improvement of the fingerprint recognition process · 2017-06-27 · techniques of fingerprint...
TRANSCRIPT

International Journal on Bioinformatics & Biosciences (IJBB) Vol.7, No.2, June 2017
1
IMPROVEMENT OF THE FINGERPRINT
RECOGNITION PROCESS
Farah Dhib Tatar1 And Mohsen Machhout2
1Department of Electrical Engineering, National School of the Studies of Engineer of Tunis, Tunisia
2Faculty of Sciences of Monastir, Monastir, Tunisia
ABSTRACT
The increased development of IT tools and social communication networks has significantly increased the
need for people to be identified with reliable and secure tools hence the importance of using biometric
technology. Biometrics is an emerging field where technology improves our ability to identify a person. The
advantage of biometric identification is that each individual has its own physical characteristics that
cannot be changed, lost or stolen. The use of fingerprinting is today one of the most reliable technologies
on the market to authenticate an individual. This technology is simple to use and easy to implement. The
techniques of fingerprint recognition are numerous and diversified, they are generally based on generic
algorithms and tools for filtering images.
This article proposes a fingerprint recognition chain by highlighting improved processing tools to facilitate
data retrieval. The results are retrieved and validated using Matlab.
KEYWORDS
Fingerprint, Biometrics, Images Processing, Minutiae, Matlab
1. INTRODUCTION Biometrics is the mathematical analysis of the biological characteristics of a person and its objective is to determine its identity irrefutably. Biometrics is based on what we are, and thus avoids duplication, theft, forgetting or loss. The characteristics used must be universal (common to all individuals), unique (to be able to differentiate two individuals) and permanent (time-invariant for each individual) [1] Biometric techniques can be classified into three categories:
• Morphological analysis: fingerprints, iris of the eye, hand shape, facial features, venous network of the retina, and analysis of the veins.
• Analysis of biological traces: DNA, blood, saliva, urine, odor, thermographs. • Behavioral analysis: speech recognition, keystroke dynamics, signature dynamics, how to
walk. Fingerprint recognition has been known since 1880, thanks to Alphonse Bertillon's research on the identification of recidivists. And then, several studies have been elaborated; so there are several types of algorithms such as HMFA (Histogram-Partitioning, Median-Filtering Fingerprint Recognition Algorithm), an algorithm based on Gaussian filters to minimize the noise existing on the image to be treated [2]; Other studies have focused on improving the comparison phase to ensure rapid authentication [3]. There are also algorithms [4] based on the recognition of the iris, the geometry of the hand, the face’s geometry ... etc, using generic algorithms.

International Journal on Bioinformatics & Biosciences (IJBB) Vol.7, No.2, June 2017
2
The performances of these different studies remain variable and depend on several factors (the sensors, the state of the duty, the climate, etc.); For this purpose there exist other studies which were based on optimization tools such as for example the MCS algorithm (MCS: Modified Cuckoo Search) which is an algorithm used as a code optimizer allowing to search for the best distribution of gray levels that maximizes The objective function. [5]
In this paper we represent a fingerprint recognition algorithm based on variance calculations and Gabor filtering. We explain the tools and methods used to improve and facilitate treatment. We also use Matlab for validation and retrieval of results.
2. FINGERPRINT RECOGNITION
A fingerprint is made up of a set of locally parallel lines forming a unique pattern for each individual (Figure 1). We can distinguish streaks (which are the lines in contact with a surface) and valleys (these are the spaces between two streaks).
Figure 1. Valleys and streaks in a fingerprint
Each fingerprint has a set of global singular points (centers and deltas) and local (minutiae). The centers correspond to places of convergence of the streaks while the deltas correspond to places of divergence (Figure 2).
Figure 2. Local and Global singular points in a fingerprint
A study (Figure 3) showed the existence of sixteen different types of minutiae, but in general the algorithms are only concerned with the bifurcations and terminations which make it possible to obtain the other types by combination [6].
Figure 3. Different types of minutiae [6]

International Journal on Bioinformatics & Biosciences (IJBB) Vol.7, No.2, June 2017
3
An automatic fingerprint recognition system is a chain of functions that, from the image of a candidate's finger, must decide whether the candidate is allowed access or not.
The fingerprint recognition algorithm under question consists of three essential parts: pre-processing of the fingerprint image to improve its quality, the extraction of the useful information and a filtering of the results before the comparison.
3. PRE-PROCESSING OF THE IMAGE
When capturing a fingerprint image, there are several factors that affect image quality such as:
• Scars in the finger, age of the person. • Parasitic substances (water, grease, dirt ...) • Capture environment: temperature (expansion, compression), humidity ...
To guarantee the reliability of the recognition, pretreatment is important to eliminate the effect of these parasitic elements on the fingerprint image. After this step, the image becomes clear and ready for the next step. The different pretreatment phases are presented in the following figure:
Figure 4. Pre-processing steps
3.1. Grayscale Transformation
There are several types of fingerprint sensors [7]; Most of them usually return color images. For this algorithm, the color planes are not required for processing, so we have to make a transformation into gray levels, although we can use a sensor that gives us a grayscale image, using a color sensor allows us to have a clearer image, it is better to start from a color image and then make the transformation into gray levels.
Assuming that the image that comes from the sensor is represented in the RGB (Red/Green/Blue) color scheme, the gray-scale transformation of a pixel is performed according to formula (1).
Where I is the value of the pixel in gray and R, G and B are the values of the color components. This step makes it possible to optimize the general appearance of the image and facilitates biometric processing.

International Journal on Bioinformatics & Biosciences (IJBB) Vol.7, No.2, June 2017
4
3.2. Image Normalization
A grayscale image is represented at 256 levels; this step allows us to minimize the gray scale variance that is to standardize the intensity values in an image by adjusting the range of gray level values so that they extend in a desired range of values. The main goal of normalization is to reduce the variance of the gray level value along the ridges to facilitate subsequent processing steps. Normalization is performed locally on each block according to the following steps:
• Averaging :
I (i, j) is the value of the pixel (i, j), M is the average value of the image and m, n are the dimensions of the image.
• Variance Calculation :
V is the variance of the image.
• Calculating the value of the normalized gray level of the pixel l (i,j) [8] :
M0 and V0 are the desired values of the average and variance respectively. Normalization does not change the structure of the image, but it is used to standardize the variation of gray levels and improve the contrast of the image. 3.3. Segmentation In order to eliminate the edges of the image and areas that are too noisy, segmentation is necessary. It is based on the calculation of the variance of gray levels. For this purpose, the image is divided into sub-blocks of (W × W) size’s and for each block the variance according to formula (3) is calculated. Then, the root of the variance of each block is compared with a threshold T, if the value obtained is lower than the threshold, then the corresponding block is considered as the background of the image and will be excluded by the subsequent processing. Otherwise, the block will be considered as the useful part of the image. The selected threshold value is T = 0.1 and the selected block size is W = 16 [9].

International Journal on Bioinformatics & Biosciences (IJBB) Vol.7, No.2, June 2017
5
This step makes it possible to reduce the size of the useful part of the image and subsequently to optimize the extraction phase of the biometric data. 3.4. Spatial estimation of the directional map The directional map defines the local orientation of the streaks contained in the fingerprint. The estimation of orientation is a fundamental step in the process of image enhancement based on Gabor's filtering (Figure 5)
Figure 5. Local orientation of a pixel
The associated direction Ѳ (i, j) to a pixel cannot be determined efficiently if it is based solely on the value of the gray level of the pixel. For this purpose, we consider its neighborhood V of size W × W pixels (the considered pixel is the center of the block) and compute the gradients Gx (i, j) along the lines and Gy (i, j) Pixel (i, j) of the neighborhood V according to formulas (5) and (6). For the calculation of the gradients, the SOBEL masks are used as follows:
(5)
(6)
Thus, the local direction in the vicinity V, in the direction of the lines (Vx (i, j)) and in the direction of the columns (Vy (i, j)) is estimated by the following calculation:
(7)
(8)
The estimation of the local orientation in the neighborhood V is Ѳ (i, j) such that:
(9)
International Journal on Bioinformatics & Biosciences (IJBB) Vol.7, No.2, June 2017
6
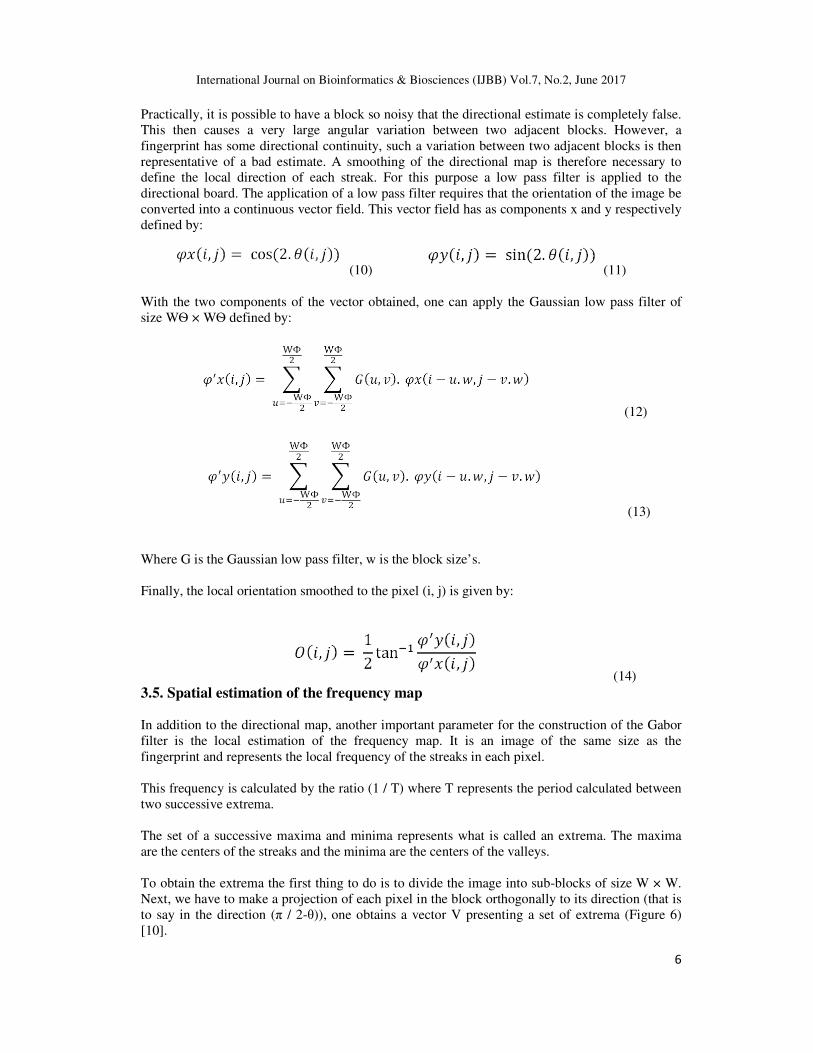
Practically, it is possible to have a block so noisy that the directional estimate is completely false. This then causes a very large angular variation between two adjacent blocks. However, a fingerprint has some directional continuity, such a variation between two adjacent blocks is then representative of a bad estimate. A smoothing of the directional map is therefore necessary to define the local direction of each streak. For this purpose a low pass filter is applied to the directional board. The application of a low pass filter requires that the orientation of the image be converted into a continuous vector field. This vector field has as components x and y respectively defined by:
(10) (11)
With the two components of the vector obtained, one can apply the Gaussian low pass filter of size WѲ × WѲ defined by:
(12)
(13)
Where G is the Gaussian low pass filter, w is the block size’s. Finally, the local orientation smoothed to the pixel (i, j) is given by:
(14) 3.5. Spatial estimation of the frequency map In addition to the directional map, another important parameter for the construction of the Gabor filter is the local estimation of the frequency map. It is an image of the same size as the fingerprint and represents the local frequency of the streaks in each pixel. This frequency is calculated by the ratio (1 / T) where T represents the period calculated between two successive extrema. The set of a successive maxima and minima represents what is called an extrema. The maxima are the centers of the streaks and the minima are the centers of the valleys. To obtain the extrema the first thing to do is to divide the image into sub-blocks of size W × W. Next, we have to make a projection of each pixel in the block orthogonally to its direction (that is to say in the direction (π / 2-θ)), one obtains a vector V presenting a set of extrema (Figure 6) [10].

International Journal on Bioinformatics & Biosciences (IJBB) Vol.7, No.2, June 2017
7
Figure 6. Extrema obtained after projection
In the vector of extrema obtained, the maxima represent the centers of the striations and the minima correspond to the centers of the valleys. The local inter-stria period is then estimated by calculating the mean distance between two consecutive maxima S (i, j):
(15) The maxima Mi and the minima mi are determined by detecting the zero crossing of the derivative of the vector V, which makes it possible to obtain the sequence {M1, m1, ..., Mk, mk, Mk + 1}. If the difference between a maximum Mi and a minimum mi is less than a threshold T then we consider that Mi corresponds to a noise and is eliminated. If the resulting vector contains at least two maxima then the inter-stria period is calculated by the mean of the distances between two consecutive maxima, otherwise the period takes the value of zero. When the estimated period is zero this means that the block contains no streak (background image) or that it is too noisy to reliably estimate the local frequency. The frequency map is a function of the gray level (dark areas = low frequency and light areas = high frequency).
3.6. Gabor Filtering
The principle of filtering is to modify the value of the pixels of an image, generally in order to improve its appearance. In practice, it is a matter of creating a new image using the pixel values of the original image, in order to select in the Fourier domain the set of frequencies that make up the region to be detected. The filter used is the Gabor filter with even symmetry and oriented at 0 degrees (formula 16):
(16)
The values of ��and �� are chosen such that �� = ��. F(i,j) and �� =�� . F(i,j). The values of �� and �� are fixed to be 0.5. To obtain other orientations, it is sufficient to carry out a rotation of the coordinate axes according to the formula:

International Journal on Bioinformatics & Biosciences (IJBB) Vol.7, No.2, June 2017
8
(17)
According to the different blocks of the image, the filter can have several favored directions. In this case, the final filter is a sum of basic filters placed in each direction. The resulting image will be the spatial convolution of the original (normalized) image and one of the base filters in the direction and local frequency from the two directional and frequency maps according to the formula 18:
(18)
With: - E(i,j) is the new value of the pixel (i, j)
- O(i,j) and F(i,j) Are the values of the pixels (i, j) of the directional and frequency maps. - �� and �� Are respectively the length and the width of the block used for the
convolution.
4. EXTRACTION OF BIOMETRIC DATA The biometric data concerning the fingerprint are minutiae. To extract them, the algorithm of figure 7 was used.
Figure 7. Extracting signature steps
4.1. Image Binarization To allow skeletonization, the image must first be binarized, ie the image in 256 levels of gray that we have at this stage is transformed into a binary image where the black pixels correspond to the streaks and the white pixels to the valleys. There are many techniques of image binarization [11];

International Journal on Bioinformatics & Biosciences (IJBB) Vol.7, No.2, June 2017
9
we chose to use a simple and effective thresholding method. To perform this processing, the value of each pixel P(x,y) is compared with a threshold M and if this value is greater than the threshold the pixel takes the value of one (black), else it takes the value of zero (white). 4.2. Skeletonization of the image
To facilitate extraction of minutiae the image must be skeletonized: a sequence of morphological erosion operations will reduce the thickness of the striations until the latter is equal to one pixel while maintaining the connectivity of the striations (That is to say that the continuity of the striaes must be respected, holes must not be inserted). We used the Rosenfeld algorithm [12] for its simplicity and because it is well adopted at the hardware implementation as it has a reduced computation time compared to the other algorithms. [13]
The use of the Rosenfeld algorithm allows optimizing the overall processing time.
4.3. Detection of minutiae
The method used is the Crossing Number (CN) [10]. It is the most used method for its simplicity. One must have as input a skeletonized image. This must have 0 for a white pixel and 1 for a black pixel. The minutiae are extracted by examining the local surrounding of each pixel in the image of the fingerprint using a connectivity of 8 surrounding pixels (window 3 × 3) (figure 8).
Figure 8. The different representations of the skeletons
The value of the CN is calculated according to formula 19. (19)
Thus, for a pixel P belonging to a streak (that is to say of value 1), the CN can take five values (figure 9):
• CN(P) = 0 : It is an isolated pixel; we do not take into account it because even if this type of minutia exists, it is very rare and in the general case it is due to a noise residue.
• CN(P) = 1 : It is a candidate for a termination • CN(P) = 2 : This is the most common case, it is a pixel that is on a streak, there
are no minutiae in this case • CN(P) = 3 : A triple bifurcation candidate • CN(P)= 4 : A quadruple bifurcation, this type is quite rare and it is probably due
to noise.
P1 P2 P3
P8 P P4
P7 P6 P5
��� = ��|�� � ��� |���
With: �8 = �0�� ∈ �0,1�

International Journal on Bioinformatics & Biosciences (IJBB) Vol.7, No.2, June 2017
10
Figure 9. Examples of determining the type of minutiae according to CN
The detection of minutiae thus causes the presence of a very large number of false minutiae. An additional processing is therefore necessary to eliminate the maximum of the detected false minutiae.
5. ELIMINATION OF FALSE MINUTIAE AND COMPARISON OF SIGNATURES The originality of this method is manifested in the reduction of the useful information comprised in the signature vector: if we locate the true and necessary minutiae for the comparison phase, we will have to compare fewer points while keeping the specific characteristics of each fingerprint. Although the pre-processing phase of the image allows us to improve the general appearance of each fingerprint and subsequently facilitates the detection of minutiae; the most important phase is the elimination of false minutiae. This phase will make it possible to have at the end the true minutiae which will serve to define the vector characteristic of the fingerprint. An algorithm [10] adapted to the treatment carried out previously was used. This algorithm is based on empirical results [11] based on the fact that the distance between two neighboring minutiae is always greater than a certain threshold. Indeed, practically it is extremely rare to find two real minutiae very close, on the other hand one almost always a local concentration of several false minutiae. When eliminating false minutiae, we have to traverse the coding image of CN by looking for the values of the pixels of values CN = 1 or CN = 3 each time because we are only interested in these Types of minutiae that are most frequent and that leads to other forms of minutiae. 5.1. Treatment of detected terminations When a candidate point T (Tx, Ty) for the termination title (CN = 1) is found, it is first checked whether it is at the edge of the image, since most of the false endings are caused by The edge of the image. This allows the elimination of many false terminations as the lines of the skeleton image stop at the edge of the image thus creating erroneous terminations. Moreover, the segmentation of the image made it possible to determine the unnecessary part considered as background of the image. This part will be used in this phase. Indeed, if a candidate T (Tx, Ty) for a termination is in a block adjacent to a block belonging to the background of the image, it will be considered as a false termination and will therefore be eliminated.
International Journal on Bioinformatics & Biosciences (IJBB) Vol.7, No.2, June 2017
11
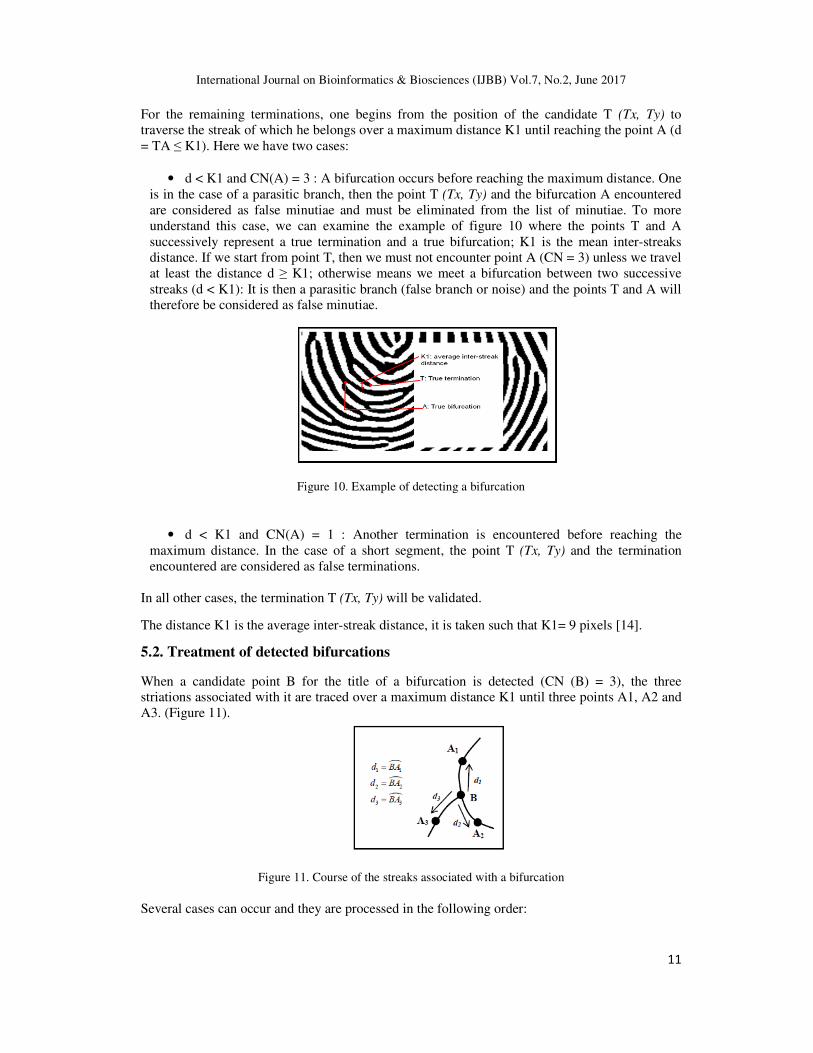
For the remaining terminations, one begins from the position of the candidate T (Tx, Ty) to traverse the streak of which he belongs over a maximum distance K1 until reaching the point A (d = TA ≤ K1). Here we have two cases:
• d < K1 and CN(A) = 3 : A bifurcation occurs before reaching the maximum distance. One is in the case of a parasitic branch, then the point T (Tx, Ty) and the bifurcation A encountered are considered as false minutiae and must be eliminated from the list of minutiae. To more understand this case, we can examine the example of figure 10 where the points T and A successively represent a true termination and a true bifurcation; K1 is the mean inter-streaks distance. If we start from point T, then we must not encounter point A (CN = 3) unless we travel at least the distance d ≥ K1; otherwise means we meet a bifurcation between two successive streaks (d < K1): It is then a parasitic branch (false branch or noise) and the points T and A will therefore be considered as false minutiae.
Figure 10. Example of detecting a bifurcation
• d < K1 and CN(A) = 1 : Another termination is encountered before reaching the maximum distance. In the case of a short segment, the point T (Tx, Ty) and the termination encountered are considered as false terminations.
In all other cases, the termination T (Tx, Ty) will be validated.
The distance K1 is the average inter-streak distance, it is taken such that K1= 9 pixels [14].
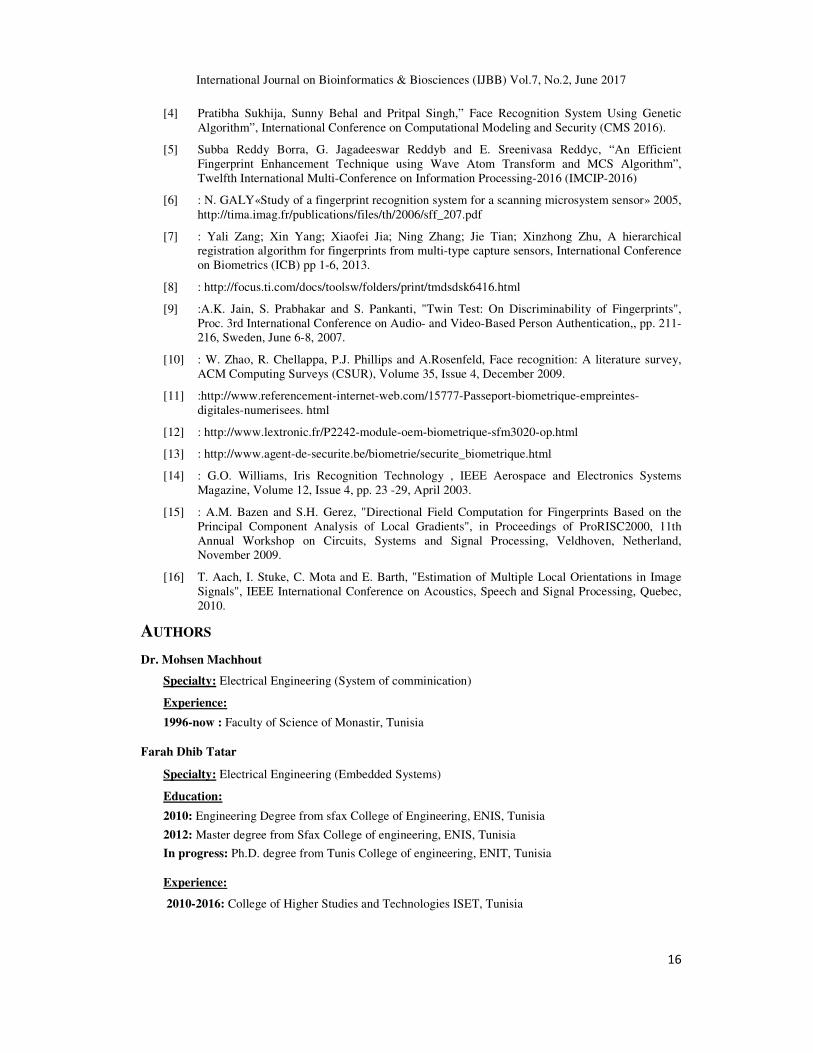
5.2. Treatment of detected bifurcations
When a candidate point B for the title of a bifurcation is detected (CN (B) = 3), the three striations associated with it are traced over a maximum distance K1 until three points A1, A2 and A3. (Figure 11).
Figure 11. Course of the streaks associated with a bifurcation
Several cases can occur and they are processed in the following order:

International Journal on Bioinformatics & Biosciences (IJBB) Vol.7, No.2, June 2017
12
• d1<K1, d2 <K1 and d3 <K1 : The circular area with center B and radius K1 contains at least four minutiae (points A1, A2, A3 and B) and which are placed in a radius smaller than the mean inter- streaks distance. We are thus in the case where we find minutiae between two successive streaks, which contrasts with the general tendency of presence of minutiae. We then consider that we are in a very noisy zone (large grouping) and that B is a false bifurcation.
• CN(A1)=1 or CN(A2)=1 or CV(A3) = 1 : At least one of the striae leads to a termination. And since d ≤ K1 (the path is made over a maximum distance K1), this means that we are in the case of a bifurcation witch one of the branches leads to a termination before reaching the mean inter- streaks distance : In this case both of the detected termination and bifurcation are invalid and are considered to be false minutiae. Figure 12 illustrates this case: point B 1 is followed by a false termination (point A1) and therefore not validated while The point B2 represents a true bifurcation.
.
Figure 12. The case of a false bifurcation
• A1=A2 or A1=A3 or A2=A3 : Two of the striaes lead to the same point. We are in the case of an island; the point B and the bifurcation reached are not validated since, by definition, the bifurcation represents a branching of a single streak into two other streaks. Figure 13 shows the difference between the two cases.
Figure 13. The difference between a true bifurcation and an island
In all other cases the point B is validated as a true bifurcation [14].
5.3. Vector signature
The signature vector is a file containing useful information for the comparison of the two signatures. Our recognition system is a verification system, that is, it consists in confirming or denying the identity of a person (am I the one I claim to be) in relation to a reference record. One distinguishes then two operations: the recording and the verification.

International Journal on Bioinformatics & Biosciences (IJBB) Vol.7, No.2, June 2017
13
During registration, the signature � extracted from the fingerprint is stored in memory. During the verification the user’s signature �! is compared with � .
Although the algorithms differ, the structure of these systems is unique (Figure 14).
Figure 14. Fingerprint recognition system
Of course these two signatures will never be strictly identical because the impression will never be acquired in a similar way (speed, dust, pressure) and localized distortions (elasticity of the skin) will appear. The authentication of the person then consists in calculating the degree of similarity between the two signatures � and �!. This quantified similarity is then compared with a threshold defined in advance according to the chosen application to determine whether or not the person is the right one. Usually the recognition algorithms try to estimate the transformation T to obtain � from �! (Formula 20).
"�′�′# ′$ = �. &cos * � sin* 0sin * cos * 00 0 ��-. . /01#2 + &
∆�∆�* .
(20)
The parameters (�, ∆�, ∆� , *) characterize the distortion caused by the acquisition:
• k is a constant scaling factor. It is generally considered to be equal to 1 when the images come from the same sensor but its estimation may be necessary in the case of two sets obtained by two different acquisition means[15].
• ∆� and ∆� define the translation in x and y of the position of the center of the image.
• α describe the difference in orientation between the two signatures. In our case it is assumed that the finger always moves in the same direction, even if using a
specific system to force the user, so one does not have to take into account the rotation parameter (* =0).
The transformation to the two signatures will therefore be according to the formula 21:
&0 1 # . = &0!1!#!. + &∆�∆�0 . (21)

International Journal on Bioinformatics & Biosciences (IJBB) Vol.7, No.2, June 2017
14
Once we have done this transformation, we now have two signatures with centers, so the next step is to determine the number of minutiae that is superimposed according to the following two conditions:
• The two minutes are of the same type: 5 =5!.
• The characteristic directions of the blocks containing the minutiae are such that: 6sin# �#! �6 < sin10° [16] The last step consists in computing the number N of the superimposed minutiae (to ∆ near) and then comparing this number with a threshold M chosen according to the recognition system, if N
≥ M on is the case of the two signatures combined, otherwise No one will be recognized and the two signatures will be considered different.
6. RESULT AND DISCUSSION:
MATLAB was used to develop and validate this code, from the preliminary processing phase of the image to the extraction of the signature vector, which allows us to identify and compare the different fingerprints. Then we validated our algorithm with respect to a database containing a hundred of the untreated images. The two following figures represent respectively the phase of elimination of the false minutiae as well as the extraction of the signature vector.
Figure 15. Result of the elimination of false minutiae stage
To highlight the importance of this step; consider the following example:
Figure 16. Identification of the phase of elimination of false minutiae
For the first figure we have compared 44 points (26 bifurcations and 18 terminations) of which 29 points represent false minutiae; the error rate is therefore 65.9%, whereas after the elimination of the false minutiae one will only have compared 15 points (7 bifurcations and 8 terminations) with an error rate that does not exceed 1%.

International Journal on Bioinformatics & Biosciences (IJBB) Vol.7, No.2, June 2017
15
Although we have eliminated a significant number of minutiae detected, the techniques used allow us to keep the information useful, necessary and sufficient to ensure comparison between fingerprints.
In addition to reducing the error rate, reducing the number of points (minutiae) compared, allows us to save a lot of time during the comparison phase and thereafter to improve overall system performance and even to facilitate the task of implementation on a hardware platform.
The signature vector: This file is used in the matching phase. At the end of this phase it can be concluded whether it is indeed the desired signature or not with an acceptable margin of error.
Figure 17. Illustration of the margins of error associated with the signature
By comparing the signature vector of the captured image with those that are recorded in the database the system concludes then whether or not the person is recognized and decides the permission or inhibition of access.
7. CONCLUSION:
The results obtained are directly linked to two main criteria: the captured image quality and the processor used to process the images.
The choice of a good sensor and a well-dedicated processor makes it possible to better highlight the advantages of processing and the qualities of algorithm used.
There are several types of sensors used for image acquisition the most used sensors in the market are the CMOS sensors since they allow to reduce the overall price of cameras, since they contain all the elements necessary for the composition cameras.
Concerning the implementation of code there are also several types of processors that can be used ranging from those provided by companies specialized in embedded manufacturing such as Altera, Xilinx, Texas Instrument ... etc. Or "free" processors such as Raspberry Pi, Beaglebone, Arduino and others.
The performance of the software and the code remains strongly dependent on these two steps and varies mainly according to the types of processors used for the processing of the image.
REFERENCES
[1] :http://www.agent-de-securite.be/biometrie/securite_biometrique.html
[2] Ayyüce M. Kizrak , Figen Özen “A new median filter based fingerprint recognition algorithm”, Haliç University, Electronics and Communications Engineering Department, Suracevizler St. No.29, Bomonti, sisli, Istanbul 34363, Turkey, Elsevier 2011.
[3] Christel-Loïc TISSE, Lionel MARTIN, Lionel TORRES et Michel ROBERT, « Système automatique de reconnaissance d’empreintes digitales. Sécurisation de l’authentification sur carte à puce »,Advanced System Technology Laboratory STMicroelectronics – ZI Rousset – 13106 Rousset, France, Université de Montpellier, UMR 5506, L.I.R.M.M.161, rue Ada -34392 Montpellier, France.
International Journal on Bioinformatics & Biosciences (IJBB) Vol.7, No.2, June 2017
16
[4] Pratibha Sukhija, Sunny Behal and Pritpal Singh,” Face Recognition System Using Genetic Algorithm”, International Conference on Computational Modeling and Security (CMS 2016).
[5] Subba Reddy Borra, G. Jagadeeswar Reddyb and E. Sreenivasa Reddyc, “An Efficient Fingerprint Enhancement Technique using Wave Atom Transform and MCS Algorithm”, Twelfth International Multi-Conference on Information Processing-2016 (IMCIP-2016)
[6] : N. GALY«Study of a fingerprint recognition system for a scanning microsystem sensor» 2005, http://tima.imag.fr/publications/files/th/2006/sff_207.pdf
[7] : Yali Zang; Xin Yang; Xiaofei Jia; Ning Zhang; Jie Tian; Xinzhong Zhu, A hierarchical registration algorithm for fingerprints from multi-type capture sensors, International Conference on Biometrics (ICB) pp 1-6, 2013.
[8] : http://focus.ti.com/docs/toolsw/folders/print/tmdsdsk6416.html
[9] :A.K. Jain, S. Prabhakar and S. Pankanti, "Twin Test: On Discriminability of Fingerprints", Proc. 3rd International Conference on Audio- and Video-Based Person Authentication,, pp. 211-216, Sweden, June 6-8, 2007.
[10] : W. Zhao, R. Chellappa, P.J. Phillips and A.Rosenfeld, Face recognition: A literature survey, ACM Computing Surveys (CSUR), Volume 35, Issue 4, December 2009.
[11] :http://www.referencement-internet-web.com/15777-Passeport-biometrique-empreintes-digitales-numerisees. html
[12] : http://www.lextronic.fr/P2242-module-oem-biometrique-sfm3020-op.html
[13] : http://www.agent-de-securite.be/biometrie/securite_biometrique.html
[14] : G.O. Williams, Iris Recognition Technology , IEEE Aerospace and Electronics Systems Magazine, Volume 12, Issue 4, pp. 23 -29, April 2003.
[15] : A.M. Bazen and S.H. Gerez, "Directional Field Computation for Fingerprints Based on the Principal Component Analysis of Local Gradients", in Proceedings of ProRISC2000, 11th Annual Workshop on Circuits, Systems and Signal Processing, Veldhoven, Netherland, November 2009.
[16] T. Aach, I. Stuke, C. Mota and E. Barth, "Estimation of Multiple Local Orientations in Image Signals", IEEE International Conference on Acoustics, Speech and Signal Processing, Quebec, 2010.
AUTHORS
Dr. Mohsen Machhout
Specialty: Electrical Engineering (System of comminication)
Experience:
1996-now : Faculty of Science of Monastir, Tunisia
Farah Dhib Tatar
Specialty: Electrical Engineering (Embedded Systems)
Education:
2010: Engineering Degree from sfax College of Engineering, ENIS, Tunisia
2012: Master degree from Sfax College of engineering, ENIS, Tunisia
In progress: Ph.D. degree from Tunis College of engineering, ENIT, Tunisia
Experience:
2010-2016: College of Higher Studies and Technologies ISET, Tunisia