improvement of the real-time pm2.5 ... - open access journal
TRANSCRIPT

Aerosol and Air Quality Research, 18: 1305–1316, 2018 Copyright © Taiwan Association for Aerosol Research ISSN: 1680-8584 print / 2071-1409 online doi: 10.4209/aaqr.2017.11.0522 Improvement of the Real-time PM2.5 Forecast over the Beijing-Tianjin-Hebei Region using an Optimal Interpolation Data Assimilation Method Haitao Zheng1,2,3, Jianguo Liu1*, Xiao Tang3, Zifa Wang3**, Huangjian Wu3, Pingzhong Yan3, Wei Wang4 1 Key Laboratory of Environmental Optics and Technology, Anhui Institute of Optics and Fine Mechanics, Chinese Academy of Sciences, Hefei 230031, China 2 University of Science and Technology of China, Hefei 230026, China 3 The State Key Laboratory of Atmospheric Boundary Layer Physics and Atmospheric Chemistry, Institute of Atmospheric Physics, Chinese Academy of Sciences, Beijing 100029, China 4 China National Environmental Monitoring Centre, Beijing 100012, China ABSTRACT
A routine air quality data assimilation (DA) system was established at the China National Environmental Monitoring Center (CNEMC) based on the optimal interpolation (OI) method. The surface observations from more than 1,400 stations across China were assimilated into a real-time air quality forecast system with three nested domains. The initial conditions of NO2, SO2 and PM2.5 in the three domains were optimized by the data assimilation system. The impact of the data assimilation on the real-time PM2.5 forecast over the Beijing-Tianjin-Hebei (BTH) Region during the heavy haze season of 2015 was evaluated. The results show that the DA can significantly improve real-time PM2.5 forecasts, reducing the root mean square error (RMSE) by 23%, 8.2% and 4.8% in the forecasts of the first, second and third day, respectively. The mean fractional bias and the mean fractional error of the forecast were reduced from 50.9% and 70.67% to 40% and 62.3%, respectively, and the performance changed from “criteria” to approaching “goal” (as defined by Boylan and Russell, 2006). Additionally, increasing the assimilation frequency can improve the DA system performance for real-time forecasts. As can be seen from the various cases studied here, the improvement in data assimilation is more significant when the bias of the model is higher and there is still much room for correction. The results also show a rapid decay of the DA effects on the PM2.5 forecast, which highlights the limitations of the current routine data assimilation system in which only initial conditions are optimized. Further improvements in the data assimilation system with meteorological data assimilation and chemical parameter optimization are needed. Keywords: Real-time PM2.5 forecast; Data assimilation; Optimal interpolation; Beijing-Tianjin-Hebei Region. INTRODUCTION
China faces serious atmospheric pollution problems, with high concentrations of fine particulate matter (PM2.5) regularly causing serious and large scale haze pollution events (Huang et al., 2014; Li et al., 2016; Wang et al., 2016; Sun et al., 2016). In response to these large-scale haze pollution incidents, in the years since 2013 the China National Environmental Monitoring Center (CNEMC) and many provincial level environmental monitoring departments in China established air quality warning and forecasting * Corresponding author.
E-mail address: [email protected] ** Corresponding author.
E-mail address: [email protected]
system based on the chemistry transport model (CTM). CTM can predict the temporal and spatial distribution of pollutants. But due to the complexity of atmospheric pollution caused by many different pollutants, the uncertainty of emissions and the chemical process modeled in the CTM, air quality forecasts still deviate from actual conditions (Carmichael et al., 2008), in especially heavy pollution the deviation can reach up to 30–50% (Zheng et al., 2015), and the simulation uncertainty of high chemical activity species such as nitrate can reach up to 3 times that (Hayami et al., 2008). DA can reduce the uncertainty (such as its initial conditions) by coupling the model with observations to improve the model performance. (Houtekamer et al., 2005; Tang et al., 2011; Bocquet et al., 2015).
DA has thus proven to be an effective method to improve weather forecasts (Bouttier and Courtier, 2002; Kalnay, 2003; Crawford et al., 2016). In the field of air pollution forecasting, Sandu et al. (2011) have shown that

Zheng et al., Aerosol and Air Quality Research, 18: 1305–1316, 20181306
data assimilation also plays an important role in improving air pollution prediction. Based on the NAQPMS (Nested Air Quality Prediction Model System, Wang et al., 2001, 2002, 2006), Huang et al. (2016) reanalyzed the PM2.5 pollution process in the Beijing-Tianjin-Hebei (BTH) region by using the optimal interpolation assimilation method and found that assimilation can reproduce the pollution process better. Wu et al. (2015) used the 3D-Var method to assimilate PM2.5 initial conditions based on WRF-Chem (Grell et al., 2005), and improved a 0–48-h PM2.5 forecast, while Zhen et al. (2017) assimilated the PM2.5 initial conditions and emission sources, which can also effectively improve the PM2.5 forecast in China base on the WRF-Chem model and ensemble Kalman filter (EnKF) (Evensen, 2010; Schutgens et al., 2010; Yumimoto et al., 2016) method.
In recent years, countries in Europe and other regions have also established assimilation business systems for air quality forecasting (Kukkonen et al., 2012; Marécal et al., 2015). In contrast, in China only air quality prediction systems without DA business systems have been built. Meanwhile, although a large number of air pollutant monitoring sites have been established, their huge data sets are mostly used for posthoc case studies, and have not been used for real-time forecasting. Based on the NAQPMS and the observation data of 1,436 sites provided by CNEMC, we used the optimal interpolation (OI) method to build a data assimilation business system named ChemDAS for the PM2.5 real-time forecast in CNEMC. It began operating in May 2015. In this paper, we added two sets of comparison experiments based on the results of ChemDAS, one is a 72-h forecast without DA and the other one is a 72-h forecast with different DA frequency, to evaluate the effect of DA for PM2.5 real-time forecast (0–72 h) during heavy pollution events. The reduction in improvement by DA and the influence of assimilation frequency on real-time forecast are also discussed. METHODOLOGY Chemical Transport Model
In this paper, the chemistry transport model NAQPMS was used, developed by the Institute of Atmospheric Physics, Chinese Academy of Sciences. Based on the three-dimensional Euler sulfide transport model, this model cases emission, advection, diffusion, dry and wet deposition, chemical (including gas phase, aqueous phase, aerosol, and heterogeneous phase) reaction processes, and the incorporation of pollution source tracking, process analysis, and other advanced model techniques, and can carry out multi-scale and multi-pollutant simulation in a mid-latitude area study. NAQPMS settings are consistent with those described in Chen et al. (2015): The improved RADM2 and ISORROPIA1.7 mechanisms are used in the gas phase and inorganic aerosol chemistries (SO4, NO3, and NH4). The dust and sea salt processes developed by Luo et al. (2006) and Athanasopoulou et al. (2008) are used to model their respective natural aerosols. The formation of secondary organic aerosols is based on Odum et al. (1997). The heterogeneous chemistry of the aerosol surface is also
considered, including 28 chemical reactions (Li et al., 2012). As one of the official CTMs used in CNEMC’s air quality prediction system, NAQPMS was successfully used during Beijing’s Olympic Games, the Shanghai World Expo, APEC and other important activities in China to ensure air quality (Sun et al., 2016). Observation Network
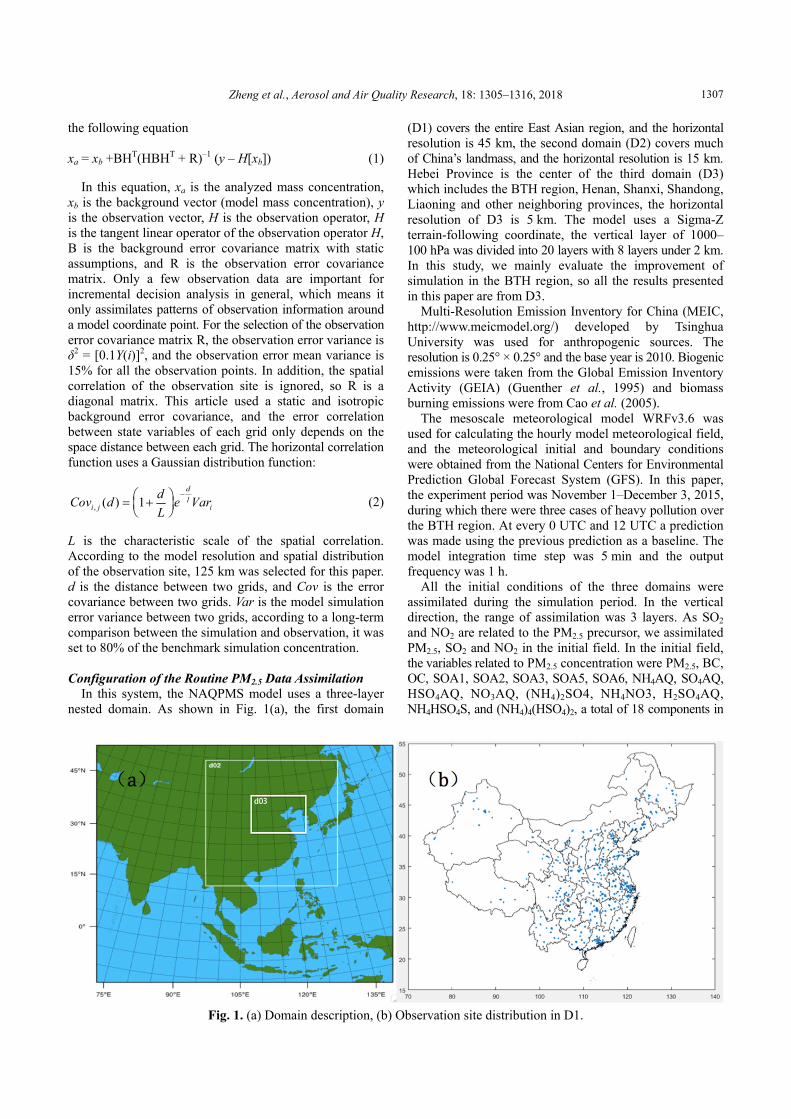
Some 1,436 national control observation sites data for PM2.5, SO2, NO2 concentrations provided by CNEMC (http://www.cnemc.cn/) are used in this paper, and 80 observation sites in the BTH region. As all of these national control stations’ observation data are collected within a 1-h process of automatic collection and upload, it is difficult to avoid errors in the data that may come from individual site abnormalities. On the other hand, as most of the observation sites are concentrated in the eastern part of China, and are densely distributed in urban areas, error data from individual abnormal sites may be diluted by other nearby sites, so it is necessary to pay special attention to the possibility of a larger error skewing the data. To prevent this, we created an automatic data quality control to remove data exceeding the maximum range according to the pollutant measurement instruments (PM2.5 < 1000 µg m−3, SO2 < 1428 µg m−3, NO2 < 1026 µg m−3). Fig. 1(b) shows the distribution of observations sites in D1. For the first time, all country control sites in China are included in one real-time forecasting assimilation system. Data Assimilation Method
The OI method is one of the commonly used assimilation algorithms used to improve the initial conditions of CTMs. Collins et al. (2001) first developed OI to study the inversion of the aerosol optical depth. Wang and Niu (2013) used the OI method to study dust aerosol assimilation in eastern Asian in a mesoscale numerical weather prediction system (GRAPES/CUACE_Dust). A DA system was developed by Jiang et al. (2013) in the WRF-Chem model that used the OI method to study the improvement of DA for PM10 simulation over China. Wang et al. (2014) also used the OI method to study the impact of assimilation of lidar observations for aerosol forecasting in the western Mediterranean Basin. It was proved that the OI method has lower computational cost then other assimilation algorithms (Wu et al., 2008), which means that it is easier to realize, especially in real-time forecast business systems. 4-dimensional variational (4D-Var) and the ensemble Kalman filter (EnKF) are two other widely used assimilation methods with better assimilation effects than OI method (Benedetti and Fisher, 2007; Candiani et al., 2013), but 4D-Var requires a more complex concomitant model (Benedetti et al., 2009; Sugimoto and Uno, 2009), while the computational cost of EnKF is much larger than an OI method (Denby et al., 2008; Pagowski and Grell, 2012). Taking into account the timeliness and computational cost in real-time forecasting, our system used the OI method.
The OI approach uses the optimal linear combination between the background state and the observed value (Daley, 1991). The analytical values can be obtained from
Zheng et al., Aerosol and Air Quality Research, 18: 1305–1316, 2018 1307
the following equation xa = xb +BHT(HBHT + R)–1 (y – H[xb]) (1)
In this equation, xa is the analyzed mass concentration, xb is the background vector (model mass concentration), y is the observation vector, H is the observation operator, H is the tangent linear operator of the observation operator H, B is the background error covariance matrix with static assumptions, and R is the observation error covariance matrix. Only a few observation data are important for incremental decision analysis in general, which means it only assimilates patterns of observation information around a model coordinate point. For the selection of the observation error covariance matrix R, the observation error variance is δ2 = [0.1Y(i)]2, and the observation error mean variance is 15% for all the observation points. In addition, the spatial correlation of the observation site is ignored, so R is a diagonal matrix. This article used a static and isotropic background error covariance, and the error correlation between state variables of each grid only depends on the space distance between each grid. The horizontal correlation function uses a Gaussian distribution function:
, ( ) 1d
li j i
dCov d e Var
L
(2)
L is the characteristic scale of the spatial correlation. According to the model resolution and spatial distribution of the observation site, 125 km was selected for this paper. d is the distance between two grids, and Cov is the error covariance between two grids. Var is the model simulation error variance between two grids, according to a long-term comparison between the simulation and observation, it was set to 80% of the benchmark simulation concentration. Configuration of the Routine PM2.5 Data Assimilation
In this system, the NAQPMS model uses a three-layer nested domain. As shown in Fig. 1(a), the first domain
(D1) covers the entire East Asian region, and the horizontal resolution is 45 km, the second domain (D2) covers much of China’s landmass, and the horizontal resolution is 15 km. Hebei Province is the center of the third domain (D3) which includes the BTH region, Henan, Shanxi, Shandong, Liaoning and other neighboring provinces, the horizontal resolution of D3 is 5 km. The model uses a Sigma-Z terrain-following coordinate, the vertical layer of 1000–100 hPa was divided into 20 layers with 8 layers under 2 km. In this study, we mainly evaluate the improvement of simulation in the BTH region, so all the results presented in this paper are from D3.
Multi-Resolution Emission Inventory for China (MEIC, http://www.meicmodel.org/) developed by Tsinghua University was used for anthropogenic sources. The resolution is 0.25° × 0.25° and the base year is 2010. Biogenic emissions were taken from the Global Emission Inventory Activity (GEIA) (Guenther et al., 1995) and biomass burning emissions were from Cao et al. (2005).
The mesoscale meteorological model WRFv3.6 was used for calculating the hourly model meteorological field, and the meteorological initial and boundary conditions were obtained from the National Centers for Environmental Prediction Global Forecast System (GFS). In this paper, the experiment period was November 1–December 3, 2015, during which there were three cases of heavy pollution over the BTH region. At every 0 UTC and 12 UTC a prediction was made using the previous prediction as a baseline. The model integration time step was 5 min and the output frequency was 1 h.
All the initial conditions of the three domains were assimilated during the simulation period. In the vertical direction, the range of assimilation was 3 layers. As SO2 and NO2 are related to the PM2.5 precursor, we assimilated PM2.5, SO2 and NO2 in the initial field. In the initial field, the variables related to PM2.5 concentration were PM2.5, BC, OC, SOA1, SOA2, SOA3, SOA5, SOA6, NH4AQ, SO4AQ, HSO4AQ, NO3AQ, (NH4)2SO4, NH4NO3, H2SO4AQ, NH4HSO4S, and (NH4)4(HSO4)2, a total of 18 components in
Fig. 1. (a) Domain description, (b) Observation site distribution in D1.

Zheng et al., Aerosol and Air Quality Research, 18: 1305–1316, 20181308
NAQPMS. We first distributed observed PM2.5 concentrations to all the related components, according to the 18 components concentration ratio in the original initial field, then assimilated all the components respectively.
In order to evaluate the effect of assimilation for real-time forecasting, we added two sets of simulation experiments shown in Table 1. Control (CT) was a 72-h forecast without DA at every 12 UTC. 24-h DA provided 72-h forecasting with DA at every 12 UTC to evaluate the impact of assimilation frequency for 72-h forecasting, and 12-h DA was the same as the system setup. All of the experiment’s first forecasts were based on the same initial conditions before DA, which was taken from the business system. RESULTS AND DISCUSSION PM2.5 Pollution Episodes
From November 1 till December 3, 2015, most regions in the BTH region were heavily polluted as a whole (PM2.5 average concentration up to 95 µg m−3). Beijing, Baoding, Langfang and some other cities’ PM2.5 daily average concentration reached 500 µg m−3 or more. Fig. 2 shows the time series of daily average PM2.5 concentration of all cities in the BTH region during the simulation period. The red line represents the average in the BTH region and the
shadowed areas represent Beijing, Tianjin, Shijiazhuang and all the other cities in Hebei Province. As can be seen in Fig. 2, the different cities experienced different degrees of haze pollution during the simulation period, but the aggregate trend is consistent. In addition to assessing the effect of assimilation over the whole period, we also wanted to know the effect of assimilation during each process of the pollution event, so we divided the whole simulation time into three cases according to changes in PM2.5 concentration. Among them, Case 2 was the longest-running case, lasting 10 days in total, and Case 3 was the most serious case, with the daily average concentration of PM2.5 reaching up to 250 µg m−3 or more in the whole BTH area.
Improvement of Initial Conditions
We chose D3 for the initial conditions verification because at the highest resolution (5 km) it allows the observed data to distribute as much as possible in the different grids. Therefore, all the observations sites (490) in the D3 were divided into two groups averagely in each city, one for assimilation and the other group for verification. These sites are shown in Fig. 3(a) (black point sites are those used for assimilation and red circle sites are those used for verification). Fig. 3(b) shows the scatter plot comparison of PM2.5 concentrations of the simulation and
Table 1. Experiments setup.
Experiment Forecasting setup DA method DA time Control (Model without DA) 72 hours at 12 o'clock (UTC) - - 24-h-DA 72 hours at 12 o'clock (UTC) OI 12 o'clock (UTC) 12-h-DA 72 hours at 12 o'clock (UTC),
12 hours at 0 o'clock (UTC) OI 12 o'clock (UTC), 0 o'clock (UTC)
Fig. 2. Time series of PM2.5 daily average observations concentration of all cities in BTH during the simulation period, red line represent average in BTH and shadow areas represent cities.
Zheng et al., Aerosol and Air Quality Research, 18: 1305–1316, 2018 1309
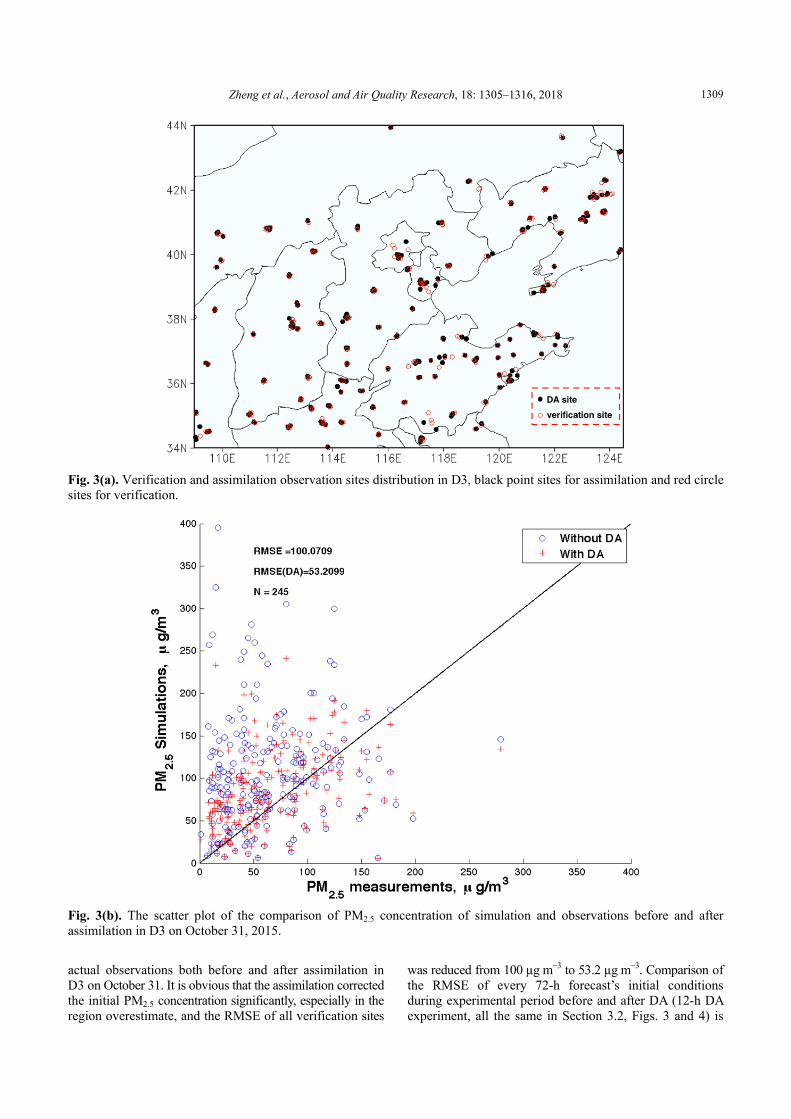
Fig. 3(a). Verification and assimilation observation sites distribution in D3, black point sites for assimilation and red circle sites for verification.
Fig. 3(b). The scatter plot of the comparison of PM2.5 concentration of simulation and observations before and after assimilation in D3 on October 31, 2015.
actual observations both before and after assimilation in D3 on October 31. It is obvious that the assimilation corrected the initial PM2.5 concentration significantly, especially in the region overestimate, and the RMSE of all verification sites
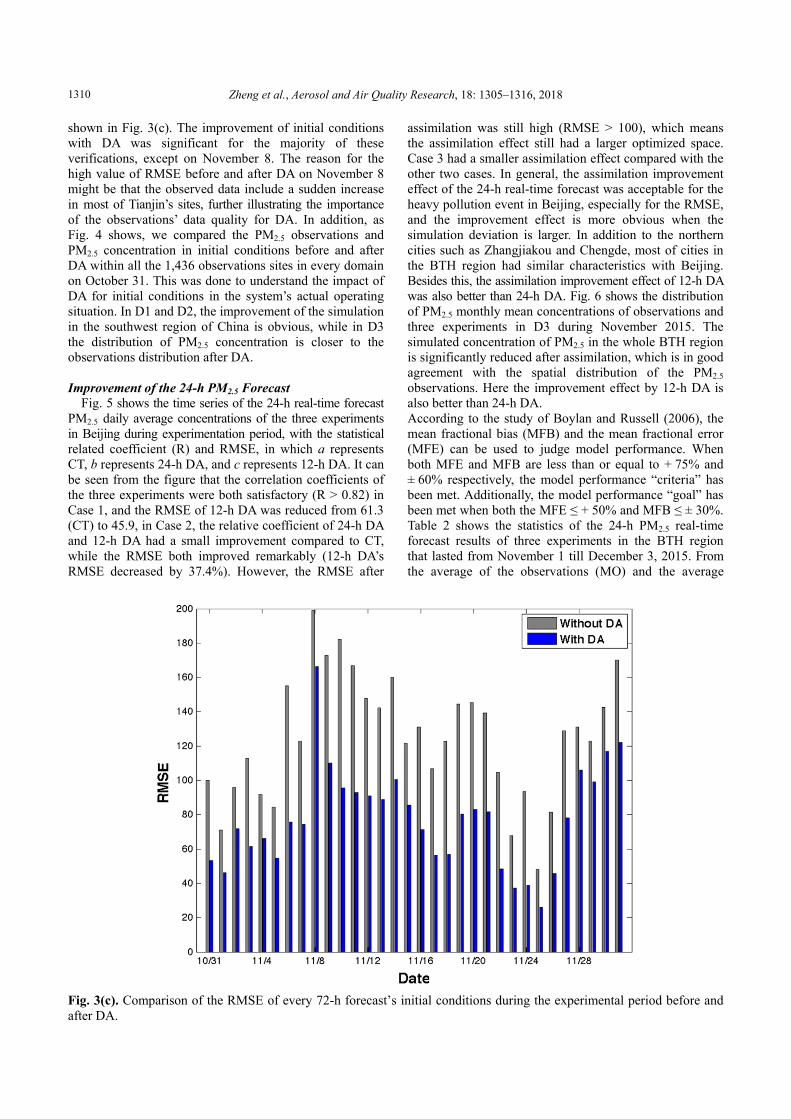
was reduced from 100 µg m−3 to 53.2 µg m−3. Comparison of the RMSE of every 72-h forecast’s initial conditions during experimental period before and after DA (12-h DA experiment, all the same in Section 3.2, Figs. 3 and 4) is
Zheng et al., Aerosol and Air Quality Research, 18: 1305–1316, 20181310
shown in Fig. 3(c). The improvement of initial conditions with DA was significant for the majority of these verifications, except on November 8. The reason for the high value of RMSE before and after DA on November 8 might be that the observed data include a sudden increase in most of Tianjin’s sites, further illustrating the importance of the observations’ data quality for DA. In addition, as Fig. 4 shows, we compared the PM2.5 observations and PM2.5 concentration in initial conditions before and after DA within all the 1,436 observations sites in every domain on October 31. This was done to understand the impact of DA for initial conditions in the system’s actual operating situation. In D1 and D2, the improvement of the simulation in the southwest region of China is obvious, while in D3 the distribution of PM2.5 concentration is closer to the observations distribution after DA. Improvement of the 24-h PM2.5 Forecast
Fig. 5 shows the time series of the 24-h real-time forecast PM2.5 daily average concentrations of the three experiments in Beijing during experimentation period, with the statistical related coefficient (R) and RMSE, in which a represents CT, b represents 24-h DA, and c represents 12-h DA. It can be seen from the figure that the correlation coefficients of the three experiments were both satisfactory (R > 0.82) in Case 1, and the RMSE of 12-h DA was reduced from 61.3 (CT) to 45.9, in Case 2, the relative coefficient of 24-h DA and 12-h DA had a small improvement compared to CT, while the RMSE both improved remarkably (12-h DA’s RMSE decreased by 37.4%). However, the RMSE after
assimilation was still high (RMSE > 100), which means the assimilation effect still had a larger optimized space. Case 3 had a smaller assimilation effect compared with the other two cases. In general, the assimilation improvement effect of the 24-h real-time forecast was acceptable for the heavy pollution event in Beijing, especially for the RMSE, and the improvement effect is more obvious when the simulation deviation is larger. In addition to the northern cities such as Zhangjiakou and Chengde, most of cities in the BTH region had similar characteristics with Beijing. Besides this, the assimilation improvement effect of 12-h DA was also better than 24-h DA. Fig. 6 shows the distribution of PM2.5 monthly mean concentrations of observations and three experiments in D3 during November 2015. The simulated concentration of PM2.5 in the whole BTH region is significantly reduced after assimilation, which is in good agreement with the spatial distribution of the PM2.5 observations. Here the improvement effect by 12-h DA is also better than 24-h DA. According to the study of Boylan and Russell (2006), the mean fractional bias (MFB) and the mean fractional error (MFE) can be used to judge model performance. When both MFE and MFB are less than or equal to + 75% and ± 60% respectively, the model performance “criteria” has been met. Additionally, the model performance “goal” has been met when both the MFE ≤ + 50% and MFB ≤ ± 30%. Table 2 shows the statistics of the 24-h PM2.5 real-time forecast results of three experiments in the BTH region that lasted from November 1 till December 3, 2015. From the average of the observations (MO) and the average
Fig. 3(c). Comparison of the RMSE of every 72-h forecast’s initial conditions during the experimental period before and after DA.

Zheng et al., Aerosol and Air Quality Research, 18: 1305–1316, 2018 1311
Fig. 4. Comparison of the PM2.5 observations and PM2.5 concentration in initial conditions before and after DA within all the 1436 observation sites in every domain on October 31, 2015, within Obs for observations, CT for initial conditions without DA and DA for initial conditions with DA.
of the model results (MM), it is clear that the model estimation was higher than the observations over the whole BTH region, and the model bias (MB) was big. It also can be seen from the table, the model performance is “criteria” level without DA (MFB is 50.9% and MFE is 70.7%). The model performance was improved in the 24-h DA experiment: The MFB and MFE were both reduced and the RMSE was reduced by about 16% in BTH. Compared to the 24-h DA experiment, the model performance of the 12-h DA experiment was further improved, the RMSE was reduced by about 10%, and the MFB and MFE are further approximated to the “goal” level, so increasing assimilation frequency can help to improve the assimilation effect. The results for Beijing, Tianjin and Shijiazhuang also show with the same characteristics. Among them, the model performance in Tianjin is closest to the “goal” level with
DA, and the assimilation helped the model performance in Shijiazhuang to reach the “criteria” level. Improvement of the 72-h PM2.5 Forecast
The simulation effect of 72-h real-time forecast is important for air quality prediction, so it is necessary to evaluate the assimilation improvement effect of the 72-h real-time forecast. Fig. 7 shows the 0–72 forecast hour PM2.5 concentrations of observations, a CT and 12-h DA experiment, and the RMSE of CT and a 12-h DA experiment in both a single real-time forecast (on November 5) and over the whole experiment period (with averages corresponding to the same forecast hour) in BTH. In both the single real-time forecast and the whole experiment period, the assimilation effect on the 0–24-h forecast was significantly higher than that of 24–48-h forecast, the assimilation improvement

Zheng et al., Aerosol and Air Quality Research, 18: 1305–1316, 20181312
Fig. 5. Time series of the 24-h real-time forecast PM2.5 daily average concentration of the three experiments in Beijing during experimentation period, with the statistical of related coefficient (R) and RMSE, in which a represents CT, b represents 24-h-DA, and c represents 12-h-DA.
Fig. 6. Distribution of PM2.5 monthly mean concentrations of observations and three experiments in D3 during November 2015.

Zheng et al., Aerosol and Air Quality Research, 18: 1305–1316, 2018 1313
Table 2. The Statistic of 24-h PM2.5 real-time forecast results of three experiments in BTH from November 1 to December 3.
Experiment MO (µg m−3) MM (µg m−3) MB (µg m−3) RMSE MFB MFE BTH Control 95.0 156.7 61.7 101.4 50.90% 70.67%
24h-DA 95.0 142.0 47.0 85.0 44.90% 65.39% 12h-DA 95.0 132.2 37.1 77.5 40.00% 62.30%
Beijing Control 122.2 187.5 65.3 101.1 51.30% 68.36% 24h-DA 122.2 170.1 47.9 82.7 44.50% 62.01% 12h-DA 122.2 160.9 38.7 76.3 40.00% 59.37%
Tianjing Control 90.3 148.9 58.6 81.2 50.70% 64.22% 24h-DA 90.3 137.1 46.9 69.4 44.80% 58.94% 12h-DA 90.3 128.6 38.3 62.9 40.00% 55.97%
Shijiazhuang Control 111.2 214.2 102.9 123.8 72.10% 80.19% 24h-DA 111.2 185.7 74.4 97.8 62.90% 72.05% 12h-DA 111.2 170.0 58.8 86.3 57.00% 67.98%
Fig. 7. The 0–72 forecast hour PM2.5 concentrations of observations, CT and 12-h-DA experiment and the RMSE of CT and 12-h-DA experiment in a single real-time forecast (on November 5) and the whole experiment period (average according to the same forecast hour) in BTH. Line is for the PM2.5 concentrations and bar for the RMSE.
effect on the 48–72-h forecast was even weaker. The assimilation had an impact on all of the forecasted hours, but the improvement effect was diminished as time increased To further study the assimilation improvement effect of every forecast hour in a 72-h real-time forecast, we compared the attenuation curve of the RMSE improvement effect of 12-h DA experiment with CT in BTH (as shown in Fig. 8). The RMSE improvement is best (20–65%) in the initial stage of forecast (< 12 h), but the improvement of RMSE rapidly fell to about 15% in the 24th forecast hour, then further dropped to about 10% during the 24–48-h period, and finally became weak (< 10%) during the 48–72-h period.
Table 3 shows the statistics of the RMSE improvement of the 12-h DA experiment compared with the CT for 72-h real-time forecast in the BTH region. For the 0–24-h real-
time forecast, the improvement effect of RMSE was 23.6% in the whole of the BTH region, and higher than 20% in most cities. Handan had the highest rate (33.7%), and Zhangjiakou the lowest (16.8%) because of the lowest background concentration of PM2.5. For the 24–48-h and 48–72-h real-time forecasts, the RMSE improvement was 8.2% and 4.8% in BTH respectively, with about 10% and 5% in cities. For the whole 72-h real-time forecast, the RMSE improvement was 12.8% in the BTH region and about 10% in cities. CONCLUSIONS
In this paper, we built a data assimilation business system for 72-h real-time forecasts with data from CNEMC’s

Zheng et al., Aerosol and Air Quality Research, 18: 1305–1316, 20181314
Fig. 8. The attenuation curve of the RMSE improvement effect of 12-h-DA experiment compared with CT in BTH.
Table 3. The statistics of the RMSE improvement of 12-DA experiment compared with CT for 72-h real-time forecast in BTH.
0–24 h (%) 24–48 h (%) 48–72 h (%) 0–72 h (%) JJJ 23.6 8.2 4.8 12.3 Beijing 24.5 6.2 5.3 12.1 Tianjing 22.5 8.6 7.1 12.8 Shijiazhuang 30.3 10.3 7.0 16.2 Tangshan 16.2 4.8 5.7 9.2 Qinhuangdao 17.2 8.4 6.6 10.9 Handan 33.7 12.4 5.2 17.8 Xingtai 32.6 10.2 5.9 16.8 Baoding 22.9 7.8 0.7 10.6 Zhangjiakou 16.8 9.1 6.8 10.9 Chengde 18.4 9.2 5.6 11.0 Cangzhou 21.0 11.4 9.0 13.8 Langfang 17.1 5.8 2.5 8.7 Hengshui 22.3 10.9 3.7 12.3
1,436 national control observation sites and an OI method. This system is the first of its kind in China and assimilates the initial conditions of PM2.5, SO2 and NO2 concentrations. To evaluate the improvement of the DA system for PM2.5 simulation, three experiments during heavy PM2.5 pollution in the BTH region were conducted. We found that the model bias of the 24-h real-time forecast in the BTH region was higher (61.7 µg m−3) without DA and lower (37.1 µg m−3) with DA, whereas the RMSE was reduced from 101.4 before assimilation to 77.5 afterwards. The model performance approached “goal” from “criteria,” with reductions in the MFB and MFE from 50.9% and 70.67% to 40% and 62.3%, respectively. Compared to a 24-h DA experiment (with one assimilation daily), the 12-h DA (with two assimilations daily) showed a greater improvement (about 10% for the RMSE), meaning that increasing the assimilation frequency can improve the DA system performance for real-time forecasts. The RMSE improvement was 24%, 8.2%, 4.8%
and 12.3% for 0–24 h, 24–48 h, 48–72 h and 0–72 h in BTH, respectively. The improvement effect was diminished as the forecast hour increased, especially in the beginning (0–12 h). The RMSE improvement in the first 24 hours of the forecast remained above 15%, then dropped to about 10% during the 24–48-h forecast, and finally weakened (< 10%) during the 48–72-h period.
With DA, the RMSE was over 100 during Case 2. Even this RMSE improvement is significant, possibly because of the uncertainty of the emission sources and the physical and chemical mechanisms in the model. However, the RMSE of the initial conditions remaining high after assimilation is likely one of the reasons for this result. Hence, even if the assimilation improvement effect is acceptable as a whole, the system has a larger optimized space. It is necessary to improve the DA system in terms of the parameters of the OI algorithm, assimilation frequency, observation data quality control and so forth, in the future.
Zheng et al., Aerosol and Air Quality Research, 18: 1305–1316, 2018 1315
ACKNOWLEDGEMENTS
This work was supported by the National Natural Science Foundation (Grant No. 41575128, 91544218, 91644216). REFERENCES Athanasopoulou, E., Tombrou, M., Pandis, S.N. and
Russell, A.G. (2008). The role of sea-salt emissions and heterogeneous chemistry in the air quality of polluted coastal areas. Atmos. Chem. Phys. 8: 5755–5769.
Benedetti, A. and Fisher, M. (2007). Background error statistics for aerosols. Q. J. R. Meteorolog. Soc. 133: 391–405.
Benedetti, A., Morcrette, J., Boucher, O., Dethof, A., Engelen, R.J., Fisher, M., Flentje, H., Huneeus, N., Jones, L., Kaiser, J.W., Kinne, S., Mangold, A., Razinger, M., Simmons, A.J. and Suttie, M. (2009). Aerosol analysis and forecast in the European Centre for Medium-Range Weather Forecasts Integrated Forecast System: 2. Data assimilation. J. Geophys. Res. 114: 1–18.
Bocquet, M., Elbern, H., Eskes, H., Hirtl, M., Žabkar, R, Carmichael, G.R., Flemming, J., Inness, A., Pagowski, M., Pérez Camaño, J.L., Saide, P.E., San Jose, R., Sofiev, M., Vira, J., Baklanov, A., Carnevale, C., Grell, G. and Seigneur, C. (2015). Data assimilation in atmospheric chemistry models: Current status and future prospects for coupled chemistry meteorology models. Atmos. Chem. Phys. 15: 5325–5358.
Bouttier, F. and Courtier, P. (2002). Data assimilation concepts and methods, Meteorological Training Course Lecture Series, March 1999, ECMWF, Reading, United Kingdom.
Boylan, J.W. and Russell, A.G. (2006). PM and light extinction model performance metrics, goals, and criteria for three-dimensional air quality models. Atmos. Environ. 40: 4946–4959.
Candiani, G., Carnevale, C., Finzi, G., Pisoni, E. and Volta, M. (2013). A comparison of reanalysis techniques: Applying optimal interpolation and Ensemble Kalman Filtering to improve air quality monitoring at mesoscale. Sci. Total Environ. 458: 7–14.
Cao, G., Zhang, X., Wang, D. and Zheng, F. (2005). Inventory of pollutants discharged from biomass burning in mainland China (in Chinese). China Environ. Sci. 4: 389–393.
Carmichael, G.R., Sandu, A., Chai, T., Daescu, D.N., Constantinescu, E.M. and Tang, Y. (2008). Predicting air quality: Improvements through advanced methods to integrate models and measurements. J. Comput. Phys. 227: 3540–3571.
Chen, H., Li, J., Ge, B., Yang, W., Wang, Z., Huang, S., Wang, Y., Yan, P., Li, J. and Zhu, L. (2015). Modeling study of source contributions and emergency control effects during a severe haze episode over the Beijing-Tianjin-Hebei area. Sci. China Chem. 58: 1403–1415.
Collins, W.D., Rasch, P.J., Eaton, B.E., Khattatov, B.V., Lamarque, J.F. and Zender, C.S. (2011). Simulating aerosols using a chemical transport model with assimilation
of satellite aerosol retrievals: Methodology for INDOEX. J. Geophys. Res. 106: 7313–7336.
Crawford, J., Griffiths, A., Cohen, D., Jaing, N. and Stelcer, E. (2016). Particulate Pollution in the Sydney Region: Source Diagnostics and Synoptic Controls. Aerosol Air Qual. Res. 16: 1055–1066.
Daley, R. (1991). Atmospheric data analysis, Cambridge University Press, Cambridge.
Denby, B., Schaap, M., Segers, A., Builtjes, P. and Hora, J. (2008). Comparison of two data assimilation methods for assessing PM10 exceedances on the European scale. Atmos. Environ. 42: 7122–7134.
Evensen, G. (2009). Data assimilation: The ensemble kalman filter, Springer, Berlin, Germany.
Grell, G., Peckham, S.E., Schmitz, R., McKeen, S.A., Frost, G., Skamarock, W.C. and Eder, B. (2005). Fully coupled “online” chemistry within the WRF model. Atmos. Environ. 39: 6957–6975.
Guenther, A., Karl, T., Harley, P., Wiedinmyer, C., Palmer, P.I. and Geron, C. (2006). Estimates of global terrestrial isoprene emissions using MEGAN (model of emissions of gases and aerosols from nature). Atmos. Chem. Phys. 6: 3181–3210.
Hayami, H., Sakurai, T., Han, Z., Ueda, H., Carmichael, G. R., Streets, D., Holloway, T., Wang, Z., Thongboonchoo, N., Engardt, M., Bennet, C., Fung, C., Chang, A., Park, S.U., Kajino, M., Sartelet. K., Matsuda, K. and Amann, M. (2008). MICS-Asia II: Model intercomparison and evaluation of particulate sulfate, nitrate and ammonium. Atmos. Environ. 42: 3510–3527.
Houtekamer, P.L., Mitchell, H.L., Pellerin, G., Buehner, M., Charron, M., Spacek, L. and Hansen, B. (2005). Atmospheric data assimilation with an ensemble Kalman filter: Results with real observations. Mon. Weather Rev. 133: 604–620.
Huang, R.J., Zhang, Y., Bozzetti, C., Ho, K,F., Cao, J.J., Han, Y., Daellenbach, J.G., Platt, S.M., Canonaco, F., Zotter, P., Wolf, R., Pieber, S.M., Bruns, M., Ciarelli, G., Piazzalunga, A., Schwikowski, M., Abbaszade, K.R., Slowik, E.A., Crippa, G., Schnelle-Kreis, J., Zimmermann, R., An, Z., Szidat S., Baltensperger, U., El Haddad I. and Prévôt, A.S. (2014). High secondary aerosol contribution to particulate pollution during haze events in China. Nature 514: 218–222.
Huang, S., Tang, X., Wang, Z., Chen, H., Liu, B. and Zhu, J. (2016). Evaluating the PM2.5 pollution over Beijing-Hebei-Tianjin Region based on observations, simulations, and data assimilation results. Clim. Environ. Res. 21: 700–710. (in Chinese)
Jiang, Z., Liu, Z., Wang, T., Schwartz, C.S., Lin, H.C. and Jiang, F. (2013). Probing into the impact of 3DVAR assimilation of surface PM10 observations over China using process analysis. J. Geophys. Res. 118: 6738–6749.
Kalnay, E. (2003). Atmospheric modeling, data assimilation, and predictability, Cambridge University Press, Cambridge, United Kingdom.
Kukkonen, J., Olsson, T., Schultz, D.M., Baklanov, A., Klein, T., Miranda, A.I., Monteiro, A., Hirtl, M., Tarvainen, V., Boy, M., Peuch, V.H., Poupkou, A., Kioutsioukis, I.,
Zheng et al., Aerosol and Air Quality Research, 18: 1305–1316, 20181316
Finardi, S., Sofiev, M., Sokhi, R., Lehtinen, K.E.J., Karatzas, K., Jose, R.S., Astitha, M. and Kallos, G. (2012). A review of operational, regional-scale, chemical weather forecasting models in Europe. Atmos. Chem. Phys. 12: 1–87.
Li, J., Wang, Z., Zhuang, G., Luo, G., Sun, Y. and Wang, Q. (2012). Mixing of Asian mineral dust with anthropogenic pollutants over East Asia: A model case study of a super-dust storm in March 2010. Atmos. Chem. Phys. 12: 7591–7607.
Li, S., Ma, Z., Xiong, X., David, C.C., Wang, Z. and Liu, Y. (2016). Satellite and ground observations of severe air pollution episodes in the Winter of 2013 in Beijing, China. Aerosol Air Qual. Res. 16: 977–989.
Luo, G. and Wang, Z. (2006). Establishment and verification of the global environmental atmospheric transport model (GEATM). Chin. J. Atmos. Sci. 3: 504–518. (in Chinese)
Marécal, V., Peuch, V.H., Andersson, C., Andersson, S., Arteta, J., Beekmann, M., Benedictow, A., Bergström, R., Bessagnet, B., Cansado, A., Chéroux, F., Colette, A., Coman, A., Curier, R.L., Denier van der Gon, H.A.C., Drouin, A., Elbern, H., Emili, E., Engelen, R.J., Eskes, H.J., Foret, G., Friese, E., Gauss, M., Giannaros, C., Guth, J., Joly, M., Jaumouillé, E., Josse, B., Kadygrov, N., Kaiser, J. W., Krajsek, K., Kuenen, J., Kumar, U., Liora, N., Lopez, E., Malherbe, L., Martinez, I., Melas, D., Meleux, F., Menut, L., Moinat, P., Morales, T., Parmentier, J., Piacentini, A., Plu, M., Poupkou, A., Queguiner, S., Robertson, L., Rouïl, L., Schaap, M., Segers, A., Sofiev, M., Tarasson, L., Thomas, M., Timmermans, R., Valdebenito, Á., van Velthoven, P., van Versendaal, R., Vira, J. and Ung, A. (2015). A regional air quality forecasting system over Europe: the MACC-II daily ensemble production. Geosci. Model Dev. Discuss. 8: 2777–2813.
Odum, J.R., Jungkamp, T.P.W., Griffin, R.J., Flagan, R.C. and Seinfeld, J.H. (1997). The atmospheric aerosol-forming potential of whole gasoline vapor. Science 276: 96–99.
Pagowski, M. and Grell, G.A. (1991). Experiments with the assimilation of fine aerosols using an ensemble Kalman filter. J. Geophys. Res. 117: D21302.
Peng, Z., Liu, Z., Chen, D. and Ban, J. (2017). Improving PM2.5 forecast over china by the joint adjustment of initial conditions and source emissions with an ensemble kalman. Atmos. Chem. Phys. 17: 4837–4855.
Sandu, A. and Chai, T. (2011). Chemical data assimilation an overview. Atmosphere 2: 426-463.
Schutgens, N.A.J., Miyoshi, T., Takemura, T. and Nakajima, T. (2010). Sensitivity tests for an ensemble Kalman filter for aerosol assimilation. Atmos. Chem. Phys. 10: 6583–6600.
Sugimoto, N. and Uno, I. (2009). Observation of Asian dust and air- pollution aerosols using a network of ground-based lidars (AD-Net): Real-time data processing for validation/assimilation of chemical transport models. IOP C. Ser. Earth Environ. 7: 012003.
Sun, Y.L., Wang, Z., Wild, O., Xu, W., Chen, C., Fu, P., Du, W., Zhou, L., Zhang, Q., Han, T., Wang, Q., Pan,
X., Zheng, H., Li, J., Guo, X., Liu, J. and Worsnop, D. R. (2016). “APEC Blue”: Secondary Aerosol Reductions from Emission Controls in Beijing. Sci. Rep. 6: 20668.
Tang, X., Zhu, J., Wang, Z.F. and Gbaguidi, A. (2011). Improvement of ozone forecast over Beijing based on ensemble kalman filter with simultaneous adjustment of initial conditions and emissions. Atmos. Chem. Phys. 11: 12901–12916.
Wang, H. and Niu, T. (2013). Sensitivity studies of aerosol data assimilation and direct radiative feedbacks in modeling dust aerosols. Atmos. Environ. 64: 208–218.
Wang, Y., Sartelet, K. N., Bocquet, M. and Chazette, P. (2014). Modelling and assimilation of lidar signals over Greater Paris during the MEGAPOLI summer campaign. Atmos. Chem. Phys. 14: 3511–3532.
Wang, Z., Zhang, D., Li, X., Li, Y., Chen, T., Liu, B., Li, L., Nie, T. and Pan, L. (2016). Multi-method observation and numerical simulation of a PM2.5 pollution episode in Beijing in October, 2014. Aerosol Air Qual. Res. 16: 1403–1415.
Wang, Z.F., Akimoto, H. and Uno, I. (2002). Neutralization of soil aerosol and its impact on the distribution of acid rain over East Asia: Observations and model results. J. Geophys. Res. 107: ACH 6-1–ACH 6-12.
Wang, Z.F., Maeda, T., Hayashi, M., Hsiao, L.F. and Liu, K.Y. (2001). A nested air quality prediction modeling system for urban and regional scales: Application for high-ozone episode in Taiwan. Water Air Soil Pollut. 130: 391–396.
Wang, Z.F., Xie, F.Y., Wang, X.Q., An, J.L. and Zhu, J. (2006). Development and application of nested air quality prediction modeling system. Chin. J. Atmos. Sci. 30: 778–790. (in Chinese)
Wu, J.B., Xu, J., Pagowski, M., Geng, F., Gu, S., Zhou, G., Xie, Y. and Yu, Z. (2015). Modeling study of a severe aerosol pollution event in December 2013 over shanghai China: An application of chemical data assimilation. Particuology 20: 41–51.
Wu, L., Mallet, V., Bocquet, M. and Sportisse, B. (2008). A comparison study of data assimilation algorithms for ozone forecasts. J. Geophys. Res. 113: D20310.
Yumimoto, K., Nagao, T.M., Kikuchi, M., Sekiyama, T.T., Murakami, H., Tanaka, T.Y., Ogi, A., Irie, H., Khatri, P., Okumura, H., Arai, K., Morino, I., Uchino, O. and Maki, T. (2016). Aerosol data assimilation using data from Himawari-8, a next-generation geostationary meteorological satellite. Geophys. Res. Lett. 43: 5886–5894.
Zheng, B., Zhang, Q., Zhang, Y., He, K.B., Wang, K., Zheng, G.J., Duan, F.K., Ma, Y.L. and Kimoto, T. (2015). Heterogeneous chemistry: A mechanism missing in current models to explain secondary inorganic aerosol formation during the January 2013 haze episode in North China. Atmos. Chem. Phys. 15: 2031–2049.
Received for review, December 18, 2017 Revised, March 19, 2018
Accepted, March 26, 2018