improvements to the output approach to gdp (gdpo) denise blackmore, mark stephens & claire...
TRANSCRIPT

Improvements to the Output Approach to GDP (GDPO)
Denise Blackmore, Mark Stephens & Claire Dobbins
ONS
June 2014
1

Agenda
• Background
• Update on current work programme
Questions/comments
• Industry review consultation
Questions/comments
• Looking forward
2

The GDPO Improvement Project
• The GDPO Improvement Project covers work on industry reviews and wider continual improvement issues, producing an annual report.
• It is delivered by the Analysis and Methods branch within Business Indicators and Balance of Payments division, ONS.
• There is increasing Eurostat focus on ‘index of services’ and an expectation that Member States give this more emphasis.
• Only Ireland, Sweden and UK currently produce a monthly index of services within the EU.
3

Recent improvements
At Blue Book 2013 (BB13) – method / data improvements for ten Standard Industrial Classification (SIC) 2007 industries covering 10% of the economy including:
• Agriculture (industry 01) – Rebasing, inclusion of oilseed rape as an indicator, review of work in progress methodology
• Fishing (03) – Rebasing
• Mining support services (09) – Move from exploration volume to workforce jobs to better represent maintenance and decommissioning
• Iron and steel (24.1-3) – Rebasing
• Construction (41-43) – Move from fixed base constant price estimates to chained volume measures; move from quarterly to monthly seasonal adjustment
• Air transport (51) – Improved treatment of births and deaths from civil aviation authority dataset
4

Rebasing work for Blue Book 2014
• A key delivery of continual improvement for Blue Book 2014 will be the use of Producer Price Indices (PPI), Import Price Indices (IPI), Export Price Indices (EPI) and Service Producer Price Indices (SPPI) rebased from 2005=100 to 2010=100.
• An article will be published on June 30th to explain this in more detail.
• These are applied across the 112 industries and products used for supply and use balancing.
• Below this level, ONS has also updated aggregation and deflation weights where appropriate within the GDPO system e.g.
• Weighting output indices for management consultants (turnover based) and head offices (jobs based).
• Weighting the Consumer Prices Index for hotels and the Service Producer Price Index (business to business) for hotels.
5

Outline of GDPO deflation sources
The following is an indication for users of the deflator sources used for 2010 within GDPO for Blue Book 2013. The September GDPO Improvement Report will supply a full update.
Source Weight Description
PPI/EPI 12.0% Harmonic Producer Price Index and Export Price Index
PPI 4.3% Producer Price Index
SPPI 11.2% Service Producer Price Index
CPI 12.1% Consumer Prices Index
RSI 5.7% Retail Sales Index implied deflator
BIS 6.4% Construction Price Indices (Business, Innovation & Skills)
AWE 11.1% Average Weekly Earnings (labour input)
HHFCE 9.4% Household Final Consumption deflator
Other 8.9%
Derived 18.8% Derived from current price and volume data with 3.0% in the market sector and 15.8% in the non-market sector
6

Price and volume ratings
The conceptual appropriateness of prices and other data are a key feature of the GDPO Improvement project.
The Eurostat ‘Price and Volume Inventory’ (2014 edition) is the guidebook used to judge the quality of indicators as:
A – appropriate
B – acceptable
C – improvement required
For example, this guides ONS in seeking to use turnover data in market settings in preference to labour inputs (jobs data).
7
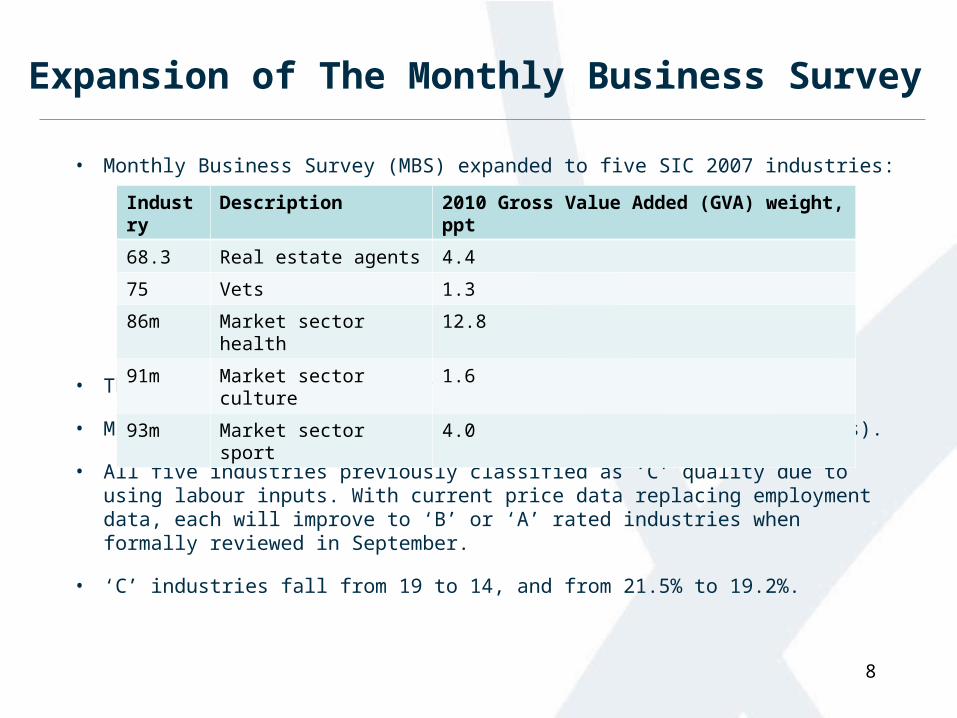
Expansion of The Monthly Business Survey
• Monthly Business Survey (MBS) expanded to five SIC 2007 industries:
• These mainly replace quarterly ONS employment indicators.
• MBS coverage increased from 41% to 43% of GDPO (2010 GVA weights).
• All five industries previously classified as ‘C’ quality due to using labour inputs. With current price data replacing employment data, each will improve to ‘B’ or ‘A’ rated industries when formally reviewed in September.
• ‘C’ industries fall from 19 to 14, and from 21.5% to 19.2%.
Industry Description 2010 Gross Value Added (GVA) weight, ppt
68.3 Real estate agents 4.4
75 Vets 1.3
86m Market sector health 12.8
91m Market sector culture 1.6
93m Market sector sport 4.0
8

VAT feasibility study
• We are now able to record Monthly VAT Turnover data on a SIC07 basis.
• Aim is to investigate using the data either as a benchmark, an indicator in its own right or as a source to augment the MBS in the long-term. It has significant potential.
• Currently conducting parallel runs with MBS. Update on progress in September report, but significant testing and development required.
• For 2013 q4, initial analysis is indicating that around 50%, 75% and 90% of turnover would have been available for the preliminary estimate, the second estimate and quarterly NA respectively.
9

• There are 17 industries that are experimental, covering 19.8% of the economy at 2010 weights.
• Nine industries are currently subject to an industry review. Their status will be addressed as part of that process by spring 2016 –
water transport (50), financial services (64), financial intermediation (66), real estate – fee or contract basis (68.3), scientific research & development (72), vets (75), market sector health (86m), residential care activities (87) and social work activities without accommodation (88).
• The methodology and data sources of the remaining industries are already of an acceptable standard. Consultation will begin in September on their re-classification as National Statistics –
programming & broadcasting activities (60), computer programming (62), information services (63), insurance & pension funding (65), rental & leasing activities (77), services to building & landscaping activities (81), membership organisations (94) and households as employers of domestic personnel (97).
Experimental Industries
10
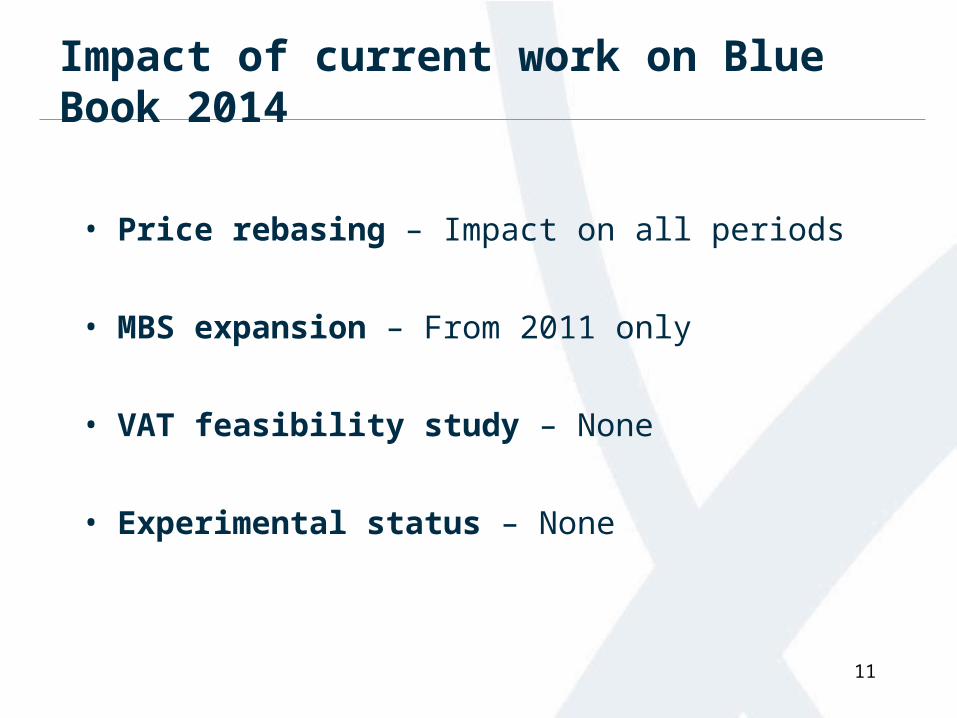
Impact of current work on Blue Book 2014
• Price rebasing – Impact on all periods
• MBS expansion – From 2011 only
• VAT feasibility study – None
• Experimental status – None
11

Questions?
12

What is the industry review process?
The process is to:
• evaluate concepts and methods against international guidelines (primarily Eurostat Price and Volume Inventory, 2014)
• quality assure current data and methods
• investigate alternative sources and methods
13

Prioritising reviews
Use a priority matrix, primarily driven by Gross Value Added weight within GDPO.
This is then influenced by:
• Eurostat quality rating (60%)• Industry specific knowledge (20%) e.g. specific
data quality, periodicity and experimental status• Revisions (10%)• Volatility (10%)
14

Priority List at Blue Book 2013
64 Financial service activities
68.1/2 Real estate and imputed rent
62 Computer programming
84 Public Administration
66 Activities auxiliary to financial services
70 Activities of head offices; management consultants
71 Architectural & engineering activities; technical testing & analysis
86m Human health (market sector)
85m Education (market sector)
86nm Human health (non-market)
87 Residential care
47 Retail trade
88 Social work (non-residential)
85nm Education (non-market sector)
69 Legal and accounting activities
Bold = currently under review Underline = to be reviewed
15

Timeline
Industry GDP weight (1000)
Commence Consult Finalise
68 – Real estate 96.9 Dec 2012 Jun 2014 Sep 2014
41.1 – Property developers
9.7 Jun 2013 Tbc Apr 2015
86 – Health 55.2 Dec 2012 Jun 2014 Sep 2014
64 & 66 – Financial industries
79.5 Feb 2013 Mar 2015 Sep 2015
84 – Public admin 53.5 May 2013 Jun 2014 Sep 2014
50 – Water transport 3.0 Apr 2014 Dec 2014 Apr 2015
87/88 – Social care 20.5 Jun 2014 Dec 2014 Apr 2015
69-75 – Professional services
68.6 Jun 2014 Mar 2015 Jul 2015
Total 386.8
16

Questions?
17

Real estate – Blue Book 2013 data sources
Industry DescriptionCurrent
PriceVolume Deflator
68.1 Buying and selling real estate
n/a n/a n/a
68.1-2 Com Commercial rentals Non-ONS survey
Derived Non-ONS survey
68.1-2 Res (non-market)
Residential rental e.g. council housing
Government data
Government data
Derived
68.1-2 Res (market)
Residential rental e.g. private rented
Derived Housing stock
ONS survey
68.2 Imputed As above As above As above As above
68.3 Agents on a fee or contract basis
Derived Jobs CPI/SPPI
18

Industry Review – Real estate (68)
Buying and selling of own real estate (68.1)
• Covers 1-2% of industry 68
• Method using administrative data to be developed
Commercial sector property rentals (part of 68.1-2)
• Investment Property Databank (IPD) currently provide a property rental deflator which is also used by SPPI.
• Develop commercial property price indices following guidance from Eurostat by the end of 2015.
19

Industry Review – Real estate (68)
Residential sector property rentals
(part of 68.1-2 and 68.2 imputed rentals)• At BB13 derived from actual rentals (e.g. council rentals) and estimated
rentals from stock of housing and rental price data from the ONS Living Cost and Food (LCF) Survey - estimates coherent with GDPE.
• Long-term aim to move from LCF to rental price data from Valuation Office Agency (VOA) which is already used within the Consumer Prices Index (Housing) or CPIH.
• In February 2014 ONS announced that CPIH growth rates would slowly be introduced to Household Final Consumption Expenditure and feed through to GDPO:
• February 2014 – Impact from 2013• March 2014 – Impact from 2012• Blue Book 2014 – Impact from 2010• Blue Book 2015 – Impact from 1997
20

Industry Review – Real estate (68)
Real estate activities on a fee or contract basis (68.3)
• Move from workforce jobs to new MBS data source for Blue Book 2014
Impact on Blue Book 2014
• 68.1-2 – New residential sector rentals from 2010
• 68.3 – New MBS data from 2011
21

Questions?
22

Health – Blue Book 2013 data sources
Industry DescriptionCurrent
PriceVolume Deflator
86NM Non-market human health activities
Government spend
Cost-weighted activity index
Derived
86M.01 Market subcontracted human health activities
Derived Cost-weighted activity index
Consumer Prices Index
for Health
86M.02 Market private human health activities
Derived Jobs Consumer Prices Index
for Health
23

Industry Review – Health (86)
Non-market health output
• Good coherence between GDPE and GDPO
• Non-market health output index is appropriate
• Non-market clinical care sub-contracted to the market sector reclassified from market to non-market sector
• Increases weight of non-market sector
• Consequential change to deflation – using the non-market health output index rather than CPI for health
• Government funding to local authorities to be reviewed as part of social care industry review
24

Industry Review – Health (86)
Market health output
• Market sector health indicator changes from workforce jobs to MBS
Impact on Blue Book 2014
• 86M – New Monthly Business Survey data from 2011
• 86NM – Increase in non-market weight in all periods with consequential use of non-market health output index rather than CPI for health
25

Questions?
26

Public Admin – Blue Book 2013 data sources
Industry DescriptionCurrent
PriceVolume Deflator
84.1-21 Admin. of state
Government spend
Jobs Derived
84.22 Defence Government spend
Jobs Derived
84.23 Justice Government spend
Cost-weighted activity index
Derived
84.24 Public Order Government spend
Jobs Derived
84.25 Fire Government spend
Cost-weighted activity index
Derived
84.3 Social Security
Government spend
Cost-weighted activity index
Derived
27

Industry Review – Public Admin. (84)
• Good coherence between GDPE and GDPO
• Use of employment indicators for administration of the state, defence and public order are appropriate
• Use of public sector output volume indices for justice, fire and social security administration are appropriate
• Impact on Blue Book 2014 – None
• Volume indices can be improved over medium-term• Coverage – e.g. courts to cover Scotland, prisons to cover Northern Ireland• Timeliness – Fire data is annual
28

Questions?
29

Looking forward
• Next suite of National Accounts articles to be published on June 30th with an overarching article describing impacts
• This includes articles on price rebasing and industry reviews
• Industry Review article• More detail on three industry reviews outlined today
• More detail on MBS expansion
• GDPO Improvement Report September 30th • Update on progress and work plans for the year ahead
• Update the priority matrix
• Extension of industry review timetable to detail new reviews to 2017
30
