improving a plant’s operations by applying lean...
TRANSCRIPT

Improving a plant’s operations by applying lean
manufacturing on the material flow and layout
design
Alfa Laval
Anton Kamne Anton Sjöberg
Master Thesis for M. Sc. in Industrial Engineering and Management
Faculty of Engineering, Department of Engineering Logistics
Supervisor: Sebastian Pashaei

i
Acknowledgement This Master thesis is the concluding part of our Master’s degree in Industrial Engineering and
Management at Lund University. The thesis has been conducted during the fall of 2015, on the behalf of
Alfa Laval on their site in Wood Dale, Chicago.
We would like to express our sincere gratitude to the entire personnel at the Wood Dale facility, from
top management to the operators on the shop floor. Without their hospitality and support this thesis
would not have been possible. A special thanks to Fredrik Berglund, Operations Development Manager
for region US, for valuable feedback throughout the course of the project. Also, Conny Lindberg and his
efforts in arranging the whole project on the behalf of Alfa Laval in Lund should be acknowledged.
We would also like to send out appreciations to our supervisor at Lund University at the department of
Engineering Logistics, Sebastian Pashaei, for his treasured guidance and comments during the thesis.
Lund, January 2016
Anton Sjöberg Anton Kamne

ii
Abstract Toyota Motor Company changed the world with their production system. By removing activities in the
manufacturing process that were not adding any value to the product, the company could become agile
and offer products to the customer with short lead time as well as to a low cost. Companies in other
countries needed to change their manufacturing processes in order stay competitive and a western
variant of the production system used by Toyota was developed. It was named lean manufacturing.
Lean manufacturing is based on the same concepts as the Toyota Production System (TPS) and focuses a
lot on eliminating non-value adding activities, so called waste. Waste could come in many different
shapes but could for example be transportation, overproduction and inventory. Companies that have
not previously been exposed to TPS or lean manufacturing tend to have a lot of waste in their
manufacturing processes.
The Swedish metal processing company Alfa Laval has relatively recently acquired a factory in Wood
Dale, a western suburb of Chicago USA. This factory has previously not been applying lean
manufacturing on their operations and is currently struggling with a lot of waste, resulting in long lead
times and high inventories.
However, the desire of Alfa Laval is to implement lean manufacturing in the plant in Wood Dale and the
purpose of this Master thesis have been to develop a plan for the material flow in the plant. Besides
performing a comprehensive analysis of the current state; the Master thesis also includes developing
suggestions of a future state with new layout, material carriers and concepts on how to signal for
material between different areas. The scope of the Master thesis is limited to the operations inside the
plant and is kept on a high level perspective, i.e. no individual cell design.
The research approach to this study has been a deductive approach with a focus on collecting
quantitative data and the strategy has been to conduct a single case study with a holistic design.
Furthermore, much of the collected data have been primary data and this is one of the reasons why the
quality of this study is considered to be high.
With the help of lean tools such as product family matrix and value stream mapping, several
improvement areas could be identified. A future state has been suggested with several benefits to the
company. The payback time of the proposals is determined to 1.9 years but by estimating the benefits of
the projected reductions in lead time this could be decreased to 0.4 years. In addition to the instant
positive effects on reducing the waste in the plant, the proposal also takes soft values like safety and
ergonomics into account.
It can be discussed whether the approach in this case study is applicable to similar situations in the
future. To achieve a better certainty, additional case studies or perhaps longitudinal case studies will be
necessary. Nevertheless, it is argued that elements from this study can be adapted to future studies.
Key words: Toyota Production System, Lean manufacturing, Value stream mapping, Product family
matrix, Lean layout design and Material flow.

iii
Sammanfattning Toyota Motor Company förändrade världen med sitt produktionssystem. Genom att ta bort aktiviteter
som inte adderade värde till produkten, kunde företaget bli agilt med korta ledtider till kunden och till
en låg produktionskostnad. För att bli konkurrenskraftiga tvingades företag världen över förändra sina
produktionsprocesser och en västlig variant av Toyotas produktionsfilosofi uppstod. Denna variant gavs
beteckningen lean manufacturing.
Lean manufacturing är baserade på samma koncept som Toyota Production System (TPS) och fokuserar
till stor del på att eliminera icke-värdeadderande aktiviteter, s.k. slöseri. Slöseri kan komma i många
olika former men kan t ex vara transport, överproduktion och lager. Företag som inte tidigare använt sig
av TPS eller lean manufacturing tenderar att ha en hel del slöseri i sin tillverkningsprocess.
Det svenska metall- och teknikföretaget Alfa Laval har relativt nyligen tagit över en fabrik i Wood Dale;
en förort till Chicago i USA. Den här fabriken har inte tidigare använt sig av lean manufacturing och i
nuläget innehåller dess verksamhet stora mängder icke-värdeskapande aktiviteter; något som resulterat
i långa ledtider och höga lagernivåer.
Alfa Lavals önskan är att implementera lean manufacturing i fabriken i Wood Dale och syftet med detta
examensarbete är att utveckla en plan för materialflödet i fabriken. Utöver en omfattande analys över
nuläget i fabriken ska även förslag över ett framtida scenario med, metoder över hur material ska
transporteras respektive signaleras efter, tas fram. Examensarbetet är avgränsat till att enbart innefatta
aktiviteter inom fabriken och med ett övergripande perspektiv, dvs. individuell cell design är inte
inkluderat.
Forskningsansatsen till den här studien har varit en deduktiv ansats, med ett fokus på insamling av
kvantitativ data där strategin har varit att utföra en s.k. single case study med en holistisk design. Stora
delar av den insamlade datan har dessutom varit primärdata, vilket är en av anledningarna till varför
kvaliteten på den här studien anses vara hög.
Med hjälp av verktyg från lean manufacturing, såsom product family matrix och value stream mapping,
har ett flertal förbättringsområden kunnat identifieras. Ett förslag på ett framtida scenario har tagits
fram, innehållande flera fördelar. Paybacktiden av förslaget har beräknats till 1,9 år men genom att
uppskatta de förväntade fördelarna med reduktionen i ledtid kan den sänkas till 0,4 år. Lägg då också till
de omedelbara positiva effekterna av minskat slöseri i fabriken. Förslaget tar även hänsyn till mjuka
aspekter och säkerhet respektive ergonomi adresseras.
Det kan diskuteras huruvida tillvägagångssättet i denna case studie är applicerbart på liknande
situationer i framtiden. För att uppnå en bättre tillförlitlighet är ytterligare studier och studier under en
längre tid nödvändigt. Oberoende av detta, anses det att element från den här studien kan användas i
framtida studier samt i liknande situationer.
Key words: Toyota Production System, Lean manufacturing, Value stream mapping, Product family
matrix, Lean layout design and Material flow.

iv
Table of Contents 1. Introduction .......................................................................................................................................... 1
1.1. Background ................................................................................................................................... 1
1.2. Problem Definition ........................................................................................................................ 2
1.3. Purpose and objectives ................................................................................................................. 2
1.3.1. Research questions ............................................................................................................... 3
1.4. Delimitation .................................................................................................................................. 3
1.5. Target Group ................................................................................................................................. 4
1.6. Report Outline............................................................................................................................... 4
2. Methodology ......................................................................................................................................... 5
2.1. Research approach........................................................................................................................ 5
2.2. Research strategy .......................................................................................................................... 7
2.2.1. Design of Case study ............................................................................................................. 9
2.3. Data collection methods ............................................................................................................. 11
2.4. Description of case study ............................................................................................................ 12
2.4.1. Literature review ................................................................................................................. 13
2.4.2. Start-up on site – shop floor practice ................................................................................. 14
2.4.3. Data gathering..................................................................................................................... 15
2.4.4. Analyzing the data ............................................................................................................... 17
2.4.5. Solution design .................................................................................................................... 18
2.4.6. Testing of ideas ................................................................................................................... 20
2.4.7. Conclusions ......................................................................................................................... 21
2.5. Quality of the study..................................................................................................................... 21
2.5.1. Construct validity ................................................................................................................ 22
2.5.2. Internal validity ................................................................................................................... 22
2.5.3. External validity ................................................................................................................... 23
2.5.4. Reliability ............................................................................................................................. 23
3. Theoretical framework ....................................................................................................................... 25
3.1. Toyota Production System (TPS) ................................................................................................. 25
3.1.1. Waste – Muda ..................................................................................................................... 25
3.1.2. TPS compared to mass production ..................................................................................... 27

v
3.1.3. One-piece flow and continuous processes bring problems to the surface ........................ 27
3.1.4. Takt time ............................................................................................................................. 28
3.1.5. Just In Time ......................................................................................................................... 28
3.1.6. Kanban ................................................................................................................................ 29
3.1.7. Heijunka .............................................................................................................................. 30
3.1.8. Make tasks standardized in order to improve continuously .............................................. 30
3.1.9. Visual control and 5S ........................................................................................................... 31
3.1.10. Genchi genbutsu ................................................................................................................. 31
3.1.11. Nemawashi .......................................................................................................................... 32
3.1.12. The learning organization ................................................................................................... 32
3.1.13. Base your management decisions on a long-term philosophy, even at the expense of
short-term financial goals ................................................................................................................... 32
3.2. Lean manufacturing .................................................................................................................... 33
3.2.1. Analysis of flows .................................................................................................................. 33
3.2.2. Pareto-analysis .................................................................................................................... 33
3.2.3. U-shaped work cells and lean assembly lines ..................................................................... 34
3.2.4. Product family matrix .......................................................................................................... 35
3.2.5. Value Stream Mapping (VSM) ............................................................................................. 36
3.2.6. How to use a value stream map ......................................................................................... 37
3.2.7. Plan For Every Part (PFEP) ................................................................................................... 39
4. Empirical data/ Identifying current state ............................................................................................ 41
4.1. The case company – Alfa Laval, Wood Dale................................................................................ 41
4.2. Description of products .............................................................................................................. 43
4.2.1. Pareto-analysis .................................................................................................................... 43
4.3. Material Flow .............................................................................................................................. 47
4.3.1. Component Unit (CU) .......................................................................................................... 48
4.3.2. Supply Unit (SU) .................................................................................................................. 51
4.3.3. Supermarket and receiving/shipping .................................................................................. 57
4.3.4. Copper room ....................................................................................................................... 58
4.4. Product family matrix in the CU and SU ..................................................................................... 58
4.5. Value Stream Map – Current state ............................................................................................. 60
5. Analysis of current state and improvement proposals ....................................................................... 63

vi
5.1. CU – Areas of improvement ........................................................................................................ 63
5.1.1. Testing of ideas in CU .......................................................................................................... 66
5.1.2. CU – Short term actions ...................................................................................................... 67
5.1.3. CU – Long term proposal .................................................................................................... 70
5.2. SU – Areas of improvement ........................................................................................................ 71
5.2.1. SU – Short term actions ...................................................................................................... 74
5.2.2. SU – Long term proposal ..................................................................................................... 76
5.3. Summary improvement proposal ............................................................................................... 81
5.3.1. Future state value stream map ........................................................................................... 83
5.3.2. Plan For Every Part (PFEP) ................................................................................................... 84
6. Conclusions ......................................................................................................................................... 86
6.1. Conclusions associated to the purpose and objectives .............................................................. 86
6.2. Findings in need of further investigation .................................................................................... 88
6.3. Answers to research questions ................................................................................................... 90
6.3.1. The framework .................................................................................................................... 92
6.4. Future research ........................................................................................................................... 93
7. References .......................................................................................................................................... 95
Appendix ..................................................................................................................................................... 98
Appendix I – Questionnaire .................................................................................................................... 98
Appendix II – WIP Calculations ............................................................................................................... 99
Appendix III – Lead time calculations ................................................................................................... 101
Appendix IV – Spaghetti chart with color coding .................................................................................. 103

vii
List of figures Figure 1: The scope of the project. ............................................................................................................... 3
Figure 2: The structure of the methodology in the shape of a funnel. ......................................................... 5
Figure 3: The two different research methods with corresponding elements. (Olhager, 2015).................. 6
Figure 4: Possible designs to a case study. (Yin, 2009) ............................................................................... 10
Figure 5: The design of the case study. ....................................................................................................... 13
Figure 6: The process of developing a solution. ......................................................................................... 18
Figure 7: An example of the structure of the case study database, used to organize the collected data. 24
Figure 8: The theoretical framework with the philosophies, concepts and methods used in this report. 25
Figure 9: The process of performing a VSM. (Rother & Shook, 1999) ........................................................ 37
Figure 10: Example of symbols in a VSM. (Rother & Shook, 1999) ............................................................ 38
Figure 11: An example of a current state value stream map. .................................................................... 38
Figure 12: Example of symbols in a VSM. (Singh, et al., 2010) ................................................................... 39
Figure 13: The organization of the Wood Dale factory. TM stands for Team Manager. ............................ 41
Figure 14: Factory layout with different colors highlighting the different departments’ areas of
responsibility. .............................................................................................................................................. 42
Figure 15: Examples from the three product types produced and sold in Wood Dale. From the left:
condenser, receiver, and evaporator. Note that this is only three examples of many variants within the
three product groups. ................................................................................................................................. 43
Figure 16: The amount of sold product, in number of complete vessels, and the total cost generated by
all sold products in each product group. .................................................................................................... 44
Figure 17: Quantities sold per year for each item in a certain product group. This curve is applicable to all
of the four of selected product types with some reservations. ................................................................. 46
Figure 18: A spaghetti flow chart, based on the four chosen product types, over the different material
flows in the factory. .................................................................................................................................... 47
Figure 19: Layout over the entire CU with receiving dock at the top left corner. ...................................... 48
Figure 20: A description of where in the CU different components are mainly being manufactured. ...... 49
Figure 21: The basic layout over the SU with shipping dock in the top left corner. ................................... 51
Figure 22: The description the different areas in the SU along with the packing/shipping zone. ............. 52
Figure 23: The current state of the SU and packing/shipping visualized in blocks of different
workstations. .............................................................................................................................................. 54
Figure 24: A view of some of the different material carriers in SU small. The image displays both baskets
with kitted orders and carts with WIP. ....................................................................................................... 56
Figure 25: A view of three different material carriers. From the left; small carts for small vessels, cart
meant for large pipes or relatively large vessels and lastly customized pallet with wheels meant for really
large vessels. ............................................................................................................................................... 57
Figure 26: A product family matrix with the selected products as well as machines or workstations in the
CU. ............................................................................................................................................................... 59
Figure 27: Product family matrix of the SU with corresponding manufacturing sequence. ...................... 60
Figure 28: The complete value stream map, based on the four chosen product types, over the current
state in the Wood Dale plant. ..................................................................................................................... 61

viii
Figure 29: The material flow of the manufacturing of large heads with partition in the CU. .................... 64
Figure 30: The product family matrix of the components manufactured in the CU. The components and
machines have been grouped together in five different work cells. .......................................................... 65
Figure 31: A layout of the current state in the CU. All of the machines have received the determined cell
color from the product family matrix. ........................................................................................................ 66
Figure 32: The new layout based on the short term actions. ..................................................................... 69
Figure 33: The long term suggested layout for the CU. .............................................................................. 71
Figure 34: An example of a bad material flow and procedure to handle the vessel. ................................. 72
Figure 35: A layout of the SU with short term actions included. ................................................................ 75
Figure 36: The future state layout of the SU. ............................................................................................. 78
Figure 37: An illustration of the new rack for heads. ................................................................................. 79
Figure 38: A suggestion of a new material carrier in SU small. .................................................................. 80
Figure 39: The new material proposed to be used in SU large to move large vessels on carts. ................ 80
Figure 40: An example of the sequence the long term proposals can be implemented in. Key
performance indexes that are affected positively by each activity are included in parenthesis in each text
box............................................................................................................................................................... 83
Figure 41: Value stream map of the future state in the plant. Based on the four investigated product
types. ........................................................................................................................................................... 84
Figure 42: Process of how lean changes can be developed in the Wood Dale plant. ................................ 93
Figure 43: Complete spaghetti chart of the factory. ................................................................................ 103

ix
List of tables Table 1: Compilation of the different sections in the report with a short descriptive explanation. ............ 4
Table 2: Different purposes and questions and which method to use in which case. (Stuart, et al., 2002) 8
Table 3: Different methods matched with conditions of when to use them. (Yin, 2009) ............................ 9
Table 4: List of the interviewed persons on site in Wood Dale. ................................................................. 15
Table 5: Tests and methods to enhance the quality of the study and in what stage in the process to use
them (Yin, 2009). ......................................................................................................................................... 22
Table 6: Explanation of the seven wastes (Hines & Rich, 1997) ................................................................. 26
Table 7: Example of the first step when building a product family matrix. (Olhager, 2013) ...................... 36
Table 8: Example on how to group products together into product families. Based on the data from table
7. (Olhager, 2013) ....................................................................................................................................... 36
Table 9: Example of categories in a PFEP. (Harris, 2004) ............................................................................ 40
Table 10: A table over the volumes and accumulated percentages connected to each product type. ..... 45
Table 11: Explanations of abbreviations used to describe workstations in the SU. ................................... 54
Table 12: The quantified benefits and costs, generated by the recommended short term actions in the
CU. ............................................................................................................................................................... 69
Table 13: The quantified benefits and costs, generated by the recommended short term actions. ......... 76
Table 14: The projected costs, benefits and payback time linked to the long term future state proposal.
.................................................................................................................................................................... 81
Table 15: The current lead time to manufacture the four investigated products compared to the lead
times in the future state. ............................................................................................................................ 81
Table 16: An example of some parts in the Plan for Every Part. ................................................................ 85
Table 17: Estimations on how much lead time reductions are worth for each investigated product. .... 101
Table 18: The projected costs, benefits and payback time linked to the long term future state proposal.
.................................................................................................................................................................. 101

x
List of abbreviations
TPS – Toyota Production System
VSM – Value Stream Map
WIP – Work-in-progress
CU – Component unit
SU – Supply unit
JIT – Just In Time
TQM – Total quality management
PFEP – Plan For Every Part
SM – Supermarket
TM – Team Manager
UM – Unit Manager
L1 – Pre-assembly large vessels
L2 – Circumferential welding large vessels
L3 – Primary welding large vessels
L4 – Cleaning and tube insertion large vessels
502 – Small parts welding
A1 – Pre-assembly product 1
A3 – Primary welding product 1
B1 – Pre-assembly product 2
B3 – Primary welding product 2

1
1. Introduction
1.1. Background The competition in the manufacturing industry is growing and concerned companies have been
pressured to take measures and change their manufacturing processes in order to stay competitive on a
global market. Such initiatives have, in many cases, been aimed towards implementing lean
manufacturing. (Vinodh et al., 2013; de-Arbulo-Lopez et al., 2013)
The concept of lean manufacturing has been around ever since first mentioned by Womack, Jones and
Roos in their bestseller The Machine that Changed the World from the year 1990. One of the reasons,
and also the foundation of the book, behind developing the term lean manufacturing were to describe
the methods in the production system invented by the Toyota Motor Company (Stone, 2012). The
definition of lean manufacturing and how it coincides with the Toyota Production System (TPS) are not
always consistent when studying present research and it has changed over time (Bhamu & Sangwan,
2014). According to Liker (2004) Toyota invented lean production while de-Arbulo-Lopez et al. (2013)
define lean manufacturing as an extension of TPS. Bhamu & Sangwan (2014) writes in their paper from
2014 that there are numerous of different definitions to lean manufacturing, leading to confusion of
what is covered by the concept.
In this report lean manufacturing is considered to be an Americanized version of TPS, i.e. the methods
invented by Toyota converted into the industries of the Western world, where one of its main messages
is considered to be the reduction of waste along the manufacturing chain (Singh & Sharma, 2009). This
so called waste could come in many shapes but are basically all activities that do not add any value to
the products from the customer’s point of view (Hines & Rich, 1997). The activities the customer does
not pay for shall the company carry out to as low degree as possible.
Benefits with lean manufacturing are, besides the reduction of waste, also the increased quality of the
products, increased effectiveness of equipment and shorter lead times. Furthermore, it facilitates better
communication between work centers and improves the morale of the workers (Bhamu & Sangwan,
2014).
In Sweden the global metal processing company Alfa Laval has been influenced by TPS and strives
towards implementing lean manufacturing to all of their divisions around the world (Berglund, 2015).
The company has grown through both acquisitions of other companies and organically (Berglund, 2015).
Today the company has customers worldwide in almost 100 countries with 42 production units in four
continents. (Alfa Laval, 2015)
An example of such an acquisition can be found in Wood Dale, Illinois. In this area Alfa Laval has
acquired a company previously known as Standard Refrigeration. This company has not been operating
according to the philosophy of TPS in the past. The acquisition of the previously family-owned company
took place in 2008 but the integration to the operations of Alfa Laval started in 2011 (Berglund, 2015).

2
The factory in Wood Dale is currently producing tube heat exchangers and has around 90 employees,
including 70 blue collars, working at the site.
To be able to put the concepts of lean manufacturing in a practical context and to assist Alfa Laval with
the integration of the Wood Dale factory into their organization a case study has been conducted on the
factory in Wood Dale. By performing a case study in a manufacturing environment the possible
consequences when not using lean manufacturing will be identified and addressed. An example of a
common consequence, that is also covering other problems in the plant, is large inventories. Problems
hidden by high inventory levels could then come in the shape of long lead times, delivery delays,
defective products, etc. (Lee-Mortimer, 2006).
1.2. Problem Definition Alfa Laval is not satisfied with the performance of their site in Wood Dale, which currently experiences
some of the consequences exemplified in the previous chapter as long lead times and high inventories.
The costs for the operations as well as the overall lead times are too high. Both Alfa Laval and the
customers are considering the lead times to be several weeks too high and they need to be reduced. To
specify; during the previous year the lead time reached average levels of up to seven working weeks.
The goal is to lower it by 25 % (Berglund, 2015).
The current layout in the factory is not assisting in creating smooth transportation flows, therefore the
layout can be seen as a limitation for an efficient material flow. At the moment the factory has a basic
layout divided among three major units: Component manufacturing, central inventory and assembling.
The link between these units is not as clear as it should be. Also, the communication between them can
be developed substantially. As a result of this, the material is currently being transported long distances
within the factory and maybe not always with the most suitable material carrier. Furthermore, the
manufacturing is struggling with high amounts of work-in-progress (WIP) in between workstations.
Methods of how to signal for more material are either not fully developed or not in place at all.
To address these issues Alfa Laval has chosen an approach influenced by the concept of lean
manufacturing. The aim is to transform the manufacturing in the factory and to make it leaner. To
enable this transformation, they have launched a large project called the Wood Dale Impact Program.
This program addresses all areas of the site and has operations as one of its main pillars. The case study,
which is the foundation of this report, is part of the operations pillar and is supposed to eventually
contribute to the end results connected to this area.
To conclude; the Alfa Laval factory in Wood Dale is in great need of developing and improving its
operations. Clarification and development is needed in many areas; for example layout, material flow,
inventory levels as well as choice of material carriers between workstations.
1.3. Purpose and objectives The purpose is to develop a plan, layout and material flow, with a lean focus for manufacturing on a plant level, suitable for the products, processes and customer needs connected to the Wood Dale facilities.

3
The objectives for this master thesis are the following:
Perform a detailed analysis of the operations at the factory.
Make a high level analysis of PFEP (Plan For Every Part) for every work center.
Configure different material flows through the factory to meet the demand from internal and external customer.
To come up with a recommendation of a preferred future scenario for the Wood Dale factory.
1.3.1. Research questions
Besides achieving the predetermined objectives and fulfilling the project purpose for the Wood Dale factory, the possibility to set up a general method or framework will be investigated. This framework will then make a contribution to Alfa Laval’s organization in terms of how to build up a recently acquired factory regarding manufacturing. If successful; the framework might be useful for the organization when facing similar situations.
Since this is merely a single case study the contribution to research will be related to the depth of the work rather than the generalizability (Olhager, 2015). It will develop knowledge of a situation where a company’s operations are analyzed and provide suggestions of how to implement lean manufacturing concepts in a, for the company, relatively new factory.
This gives the following research questions:
How should lean methods be applied on the operations of a company, who have not been
previously exposed to a structured way of working with lean manufacturing?
What are the key variables to consider when aligning the operations, of a recently acquired
company, with lean manufacturing?
1.4. Delimitation The scope is limited to a factory level, see figure 1. Layout and material flow inside the factory will be
studied. That is, flow from suppliers and to customers along the value chain is not included. The material
flow is studied at a helicopter perspective, e.g. the scope does not cover the design of individual cells
and such.
Figure 1: The scope of the project.
The high level Plan For Every Part has been limited to some extent. It should consist of how to signal for
material, material carrier and basic description of the work cells the part is going through. The
description should also explain the sequence of workstations a particular part has when being
manufactured.
Supplier Factory Customer

4
1.5. Target Group The target group of this Master thesis is employees at Alfa Laval’s site in Wood Dale, Lund and other
offices. A second target group is supervisors and employees at the institution of Engineering Logistics at
the Faculty of Engineering at Lund University. Furthermore students, researchers and any other persons
with an interest in supply chain management and logistics, especially with a focus on lean
manufacturing, might find this Master thesis interesting.
1.6. Report Outline This chapter summarizes all of the different chapters in the report and briefly explains the content in
them, see table 1.
Table 1: Compilation of the different sections in the report with a short descriptive explanation.
Introduction In the Introduction chapter a brief background of the company Alfa Laval is given along with purpose and objectives, problem definition, delimitation and target group. This is described in the beginning of the Master thesis in order to make the reader more convenient with the following reading.
Methodology The methodology chapter states how the methodological and practical choices throughout the master thesis have been decided. The chapter first describes research approach. Thereafter, research strategy and data collection methods. Next a more detailed explanation of how the study has been conducted is presented. Lastly the quality of this study is discussed in terms of validity and credibility.
Theoretical framework This chapter will provide the reader with concepts and models relevant to this study. In the beginning of the chapter a frame of reference of the different models is included to give the reader an overview of the used philosophies and concepts.
Empirical Data/Identifying the current state This chapter focuses on identifying the current state of the factory, e.g. the work procedures in the factory today and the design of the current layout. The empirical data that have been gathered during the project is presented.
Analysis of current state and improvement proposals The current state is analyzed and possible improvement areas, in the investigated areas in the plant, will be highlighted in this chapter. This is followed by improvement proposals connected to each area. The proposals will be divided into short term and long term suggestions.
Conclusions In this chapter conclusions, regarding the result of the case study in relationship with the stated purpose and objectives of the Master thesis, are presented. Other findings during the study, which have not been addressed in the proposals, will also be presented as suggestions to future projects. Also answers to research questions and suggestions on further research are provided in this chapter.
References This chapter provides a list of the literature that has been the foundation for this Master thesis.
Appendix Supplementary information that goes more into detail in certain areas, e.g. interview guide and cost calculations.

5
2. Methodology The structure of the chapters can be compared to a funnel with the overall research approach as the
first step. This is followed by sections explaining the research strategy, data collection methods, the
design of the research and finally a discussion about the credibility of the study, see figure 2 for an
illustration of the structure. Even though the funnel method is usually recommended when structuring
the introduction chapter, it has been considered to fit well into the structure of this study’s
methodology as well. (Olhager, 2015)
2.1. Research approach When describing different research approaches within logistics, Golicic et al. (2005) discusses the
theories regarding inductive and deductive approach. Inductive approach is also usually referred to as
qualitative approach while deductive approach is usually referred to as quantitative approach (Golicic, et
al., 2005). Also Olhager (2013) mentions and visualizes this division of different approaches, see figure 3.
Approach
Credibility/validity
Strategy
Data collection methods
Design
Figure 2: The structure of the methodology in the shape of a funnel.

6
Figure 3: The two different research methods with corresponding elements. (Olhager, 2015)
The inductive approach often gives the researcher a deeper understanding of a not-previously known
issue. The basic steps involved in an inductive research would be to first gather all qualitative data
specifically linked to the issue set out to investigate. Next, based on this data, describe the issue and
lastly to explain the matter. The result from such a research will be a thorough theory of the issue that
describes it in a deep manner. In other words, inductive research approach can be described as process
that starts with a specific phenomenon and then develops a theory or framework to explain it with.
(Golicic, et al., 2005)
Deductive research approach will then, in an opposite way to inductive approach, start off with the
study of relevant literature and secondly form a theory based on that literature review. Next the
researcher should apply that theory on the field and see how well it acts in accordance with reality. This
is also the most common research approach within the field of logistics. (Golicic, et al., 2005)
Even if these approaches most frequently are carried out independently they could also be combined.
By not following the typical steps and instead going back and forth between the two approaches, a third
approach is formed. This approach is described by Golicic et al. (2005) as the balanced research
approach.
Three similar approaches are mentioned by Spens & Kovacs (2006). Inductive and deductive are also
mentioned but instead of the balanced research approach they refer to the abductive research
approach. The steps in an abductive approach can in a basic manner be explained as a method to help
7
the researcher gain knowledge on theories in a deductive way, which an inductive approach then could
be used to verify. (Spens & Kovacs, 2006)
In the beginning of this study there was a phenomenon that needed to be investigated, which was the
material flow in at Alfa Laval’s plant in Wood Dale. This corresponds to the initial step in an inductive
approach. However, the actual approach when working with this phenomenon has been to first perform
a broad literature review. From this review a frame of reference based on relevant literature has been
set up. Consequently, this frame of reference has been tested in a real-life environment, resulting in the
development of new knowledge. In other words, the research approach of this study complies with the
approach of a deductive one. (Spens & Kovacs, 2006)
A subject that already have been thoroughly described works well with deductive approach since it gives
the researcher lots of literature to use in the literature review, which facilitates the search for relevant
variables and gaps between theory and practice. If the study is supposed to investigate a well-
researched subject in a broad way, the deductive approach is the most suitable approach (Golicic, et al.,
2005). This emphasizes the deductive nature of this study even more since lean manufacturing is such a
subject. Also, this study is considered to have a relatively broad perspective on lean manufacturing, even
though it is a single case study.
2.2. Research strategy Two different research strategies are described by Meredith (1998), who compares the approaches of
case studies and rationalist studies. Case studies are characterized as a research strategy that uses
several different methods to collect data with the purpose of studying current real life situations and
doing so without affecting the result of the study. Rationalist studies on the other hand are studies with
pre-determined variables and relationships detached from the theories explaining them, allowing them
to be altered by the researcher without disagreeing with the theories. Rationalist studies include
surveys, experiments and modeling by equations. (Meredith, 1998)
When comparing this study to the different methods mentioned in this chapter, it is obvious that this is
not a rationalist study due to the absence of pre-defined variables and relationships (Meredith, 1998).
Neither is the strategy of this study involving well-structured algorithms or explaining how something
should be; it is rather trying to describe how something appears right now by using a mix of both
qualitative and quantitative data. In other words, the study is not a rationalist study.
As mentioned recently, the research questions in this thesis are mainly focused on “how something is”.
This kind of research question suits the method of case studies (Voss, et al., 2002). It is, according to
Voss et al. (2002) and Stuart et al. (2002), important to state the research questions and align the
strategy accordingly. Both of the sources exemplify what kind of research strategies that are the best
choices in situations of different questions. Table 2 visualizes how Stuart et. Al (2002) links different
questions with different methods.

8
Table 2: Different purposes and questions and which method to use in which case. (Stuart, et al., 2002)
Purpose Question Method
Exploration What is going on? Is research justified?
In-depth case study Longitudinal field study
Theory testing What are the key variables? What is the pattern between these variables? Why does this relationship exist?
Few focused case studies Several on-site case studies In-depth field studies Best in class case studies
Theory building Will the theories withstand being tested by empirical data?
Test/experiment Multiple case studies Sampling in large scale
Theory extension/refinement How generalizable is the theory? Where does the theory apply?
Experiment Case studies Sampling in large scale
Common mistakes made by researchers are misjudgments of the knowledge and research already
existing within the concerned field. In other words; they do not know what kinds of questions they are
investigating. For example, there may already exist a fundamental model describing the same
phenomena as the researchers are investigating, they try to use explorative research question while the
study really is asking questions better suited as theory extensions or refinements. Conducting such a
mistake could result in rejection of the paper. With this is mind, it is recognized that the questions asked
in this report are aiming towards investigating already present models and concepts within the field of
operations. They can therefore be claimed to facilitate theory extension/refinement. (Stuart, et al.,
2002)
To clarify even more what the most suitable method is, Yin (2009) can be studied. Yin puts a lot of
emphasize on the importance of matching the research questions with the research strategy, similar to
what have already been dicussed. However, sometimes it may not be as simple as just choosing the
strategy based on the design of the research questions. Situations could occur where several methods
matches the questions. In these cases other factors can help to decide the proper strategy, i.e. factors
like the possibility to control the variables in the study and at which point of time the study is focusing
on.
In connection to this, Yin (2009) describes five methods used when conducting research. These are
experiment, survey, archival analysis, history and case studies. In addition, Yin emphasizes three major
questions that need to be answered and taken into account when deciding which method to use; what
is the design of the research questions? Are there any possibilities to manage behavioral elements? Is
the focus of the study on present events? See table 3.

9
Table 3: Different methods matched with conditions of when to use them. (Yin, 2009)
It has been established that this study has questions in the shape of “how”. This means that either
experiement, history or case study is applicable. It is also clear that the study do not have any or very
little control over the interactive elements it is studying, which allows us to rule out experiments as an
appropriate method. Additionally, the study is definitely focusing on the events taking place today with
real life observations and interactive sessions with persons relevant to the study. The method of history
is only considering events in the past, without any possibilities to gather data based on direct
observations, and is therefore not a proper choice of research strategy. The best choice of method is a
case study. Conditions such as research questions structured as “how” and no or little manipulation of
variables that are present today, all matches well with the settings of this study and are at the same
time typical for a case study. (Yin, 2009)
Based on the specification of this study, the strategy and method is decided to be an in-depth case
study. Different definitions from independent sources have been evaluated. It has in every case been
apparent that the method of case study is the best suited strategy to this research.
2.2.1. Design of Case study
When the strategy of a study has been set and it has been decided that a case study is the method, the
next step is to design the actual case study. In such step it is central to determine the unit of analysis in
the study and the number of cases that are being studied. Yin (2009) has illustrated the fundamental
alternatives of design to a case study, see figure 4.
Method Research Question Control over behavioral elements
Focus on present events
Experiment how, why Yes Yes
Survey who, what, where, how many, how much
No Yes
Archival analysis who, what, where, how many, how much
No Yes/No
History how, why No No
Case Study how, why No Yes

10
Figure 4: Possible designs of a case study. (Yin, 2009)
The unit of analysis is connected to the research questions and should clarify the phenomenon being
studied. Dependent on what kind of unit analysis the study has, the data gathering and research design
will be performed accordingly. Furthermore, it is also possible to have the overall unit of analysis
branched down into sub-units of analysis. These sub-units could then investigate smaller units within
the main one. If a study is designed with this type of several units of analysis, the study has an
embedded case study design. Although an embedded case study might be detailed with many layers of
analysis the risk of focusing too much on a sub-unit must be taken into account. Otherwise the main unit
of analysis, and originally the target to examine, will be lost and the overall objective may be affected.
(Yin, 2009)
In comparison when strictly having only one unit of analysis in the case study, the concept of a holistic
design is appropriate. This means that the chosen unit of analysis is described in a general way, without
any further analysis of the overall unit’s components. The benefit of choosing a holistic approach is that
it enables the researcher to get a full picture of the studied events, but at the same time it may also be
experienced as vague with uncertain data. Moreover, if a change in the research objectives develops,
the design of the study must be redone. A holistic design is less reactive to symptoms indicating such
changes in objectives, compared to an embedded design with sub-units. (Yin, 2009)
Independent of an embedded or holistic case study design is chosen, another choice must also be taken.
This is whether to undertake a single-case study or a multiple-case study. The two alternatives are
basically explained by their names, either a single case is studied or several.
Single case Multiple cases
Holistic design
Context
Embedded design
Context
CaseContext Context
Context Context
Case Case
Case Case
Case
Unit of analysis 1
Unit of analysis 2
Context Context
Context Context
CaseUnit of analysis 1
Unit of analysis 2
CaseUnit of analysis 1
Unit of analysis 2
CaseUnit of analysis 1
Unit of analysis 2
CaseUnit of analysis 1
Unit of analysis 2

11
A single-case study is recommended by Yin (2009) under some circumstances. This is when the case is
investigating an extreme situation, a most common situation or when testing existing theories and
concepts. In addition, it is also suitable to use single case when performing a study that lasts over
multiple occasions in time or when the study has the potential to reveal new information.
Multiple case studies on the other hand are in general considered to be more robust and should be
preferred when time and resources are available. A specific example of a multiple-case study design is
when two or more cases are investigated, which are predicted to have similar or identical outcomes
when studied, which then allows the researcher to generalize the results. To obtain this, the different
cases must be chosen wisely. (Yin, 2009)
Additionally Voss et al. (2012) also bring up, besides single- and multiple-case studies, the alternatives of
retrospective cases and longitudinal cases. This is a slightly different division compared to Yin (2009)
who includes longitudinal studies in his explanation of single-case studies. Longitudinal case studies are
basically case studies carried out over a long period of time while a retrospective case study is based on
historical or archival data.
Due to the fact that the case study in this report is focusing on present events, a retrospective case
study is ruled out as a design option. Furthermore, the study is decided to be a consistent investigation
during the entire time at the case company, so that the processes at the company can be studied as long
time as possible without interruptions and risk of losing data. Therefore, a longitudinal case study is
ruled out as well. Even though multiple case studies are in general recommended by Yin (2009), they are
also considered to require more resources and every individual case will often only be studied at the
surface (Voss, et al., 2002). Therefore, a multiple case study is not chosen to this case study. Since the
research questions are directed towards testing existing theories and concepts with an in-depth focus a
single-case study is chosen.
Next it must be decided if the case study is going to be designed as a holistic or embedded case study.
Based on the research questions in this study, which is linked to a factory’s operations, the unit of
analysis is the material flow. More in detail described as the material flow of a manufacturing factory.
This is the only unit of analysis in the study. Since there are not any sub-units of analysis in the study it is
clear that the chosen research design involves a holistic case design.
To summarize; the case design for this study is a single-case study with a holistic design.
2.3. Data collection methods In the field of operations management several different methods to collect data exists. A common
method has been to collect secondary data. In those cases a valuable source of data has been public
data such as accounting data, annual reports or similar. Another way of collecting data is to focus on
primary data. Frequently used methods to gather primary data are direct observations and experiments.
(Fischer, 2007)

12
Among the most usual methods to gather data for a case study, structured interviews are often
mentioned (Stuart, et al., 2002; Voss, et al. 2002). Additionally secondary data, in terms of files from a
company’s database and other documents, as well as real life observations by the investigator can be
considered as common data collection methods (Stuart, et al., 2002). Voss et al. (2002) claim that other
ways of gathering data could be; to be present at meetings, surveys and even casual conversations with
employees. As a matter of fact, Fischer (2007) argues that the opportunity to receive good data during
an informal lunch with a company manager should not be underestimated.
Since the interview is one of the most central sources of data to a case study it is important to conduct it
in an efficient manner. To be able to do this it is important to quickly build the trust of the interviewee
and at the same time to not affect the answers (Stuart, et al., 2002).
In addition to this Yin (2009) lists a set of skills that are vital in order to collect data successfully:
Ask good questions and interpret the answers accordingly.
Be a good listener and do not let personal opinions interfere.
Make sure you are studying the right event.
Be flexible and see unexpected situations as opportunities.
Exclude all sorts of preconceived ideas, no bias can occur.
These skills are mainly connected to the preparation work before the actual data collection but can also
be developed during the phase, as long as the investigator is aware of its own capabilities and which
skills that needs to be developed.
In this case study three main methods have been used to collect data; observations, interviews and
secondary data gathered from available company databases. By using all of these three methods, as
much as the availability of secondary data allowed, on the same phenomena the validity of the report
was enhanced. This technique of gathering the same type of data but with several different methods is
called triangulation (Voss, et al., 2002). Furthermore, the set of skills described by Yin (2009) have been
important all along the process of data collection; it facilitated a high quality on the data as well as
ensuring that no data was left behind once the study was finished (Yin, 2009). Specifically has interviews
been a large source of data and many different interviews have been conducted. To use the limited time
efficiently the strategies from Stuart et al. (2002) have been guiding the structure of the interviews.
Example of interview questions, see Appendix I.
2.4. Description of case study This chapter will provide a more detailed description on how the project have been performed; i.e. how
the data have been collected, what kind of choices that have been made and why they have been made.
All together the study followed a process of seven different steps; literature review, start-up, data
gathering, analyzing the data, solution design, practical testing of ideas and conclusions. See figure 5.

13
Figure 5: The design of the case study.
Another process is illustrated by Stuart et al. (2002) and yet another one by Vinodh et al (2013). These
processes consist of both similarities and differences compared to the process displayed in figure 5 but if
they are combined a process like the one in figure 5 can emerge.
Although the process from Stuart et al. (2002) only describes a process of five steps the first four steps,
with some reservations, are considered to be comparable to the process used for this research. The
steps of solution design and implementation in small scale might be merged into the analyzing phase
but as an attempt to highlight the importance of these phases, they were kept separated from each
other. To supplement this, Vinodh et al. (2013) refer to a process with an identical initial stage as well as
a practical validation in the end, which coincides with the methodology in this study.
Due to the nature of this case study, and case studies in general, it should be mentioned that the
process of this study is iterative throughout the study, which also is supported by existing theory within
operations management (Voss, et al., 2002). Also Yin (2009) is recommending an iterative process when
presenting a general model of how to conduct case study research. The process can be argued to
describe the process on a higher level and every step contains several key activities. However, by
identifying certain activities in the different steps the model can be claimed to resemble the process
described by Stuart et al. (2002). Thus, the similarities between the process used in this study and the
one presented in Stuart et al. (2002) is considered to be the same as the model presented in Yin (2009).
2.4.1. Literature review
The literature review was the first step of the case study and can be seen as the foundation to it.
Relevant theoretical topics and concepts that have been used when collecting literature were Lean
manufacturing and Toyota Production System. The databases and search engines of Emerald Insight,
Elsevier and LUBsearch were used in the search for relevant material. They were chosen due to their
eligibly large records of literature within operations and supply chain management. It is common to use
more than one database in order to satisfy the need of the research (Menachof, et al., 2009). To receive
as broad and diverse information as possible, articles have been retrieved from many different journals.
At first top ranked journals such as Journal of Business logistics and International Physical Distribution &
Logistics were used when searching for relevant articles (Menachof, et al., 2009). Although a few
suitable articles were retrieved from these journals the intention was not to exclusively focus on them.
Therefore, the search was not limited to certain journals; instead key words, related to the specific case
in this study, were used. These key words were strongly connected to the concepts mentioned earlier
Literature review
Start-up on site
Data gathering
Analyzing the data
Solution design
Testing of ideas
Conclusions

14
and were lean production, value stream map, Pareto-analysis, production process, line balancing, facility
layout and manufacturing transformation. The different articles received in the search have then been
evaluated based on certain principles: Level of analysis, purpose of the paper and primary actor of
analysis. This is in order to ensure the relevance of the selected articles. The decision to use these
particular principles has been influenced by Halldórsson & Arlbjørn (2005) who uses the similar type of
principles in their review of supply chain management articles.
Basically, as primary actor the search focused on a manufacturer and it was a high-level analysis
concentrating on the factory. The purposes of the papers in the review were not restricted to one
obvious type. Instead articles set out to explain, to describe and to explore a phenomenon were all
included in the review. (Halldórsson & Arlbjørn, 2005)
In addition to the articles from the databases a few books have had a significant contribution to the
study as well. The book Case Study Research: Design and Methods by Robert K. Yin have been important
to set the direction and structure of this study. This book has been recommended by researchers at
Lund University. Other important books have been Operations Management Research by Professor Jan
Olhager at Lund University and Value Stream Design – They Way Towards a Lean Factory by Dr. Klaus
Erlach. They have both been helpful when choosing which methods to apply on the case. The reliability
of these books have been confirmed in the following ways; the first book was received and
recommended from researcher at Lund University and the second one have been approved in the
project specification as key literature by examiner at Lund University.
Furthermore, the book The Toyota Way: 14 Management Principles from the World’s Greatest
Manufacturer by Jeffrey K. Liker have been used to a high degree. The author of this book was in 2012
introduced into the Association of Manufacturing Excellence Hall of Fame. The book also won the 2005
Institute of Industrial Engineers Book of the Year Award and 2007 Sloan Industry Studies Book of the
Year (Anon., 2015). Therefore, this is considered to be a reliable source as well.
2.4.2. Start-up on site – shop floor practice
The start-up phase began immediately after arrival to the factory. The first few weeks on the site in
Wood Dale was spent in the production, trying to get to know the factory as much as possible in order
to truly understand the situation. In the Toyota Production System this is known as Gemba or Genchi
Genbutsu (Liker, 2004). Before conducting Genchi Genbutsu, a schedule was determined where one day
should be spent in each one of the different departments in the factory with corresponding team
manager. The overall idea when designing the schedule was to start the first day in the shipping area,
continue the next day to finishing area and so on. In other words, the material flow was followed from
the end until the beginning. It can be described as a reversed walk through the factory and was done to
keep the customer’s point of view in mind as well as increase the understanding of how the products,
with all of its different components, were manufactured (Erlach, 2013).
To gain knowledge of how the products moved within the factory, and at the same time visualize the
waste as unnecessary transportation described by Hines & Rich (1997), a spaghetti chart was
constructed (Olhager, 2013). Thereafter team managers from all of the different departments, with over

15
thirty years of experience per person, verified that the chart was giving a correct picture of the current
state in the factory. To enhance the investigation of how much waste that comes from transportation in
the factory, AutoCAD was used in order to calculate distances of the different material flows.
2.4.3. Data gathering
The next phase of the study was to start gathering as much of the necessary data as possible, i.e. in
addition to what was already discovered during the start-up phase. Since interviews are an essential
method of gathering data in a case study, several interviews were therefore conducted (Stuart, et al.,
2002). See table 4 for list of interviewed persons. The interviews were based on similar types of
questions, see Appendix I. Inspired by Erlach (2013); key questions to the interviewee have involved
what are your responsibilities? How do you know what to do and when do to it? Where is the required
material coming from as well as going to when finished? By asking these types of questions a relatively
inclusive representation of the current state was provided. Data about the work processes and different
work cycles were received. Additionally, a picture of the information flow to as well as from
workstations became evident. It was also possible to puzzle the answers together and get an overall
view of the whole material flow within the factory.
Besides this, the interviews have been both formal in terms of actual meetings in an office environment
and informal, e.g. with operators in the production. A lot of emphasize have been put on talking to the
persons on the shop-floor, to make sure that the information would be as close to reality as possible
(Erlach, 2013).
Table 4: List of the interviewed persons on site in Wood Dale.
List of interviewed persons
1. Team manager, shipping and receiving
2. Team manager, finishing department
3. Team manager, supply unit (SU), a.k.a. assembling and welding
4. Team manager, component unit (CU)
5. Unit manager CU
6. Unit manager SU
7. Product portfolio manager
8. Plant controller
9. Logistic & purchasing manager
10. Production support manager, a.k.a. maintenance manager
11. Project manager, Operations Development
12. Machine operators in CU
13. Assembling operators and welders in SU
14. Operators in shipping and finishing department
In many cases relevant secondary data from the company’s database have been retrieved in connection
to these interviews. Persons with the right knowledge, i.e. knowledge that helps to achieve the
objectives of this report, have been able to provide us with much relevant secondary data. In some
cases, the secondary data have also been retrieved without help. Nevertheless; examples of valuable

16
secondary data include sold and manufactured volumes per item, costs to manufacture different
products or components and defects in terms of leak rates.
With the help of this information a Pareto-analysis was made where a few products were selected, on
the basis of sold quantities per year, and decided to be representative for the product range as a whole.
Together with information from the product portfolio, in terms of product characteristics and bill of
materials, a high level differentiation of the diverse products currently manufactured in the factory was
made possible. By focusing on a few seemingly more important products, especially in terms of amounts
sold per year, time and resources were saved (Ab Talib, et al., 2015).
Data about leak rates were also collected. This is data that describes how frequently a leak is detected
on a product when it is tested in the plant. The leak rates supported the investigation regarding whether
the sequence in a specific flow was optimal or not. This was an investigation with the hypothesis to
reduce the waste in terms of waiting time in this particular flow significantly.
However, due to several gaps between the existing information and the desired information, primary
data was gathered as well. The gathered primary data mainly consisted of time measurements of
processing time, value adding time and changeover time. Furthermore, the number of operators in the
different workstations were noted and also the WIP as well as distances around the factory. Distances
were needed to calculate cost-savings of reduction in travel when comparing current state with
suggestions for a future state. All of the other primary data were gathered with the purpose of being
used in a value stream map (VSM).
According to Keyte & Locher, 2004, the types of metrics that are used in a VSM can vary from case to
case but processing time and lead time are two metrics that must be in the map in every occasion.
Alongside these two metrics and mentioned earlier; changeover time, value adding time and waiting
time have been added to the VSM to create an extensive view of all of the different components that
the overall lead time consists of. This was then accompanied with information about the number of
operators per workstation. This is information that facilitates identification of unevenness in the
production process, i.e. if a workstation has more or less work compared to the amount of operators in
it (Liker, 2004). Since this information either did not exist in the system or the quality of the data was
too poor, it had to be collected manually.
The WIP was collected in order to calculate waiting time, which is one of the seven wastes described by
Hines & Nich (1997). WIP, along with the time measurements, were also needed to capture the
bottlenecks along the processes (Erlach, 2013). WIP is also classified as inventory, which is another form
of waste that should be addressed in lean manufacturing (Emiliani & Stec, 2004).
The time measurements of cycle times, value adding times and changeover times were also collected to
eventually be used in combination with information about customer demand and available working
time, i.e. the pace certain products are demanded and needed to be produced at. This pace can be
called takt time and the reason why time measurements is used together with this is to create a VSM
over a suggested future state with a more balanced workload along the workstations (Singh & Sharma,
2009).

17
In the end, all of the collected metrics are mapping current state and its non-value adding activities.
These non-value adding activities are basically all waste and if lead time is supposed to be reduced; the
non-value adding activities are the ones that should be investigated. The general idea of lean
manufacturing is to eliminate waste in order to reduce lead times (Vrat, 2014). To do this and to
compare before and after the proposals in terms of lead times; measurements regarding both WIP and
time are beneficial.
Even though lean manufacturing strives to zero defects, the data related to defects along the material
flow have not been collected in the same large extent as for the time measurements (Matawale & Datta,
2015). There are two reasons to this, the quality of the available data on defects was too poor, i.e. it was
problematic to derive specific defects to specific product families in specific workstations, and the work
it would have taken to collect it manually was estimated to be too extensive. However, the defect data
that was retrieved during the case study was instead used more in-depth on one specific flow, which is
mentioned earlier in this chapter when describing the leak rates.
2.4.4. Analyzing the data
It can be argued that an initial step of the analysis already had been made since the yearly demand for
different products had been investigated. This enhances the fact that the process is iterative and it is
specifically common to have the stages of data collection and analysis overlapping each other (Voss, et
al., 2002).
Nevertheless, the next step in the analysis was to divide products into products families based on
mutual processes. Subsequently a value stream map was created and lastly possible improvement areas
were identified. Similar process steps when analyzing data is explained and motivated by Erlach (2013).
An example of a product family matrix is illustrated in Olhager (2013). See chapter 3.2.4. Product family
matrix, in the theoretical framework for more information. Another one can be found in Erlach (2013)
but the structure of them is basically the same. Influenced by these sources and their matrixes, two
product family matrixes were constructed. One matrix was set up for the CU containing the different
components of the products selected from the Pareto-analysis, together with the different machines or
workstations currently present in the CU. A similar matrix was also set up in the SU but instead of
tracking components, whole products were analyzed. See figure 27 and 28, in chapter 4.4. Product
family matrix in the CU and SU, for an illustration of the matrixes.
The product family matrix can according to Olhager (2013) be used favorably when facing a situation
with medium high degree of product standardization and at the same time with medium amount of
volumes demanded; in order to group products or components into flow groups. These flow groups will
then share the same flow. It was decided to use this tool to get information, which would aid the design
of the future state of the factory. Furthermore, the matrix enabled new ideas for the layout in terms of
rearranging machines with the intention to achieve a leaner material flow.
The reason to why a value stream map was selected as an appropriate analyzing tool is due to its ability
to visualize and identify the central aspects in the material flow without any risk of drowning in large

18
amounts of confusing data (Erlach, 2013). In addition, a value stream map also displays waste and the
source of the waste in the value stream (Rother & Shook, 1999).
When it comes to the metrics in a value stream map, Vinodh et al. (2013) uses the same metrics as in
this case study but also adds uptime, which is the ratio of actual production time in relation to available
production time, in every workstation. Another example of metrics in a VSM could include number of
shifts in every station (Singh, et al., 2010) and some may include defects in the current state map (de-
Arbulo-Lopez, et al., 2013).
Erlach (2013) categorize the data in his value stream map in cycle time, quality and EPEI-value. Cycle
time reveals the efficiency in as well as the available capacity in the production process and quality is
strongly connected to defects. EPEI-value could basically be interpreted as changeover time for all the
different variants and is evaluating the flexibility of the production process.
The value stream map in this case study puts a lot of emphasize on time measurements and to further
motivate why these are good metrics; cycle time is claimed to reveal the efficiency as well as the
available capacity in the production process while changeover time is an appropriate metric to evaluate
the flexibility of the process. (Erlach, 2013)
Once the primary data had been collected the waiting time in each individual workstation was
calculated by using Little’s law, i.e. the WIP was divided with the daily demand connected to the station
(Erlach, 2013). The demand per day was retrieved by taking the yearly amount of components sold,
which can be translated into the demand per year and subsequently also to the demand per day, see
equation 1 for an example.
Equation 1
Waiting time in station i =Work−in−progress in station i
Average demand per day =
79
37= 2,1 days
2.4.5. Solution design
The process of developing a solution is illustrated in figure 6. The upcoming text in this chapter is then
describing the steps in process more in-depth.
Figure 6: The process of developing a solution.
Verification meetings
•One with CU
•One with SU
Workshops
•One with CU
•One with SU
Determine short term actions
•Based on results from workshops
Determine long term proposal
•Develop future state map
•Apply line balancing
•Construct a PFEP

19
The solution design started with short meetings to verify the collected data with corresponding analysis.
These meeting were kept short and divided into two meetings with only concerned persons, i.e. persons
with the desired knowledge, attending each meeting. This structure was chosen to not waste time and
resources on people that was not involved by the agenda of the meeting. One large meeting with all
people would not have been efficient for a meeting with the purpose to verify data. Instead one
meeting was held with team managers from the department that manufactured components, the so
called component unit (CU), and one with team managers from the department that assembled and
tested the actual end products, the so called supply unit (SU).
Once these meetings were finished and the input from them had been processed; a similar structure
was set up but now with workshops instead of meetings, one workshop with the CU and one with the
SU. These workshops included more persons than the verification meetings and also with more persons
higher up in the factory’s leader hierarchy, i.e. unit managers for the different departments and also the
factory manager. These leaders were included to make them aware and inspire them to support the
improvement suggestions developed during the workshops. If a leader is supporting and appreciating
the suggested improvements, there is a great likelihood that the followers will do so too, which
increases the chance to implement the suggestions in a real life setting. (Emiliani & Stec, 2004)
The overall most important reason to develop the ideas in workshops is to engage the employees of the
factory as much as possible. Besides the persons participating in the workshops, the majority of the
employees on the shop floor have also provided valuable input when they have been asked how they
would like to arrange their workstation in the future. It is critical to have the employees motivated and
inspired to go through with the proposed changes in order to make them a success. (Bhasin, 2012)
The ideas developed during these workshops would then be the foundation of the proposal for the
future state of the factory. The suggestions were divided into short and long term and were mainly
addressing issues concerning the layout and overall material flow of the factory. The short term
proposals consisted of several actions that were estimated to be possible to implement with relatively
small efforts. By having some of the proposals in the short term, some of the projected benefits are
estimated emerge fairly fast. This strengthens the reliability of the new way of working and at the same
time makes it easier to motivate further changes (Bhasin, 2012).
The long term suggestion was the proposal that was constructed in the future state of the value stream
map. Inspired by Emiliani & Stec (2004) the future state was designed as a vision for the factory to aim
towards. Several improvement activities are needed before everything in the map can be realized but
the scenario is still considered to be reachable. The long term suggestion is also based on the short term
actions and the overall plan bear a resemblance to a two-step process. First the short term actions to set
the conditions for further development, and second to start looking into the implementation of the long
term suggestions.
To enable a good design of the assembly-lines in the factory, elements from the concept of line
balancing, i.e. Heijunka, was applied on them (Liker, 2004). By balancing the assembling lines based on
takt time and measured cycle times, valuable insights on the theoretically optimal settings were gained,

20
e.g. in terms of the necessary amount of operators in every workstation. Since the data collected about
the current state contained the number of operators in each workstation it was possible to identify and
compare the potential improvements linked to the performed line balancing design.
In the future state value stream map concepts to signal for material were included to create a better
understanding of how the information will flow between departments and consequently how the
material flowed. The two overall concepts chosen to signal for material between departments were
production kanban and withdrawal kanban. Both of these two concepts are favorable to use in
combination with a supermarket in place, which can be described as a storage point of components with
the factory processes as the so called customer (Toyota Motor Corporation, u.d.). Additionally, the
concepts are suggested to be used in the case of decoupling two different production processes (Erlach,
2013). The supermarket was already in place in the case study factory and the only action that has to be
taken is to implement the kanban system; i.e. it already existed two processes, the CU and SU, with a
small storage area in between them. This made it suitable to go with the two mentioned kanban
concepts as well as a supermarket.
It is appropriate to use withdrawal kanban between the SU and the supermarket since SU is mainly
consisting of welding and other assembling activities, which produces the units that goes to the external
customer. Production kanban is preferred between the supermarket and the CU due to the fact the CU
is performing manufacturing of components, by the use of heavy machinery, to the SU and can
therefore be seen as a supplier process to the SU. (Erlach, 2013)
All of the information developed and proposed in a future state for the factory was then compiled in a
Plan For Every Part (PFEP). This plan highlights the sequence of workstations every investigated item
was manufactured in, along with ideas on how to signal for material in every workstation and different
material carriers recommended in the corresponding flow. These aspects have been chosen and
developed together with Alfa Laval when determining the scope of the case study, see chapter 1.4.
Delimitations. It is encouraged to tailor the PFEP according to the needs and purposes of each factory,
which most likely will differ from case to case (Harris, 2004). Inspired by Harris (2004) a spreadsheet in
MS Excel was used to present and structure the plan in order to make it easy for everyone to
understand the information.
2.4.6. Testing of ideas
In the beginning of the case study the aim was to test, or maybe even implement in small scale, a few of
our ideas in practice. One round of testing was planned in the CU and one in the SU.
The first test was carried out in the CU and the initial contact for this was taken during the workshop
that was held with the managers from the CU. Together with the unit manager and team managers for
the CU it was decided to test one of the ideas categorized as a short term action item, which basically
consisted of changing the sequence of activities in a certain flow. This was suggested since the data
analysis exposed this specific flow to be inefficient with much transportation and large amounts of
inventory between the workstations.

21
Next the plan was to conduct a second round of testing but now in the SU. After the workshop with the
SU managers a meeting was held with the unit manager for the SU and the team manager for the
welding department in the SU to specify the goal and plan for the intended test. The approach to focus
on testing ideas labelled as short term actions were replicated in this planning process as well.
However, during the work of planning the test it became evident that this had to be revised. Large
projects meant for important customers came up and required lots of attention as well as resources
from the SU. This in combination with a limited time on site made it difficult to go through with the
testing of ideas in the SU.
2.4.7. Conclusions
The conclusions of the case study have been made by studying the result in relation to the theoretical
framework. Conclusions were first drawn regarding the purpose and objectives of the report. Additional
findings, which were not addressed in the proposals of the future state, were then highlighted and
suggested as future topics to study. This was made to aid the people on site in Wood Dale, in their
future work with improvements.
Next, answers to the research questions were presented and discussed. Several aspects were discussed
and recommended. Possible gaps between theory and practice during this case study have also been
one of the focus areas in this chapter. Conclusions regarding the research questions were then followed
by examples of future research. In general, the work in this stage followed the deductive research
approach described in chapter 2.3. Research approach.
2.5. Quality of the study The quality of a study can be evaluated in many ways. In this case study the quality of the study has
been considered to be equal to the credibility of the study. Two features highlighted as important when
studying the credibility of a case study is reliability and validity (Voss, et al., 2002; Yin, 2009) According
to Yin (2009) the quality of the study is determined based on these two aspects where validity can be
broken down to construct validity, internal validity and external validity. Yin refers to these aspects in
terms of tests to measure the quality of the study and lists how a study can achieve a high score in each
of one of them. Table 5 is presenting the different tests and corresponding recommended tactic.

22
Table 5: Tests and methods to enhance the quality of the study and in what stage in the process to use them (Yin, 2009).
Tests Strategy to pass the test Stages when to apply strategies
Construct validity Collect information from more than one source. Use a chain of evidence. Let key informants verify the draft.
Data collection Data collection Composition
Internal validity Match patterns. Build up explanations. Highlight rival explanations. Use logic models.
Data analysis Data analysis Data analysis Data analysis
External validity Single-case studies: build your case on theory. Multiple cases: Use the same research design on multiple cases.
Research design Research design
Reliability Establish a case study database. Develop a case study protocol.
Data collection Data collection
This view of aspects to test the quality of the case study from Yin (2009) is shared by Voss et al. (2002)
and to a large extent also by Stuart et al. (2002) who discusses the concepts of validity and reliability as a
way of respond to invalid criticism. Criticism such as poor rigidity of the case study is according to Stuart
et al. (2002) not unusual and the tests seen in table 4 aids in strengthening the rigor of the study.
2.5.1. Construct validity
Construct validity is describing how well the study is using correct operational measures on
phenomenon being studied, i.e. is the right things measured with the right measurements (Yin, 2009).
Inspired by the corresponding approach suggested in table 5, the construct validity is considered to be
on a high level for this case study. Especially due to the comprehensive collection of data from multiple
sources and the large amount of primary data that has been gathered. The same type of data has been
collected through interviews, databases and personal observations.
During the study a process of continuous verification and validation from experienced personnel,
regarded as key informants in the context of this study, have been utilized in order ensure the work was
progressing in the right direction. This is yet another aspect that enhances the construct validity of the
case study. (Yin, 2009)
2.5.2. Internal validity
Internal validity is not relevant to all case studies. Only those studies that aims to explain something, e.g.
why and how a specific result was caused by a specific factor. The risk of failing this test is then if there is
a third factor that unknowingly affects the result, or if a conclusion is made without having confirmed
the accuracy of it and to not having looked on the collected data in a critical way. If these factors are
addressed from the start of the study with the means described in table 5, the test of internal validity

23
will most likely be passed. Since this case study is more aimed towards refining and investigating already
existing theory, the aspect of internal validity is claimed to be irrelevant. (Yin, 2009)
2.5.3. External validity
This factor tests how well the results from a case study can be generalized. One of the most common
criticisms to a single-case study is that it is not possible to generalize the results from it (Yin, 2009).
Furthermore, Meredith (1998) is claiming the generalizability to be the biggest hurdle to overcome
when ensuring a high quality in the research of a case study. To enhance the generalizability in a single-
case study a suggested approach is to use to same theory that was the reason for the case study in the
first place and subsequently generalize within that area. For example; this case study was selected based
on theories on how to implement concepts of lean manufacturing in a recently acquired factory, which
makes theories on implementing lean manufacturing in newly acquired factories the area to which the
outcome can be generalized. However, to truly be able to generalize the result from a single-case study
a second or a third identical study should be carried out in a different environment. Once this has been
done the study can achieve high external validity. (Yin, 2009)
In comparison, Meredith (1998) adds three other methods on how to increase the generalizability on a
case study. One of them is similar to the suggestion recently described about conducting the same case
study in another surrounding. The other two is to use as many independent variables as possible or to
add other test objects in the original theory.
To increase the external validity this case has focused on the method defined by Yin (2009), i.e.
enhancing the external validity by using proper theory and create conditions to further perform the
same case study in a different setting.
2.5.4. Reliability
The last criteria to take into account when securing the quality of the study is the reliability of it. A case
study has a high reliability if it presents the same results when it is conducted by another researcher. In
other words; the results of a case study should be able to be display the same result every time,
independent of what researcher is performing the study, as long as it has identical conditions. (Yin,
2009)
To make sure that the reliability is acceptable the key element is to have a structured documentation of
the work during the case study. This documentation could, according to Yin (2009), either be achieved
with a structured case study database or by the use of a case study protocol. A case study protocol is a
way to, before the study begins, organize how the data collection will be performed and how the data
subsequently will be managed.
In this case study a database was created. The overall structure has been to divide the information by
the source of information. The data connected to each one of these sources have then been divided in
the persons providing the information, in the cases where it was applicable. Lastly the data was
categorized based on the type of the document, e.g. word document or excel document. This is
exemplified by figure 7.

24
Figure 7: An example of the structure of the case study database, used to organize the collected data.
A case study protocol, as described by Yin (2009), has been adapted and organized to the circumstances
connected to the concerned case study. According to the guidelines stated by Yin (2009) a case study
protocol is recommended to contain an overview of the case study project, field procedures, case study
questions and instructions on how to develop the report. Prior to this case study, a complete case study
protocol in a single document was not prepared. Instead the parts of the protocol were created
separately and then used together. First a goal document describing the actual case was prepared. Next
the case study questions were designed, see Appendix I for questions. The procedures in the field were
not written down and structured before the case study had started; i.e. methods and theory of how to
achieve the objectives of the study was studied and noted, but not in a structured manner. Voss et al.
(2002) mentions that data collection and analysis often overlap and affects each other, which was the
reason behind the decision to keep the field procedures flexible and adapt them according to what
some of the analysis indicated during the study. Finally, instructions on how to develop the report have
been received by researchers at Lund University during the case study and inspiration have also been
collected from old studies within the same field of investigation.
To summarize; the reliability is considered to be high since a database over the collected data has been
established. In addition, a version of a case study protocol has been adapted to this case study, the
difference from the protocol described in Yin (2009) is that the recommended parts have been created
in separate documents, rather than to structure all of them in one document prior to the data collection
phase.

25
3. Theoretical framework This chapter will provide information about the theoretical framework used in this thesis. Different
concepts from well-established theories as well as more recent studies will be described and explored.
The framework is built around the philosophies in Toyota Production System (TPS). Lean manufacturing
is considered to be a western variant of TPS and is therefore included together with TPS in this particular
framework. Furthermore, within lean manufacturing a few analysis tools are especially emphasized. See
figure 8 for complete view over the framework used in this case study.
Figure 8: The theoretical framework with the philosophies, concepts and methods used in this report.
3.1. Toyota Production System (TPS) Toyota Production System is Toyota’s approach to manufacturing. Many of the concepts in lean
manufacturing comes from TPS. TPS has been a major influence on the trends in manufacturing during
the last decades. Toyota’s methodology to implement a lean concept is very different from other
companies. It is possible to allege that a lean enterprise is achieved if TPS is applied to all business areas
in a company. Toyota has defined lean manufacturing as a five step process; defining customer value,
defining the value stream, make the value stream flow, pulling from the customer and striving for
excellence. To become a lean enterprise, the company culture also requires that everyone is striving to
improve continuously. Taiichi Ohno, one of the founders of TPS, has made the following statement: “All
we are doing is looking at the time line from the moment the customer gives us an order to the point
when we collect the cash. And we are reducing that time line by removing the non-value-added wastes”.
(Liker, 2004)
3.1.1. Waste – Muda
Muda is Japanese for waste and are all activities that do not add any value to the finished product.
Toyota was among the first companies that, through TPS, defined the sevens wastes in a manufacturing
Toyota Production System
Lean Manufacturing
•Pareto-analysis
•Product family matrix
•Value Stream Map
•Plan For Every Part (PFEP)
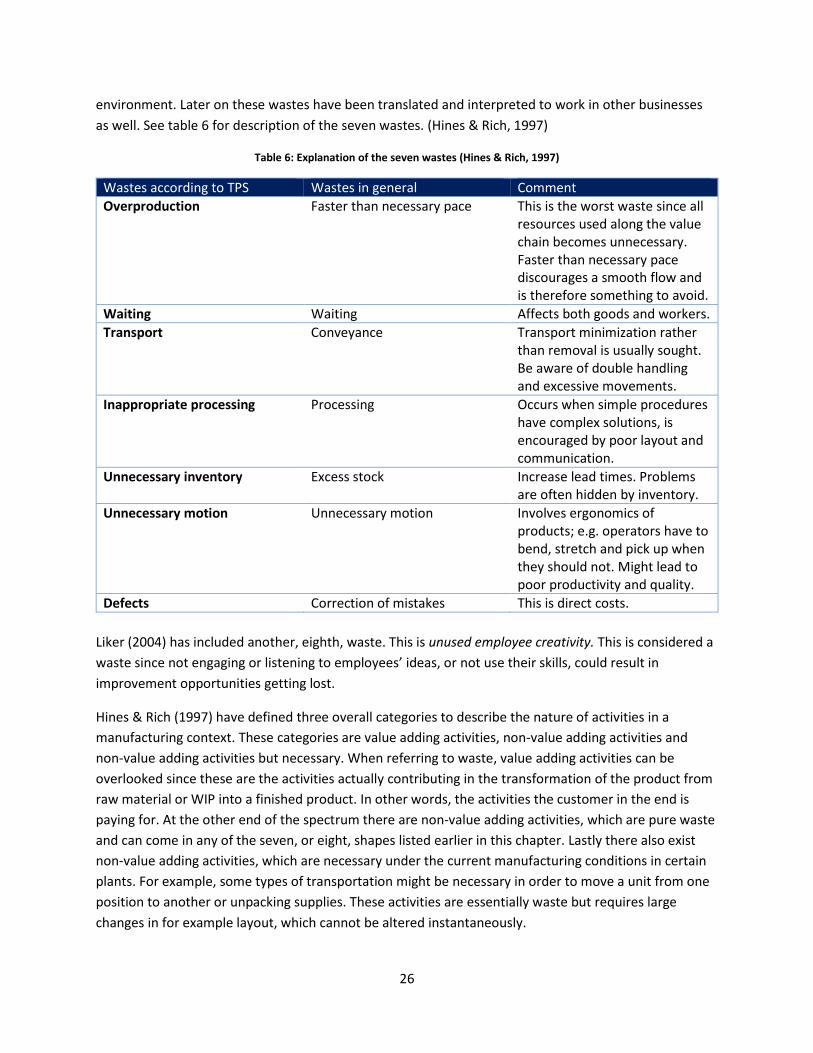
26
environment. Later on these wastes have been translated and interpreted to work in other businesses
as well. See table 6 for description of the seven wastes. (Hines & Rich, 1997)
Table 6: Explanation of the seven wastes (Hines & Rich, 1997)
Wastes according to TPS Wastes in general Comment
Overproduction Faster than necessary pace This is the worst waste since all resources used along the value chain becomes unnecessary. Faster than necessary pace discourages a smooth flow and is therefore something to avoid.
Waiting Waiting Affects both goods and workers.
Transport Conveyance Transport minimization rather than removal is usually sought. Be aware of double handling and excessive movements.
Inappropriate processing Processing Occurs when simple procedures have complex solutions, is encouraged by poor layout and communication.
Unnecessary inventory Excess stock Increase lead times. Problems are often hidden by inventory.
Unnecessary motion Unnecessary motion Involves ergonomics of products; e.g. operators have to bend, stretch and pick up when they should not. Might lead to poor productivity and quality.
Defects Correction of mistakes This is direct costs.
Liker (2004) has included another, eighth, waste. This is unused employee creativity. This is considered a
waste since not engaging or listening to employees’ ideas, or not use their skills, could result in
improvement opportunities getting lost.
Hines & Rich (1997) have defined three overall categories to describe the nature of activities in a
manufacturing context. These categories are value adding activities, non-value adding activities and
non-value adding activities but necessary. When referring to waste, value adding activities can be
overlooked since these are the activities actually contributing in the transformation of the product from
raw material or WIP into a finished product. In other words, the activities the customer in the end is
paying for. At the other end of the spectrum there are non-value adding activities, which are pure waste
and can come in any of the seven, or eight, shapes listed earlier in this chapter. Lastly there also exist
non-value adding activities, which are necessary under the current manufacturing conditions in certain
plants. For example, some types of transportation might be necessary in order to move a unit from one
position to another or unpacking supplies. These activities are essentially waste but requires large
changes in for example layout, which cannot be altered instantaneously.

27
3.1.2. TPS compared to mass production
TPS can be seen as the opposite of mass production. Instead of economies of scale, spokesmen for TPS
advocate a one-piece flow. (Hines & Rich, 1997).
There are many differences between mass production and TPS. For example, the view on machine
downtime. Mass production philosophy states that machine downtime is something that should be
avoided, because then machines cannot produce parts that could generate money. TPS argue that it is
good to have a machine shut down since it can prevent overproduction, and this is one of the most
important wastes to address in according to the TPS philosophy. In TPS a company should strive after
building up small inventory of finished goods and not produce according to a fluctuating demand. If that
is achieved the company is able to level out the production schedule. This leads to small variations in the
production schedule and a smooth manufacturing flow. (Liker, 2004)
The major focus of the philosophies is completely different. Mass production focus on everything that is
not value adding while TPS focus on everything that is value adding. Instead of trying to identify waste,
the overall philosophy of TPS is to identify activities that add value and reduce everything else. (Liker,
2004)
3.1.3. One-piece flow and continuous processes bring problems to the surface
A continuous process with a one-piece flow is the core which many of the lean tools will be
implemented around since it reveals hidden problems in a manufacturing environment. For example,
problems hidden by high inventory levels can be discovered. By “lowering the water level”, in the shape
of inventory levels, issues will appear. If they are not investigated and solved, even more problems will
occur. Major inefficiencies in companies that are not considered as lean, are hidden in their capacity.
These inefficiencies will not be noticed until the water level is lowered and they are brought to the
surface. (Liker, 2004)
In many businesses a large part of the processes is waste. The value added activities are surrounded of
waste. In a manufacturing process with a continuous flow the raw material starts to move when a
customer places an order. The raw material flows forward to the workstation or the factory where it is
needed. Nothing is produced until it is actually needed by the next step of the process. This is the main
idea in theory; an uninterrupted production process with no inventory or waiting time between stations.
(Liker, 2004)
In a mass production setting it is not unusual to group similar workers or machines together in order to
achieve economies of scale and flexibility in scheduling, i.e. no consideration on how the material
actually flows. This can result in large amounts of WIP, unnecessary travelling and overproduction.
(Liker, 2004)
In TPS there exist no departments or sections with only one type of process, instead there are work
cells. These work cells are grouped by product instead of process. A faster flow is the same as a better
flow. This is because a faster flow often has higher quality of the products compared to a slower flow. In
mass production large batches are produced. If an error occurs it might take long time before it is
discovered, and by then a lot of products are already made. In a one-piece flow the time it takes from

28
one station to another is shorter, since only one product has to be produced and not several. Therefore,
it will not take that long time until the potential error is detected, and by that point it is easier to detect
the root cause of the problem. If products are produced in large batches the error might be detected
too late to find out what caused it in the beginning. In this way a faster and continuous flow will be a
flow with a higher quality of its products than a slower flow. (Liker, 2004)
One negative aspect with a one-piece flow compared to mass production is that in mass production, one
workstation can keep producing even if the previous workstation breaks down, thanks to the high
inventory. In a one-piece flow the entire flow stops if one machine is down. The priority in TPS is to not
have any intermediary flows that covers the problems. Without exposing the flaws of the flow it is not
possible to improve it. This is why continuous improvement is strongly linked together with one-piece
flow. (Liker, 2004)
However, Toyota is not applying a one-piece flow if it does not fit but the idea of it is always present
within the organization. The idea of one-piece flow creates something to strive after and presents a
direction processes should follow. Small batches are better than larger ones, even if it is not a single
piece. The smaller the batches are the faster can the production respond to changes in customer
demand. (Liker, 2004)
3.1.4. Takt time
If one workstation is made more efficient than the others, the risk is that this workstation will make the
overall process more slow, instead of increasing the overall speed. The extra efficient workstation will
only add inventory and extra paperwork to the other less efficient stations, resulting in an overall slower
manufacturing process. This is why processes or activities need coordination, in order to work as an
integrated team of players to achieve maximum total speed. To complete a one-piece flow, the takt
time need to be considered. Takt time is the rate of customer demand. By this measurement the speed
of production can be determined and in the extension each process can see if they are working too fast,
too slow or in the right pace. (Liker, 2004)
An example to describe how takt time works: If a company has 1 shift per day for a certain product and
each shift is 8 working hours, which is equal to 480 minutes per day. A month may consist of 20 working
days which gives a total of 9 600 working minutes per months. If the demand from customers for that
specific product is 19 200 units each month, it leads to a takt time of 2 units each minute (19 200 / 9 600
= 2). This means that every 30 second a new product should be finished; this is the heartbeat of the
production and the takt that all processes should relate to. (Liker, 2004)
3.1.5. Just In Time
Just In Time (JIT), is a fundamental principle of the TPS and is based in Toyota’s pull system. If JIT should
be described by one sentence it is that JIT is the way of deliver the right items, in the right amount and
at the right time. To be able to be responsive to customer demand, JIT is an essential part and it is
applicable both internally and externally. Customers can be external but also internal inside the
company, and should be provided with the same services as the external ones. (Liker, 2004)

29
If JIT is fulfilled it is possible to keep a low WIP. A high level of WIP increases the capital accumulation in
the production and handling of material. In JIT production the following workstations gets information
from the previous one with a kanban system, described in the upcoming chapter. To succeed in JIT, good
production conditions are required. (Olhager, 2013)
3.1.6. Kanban
In a one-piece flow, the ideal state should be a process that gets its units in the exact time, quantity and
quality as the process requires it. This is a pure pull system. Instead of pushing products forward along
the flow of a process, let the stage before know when the units are wanted. In that way the flow does
not run the risk of having too many units pushed forward to the next station. Therefore, no inventory is
built up. However, there are some issues with no inventory at all. Ohno recognized that some inventory
is needed to keep a smooth flow. The decision Ohno made was to create small inventory points
between the processes. When the inventory level is low enough it gets replenished and if it never sinks
it never get replenished. In order to signal to the different processes when it was time to refill the
inventory, some sort of signal system was needed. This is how Toyota came up with their kanban
system.
The kanban let the process know exactly what amount that has to be produced and when it should be
produced. It is important to point out that not every process can be used with a pure pull system. Some
processes need a push system with an actual schedule in order to work. Nevertheless, Toyota strives
towards a true one-piece flow and that includes pull system. In the extension this means elimination of
all inventories, if it is possible. It is only when no inventory exists that an enterprise can have a true one-
piece flow. Even if it impossible to achieve, a company that seeks a one-piece flow should always try to
eliminate inventory where it is possible. (Liker, 2004)
When there are no ways to realize a true one-piece flow, a pull system should be implemented instead.
Even if kanban is a good system, keep in mind that all types of inventory are waste, so even kanban. A
company should therefore not be satisfied with its kanban system; it should get rid of it if the company
truly seeks to become a lean enterprise. Despite this, every company is different and has a specific need
and a unique position, therefore some compromises and combinations might be the best in each
specific case. Even Toyota uses some type of push system, to get harmony of their business in the big
picture. (Liker, 2004)
To match different needs in different companies, several kanban systems have been developed. Within
a factory, variants called withdrawal kanban and production kanban are commonly used. In these
kanban systems, a storage point such as the supermarket is preferred. (Erlach, 2013) A supermarket is a
storage point of standard inventory, with the purpose to provide downstream processes with material
when needed (Anon., n.d.). A supermarket does not replenish goods on the shelves until they are almost
empty. (Liker, 2004)
The withdrawal kanban is representing the customer manufacturing process and is used to signal for
material from the supermarket. Production kanban can be seen as an internal supplier in the factory
with the main task to replenish the supermarket with material when needed. In other words; the

30
material is being pushed into the supermarket by the use of production kanban and pulled from it with
withdrawal kanban.
Cards that can be passed on from stations in the customer process to the supermarket can be used in a
kanban system but the important thing is to have some sort indicator that alerts the supermarket to
deliver material in a system of withdrawal kanban. Similarly, can an indicator designed to the production
from the supermarket be put into motion when replenishment is needed in the supermarket, i.e. to
support the production kanban system. To clarify; the kanban signal does not have to be cards. It can for
instance be containers or boxes. It is central to have the kanban designed to the specific parts it is
signaling for. (Erlach, 2013)
3.1.7. Heijunka
Heijunka describes how to level out production and is therefore related to takt time. The best way,
according to a lean perspective, is to produce orders when the customer wants it. However, customers
do not order the exact same number of products from week to week. In many businesses there can
instead be the opposite, the demand changes very much from one week to another. This challenges the
strive towards a balanced production with a one-piece flow without intermediary inventory. (Liker,
2004)
If production is not leveled out, the workers might need to work overtime and the week after they might
have nothing to do and workers and machines are not utilized. The amount of raw material or other
material bought from suppliers are also something that will get the company in trouble since the
fluctuations in demand will lead to very large changes in what will be ordered. (Liker, 2004)
If the total numbers of orders in a time period are studied, it is possible to level out these orders in a
given set of time with the same number of work orders in production each day. Then the workstations
will carry out their work in roughly the same time, which support a smooth flow. Heijunka is very
important but can seem like the opposite of lean thinking, especially when customer demand is very
unsecure. If this is the case the company is forced to keep some inventory of finished goods in order to
have an even level of production. As described many times before, inventory is waste! It is important to
serve the customer and a company can in general not rely on zero inventory to satisfy all customers. By
keeping this small amount of finished goods, the company can maintain a production that is leveled out
and eliminate far more muda in all the previous steps in the production process than the inventory in
the finished goods warehouse adds up to. A successful TPS can therefore be a combination, as long as it
is combined in the right way, between make to order and make to stock. (Liker, 2004)
3.1.8. Make tasks standardized in order to improve continuously
Standardized work first got its major breakthrough with the mass production concept, but it is also an
important part of TPS. Toyota implemented standardized work into all processes, shop floor as well as
engineering. Until work is standardized it is hard to improve it and to make the improvement last. If a
defect appears, it might be because the standard procedure was not followed. If it is followed and errors
still occur, then the standardization of that particular task might need to be investigated and changed.
(Liker, 2004)

31
Toyota recognizes that in order to survive year in and year out and be successful, continuous
improvements needs to be based on standardized work. The trade-off regarding the standardized
process is the degree of procedures that need to be followed to the letter and the degree of flexibility
the workers have to be creative and might come up with improvement suggestions that will lead to an
improved process and in the extension contribute to the continuous improvement of TPS. (Liker, 2004)
3.1.9. Visual control and 5S
If it is not possible to see if an item is in the right place, e.g. because of disorder, it is hard to decide if a
problem exists or not. In order to identify where problem could occur before it becomes a fire-fighting
task, visual control is important and another principle of TPS. (Liker, 2004)
5S is a system that creates a well-ordered work environment by applying five S to it; sort, set in order,
shine, standardize and sustain. Initially the 5S’s were representing the Japanese equivalents but have
later on been translated to English. (Chapman, 2005)
5S alone, is not a key tool to achieve a manufacturing system like TPS. 5S does not lead to better quality
or lower costs; it helps to support a smooth flow according to takt time and, in the extension, to support
continuous improvements by making problems visible. (Liker, 2004)
3.1.10. Genchi genbutsu
This chapter refers to the act of go and see yourself to completely understand the condition. It does not
matter which department that is supposed to be investigated, the best way to get information is to see
or collect it firsthand. A president of a Toyota production plant might know the figures and numbers in a
report, which is important as well, but the processes that are carried out every day might not be
revealed in these kinds of reports. The only way to gain total understanding of the process is to go and
see it. This is called genchi genbutsu. (Liker, 2004)
Genchi genbutsu means the actual place and material/products. Gemba is also a term that is common to
use, and basically refers to the same thing. Gemba literally means the actual place. If the goal is to
totally understand the current situation an associate must spend several years to understand the
situation at the gemba.
There exist some management principles around genchi genbutsu. For example; use verified and proven
information of data when you do your analysis and also take advantage of wisdom and experience of
others to discuss information. It can be seen as a sign of good preparation if someone have been at the
shop floor to see for himself before a meeting compared to someone that have not. (Liker, 2004)
Genchi genbutsu is not only for blue collars and regular workers; it is for leaders as well. According to
TPS, how should a leader or CEO make appropriate decisions if he or she has not spent a lot of time at
the shop floor to deeply understand the processes the decision is about? Even though many leaders and
CEOs want to see as much as possible for themselves, it can be very difficult to find the time to do so.
Therefore, a faster version of genchi genbutsu exists, called hourensou. The basic idea of hourensou is
to delegate. If a leader of several production plants recruits site managers that are trustworthy, the
leader can gather data from these people in second hand. (Liker, 2004)

32
After some time, the goal is to incorporate genchi genbutsu in the company culture. The goal is to make
it the company’s natural way of performing the day to day business. (Liker, 2004)
3.1.11. Nemawashi
This chapter discusses the importance of make decisions slowly, based on consensus and with every
option studied, instead of implementing the changes quickly. This is often referred to as nemawashi. If
the decisions are very well-investigated and accepted by all parties, the chance of a successful
implementation will increase. (Liker, 2004)
If the planning process is long and thorough, more potential problem areas can be identified as well as
resolved before they occur. The intention is to get rid of problems that otherwise will occur in the
implementation phase. The goal is also to minimize the total time from the project is started until the
new process runs without any defects. A shorter planning process might not lead to a shorter overall
project process since it might lead to a more complex implementation. Therefore, it can be seen as an
investment in time to do a rigid planning to save time later in the implementation phase. (Liker, 2004)
3.1.12. The learning organization
Many years back, a company could make good profits just by the revenue from the company’s cash cow,
year in and year out. Today a company needs more than a good shop and manufacturing to survive and
the old way of doing business is no longer sufficient. To survive today, the company needs to learn and
improve continuously. (Liker, 2004)
When a process is stable and standardized, and only then, continuous improvement can occur.
Continuous improvement comes from the Japanese word kaizen. Kaizen exposes the root cause of a
problem by asking “why” five times. This analysis strives to get a deep understanding of how a problem
can happen and then how it can be prevented. A process that is improved, but not standardized, will as
time goes by loose the improvement. Later on all the improved work will be forgotten and the process is
back to where it started from. (Liker, 2004)
To truly become a so called learning organization is not something that happens overnight, it is a very
long and continuous journey. For Toyota it has taken almost 100 years and the company will most likely
need another 100 to carry on the improvement of the organization. (Liker, 2004)
3.1.13. Base your management decisions on a long-term philosophy, even at
the expense of short-term financial goals
The management at Toyota is working with long-term goals, which are supposed to take the company to
the next level. The company’s mission and morale values is prioritized over short-term financial goals.
One example of Toyota’s long-term perspective is their attitude towards their employees. By relocate
staff instead of firing them, Toyota will reduce a new hiring in the future but not get rid of the people
working there today. The employees all seem to have a greater goal than to get a paycheck each month;
they are loyal to the company. It is important to have in mind that TPS is not a bunch of tools; it is a
culture of the whole enterprise, a culture that requires everybody to participate. (Liker, 2004)

33
Another major long-term task for Toyota was to focus on the customer and do the right thing for the
customer. Instead of just do the right thing to develop the company, Toyota also develops the people.
(Liker, 2004)
3.2. Lean manufacturing The topics discussed previously about TPS is highly relevant for lean manufacturing, since lean
manufacturing is considered to be a western adaption of TPS. The main parts of TPS and the overall
philosophy of reducing waste is also the main philosophy in lean manufacturing.
Lean manufacturing was stated for the first time in the late 80’s in an international study regarding the
automotive industry. The basic idea with lean production is to use less of everything compared to mass
production, less human effort, engineering hours, space in factory and so on, which requires less
inventory and defects to succeed. The resources the company possesses need to be used in an efficient
way. It is important to keep in mind that lean production is not the same as minimizing the resources
used; it advocates efficient use of resources. (Olhager, 2013)
Lean is not just connected to machines in the production; all the production resources of the company
are included, for example personnel, capital and energy. Today the lean concept is used in many
different areas regarding improvements and the original meaning of the concept may have lost its
meaning. Lean is the continuing of different improvement programs such as JIT and Total Quality
Management (TQM). There are several improvement measures that support lean. Lean cover
improvements regarding time, quality and cost efficiency. (Olhager, 2013)
3.2.1. Analysis of flows
By analyzing the material flow throughout the production site, potential improvements areas can be
found. The most critical process can be identified and how other process support the most critical one.
In the material flow chart, operations and inventory points are often specified. (Olhager, 2013)
A good tool to visualize the flow by is the so called spaghetti diagram. This tool basically works as
follows; all of the concerned flows are drawn as lines on a layout over the investigated area, which in a
factory often results in a large complex web of different flows crossing each other. This complex web of
flows has the resemblance of lots of spaghetti strings and therefore the name spaghetti diagram.
(Olhager, 2013)
Possible flows to map could be material flow, administrative flow or the flow of people walking at work.
The flows’ distances could then be measured to get an idea of how much transportation is carried out in
the investigated area. (Anon., n.d.)
3.2.2. Pareto-analysis
The Pareto principle describes the case when 80 percent of a total sum or outcome is generated by 20
percent of the connected drivers that are responsible. It can be applied in many different areas, for
example if 20 percent of sold products generate 80 percent of the revenues. Vilfredo Pareto was the
man who introduced the principle; hence the name the Pareto principle. The 80/20 rule is another well-

34
known term. Pareto used the principle to describe that 20 percent of Italy’s population had control of 80
percent of the total wealth in the country. (Ab Talib, et al., 2015)
Another description of the Pareto-analysis is made by Karuppusami & Gandhinathan (2006) who uses
the term in connection to TQM. By using the Pareto analysis as a way of identify and rank the critical
reasons to defects in a TQM investigation, the biggest problems can be revealed and resources allocated
accordingly. (Karuppusami & Gandhinathan, 2006)
The Pareto analysis is a popular tool in decision making among management people, both in industry
and other sectors. The reason for this is that Pareto principle is easy to use and visualizes the conditions
in a good manner. Pareto-analysis is also widespread within operations management, purchasing and
parts of supply chain management, i.e. the parts of quality management and material management (Ab
Talib, et al., 2015). Pareto-analysis is also one of the most frequently used statistical analysis-tool by
Toyota (Murugaiah, et al., 2010).
A risk that needs to be taken into account when performing a Pareto-analysis is the fact that the analysis
is a static tool, which means that the results is only accurate for a specific point or period of time. For
example; a list over the sales of a set of products is compiled and analyzed with a Pareto-analysis for a
specific year. It turns out that 20 percent represents 80 percent of all the sales during one year, those 20
percent is basically only important in connection to that particular year. There could be a large increase
in sales of products among the 80 percent in the future, which changes the 80/20 relationships, but this
is not revealed by the analysis. (Sanders, 1992)
3.2.3. U-shaped work cells and lean assembly lines
A layout can be designed in many different ways depending on the purpose of the factory and the
company philosophy. When speaking about lean manufacturing much involves the reduction of waste in
order to reduce the overall lead time in a factory (Vrat, 2014). The design of the layout is no exception.
Lee-Mortimer (2006) describes a situation where a company redesigned their production layout into U-
shaped work cells. This combined with visual management resulted in several benefits to the company.
The new work cells facilitated an increase in productivity due to shorter cycle times, less used space and
less inventory in terms of WIP. (Lee-Mortimer, 2006)
Other benefits of designing a plant layout into work cells are better communications among the
employees and less man-hours needed. However, there is an important prerequisite that needs to be
fulfilled before a successful work cell structure can be designed. This is the grouping of products in
product families, i.e. products sharing the same process, and dedication of them to appropriate cells,
see the upcoming chapter Product family matrix for more information on how to carry out this
categorization. (Aghazadeh, et al., 2011)
An alternative to work cells are assembly lines. Assembly lines are in general best suited when a
company’s product assortment has a low degree of customization and high volumes. However, in
modern times there are examples of companies which have used standardized modules and then
performed customized production on them, allowing the company to gain the benefits from a repetitive

35
production scheme and at the same time attract customers who desire customized products
(Aghazadeh, et al., 2011).
Independent if using an assembly line or a work cell, it is vital to balance the workload. This can be done
by practicing the concept of Heijunka. Balancing the workload affect the amount of workers in each
station and how many stations of every type the line or work cell should contain. (Aghazadeh, et al.,
2011)
3.2.4. Product family matrix
A product family matrix is a tool to divide products sharing similar flow into product families, which
motivates the products within each family to get the similar treatment (Erlach, 2013). The tool is
according to Erlach (2013) relatively safe and easy to use and is recommended to be used prior to a
value stream map. Also Rother & Shook (1999) emphasizes that a product matrix is supposed to be used
before conducting a value stream map. The reason is to reduce the complexity of the value stream map
and to make sure a, from the customer’s point of view, relevant product is investigated. The outcome of
a product matrix will then assist in deciding which product family that should be the object of
investigation in a value stream map. (Rother & Shook, 1999)
A common way of designing a product family matrix is to list all the products along the vertical axis and
the different resources available in the plant on the horizontal axis (Olhager, 2013). Roother & Shook
(1999) as well as Erlach (2013) denotes the horizontal axis to all of the steps needed to produce the
complete assortment of products in the plant. Next, every product gets a mark in every cell of the
resources it uses or flows through in its production process, see table 7 for an example. Once this is
completed the different products can be grouped together by studying similarities in production steps or
resources, see table 8 for an example.
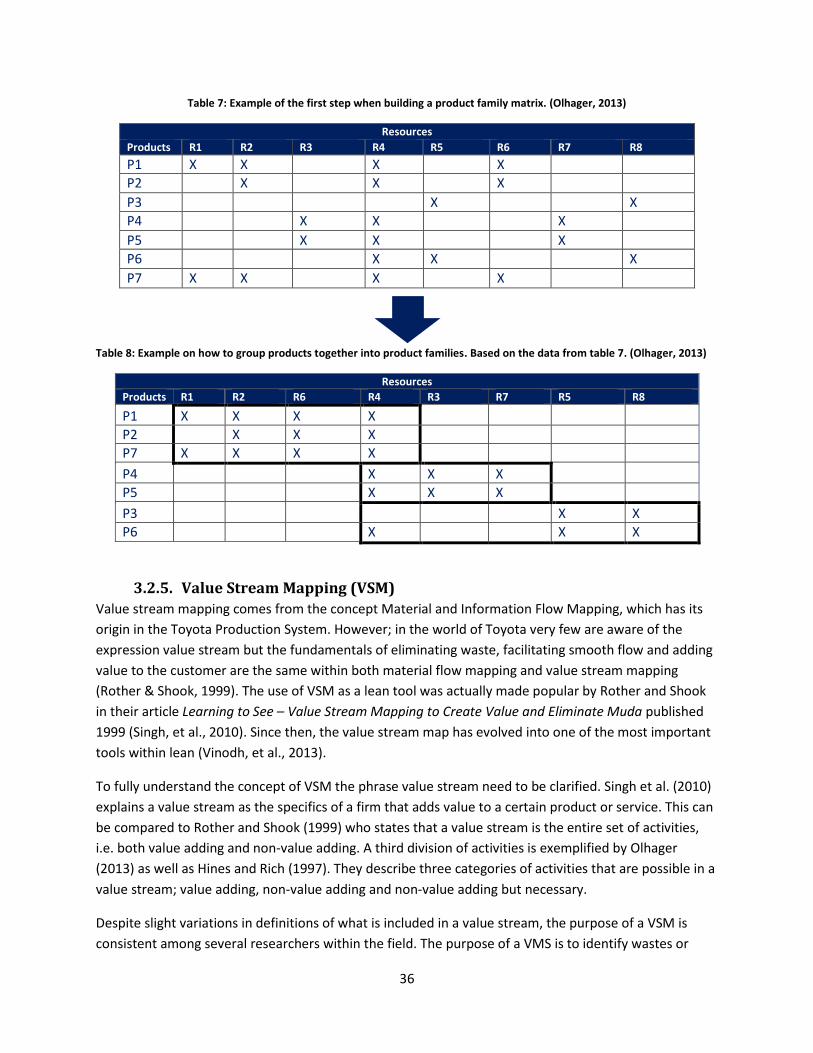
36
Table 7: Example of the first step when building a product family matrix. (Olhager, 2013)
Resources
Products R1 R2 R3 R4 R5 R6 R7 R8
P1 X X X X
P2 X X X
P3 X X
P4 X X X
P5 X X X
P6 X X X
P7 X X X X
Table 8: Example on how to group products together into product families. Based on the data from table 7. (Olhager, 2013)
Resources
Products R1 R2 R6 R4 R3 R7 R5 R8
P1 X X X X
P2 X X X
P7 X X X X
P4 X X X
P5 X X X
P3 X X
P6 X X X
3.2.5. Value Stream Mapping (VSM)
Value stream mapping comes from the concept Material and Information Flow Mapping, which has its
origin in the Toyota Production System. However; in the world of Toyota very few are aware of the
expression value stream but the fundamentals of eliminating waste, facilitating smooth flow and adding
value to the customer are the same within both material flow mapping and value stream mapping
(Rother & Shook, 1999). The use of VSM as a lean tool was actually made popular by Rother and Shook
in their article Learning to See – Value Stream Mapping to Create Value and Eliminate Muda published
1999 (Singh, et al., 2010). Since then, the value stream map has evolved into one of the most important
tools within lean (Vinodh, et al., 2013).
To fully understand the concept of VSM the phrase value stream need to be clarified. Singh et al. (2010)
explains a value stream as the specifics of a firm that adds value to a certain product or service. This can
be compared to Rother and Shook (1999) who states that a value stream is the entire set of activities,
i.e. both value adding and non-value adding. A third division of activities is exemplified by Olhager
(2013) as well as Hines and Rich (1997). They describe three categories of activities that are possible in a
value stream; value adding, non-value adding and non-value adding but necessary.
Despite slight variations in definitions of what is included in a value stream, the purpose of a VSM is
consistent among several researchers within the field. The purpose of a VMS is to identify wastes or

37
muda in the company processes and take actions to eliminate them (Emeliani & Stec, 2004; Singh et al.,
2010; Singh & Singh 2013).
Besides sharing the recently mentioned fundamentals with Material and Information Flow Mapping
from TPS, a VSM can be defined as a tool that supports the visualization of the complete manufacturing
process (Singh, et al., 2010). Both in terms of material flow and information flow. Rother & Shook (1999)
emphasizes that a VSM should be able to show the entire picture of a productions process; a VSM is not
a tool for isolated and individual events.
Since lean manufacturing mostly are known as the reduction of the seven wastes described by Hines &
Rich (1997), and VSM is considered to be an efficient method to facilitate the removal of waste. VSM is
also considered to be a strong method to facilitate lean manufacturing. Due to the holistic perspective
of a VSM it works well when reshaping the manufacturing process of a factory and eliminating
unwanted waste. (Singh & Singh, 2013)
3.2.6. How to use a value stream map
To use the VSM properly, it is not enough to only draw one map over the current state. Rother & Shook
(1999) is recommending four steps when using a VSM, see figure 9. The initial steps of analyzing product
families have already been discussed in the previous chapter. Nevertheless, by following the steps
illustrated in figure 9 a complete analysis based on the VSM-tool is performed.
Figure 9: The process of performing a VSM. (Rother & Shook, 1999)
When creating a VSM it is suggested to focus on a single product within a certain product family to
represent the whole product family (Erlach, 2013). The data collected on this single product, and the
following conclusions, is then generalized to the rest of the product variants within the same product
family.
Once product families have been sorted out it is time to start to draw the first map, the current state
map. To aid the creation of an accurate VSM of the current state it is advised to be consistent in the use
of different symbols and data in the map. When selecting the data in the current state map, the most
Identify product families
Design current state
map
Design future state
map
Plan and implement

38
important criteria is that it later should be able to work as material for the future state map. (Rother &
Shook, 1999) See figure 10 for an example of how the symbols in a current state map could be designed
as well as figure 11 for a basic example of a current state map.
Figure 11: An example of a current state value stream map.
It is important to emphasize the fact that a value stream map is only snapshot in time and there is a risk
that it is a snapshot of an unusual moment to the factory. However, according to Erlach (2013) this is
rarely the case.
When the current state map is finished and followed by thorough analysis it is time to construct the
future state map. The main purpose of the future state VSM is to display a future scenario where the
majority or all of the identified waste is removed. The map can work as a vision guiding the company
towards an ideal state (Emiliani & Stec, 2004). It can also be a map with proposals possible to implement
in the near term (Rother & Shook, 1999). Independent of the details in the structure, it is important to
make sure to address all of the possible wastes by its root causes. A common mistake is to only take care
of evident waste by the surface when designing the future state and forgetting to analyze the root
causes of a process’s problems. (Rother & Shook, 1999)
A necessary step towards a complete future state VSM is to calculate the takt time. By calculating the
takt time the pace of the production process can be identified. One takt is representing one unit going
through one activity block in the process (Singh & Sharma, 2009).
Assembly
C/T
C/O
Number of
Operators
Shifts
Activity with data box Inventory Material flow Supplier or
customer
Information flow
Figure 10: Example of symbols in a VSM. (Rother & Shook, 1999)
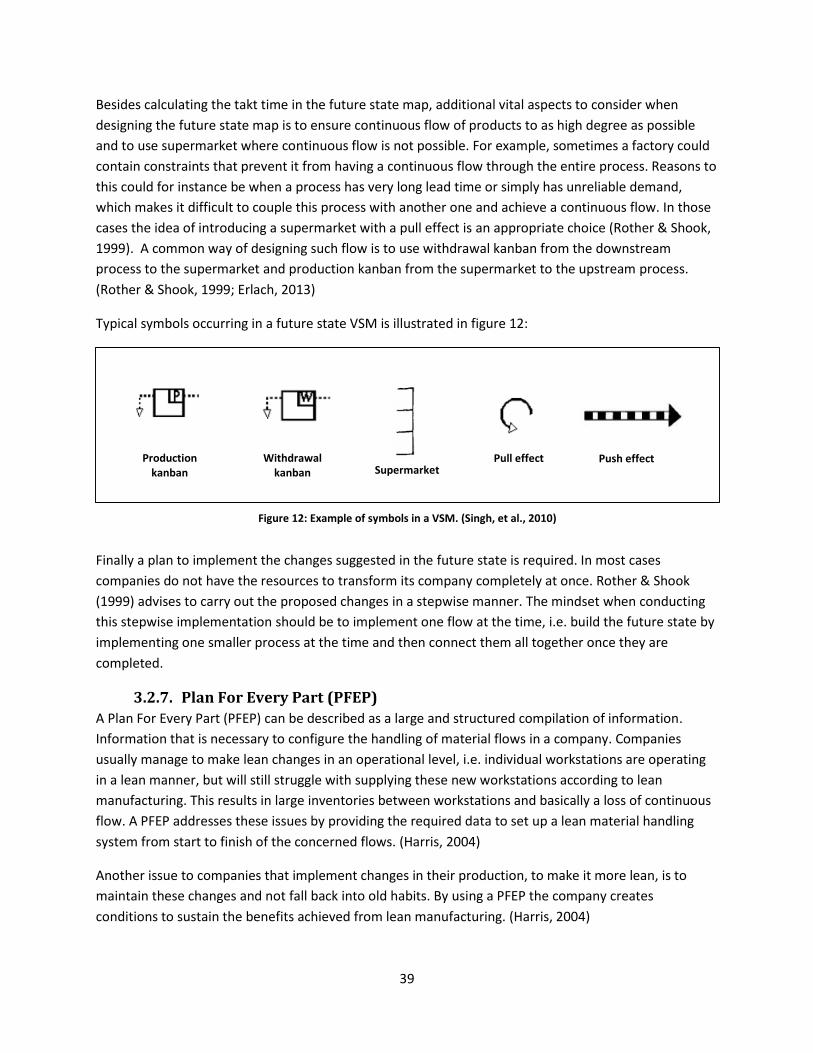
39
Besides calculating the takt time in the future state map, additional vital aspects to consider when
designing the future state map is to ensure continuous flow of products to as high degree as possible
and to use supermarket where continuous flow is not possible. For example, sometimes a factory could
contain constraints that prevent it from having a continuous flow through the entire process. Reasons to
this could for instance be when a process has very long lead time or simply has unreliable demand,
which makes it difficult to couple this process with another one and achieve a continuous flow. In those
cases the idea of introducing a supermarket with a pull effect is an appropriate choice (Rother & Shook,
1999). A common way of designing such flow is to use withdrawal kanban from the downstream
process to the supermarket and production kanban from the supermarket to the upstream process.
(Rother & Shook, 1999; Erlach, 2013)
Typical symbols occurring in a future state VSM is illustrated in figure 12:
Finally a plan to implement the changes suggested in the future state is required. In most cases
companies do not have the resources to transform its company completely at once. Rother & Shook
(1999) advises to carry out the proposed changes in a stepwise manner. The mindset when conducting
this stepwise implementation should be to implement one flow at the time, i.e. build the future state by
implementing one smaller process at the time and then connect them all together once they are
completed.
3.2.7. Plan For Every Part (PFEP)
A Plan For Every Part (PFEP) can be described as a large and structured compilation of information.
Information that is necessary to configure the handling of material flows in a company. Companies
usually manage to make lean changes in an operational level, i.e. individual workstations are operating
in a lean manner, but will still struggle with supplying these new workstations according to lean
manufacturing. This results in large inventories between workstations and basically a loss of continuous
flow. A PFEP addresses these issues by providing the required data to set up a lean material handling
system from start to finish of the concerned flows. (Harris, 2004)
Another issue to companies that implement changes in their production, to make it more lean, is to
maintain these changes and not fall back into old habits. By using a PFEP the company creates
conditions to sustain the benefits achieved from lean manufacturing. (Harris, 2004)
Supermarket Withdrawal
kanban Production
kanban Pull effect Push effect
Figure 12: Example of symbols in a VSM. (Singh, et al., 2010)

40
The data in a PFEP can vary from case to case since every factory is different with different issues.
Therefore, the data that goes into the PFEP must be carefully selected in order to match the settings of
the case factory. Also, a PFEP is not a fixed tool only designed once and then left alone. First of all, the
data in the selected categories need to be updated continuously. Secondly, the conditions in the factory
might change and then the PFEP will have to be modified accordingly. Table 9 illustrates some of the
common sets of data in a PFEP. (Harris, 2004)
Table 9: Example of categories in a PFEP. (Harris, 2004)
Plan For Every Part – PFEP, data categories
Item number Number to identify the specific part in the factory.
Description of part The name of the part, e.g. pipe.
Locations used in The location where the part is used, e.g. workstation 5.
Locations stored in Locations where the part is stored, e.g. supermarket.
Supplier The name of the supplier.
Container type How the item is packaged, e.g. box or case.
Etc. Etc.
Harris (2004) advices to fill in the data in the PFEP step by step by starting in a single workstation,
continue with a complete cell and then keep adding cells until the whole value stream is represented.
Furthermore, use a scope that makes it manageable and take it from there. The risk of trying to set up a
too extensive PFEP is especially high for large facilities, which means that the company is trying to do all
at once and either fails to complete the project or not using data with the right quality. (Harris, 2004)

41
4. Empirical data/ Identifying the current state This chapter focuses on identifying the current state of the factory, e.g. the work procedures in the
factory today and the design of the current layout. The empirical data that have been gathered during
the project is presented.
4.1. The case company – Alfa Laval, Wood Dale Alfa Laval is a global metal processing company with head office in Lund, Sweden. The company was
founded in 1883 in Lund, Sweden, by Gustaf de Laval and Oscar Lamm. At first the name of the company
was AB Separator but in 1963 the company took their current name. Alfa Laval is holding more than 2
000 patents and is present within technologies such as heat transfer, separation and fluid handling.
Their key products are heat exchangers, separators, pumps and valves. Every year 35 to 40 new
products are launched (Alfa Laval, 2015).
One of Alfa Laval’s factories is located in Wood Dale, Illinois. Besides the production with approximately
70 employees, the same factory also contains sales and customer service departments. The overall
organization, connected to the manufacturing in the factory, is illustrated in figure 13:
Figure 13: The organization of the Wood Dale factory. TM stands for Team Manager.
Site Manager
Factory Manager
Production Support Unit Manager - CU
TM - CU pipes, domes, fittings,
copper tubes
TM - CU tubesheets, heads,
miscellaneous parts
TM - CU 2nd shift
Unit Manager - SU
TM - SU assembly, welding
TM - SU trimming, testing, head
assembly, painting
Unit Manager Engineering
Unit Manager Materials & Logistics
TM - Receiving, supermarket,
shipping
Unit Manager Quality

42
The manufacturing in Wood Dale is basically divided into two separate units; the CU and the SU. The CU
mainly produces parts and components from raw material like metal sheets and pipes in various sizes,
and consists of several different kinds of machines. This is the first step in the factory. The CU also
performs and has the responsibility of cutting as well as bending copper coils into tubes when necessary.
The majority of the outcome from the CU is stored in an intermediary inventory between the CU and SU
called a supermarket (SM). Furthermore, inside the factory an area designated to storage of copper also
exists. This area is located in a separate room with possibilities to secure because of the high value of
copper. It is also in this room the CU is cutting the copper tubes, as mentioned earlier.
The SU is the second part of the overall manufacturing process. In the SU vessels are being assembled
into a final product, tested, painted and made ready for the shipping department. The material to the
SU is picked, kitted together and delivered by personnel from the supermarket.
The supermarket, the copper room, the receiving and shipping areas all goes under the responsibility of
the logistic manager. The logistic manager is also responsible for the purchasing department of the
factory.
The factory has also an engineering department, which is focusing on developing customized solutions
when there is a demand for that. By studying figure 14 the areas connected to the different
departments are visualized in a factory layout.
Figure 14: Factory layout with different colors highlighting the different departments’ areas of responsibility.

43
To enable performances on a high level throughout the organization of Alfa Laval, the company have
focused on four overall key performance areas; safety, quality, delivery and cost. The plant in Wood
Dale is no exception and the management works with performance indexes within all of these areas. An
example of how the safety index is affected could be number of injuries while the quality index could be
number of defects. The delivery index could then be related to elements such as delivery lead time or
delivery accuracy and the cost index to cost of sold products.
4.2. Description of products Alfa Laval in Wood Dale is a producer of tube heat exchangers. They are manufacturing and selling a
broad range of tubular vessels with the purpose to facilitate, generate or assist in heat transfer. They are
also selling parts individually, e.g. as spare parts. Nevertheless, the company has a product portfolio
predominantly containing three different types of products; condensers, receivers and evaporators. See
figure 15 for examples of the product types.
Figure 15: Examples from the three product types produced and sold in Wood Dale. From the left: condenser, receiver, and evaporator. Note that this is only three examples of many variants within the three product groups.
These product types are then consisting of different variants, sizes and even different sub-groups. For
example, within the category of evaporators there are two main subgroups that in this case study are
called flooded evaporators and other evaporators, where flooded evaporators are a category containing
relatively large vessels. Another characteristic of the large vessels such as flooded evaporators are the
high degree of customization that is carried out on these products. However, the foundations are
basically the same and the customization does not take place until relatively late in the manufacturing
process, allowing as many parts as possible being manufactured in a standardized fashion.
Besides the three main product types illustrated in figure 15, there also exist product groups called ELT
and VSE. The VSE is similar to a receiver but with some distinct differences, e.g. the VSE contains a
copper coil, and the ELT is basically several tubes lined up on top of each other. In general, the product
groups of VSE and ELT consist of low-volume products and are not included among the plant’s main
product groups.
4.2.1. Pareto-analysis
Due to confidentiality, figures in this chapter are fictive and parts of the original content have been
removed or classified.

44
Based on data from the sales in 2014 and the sales up to the beginning of September in 2015, a Pareto-
analysis was performed. First of all, the data had to be filtered according to the purpose of the case
study. Only still active products, which had been made in the factory and sold, were included. Moreover,
only the sales from complete vessels like receivers, condensers and evaporators were analyzed.
Evaporators were then divided into flooded evaporators and other evaporators due to their large
difference in design as well as manufacturing process. The same goes for receiver and VSE. The ELT were
also included to receive verification on the low-volume nature of this product group. Lastly a division of
the vessels’ size was made where it was possible; i.e. some product groups could be divided into large
vessels and small vessels. The reason to this was the large differences in material flow and material
handling between large and small vessels. Figure 16 presents the results from this compilation but due
to the classified nature of the content the product categories are instead given a random number, e.g.
product 1 or product 2. Note that these numbers will be the denotation of the product types in the rest
of the report. To complement the sold volumes per category, all costs associated with the sold products
were also compiled and included in the figure.
Other products like components, spare parts and accessories were not considered since they either
were assembled into a whole vessel or had a limited material flow; i.e. it was purchased, put on a shelf
and then shipped without any direct value adding activities.
Figure 16: The amount of sold product, in number of complete vessels, and the total cost generated by all sold products in each product group.
Next the actual Pareto-analysis was executed. The data from figure 16 were inserted in a table and
subsequently the accumulated percentages of the different quantities per year were calculated. This
Product 1 Product 2 Product 3 Product 4 Product 5 Product 6 Product 7 Product 8
Total cost and quantity per year and sold product group
Sum of Qty 2014
Sum of Qty 2015
Sum of Cost 2014
Sum of Cost 2015

45
was then put into relation with the percentage of each product type compared to the total amount of
product types. The result is displayed in table 10.
Table 10: A table over the volumes and accumulated percentages connected to each product type.
Product type Acc. % of total quantity 2014
Acc. % of total quantity 2015
Acc. % of number of types.
Product 1 30% 43% 13%
Product 2 68% 77% 25%
Product 3 76% 84% 38%
Product 4 83% 91% 50%
Product 5 96% 95% 63%
Product 6 98% 98% 75%
Product 7 100% 100% 88%
Product 8 100% 100% 100%
Total: 100% 100% 100%
By studying the result from the Pareto-analysis, it was noted that product 1 and product 2 are by far the
most sold products. The data from 2015 displays the fact that product 1 and 2 represent almost 80 % of
all the sold volume that is being manufactured in the plant.
If this result is combined with an identical analysis over all of the associated costs per product type,
illustrated by the curves in figure 16, it is evident that the type labelled as product 2 are a central
product group with both high scores in quantity and costs. Another observation is that the categories of
product 6 and 7 drive a lot of costs in comparison to the sold quantity.
With the objective of performing an analysis with a helicopter perspective in mind, the decision to limit
the study to four different product types was taken. Product 1 and 2 were easy choices due to their
large quantities sold per year and consequently their frequent impact on the material flow. Thereafter
product 6 was also selected on the reason of being the costliest product type compared to the amount
sold per year. Finally, to still be able to analyze as many relevant product types as possible without
losing the helicopter perspective, the category of product 3 was also selected. This choice is explained
further below.
Product 4 actually had a similar demand as product 3 but was not driving as much costs. Therefore,
product 4 was discarded in favor of product 3. Another reason to why product 3 was selected was the
difference in manufacturing process compared to other categories. To include all product types in the
analysis would have resulted in a too detailed study. Since the discarded product types did not have a
large impact on the plant, neither in sold quantity nor cost, they would not have had any effect on the
end result either.
In each one of the four selected product groups a specific product was chosen to represent the whole
group. In the upcoming section of this chapter explanations and motivations regarding the specific
products chosen in each group will be presented.

46
A pattern with large quantities on a few items was discovered in all of the four product groups, see
figure 17 for an image of the general distribution between products in the different product groups and
sold quantities. If there were any differences between the investigated years, more weight was put in
the year of 2015.
Figure 17: Quantities sold per year for each item in a certain product group. This curve is applicable to all of the four of selected product types with some reservations.
Regarding product 2 there were two candidates that were manufactured in significantly larger volumes
than the other variants. Both of these candidates were also among the variants that drove the most
costs. Eventually it was decided to include the one with the highest quantity sold in the case study.
Next it came down to the type called product 1. Also in this product group there was a clear distinction
of high-volume and low-volume products. A clear top candidate, in terms of sold quantity per year, was
therefore found and selected without any further analysis needed.
It was a little bit more difficult to select an undisputable large-quantity item in the other two product
groups, i.e. product 3 and 6. There were some items with higher demand than others, but in general
there were no large quantities of a certain variant sold from either one of the categories. These product
groups are not as highly demanded as product 1 and 2. This, in combination with the fact that the
manufacturing processes within each group basically contains the same stages of workstations for every
variant, regardless of customization or not, means that almost any item can be chosen when studying
the material flow. By putting more emphasize on the volumes from the year of 2015, one product from
the category of product 3 and one from product 6 were eventually considered appropriate to study.
To summarize; quantity was an important factor when deciding which items to study. The products with
the highest demand in numbers of vessels will also be the products affecting the flow most often.

47
Therefore, the product groups chosen to investigate were product 1, 2, 3 and 6. Because of the limited
time of gathering data on site, it was not possible to wait for a specific product in each category. It had
to be a common product that goes through the flow while the case study is conducted on site. With this
in mind four products, one from each product group, were chosen.
4.3. Material Flow When products, to base the analysis on, had been selected it was time to start mapping their
corresponding material flows in the plant. At the same time, time measurements in each workstation
along the manufacturing processes were carried out. Several weeks were spent analyzing the
manufacturing of components in the CU as well as the assembling and finishing of whole vessels in the
SU. In addition to this the supermarket, the copper room and receiving/shipping areas were affected by
the material flow and were therefore also included in the mapping. When all of the flows had been
identified and measured, a spaghetti flow chart was constructed, see figure 18.
Figure 18: A spaghetti flow chart, based on the four chosen product types, over the different material flows in the factory.

48
As displayed in figure 18 there are a lot of different material flows in the factory, see Appendix IV for full
list over what part or product type each color is representing. The following chapters will describe the
material flows in each department a bit more in detail.
4.3.1. Component Unit (CU)
In the CU the receiving dock is located in the corner of the layout, which is the main inflow of the whole
factory. Parts are processed through the CU in different machines or tools and leave the CU through
either one of two possible doors, see figure 19. These two doors lead to the supermarket and
subsequently also to the SU. Due to the manufacturing of many components with different material
flows within the CU, it is not possible to draw an overall path for a majority of the components. See the
spaghetti chart in figure 18 in the previous chapter for details of the specific material flow in the CU.
Figure 19: Layout over the entire CU with receiving dock at the top left corner.
The CU can be divided into two main areas CU 1 and CU 2, see figure 20. CU 1 can be claimed to process
components called tubesheets and miscellaneous parts while CU 2 process pipes, domes and fittings.
However, there is not always a distinct line between these departments and some components are
being processed in both of these areas. Most of the components are manufactured and also transported
in batches. The really heavy components are the exception and are in general both manufactured and
transported one by one. If large components are manufactured in batches, it is not in large numbers.

49
As displayed in figure 20, the only thing not part of the CU in the layout is the receiving dock. The
receiving dock is working in collaboration with the CU but is considered to be part of the materials &
logistics department. The receiving dock allows trucks to unload their material inside the plant.
Unloading is done either by forklifts or by a crane. Almost all material delivered to the factory, except
copper tubes and some small stationery, are unloaded at the receiving dock.
Figure 20: A description of where in the CU different components are mainly being manufactured.
In addition to figure 20 the CU are also using workstations situated in the SU. These workstations are
welding stations and are mainly welding smaller or medium sized components. The CU is mainly linked
to these departments by the manufacturing process of heads. After the welding is finished the
component, most often heads, is either send back to CU for more machine processing or put in storage

50
in the SU. Since these workstations technically belong to the SU they are described further in the
upcoming chapter about the SU.
Currently the material in the CU is transported in several different ways. The heavy components, such as
large pipes and large tubesheets, are moved with large overhead cranes or by jib cranes mounted to the
ground. When these heavy components are being transported to areas where the cranes cannot reach,
a forklift and a EUR-pallet is generally used. The really large pipes are in some cases being pushed
manually on large wagons equipped with wheels, when being transported to another workstation.
Smaller components can be moved manually in cases or piece by piece depending on how long the
movement is supposed to be. Regularly the components are manufactured in batches and are
afterwards transported on pallets or in large baskets. These pallets or baskets are then moved with
either hand pallet jacks or regular forklifts. This depends on how many the numbers of components are,
the type of components and the accessibility of the forklifts.
The baskets mentioned in the previous piece of text, are actually mostly used to kit different
components together and are in general located in the kitting area, see figure 20. This means that the
baskets mostly works as a mean to transport the kitted orders from the kitting area in the CU to the
staging area prior to the assembling in the SU, more on this in the upcoming chapter about SU.
Additionally there are also examples of components, such as small pipes, that are being transported
with trolleys between some stations. When these are finished they are kitted together in the kitting area
and placed in the recently described baskets or transferred to a storage location in the supermarket.
The method of how to signal for material and schedule the production is basically the same for every
department. The only thing that controls what is being made and when is the daily schedule. In the CU,
this schedule is handed out to each operator before they start in the morning, or in the afternoon for
the second shift. The orders listed in this schedule are the one supposed to be completed during the
day, unless a rush order comes in that needs to be finished immediately. If there are any adjustments in
the order list, the details of what order is going to be processed and when is controlled by the team
managers in the CU. The team managers work from the directives they have received from the unit
manager.
Lastly, it has not been feasible to follow the material flows connected to all of the components in the
selected products. Nevertheless, the material flow linked to almost every type of component including
the most significant components was followed, i.e. some small insignificant components were filtered
out. These minor components were projected to have a very small impact on the material flow and
could therefore be neglected.

51
4.3.2. Supply Unit (SU)
In the SU parts are being delivered kitted from the supermarket to a staging area right next to the
assembly. The material can enter the SU from two different paths, see figure 21. The basic material flow
after entering the SU is in the shape of a large U. First the material moves straight along the assembly
area towards the wall, next it turns left up towards the finishing area and finally another left turn to the
packaging area where the material & logistics department takes over the responsibility. From the
packaging area the material is moved to the shipping dock and later shipped.
Figure 21: The basic layout over the SU with shipping dock in the top left corner.
The different subdivisions in the SU, along with the area for packing and shipping, can be studied in
figure 22.

52
Figure 22: The description the different areas in the SU along with the packing/shipping zone.
Depending on the product type and size of the vessel, the different units either make their way through
SU small or large. Kitted components, coming from the CU and the supermarket, are being assembled
and welded together to manufacture the vessels. SU large is mainly for large vessels like product 6, but
smaller vessels such as product 3 are currently also being assembled in this area. In SU small, product 1
and 2 are being assembled. The general concept behind SU small and large is line manufacturing with
material flowing step by step through the different stations in these areas. However, some of these
stations are lined up after one another and some are not.
Shipping
SU Small
Assembly/Welding
SU Components
SU Large
Assembly/Welding
Tube
Trim/Rolling
Finishing
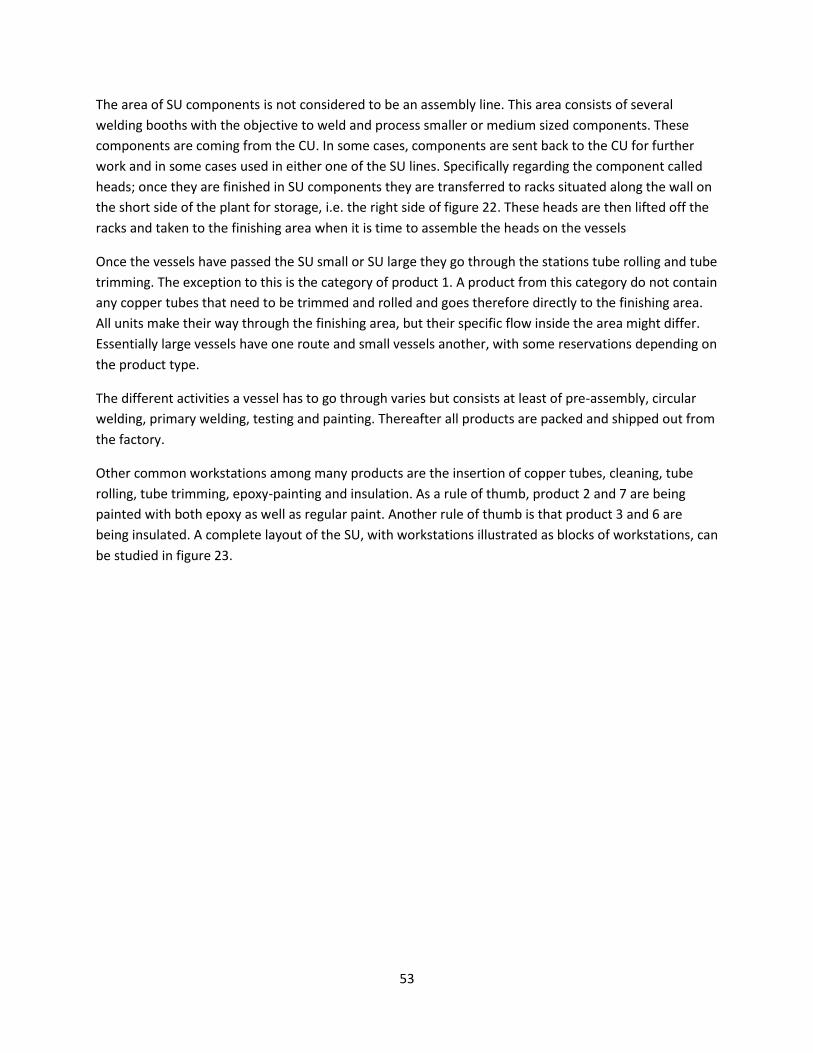
53
The area of SU components is not considered to be an assembly line. This area consists of several
welding booths with the objective to weld and process smaller or medium sized components. These
components are coming from the CU. In some cases, components are sent back to the CU for further
work and in some cases used in either one of the SU lines. Specifically regarding the component called
heads; once they are finished in SU components they are transferred to racks situated along the wall on
the short side of the plant for storage, i.e. the right side of figure 22. These heads are then lifted off the
racks and taken to the finishing area when it is time to assemble the heads on the vessels
Once the vessels have passed the SU small or SU large they go through the stations tube rolling and tube
trimming. The exception to this is the category of product 1. A product from this category do not contain
any copper tubes that need to be trimmed and rolled and goes therefore directly to the finishing area.
All units make their way through the finishing area, but their specific flow inside the area might differ.
Essentially large vessels have one route and small vessels another, with some reservations depending on
the product type.
The different activities a vessel has to go through varies but consists at least of pre-assembly, circular
welding, primary welding, testing and painting. Thereafter all products are packed and shipped out from
the factory.
Other common workstations among many products are the insertion of copper tubes, cleaning, tube
rolling, tube trimming, epoxy-painting and insulation. As a rule of thumb, product 2 and 7 are being
painted with both epoxy as well as regular paint. Another rule of thumb is that product 3 and 6 are
being insulated. A complete layout of the SU, with workstations illustrated as blocks of workstations, can
be studied in figure 23.

54
Figure 23: The current state of the SU and packing/shipping visualized in blocks of different workstations.
The short abbreviations in figure 23 are used to describe the different workstations and are explained in
table 11.
Table 11: Explanations of abbreviations used to describe workstations in the SU.
Abbreviations of workstations in the SU
L1 Pre-assembly large vessels
L2 Circumferential welding large vessels
L3 Primary welding large vessels
L4 Cleaning and tube insertion large vessels
502 Small parts welding
A1 Pre-assembly product 1
A3 Primary welding product 1
B1 Pre-assembly product 2
B3 Primary welding product 2
Tube rolling Expanding copper tubes to fit into vessel
Tube trimming Grinding copper tubes to proper length
Head assembly (L) Head assembly large vessels
Head assembly (S) Head assembly Product 2
By looking closely to figure 23, it can be noted that a small line for product 3 has been set up right below
the station called tube rolling. The product 3 line was developed during a previous project at the factory

55
and is supposed to facilitate the assembling and welding of the products within this category in a line-
based manner. Even though the necessary equipment has been arranged, the line has not been put into
use yet.
In SU small there exist two circumferential welding machines; one that can weld on two sides of the
vessel at the same time and one that is only able to weld one side at the time. Through observations it
has been confirmed that the two-sided welding machines are regularly used for product 1 and the one-
sided for product 2. However, this not a rule and sometimes product 2 goes in the two-sided welding
machine and product 1 goes in the one-sided. It depends on the availability of the machines and on the
size of the orders, i.e. an order with many units normally goes in the two-sided circumferential welder.
All vessels in an order are namely most likely batched together. Because of the batching orders with
many vessels are directed to the two-sided welding machine to save time.
During the time of the study SU large had an old circumferential welding machine that could not
manage every type of large vessels. The very largest units had to be circumferential welded manually in
a separate workstation. As a part of a large improvement project, right at the end of the case study, a
new circumferential welding machine arrived to SU large. This new welding machine is supposed to
handle all sizes of vessels in SU large, making the manual circumferential welding a spare welding station
for times with heavy workloads.
The system with a daily plan, mentioned in the previous chapter about the CU, is the same in SU.
Correspondingly in the SU, the team managers have an overall responsibility to control and make sure
the vessels are being manufactured in the right order.
The main material carrier in the SU is large overhead cranes. In SU large the vessels are both moved
within the stations and from one station to another with these cranes. In SU small cranes are used to
adjust the position in the workstation and to lift the vessel from or to a cart or basket. These carts and
baskets are then moved with hand pallet jacks or pushed between workstations. The way of handling
the material in SU small is generally the following; the material comes kitted and ready in baskets. Next
the operator fetches a cart by which the pipe is lifted over to. After that the operator lifts the pipe to his
worktable and starts working on it, figure 24 reveals how it could look like in a workstation.

56
Figure 24: A view of some of the different material carriers in SU small. The image displays both baskets with kitted orders and carts with WIP.
After the assembly lines in SU small and SU large the material is either transported to the rolling and
trimming area or directly to the finishing area in carts. Small vessels have regular carts and large vessels
have either similar carts made for bigger units or customized pallets with wheels for the really large
units, see figure 25. The large customized pallets for the large vessels are then moved with forklifts since
it would be too heavy to manually push the vessel forward.
57
Figure 25: A view of three different material carriers. From the left; small carts for small vessels, cart meant for large pipes or relatively large vessels and at last customized pallet with wheels meant for really large vessels.
In the finishing area the main method to move material is to use overhead cranes. However, in the
painting area a rail system in the ceiling is being used. This enables vessels to slide in and out from the
paint booth in a smooth manner. To some degree the large vessels have to be transferred with forklifts
on the customized pallets displayed in figure 25.
4.3.3. Supermarket and receiving/shipping
The department of materials & logistics is in charge of three distinct areas in the factory; the
supermarket, the receiving and the shipping area. These areas are basically involved in every value
stream in the entire factory. All of the manufactured components pass the supermarket before it
continues further in its manufacturing process and all of the finished products are being packed and
shipped in the shipping department. The receiving dock has already been described in chapter 4.3.1. The
Component Unit (CU) where it was explained that all material, with the exception of cupper tubes and
small stationary that are being received at the shipping dock, is coming in by the receiving dock adjacent
to the CU.
The supermarket is an intermediary storing location between the CU and SU. It mainly consists of racks
where mostly small to medium size components are stored. The supermarket is also responsible of the
kitting of orders from the CU before delivery to the SU. This kitting is mainly taking place in the small
area visualized in figure 20, in the CU. Once an order is kitted and made ready it can be delivered to the
SU. The workers in the supermarket deliver the basket with material by pulling it with a hand pallet jack
and placing it in the staging area located nearby one of the assembly lines.
The supermarket personnel are also responsible of picking copper tubes to the assembly lines. Either
they pick them and walk with them to station L4 where large vessels have their tube insertion or they
walk with them to B1 where products of product type 2 have their tube insertion. In some cases, when a
vessel in SU large is not too large, copper tubes are inserted in station L1 instead. See previous chapter
for list of abbreviations in the SU.

58
The shipping area is not only a shipping dock. This area also includes a few racks where some of the
most popular vessels are being stored, i.e. a storage point of finished goods. Furthermore the shipping
area also makes sure the vessels are being packed, palletized and weighed before they are placed at the
shipping dock. In fact, the shipping area is containing a small carpentry where pallets and cradles are
being manufactured according to the specific measurements of each incoming vessel.
4.3.4. Copper room
The copper room is the storage location for all copper in the factory. Copper tubes are an essential part
of several of the products produced at the factory and are of high value. This is also the reason why
copper is stored in a separate room possible to lock after closing.
All copper tubes are received at the shipping dock, next to the copper room and are then transferred
into the copper room. Copper tubes are, as mentioned in the previous chapter, one of the very few
items that are not received in the receiving dock. The copper tubes either enter as pre-cut parts in long
wooden boxes or in large copper coils, which has to be cut in the desired length when demanded from
the SU. The cutting of the copper coils is carried out by an operator belonging to the CU on machines
located in the copper room.
In the copper room the copper is stored on racks or plain and simple on the ground. The room lacks a
system of where to put each type of copper and the copper stored on the ground are often stacked on
top of each other. These stacks will sometimes contain only one kind of copper but most likely several
kinds are mixed within the stack, causing double handling.
In the copper room an area has also been dedicated to the department of production support, i.e. the
maintenance department. Maintenance has an area in the right top corner of the room, where tools and
small parts are stored on shelves and larger equipment are positioned on the ground along the wall.
4.4. Product family matrix in the CU and SU To aid in creating an understanding of the current state in the plant and to distinguish different
production processes, two separate products family matrixes were constructed. First a matrix in the CU
was created with all resources or machines in the CU listed along the horizontal axis and each product’s
components listed along the vertical axis. See figure 26.

59
Figure 26: A product family matrix with the selected products as well as machines or workstations in the CU.
Instead of marking each cell in the matrix with a cross, as mentioned in the theoretical framework,
numbers were inserted. These numbers symbolized the order of when the concerned component was
processed in the stations; i.e. the number 1 represents the first step in the production process, number
2 the second step and so on until the components has been finished and transferred to the
supermarket. In some cases, several different machines can carry out the same work, e.g. many of the
drilling machines can process the same component. To cover this, the components that can go into
several machines have the same number in all of these machines. For example, the component called
endplate in product 2 can be processed in two machines in its second step and has therefore the
number 2 on two different places.
The second matrix was then constructed over the SU. The main differences from the first matrix were
that complete products were listed along the vertical axis, i.e. no components, and that the
workstations along the horizontal axis mainly consisted of assembly stations instead of machines. The
same structure with numbers describing the manufacturing sequence was also used when designing this
matrix. See figure 27.
Saw
CN
C d
rill
Do
me R
ob
ot
Sheet m
etal station
Tum
bler
IDO
D
Fitting m
achin
e
Wash
er
Trum
pf
Bu
rno
SU co
mp
on
ents W
eld
Oo
ya drillin
g
Kitam
ura m
achin
e
Mo
ri SEIKI d
rilling
Surface grin
der
PT-test
SH4
00
SH4
0
Small p
art grind
er
Vern
on
Blast b
un
ker
10
6 K
oam
ing
Stub
end
fabr. &
prim
. weld
Am
eriSEIKI
Oo
ya VM
C
Tack weld
Lathe
Diago
nal cu
t
Product 6
Pipe 1 2
Tubesheet 1 5 2 5 4 3
Ring, large 1 2 2 2
Fitting 2 1
Support 2 1 3
Base plate 1 2 3
Front head 1 4&6 5 3 2
Rear head 1 5 4 3 2
Large fitting 1 5 3 2 4
Deflector 1 2
Flange 1
Bracket 2 1 3
Product 3
Tube 1 2 3
Tubesheet 1 2 2 3
Fitting 2 1
Front head 1 2 3 3
Rear head 1 2 2
Baffle 2 1
Product 2
Tubesheet 1 4 2 2 3
Endplate 1 2 2
Pipe 1 2 3
Fitting 2 1
Ring, small 1
Product 1
Dome 1 2
Pipe 1 2 3
Fitting 2 1
Pickup tube 1
Hanger 1
Parts
Parts
Parts
Parts
Machines/Workstations in CU

60
Figure 27: Product family matrix of the SU with corresponding manufacturing sequence.
To clarify; the products in the SU are mainly being manufactured in different workstations defined by
the activity carried out by the operators in that station, e.g. pre-assembly or primary welding.
Furthermore, since the SU mainly are consisting of assembly lines there are not many activities carried
out by machines in the SU. Due to this, workstations or activities were listed instead of machines as in
the CU matrix.
The SU matrix was mostly used to verify that the different product types had been grouped together
appropriately, or if there were any processes that could be adjusted according to the result from the
matrix. The CU matrix was mainly set out to investigate what kinds of machines are being used to
manufacture which component and to identify how the machines then should be located to achieve the
leanest flow.
The results from these matrixes were both useful in the next step of the case study, the value stream
map.
4.5. Value Stream Map – Current state The theoretical framework presented in chapter three presents that a value stream map over the
current state should be based on a product family identified in the product family matrixes. This has not
entirely been the case in the design of this value stream map. Product families of complete vessels had
already been identified through e.g. genchi genbutsu and several interviews with people at the plant.
However, the matrixes confirmed in some sense what was discovered earlier and in the CU the product
families of the different components could be identified. All this information was helpful when building
the VSM of the current state.
Even though product families were identified in the product matrix to the components in the CU; the
current state VSM of the CU was designed to include the value streams of all of the different
components relevant to the four selected product groups. There were two reasons to this. Initially it was
desired in order to get a complete view of the manufacturing linked to the four investigated product
groups, and minimizing the risk of missing any critical material flows. Secondly, to be able to get a visual
of the current setting in the CU and the complexity of it. Some components were grouped together but
L1 L2 L3
B1
On
e-sided
circ.weld B
3
A1
Two
-sided
circ.weld A
3
Clean
ing
Insertin
g tub
es
Tagging
60
1
60
2
Testing sm
all
Testing large
Head
assemb
ly (S)
Head
assemb
ly (L)
Regu
lar pain
ting
Epo
xy-pain
ting
Insu
lation
Packin
g/palletizin
g
Ship
pin
g
Product 1 3 1 2 4 5 6 7 8
Product 6 1 2 3 4 5 6 7 8 9&11 10 12 13 14
Product 2 1 2 3 4 5 6 7 9 10 8 11 12
Product 3 1 2 3 4 5 6 7 8 9 10
Workstations in SU

61
a division of components with different sizes were kept, e.g. all small pipes had one value stream and
large pipes had one. This resulted in many different value streams with different amount of production
steps, which then was visualized in a large map. To make the VSM of the current state complete the four
assembly processes of the product 1, 2, 3 and 6 were also attached.
The current state map also contains the typical VSM symbols and to see the whole VSM of the current
state with both the CU and the SU, see figure 28. Due to confidentiality, the information in the data
boxes are not presented. It should be emphasized that the figure of the value stream map is mainly
working as an illustrative example to highlight the complexity in the plant. Both in terms of confusing
material flow and working procedures. Since all of the workstations currently are operating as silos and
basically only minding their own business, this map gives an accurate image of the current state.
Figure 28: The complete value stream map, based on the four chosen product types, over the current state in the Wood Dale plant.

62
All flows in the map are in general going from the left to the right but since several products share parts
of the same material flow, which is the case in the CU, some flows are merged together.
The information in the data boxes are not possible to extract from the figure, but the collected data are
consisting of the cycle time, the changeover time, number of shifts and the number of operators. In
addition to this, corresponding value added time was collected and put into relation with the data in the
VSM. This was made to create an understanding of the amount of waste currently existing in the factory
and where it could be derived.
All the time measurements were then compiled and contributed in determining the overall lead time of
the four different product types. The lead time was calculated since it was important to the case
company, but foremost since it provided a clear and understandable index of how the company was
performing right now.
Although the VSM is, as mentioned in the theoretical framework, only a snapshot in time it is still giving
a lot of information of the processes in the plant. By spending several weeks in the gemba observing
many so called snapshots, it is apparent that the situation in the current state VSM is not a one-time
event.

63
5. Analysis of current state and improvement proposals In this chapter an analysis of the current state in the CU and the SU is presented and improvement areas
are highlighted. These areas are then addressed and improvement suggestions, both with a long term
and a short term perspective, are presented. Ideas from the analysis in the CU that were tested and
taking into consideration when developing the improvement proposals, are also included in this chapter.
5.1. CU – Areas of improvement In the CU a lot of different machines, raw material storages, inventories, WIP and kitting areas exist. A
lot of parallel material flows takes place each and every minute and therefore the overall material flow
in the CU is complex, hard to overview and ineffective.
The main issues in the CU involve the many and complex flows that are occurring in the department,
and the large amounts of machines currently existing in the department. Currently the CU has many
machines that can carry out the same job, with some slight differences. This results in many machines
taking up a lot of space and at the same time not being used. Instead of having a few machines being
utilized the majority of the time; the CU has many machines that are not even close of utilized half of
the possible working time. The rest of the time the machines are standing still.
The complicated flows in the CU are an issue since it contributes to a lot of unnecessary travel and
makes it hard to keep track of parts in the manufacturing process. Several machines in the CU are not
structured according to the sequence some of the components are being made, which creates long
distances of transportation and poor communication between departments that instead are working as
silos. All of this is also a cause to the large amount of WIP all over the CU area.
The CU does not only keep inventory as WIP in between workstations, the department also has large
areas where raw material is stored. By spending time in the gemba one example of excessive stock was
instantly noticed. It is clear that the stock of domes, meant for the cell with a dome robot, is way more
than necessary. The inventory of domes takes up far more space than the actual work cell needs.
In addition to complicated flows a lot of travel back and forth exists in the CU, i.e. back and forth
between the CU and the SU. As an example the component type of large front heads with partition are
used. This type of component is being transported in a very ineffective way. The product is processed in
the CU, then transported to the SU for welding, transported back to the CU and then finally over to the
SU again to get fittings welded on to it. To add even more distance to the entire flow; these fittings have
then already been transported several times between CU and SU in their manufacturing process. See
figure 29 for an example of the described flow. The red lines are representing the heads and the yellow
ones are representing the fittings. This way of handling material requires a lot more travel than
necessary and the possibility to perform visual management with this kind of flow is very hard.

64
Figure 29: The material flow of the manufacturing of large heads with partition in the CU.
The conclusion that resources were not arranged optimally was developed when performing the
product family matrix on the components manufactured in the CU. The first step of the product family
matrix can be seen in figure 26 chapter 4.4. Product family matrix in the CU and SU. Figure 30 presents
the second step; the organization of components into cells with similar flows. Each cell has been given a
color that represents that particular cell. In some cases, a machine is used to manufacture two different
types of components, meaning that one machine might fit into two different cells. In those cases, the
volumes of the concerned components have been studied and the component with the largest
demanded volume has determined which cell the machine should go into.
The result was five different cells; pipes, heads, fittings, tubesheets and miscellaneous parts. From the
matrix it was also revealed that two machines or workstations were occurring in many different value
streams, i.e. the burno machine and the blast bunker. These two workstations were therefore
considered as shared resources to many components and so called stand-alone workstations.

65
Figure 30: The product family matrix of the components manufactured in the CU. The components and machines have been grouped together in five different work cells.
To visualize the results in relation to the current layout all of the machines were displayed in the given
cell color from the product family matrix, see figure 31. This result was then used in workshops to
facilitate the creation of improvement suggestions and to determine which ideas that could be tested.
Cell colour Product type color
Bu
rno
Do
me R
ob
ot
SU co
mp
on
ents W
eld
Surface grin
der
Stub
end
fabr. &
prim
. weld
Tack weld
Mo
ri SEIKI d
rilling
Tum
bler
Fitting m
achin
e
Wash
er
Kitam
ura d
rilling
PT-test
SH4
00
SH4
0
Small p
art grind
er
10
6 K
oam
ing
Am
eriSEIKI
Oo
ya VM
C
Vern
on
IDO
D
Saw
CN
C d
rill
Lathe
Diago
nal cu
t
Blast b
un
ker
Trum
pf
Sheet m
etal station
Oo
ya drillin
g
Dome 1 2
Rear head 1 2 2
Front head 1 2 3 3
Front head 1 4&6 5 3 2
Rear head 1 5 4 3 2
Fitting 2 1
Fitting 2 1
Fitting 2 1
Fitting 2 1
Flange 1
Tubesheet 1 4 2 2 3
Tubesheet 1 5 4 5 3 2
Tubesheet 1 3 2 2
Endplate 1 2 2
Ring, large 1 2 2 2
Pipe 3 1 2
Pipe 1 2
Pipe 3 1 2
Pipe 3 1 2
Large fitting 3 1 5 2 4
Pickup tube 1
Support 3 1 2
Baffle 1 2
Bracket 3 1 2
Deflector 1
Ring, small 1
Base plate 1 3 2
Hanger 1
Product 6
Product 3
Product 2
Product 1
Machines/Workstations

66
Figure 31: A layout of the current state in the CU. All of the machines have received the determined cell color from the product family matrix.
By studying the current layout with the machines in different colors, it becomes evident that many
machines are not organized optimally. Both in terms of being located far from machines with the same
color but also since there are a lot of unused space between the machines. A lot of the white space in
the image is used as storage space and inventory is waste according to lean manufacturing. Figure 31
gives a good indication on how much space is “wasted” on storing WIP or raw material.
A last remark regarding the material flow and another improvement area is the material flow that
involves the activity of PT-test. PT-test is a test to examine how brittle the test subject is. In the CU a PT-
test is carried out on small tubesheets as a last step before sending them to the supermarket. When the
PT-test is performed, all the parts that should be tested are collected on a pallet and then moved by
forklift to the receiving area. Usually in batches of around 50 pieces of tubesheets. This is a travel
movement in the complete opposite direction of the optimal flow. This is because good ventilation is
needed in order to do the test, therefore the operator perform the test at the receiving dock when the
gate is open. This procedure is not efficient and a lot of extra travelling is taking place. Also large
amounts of WIP are created due to the batching of units.
5.1.1. Testing of ideas in CU
A lot of improvement areas were identified, as presented in the previous chapter, and before
improvement proposals could be determined it was decided to test some of the ideas in practice. By
testing ideas in practice it was possible to receive an immediate response on how well the idea worked.

67
Depending on the outcome of the idea it could then work as a basis in the process of developing
improvement suggestions, both for the long term suggestions but mainly for the short term.
When developing suggestions regarding the future state in the CU one idea in particular was tested in
practice. This idea was addressing the manufacturing process of large heads with partitions. This flow
was described in the previous chapter and worked as an example of an inefficient flow, see figure 29.
The idea concerned the sequence of activities in this manufacturing process. By changing the sequence
of some specific activities, the flow back and forth was predicted to disappear. If successful, it would
also have been possible to implement the idea instantly.
The result from the testing was mixed. It was possible to change the sequence but it would require a
new set of fixtures. It was then decided that it would be more convenient to simply move a welding
station from the area called SU components, which is the workstation currently processing the heads in
the SU, to the CU. In other words; the sequence of activities was decided to be kept intact and the focus
should instead be on relocating the welding booth in the SU. This had previously been the setting in the
CU but it was changed, mainly because management wanted to have all of the welders in the same area.
Since the setting with welding booths in the CU already had been proven to work in the past it was
decided that this did not need any further testing.
5.1.2. CU – Short term actions
The short term actions proposed for the CU is claimed to be possible to implement, as well as recognize
the results from, in a near future. In contrast to the long term proposals for the CU, the short term
actions have not needed as thorough investigations and calculations. These actions are more aimed
towards capturing the “low hanging fruits” that exist in the factory today, i.e. the improvement areas
that are argued to be relatively easy to identify and correct.
What is considered to be easy to implement and improve is always relative but since much of the work
carried out in the CU involves machines, machines are also included in the short term actions. In
general, rearranging heavy machines is considered appropriate in the long term suggestion while
relocating smaller machines are recommended as short term actions. All of the suggested
rearrangements of machines, both short and long term, have been based on the work cells illustrated in
figure 30, chapter 5.1. CU – Improvement areas.
The first relocation of a machine is recommended to be the relocation of the dome robot. The dome
robot can be moved from its current location and placed closer to the kitting area, which also puts the
dome robot much closer to the other machines identified in the product family matrix as machines
suitable for the head cell. This relocation, to an area with less available space around the robot cell,
creates incentives to reduce the inventory for the dome robot. Either the inventory is reduced or the
transportation to go and get material will be significantly longer. The inventory does not need to be as
high as it is at the moment and the risk of making the material flow worse by this change is low.
Next the blast bunker is suggested to be turned 180 degrees. Since the blast bunker has a grounded
foundation, it is very hard and expensive to move it. By turning the blast bunker 180 degrees the
68
foundation can be still where it is today. Either the actual bunker can be turned, or the location of the
doors can be switched from one side to another. In addition to this the tumbler and the washer can be
moved from their current location to a location next to the fitting machines and blast bunker. In this
area several blasting machines will be located and the idea is that the operators working with blasting
can help each other out during the shift. The blasting machines do not need full attention from the
operator all the time and due to this, operators can help each other during the workday. Sometimes big
sheets need blasting in the blast bunker and often two operators are needed to move the sheets inside
the blast bunker. By having several operators in the same area this need of extra personnel is quickly
satisfied. It is also important to mention that the rearranging of the blasting and fitting machines also is
a good step towards the layout with work cells developed from the product family matrix.
The two small drilling machines, that today are located next to the tumbler and washer, will be moved
and placed next to the fitting machines. These two drilling machines are seldom used and their location
is not the most important matter in a material flow point of view. They are moved in order to free up
some more space in the area they currently are located at. This freed up space can for example be used
as storage of large pipes. Today around 50 large pipes are being stored outside in the parking lot
adjacent to the plant. This is not ideal and the company needs to find a place for these pipes inside the
plant. By doing this rearrangement of machines and inventories, a new area for pipe storage can be
created.
The lathe machine is today standing in the middle of several drilling machines that are used to process
tubesheets. Since the late machine is processing pipes and has more in common with machines that
process pipes it should be relocated to a position closer to them, which is on the opposite side of the
factory. In the new layout proposal, the lathe machine is standing in the pipe cell.
At last, as mentioned briefly in the previous chapter, after testing an idea in practice it was eventually
decided to recommend a welding booth to be installed in the CU. This welding booth, along with
rearranging the other machines linked to the head cell from the product family matrix, will enable a
smooth U-shaped material flow within the cell. This will also generate a small footprint of the cell on the
plant. However, the main advantage by this rearrangement is the removal of the unnecessary travel
back and forth between the CU and the SU for those products that currently need welding in both areas.
All of these suggested changes give a new layout, which can be seen in figure 32. The arrows in the
figure shows the movement of the workstations compared to the current layout.

69
Figure 32: The new layout based on the short term actions.
To summarize and compile all the different cost and benefits of the proposed short term actions,
detailed calculations have been carried out. The figures have been calculated through estimations from
managers and members of the maintenance crew which estimated the time it would take to do all the
necessary work. The financial controller at the site had information about the hourly rate of a blue
collar. Together with hourly rates and estimations of time it would take to do the implementation the
total costs could be calculated. The savings in WIP was done in the same way as in SU small, which can
be studied more in detailed in Appendix II. In table 12 the numbers from the result are presented.
Table 12: The quantified benefits and costs, generated by the recommended short term actions in the CU.
Benefits Costs
Reduced travel = $1482/year Reduced WIP = $725/year Reduced waiting time = 11 days/set of investigated components Avoidance of fee from pipe storage outside = Unknown
Rearranging blast bunker = $4000 Rearranging machines = $4570 Install welding booth = $476 Train worker to weld partition = $95
Total: $2138/year Total: $9141
The highest and most significant costs for the short terms actions are the rearranging of machines. This
is because it takes a lot of time and resources to complete this task. If these costs are looked into it
becomes clear that the rearrangement of the blast bunker alone stands for almost half of the costs. It
may be considered as high but it is an important part of the rearrangement and without it many of the

70
other suggested actions will lose their positive effects. The costs are also calculated with a conservative
mindset and it may turn out to be less costly.
The cost calculations in general may also seem a bit too high compared to the benefits. This leads to a
payback time that is rather high. Though, it is very important to keep in mind that all of these changes in
short term are very important steps on the way towards the long term proposal. The short term actions
are setting the direction towards a lean way of working and the true benefits can only emerge in the
long term. It cannot be stressed enough that all of the changes, both CU and SU, must be seen in a
holistic manner. They should not be seen as individual implementation projects with an individual
payback time.
5.1.3. CU – Long term proposal
The long term proposal for the CU is a more or less complete rearrangement of the layout. As
mentioned in the short term proposal the blast bunker is hard to move since it has a foundation in the
ground. Also the burno machine is hard to move and both the burno and the blast bunker are
considered to be stand-alone workstations. In other words, they are hard to categorize into a specific
group of machines, since many different components go through these work stations. Almost all of the
other workstations are relocated according to the work cells specified by the product family matrix in
chapter 5.1. CU – Improvement areas and figure 30.
Aspects that were considered when structuring the layout were to minimize unnecessary transport and
reduce as many of the crossing material flows as possible. The material flow is recommended to either
be straight or in the shape of an U. In both cases the goal should be to have as few interruptions as
possible in the flow.
It is recommended to move another welding booth from the SU to the CU and by that reduce the back
and forth travelling between the departments even more. The welding booth should be positioned in
the so called head cell. The workstations in this cell are suggested to be arranged in a U-shape, in order
to facilitate a smooth and efficient flow of the products passing through the workstations within the cell.
The fittings that eventually are linked to the large heads and that also were exposed to a lot of travelling
between the SU and CU are suggested to be manufactured completely in the CU, before sent over to the
SU for welding. Specifically, this means that the drilling of holes on the fittings will be carried out after
the fittings are cut out by the saw in the pipe cell.
Some equipment is not needed in the long term. Some jib cranes will be rearranged or removed to fit
into the new layout. A machine known as the hydraulic press will also be removed from the factory. An
upcoming project will adjust the way the plant is manufacturing certain components and this will make
the hydraulic press obsolete. This project is assumed to work as anticipated and the hydraulic machine is
therefore excluded from the layout about the future state.
A cage equipped with proper ventilation, to perform the PT-test in, will be bought and placed inside the
tubesheet cell in order to avoid unnecessary travel and to support an efficient material flow.
A complete view of the future state is displayed in figure 33.

71
Figure 33: The long term suggested layout for the CU.
The proposed changes all have costs connected to them. The benefits will be reduced silo behavior
between the workstations. Machines can be placed closer to each other and use space more efficiently.
This gives more available space. The future state proposals will also lead to reduced WIP and waiting
time, which in the end will lead to shorter lead times. Essentially the reduction of complex material flow
helps to reduce waste in many shapes and especially unnecessary travel.
5.2. SU – Areas of improvement The supply unit of the plant may not have as many crossing flows as the component unit when studying
the overall material flow from a helicopter perspective. However, within the individual areas of the SU
there exist several complicated flows and excessive ways of handling material. One example is
illustrated in figure 34.

72
Figure 34: An example of a bad material flow and procedure to handle the vessel.
The example in figure 34 highlights poor material handling of large vessels in an area with limited space.
The vessels in this flow are processed by many activities in several workstations even though they are
very large and heavy. Besides the safety risk of moving heavy units it takes time to move them. Even
though these movements are relatively short in distance they are still considered transportation, and
transportation is a waste. It is also not efficient to change the orientation of a large vessel the amount of
times illustrated in figure 34 and in an area with such limited space.
In SU small, the conditions of setting up a line based assembly process exists. There is a clear distinction
of product families and a relatively standardized way of manufacture the majority of the variants. To set
up one assembly line for product 1 and one assembly line for product 2, some rearranging of welding
booths need to be done. At the moment many of the welding booths are working in their own world
with poor knowledge about the order status in steps prior or after them. Due to this, units or WIP are
piling up before and after the stations.
Not only WIP is large in SU small, also the number of carts used to carry the material and WIP are high.
As illustrated in chapter 4.3.2. Supply Unit (SU), a lot of carts and baskets are used to carry out the same
work, which basically is to transport material. Especially inefficient is the use of first baskets and then
carts to move the vessel to the worktable.

73
Another inefficiency connected to SU small is the procedure of inserting copper tubes into products
within the category of product 2. This activity is carried out in workstation B1 but since the
circumferential welding is the next step in the manufacturing process, not all copper tubes can be
inserted. The one or two tubes closes to the edge will be damaged by the circumferential welding.
Therefore, the vessel is continuing its process after B1 with a few tubes missing until it gets to
workstation tube rolling. Before the operator in tube rolling can start working on the unit he or she has
to walk all the way back to B1 to fetch the missing copper tubes, walk back and insert them in the vessel.
This is an example of a typical non-value adding activity and pure waste.
A similar improvement area can be found in SU large where products from category 3 currently are
being assembled. As explained in chapter 4.3.2. Supply Unit (SU), an assembly line for these units have
been set up but not yet put into use. This is a typical example of when an improvement project has been
implemented but not sustained. This has resulted in product 3 being assembled in L1 but with material
being kept adjacent to the unused product 3 line, the operator has to walk back and forth to the line in
order to get and leave necessary equipment when assembling the unit.
By studying the image of the current layout in SU, figure 23 in chapter 4.3.2. Supply Unit (SU), the
tagging machine can be found in between the SU assembly departments. The tagging machine provides
all of the vessels with small metal plates or tags, describing the characteristics of the product. Since this
is an activity that without exceptions all of the products need to go through, it seems strange to place
this station in the middle of two flows. The current location of the tagging machine is creating a lot of
unnecessary detours, in particular for the units coming from SU small that has to go backwards after
being processed in workstation B3.
Many of the identified improvement areas are in the assembly lines in SU small and SU large, but there
is room for improvement in the finishing area as well. In the finishing area the large vessels are tested
twice; one time without heads and one time with heads, and there is a reason for this. If the vessel has a
leak on one of the copper tubes inside itself, it is not possible to detect which tube is leaking with the
heads assembled on the vessel. To avoid having to remove the heads, repair the tube leak and assemble
the heads back on; the large vessels are first tested without any heads and then with heads. If there is a
leak during the second test round it is obvious that it is a leak on the heads, since the rest of the vessel
already had passed the first test round, and this can be repaired without having to remove anything
from the vessel. The downside with this procedure is that the waiting time prior to the test station is
occurring twice instead of one time as would be the case if the head assembly would have been carried
out before the first test round.
Another way of working, linked to the head assembly, which generates waste is the system of storing
and retrieving the heads. As mentioned in chapter 4.3.2. Supply Unit (SU), the heads are stored on racks
along the wall on the short side of the factory. It is also mentioned that the heads are picked from these
racks by the personnel in the finishing department when needed. Since these racks are located a
significant distance from the head assembly area, the heads have to travel several meters every time it
is transferred to that area.

74
One of the most serious wastes is overproduction and by having an unbalanced assembly line some
stations are producing more than they need, causing a build-up of inventory before the other stations.
This is the case in the assembly lines in SU small and large where the amounts of available assembly
stations, or welding booths, do not reflect the required amount of workstations to match the yearly
demand.
In general SU large is characterized by many small movements, i.e. short distances, of very large and
heavy units. In addition to this, it occurs that orders go into assembly without having all of their
necessary components available. This results in units being put aside in the middle of its assembly
process to wait for the missing part, which can take a day or two, before it can continue.
Waiting for parts is also not an unusual occurrence in the SU small. However, in SU small the vessels are
much faster and simpler to manufacture and impact on this line is not as severe as to the line in SU
large. However, since this case study is focused on the development of a new layout and configuration
of material flows, the planning of orders has been considered to be out of scope. Further investigation is
necessary on this topic but by setting the layout and material flow the foundation of a complete solution
can be developed. This matter is also addressed with the expected installation of a new ERP-system. This
new system is scheduled to be up and running in the fall of 2016.
5.2.1. SU – Short term actions
This chapter will present the short term suggestions related to the SU. These suggestions are estimated
to be relatively easy to implement and can result in positive effects instantly if managed correctly. The
reasoning has been to focus on a few changes and make them care, instead of making too much at once.
These short term actions will namely work as the basis of the long term proposal.
The first suggestion involves rearranging the circumferential welding machines and some regular
welding booths in SU small. The outcome of the rearrangement will create conditions to have a line-
shaped flow for product 1 but in particular for product 2. The new design enables product 2 to be
assembled and transferred immediately to the next manufacturing step with negligible traveling. See
figure 35 for a layout with all short term action included. The highlighted booths in figure 35 are the
ones that have been rearranged.
The second improvement suggestion is simply to move the tagging machine from its current position to
the end of the aisle. The tagging machine is a rather small machine with wheels and can be moved to a
new position within a minute. By relocating the tagging machine, the units assembled in SU small can
travel straight down to the wall and turn for a straight flow towards the finishing area, eliminating the
backwards flow that occurs due to the present location. This change of position must be supplemented
with clear instructions of the new route to the operators moving the units from SU small to the tagging
machine. The arrow in figure 35 symbolizes the recommended movement of the tagging machine.

75
Figure 35: A layout of the SU with short term actions included.
Next suggestion addresses the excessive walking by the operator, in the station of tube rolling, in order
to fetch the few missing copper tubes in product 2. Instead of inserting almost all copper tubes in B1 the
entire set should be delivered directly to tube rolling, where all of the copper tubes should be inserted.
This procedure of inserting all copper tubes after all welding operations is already carried out for large
vessels and can be so for smaller vessels as well. The operator in tube rolling is also paid less per hour,
which makes this a more cost efficient solution. The operator in B1 can therefore focus on more
complicated and expensive work such as welding.
There is however one issue that needs to be resolved in order to succeed with this solution. A product 2
type needs to have two or three tubes inserted in order to align the components in each end of the
pipe. It is not a good idea to split the copper order and make the supermarket personnel deliver a few
tubes to B1 and the rest to tube rolling. This would only create more confusion and increase the
transportation. Instead it is recommended to have a few sets of dummy tubes with standard
measurements in B1. Two or three dummy tubes will then be inserted in B1 to align the components
and subsequently the circumferential welding machine in the booth next door welds the components on
each side of the pipe. Once this has been done the dummy tubes can be removed from the vessel and
returned to B1. Since B1 is located right beside the circumferential welder this will not add any extra
transportation. The vessel will then continue its manufacturing process and eventually pass the
workstation of tube rolling where all of the real copper tubes will be inserted.

76
Lastly it is suggested to start using the already installed product 3 line. The product 3 line facilitates
smooth manufacturing of this category without having to walk long distances to look for equipment. The
product 3 line will also reduce the WIP significantly and create some structure in the manufacturing
process since all assembly stations are placed right next to each other and not randomly spread over SU
large as in the current state.
Even though changes in lean manufacturing should not be evaluated individually, a basic attempt to
quantify the benefits and costs has been performed. The calculations have been made in a similar
manner as described in chapter 5.1.2. CU – Short term actions. Despite the advice against, the numbers
have been compiled because it will give some understanding about the costs and benefits that will arise
in the short term.
The short term actions are setting the direction towards a lean way of working. It cannot be stressed
enough that all of the changes, both CU and SU, must be seen in a holistic manner and so is the case
when calculating cost and benefits for the suggested strategy.
To summarize the benefits and the cost from the short term suggestion in the SU, see table 13. A full
view of the calculations resulting in the numbers in table 13 can be found in Appendix II.
Table 13: The quantified benefits and costs, generated by the recommended short term actions.
Benefits Costs
Reduced travel = $1070/year Reduced WIP = $1614/year
Rearranging welding machines and welding booths = $952
Total: $2684/year Total: $952
In addition to these quantified benefits of reduced travelling and WIP, the short term suggestions are
projected to generate reduced waiting time in SU small and increased transparency as well as
communication between stations in product 2 assembly line. Also some of the work in SU small is
moved to less expensive workforce, which is also a positive effect of the changes.
5.2.2. SU – Long term proposal
The general idea is to base the long term proposal on the short term actions presented in the previous
chapter. The only short term suggestion that is adjusted is the position of the tagging machine, which in
the long term proposal is recommended to be located in the test area. This could have been included in
the short term suggestion but at the moment too many vessels are piled up before the test area. The
tagging machine has in the past been in conjunction to the test area but due to the many vessels piled
up there, tags were attached to the wrong vessels. Therefore, it was not possible to perform this move
in the short term. However, in the long term, it is assumed that the planning and scheduling is under
control to ensure the amount of vessels in this workstation to be kept on reasonable levels.
Besides this; the short term suggestions are the foundation of the long term proposal, which can be
seen as a vision and something strive after. For instance, the workstations of tube trimming and tube
rolling are moved to the product 2 line created by the short term actions. By calculating the takt time

77
and applying line balancing on this line it became obvious that tube rolling and trimming could be
merged into one station. By setting up a station with both these activities right after the product 2 line,
conditions to a better as well as longer one-piece flow are created.
By balancing the other assembly lines, on the basis of the analogous takt time, changes are suggested in
them as well. The product 1 line only needs three assembly stations with one operator in each station;
pre-assembly A1, circumferential welding and primary welding A3. The category of product 3 will
continue to be assembled in the product 3 line as suggested in the previous chapter and similar to the
product 2 line, tube rolling and trimming will be incorporated in the end of the line. Additionally, since
the demand is relatively low for product 3 and the assembly time is relatively fast, only one operator is
needed in this line.
The assembly line for large vessels only requires one station of pre-assembly, L1, compared to the
existing setting of four of those stations. It is assumed that the new circumferential welding machine in
L2 will work as expected and the manual circumferential welding station will only work as backup in case
of breakdowns or to support L2 when demand is high. Next, more activities are suggested to be included
in the primary welding stations L3. The idea is to perform as many activities, linked to the large vessels,
in one station as possible. The large vessels are heavy, hard to move and the safety risk with every
movement is higher than for the smaller vessels. Since it is much easier to move people it is
recommended to have large vessels fixed in a single cell as much as possible and then move people to
that station to carry out the work. This is why cleaning, tube insertion, tube rolling and tube trimming
now are included in L3-cells. To balance the line, six work cells of L3 are necessary under the condition
that there can only be one operator in each cell. See figure 36 for full layout of the future state in the
SU.
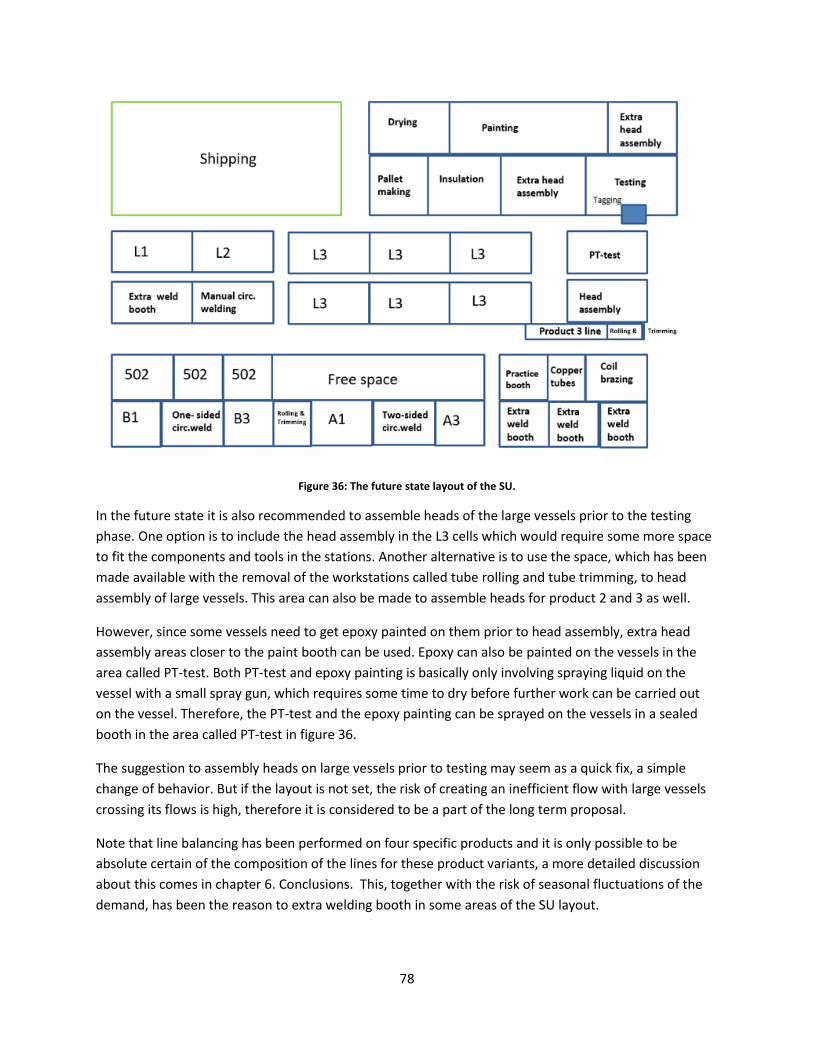
78
Figure 36: The future state layout of the SU.
In the future state it is also recommended to assemble heads of the large vessels prior to the testing
phase. One option is to include the head assembly in the L3 cells which would require some more space
to fit the components and tools in the stations. Another alternative is to use the space, which has been
made available with the removal of the workstations called tube rolling and tube trimming, to head
assembly of large vessels. This area can also be made to assemble heads for product 2 and 3 as well.
However, since some vessels need to get epoxy painted on them prior to head assembly, extra head
assembly areas closer to the paint booth can be used. Epoxy can also be painted on the vessels in the
area called PT-test. Both PT-test and epoxy painting is basically only involving spraying liquid on the
vessel with a small spray gun, which requires some time to dry before further work can be carried out
on the vessel. Therefore, the PT-test and the epoxy painting can be sprayed on the vessels in a sealed
booth in the area called PT-test in figure 36.
The suggestion to assembly heads on large vessels prior to testing may seem as a quick fix, a simple
change of behavior. But if the layout is not set, the risk of creating an inefficient flow with large vessels
crossing its flows is high, therefore it is considered to be a part of the long term proposal.
Note that line balancing has been performed on four specific products and it is only possible to be
absolute certain of the composition of the lines for these product variants, a more detailed discussion
about this comes in chapter 6. Conclusions. This, together with the risk of seasonal fluctuations of the
demand, has been the reason to extra welding booth in some areas of the SU layout.

79
Next improvement suggestion is to move the storage area of heads to the head assembly area. The
heads will be put into a new type of rack inspired by the image in figure 37. With this rack the heads are
stored vertically like weights in a gym rack. The heads can be moved with the overhead crane, reducing
the forklift driving in the head assembly area but foremost reducing the transportation between the
racks and the head assembly area. In the future the heads will be manufactured and moved to these
racks JIT but as a first step towards this situation, the heads can first be transferred to the current racks
for storage. In the beginning of each week the heads for the upcoming week’s orders will be moved to
the racks and made ready for head assembly. JIT will be included in the approach and vision of the
production.
Figure 37: An illustration of the new rack for heads.
When it comes down to the material carriers, the already installed cranes will still be useful in the lines.
By using cranes, the use of forklifts will be kept to a minimum, which from a safety perspective is good.
Furthermore, the double handling in SU small with baskets and carts as material carriers can be
eliminated by combining these two. See figure 38 for an image of this new material carrier.

80
Figure 38: A suggestion of a new material carrier in SU small.
This new material carrier is easy to move with the wheels from the cart and has the ability to store both
smaller components and WIP because of the basket with a shelf on top of it. The wheels also enable a
one-piece flow with products being rolled over to the next station in a smooth manner. By putting a cap
on the number of the carts in the assembly line a pull system is facilitated. The amount of carts
necessary for this, needs more investigation and is recommended as a future project. The goal should be
to eliminate the current cranes in the SU by performing all the work on these carts and rolling them
between assembly stations without moving the unit from the cart.
There is also an issue with the transportation of large vessels when they are on carts. The personnel are
then forced to push the carts with the heavy vessels and this is not ergonomic. A new material carrier is
proposed to be used in cases such as described, see figure 39. This new material carrier is actually used
in other Alfa Laval plants and is therefore proven to work.
Figure 39: The new material proposed to be used in SU large to move large vessels on carts.

81
All of the improvements presented in this chapter are sources of many benefits but also to some costs.
In order to be able to carry out as much work on large vessels as possible in a single cell, these cells need
to be fully equipped. This means investing in more cleaning and rolling equipment. Furthermore,
material to the new rack in head assembly area is needed and has to be purchased as well as put
together. Also new material carriers need to be purchased. Lastly machines and welding booths need to
be rearranged. A PT-test booth will actually also be a source of costs but since this booth is already
planned to be installed, the costs linked to this has not been considered.
The benefits are mainly the same as for the short term actions, but in a larger extent. The WIP will be
reduced even more. The same goes for the waiting time and travelling between stations. The space will
be used more efficiently and the balanced assembly lines will reduce the need for overtime as well as
needed man-hours per line in general. A more efficient layout with less waste will also, with the help of
new material carriers, facilitate a safer way of working and with better ergonomics for the workers.
5.3. Summary improvement proposal Due to confidentiality figures in this chapter are fictive and parts of the original content has been
removed/classified. However, the presented payback time and total lead time reductions are accurate.
Since lean manufacturing should be a holistic way of working, i.e. an improvement suggestion should
never be studied in solitude, the payback time are based on the combined benefits and costs from the
improvement suggestions. Table 14 presents the costs and benefits that have been possible to quantify
and the subsequent payback time.
Table 14: The projected costs, benefits and payback time linked to the long term future state proposal.
Compilation of projected costs, benefits and payback time:
Benefits = Benefits in CU + Benefits in SU = $278 432 + $279 632 = $558 064/year
Costs = Costs in CU + Costs in SU = $485 464 + $589 416 = $1 074 880
Payback time = $1 074 880/$558 064 = 1.9 years
Next table 15 is presenting the four product types with a lead time comparison. The lead time in the
current state is compared to the ideal lead time in the future, i.e. the lead time that is possible if all the
waste in the manufacturing process is eliminated.
Table 15: The current lead time to manufacture the four investigated products compared to the lead times in the future state.
Lead time comparison (days)
Product type Current state CU
Current state SU
Current total lead time
Future state CU
Future state SU
Future total lead time
Total reduction
Product 6 44,8 43,8 55,6 34 37,9 38,9 16,7
Product 3 42,5 40 49,5 33,2 33,8 34 15,5
Product 1 39,8 37 43,8 33,2 33,4 33,6 10,2
Product 2 44,4 39,5 50,9 33,3 33,8 34,1 16,8

82
Note that the future state lead times are the theoretically optimal times based on the four investigated
products. Further investigation concerning for instance capacity planning and other product variants is
recommended in order to get the full picture.
In addition to the stated costs and benefits, several soft benefits can be gained. In other words, benefits
that is hard to quantify but is equally important in a successful business. The benefits from lower lead
times are hard to quantify but the upside is evident. Lowering the lead times will most likely attract new
customers but also strengthen the relationship with current customers. A better relationship may result
in increased benefits from goodwill and new customers can make a big contribution to the company,
which will lower the payback time of the suggested investments even more.
Although it is hard to quantify benefits from a lead time reduction, estimations of it have been made
after discussing the matter with Alfa Laval. The benefits from the total lead time reductions in table 15 is
estimated to reduce the payback time to 0.4 years, see Appendix III for more details about the
calculations.
Additionally, the suggested layouts in CU and SU are both facilitating visual management and make it
easy for operators in corresponding manufacturing process to see how work is proceeding in other
stations. Moreover, the new layout enables better communication between the stations. The silo
mindset will be eliminated. All of the benefits will also be made with the safety in mind. Safety is a top
priority and many of the improvement suggestions assists in making the plant a safer place to work in.
All of the mentioned benefits can also be related to sustainability since they are improving both the
economics and the social factors of the plant. Several financial benefits have been mentioned and
benefits improving safety and ergonomics can be classified as social benefits.
A suggestion of the sequence of when the proposed improvements should be implemented are
illustrated in figure 40. The figure also highlights the kind of performance area that is improved by each
action. The performance areas taken into account have been cost, delivery, quality and safety. These
areas are the key performance areas to any Alfa Laval organization.

83
Figure 40: An example of the sequence the long term proposals can be implemented in. Key performance indexes that are affected positively by each activity are included in parenthesis in each text box.
5.3.1. Future state value stream map
The long term proposals in CU and SU can be interpreted into a high level future value stream map, see
figure 41. It is high level since the actual numbers in each data box need further investigation. The new
work cells in the CU, situated on the left side of the map, need to be balanced and each cell is
recommended as a future project of its own. The same goes for the assembly lines in the SU, situated on
the right side of the map, where the time measurements only have been fully determined on four
different products. However, the structure presented in figure 41 is something to strive towards and is
recommended to be the basis of the manufacturing processes in the future.
This value stream map also works mainly as an illustrative example, similar to the current state map in
figure 28, but this time with less complicated material flows. Instead of having each workstation working
as silos, cells and assembly lines are working together as one unit. Specific data is due to confidentiality
not included in the map; the main message of figure 41 is the simplicity compared to the current state
value stream map in figure 28.
The material from the CU are called upon by the supermarket by a production kanban system. The
supermarket is pictured in the middle of figure 41 with four identical symbols and a production kanban-
symbol is attached to the left of each supermarket symbol. The material is then being pulled from the
supermarket by the four assembly lines in the SU by the means of a withdrawal kanban system. The
withdrawal kanban-symbols, with classic pull symbols beneath them, are illustrated to the right of the
supermarket symbols.

84
Figure 41: Value stream map of the future state in the plant. Based on the four investigated product types.
5.3.2. Plan For Every Part (PFEP)
Once a future layout has been set and possible material carriers as well as methods to signal for material
has been developed; some sort of plan can be designed. This plan has been inspired by the concept
described in chapter 3.2.7. Plan For Every Part (PFEP), and tailored according to the objectives of this
case study. Every part considered to have an impact on the material flow in the factory has been
evaluated and included in the plan. This involves a description as well sequence of the workstations
every part is flowing through, the concept of how to signal for material, material carrier in the stations
as well as material carrier to transport the material to and from the stations. The outcome is a
comprehensive document with many rows of data. As an example of the data and structure in the
document, table 16 can be studied.

85
Table 16: An example of some parts in the Plan for Every Part.
Description of part or product
Workstations Description of workstation
Concept to call off for material
Material handling equipment in station
Material carrier between stations
Pipe, small 301 Saw cutting Production kanban
Overhead crane Trolley or cart
Pipe, small 304 CNC drilling Production kanban
Jib crane Trolley or cart
Pipe, small 408 IDOD blasting Production kanban
Jib crane Trolley
Product 1 N502 Picking/kitting Withdrawal kanban
Two-level cart with basket on lower level
Two-level cart with basket on lower level
Product 1 A1 Pre-assembly Withdrawal kanban
Two-level cart with basket on lower level
Two-level cart with basket on lower level
Product 1 A2 Circumferential welding
Withdrawal kanban
Two-level cart with basket on lower level
Two-level cart with basket on lower level
The sequence of the manufacturing is identified by the order the workstations are listed. In table 16 this
would mean that the small pipe first is entering station 301. Next it goes to 304 and 408 before it is put
into the supermarket, which has the denotation N502. Thereafter, when the product 1 line is signaling
for material, the components are transferred to A1 from the supermarket. In A1 product 1 starts to get
assembled. Next it is moved to A2 for circumferential welding, and so it continues through the entire
manufacturing process.
The purpose of the plan is to structure the material flow in the future state and to keep it visible to
everyone, which also will facilitate that the proposed improvements are sustained. This plan should be
considered the start of an even more comprehensive and detailed plan. For example, the methods of
how to signal for material can in the future be branched down into more specific examples of how to
call for more material and the product types can be branched down into variants.

86
6. Conclusions In this chapter conclusions, regarding the result of the case study in relationship with the stated purpose
and objectives of the Master thesis, are presented. Other findings during the study, which have not been
addressed in the proposals, will also be presented as examples of future projects. Also answers to
research questions and suggestions on further research are provided in this chapter.
6.1. Conclusions associated to the purpose and objectives In conclusion, an overall plan for the material flow has been developed to suit the Wood Dale factory.
This plan consists of a short term and a long term proposal, divided between the two main units of the
factory; the CU and the SU. The plan includes many lean tools and this is also the general focus of the
configuration of the short and long term proposals. For example; the layout has been designed to
minimize waste, inventories and unnecessary transport. The future state in the factory strives towards a
one-piece flow with Just-In-Time deliveries, which is consistent with a lean manufacturing philosophy.
Further the most significant products and processes of the Wood Dale factory have acted as base when
designing the improvement suggestions. Thanks to the product family matrix, different work cells have
been created and connected to products or components with similar processes. The matrix revealed
much useful information about the current state of the plant. Improvement areas in especially the CU
were exposed and could thereafter be addressed.
A detailed mapping and analysis of the current state was carried out. This current state analysis was
needed in order to develop a complete future state and solution design, therefore it was done in a
rigorous way and the analysis and mapping was a contribution to the overall analysis itself. Since there
was a huge lack of data as well as old and outdated data, the majority of the used data have been
primary data. In some cases, secondary data was also used to create an element of triangulation of the
sources. The credibility of the study is high due to large amount of primary data. Emphasize should be
put on the importance on collecting data of good quality and the experience from this case study is that
when you use respectable data the results becomes respectable as well.
The PFEP have been focused on an overall analysis rather than a very detailed analysis of each and every
work cell. The PFEP has mainly displayed information about material carriers, signal concepts between
work stations and description of the workstations linked to the investigated material flows. By listing the
workstations in the proper sequence to the material flow linked to each component or vessel, combined
with previously mentioned aspects, a nice structure of the material flow has been created and compiled
in one place. The plan is considered to work well as a first step towards a sustainable lean configuration
of the material flow. However, it is recommended that the plan is further developed in the future by
adding more detailed information about the different material flows. In general, the PFEP is considered
to be well aligned with theory.
As mentioned previously, the preferred future scenario has been divided into a long- and a short term
suggestion. The long term suggestion is a state that the employees of the factory should strive after, in
other words some sort of vision. The long term proposal has many minor steps in order to reach this
future state. Some of these steps are considered easier to implement than others and have been

87
categorized as short term actions. Every short term action is a small step on the way towards the desired
state. It is important to keep in mind that a holistic view of the transformation process is needed in
order to see the benefit of each and every new implementation. Many of the short term suggestions
may seem expensive when studied as an isolated activity but together and with a longer perspective the
benefits outweigh the costs considerably. This coincides well with Toyota’s philosophy to base decisions
on a long-term strategy, even at the expense of short-term financial goals. It is important to look at the
long-term benefits when conducting new proposals together with the management, and this approach
is similar to both TPS and this thesis.
Unnecessary transportation is one of the wastes according to TPS and lean manufacturing. This waste is
very present in the Wood Dale plant and by using a spaghetti chart all of the different material flows
were compiled in one figure. The spaghetti chart made it possible to identify if a flow was efficient or
not without a deep understanding of the entire web of flows. The design of the chart followed theory to
a high degree and by setting up a spaghetti chart, an understanding about the current layout was
gained. The material flows with plenty of unnecessary transportation could also be identified. In other
words, the spaghetti chart is an easy and yet powerful tool to identify messy flows with much
transportation, and can be used favorably when designing new production layouts.
According to TPS transportation is a waste and that became clear during this case. It was easy to
recognize and understand why unnecessary transportation is considered as waste by existing theory.
However, a reduction in transportation distances did not have as big impact on the cost side as first
anticipated. This is not that strange since even though transportation is a waste, the cost of
transportation might be low. Especially inside a factory where the distances are not particularly far to
begin with. Nevertheless, it is important to point out that a top class material flow is needed in order to
achieve an efficient factory. Therefore, reduction in transportation needs to be seen in a bigger picture
and as a part for the long term goal for the site.
To capture more types of waste than transportation a value stream map was constructed. When the
VSM was completed all of the transportation, waiting time, WIP and bottlenecks for every part was
visualized for everyone to see. This was a good tool because it made it possible to present to everyone
at the factory, from managers to operators on the shop floor, how everything was connected and how
the material flows actually were structured. Furthermore, a VSM of the future state was also
constructed. It displayed how the manufacturing processes could look like when all of the wastes had
been eliminated. It may not be possible to eliminate all of the wastes but the potential is visualized well
by the future state map and is something to strive towards. The value stream map is claimed by theory
to be an efficient tool of visualizing waste and this is further emphasized in this thesis.
The proposals of dividing the layout into cells is also well aligned with theory and TPS. The proposed
work cells were also visualized in a future state VSM, and the example of grouping products into the
same stage in a VSM is a common method noticed in other research as well. This is considered to be an
effective way of configuring a plant’s value streams.

88
A limitation in this case is that it only focuses on four different kinds of vessels in the factory. A complete
analysis might require a higher number of product variants. This would make a more solid analysis but
would also be much more time-consuming to carry out and the potential enhancements to the case
study are uncertain. Earlier in the report it is motivated and stated why these four types of vessels are
investigated and why there are only four of them. This motivation is considered to be sufficient but in
the future, if there is a wish to make further analysis, a higher number of variants in the factory could be
objects for an investigation.
The estimated benefits of the improvement suggestions, with consequential payback time of 1.9 years,
are claimed to be a good result and supports the proposed future state. The already acceptable result
becomes even stronger, with a payback time of 0.4 years, when adding the estimated benefits from the
lead time reductions. Reducing the lead time is a strategic goal for the plant in Wood Dale, a short lead
time is highly valued by Alfa Laval and most likely also by the customers on the market. Note that
several soft benefits such as improved safety and ergonomics have not been quantified, which
strengthens the suggestions even more.
6.2. Findings in need of further investigation The manufacturing of each and every pallet for every vessel that is being manufactured in the Wood
Dale factory is probably not a core competence of the company. When a vessel is finished in the Wood
Dale factory a pallet made to order for this specific vessel is manufactured. The necessity of this
procedure should be looked into when developing the plant towards the suggested future state.
It has to be kept in mind that some of the vessels are customized. However, it should most likely be
possible to have some sort of standardization of the palletizing process. One idea is to remove the
carpentry and purchase standard pallets. For example, use three standard pallets that fits the vast bulk
of vessels. In addition to these three standard pallets there could be another larger pallet that fits all
sizes, i.e. it will be used for the vessels that do not fit the three standard pallets.
If this is not possible one option is to keep the carpentry in a smaller scale and seldom manufacture
custom pallets. This should reduce the number of man hours needed in the carpentry, reduce space
needed for the actual carpentry and inventories connected to it. There will probably be a higher cost for
purchasing and sourcing of pallets but the benefits from reducing the carpentry area might be larger and
is worth investigating.
The investigation of the supermarket can be much more detailed than the one performed in this case
study. Is there really a need for a SM in the first place? In a long term perspective, if a true one-piece
flow is achieved, the material should flow directly from the CU to the SU with no intermediate stop in
between. Inventories is considered waste according to TPS and lean manufacturing, and storage in SM is
nothing else than a lot of inventory. However, in the short term or if there is a need of a smaller
supermarket in the long term the layout and usage can be investigated further. This could involve which
parts should be stored where and how much? Is the position of the racks arranged optimally? There is
available space on the top shelves, why is not that space utilized? There are many different areas to
investigate and each and every investigation can be turned into a small project of its own.

89
Even if a true one-piece flow probably never will take place in the Wood Dale factory, it is something to
strive towards. This is similar to what is advocated by Toyota and if the plant never manages to achieve
a one-piece flow, smaller batch sizes should be the goal. In TPS small batches is described as the
standard way of working, since a true one-piece flow is hard to achieve, and this agrees well with the
proposed improvements.
When an item number does not have a dedicated storage area in the supermarket, the operator simply
takes a post-it note and writes the new item number down and sticks it onto the box or pallet. This is
not a reliable system. If a post-it falls to the ground, it is hard to tell where it belongs and without a note
the operators will not know where the item is stored. This is a source for mistakes and will in the
extension contribute to the fact that parts can be missing and the system cannot tell if there are parts in
stock or not. Huge stocktaking events need to take place in order to keep control over parts that can be
missing due to lack of proper marking in the SM. This system needs to be reviewed and a new one is
recommended to be developed. In this case, the theories regarding 5S can come to good use.
An important issue that need further investigation and improvement is the occurrence of missing parts
in the manufacturing process. It is not unusual that parts are discovered to be missing when a vessel
already has started its assembly or welding phase. It is not clear whether the operator thinks all parts
are in order of if he or she knows that some parts are missing but starts anyway. Nevertheless, this leads
to high level of WIP and causes big delays. Space in the SU is occupied by vessels that are half finished
and cannot be worked on for some time. In the CU components need to be manufactured in a rush
which results in the intended work order being modified and the original planning being rescheduled.
Work that have been performed on a vessel that now is half finished could instead have been invested
in a vessel that had all the parts ready.
Missing parts in the process is a major planning issue and needs to be investigated further. One idea to
this problem could be to make it impossible to start with an order unless all parts are ready. Some kind
of signal system that clearly shows that some parts are missing should make it easy not to start unless
the work can be completely finished.
Another interesting arrangement in the plant is that the maintenance department is located in the
copper room. The copper room is basically the vault of the factory where the inventory of the highest
value is stored. Even though the storage of copper can be organized much more efficient, and then it
might be the case that the space dedicated to copper today is enough, it might need more space in
order to be stored in an efficient way. If this is the case it seems inappropriate to keep maintenance in
the copper room since it occupies a notable amount of space.
A lot of improvement can be made in the copper room. For example, a number of copper types have not
been used in several years and a few types are discovered to represent almost the entire usage of
copper. It should be possible to organize the copper tubes in a more efficient way. The types of copper
tubes that are used the most should probably have better locations compared to those units that are
not used that often. Units that are not used at all should be removed completely, or at least placed in
the least convenient locations.

90
The coordination between the two shifts in the SU are not always working. There are often
misconceptions between the first and the second shift. The first shift can for example leave a work
unfinished and argue that it is better if the operators on the second shift finish it as they please. The
operators in the second shift are on the other hand arguing that the operators in the first shift leaves
every problem to the second shift for them to solve. This can hopefully be solved if the coordination gets
better. It has to be clear what and when to do something. The second shift in the CU has a team leader
in place during both first and second shift while the SU only has it during the first shift. It could be
investigated further if it is suitable to appoint or hire a team leader to the second shift in the SU as well.
This may help to coordinate the workload between the two shifts more appropriately.
Lastly, when a head is assembled on a vessel it is assembled on a vessel standing in a horizontal manner.
The vessel also has to have a thin gasket between the head and the pipe, which sometimes is hard to
align with both the holes in the pipe and the head because of gravity. Yet, the assembling of gaskets and
heads could perhaps be carried out when the orientation of the pipe is in a vertical position. It could be
examined further if there exist equipment to support such an assembly and if it is financially beneficial.
6.3. Answers to research questions The research questions for this report were first presented in chapter 1.3.1. and here the answers to
these questions will be presented.
How should lean methods be applied on the operations of a company, who have not been
previously exposed to a structured way of working with lean manufacturing?
The recommendation is a stepwise introduction towards a long term goal. Decisions should not be
based solely on the cost and benefit from a particular investment or implementation, instead the
desired long term state need to be kept in mind. The result from this case study shows that short term
actions may seem costly when studying them as isolated activities but in a longer perspective they all
contribute to great benefits. Even a small improvement can have a big impact on the material flow and
plays an important part in the end. In other words; emphasizes should be put on a holistic way of
transforming the operations of the plant and to convey this throughout the concerned organization. This
is in line with the theory described in the theoretical framework presented in chapter 3.
Another aspect that influences how methods should be applied is the communication with the
personnel on the shop floor. During the investigation of this case study it was crucial to keep a dialogue
with the people on the shop floor. They have the most detailed knowledge about their own work area
and will be responsible of the work in that area if the suggested improvements are implemented.
Therefore, it is wise to establish ideas among the workforce in an early stage and ensure that the people
on the shop floor know why there will be a change of the working process.
It is sensible to start with selecting one area or work cell and make that area shine. This will make it
easier to convince others that the proposed changes will lead to an improvement. It can also be seen as
an opportunity to find out what is working, and what is not, in that specific area and then the lessons
can be brought on to the next work cell that needs transformation.

91
However, before any improvement suggestions can be developed a thorough analysis is needed. It is
recommended to start with a Pareto-analysis to identify which products affects the operations of the
company the most. To gain the most from lean manufacturing, these products or product groups should
be the main focus when developing a proposal of a future state. Although the Pareto-analysis is
mentioned as valuable by existing theory, the usefulness of it can be emphasized even more. In this
study, where the production setting was complex with many different variants, the Pareto-analysis
enabled an efficient study and allocation of resources.
It is important to present the result from the analysis in a visual manner, in order to make everyone
aware of the improvement areas and to understand them. Two tools that made this possible, in this
case study, was the product family matrix and the value stream map.
The product family matrix was very useful since it made it clear how machines should be arranged in
order to minimize travelling distance. The product family matrix was not used completely in line with
theory. Much of the theory states that a product family matrix should be used to identify product
families, which later can be used in a value stream map. Alfa Laval in Wood Dale already had a solid
grasp of their product families and in that sense, the matrix was merely used to verify this. The matrix
was much more useful as a map to identify resources that shared the same material flow and how they
should be arranged in order to create a leaner layout. A lot of room for improvement was identified and
above all; by transferring the results to a drawing of the current layout, it was made visual for everyone
studying it. The value of a product family matrix, when developing a manufacturing layout, is recognized
in this thesis as more valuable than what is interpreted from existing theory.
The value stream map was also useful and the design of it was well aligned with theory. The current
state map was of course tailored according to the needs of the Wood Dale plant and the future state
map can be further developed, but in general it followed the same structure as described in the
theoretical framework. Also, the method of using a few common products and then generalize the
results to entire products groups is aligned with theory. However, one difference compared to theory
was that the current state map combined several value streams instead of only displaying one. If time
and resources is available to do a high level visualization of all the value streams in a VSM it is
recommended to perform such a visualization. This study illustrates that by including all of the value
streams, the complexity and silo behavior can be captured in a factory that has not previously been
exposed to lean manufacturing.
To address the waste of overproduction and an unbalanced workload among the manufacturing
processes the concept of line balancing is important. The case company revealed that it was most
beneficial to use line balancing on the assembly lines since they were consisting of a straight flow of one
product type while the component manufacturing area consists of many complex value streams that
sometimes share a resource and sometimes not. The component manufacturing should instead use the
information from the product family matrix to sort out its different processes before line balancing can
become relevant. The balancing of the assembly lines has been made with existing theory in mind and
the suggestions influenced by this method is also aligned with the theory.

92
What are the key variables to consider when aligning the operations, of a recently acquired
company, with lean manufacturing?
One major variable to consider is the level of awareness, of lean manufacturing, at the site from the
start. Have any other lean projects occurred recently? In Wood Dale the awareness has been improved
significantly over the last years, since Alfa Laval started to transform the site. If no one knows the
concept of waste and has never heard about TPS or lean manufacturing, the first thing to do is to explain
it to the people at the plant, and especially to people in management positions, and how it can improve
the performance. On the other hand, if a lot of lean transformation practices and events already have
occurred and the knowledge is high among the staff, the work should be more focused on fine tuning
the improvements. It is recommended to coordinate all the work and improvements with a long term
perspective in mind and to achieve positive synergies from different activities, i.e. to use a holistic view
and a long term vision for the entire site.
If everything seems to work out well and people at the factory do not see any areas that can be
improved further, the situation is probably something else. As long as you are not situated as the best
performing factory in the world, there exists a factory somewhere else that is performing better; i.e. it is
possible to improve any factory in the world, even if it is considered to be state of the art in lean
manufacturing. Most definitely the world’s leading factory also have some areas that work better than
others and if they are not constantly seeking to improve its operations they will most likely not be world
leaders much longer. This is best described as continuous improvements by the TPS and if this is not
addressed and communicated throughout the factory, the risk of the company not being able to keep up
with its competition may increase. Without continuous improvements the company will also have
difficulties to sustain benefits from already finished improvement projects.
When it comes to which changes or implementations that should be focused on budget, available time
and resources are key variables to consider. The best thing is of course to use some kind of leverage
implementation that does not cost that much or take too long time to implement, but nevertheless will
have a major impact on the performance of the factory. The Pareto-analysis serves this purpose well
since it displays the volumes, e.g. cost or quantity, of the products being manufactured in a factory. In
Wood Dale it was also necessary to have the economy in mind when designing a future state. For
instance, some machines were considered too expensive to move in order to get a tolerable payback
time.
6.3.1. The framework
When performing a case study of Alfa Laval in Wood Dale a set of different tools and lean concepts were
applied to the plant. How they should be applied and the key variables to consider when applying have
been discussed in the previous chapter. All of these tools and concepts have been put together in a
framework of how to apply them in relation to the process of the case study, see figure 42.

93
Figure 42 and the illustrated sequence of activities can be supplemented with an overall directive of
encouraging continuous improvements.
The framework displayed in figure 42 was the approach to this study and it can be discussed whether it
is possible to generalize it for future use. A single case study may not be enough to determine a
universal framework of how to incorporate lean methods on a recently acquired factory. To attain
higher certainty supplementary case studies or a longitudinal study on the Wood Dale plant is
recommended. With that said; we are convinced that even if the entire framework may not always be
the best approach to every factory, there will most likely always be elements in it that will be useful.
According to each plant’s specific needs, different elements in the framework can be highlighted more
than others.
A company should be able to keep track of its products and resources and a product family matrix is a
great way of achieving control of this. To quickly get an understanding of a plants different
manufacturing processes and identifying improvement areas, a value stream map is suggested. It will at
least be useful to map the current state. Depending on the specific conditions of each factory the
solutions may be developed differently but we believe that even a basic future state map has some
value. It is recommended for a company to have its goal visualized and a future state VSM is providing
this.
6.4. Future research It is clear that more research can be conducted at the Wood Dale site. As stated previously many areas
of the site can be improved. This also includes future research within those areas. There are also many
other topics, which it is not brought up in this report, that can be investigated further. A future analysis
Start-up phase
Data gathering
Analyzing the data
Solution design
Testing of ideas
Conclusions
Pareto-analysis Long term
proposal
Establish
ideas on the
shop floor
Current state
value stream
map
Product family
matrix
Future state
value stream
map
Evaluate level of
understanding
awareness of lean
manufacturing Short term
actions
Figure 42: Process of how lean changes can be developed in the Wood Dale plant.

94
could for example have a much more detailed focus on a company’s operations or it could change focus
to the office environment and administrative processes.
Future research can for example discuss a more detailed layout in each work cell or assembly line. The
research may even investigate settings in individual workstations. One suggestion is to, in more detail,
investigate how to signal for material between workstations, i.e. how the production kanban and
withdrawal kanban should be set up in practice. Another one could be to investigate how and if line
balancing should be applied on work cells in a company striving towards lean manufacturing.
How to signal for more material also coincides with the planning system of the company, since a proper
planning of orders and raw material should facilitate a lean and pull-based material flow. Future
research can be conducted on planning of orders and capacity planning in each workstation. However,
keep in mind that the plant in Wood Dale is getting a new ERP-system in the upcoming fall and future
research need to consider this system if new suggestions are developed specifically to the Wood Dale
site.
Also the work in the office side is open to investigate. Reduction of waste may also be important in this
area. Aspects to look into could be how the business transaction is done and how the drawings for each
work order is done. Administrative processes require a lot of resources and efforts as well.

95
7. References Ab Talib, M. S., Hamid, A. B. A. & Too, A. C., 2015. Critical success factors of supply chain management: a
literature survey and Pareto analysis. EuroMed Journal of Business, 10(2), pp. 234-263.
Aghazadeh, S.-M., Hafeznezami, S., Najjar, L. & Huq, Z., 2011. The influence of work-cells and facility
layout on the manufacturing efficiency. Journal of Facilities Management, 9(3), pp. 213-224.
Alfa Laval, 2015. Alfa Laval: About Us. [Online]
Available at: http://www.alfalaval.com/about-us/our-company/
[Accessed 11 09 2015].
Anon., 2015. University of Michigan, Michigan Engineering. [Online]
Available at: http://liker.engin.umich.edu/
[Accessed 25 10 2015].
Anon., n.d. Lean Enterprise Institute. [Online]
Available at: https://www.lean.org/lexicon/supermarket
[Accessed 17 12 2015].
Anon., n.d. Six Sigma Material. [Online]
Available at: http://www.six-sigma-material.com/Spaghetti-Diagram.html
[Accessed 17 12 2015].
Berglund, F., 2015. Operations Development Manager, Region US, OD US [Interview] (26 10 2015).
Bhamu, J. & Sangwan, K. S., 2014. Lean manufacturing: literature review and research issues.
International Journals of Operations & Production Management, 34(7), pp. 876-940.
Bhasin, S., 2012. An appropriate change strategy for lean success. Management Decision, 50(3), pp. 439-
458.
Chapman, C. D., 2005. Clean House With Lean 5S. Quality Progress.
de-Arbulo-Lopez, P. R., Fortuny-Santos, J. & Cuatrecasas-Arbos, L., 2013. Lean manufacturing: costing
the value stream. Industrial Management & Data Systems, 647-668(5), p. 113.
Emiliani, M. & Stec, D., 2004. Using value-stream maps to improve leadership. The Leadership &
Organization, 25(8), pp. 622-645.
Erlach, K., 2013. Value Stream Design - The Way Towards a Lean Factory. 3rd ed. Stuttgart: Springer
Verlag.
Fischer, M., 2007. Strengthening the Empirical Base of Operations Management. Manufacturing &
Service Operations Management, 9(4), pp. 368-382.

96
Golicic, S. L., Davis, D. F. & McCarthy, T. M., 2005. A Balanced Approach to Research in Supply Chain
Management. In: H. Kotzab, S. Seuring, M. Müller & G. Reiner, eds. Research Methodologies in Supply
Chain Management. New York: Physica-Verlag, pp. 15-30.
Halldórsson, Á. & Arlbjørn, J. S., 2005. Research Methodologies in Supply Chain Management – What Do
We Know?. In: H. Kotzab, S. Seuring, M. Müller & G. Reiner, eds. Research Methodologies in Supply
Chain Management. Heidelberg: Physica-Verlag, pp. 107-124.
Harris, M., 2004. Lean Enterprise Institute. [Online]
Available at: www.lean.org/library/the_plan_for_every_part.doc
[Accessed 2 12 2015].
Hines, P. & Rich, N., 1997. The seven value stream mapping tools. International Journal of Operations &
Production Management, 17(1), pp. 46-64.
Karuppusami, G. & Gandhinathan, R., 2006. Pareto analysis of critical success factors of total quality
management: A literature review and analysis. The TQM Magazine, 18(4), pp. 372-385.
Lee-Mortimer, A., 2006. A lean route to manufacturing survival. Assembly Automation, 26(4), pp. 265-
272.
Liker, J. K., 2004. The Toyota Way: 14 Management Principles from the World's Greatest Manufacturer.
s.l.:McGraw-Hill.
Matawale, C. R. & Datta, S., 2015. Leanness metric evaluation platform in fuzzy context. Journal of
Modelling in Management, 10(2), pp. 238-267.
Menachof, D. A., Gibson, B. J., Hanna, J. B. & Whiteing, A. E., 2009. An analysis of the value of supply
chain management periodicals. International Journal of Physical Distribution & Logistics Management,
39(2), pp. 145-166.
Meredith, J., 1998. Building operations management theory through case and field research. Journal of
Operations Management, Volume 16, pp. 441-454.
Murugaiah, U., Benjamin, S. J., Marathamuthu, M. S. & Muthaiyah, S., 2010. Scrap loss reduction using
the 5-whys analysis. International Journal of Quality & Reliability Management, 27(5), pp. 527-540.
Olhager, J., 2013. Produktionsekonomi. Lund: Studentlitteratur.
Olhager, J., 2015. Introduktionskurs till examensarbeten inom teknisk logistik. Lund: s.n.
Rother, M. & Shook, J., 1999. Learning to See - Value Stream Mapping to Create Value and Eliminate
Muda, Brookline: The Lean Enterprise Institute.
Sanders, R., 1992. The Pareto Principle: its Use and Abuse. Journal of Product & Brand Management,
1(2), pp. 37-40.

97
Singh, B., Garg, S., Sharma, S. & Grewal, C., 2010. Lean implementation and its benefits to production
industry. International Journal of Lean Six Sigma, 1(2), pp. 157-168.
Singh, B. & Sharma, S. K., 2009. Value stream mapping as a versatile tool for lean implementation: an
Indian case study of a manufacturing firm. Measuring Business Excellence, 13(3), pp. 58-68.
Singh, H. & Singh, A., 2013. Application of lean manufacturing using value stream mapping in an auto-
parts manufacturing unit. Journal of Advances in Management Research, 10(1), pp. 72-84.
Spens, K. M. & Kovacs, G., 2006. A content analysis of research approaches in logistics research.
International Journal of Physical Distribution & Logistics Management, 36(5), pp. 374-390.
Stone, K. B., 2012. Four decades of lean; a systematic literature review. International Journal of Lean Six
Sigma, 3(2), pp. 112-132.
Stuart, I. et al., 2002. Effective case research in operations management: a process perspective. Journal
of operations management, Volume 20, pp. 419-4333.
Toyota Motor Corporation, n.d. Just-in-Time — Philosophy of complete elimination of waste. [Online]
Available at: http://www.toyota-
global.com/company/vision_philosophy/toyota_production_system/just-in-time.html
[Accessed 2 12 2015].
Vinodh, S., Somanaathan, M. & Arvind, K., 2013. Development of value stream map for achieving
leaness in a manufacturing organization. Journal of Engineering Design and Technology, 11(2), pp. 129-
141.
Voss, C., Tsikriktsis, N. & Frohlich, M., 2002. Case research in operations management. International
Journal of Operations & Production Management, 22(2), pp. 195-219.
Vrat, P., 2014. Materials Management - An integrated Systems Approach. 1 ed. New Delhi: Springer
Verlag.
Yin, R. K., 2009. Case Study Research: Design and Methods. 4 ed. Los Angeles: SAGE Publications, Inc.

98
Appendix Due to confidentiality figures in this chapter are fictive and parts of the original content has been
removed/classified. In some cases, the real figures have been removed and replaced with “xxx”, to still
be able to read how the calculations were carried out. In other cases, the figures have been manipulated
in order to not reveal any confidential material. However, the only information that is authentic is the
total savings from reduced WIP in Appendix II and the payback time displayed in table 18 Appendix III.
Appendix I – Questionnaire
General questions
What are your main responsibilities, on a daily routine and on a more long-term basis?
How do you know what to do and when to do it?
What are the major problems in the factory?
What do you think are the biggest issues with the material flow in the factory?
How is the procedure of the planning process?
How would you like the layout to be (instead)?
Questions asked to each workstation
What kinds of products are manufactured in this station?
What kinds of components are you using in this area?
How much work-in-progress do you have in your area?
What kinds of material flows is your area affected by?
Where is the required material coming from, and where is it going when finished?
How is the information flow in your area?
What do you consider is the major problems in your area?
How many shifts are there in this area?
How many operators work in this work cell?
How many operators work with each machine?
What equipment do you use to handle the material in this cell?
How would you like your station to be arranged in the future in terms of layout and material
flow?

99
Appendix II – WIP Calculations
Calculating distances
All distances have been measured in the CAD program AutoCad. In AutoCad it was possible to measure
distances in the factory layout. With the estimation of travel limit of 4 km per hour and the information
of cost per worker, it was then possible to calculate how much each hour of travel was worth, i.e. it was
possible to calculate the potential savings from less travel.
Calculating WIP in SU Small – B1, B3 and L3
When calculating the new WIP after the machines in SU small has been rearranged the following
procedure was done:
The three machines – B1, B3 and L3 – were relocated in the layout so that they were standing
next to each other.
Estimation was done considering deliveries from the SM. It was assumed that the delivery was
done once a day and then production for that day was delivered.
No WIP more than the delivery from the SM was considered, thanks to machines standing so
close to each other only the units that are in the actual machines/welding stations are WIP, i.e.
no WIP between the stations will exists. The only WIP is the delivery of one day’s WIP to B1. This
WIP can of course be considered to be spread out over the three work stations.
L3 takes longest time, xxx minutes, and therefore this is the bottleneck of the line. This work
stations decides the production rate of the line.
Calculations
Three work stations are investigated. One of them has a higher cycle time than the others, this is xxx
minutes. Therefore, station xxx is the bottleneck of the line and the work stations that determines the
capacity of the line. This cycle time for station xxx is xxx minutes. The takt time for product 2 is xxx
minutes. It means that each xxx minute one product 2 should start producing, or the production should
be xxx units per hour. The following calculations were done:
Total production of xxx per shift (one shift is xxx h):
Equation 2
xxx ℎ
𝑠ℎ𝑖𝑓𝑡 ∗ xxx
𝑢𝑛𝑖𝑡𝑠
ℎ = xxx 𝑢𝑛𝑖𝑡𝑠/𝑠ℎ𝑖𝑓𝑡
This is rounded up to xxx units.
When considering the WIP it is assumed that two deliveries from supermarket is done each day and that
units are processed in the three stations. The average WIP should be the delivery divided by two, in
theory. To get some buffer in the practical arrangement it is possible to just count the maximum WIP as
the WIP that will exist in the future. Therefore, the potential savings will most definitely be even bigger.

100
Counted snapshot of WIP were xxx units.
Total reduction in WIP is xxx %.
The value of each WIP vessel in these stations is xxx $ (when it hits the work station in question). Before
the total value was xxx $ and after the rearrangement of machines the total value was xxx $. Of course
this is a reduction with the same percentage, xxx %.
Calculated of the company’s interest rate for 2015, which is xxx %, the total savings per year thanks to
reduction in WIP then becomes: xxx ∗ (xxx − xxx)$ = 1614 $

101
Appendix III – Lead time calculations Regarding the lead time; it is very hard to known for sure how much impact a reduction in lead time will
be monetarily. Of course there are much gains from reduction in lead time and a more stable lead time.
For example; increased competiveness, decreased risk of fees or loss of customers due to late deliveries,
opportunities to gain market shares, chances to rise the margins and earn more money on each product
sold and much more.
All these benefits leads to a value that have to be considered in the calculations in this report. There is
no given rule how to calculate these matters and no information at the site shows how calculations,
regarding earnings of a reduced lead time in the past, should be done. Therefore, the savings due to
reduced lead time have to be estimated. It is hard to do it exactly and it is preferred to calculate rather
too low than too high, to get some margin in the calculations.
To be able to calculate the value of the reduction the following estimation is done: A reduction in lead
time leads to increased selling price by half of the reduction. A reduction of X % in lead time was
considered to gain 𝑋
2 % in increased selling price. If the lead time for a product is reduced by 20 % the
corresponding selling price for that product will be 10 % higher. For example, this leads to a product that
today has a price of 1 000 $ and a lead time of 10 weeks and after the reduction has a 7 weeks long lead
time (reduction 30 %) will have a new price of 1 150 $ (increased 15 %).
See table 17 for the product studied in this report.
Table 17: Estimations on how much lead time reductions are worth for each investigated product.
Lead time today (days)
Selling price today ($)
Reduction in lead time
Increased price in
Increased price ($)
Product 6 55,6 199 856 74 % 37 % 73 944
Product 3 49,5 10 016 94 % 47 % 4 704
Product 1 43,8 8 144 94 % 47 % 3 824
Product 2 50,9 10 968 94 % 47 % 5 152
Total increased income, based on number of units sold, is: 2 115 784 $. See table 18 for payback time
when reduction in lead time has been taken into account.
Table 18: The projected costs, benefits and payback time linked to the long term future state proposal.
Compilation of projected costs, benefits and payback time:
Benefits = Benefits in CU + Benefits in SU = $278 432 + $279 632 + $ 2 115 784 = $2 673 848/year
Costs = Costs in CU + Costs in SU = $485 464 + $589 416 = $1 074 880
Payback time = $1 074 880/$2 673 848 = 0.4 years

102
Once again, this are all based on estimations. The estimations can be way too low, or too high. Hopefully
they are rather too low than too high but since this is a very hard task to estimate the risk of these
calculations are quite high and it is important to keep that in mind when investigating further.

103
Appendix IV – Spaghetti chart with color coding See figure 43 below for a complete overview of the spaghetti chart. In this appendix the different
meaning of each color can also be studied, in order to completely understand the spaghetti chart.
Figure 43: Complete spaghetti chart of the factory.
CU
Large tubesheet
Small tubesheet
Fittings/couplings
Small pipe
Large pipe

104
Large heads
Large ring for large head
Large fitting for large head
Dome
Small head
Support/baffle
Small ring for endplate
Hanger
Base plate
Bracket
Deflector
Pickup tube
Endplate
SU
Product 6
Product 1
Product 2
Product 3
Copper tube
Copper coil