improving accuracy and precision of calculated … · improving accuracy and precision of...
TRANSCRIPT
IMPROVING ACCURACY AND PRECISION OF CALCULATED PROCESS VARIABLES BY USING DIRECTLY MEASURED NONSUGARS
Jeffrey L. Carlson Gregory W. Golovanoff
Kenneth A. Kubat Minn-Dak Farmers Cooperative
7525 Red River Road Wahpeton, NO 58075
Introduction
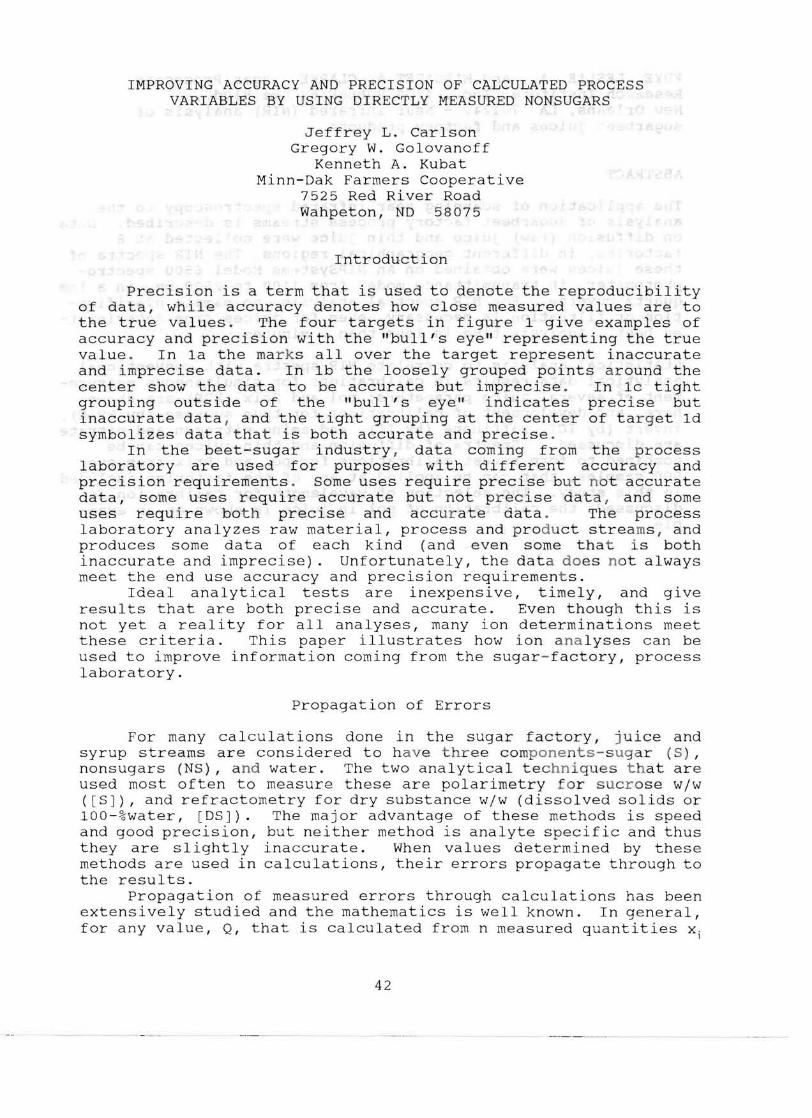
Precision is a term that is used to denote the reproducibility of data, while accuracy denotes how close measured values are to the true values. The four targets in figure 1 give examples of accuracy and precision with the "bull's eye" representing the true value . In Ia the marks allover the target represent inaccurate and imprecise data. In Ib the loosely grouped points around the center show the data to be accurate but imprecise . In Ic tight grouping outside of the "bull's eye" indicates preclse but inaccurate data , and the tight grouping at the center of target Id symbolizes data that is both accurate and precise .
In the beet-sugar industry , data coming from the process laboratory are used for purposes with different accuracy and precision requirements . Some uses require precise but not accurate data, some uses require accurate but not precise data , and some uses require both precise and accurate data . The process laboratory analyzes raw material, process and prod uct streams , and produces some data of each kind (and even some tha t is both inaccurate and imprecise). Unfortunately, the data does n o t always meet the end use accuracy and precision requirement s.
Ideal analytical tests are inexpensive, timely, and give results that are both precise and accurate. Even though this is not yet a reality for all analyses, many ion determinations meet these criteria. This paper illustrates how ion a na lyses can be used to improve information coming from the sugar- factory, process laboratory.
Propagation of Errors
For many calculations done in the sugar factory, ju ice and syrup streams are considered to h ave three components-s ugar (S) , nonsugars (NS), a nd water. The two analytical techniques that are used most often to measure these are polarimetry fo r s u c r ose w/w ([SJ), and refractometry for dry substance w/w (dissolved solids or IOO-%water, [DSJ). The major advantage of these methods is speed and good precision, but neither method is analyte specific and thus they are slightly inaccurate. When values determined by these methods are used in calculations, their errors propagate through to the results.
Propagation of measured errors through calculations has been extensively studied and the mathematics is well known. In general, for any value, Q, that is calculated from n measured quantities x·
42
1

such that Q = Q(x"xZ 'x3 , ••• ,xn) and each measurement differs from its true value, fL i , by and amount Bi , (Bi = Xi - fL i ), the error in the calculated value BQ can be estimated by equation 1. Most often, B. is not known, but by using estimates of the
1uncertainties, E . , and a derivation of equation 1, a good estimate of B
Q, EQ can be lcalculated (equation 2)'
(1 )80 =( :~ )81 +( :~ )82 + ... +( :;n)8 n
2 0 0 2 00 2 00 2
)2 ()2 ()2 (2 )€ Q= ( OX €1+ OX € 2 + "' + OXn € n
1 2
The equations for calculating both [NS] and E [N S) are shown (equations 3 and 4) If it is assumed that the two uncertainties0
are independent and equally likely to be positive or negative the cross term (2 E [N S) E [S]) will be zero. These equations show that the absolute uncertainty for [NS] will always be of the same order of magnitude as the largest of the uncertainties from [ OS] and [S] (Table I).
[NS] = [DS] - [S] (3)
(4 )€[NS] =.j€1DS] +€1 s ]-2€[NS] € [S]
Probably the most fre.quently used quantity for sugarprocess evaluation is purity (P) ~ purity is the percentage of [OS] that is sugar (equation 5) and its relative error is calculated with equation 6. The relative uncertainty of the calculated purity value will always be of the same order of magnitude as the largest of the relative uncertainties from which it is calculated (Table I)
Pur i t y = [S] ( 5)[DS]
( 6)
Use of Specific Nonsugars in calculating Crystallizations
An example of how sUbstitution of an ion concentration for [NS] improves data can be given with the sugar elimination equation. When this calculation is used to evaluate pan and
43

Table I: Propagation of Errors from Measured [ROS] and [S] to Calculated [NS] and purity.
Measured Ca l c ulated
Values
RDS S NS Purity Thin Juice 17.2 15.7 1.5 91.3 A-Pan Mass 91. 0 84.6 6.37 93.0 A-Green 80.0 68.8 11. 2 86.0 Molasses 80.0 44.8 35.2 56.0
Absolute Error
ROS S NS Purity Thin Juice ± 0.2 ± 0.2 ± 0.3 ± 1.6 A-Pan Mass ± 1.0 ± 1.0 ± 1.4 ± 1.5 A-Green ± 1.0 ± 1.0 ± 1.4 ± 1.6 Molasses ± 1.0 ± 1.0 ± 1.4 ± 1.4
Relative Error
ROS S NS Purity Thin Juice ± 1.2 ± 1.3 ± 19 ± 1.7 A-Pan Mass ± 1.1 ± 1.2 ± 22 ± 1.6 A-Green ± 1.4 ± 1.5 ± 13 ± 1.9 Molasses ± 1.4 ± 2.2 ± 4.0 ± 2.6
crystallizer performance it is known as percent gross crystallization (%GC). The %GC is the amount of sugar crystals produced (w/w) as a percent of the total sugar in a syrup . It is generally calculated using equation 7 where P and P are the massecui te (or feed) and green syrup pur i tie~ resp~ctively2.I
Substitution of [S] + [NSJ for [OS] in this equation followed by simple algebraic manipulation results In the mathematically equivalent equation 8.
An assumption implicit in %GC calculations is that the absolute amount of nonsugars does not change during crystallization. This assumption should be very good as there is little destruction of sucrose or nonsugars during this process.
10 I 000 ( Pm - Pgl % GC = (7)
Pm (100 - Pgl
[51 g [N5] m]% GC -100X[ 1 - (8)
[5] m [N5] g
44

2 2 2p; __2_P_m_P",g + PmPg
1 00 1 0000
(9 )
Just as the errors in the [OS] and [S] values propagate to the purity value, so will the error in purity propagate to the %GC calculation (equation 9). An example can be made using the purity and error values from Table I in equations 7 and 9. The resultant %GC is 53.8 with an absolute error of 12.3 % or a relative error of 22.9 %.
The high absolute error results primarily from the two subtractions where the absolute error for each is large with respect to the differences. The larger the purity drop between the massecuite and syrup, the larger the difference in the numerator. Thus, the magnitude of error in the %GC calculation will diminish with greater purity differences. Also, because of the difference in the denominator, the lower the purity of the green syrup, regardless of the mass purity, the smaller the error for a given error in purity.
Equation 8 gives an alternative method for calculating %GC. However, the [NS] values as calculated from equation 3, are determined from the same [OS] and [S] values as the purity. Thus, use of these [NS] values in equation 8 gives the same result and error as use of purities in equation 7.
Since the % GC calculated from equation 8 uses the [S] and [NS] ratios in the massecuite and the green syrup, their actual values are not needed, just numbers that are proportional to the actual values. This means that any specif ic nonsugar can be substituted for [NS] .
Modern analytical instrumentation allows the easy and accurate measurement of many specific nonsugars. The concentrations of ions like potassium [K+], sodium [Na+], chloride [Cl-] and nitrate [N03- ]
can be determined with low relative errors. This makes them attractive replacements for [NS] in many sugar-factory calculations including %GC.
For the work presented here, potassium ([K+]) was the nonsugar chosen for three reasons . First, beet-sugar syrups contain enough of these ions for easy quantification by atomic absorption; second, contamination from environmental potassium is not -a problem; and finally, these ions are very soluble in sugar solutions so they do not precipitate or scale out of solution, but pass completely through the process to molasses.
In equation 8 there is no error in the first term of the parenthes es as it is an absolute number which represents complete crystallization. Application of equation 2 to the second term gives equation 10. This is the propagation-of-error expression for [K+] and [S] errors to the fraction of sugar that is retained in
4 5

the syrup after crystallization (R). The absolute error for this term will be the same absolute error for the crystallized fraction (equat i on 8 : the term in the parentheses) 100E R = E%CG. When %GC is calculated with equation 8, the greater its value , ~he smaller the propagated error.
( 10)~= R
Table II compares values of %GC for hypothetical A- ,B- and Cpan crystallizations as calculated with both purities and [K+]. The %GC and error estimates in this table were determined by applying equations 8 and 10 to [OS], [S] and [K+] values given. The absolute error i n [OS] and [S] values are assumed to be 1 . 0%. Two different relative err ors for [K+] 1.0% and 5.0% are assumed. For all three pans , the 1 . 0% errors in [OS] and [S] had more impact in the %GC calculated wi t h purities than the 5 . 0% error in [K+] had using the other equation .
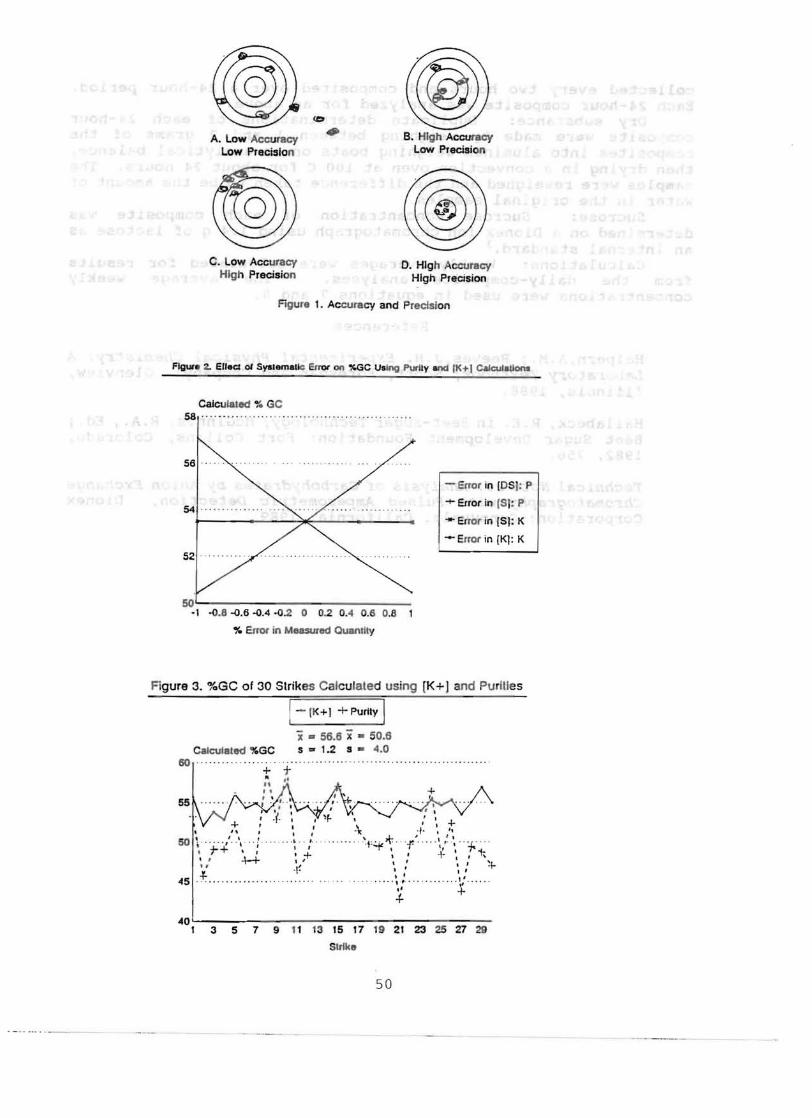
Another advantage that individually measured nonsugars have is the minimization of the effect that systematic errors have i n %GC calculations. This can be illustrated by considering a hypothetical strike with the A-mass and A-green parameters g iven in Table II. The % GC for this strike would be 53 . 8. Typical systematic errors manifest themselves as either absolute offsets (intercept errors) or a relat i ve offsets (slope errors). In either case, all measurements have these errors . Figure 2 illustrates the relative offset in the %GC calculation . The %GC determined using [K+] will be unaffected, but the same calculation using purities will have significant error.
The above difference that exists in these cal c u lations can be understood if equation 8 is examined. Since [NS] and [S] values appear in both the numerator and denominator of the second term, a systematic relative error will divide out . Systematic absolute errors essentially divide out as well.
Results
%GC of A-Pan Strikes Figure 3 shows the %GC for 30 A-pans calculated with equations
7 and 8. Apparent purities were used for equation 7 , and AA determined [K+] with po l arimetry determined [S] values for equatio n 8 . Equation 8 values hav e a higher average %GC (54.6) than those calculated with apparent purities (50 . 6) . In addition, the variation from pan-to-pan was much less with est i mated standard deviations for the thirty of 1 .2 and 4.0 respect i v ely.
Sugar- End Extraction Figures 4 and 5 compare sugar-end extraction over a 17-week
period as calculated using equations 7 and 8. Sugar-end e xtraction is the percent of the sugar entering in the thick juice that is
46

Table I I : Errors in %-Gross-Crystallization as Calculated with Purities and Potassium Ions .
CRYSTALLIZATION
Substance [DS J 1
±1. 0 [ S J 1
±1.0 P [NSJ [K+J
ppt %GCp %GCK+
2
±1. 0 ±5.0
A-PAN
Massecuite Green
91 80
84.6 68 . 8
93 6.4 5.1 86 11.2 9.0
Abso 1ute Error 53.8 ±12
53.9 ±1.1
53.9 ±3 . 3
B-PAN & CRYSTALLIZERS
Massecuite Green
93 81
74.4 55.9
80 18.6 69 25.1
Absolute
10.0 13 . 5
Error 44.4 ±6.7
44 . 3 ±1.5
44.3 ±4.1
C-PAN & CRYSTALLIZERS
Massecuite Molasses
94 8 2
64.9 46.7
69 29.1 57 35.2
Absolute
20.0 24.3
Error 40.6 ±5.7
40. 8 ±1.9
40.8 ±4. 5
lThe absolute error in the [DSJ and [SJ is 1.0. 2The error in %GC is calculated for relative errorss of 1 . 0 and 5.0 % in the potassium determination.
extracted as granulated sugar . It is assumed that all nonsugars entering exit with molasses and that no e xtra nonsugars are added.
The sugar-end extraction calculation will be one of the most accurate elimination calculations for either equation 7 or 8. Because of large differences in thick juice and molasses purities, and the fact that molasses has a low purity, propagation of errors through both equations is minimized. If a 1.0% absolute error is assumed for ,the purity values, then E%GC = 1.6 . (equation 9). If 1.0 % relatlve errors are assumed for [K+J's and 1.0% absolute errors for [SJ's, Then E~c = 0.3 (equation 10).
Figure 4 compares weekly calculations using apparent purities with the ones using [K+J and polarimetry determined [SJ. Over this per iod, both calculations show gradual drop in the sugar-end extraction but value calculated from equation 8 shows a 2.0% higher extraction than the one calculated with apparent purities.
47

Figure 5 compares calculations using true purities with those using [K+] and IC determined [S]. The calculated average extraction during this period is about the same for each method, however, the trending over time is more definite with the potassium calculation .
Figure 6. compares the extractions calculated from equation 8 using the two methods for [S] determination. Both types sucrose determinations give virtually identical results.
Conclusions
The improvements in both the precision and accuracy of calcu l ated values through the use of a specifically measured nonsugar have been demonstrated. Use of this method wi 11 be helpful in a number of ways. First, there are many laboratory and on-l ine instruments avai lable for measur ing speci f ic nonsugars. This expands the chemist's or process engineer's choice of instruments for determining traditional sugar-factory parameters. Second, greater accuracy and precision of these calculations improves the numbers engineers and managers have when they are evaluating processes and planing for changes. Finally, i ncr eased accuracy and precision of real-time calculated values can b e used for control evaluations.
Use of calculated fproductivity
purposes instead of just
specifically measured nonsrom them can be invaluable in the sugar industry.
being
ugars tools
after-the-fact
and parameters for increas ing
Experimental
%GC of A-Pan strikes Sampling: Samples of the A-massecuite were col l ected by the
sugar boilers just before each pan was dropped. The pan-floor
helper separated mother liquor from the massecui te by using a Buchner funnel equipped with a filter that had b een cut from a used, whi te-centr ifugal screen. The mother liq uor was drawn through the screen with vacuum , and all samples were brought to the laboratory where 70 g of each was weighed into a bottle a nd 230 g of reverse-osmosis water added . The samples were thermostated to 20°C .
Sucrose analysis : The thermostated samples were analyz ed for sucrose with a CTI - 501 Dark Solution Polarimeter
Dry s u bstance analysis : A CTI - 601 Precision Refractometer , both manufactured by Crystal Tek International was used .
Ion analysis : The diluted samples were further diluted so the ion concentration would be between 0 and 5 ppm and analyzed for potassium with a Perkin-Elmer 3100 Atomic Absorption Spectrop hotometer equipped with an acetylene/air burner.
Sugar- End Extraction Sampling : Production thick juice and molasses samples were
48

collected every two hours and composited over a 24-hour period. Each 24-hour composite was analyzed for as above.
Dry substance: Duplicate determinations of each 24-hour composi te were made by weighing between 1 and 2 grams of the composites into aluminum weighing boats on an analytical balance, then drying in a convection oven at 100 C for about 24 hours. The samples were reweighed and the difference taken to be the amount of water in the original samples.
Sucrose: Sucrose concentration of each composite was determined on a Dionex ion chromatograph using 1 . 4 g of lactose as an internal standard. 3
Calculations: Weekly averages were calculated for results from the daily-composi te analyses. The average weekly concentrations were used in equations 7 and 8.
References
1. Halpern,A.M.; Reeves,J.H . Experimental Physical Chemistry: A Laboratory Textbook; Scott, Foresman and Company : Glenview, Illinois, 1988.
2. Ha llabeck, R. E. in Beet-Sugar Technology; McGinnis, R. A., Ed.; Beet Sugar Development Foundation: Fort collins, colorado, 1982, 756.
3. Technical Note 20: Analysis of Carbohydrates by Anion Exchange Chromatography wi th Pulsed Amperometric Detection, Dionex corporation: Sunnyvale, California, 1989
49
B. High Accuracy Low Precision Low Precision
A. Low Accuracy
C. Low Accuracy High Precision
o. High Accuracy High Precision
Figure 1. Accuracy and Precision
Figura 2. Ellad 01 System.lle En Ol' on %GC Using Purity and /K+I C.ucut.uon.
Calculated % GC 58 . . . .. .. .. . . . . ... ..... .. .. . . .. . . ........... . .. .
56 ...
.0.8 -<l.6 .0.4 -0.2 0 0.2
- Error in [OS): P
+ Error in (SI: P
.... Error in [SI: K
- error in [KI: K
0.4 0.6 0.8 1
% Error in Measured Quantity
Figure 3. %GC of 30 Strikes Calculated using [K+J and Purities
1- [K +I + Purity 1 i 56.6 x- 50.6IS
Calculated %GC s .. 1.2 s - 4.0 60
+..
•I I
+ , , , I. , I" , ·f· I 'I'. 50 ~ . .. . .. ,'. . \ . ! . . ...". 'r .... ",", .'7-' ... ~ r+ . : I
,+ ,
. t~ I. , ~ • , 4-+ ,I II , .' ~f..·I! .,
45 .f .. ... ..... .. ... . .. ... .. ....., .,.' ... I' r ···· 4
40L-----------------~~~----~~_=~~ 1 3 5 7 9 11 t3 15 17 19 21 23 25 27 29
Strike
50
._ .. .. ... ... _- -

AgU'e 4. Sugar·End ElItraclion Calculated wflh Apparent PurlUes and {K +] "........ --- .............. --' ...... ...........~.
Sugar·End Extrac tion
95
93
91
89
87
. . .. .. . .. .. .. .... rl_-(-K+- ]- -j-_A-p-p-a.ren-I-p-U-rl-ty-'r ...... .
.. ... . . . . .... .. . i - 90.1·" x;,; 88.1 s - t.O s = 0.9
.,j. A;1-' - ~' '4".' ... ~ p ' ••••••••. • •.
• 'J!
Campaign Week #
Values laken from Mlnn-Dak's 1992-1993 Campaign.
Figure 5. Sugar-End Extraction Calculated with True Purity and {K+ J."""""""'_: ..._ 11:. _ ___
Sugar-Ene"' Extraction
951r---
,
+;' ,. . ,
(-K-+-]-+-Tr-u-e-p-u-r-ily--r ...... ..... .. . , . . . . .
93 . ... . . . .. . X " 90.1 x= 89.5 s = 0.9 s = 1.1
91
89-'f",4~./ , , ., , • A-r- ~'
87
85L-------------------------------------9 11 13 15 17 19 21 23 25
Campaign W81!Ik ;11
Values taken Irom Mlnn·Dak's 1992-1993 Campaign.
Figure 6. Sugar-End Extraction Calculated Using [K + ] Analytical "'.'hOOS: Ion Clvomatogrephy. PoIe,imelty. and Alamle Abeorpllon
Sugar-End extrac tion
95 .rl-----p-omn--.-m-e-I~---l--I-o-n-C-h-r-o-m-a-IO-g-r-a-p-h-y~1
93
89
x = 90. 1 s - 1.0
x - 90.1 s - 0.9
87 ...... . ........... ..... . ... . . .. . ... . ............ . . ......... ....... ... .
~~-------------------------------------9 11 13 15 17 19 21 23 2S
. Campaign Week #
Valuea laken I,om Mlnn-Oak's 1992- t 993 Campaign.
51