improving analytical efficiency and reducing cost of operation
TRANSCRIPT

Improving Analytical Efficiency and Reducing Cost of Operation
Craig MarvinGlobal Environmental Industry Manager
Graham Robinett
Federal Account Manager – Linthicum
June 2017
MELA and CWEA
Joint Technical Sessions

A Brief History of Agilent
1939–1998:The Hewlett-Packard years
60-year heritage of leadership and innovation
1999:Agilent is born
Biggest IPO in Silicon Valley: $2.1 billion
2005:Agilent refines scope
Focus on measurement
2006–2010:Transformation
Acquisitions, divestitures and restructuring
2013:World’s premier measurement company
$6.8 billion revenue
2013:Agilent announces spinoff of Electronic MeasurementAgilent to focus on Life Sciences, Diagnostics and Applied Chemical markets
2014:Agilent spins off Keysight Technologies The spinoff is final Nov. 1, 2014, through a tax-free distribution of Keysight common stock
MELA 20172 1 November 2017

AgilentLeader in Analytical Applications for 50 Years
$7M
$4.2B
GC MSLC
GC/MS
Fused Silica
Capillaries
UV-Vis
LC/MS
Microarrays
UHPLC
TOF-MS
Bioinformatics
Spectroscopy
Diagnostics
Capillary
Electrophoresis
HPLC-Chip
1965 1970 1980 1990 2000 2010 2016
1 November 2017 MELA 20173

Environmental issues in the headlinesWater’s importance?
Why Water?• Population growth: 7.4 billion people and counting
• Demand will increase 55% by 2050*
• Expects a 40% shortfall in water by 2030*
• Expected global population of 10.3 billion by 2050
• More than 660 million people+ live without a safe
water supply close to home
• Clean water a lower priority than food/jobs/energy
* United Nations+ Environment Canada
1 November 2017
MELA 2017
4

Environmental Monitoring ApplicationsCurrent challenges and future requirements
1 November 2017
MELA 2017
5

Today’s ChallengesExpecting More from Less
• Increasing cost of ownership
• Demands for higher throughput
Business Challenges
• Less time for method development
• Limited technical experience
ResourceAllocation
• Trace analysis in complex matrices
• Quicker return on capital investment
Optimizing Efficiency
1 November 2017
MELA 2017
6

MS Source Redesign
• Optimizing source efficiency
• High Efficiency Source, 20x Yield
• Dioxins, SVOCs, Nitrosamines
Leveraging Innovation to Improve Efficiency
1 November 2017
MELA 2017
7
JetClean• Self Cleaning Ion Source
• “Clean Only” or “Clean and Acquire” operation
• Extended operation, PAH ~ 2 yrs
Inert Flow Path• Ultra-inert or Ultimetal treatment of sample
flow path components
• Inlet, columns, fittings, detector jets
• Gets trace analytes to detectors
Multi-Mode Inlet
• Reduce solvent consumption
• Controlled, large volume, heated injection
• 95% reduction in usage
Oil Free Rough Pump
• Eliminates oil leaks
• Reduce maintenance cost, ~30%
• Reduce maintenance time, >50%
• For MS and MS/MS configurations
VacShield
• Service capillary without venting
• Down time ~20 min vs 12 hr
• Ultivo, 6495B
Increase speed and
sensitivity while
decreasing cost
The challenge

• Large volume injection helps optimize LOD performance
• LVI helps reduce sample cleanuprequirements
• 130mL sample with 18mL DMC extraction
• Microwave Extraction with dilute to volume and direct injection
• Validate recovery per method performance requirements
•Modification to Sample Prep
Reducing Emissions and Solvent UsageImprovements Through Improved Technology
1 November 2017
MELA 2017
8

• MMI allowed for a reductions in Sample Volume
• Resulted in REDUCEDchlorinated solvent usage from 30,000 lbannually to only 1,600 lb
Laboratory Success
Chlorinated Solvent Reduction ProfileImprovements Through Technology
1 November 2017
MELA 2017
9
Financial Benefit: $200K in the first twelve months!

GC/MS Quad Source that “Cleans Itself”Continually Driving Technology Innovation
1 November 2017
MELA 2017
10
“Clean Only” or “Clean and
Acquire” operation
Consistent response for
extended period of time
Reduces or eliminates
downtime for manual source
cleaning
As Option or Upgrade for
single and tandem quad
GC/MS systems

Cleaning Restores Analyte (OFN) DetectionComparable to manual cleaning
4 . 1 0 4 . 1 2 4 . 1 4 4 . 1 6 4 . 1 8 4 . 2 0 4 . 2 2 4 . 2 4 4 . 2 6 4 . 2 8 4 . 3 0 4 . 3 2 4 . 3 4 4 . 3 6 4 . 3 8
1 4 0 0 0 0
1 4 2 0 0 0
1 4 4 0 0 0
1 4 6 0 0 0
1 4 8 0 0 0
1 5 0 0 0 0
1 5 2 0 0 0
1 5 4 0 0 0
1 5 6 0 0 0
1 5 8 0 0 0
1 6 0 0 0 0
1 6 2 0 0 0
1 6 4 0 0 0
1 6 6 0 0 0
1 6 8 0 0 0
1 7 0 0 0 0
1 7 2 0 0 0
1 7 4 0 0 0
1 7 6 0 0 0
1 7 8 0 0 0
T i m e - - >
A b u n d a n c e
I o n 2 4 1 . 0 0 ( 2 4 0 . 7 0 t o 2 4 1 . 7 0 ) : O F N - p r e c o n d - 0 - r e p 0 0 . D \ d a t a . m s
4 . 1 0 4 . 1 2 4 . 1 4 4 . 1 6 4 . 1 8 4 . 2 0 4 . 2 2 4 . 2 4 4 . 2 6 4 . 2 8 4 . 3 0 4 . 3 2 4 . 3 4 4 . 3 6 4 . 3 8
0
5 0 0
1 0 0 0
1 5 0 0
2 0 0 0
2 5 0 0
3 0 0 0
3 5 0 0
4 0 0 0
4 5 0 0
5 0 0 0
5 5 0 0
6 0 0 0
6 5 0 0
7 0 0 0
7 5 0 0
T im e - - >
A b u n d a n c e
T I C : O F N - p o s t c o n d - 1 - p r e t u n e - r e p 0 2 . D \ d a t a . m s
S:N > 50 pk-pk
> 200 rms
S:N ≈ 1 pk-pk
> 2 rms
Very dirty source
before cleaning
After cleaning with H2
MELA 2017
11 1 November 2017

Verified Performance PAH Analysis – Clean and Acquire
62 PAHs, “archetypally difficult”
Range 1-10,000pg/μl, R2>0.998
5% of true values, over many month
Mean limits of LODs 1.02 +/- 0.82pg/ μl
Non-reactive,
nonpolar
compound
classes are
generating
exceptional
results in the
Acquire & Clean
operational modeNow >2 years
1 November 2017
MELA 2017
12

Name TS RTAvg.
Conc.
Std.
Dev.MDL LOQ LOD
EPA
MRLsNoise S/ N
Avg.
Resp
Resp.
RSD(%)
NDMA 1 7.15 1.62 0.0471 0.141 0.471 0.141 1.6 5 228 3275 3.9
NMEA 2 8.28 1.48 0.0287 0.086 0.287 0.086 1.5 3 258 2073 4.1
NDEA 3 9.13 1.43 0.0579 0.174 0.579 0.174 2.1 3 Inf. 1347 5.3
NDPA 4 11.08 1.29 0.1423 0.427 1.423 0.427 1.2 10 214 238 8.9
NMOR 5 11.47 1.19 0.0411 0.123 0.412 0.123 3 1912 2478 3.9
NPyr 5 11.64 1.32 0.124 0.372 1.240 0.372 1.4 1 1525 375 7.5
NPip 6 11.85 1.41 0.045 0.135 0.450 0.135 1.4 3 216 1206 3.5
NDBA 7 12.56 1.47 0.0595 0.178 0.595 0.178 1.4 8 Inf. 928 3.8
MDL/LOQ/LOD at 95% confidence level: Calculated from 8 replicates at 1.25 ng/L using 0.5 µL injections
N-Nitrosamines in Drinking Water GC-MS/MS with HES (all concentrations in ng/L)
1 November 2017
MELA 2017
13
• Enhanced EI sensitivity meets, and exceeds, the requirements of EPA Method 521
• Excellent alternative to the method specified PCI MS/MS Ion Trap systems.
• Excellent detection levels ranging from 0.08 – 0.4 ng/L
• Well below the required levels with only a 0.5 µL sample injection.
Performance
Smaller injection volume led to less
sample on column, less matrix and
longer time between system
maintenance

LISTENING TO CUSTOMERS:THE SPARK FOR INNOVATION
1 November 2017
MELA 2017
14

Innovating the GC Flow PathIntuvo Model 9000 Gas Chromatograph
To detector
Conventional
flow path
Inlet
Gold seal
Nuts and ferrules
Classic capillary
column
1 November 2017
MELA 2017
15
Click-and-run
direct
connections
To detector
Intuvo
flow path
Inlet
Guard chip
Intuvo planar
column
Flow
chip

Innovating a New Path to GC ProductivityA new approach to GC
Disposable
Guard chip
No-trim
column
Direct
heating
Modular
Intuvo flow chips
Ferrule-free click-and-run
connections
1 November 2017
MELA 2017
16

Seamless Method Migration to IntuvoPreserving method and SOP investments
1x10
0
0.1
0.2
0.3
0.4
0.5
0.6
0.7
0.8
0.9
1
1.1
1.2
1.3
1.4
1.5
1.6
1.7
1.8
1.9
2
2.1
2.2
2.3
2.4
2.5
2.6
2.7
2.8
2.9
3
3.1
3.2
3.3
3.4
3.5
3.6
3.7
+ TIC Scan 12 CAL 10 (20000 ppb) - Apr 30.d
Counts (%) vs. Acquisition Time (min)
4 4.5 5 5.5 6 6.5 7 7.5 8 8.5 9 9.5 10 10.5 11 11.5 12 12.5 13 13.5 14 14.5 15 15.5 16 16.5 17 17.5 18 18.5 19 19.5 20 20.5 21 21.5 22 22.5 23 23.5 24
1x10
-0.1
0
0.1
0.2
0.3
0.4
0.5
0.6
0.7
0.8
0.9
1
1.1
1.2
1.3
1.4
1.5
1.6
1.7
1.8
1.9
2
2.1
2.2
2.3
2.4
2.5
2.6
2.7
2.8
2.9
3
3.1
3.2
3.3
3.4
3.5
3.6
3.7
3.8
3.9
4
4.1
4.2
4.3
4.4
4.5
4.6
4.7
4.8
4.9
5
5.1
5.2
5.3
5.4
5.5
5.6
+ TIC Scan 12 Cal-10 (Dec 10) 20000 ppb .D
Counts (%) vs. Acquisition Time (min)
4 4.5 5 5.5 6 6.5 7 7.5 8 8.5 9 9.5 10 10.5 11 11.5 12 12.5 13 13.5 14 14.5 15 15.5 16 16.5 17 17.5 18 18.5 19 19.5 20 20.5 21 21.5 22 22.5 23 23.5 24
83 SVOC by US EPA 8270
1 November 2017
MELA 2017
17

SMALL IS BIG AGAIN!
Ultivo LC/TQ
Next Generation of LC/TQ”Fit for Purpose”
Expectations for LC/TQ performance• Bench space requirements
• Robust, reliable and accurate measurements, day in –
day out
• Minimal downtime for maintenance
• Intuitive and user-friendly• Quickly achieve ROI
1 November 2017
MELA 2017
18

Ultivo“Fit for Purpose” LC/TQ
Diagnostics – Provide “real-
time” information concerning
stability/usability of the system
Reliability – Overall (mean time
to service), sample throughput,
consumable components
(TMP, ion injector)
Performance – Sensitivity,
selectivity, positive/ negative
switching, mass range /
resolution, matrix
Form Factor – Size/ Footprint,
stackability, external
appearance
Ease-of-Use - Initial set-up /
post-sales support (e.g.
method development), training,
fit into workflow
Total Cost of Ownership –
Initial cost, reduced
maintenance cost, gas usage,
noise reduction, training
1 November 2017
MELA 2017
19

Analysis of Trace Organic ContaminantsIon Suppression Comparison by Sample Prep Method
Conventional SPEMass on Column :150 pg
Online SPEMass on Column :150 pg
Direct InjectionMass on Column :150 pg
Dr. Shane Snyder
University of Arizona
1 November 2017 MELA 201720

Analysis of Trace Organic Contaminants in Drinking WaterFlexCube Online SPE + 1290 II LC + Ultivo Triple Quad LC/MS
Distribution of the limits of detection for 31
common TOrCs found in water
• 750 µL injection onto Flexcube
• <20 min cycle time
• R2 > 0.99 for range 0.5 – 200 ng/L
1 November 2017
MELA 2017
21
< 0.5 ng/L, 19 TOrCs

Analysis of PFAS in Drinking Water with UltivoEPA Method 537
1 November 2017
MELA 2017
22
Analysis of 17 PFASs in drinking water with <0.1 ng/mL DLs in extract
(includes all 14 compounds in EPA 537)
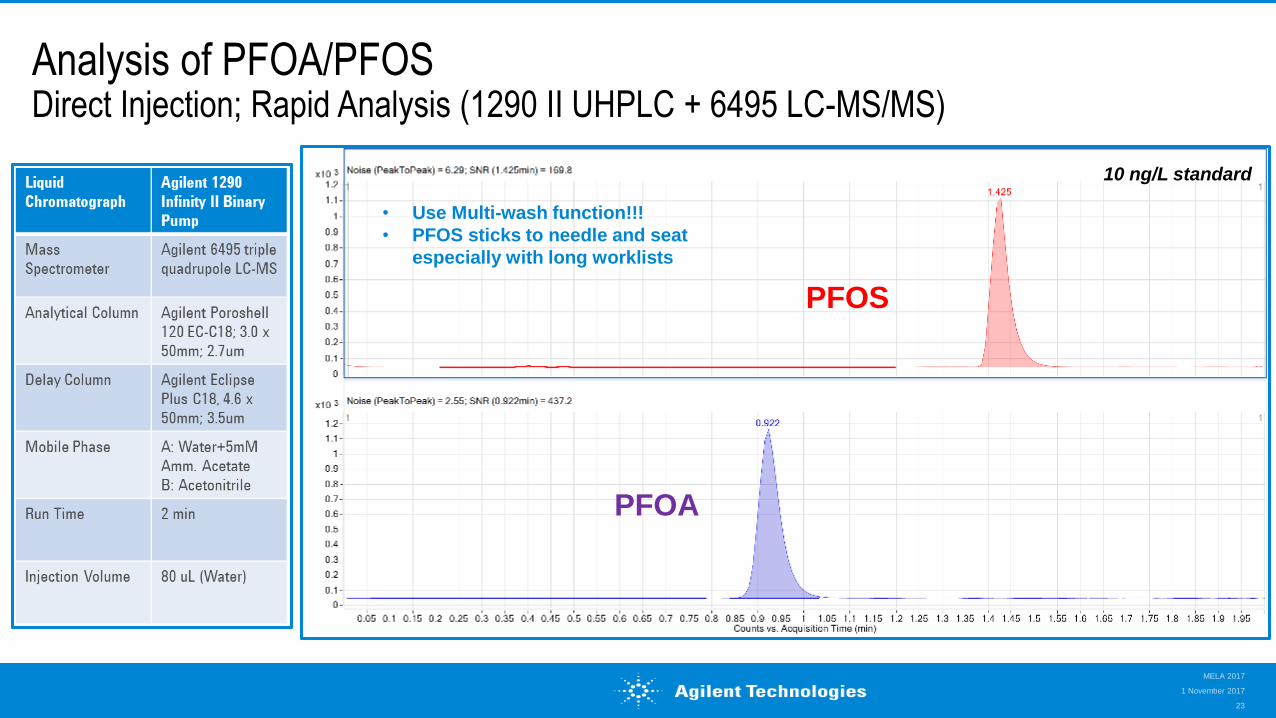
Analysis of PFOA/PFOSDirect Injection; Rapid Analysis (1290 II UHPLC + 6495 LC-MS/MS)
1 November 2017
MELA 2017
23
PFOS
PFOA
10 ng/L standard
• Use Multi-wash function!!!
• PFOS sticks to needle and seat
especially with long worklists

Key Application for LC/TQLow Level Detection of PPCPs using Model 6495
Performance
Detection at concentration <10 ppt without sample enrichment.
Calibration range from 2 to 1,000 ppt (R2 >0.995 for most compounds)
Accuracy 80–120%
1 November 2017
MELA 2017
24
Negative ModePositive Mode

PPCPs Identified Positive Ion Mode Remote Source Water (>10ppt)
1 November 2017
25
MELA 2017

PPCPs IdentifiedUrban Source Water (>10ppt)
1 November 2017
26
MELA 2017
Positive Ion Mode
Positive Ion Mode

PPCPs Identified Positive Ion ModeLocal Tap Water (>10ppt)
1 November 2017
27
MELA 2017

Analysis of Hormones in Drinking Water5 ng/L (testosterone) to 17.5 ng/L (EE)
Estriol17-β-Estradiol
Testosterone
17-α-EthynylestradiolEquilin Estrone
Androstenedione
Estrone (-)
Estriol (-)
Testosterone (+)
Androstenedione (+)
Equilin (-)
17--Ethynyl estradiol (-)
17--estradiol (-)
1 November 2017
28
MELA 2017

Analysis of 9 Polar Pesticides in Water - GlyphosateDirect Aqueous Injection with LC-MS/MS
29
1 November 2017
MELA 2017
1260
Bioinert LC
Metrohm
Asupp IX
column
100 µL inj.
20 min RT
6495 Triple Quad LC/MS
ESI Negative
LOD: 0.2 ppb for
Glyphosate; lower for
others

Haloacetic Acids and Bromate in Water by IC-MS/MSEPA method 557 (Metrohm 950 IC + Agilent 6490 Triple Quad LC/MS)
1 November 2017
MELA 2017
30
Advantages:
• Method runtime (20 min) is a
third of EPA method
• MDLs are better in most
cases than EPA method
• Includes 4 Iodo-HAAs not in
EPA method
Wu et al. (2017), “Analysis of haloacetic
acids, bromate and dalapon in natural
waters by ion chromatography-tandem
mass spectrometry”, J Chrom A, 100-107
100 µL direct aqueous
injection of water
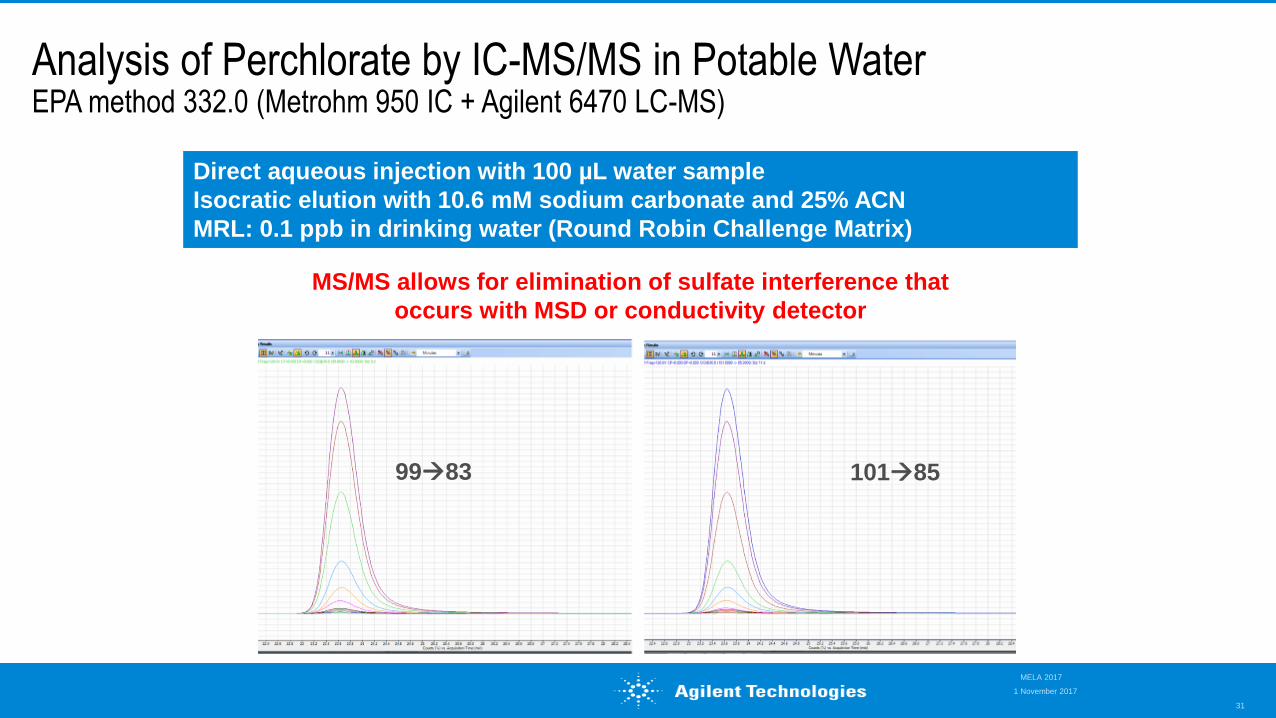
Analysis of Perchlorate by IC-MS/MS in Potable WaterEPA method 332.0 (Metrohm 950 IC + Agilent 6470 LC-MS)
1 November 2017
MELA 2017
31
Direct aqueous injection with 100 µL water sample
Isocratic elution with 10.6 mM sodium carbonate and 25% ACN
MRL: 0.1 ppb in drinking water (Round Robin Challenge Matrix)
9983 10185
MS/MS allows for elimination of sulfate interference that
occurs with MSD or conductivity detector

Thank you Let’s Continue the Conversation
1 November 2017
MELA 2017
32