improving early childhood development - main - ecd · pdf file ·...
TRANSCRIPT

Improving EarlyChildhood Development
An Integrated Programfor the Philippines

Map of the Philippines

DIRECTIONS IN DEVELOPMENT
Improving EarlyChildhood Development
An Integrated Programfor the Philippines
Richard A. HeaverJoseph M. Hunt
A collaborative report by the World Bankand the Asian Development Bank for the
Government of the Republic of the Philippines
The World BankWashington, D.C.

© 1995 The International Bank for Reconstructionand Development / THE WORLD BANK
and the Asian Development Bank
All rights reservedManufactured in the United States of AmericaFirst printing November 1995
The findings, interpretations, and conclusions expressed in this study areentirely those of the authors and should not be attributed in any manner to theWorld Bank or the Asian Development Bank, to their affiliated organizations, orto members of their Board of Executive Directors or the countries they represent.
Cover photograph by Curt Carnemark
ISBN 0-8213-3350-X

Contents
Foreword vii
Acronyms and Abbreviations ix
Glossary x
Overview 1The Situation of Preschool Children in the Philippines 1Government Policies, Goals, and Intervention Programs 6Strategy Issues 11Financing a Strengthened ECD Program 19Recommendations 22Notes 24
1. Introduction 25What Is Early Childhood Development? 27Why Should the Government Invest in Early Childhood Development? 32
2. The Situation of Children in the Philippines 43Developmental Status 43Causes of Disadvantage 48The Worst-off 63Implications for Action 65
3. Government Policies, Goals, and Intervention Programs 71
Child Development Policies and Goals 71Health Intervention Programs 73Nutrition Intervention Programs 80Early Education 94
v

vi C O N T E N T S
4. Creating an Integrated, National Early Childhood Development Program 106
An ECD Program Model 107Community and NGO Participation 114Program Management under Devolution 121Central Support and Direction 127Conclusions 133
5. Financing Early Childhood Development 135Trends and Levels in Spending 135Six-Year Financing Needs 141Sourcing and Sustaining the Financing 153Conclusions 161Note 162
Bibliography 163

Foreword
This book is a joint product of the World Bank and the AsianDevelopment Bank (ADB), and of a consultation process with keymembers of the child development community in the Philippines.It is based on a report that was produced to help in the preparationof a national investment plan for early childhood development(ECD). This is the first time either development bank has done acountry study that looks at ECD in an integrated way, across health,nutrition, and early education. It is hoped, therefore, that this bookwill be of interest to the international child development commu-nity, as well as in the Philippines.
The first draft of the report was based on the findings of a jointmission in March 1994. Team members were Richard A. Heaver,IBRD (mission leader and management specialist); Joseph M. Hunt,ADB (ADB team leader and economist); ADB consultant Keith McIn-nes (financial analyst); and IBRD consultants Rosendo Capul (publichealth), Sony Chin (nongovernmental organizations and commu-nity participation), John Kevany (nutrition), and Fred Wood (earlyeducation). During this mission a workshop was held with leadingspecialists in child development in the Philippines, including gov-ernmental and nongovernmental organizations and the United Na-tions Children’s Fund, to define the main issues on which thereport should concentrate. A second workshop with similar partici-pants was held in Manila in September 1994 to provide reactions tothe first draft. Both workshops were chaired by the PhilippineCouncil for the Welfare of Children. The current version of thereport, on which this book is based, took into account commentsfrom the second Manila workshop as well as comments by review-ers from inside and outside the World Bank at review meetings inWashington, D.C., in July and December 1994.
The broad findings of the report were endorsed by a steeringcommittee—consisting of representatives of the main governmentagencies involved in ECD in the Philippines—that was tasked withdeveloping a proposal for a national ECD program. Institutions
vii

represented on the steering committee include the Department ofHealth (chair); the National Council for the Welfare of Children;the National Nutrition Council; the Department of Social Welfareand Development; the Department of Education, Culture, andSports; the Nutrition Center of the Philippines; the Department ofInterior and Local Government; and the Museo Pambata Founda-tion. The findings helped the committee to prepare an ECD strategypaper for submission to the Social Development Committee, ahigh-level Philippine policymaking body, seeking endorsement ofan integrated national ECD program. Although the report wasbroadly endorsed by the steering committee, the specific findingsin this book and the levels of investment proposed represent therecommendations of the joint team, rather than the position of thegovernment of the Philippines.
To provide a smaller, more accessible volume for the nontechni-cal reader, the eleven annexes to the report are being published ina separate companion volume, Supplement to Improving Early Child-hood Development.
The authors gratefully acknowledge the contribution of all thosein the Philippines and in the international agencies, as well as eachmember of the mission team, who provided data, shared theirviews about issues and priorities, and commented on drafts. Errorsand omissions remain the responsibility of the authors alone.
Children represent the future of the nation. This book is dedi-cated to the many Filipinos who are working for the cause of chil-dren, in the hope that preschoolers, especially the disadvantaged,will have a better future.
viii F O R E W O R D
Callisto E. MadavoDirector, East Asia and Pacific
Country Department IThe World Bank
Dinh X. VinhDirector, Agriculture and
Social Services Department (East)Asian Development Bank

Acronyms and Abbreviations
ABCSD Area-Based Child Survival and DevelopmentADB Asian Development BankARMM Autonomous Region of Muslim MindanaoCAR Cordillera Administrative RegionCODE-NGO Caucus of Development NGO NetworksCWC Council for the Welfare of ChildrenECD Early childhood developmentEPI Expanded Program on ImmunizationFNRI Food and Nutrition Research InstituteGDP Gross domestic productGMP Growth monitoring and promotion GNP Gross national productIALDM Integrated Approach to Local Development
ManagementIEC Information, education, and communication IRA Internal Revenue AllotmentIRS International Reference Standard for GrowthNCR National Capital RegionNEDA National Economic and Development AuthorityNGO Nongovernmental organizationNNC National Nutrition CouncilORT Oral rehydration therapyPEM Protein-energy malnutritionUNICEF United Nations Children’s FundUSAID U.S. Agency for International DevelopmentWHO World Health Organization
ix

Glossary
Barangay The lowest level of local government, roughly equiva-lent to village; contains an average of 1,500 people (within a verywide range).
Municipality The local government level (boh urban and rural)between a province and a barangay; contains an average of 20,000people (within a very wide range).
x

1
Overview
The situation of children in the Philippines is considerably worsethan it need be for a country of its per capita income. Ill health,malnutrition, and poor psychosocial development among pre-schoolers are costing the country substantial amounts in terms ofpremature deaths, permanent disabilities, and lost productivityand income. The benefits to the nation of improved child develop-ment greatly outweigh the costs. However, the benefits will ariseover a long period, whereas making the investment in children is animmediate priority. The cost of inaction is high. Every year lost canbe measured in deaths, disease, and often permanent disabilities.
This book argues that the Philippines should be investing morein child development and that doing so will have a high payoff.The objective is to convince those who control resources in thecentral and local governments, and in the nongovernmental anddonor communities, that they should finance an integrated invest-ment package that has a real prospect of meeting the national goalsfor children. The technologies for program design and implementa-tion are well-enough known, the finance can be raised or reallo-cated, and the goals can be achieved—if the commitment of thegovernment as well as the nongovernmental and donor communi-ties can be crystallized around a shared vision of what needs to bedone.
The Situation of Preschool Children in the Philippines
Health
In the Philippines two of every three preschoolers who die areinfants. The infant mortality rate is about 57 per 1,000 live births.During the 1980s the infant mortality rate declined much moreslowly than in other East Asian countries. For example, althoughThailand and the Philippines had similar infant mortality rates inthe 1960s, Thailand’s rate is now only about 30 per 1,000. The main

causes of infant and child deaths are pneumonia and other respira-tory diseases; bronchitis, influenza, and diarrhea are the leadingchildhood diseases. Most of these deaths are preventable, and mostof these diseases are treatable with cheap, simple technologies.
Child health has improved more slowly in the Philippines thanelsewhere for a number of reasons. The deep economic recessionand years of slow growth of the 1980s limited the access of thepoor to public health services. Little was spent on the key primarytechnologies until the Aquino and Ramos governments came topower. Underinvestment in sectors outside child health, but whichpowerfully affect child health, also played an important part. Slowprogress with the family planning program took a heavy toll inchildren’s lives; it has been estimated that the infant and childmortality rates would decline by as much as 25 percent if preg-nancy were avoided by women who are under 20 and over 45,women who have four or more children, and women who arewithin fifteen months of their last birth.
There was also underinvestment in controlling protein-energymalnutrition (PEM, which depresses the immune system; severePEM can increase the risk of death by up to eight times. Recentresearch has shown that even moderate PEM, the degree of severitymost common in the Philippines, is associated with increased dis-ease and death rates; it is estimated that nearly half of infant andchild deaths in the Philippines are the combined result of infectionand malnutrition. Gains from further investment in child healthprograms may therefore be limited unless accompanied by equallydetermined efforts to improve nutrition.
Nutrition
The commonest form of malnutrition in the Philippines is iron defi-ciency anemia, which affects more than 40 percent of pregnant andlactating women and about 50 percent of infants. These levels mayincrease further once the new international standard for measuringanemia, recently adopted by the World Health Organization(WHO), has been adopted in the Philippines. This deficiency ad-versely affects children’s growth and performance, including intel-lectual development. Iodine deficiency remains a serious problemin parts of the country, leading to cretinism, mental retardation,reduced learning capacity, and hearing loss in infants and children.Vitamin A deficiency is mostly now at subclinical levels, but eventhis remains a problem because of its recently discovered linkswith mortality. Micronutrient deficiencies result mainly from low
2 I M P R O V I N G E A R L Y C H I L D H O O D D E V E L O P M E N T

dietary intakes: for anemia and vitamin A, through eating too fewmicronutrient-rich fruits and vegetables and, for iodine, because ofgeological conditions. Anemia is also exacerbated by iron losscaused by parasites—malarial, schistosomal, and helminthic—inecological zones where these are prevalent.
During the 1980s, PEM declined more slowly in the Philippinesthan in not only the better-off countries of East Asia (Malaysia,Thailand) but also the poorer countries of South Asia (Bangladesh,India, Pakistan). Different kinds of standards are used to define themagnitude of PEM. By the Philippines Reference Standard, about 11percent of children under 60 months old were underweight in 1992;by the International Reference Standard, endorsed by WHO, 33 per-cent were underweight. Using the International Reference Stand-ard, which makes international comparisons possible, PEM in thePhilippines in 1992 was worse than in poorer countries suchas Egypt, Kenya, Tanzania, and Zimbabwe. Data from the 1993Philippines National Nutrition Survey indicate that, by the Philip-pines Reference Standard, PEM had fallen to about 8 percent ofchildren under age 6. This percentage would equate to about 29percent by the International Standard. The continuing decline isencouraging, but the absolute amount remains a significant causefor concern.
PEM is often thought to result simply from poverty and lack ofpurchasing power for food. In the Philippines, household food in-security affects 20 percent of families and is certainly an importantfactor in PEM. But so, also, are poor child health and poor caringpractices for children. Wasting (low weight for height, which indi-cates current malnutrition) in preschoolers peaks between the agesof 6 months and 2 years and then, in most families with a nutritionproblem, declines just when children are getting more expensive tofeed. The peak around weaning reflects both the incidence of infec-tion and inadequate weaning practices, even in families who canafford the food. It is likely that most mothers feed their childrentoo little because they do not realize their children are malnour-ished; moderate PEM is not easily visible to the untrained eye. Themultiple causes of PEM have important implications for policy.Many policymakers favor livelihood-creation programs as thesolution for the nutrition problem. But investment in health careand efforts to improve caring practices are also essential. A keyintervention is an effective program to monitor and promotegrowth. Such a program permits parents to recognize malnutritionand the positive effects of feeding affordable, additional amountsof food.
O V E R V I E W 3
Early Education
There is very little survey data that directly measure children’spsychosocial development. But indirect evidence from surveys ofperformance in elementary school is worrying. Although 99 per-cent of Filipino children are enrolled, dropout rates are unaccept-ably high. Only 68 percent of grade 1 entrants actually completeelementary school, with 60 percent of the dropout occurring ingrades 1 and 2. Also, test results for those staying in school arelower than for other East Asian countries. It is not known howmuch of the dropout and poor learning performance should beattributed to poor school readiness, how much to poor teaching inelementary school, or how much to other factors. But high dropoutrates and poor performance in school must be due in part to inade-quate school readiness among Filipino children—readiness in theirability to deal with different ways of learning, their socializationwith large groups of children their own age, and their languageskills.
As noted above, persistent poor health and malnutrition arethemselves important causes of inadequate psychosocial develop-ment. They can inhibit the development of intelligence and of neu-rological and psychomotor systems, and they make children lessactive and less responsive to stimulation. Other important influ-ences are the amount of attention children receive from caregivers,the interaction they have with other children, and the richness oftheir environment. There is little solid data on any of these factorsin the Philippines. In general, the families least likely to be able toprovide for their children’s developmental needs are the very poor,particularly those who have migrated to urban areas and are with-out extended family support systems to help with childcare. Onestudy of women’s work and infant care in Cebu showed that nearly60 percent of mothers worked outside the home and that poorwomen with several preschoolers were the mothers most likely tobe working outside the home.
The Worst-off
Depending on where they live and what type of family they comefrom, children are subject to different types and degrees of risk.Risk factors may be demographic (being an infant with closelyspaced siblings), related to income (being the child of a poor, land-less laborer), environmental (living in an area with malaria or un-protected water supplies), geographic (living in a mountain area ora coastal community only reachable by water), related to peace and
4 I M P R O V I N G E A R L Y C H I L D H O O D D E V E L O P M E N T

order (being underprovided with services because of past armedconflict) or cultural (living in indigenous communities, whichalso have poor access to services). Families are worst-off usuallybecause they suffer from combinations of such risks. In the Philip-pines, the worst-off areas in terms of high infant mortality andPEM rates are Bicol and Western Visayas; the best-off are the Na-tional Capital Region (NCR), Mindoro, and Region III in northernLuzon. But in terms of numbers of disadvantaged children, thepicture is different: the worst-off include not only WesternVisayas and Bicol, but also the NCR, Region I in northern Luzon,and Mindoro.
Implications for Action
To best design and target interventions, better data are needed inseveral areas. On the technical side, improvements are needed indisease surveillance and in measuring iron deficiency, PEM inpregnant and lactating women, and psychosocial development. Fortargeting purposes, better data are also needed on the most disad-vantaged, including studies of their risk profiles, and better mecha-nisms are needed for identifying disadvantaged children scatteredamong populations of the better-off. Growth monitoring andhousehold asset surveys appear to be cost-effective ways to collectthese kinds of data.
The nature of child development problems in the Philippinessuggests that the main priorities should be programs for:
• Child survival, with special attention to maintaining the Ex-panded Program on Immunization, acute respiratory infectioncontrol, oral rehydration therapy, and interventions aimed atneonatal mortality
• Disease control, with special attention to diarrhea and pneu-monia nationally and to malaria, schistosomiasis, and helminthcontrol in heavily endemic areas
• Deficiency control, for iron, vitamin A, and iodine amongpregnant and lactating women as well as children
• PEM control, focusing on food security and behavioral changeand on pregnant and lactating women as well as children
• Early education, for disadvantaged children (however, thelack of hard data makes it difficult to determine the appropri-ate extent and type of intervention)
• Maternal care and birth-spacing, aimed at improving mothers’health and nutrition and reducing infant and child mortalityand malnutrition
O V E R V I E W 5

• Water supply and sanitation, in areas where limited coverageleads to high diarrhea rates.
Government Policies, Goals, and Intervention Programs
The Philippines has a set of laws and policies, including a nationalPlan of Action for Children, that strongly support child develop-ment. The government’s qualitative and quantitative goals for thesurvival, protection, and development of children are clear andambitious. Between 1990 and 2000 the goal is to reduce the infantmortality rate to 37.6; to halve the prevalence of PEM among pre-schoolers; to reduce low birth weight to less than 10 percent; tovirtually eliminate vitamin A and iodine deficiencies; and to estab-lish a preschool center in every barangay.
To be most effective, early childhood development programsshould attempt to integrate interventions in health, nutrition, andearly education so as to respond to children’s needs in a holisticway. Some of the strategy issues that cut across these three sectorsare discussed in the following section. But first the existing pro-grams in health, nutrition, and early education are reviewed sepa-rately because, until the recent devolution,1 they have mainly beenseen—and managed—as separate programs. Only the nationwideprograms are reviewed, because the success or failure of theselarge-scale programs will determine whether the nation’s child de-velopment goals are achieved. There are also a number of small-scale projects and programs in the Philippines that have attemptedto integrate health, nutrition, and early education interventionsand from which much can be learned about how to strengthen thenational programs.
Health Programs
During 1991–93, health services were devolved to local govern-ments. Now most of the hospitals are controlled by the seventy-seven provincial governments, and most public health services bythe more than 1,500 municipalities. At the periphery, the keyhealth worker is the rural health midwife, of which there is one forevery 5,000 people on average, and one for every 2,000 to 3,000people in most poorer provinces. Rural health midwives are as-sisted by barangay health workers. These volunteer workers helpfor two or three hours a week encouraging community participa-tion in health campaigns and providing health education. A typicalbarangay of 1,500 people might have ten such volunteers, of whomhalf might be active workers.
6 I M P R O V I N G E A R L Y C H I L D H O O D D E V E L O P M E N T

The various child health programs have had different impacts,depending on the levels of commitment and funding they havehad, how difficult their technology is to manage, and how longthey have been established. The immunization program has beenthe most successful; strong commitment and ample funding haveincreased coverage to more than 90 percent. The diarrhea programhas been the next most successful, with oral rehydration beingused in 50 to 60 percent of cases. But more needs to be done topromote home prevention and management of diarrhea. The con-trol of acute respiratory infections is a newer technology. This pro-gram was launched only five years ago. Much training has beendone, but the current monitoring system has not been able to deter-mine how far the new case management system is being followedin the field. Financing for expansion of the program is uncertain.Although support from the United Nations Children’s Fund(UNICEF) will continue, assistance from the U.S. Agency for Interna-tional Development (USAID) and the World Bank for acute respira-tory infection control and other child survival interventions wasscheduled to end in late 1994 or early 1995.
In contrast to the earlier, weak commitment to family planning,the Department of Health has now made the program for familyplanning, women’s health, and safe motherhood its flagship pro-gram and is implementing two major, donor-supported projects tosupport it. Although efforts to improve and expand family plan-ning should greatly affect infant mortality, more needs to be doneto reduce the 35 percent of infant deaths that occur in the firstmonth after birth.
With the government’s increasing commitment to the childsurvival program and to women’s health and family planning, therural health midwife’s workload is growing steadily. This increaseimplies the need to carefully review the ratio of field staff topopulation. It also implies the need for more systematic plan-ning of the rural health midwife’s time and the division of laborbetween her, the barangay health workers, and the doctors andnurses in the health centers. Efficiency would increase if fieldwork-ers’ time were focused on providing integrated services to the cli-ents who are most at risk and at the times when they most needassistance.
Except for interventions to reduce deaths in the first monthsof life, the technical strategies for child health interventions arewell developed. The main constraints are institutional and finan-cial. Since devolution there have been varying degrees of commit-ment and resource allocation, and at least in some localgovernments there are worrying signs that the delivery of public
O V E R V I E W 7

health services is beginning to falter. On the financial side, localgovernments inherited a series of child health programs that variedin their stage of development and effectiveness and still sufferedfrom the legacy of underfunding of primary care during the 1980s.Substantial additional resources are required to consolidate theseprograms.
Nutrition Programs
At least eight agencies are involved in implementing nutrition pro-grams. Foremost are the Department of Health and the Departmentof Social Welfare and Development. The Department of Health isresponsible for the micronutrient program and for growth monitor-ing, as well as for nutrition education and supplementary feedingfor pregnant and lactating women and children under age 4 (age 0to 36 months). The Department of Social Welfare and Developmentruns a nutrition program, including supplementary feeding, for the4- to 6-year-olds. At the periphery, the same rural health midwivesand barangay health workers who are responsible for health arealso responsible for nutrition. They are assisted by barangay nutri-tion scholars—volunteer workers with very small allowances(mostly not more than P50 [less than $2]2 a month) who work forone or two hours a day on growth monitoring, supplementaryfeeding, micronutrient distribution, and nutrition education. Onaverage, there is one barangay nutrition scholar for every threebarangays in the country.
The Department of Health, with good support from local govern-ments, has launched major campaigns promoting vitamin A andiodine supplementation, and coverage rates are rising fast. Ironsupplementation does not lend itself to the campaign approach forimplementation because iron supplements have to be taken dailyor weekly. The Department of Health therefore plans to improvethe delivery of iron to pregnant women in the context of itswomen’s health and safe motherhood program. Anemia also mustbe attacked through well-targeted efforts to control parasitic dis-eases, but more work is needed to define the areas of highestprevalence and to develop appropriate interventions.
Efforts to fortify staples with key micronutrients and to changedietary habits have moved less fast than supplementation interven-tions. Fortification has suffered from an ad hoc approach andwould benefit from technical assistance to develop industrywideplans and the capacity to design, monitor, and evaluate the fortifi-cation program. The emerging overload on field staff, coupled with
8 I M P R O V I N G E A R L Y C H I L D H O O D D E V E L O P M E N T

their inadequate training, is making it difficult to promote dietarychange seriously.
Most cases of PEM in the Philippines are moderate rather thansevere and hence not easily visible to the untrained eye. Growthmonitoring is an essential tool for showing parents that their chil-dren are malnourished and that malnutrition responds quickly tofeeding small additional quantities of food. For the same reason,short-term supplementary feeding of growth-faltering children isalso useful. However, the growth promotion program in the Philip-pines has not worked well. Growth monitoring is often infrequentand of poor quality, as is counseling. Food supplementation hasnot been adequately targeted on the 0- to 24-month age groupmost at risk, food supplements for children are often taken homeand shared with other family members, and many children stay inthe feeding program for six to twenty-four months, thus encourag-ing dependency on it. There have been ambivalence and lack ofunderstanding as to whether supplementation is a growth pro-motion intervention to educate parents about better childcare ora food security intervention to provide a safety net for the verypoor.
Managing an effective growth promotion program focusing onchildren under 3 in a barangay of about 1,500 would take a workerfour to six hours a day, six days a week. This kind of time commit-ment cannot be expected from volunteers. It is therefore recom-mended that a part-time community worker in each barangay behired to run this program, with an allowance of about P750 ($27) amonth. Existing barangay nutrition scholars could be used for theprogram where suitable.
The food supplementation program has depended heavily onU.S. Public Law 480 (PL 480) food aid, which is to be phased out inthe next few years. We recommend that a suitable, locally pro-duced weaning food be substituted for the PL 480 commoditiesand that the supplementation program be reoriented to focus onon-site feeding for at-risk pregnant women and 0- to 24-month-olds, the highest risk group.
A separate intervention will be required for families in whichchild malnutrition is the result of food insecurity rather than, or inaddition to, poor health care and poor feeding practices. Thesefamilies can be identified through household asset surveys, and theappropriate intervention will be an income supplementation pro-gram, such as food stamps or job creation through public works.At present the National Food Authority spends P2 billion3 to P3billion ($71 million to $107 million) a year to finance a generalized
O V E R V I E W 9

food subsidy, which has been shown to do little or nothing to im-prove the nutritional status of the poor. These funds would bebetter reallocated to finance effective growth promotion and foodsecurity programs of the above type.
In contrast to its commitment and initiative in micronutrientmalnutrition, the government has mounted no comparable effort toimprove the PEM control program. Despite a continuing reductionin PEM rates, moderate malnutrition, as measured by internationalstandards, still affects more than a quarter of preschoolers. Andgiven the close links between PEM and child deaths, continuingslow progress in reducing PEM may also threaten the achievementof national goals to reduce mortality. The proposed rapid phaseoutof the PL 480 program will precipitate a reorientation of the nutri-tion program. It is essential to use this reform opportunity to re-design the nutrition program to benefit the most vulnerable:pregnant women and very young children. Reducing PEM will re-quire not only livelihood-creation programs, as currently empha-sized, but also a revamping of the growth promotion program andthe creation of a new and more efficient, targeted food securityintervention.
Early Education Programs
Before devolution the Department of Social Welfare and Develop-ment, through the Day Care Center Program, was the main govern-ment provider of early education services. As with health andnutrition programs, this program has now been devolved, and lo-cal governments are legally required to provide it. Although calleda day care program, the Day Care Center Program is really a pre-school program, because it takes children for only two to threehours a day. Its coverage has been expanding very rapidly, from13,900 centers in 1991 to more than 18,000 in 1992, but the programstill covers less than half of all barangays. The key peripheralworker is the day care worker, who is responsible for a day carecenter serving about sixty 4- to 6-year-old children in a barangay,about 45 percent of the population of that age group. Day careworkers receive an allowance ranging from P500 to P1,000 ($18 to$36) a month and are supervised by social welfare workers at themunicipal level.
In addition, the Department of Education, Culture, and Sportsruns about 2,900 preschool classes for 6-year-olds, using its exist-ing school buildings and teachers. (Elementary education in thePhilippines has in the past not begun until age 7, but the govern-ment recently decided to extend entry to 6-year-olds.) The depart-
10 I M P R O V I N G E A R L Y C H I L D H O O D D E V E L O P M E N T

ment has also recently allocated a small amount of money to begina new community-based preschool program for 4- to 6-year-olds,bringing to the fore the question of how responsibility for earlyeducation should be divided between agencies. Given that the De-partment of Education, Culture, and Sports will be preoccupiedwith expanding elementary school and has no comparative peda-gogical advantage in preschool, and given that the Department ofSocial Welfare and Development already has a very substantialpreschool infrastructure, it seems sensible to upgrade the day carecenters to become the national public sector preschool program for3- to 5-year-olds.
It is generally agreed that the quality of the day care centers islow. Learning materials are in short supply, workers are gener-ally poorly trained, and in some areas workers are not receivinga sufficient financial incentive for good-quality work. A variety ofmeasures are needed to improve the program: improving curricu-lum content, developing minimum acceptable standards for a daycare center, creating a new training capacity, raising day careworkers’ allowances where these are less than P1,000 ($36) amonth, limiting the number of children in each class to no morethan twenty, and adding a social welfare worker in each mu-nicipality to ensure good-quality supervision and on-the-jobtraining. To increase the outreach and equity of the program,satellite home-based centers, serving six or seven children, couldbe developed where poor clients live outside easy reach of thevillage center.
It is difficult to assess how effective the operation of the earlyeducation program is because systematic evaluation is not takingplace. This situation needs to be remedied as a priority. But it isclear that the quality is low and that most local governments arepreoccupied with expanding the number of centers rather thanmaking them work well. If the quality is to be improved, localgovernments will have to have an assistance package in which thelocal government would undertake to improve quality accordingto measures that have been agreed on in return for technical, finan-cial, and training assistance from the Department of Social Welfareand Development.
Strategy Issues
This section begins by summarizing some technical, institu-tional, and financial issues that are specific to nutrition and toearly education. The subsequent issues—the overriding ones inchild development—all relate to how the government can integrate
O V E R V I E W 11

what is now essentially a series of vertical interventions into achild development program that responds to the needs of the childas a whole. Cross-cutting issues include how to target the mostdisadvantaged and provide integrated services to them, how tomaximize the contribution of local communities and nongovern-mental organizations to the program, and how to manage the pro-gram under devolution.
Strategies for Reducing PEM
As noted above, the current nutrition strategy has not reducedmoderate malnutrition to acceptable levels. Several changes instrategy appear to be required. First, the growth promotion pro-gram at the barangay level seems unlikely to succeed unless nutri-tion workers are better trained and paid a financial incentivecommensurate with the time it takes to do good growth monitor-ing, counseling, and supplementary feeding for a large populationof malnourished mothers and children. Second, with the phasingout of PL 480 resources, the government will need to take financialresponsibility for the supplementary feeding program. Further-more, it will need to retarget the feeding program to the neediestwomen and children to make sure the additional expenditure isused as efficiently as possible. Third, the growth promotion pro-gram will need to be complemented by an effective nutrition safetynet program for the food insecure, perhaps through a food stampor public works program.
These three changes will together require a significantly increasedfinancial commitment to the nutrition program. Such a commitmentis affordable for a country with the Philippines’ per capita income;poorer countries such as India have already been able to put na-tional PEM programs with similar strategies and financial require-ments into place. Nevertheless, putting additional resources into thePEM program will be difficult, given the current fiscal constraints.Because the government is already spending, unproductively, anamount on a generalized food subsidy that would be enough tofinance the recurrent costs of reorienting the PEM program along theabove lines, the most efficient financing option would be to reallo-cate resources currently going to the National Food Authority.
The Government’s Role in Early Education
Although the government’s role in financing a minimum packageof health and nutrition services is well accepted in the Philippines,its financing role in early education is more controversial. The
12 I M P R O V I N G E A R L Y C H I L D H O O D D E V E L O P M E N T

key issues center on the role of government in early education andday care—the areas that involve significant capital and recurrentcosts. Data on the cost-effectiveness of preschooling in the Philip-pines are very weak. A recent study concluded that preschoolingreduces the dropout rate from school and improves the perform-ance of those who stay in school. But the study did not look at thecost or quality of the existing system or analyze the relative cost-ef-fectiveness of different approaches. Given the uncertainties aboutrelative cost-effectiveness and the best way to design a preschoolprogram in the Philippines, we conclude that not enough is knownfor the government to fund a program of universal preschooling. Todetermine whether the government should do so, a longitudinalcost-effectiveness study of different approaches to preschoolingshould be undertaken.
Despite uncertainties about funding universal preschooling, acase can be made for the government to improve the quality andcoverage of the existing day care center program, provided that themost disadvantaged children in each barangay get access to theprogram and that the day care center become a convergence pointfor all early childhood development (ECD) services in the barangayand hence be used to maximize the synergy of health, nutrition,and education interventions. The poor cannot afford to send theirchildren to private sector preschools. But the study of preschoolingmentioned above did unambiguously show that going to preschoolreduces the likelihood of poor children dropping out of elementaryschool to the point where they are no more likely to do so than thechildren of the better-off. From an equity perspective, an alreadymandated intervention that significantly narrows the differentialbetween poor and rich should receive continued public sector sup-port until there is hard evidence that an alternative approach ismore cost-effective.
The situation with regard to day care for the children of workingmothers is different. Here the potential role for the private sector ismuch greater. In addition to providing long-term benefits to soci-ety, day-long day care (as opposed to the two to three hours ofpreschool offered by the so-called day care program) offers imme-diate financial benefits to parents because it frees their time to en-ter the labor market or to take a higher-paying job outside thehome. Private sector, home-based day care has been shown inother countries to be both financially viable and equitable; lowoverheads mean that the service is affordable even for poorwomen, and the centers themselves generate additional employ-ment for poor women. But this system is not yet widespread in thePhilippines. Therefore a case can be made for the government to
O V E R V I E W 13

provide seed money and technical support for demonstrationhome-based day care centers so that poor women are aware thatthey can be both users and providers of the service.
Targeting Field Services
The government has ranked provinces in terms of disadvantageusing a weighted indicator that includes measures of illiteracy,infant mortality, malnutrition, sanitation, and the head count andpoverty gap definitions of poverty. This mechanism for geographictargeting is proposed as the main way to allocate additional re-sources for antipoverty programs. But, as noted above, many dis-advantaged children in better-off regions of the country, such asthe National Capital Region and Mindoro, will be neglected if thistargeting mechanism is applied to the ECD program. Thus the gov-ernment should adopt alternative targeting mechanisms that areable to select the most disadvantaged and the most at risk fromamong populations of the better-off throughout the country.
Given the difficulties of using income as a targeting mechanism,and given that low income often inadequately predicts which fami-lies will have an at-risk child, a two-step, non-income-based target-ing mechanism should be used. The first step identifies thosewomen in each barangay who are pregnant or lactating, as well asall children under 6, as the members of the population who are atthe most vulnerable period of the reproductive cycle from a devel-opmental perspective. This would be the broad target group onwhich fieldworkers should concentrate their time. The second stepidentifies families within this group that are actually or potentiallymost at risk by measuring PEM status and family assets as proxiesfor the whole range of indicators of disadvantage.
The Convergence of Field Services
Evidence from around the world clearly shows that ECD programsthat integrate health, nutrition, and early education interventionshave more impact than those aimed at one aspect of child develop-ment alone. This is because disadvantage in one aspect of develop-ment reinforces disadvantage in another (Box 1). Children who aremalnourished are more likely to fall ill, and vice versa. And chil-dren who are malnourished or ill learn more slowly. The mutuallyreinforcing nature of child development problems means that inte-grated programs benefit greatly from synergy. Strategies to ensurethe convergence of services in the field assume particular impor-tance in this context.
14 I M P R O V I N G E A R L Y C H I L D H O O D D E V E L O P M E N T

Because of devolution, and for the first time, the key ECD work-ers at the barangay level now all report to one authority at the cityor municipal level. Advantage needs to be taken of this new oppor-tunity to integrate services. In the past, the delivery of ECD serviceswas split among several agencies, and heavy reliance had to beplaced on interagency committees to coordinate the integration ofservices. Interagency committees are a relatively weak mechanism
Box 1. Interrelation of Health, Nutrition, and Educationon Early Childhood Development
Health impacts on nutrition
• Severe or multiple acute respiratory infections and fevers lead toweight loss.
• Severe or repeated diarrhea and associated dehydration reducenutrient uptake and lead to weight loss.
• Heavy parasite loads (intestinal, malarial, schistosomes) reducenutrient uptake.
Nutrition impacts on health
• Children not eating enough have weakened immune systems andare more likely to get infections and die.
• Vitamin A–deficient children also have weakened immune sys-tems and are more likely to be ill and die.
Health and nutrition impacts on psychosocial development and learning
• Children with iodine deficiency have lower IQs.• Malnourished and frequently ill preschoolers are listless, play
less, learn less at home, and become less well socialized.• Malnourished and frequently ill children have poor school atten-
dance and are more likely to drop out.• Malnourished children have shorter attention spans and less
learning capacity in class.
Preschool impacts on school
• Children who have been to an organized preschool are bettersocialized and adjust more quickly to elementary school.
• Children who have attended preschool are likely to progressmore quickly and achieve better test results, particularly in theearly primary grades.
• Children who have attended preschool are less likely to drop outin the course of primary school.
O V E R V I E W 15

for changing the behavior of workers in the field. Now that themanagement of service delivery for all ECD interventions is inte-grated at the local government level, the convergence of servicescan be approached through the more effective mechanism of rede-signing both the job content of workers at the periphery and theway in which supervision and on-the-job training are carried out.
The job content of the proposed new child development workerfor children under age 4 and of the existing day care worker shouldbe designed so that each can provide the full range of core ECDservices appropriate for the age group for which the worker isresponsible. In practice, because children’s needs are different atdifferent ages, the child development worker would spend moretime on health and nutrition, and the day care worker would spendmore time on organized preschool activities. Much could also bedone to integrate supervision and training: redesign supervisionroutines so that health, nutrition, and social welfare staff makesome joint visits and attend staff meetings together; develop a com-mon core curriculum for training child development workers andday care workers; and have an integrated team of health, nutrition,and social welfare staff provide training.
Participation by Communities and Nongovernmental Organizations
For communities and nongovernmental organizations (NGOs), par-ticipation in development programs can vary from simple consul-tation, through involvement in program monitoring, to full-scaleprogram management. A systematic process of consulting with dis-advantaged communities, using structured interviews and focusgroups, needs to be set up, preferably using the skills of NGOs thathave the confidence of client communities. These consultationsshould be used to gain a better picture of communities’ preferencesand needs and to develop options for ECD programs appropriatefor different circumstances. Also, communities and NGOs could begiven a greater role in monitoring programs. For example, theycould post key program performance information at day care cen-ters. And communities could be involved in “verbal autopsies”—inquiries into what went wrong with the ECD program in the eventof a preventable child death.
Government funds should also be used to finance ECD interven-tions jointly planned and managed by local governments, commu-nity organizations, and NGOs along the lines of the CommunityHealth Partnerships already set up by the Department of Health.Where experienced NGOs exist and can help intermediate between
16 I M P R O V I N G E A R L Y C H I L D H O O D D E V E L O P M E N T

local governments and communities, these partnerships are likelyto be the best mechanism for developing the Child DevelopmentProgram Agreements proposed below and for ensuring that theyreflect local priorities. Outstanding NGOs could also greatly in-crease their impact if given more opportunities to leverage theirresources and expertise by helping other institutions expand andimprove their quality. They could help in consultations with localgovernments and communities; with curriculum development andtraining; with experimenting with and evaluating different ways todeliver services, especially in early education; with developing theinstitutional capacity of other NGOs; and with policy analysis andevaluation.
The for-profit NGO sector is most active in preschool education.The Department of Education, Culture, and Sports has accreditedmore than 1,300 private preschools, and it is believed there may beseveral times that number of small, unaccredited preschools andday care centers. The government’s main current involvement iswith accreditation. A more proactive role is recommended, includ-ing experimentation with technical assistance and training to im-prove the quality of private preschools and, more radically, withfinancing private sector preschools on a contract basis. But the cost-effectiveness of private sector support and provision needs to becarefully evaluated before applying such approaches nationwide.
Program Management under Devolution
Most provincial and municipal governments took over child devel-opment and other social services with very little experience in howto manage them. There are few data as yet on how they have per-formed or how spending behavior in the social sectors haschanged. However, there is some concern that public demand forclinical care and new day care centers may cause priorities to shiftat the expense of outreach care and program quality. The centralgovernment is also having to adapt to a new role—that of not man-aging, but influencing, program implementation. This is donethrough “marketing” priority programs, providing technical assis-tance, and using central financing to supplement and influence theuse of local government resources.
Both the Department of Health and the Department of SocialWelfare and Development need to develop their capacity to advo-cate child development to local governments and to systematicallyconsult them about their priorities. In training, the Department ofSocial Welfare and Development in particular, as a small agency,
O V E R V I E W 17
needs to build up its institutional capacity to support local govern-ments. In financing, the Department of Health has developed theconcept of Comprehensive Health Care Agreements, in which localgovernments agree to provide certain services in return for speci-fied hardware, cash, and software from the national government. Itwould be desirable for the Department of Social Welfare and De-velopment to adopt a similar mechanism and to form with theDepartment of Health and local governments joint “Child Develop-ment Program Agreements” that would govern all investment inECD in an integrated way.
The Role of the Central Support Institutions
The Council for the Welfare of Children is the main agency forformulating policy on, coordinating, and monitoring child devel-opment. A fairly new and very small agency with a budget of onlyP5 million ($0.18 million) in 1994, the council has few highlyskilled technical personnel and limited influence with the cabinetand line agencies when it comes to budgets for child developmentprograms. For the council to become a fully effective national over-sight agency for children, its structure needs to be reviewed, thenumber and levels of professional posts increased, and its budgetincreased substantially.
The National Nutrition Council’s staff is more than three timesas large as that of the Council for the Welfare of Children, but it,too, because of its advisory status, has had difficulty in influencingpolicies and budgets. And although it has done much useful re-search, it has not rigorously analyzed some of the key issues, suchas what causes malnutrition in the Philippines and whether expen-ditures from the generalized food subsidy should be reallocatedinto an effective program to both promote growth and provide asafety net. A key issue with regard to the National Nutrition Coun-cil is whether it should develop a comparative advantage in one ortwo major missions or continue with its multiple missions, whichnow include policy analysis and development; program coordi-nation; nutrition surveillance; information, education, and com-munication; and coordination of the implementation of certainintervention programs.
Finally, early education has no national support institution com-parable to those already established in health and nutrition. Con-sideration needs to be given as to whether a new institution shouldbe created for this purpose. Given the government’s lack of com-parative advantage in early education, and given existing moves to
18 I M P R O V I N G E A R L Y C H I L D H O O D D E V E L O P M E N T

streamline the civil service, it may be preferable to support earlyeducation by establishing a network of existing governmental andnongovernmental institutions with expertise in this area. This net-work would need a small secretariat that would provide directionand guidance and that would have a discretionary budget allowingit to commission work from qualified network members.
Financing a Strengthened ECD Program
The budget for ECD programs in 1994 was approximately P2,107million ($84 million), or about P195 ($7.80) for each preschooler.Allocations to ECD need to rise substantially to meet the gaps incoverage and quality noted above. However, unless policy action istaken, allocations for ECD will probably fall by as much as half abillion pesos (about $18 million) rather than rise. Unless other re-sources can be found to substitute for the P430 million ($15 mil-lion) PL 480 spending on food supplements, the current amountspent on nutrition will fall by about half. If the apparently excep-tional P91 million ($3.26 million) 1994 congressional insertion forthe day care center program is not sustained, the amount spent onearly education may also fall. The 1995 budget included P63 mil-lion ($2.26 million) for the day care program, a reduction of almostone third. As a congressional initiative, there is no guarantee thatthis item will be renewed annually. This would reduce spending toabout P150 ($5.90) per child.
On the basis of assumptions detailed in the following chapters,the cost of bringing the national ECD program up to a level ofquality and coverage sufficient to meet national targets wouldbe P9.6 billion to P10.5 billion ($342 million to $374 million) oversix years. Table 1 shows the breakdown of these costs, assuming
Table 1. Estimated Costs, Available Resources, and Financing Gap for Investments in Early Childhood Development Programsover Six Years in the Philippines(millions of pesos)
Health Nutrition Education Total
Total costs 7,128 6,793 4,937 18,857Available resources 4,433 2,951 1,451 8,835Resources as a percentage of costs 62 43 29 47Financing gap 2,695 3,842 3,486 10,023Financing gap (millions of dollars) 96 137 124 358
Source: World Bank and ADB data.
O V E R V I E W 19

investment in the middle of this range. It indicates that, overall, theresources currently planned for ECD are about 47 percent of what isneeded. These estimates are conservative in that they assume afairly modest, even phasing of program expansion over six years.
At the time of devolution, local governments inherited an unfin-ished agenda for ECD, an agenda that required substantial addi-tional investment. The revenues that provinces and municipalitieswere allotted then and their revenue growth since are insufficientto strengthen and expand the program. Although local govern-ments and local communities should pay their share, it is clear thatthe central government will need to provide continuing financialsupport for ECD activities, as it does in other countries. However,the central government must also avoid simply substituting its fi-nancing for efforts that local governments could otherwise make.This implies that a cost-sharing policy be developed. Such a policyshould ensure that local governments increase their share of ECDprogram financing over time as their revenues and their ability tosustain the ECD program increase. At the same time the policyshould ensure that the central government continue to partlyfinance the ECD program, if necessary, over the long term in mu-nicipalities whose weak revenue base, large populations, andpoor ECD indicators make it impossible to sustain the programalone. Developing an appropriate cost-sharing policy will requirethe collection of additional data on local governments’ ability andwillingness to pay for ECD programs. Collecting these data is a highpriority.
The incremental recurrent cost required to sustain a strength-ened and expanded ECD program would be in the range of P1.5billion to P2 billion ($54 million to $71 million) a year over five toten years. It is now not clear how much of this the local govern-ments could finance. On the central government side, much of theDepartment of Health’s requirement could be met from the pro-posed allocation for ECD in its investment plan. But the Departmentof Social Welfare and Development would require an increasedceiling to fund a strengthening of the day care program. Reallocat-ing resources within and between government departments couldfree up substantial additional funds for ECD if this program is des-ignated as a national priority. With the upcoming reduction in PL480 support, a particularly strong case can be made for reallocatingfood subsidy expenditures made by the National Food Authorityinto an effective nutrition program for children. However, budgetreallocations are politically difficult and take time. Time is alsorequired for local government revenues to grow to a point wherelocal governments can sustain an increasing share of the ECD pro-
20 I M P R O V I N G E A R L Y C H I L D H O O D D E V E L O P M E N T

gram. In the interim, foreign aid could help to fill the financinggap. The donor community is putting few resources into ECD; astrong case could be made for donors to substantially increase theircommitments if the government decides that reorienting andstrengthening the ECD program is a national priority.
The Returns to Investment
The kinds of primary care interventions in health and nutrition in-cluded in the Philippines ECD program rank among the most cost-ef-fective of all health interventions. Global estimates indicate that theequivalent of an extra year of healthy life can be obtained by spend-ing $25 to $30 on immunization, vitamin A, and iodine supplemen-tation or about $63 on food supplementation. For comparison,prenatal and delivery care cost $60 to $110 and family planning$100 to $150 for each healthy life-year gained. These ECD interven-tions are not only quite cheap to implement, but also save latergovernment expenditure on much more expensive hospital care andrehabilitation. And they are good for equity, because the children ofthe poor suffer disproportionately from ill health and malnutrition.
A recent computer simulation of the impact of improving childmalnutrition in the Philippines indicated significant potential bene-fits. It estimated that a 50 percent reduction in PEM would avertmore than 37,000 infant and child deaths each year and save 150million to 200 million days of illness each year. Reducing iodinedeficiency by half would avert more than 15,000 cases of mentalretardation every year. Reducing anemia by half might lead to ad-ditional earnings from increased agricultural productivity of morethan P1,340 million ($48 million) a year. And reducing iron defi-ciency, stunting (low height for age, which indicates cumulativemalnutrition over time), and malnutrition-related mortality by halfmight lead to additional wage earnings of P8,400 million ($300 mil-lion) a year.
Quantifying the cost-effectiveness of preschool is more difficult.But it is clear that integrated interventions in health, nutrition, andearly education reduce the school dropout rate and improve chil-dren’s performance in school. There is also evidence that inte-grated ECD programs have sustained long-term benefits to theeconomy and society. Evaluation of a U.S. ECD program for disad-vantaged inner city children that has run since 1962 showed that forevery dollar invested, $7 was gained in lower expenditures on edu-cation and welfare and higher productivity among participants. Atage 19, former participants were 56 to 80 percent more likely to beliterate, enrolled in postsecondary education, or employed and 39 to
O V E R V I E W 21

57 percent less likely to be classified as mentally retarded, schooldropouts, arrested for criminal activity, or on welfare.
Recommendations
A serious effort to improve the situation of preschoolers wouldrequire a commitment to the following four policies.
• Move from a system of largely separate, vertical programs to anintegrated program approach to health, nutrition, and early educa-tion. Because of the synergy among investments in each ofthese areas, an integrated approach will mean more benefit foreach peso invested. Effective integration will require signifi-cant institutional changes (see Box 4-1 for a summary).
• Mount a determined drive to improve the quality of programs.Among other things, this effort will require increased staffinglevels to realistically reflect workloads for service deliveryand for support and supervision. In particular, a paid workeris needed in each disadvantaged barangay to look after theECD needs of pregnant and lactating women, as well as chil-dren under 4. Also, additional supervisors are needed for theday care program because the ratio of supervisors to day careworkers is inadequate for good-quality supervision and on-the-job training.
• Substantially increase spending on ECD, to increase both the qualityof programs and their coverage to unserved, disadvantaged children.The Philippines is now spending about P195 ($7.80) per pre-schooler on ECD—an amount that with current plans will fallduring the next few years to about P150 ($5.90) as existingchild survival projects come to an end and donor support forthe PL 480 nutrition program is phased out. Instead of allow-ing resources for children to fall, during the next six years thegovernment should be investing about P275 ($11) per child—an increase of about 40 percent—to achieve the national goalsfor children. The total required increment over the six years isestimated to be about P10 billion ($400 million). Much of thisincrement could be met by reallocating resources now spentless productively. In particular, funds for food subsidies fromthe National Food Authority, which appear to have little im-pact on malnutrition, could be much more productively spenton a targeted nutrition program for preschoolers.
• Accept that achieving the nation’s ECD goals will require a sus-tained investment by the public sector in recurrent costs over the
22 I M P R O V I N G E A R L Y C H I L D H O O D D E V E L O P M E N T

medium and long terms. More than 80 percent of the estimatedsix-year investment requirements represent recurrent costs.Some of this investment can come from local governments; anurgent priority is to collect data on local governments’ abilityand willingness to pay for ECD services so that an equitablecost-sharing policy between the central and local governmentscan be determined. But many areas in the country where chil-dren are worst-off are also those where local governments areleast able to pay for improved and expanded services. Herethe central government will need to make a policy commit-ment to partly finance the recurrent costs of strengthening theECD program over the medium and long terms. This kind ofinvestment is amply justified in cost-benefit terms and on thegrounds of equity and market failure.
If these general commitments are made, the central governmentwould need to take the following steps to translate policy inten-tions into a program of action:
Preparation Phase
• Resolve specific policy issues relating to the current nutritionand early education programs and to the appropriate form ofcentral technical support for child development in general andearly education in particular
• Develop a detailed, costed child development program plan,in consultation with local communities and local governments
• Mount studies on local governments’ ability and willingnessto pay for ECD, as a prelude to developing cost-sharing poli-cies between central and local government.
Implementation Phase
• Rapidly implement interventions where it is clear what needsto be done (for example, expand health and nutrition pro-grams and strengthen the existing day care program)
• Do pilots of interventions where the best approaches to imple-mentation are unclear (for example, pilot home-based day carecenters)
• Initiate research studies where the appropriateness, scale, ortype of public sector intervention is unclear (for example, re-search whether the government should provide preschoolingfor children of the better-off).
O V E R V I E W 23

Notes
1. Devolution is an extreme form of decentralization. It involves not only increasing theresponsibilities of lower levels of government but also transferring substantial budgetarycontrol to them. The Philippine government devolved a number of services, includinghealth, social welfare, and agricultural extension, in 1991.
2. All dollar amounts are in 1994 U.S. dollars, with no allowance for inflation.3. A billion is 1,000 million.
24 I M P R O V I N G E A R L Y C H I L D H O O D D E V E L O P M E N T

1. Introduction
This study appears to be the first in the Philippines to attempt acomprehensive, combined review of the three subsectors—health,nutrition, and education—that most affect the development of pre-school children. Because this book presents a broad sectoral reviewrather than a project proposal, it aims to provide no more than anoverview of the problems, issues, and needed interventions inearly childhood development. To turn the general recommenda-tions and estimates made here into a detailed, costed investmentprogram requires more work.
In line with its broad scope, the intended audience of this book isthe whole community of those involved in planning, managing,and financing child development in the Philippines. This includesthe agencies of the central government with policy responsibilityfor early childhood development; the politicians and economicagencies at the national level who allocate resources; the local gov-ernments, which are now both financiers and implementors of theprogram; the nongovernmental organizations involved in programimplementation, advocacy, or technical support; and the foreignaid community.
This book has three specific objectives. The first is to inform.Many of those involved in child development are well informed onthe program with which they are immediately concerned but lesswell informed on other programs equally important to the devel-opment of the child. Others have developed effective, integratedservices on a small scale but lack the big picture of what is happen-ing nationally. The hope is that a shared vision of problems andneeds in the sector will lead to unified action.
The second objective is to review and analyze. The book at-tempts to go beyond a situation analysis of the status of childrenand to form some judgments about the effectiveness of the mainnational programs and the needs for reorientation and investment.In particular, the book analyzes what causes protein-energy malnu-trition (PEM) and what an appropriate response to the problem
25

might be. This analysis goes beyond the conventional wisdom thatPEM is a problem of poverty and lack of purchasing power. Thebook also presents an analysis of sectoral resource needs, an analy-sis that, although approximate, goes beyond what has been donebefore in both scope and detail.
The third objective is to advocate. The book argues that the Phil-ippines should be investing more in child development and thatdoing so will have a high payoff. The objective is to convince thosewho control resources in the central and local governments, and inthe nongovernmental and donor communities, that they should fi-nance an integrated investment package that has a real prospect ofmeeting the national goals for children. The technologies forprogram design and implementation are well-enough known;the finance can be raised or reallocated; and the goals can beachieved—if the commitment of the government, nongovernmen-tal, and donor communities can be crystallized around a sharedvision of what needs to be done.
This chapter summarizes what is meant by child development,as opposed to just child survival—which was until recently themain objective of programs for children—and what the main char-acteristics of an effective early childhood development (ECD) pro-gram are. It also reviews the growing body of evidence showingthat government investment in child development, in addition tobeing a humanitarian priority, has a high economic payoff.
Chapter 2 summarizes the data on the developmental status ofpreschool children in the Philippines, focusing on which childrenare the most disadvantaged. It offers suggestions for improving thequality and usefulness of the data and draws implications from thedata about the kinds of programs that would have the most impacton the development and welfare of young children.
Chapter 3 reviews the coverage and quality of the current pro-grams in each subsector—health, nutrition, and early education—to determine which strategies are sound and which need substantialreorientation if national goals are to be met.
Chapter 4, in contrast to Chapter 3, takes a cross-sectoral perspec-tive. It looks at ways to integrate the interventions and reviewsissues common to all three programs, such as how best to managethem now that responsibility for implementation has devolved tolocal governments and how best to maximize the participation ofcommunities and NGOs.
Finally, Chapter 5 looks at the key financing issues in the sector:how much the Philippines has invested compared with other Asiancountries; the additional resources required to reach national goals;
26 I M P R O V I N G E A R L Y C H I L D H O O D D E V E L O P M E N T
and the prospects for financing and sustaining the additional in-vestment required.
What Is Early Childhood Development?
During the 1970s and much of the 1980s, the aim of large-scaleinvestment in programs to assist children in the developing worldwas mainly child survival. By contrast, the aim of child develop-ment programs is not only to promote survival but also to promotethe physical, intellectual, social, and emotional development ofthose who survive, recognizing that children cannot develop fullyas personalities or contribute fully to society unless attention ispaid to all these aspects of development. Such programs often fo-cus on early childhood, that is, the preschool years, because this isthe period when children develop fastest and a good deal of re-search shows that, if children’s development is compromised atthis stage, it is often impossible, and always much more difficultand expensive, to compensate for the disadvantage later.
In this book, child development problems refer to problems of illhealth, malnutrition, or inadequate psychosocial development, thelast being used as a summary term for intellectual, social, andemotional development. Child development interventions meanhealth, nutrition, and early education interventions, with the un-derstanding that early education in this field means not just organ-ized education, such as nursery school or kindergarten, buteverything that parents do to provide an intellectually stimulating,socially adjusting, and emotionally supportive environment fortheir children. The book deals only with early childhood develop-ment (or ECD), that is, with the development of preschoolers, al-though for convenience ECD is often referred to simply as childdevelopment.
The concept of a child development program is not universallyfamiliar. The remainder of this section, therefore, discusses howinterest in early childhood development evolved and what kinds ofactivities are seen as the essential ingredients of an effective childdevelopment program.
The Evolution of Interest
At least three factors are responsible for the rising interest in childdevelopment during the past ten years. The first is simply the in-creasing success of child survival programs, coupled with progressin economic development. As infant and child death rates have
I N T R O D U C T I O N 27

fallen, especially in Latin America and Asia, governments havebeen less overwhelmed with the emergency of survival; at thesame time, rising incomes and bigger government budgets haveallowed them to think of expenditures beyond those for survival.
A second factor has been a wave of research findings, some ofwhich are summarized below, showing not only that investment inchild development has high economic returns but also that failureto invest in child development results in reduced school perform-ance, a less productive labor force, and increased welfare and othersocial expenditures.
A third factor has been a succession of international events thathave done much to promote these research findings and the impor-tance of child development generally. These include the confer-ences prior to the adoption of the 1989 Convention on the Rights ofthe Child; the 1990 World Summit for Children, at which a numberof ambitious development goals were adopted; the 1990 WorldConference on Education for All, which, under the slogan “learn-ing begins at birth,” affirmed the importance of early education forlater development; and the 1992 International Conference on Nutri-tion, at which participants committed their governments to achiev-ing substantial reductions in child malnutrition. Largely because ofthe leadership of UNICEF at these conferences and elsewhere, childdevelopment has moved from UNICEF’s advocacy agenda to be-come part of the mainstream development agenda of most govern-ments and foreign aid agencies.
As of the mid-1990s, progress in child development around theworld is very mixed. Some countries made major financial commit-ments to launching and expanding child development programs inthe early 1980s. India, whose Integrated Child Development Serv-ices program now covers most of the country’s most disadvan-taged children, is an example of what can be achieved despite lowper capita income. Other countries, including the Philippines, havepledged their political commitment to child development in inter-national fora but have yet to translate their pledge into a financialcommitment sufficient to achieve the ambitious goals they setthemselves at the World Summit.
Designing Effective ECD Programs
From research findings and field experience with interventionprograms, a good deal is now known about what makes an ECDprogram effective. Four design features in particular stand outand may be taken as prescriptive. We discuss them below; they
28 I M P R O V I N G E A R L Y C H I L D H O O D D E V E L O P M E N T

are discussed more fully, together with others, in Myers (1992),a seminal reference that sets out the current “state of the art” inchild development.
FOLLOW AN INTEGRATED APPROACH. Effective ECD programs com-bine interventions in health, nutrition, and early education. Thecross-sectoral approach is advocated partly because this makessense to parents and children. “A child is born without barriers. Itsneeds are integrated, and it is we who choose to compartmentalizethem into health, nutrition, or education. Yet the child itself cannotisolate its hunger for food from its hunger for affection or its hun-ger for knowledge” (Alva 1986 quoted in Myers 1992).
A combined approach also has more impact. Disadvantage inone aspect of development reinforces a child’s disadvantage in oth-ers. For example, children who are malnourished are more likely tofall ill, and vice versa; and children who are malnourished or illlearn less quickly. Box 1-1 sets out several of the most importantlinkages between health, nutrition, and psychosocial development.A child’s risks of death or disadvantage combine geometricallyrather than arithmetically. That is, a child who is severely malnour-ished as well as ill has not just twice but several times the risk ofdying that a child who is only ill does. The mutually reinforcingnature of health, nutrition, and psychosocial developmental prob-lems means that, correspondingly, integrated approaches to solv-ing them benefit from synergy and have a much higher payoff thanprojects or programs aimed at one aspect of child developmentalone.
Integrating health, nutrition, and early education efforts at theoperational level does not necessarily imply that management hasto be integrated. Child development interventions in different sec-tors do not have to be implemented under the aegis of a singleorganizational structure in order to achieve effective integration intheir effects. Although an integrated structure may be best in the-ory, radically altering existing organizational arrangements mayentail adverse political or other consequences and can dissipateenergy better directed at helping the children. Therefore, depend-ing on the situation, organizing services from different agencies sothat they converge on families in need in a coordinated mannermay be more practical than integration in the strict sense.
BEGIN BEFORE BIRTH AND ADOPT DIFFERENT INTERVENTIONS ATDIFFERENT AGES. Most of the development of a child’s brain, nerv-ous system, and motor system is complete by the age of 6; much of
I N T R O D U C T I O N 29
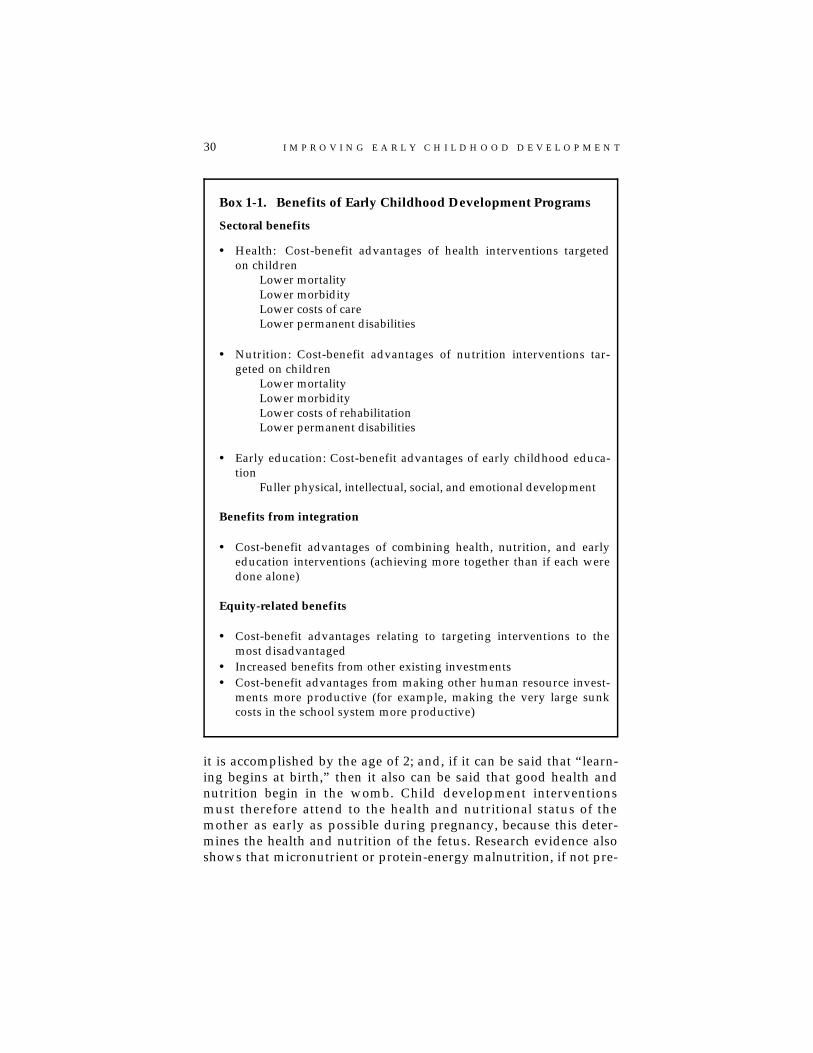
it is accomplished by the age of 2; and, if it can be said that “learn-ing begins at birth,” then it also can be said that good health andnutrition begin in the womb. Child development interventionsmust therefore attend to the health and nutritional status of themother as early as possible during pregnancy, because this deter-mines the health and nutrition of the fetus. Research evidence alsoshows that micronutrient or protein-energy malnutrition, if not pre-
Box 1-1. Benefits of Early Childhood Development Programs
Sectoral benefits
• Health: Cost-benefit advantages of health interventions targetedon children Lower mortality Lower morbidity Lower costs of care Lower permanent disabilities
• Nutrition: Cost-benefit advantages of nutrition interventions tar-geted on children Lower mortality Lower morbidity Lower costs of rehabilitation Lower permanent disabilities
• Early education: Cost-benefit advantages of early childhood educa-tion Fuller physical, intellectual, social, and emotional development
Benefits from integration
• Cost-benefit advantages of combining health, nutrition, and earlyeducation interventions (achieving more together than if each weredone alone)
Equity-related benefits
• Cost-benefit advantages relating to targeting interventions to themost disadvantaged
• Increased benefits from other existing investments• Cost-benefit advantages from making other human resource invest-
ments more productive (for example, making the very large sunkcosts in the school system more productive)
30 I M P R O V I N G E A R L Y C H I L D H O O D D E V E L O P M E N T

vented or corrected by the age of 2 or 3, is impossible or verydifficult and expensive to correct later. Early intervention of theright type is crucial.
ECD interventions also need to vary in response to the child’sdiffering needs at different ages. For example, a child’s psycho-social developmental needs are very different as an infant, as atoddler, and as a four-year-old. Infants need body contact with theparent, good feeding practices, and appropriate stimulation. Tod-dlers are exploring a wider environment and need quite differentkinds of attention and opportunities for learning. The developmen-tal needs of a 4-year-old can no longer be fully met by the immedi-ate family; the child’s social and emotional development will beinhibited if he or she does not learn to interact with children of asimilar age.
AIM AT FAMILIES, NOT JUST CHILDREN. ECD programs should try toincrease the capacity of families to provide for the development oftheir own children rather than simply correct whatever disadvan-tage a child is currently suffering from. The programs need to aimparticularly at mothers, both because the mother’s health and nu-trition during pregnancy determine the child’s health and nutritionat birth and because mothers are the primary providers of care topreschoolers. But the programs must also look at the family as aunit, because a child’s advantages or disadvantages stem from thesituation of the family as a whole. Also, not just mothers but oftenfathers, grandparents, and siblings care for and influence the child.
To be effective, child development workers must be drawnfrom the local community so that they have easy access to theirclients, know them well, and are trusted by them. The client loadmust be sufficiently small to allow for thorough communicationand education—a precondition of program effectiveness. In Chap-ter 3 we discuss what a realistic client load is and how this wouldaffect staffing requirements.
FOSTER PARTICIPATION. Just as ECD programs should empowerthe family to meet the child’s full developmental needs, so shouldthey empower the community to provide for the welfare of all ofits children. Well-designed programs therefore foster the participa-tion of the clients in assessing their problems and needs and inmonitoring, planning, and implementing interventions affectingthem. As with other development programs, participation is oftenbest fostered by strengthening and drawing on the resources ofcommunity and nongovernmental organizations.
I N T R O D U C T I O N 31

Why Should the Government Investin Early Childhood Development?
Little work has been done on the specific costs and benefits ofinvesting in child development in the Philippines. This section,therefore, begins by reviewing the worldwide evidence on the cost-effectiveness of ECD. It then summarizes the findings of three re-cent pieces of analytical work on the benefits of preschooleducation and nutrition in the Philippines. Finally, it reviews thearguments for a governmental role in financing ECD.
General Findings on Cost-Effectiveness
The findings below summarize the experience with ECD investmentin general terms. Project-specific summaries of the quantitative re-sults of sixteen ECD projects in developing countries can be foundin Section B (taken from Young 1995) of the supplement volume.Other sources that document the cost-effectiveness of investing inECD are Myers (1992) and World Bank (1992).
HEALTH AND NUTRITION. The kinds of primary care interventionsthat are typically implemented in ECD programs include prenatalcare and education; immunization; oral rehydration therapy; thecontrol of acute respiratory infections; supplementation with vita-min A, iodine, and iron; and growth promotion and supplementaryfeeding to control PEM. These kinds of interventions are extremelycost-effective. World Development Report 1993 (World Bank 1993b)ranked the cost-effectiveness of different health care interventionsin terms of their cost for each additional year of healthy life theyyielded. It concluded that the “EPI Plus” package of interventions,consisting of immunization, and vitamin A and iodine supplemen-tation, ranked among the most cost-effective of all health interven-tions, costing only $25 to $30 per healthy life-year gained. Growthpromotion interventions to control PEM, although more expensive,are nevertheless also cost-effective. The World Development Reportestimated that food supplementation, for example, is in the middleof the cost-effectiveness range for public health interventions, cost-ing about $63 for each healthy year of life gained, as against $60 to$110 for prenatal and delivery care and $100 to $150 for familyplanning.
ECD programs focusing on primary care interventions can reducethe number of children who need admission to expensive hospitalbeds or who require expensive rehabilitation once chronic malnu-
32 I M P R O V I N G E A R L Y C H I L D H O O D D E V E L O P M E N T
trition has set in. Primary care interventions thus save money andare efficient. They also have equity benefits. Children of the poorsuffer disproportionately from ill health and malnutrition. Givingpoor children a better start in life helps reduce disparity by im-proving their performance in school and their productivity in laterlife. Nutrition interventions appear to have a particularly strongimpact on educational performance. A ten-year study in Mexicodemonstrated that severe malnutrition negatively affects schoolreadiness, as does the lack of home stimulation on language devel-opment (Chavez and Martinez 1981). Glewwe and Jacoby (1993), inanalyzing the Ghana Living Standards Survey, found that nutri-tional deficiencies in early childhood were associated with delayedprimary school enrollment, and argued, based on their survey evi-dence, that early childhood nutrition interventions can lead to sub-stantial increases in lifetime wealth.
There is striking evidence that nutrition interventions in earlychildhood prevent death, disability, and degenerative illness, andthat they enhance life-long educability and productivity. The les-son from public health nutrition is that poor nutrition in earlychildhood is a powerful constraint on realizing human potential inpoor societies. Operating in synergism with diarrheal, respiratory,and other infections, poor diets in early childhood lead to growthfailure, delayed motor and mental development, impaired immu-nocompetence, and increased risk of complications and death frominfections (Waterlow 1992). Child stunting linked with subclinicalmalnutrition is associated with lowered adult productivity as wellas a lasting effect on learning and behavior (Pollitt and others1993).
Studies in Colombia and Taiwan have shown that food supple-mentation has a beneficial effect on young children’s body size,capacity to work, and cognitive development and performance(Mora and others 1981; McKay and others 1978; Adair and Pollitt1985). Two well-designed studies, begun in the 1960s in Guatemalaand Mexico, clearly demonstrated that poor, rural, breastfed chil-dren who received supplementary feeding up to age 2 were taller,had fewer infections, and performed better on appropriate cogni-tive tests.
Follow-ups of the Guatemala and Mexico studies fifteen yearsafter the intervention confirm the lasting benefits of preventingmalnutrition at an early age. In Guatemala several thousand chil-dren from the original study were reexamined as adolescents andyoung adults, and the finding was that supplemented persons hadcompleted more years of schooling and performed better on multi-faceted achievement tests compared with children who did not
I N T R O D U C T I O N 33

receive the supplement. Moreover, cognitive gains that were smallat age 2 were medium to large in the follow-up study (Martorell1992; Martorell and others 1992). Mexican results were similar(Chavez, Martinez, and Soberanes 1992).
Lastly, the permanent effects of fetal malnutrition on life expec-tancy and adult health have recently been documented from stud-ies of low birth weights and stunted infants in industrial societiesin the early part of the century. Controlled longitudinal studies ofBritish males born in the 1920s and 1930s showed that infants suf-fering from fetal growth retardation at birth or infants stunted attwelve months had higher mortality as adults from cardiovasculardisease, hypertension, and diabetes (Barker 1992).
EARLY EDUCATION. Trying to separate the benefits of early educa-tion from those of other ECD interventions is difficult. As in theMexican study by Chavez and Martinez (1981), where home stimu-lation was combined with nutrition, early education interventionsare usually combined with health and nutrition interventions be-cause of the synergy involved. Even where early education inter-ventions can be separated from other ECD interventions forevaluation purposes, getting a true picture of their benefits is diffi-cult because the most easily quantifiable benefits are in improvingschool readiness and school performance. Yet early education pro-grams achieve more than school readiness; they also have signifi-cant, but hard-to-quantify, longer-term benefits, for example, interms of improving the socialization of adults. There is thereforeboth difficulty in measuring the benefits, and some controversyabout the magnitude of the benefits, of investing in early educationprograms alone.
Organized preschool is one common approach to early educationfor 3- to 6-year-olds. Preschool can have a value beyond the provi-sion of early education alone, if, in an integrated ECD program, thepreschool serves as a convergence point for all ECD services. Thereis clear evidence that, when combined with health and nutritioninterventions, well-designed preschool programs can substantiallyimprove the timeliness of school enrollment, reduce the dropoutrate of children from school, and increase the performance of chil-dren in school. For example, a review by Myers (1992) of nineteenlongitudinal evaluations of ECD programs in Latin America showedclear evidence of reduced repetition rates in primary education.And an evaluation of Brazil’s PROAPE program showed that thisintegrated ECD intervention more than paid for itself in reducingthe extra cost associated with repeating grades in primary school.The educational benefits of ECD programs are particularly pro-
34 I M P R O V I N G E A R L Y C H I L D H O O D D E V E L O P M E N T

nounced among traditionally disadvantaged groups, for example,girls and children with rural, indigenous, and lower-level socio-economic backgrounds.
Because ECD programs in developing countries have not beenrunning long or lack monitoring and evaluation systems, it is notpossible to determine the long-term effects of these programs ontheir participants. But a series of evaluations of the Perry PreschoolProgram and the Head Start Program in the United States havebuilt up considerable evidence of long-term effectiveness. For ex-ample, participation in the Perry Program increased the proportionof people who at age 19 were literate (by 60 percent), were enrolledin postsecondary education (by 80 percent), or were employed (by56 percent), whereas it reduced the percentage who were classifiedas mentally retarded (by 57 percent), school dropouts (by 35 per-cent), arrested for criminal activity (by 39 percent), or on welfare(by 43 percent). This program, which began in 1962, was evaluatedto have yielded gains of $7 for every dollar invested, in terms oflower education and welfare expenditures and higher productivityamong participants (Schweinhart 1993). In 1985 the U.S. Commit-tee for Economic Development concluded that it would be hard toimagine that society could find a higher yield for a dollar of invest-ment than that found in preschool programs for its at-risk children.
Findings for the Philippines
NUTRITION. The international research literature on the nutritionof young children has reached fairly robust quantitative conclu-sions about the relation between better nutritional status and lowerdeath and disease rates, lower health expenditure, lower mentalretardation, higher labor productivity in agriculture, and increasedearnings. The PROFILES project, carried out by the Academy forEducational Development with funding from the U.S. Agency forInternational Development, has developed a computer model thatis able to simulate some of these relationships for different levels ofand improvements in nutritional status and for different countryconditions. The model was first applied in Bangladesh in 1992, andthe Asian Development Bank financed the first application of thetechnology in the Philippines in April 1994. The assumptions un-derlying the model are based on relationships found in the interna-tional literature, modified where appropriate to fit conditions inthe Philippines wherever specific research evidence is available.Some details of the PROFILES model and the assumptions made inthe Philippines analysis are given in Section C of the supplementvolume.
I N T R O D U C T I O N 35

The simulations prepared so far look at six relationships: reduc-tion in PEM, to infant and child deaths; reduction in PEM, to infantand child morbidity; reduction in iodine deficiency, to the numberof mentally deficient children born; reduction in anemia, to in-creased agricultural productivity; reduction in iodine deficiency,malnutrition-induced mortality, and stunting, to total potentialwages gained; and reduction in morbidity that is caused by malnu-trition-induced acute respiratory infections, diarrhea, and blind-ness, to government health expenditures.
The simulations show that a nationwide investment in child nu-trition would bring very substantial annual benefits. Using 1999 asa basis, the PROFILES model estimates that a 50 percent reduction inPEM would avert more than 37,000 infant and child deaths a yearand save more than 150 million days of illness a year. Reducingiodine deficiency by half would prevent more than 15,000 cases ofmental retardation every year. The annual benefits of improvednutrition in peso and dollar terms on agricultural productivity,wages gained, and health expenditures are set out in Table 1-1.These benefits are very substantial when set against the likely costsof an effective child nutrition program (estimated in Chapter 5).The calculations are based on projections of the 1990 census popu-lation (United Nations 1993a). To accommodate variations in thereliability of the data and the robustness of the assumptions made,a range of benefits is presented for certain nutritional outcomes.
EARLY EDUCATION. Three studies have reviewed the impact ofpreschool education programs in the Philippines. The first study
Table 1-1. Annual Earnings and Savings from Improvementsin Nutrition, Estimates for 1999
Pesos (millions) Dollars (millions)
Current earnings from increased agricul- tural productivity because of a 50 percent reduction in anemia 1,340 48Future wages gained because of a 50 percent reduction in iodine deficiency, mortality, and stunting 8,400–19,600 300–700Savings in government health expendi- tures because of a 50 percent reduction of malnutrition-related diarrhea, blind- ness, and acute respiratory infections 168–672 6–16
Source: Academy for Education Development (Washington, D.C.) data.
36 I M P R O V I N G E A R L Y C H I L D H O O D D E V E L O P M E N T

(Child and Youth Research Center 1988) evaluated the impact ofthe Early Childhood Enrichment Program. As noted in Section B ofthe supplement volume, this program improved achievement in arange of subjects in the first two grades of elementary school. Butthis study did not estimate costs, it is not clear whether the im-provement had a lasting effect at higher educational grades, and itdid not look at alternative ways to improve achievement in pri-mary school, so the relative effectiveness of the program is unclear.
The second study (Mingat and Tan 1995) reviewed the impact ofpreschool education in general on elementary school outcomes. Ofits three significant findings, the first concerned the dropout ratefrom elementary school: the study concluded that children frompoor families are more likely to drop out; that preschool educationsignificantly reduces the likelihood of dropping out (the rate fellfrom 18 percent to 12 percent for children from poor farming fami-lies); and that, from the point of view of dropping out, preschooleducation fully compensates for the disadvantage of being a poorfarmer’s child. This study strongly confirms the equity benefits ofpreschool, which were found in studies in other countries. Again,however, this study did not try to estimate the cost-effectiveness ofpreschool or compare the impact of preschool to other interven-tions to reduce the dropout rate from elementary school.
The other main findings of this study related to academicachievement in elementary school. The study found that preschoolbenefits the children of the better-off more than the children of thepoor and that going to preschool for one year affects school per-formance as much as going for two or more years. These findingsseem counterintuitive. They may be an artifact of the study design,which, because of the limitations of the data, was not able to differ-entiate by the type or quality of preschooling. It is possible that thechildren of the better-off were able to go to better preschools thanthe children of the poor and therefore were better prepared forschool. Similarly, the finding that a short exposure to preschool isas good as a long one may hold true for preschool as currentlyorganized in the Philippines, but probably does not form a basisfor a policy decision about the appropriate length for better-designed, higher-quality preschooling.
The third study (Tan, Land, and Coustere forthcoming) looked atthe relative cost-effectiveness of different interventions for increas-ing student achievement in elementary school. It concluded thatpreschooling was less effective than providing workbooks or ap-propriate classroom furniture to elementary students but that itwas more cost-effective than reducing class size or increasingteachers’ credentials or experience. Because relatively little additional
I N T R O D U C T I O N 37

investment is required to provide all elementary students withworkbooks and furniture in the Philippines, this study concludedthat investing in preschooling was an attractive option.
Each of these studies broadly confirms the experience from othercountries that preschooling has significant benefits in equity andschool performance. But, because of the way the studies were de-signed, they provide no guidance as to how long preschool educa-tion should be or what preschools should be like to be mostcost-effective. More comparative analysis is needed, based on afollow-up of children going to different types of preschools and alook at the costs and effects of different kinds of preschooling.
The Role of Government
HEALTH AND NUTRITION. The fee-for-service private sector pro-vides the curative care the public is prepared to pay for. But with-out a free public program, there would be little market demand forthe preventive care that can obviate the need for much spending oncurative care; many people, especially poorer and less-well-edu-cated people, do not perceive the full value of preventive care. Thesame is true for simple forms of curative care (such as oral rehy-dration for diarrhea or cotrimoxazole for acute respiratory infec-tions) that can prevent the need for sophisticated and expensivehospital care. Left to the market, many parents will seek medicalhelp for their children too late, when, at worst, a life may be lostand, at best, the cost to the individual and the economy will behigher than it need be. Thus the government’s role in paying for aminimum package of public health services on the grounds of mar-ket failure is well accepted in the Philippines. As noted above, stateintervention to fill the failure of the market in basic health care foryoung children has very high returns.
There is also a market failure case for public financing of growthpromotion interventions to control PEM. Many parents neither real-ize their children are malnourished nor perceive the effects ongrowth of small additional amounts of calories. Left to the market,these parents will not intervene. And, left to the market, some verypoor parents will be unable to afford the additional food evenwhen they are educated about its benefits. State intervention isjustified in principle to demonstrate to all parents the existence ofPEM and how to deal with it, and, in the case of a smaller numberof food-insecure parents, to provide the wherewithal for them tofeed their children properly. The question is not so much whetherthe state is theoretically justified in intervening as whether the in-tervention is affordable. For the Philippines, the answer to this
38 I M P R O V I N G E A R L Y C H I L D H O O D D E V E L O P M E N T

question must be yes, because countries such as India, with muchlower income levels, are able to spend very substantial resourceson national-scale PEM interventions. And indeed, the Philippinesalready is spending, unproductively, an amount on general foodsubsidies that would be more than enough to finance an effectivechild nutrition program (see Chapter 3).
However, questions of the appropriate scale of coverage arise forPEM programs in a way that they do not for programs like immuni-zation, where universal coverage is required to break the chain ofdisease transmission. PEM affects children progressively less as in-comes rise. Geographic targeting is required to ensure that the PEMprogram is not implemented unnecessarily in better-off areas. Arecent survey by the Department of Health identified and mappedthe slum populations of two major cities (Metro Manila and CebuCity) on the basis of housing and other environmental conditions;these areas contain about 50 percent of the city population. Thus,one reasonable approach to defining the geographic limits of thePEM program might be to exclude the 50 percent of the urban popu-lation who are not slum dwellers.
EARLY EDUCATION. In the Philippines the appropriate role forgovernment in early education is more controversial than in healthand nutrition. The key issues center on the role of government inpreschool education and day care—areas involving significantcapital and recurrent costs—rather than on educational interven-tions to encourage better parenting. The latter can readily be com-bined, at minimal additional cost, with health and nutritionoutreach services, in which the government’s role is clearer. Bycontrast, preschool and day care centers require dedicated build-ings and staff. In principle, government investment in preschooleducation and day care is justified if it meets three tests: first, theprivate market is failing to provide services in adequate quantityor quality; second, the intervention is cost-effective; and, third, theintervention is as cost-effective, or more cost-effective, than otherinterventions the government might make to achieve similar goals.
With regard to the first of the above tests, the data on the extentand quality of private sector preschools are extremely weak. Mostaccredited private preschools appear to be in urban areas, and theimpression from field visits is that rural barangays are very poorlyserved by the private sector. Until better data can be collected onthe distribution of private preschools, it would seem reasonable toassume that the private sector serves no more than the nonslumurban areas, the same areas proposed above for exclusion from thegrowth promotion program.
I N T R O D U C T I O N 39

With regard to the second and third tests, the only availablestudy on the effectiveness of preschool education in the Philippinesis Tan, Land, and Coustere (forthcoming), whose main results weresummarized above. Although these studies concluded that pre-schooling reduces the dropout rate from school and improves theperformance of those who stay in school, they did not calculate thecost of the current approach to preschool education or look at thecosts or the cost-effectiveness of different approaches to pre-schooling. Given the uncertainties about the best way to design apreschool intervention in the Philippines, it can be concluded thatnot enough is now known for the government to make the verysubstantial investment required to provide universal preschooling.A good, longitudinal cost-effectiveness study of different ap-proaches to preschooling should be undertaken to determinewhether there is a case for this kind of investment.
The study mentioned above did conclude that preschooling inthe Philippines is relatively cost-effective in improving educationalachievement in elementary school and that preschooling signifi-cantly reduces the school dropout rate among the children of thepoor. The study also demonstrated that preschooling has a biggereffect on reducing the dropout rate among the children of poorfamilies than among the children of the better-off. Given thesefindings and the big disadvantage of the poor in completing school(see Chapter 2), a case might be made for the state to financepreschooling for the poor, provided that the preschooling is ap-propriately designed and preschools are used as convergencepoints for an integrated set of ECD services, so as to maximize theirbenefits.
The Philippines already has a rapidly expanding preschool pro-gram, which is set up to benefit about 40 percent of 4- to 6-year-olds in each barangay. (This program is, confusingly, named theDay Care Center Program, although it provides a preschool servicerather than daylong child care for working mothers, which is dis-cussed separately below.) Continued government investment inthis program appears to be justified provided that its beneficiariesinclude the children of the poorest families, who do not have theresources to pay for private sector preschooling even if it wereavailable. Even though it is not clear whether this program offersthe most cost-effective design or length of preschooling—and moreresearch is needed on this—from an equity perspective, an alreadymandated program that significantly narrows the differential be-tween poor and rich should not be discontinued until there is hardevidence as to alternatives that are more cost-effective.
40 I M P R O V I N G E A R L Y C H I L D H O O D D E V E L O P M E N T

Even if continuation of the day care center program is justified, itmay still be argued that the duration of the program should be cutfrom three years to one, based on the Bank’s finding that a year ofpreschool produced no greater impact than two or more years. Thisfinding suggests that, if the Philippines were to invest in universalpreschooling, a year of preschool might be adequate for the chil-dren of the better-off. But the same conclusion is unlikely to holdfor the children of the poor. It is plausible that a longer period ofgood-quality preschooling may be required to offset the initial dis-advantage of these children. It would be unwise to risk penalizingthe poor by cutting the current three-year duration of the day carecenter program until its impact has been properly evaluated. More-over, such an evaluation should take place only after the quality ofthe day care center program has been improved, because the Bankstudy did not control for program quality.
The situation for day care is different because, on the basis ofother countries’ experience, the role of the private sector is poten-tially much greater. In addition to providing long-term benefits tosociety, daylong care offers immediate financial benefits to parentsbecause it frees a parent’s time to enter the labor market or to takehigher-paying employment outside the home. The experience else-where has been that the private sector can meet this demand on acommercial, fee-paying basis. Furthermore, private sector, home-based day care can be quite equitable because low overheads meanthat the service is affordable even for poor women, and additionalemployment for poor women can be generated. Therefore the gov-ernment should not need to provide widespread daylong care forchildren of working mothers. If, however, home-based daylongcare is not emerging as a result of market forces, as appears to bethe situation in the Philippines, there is a case for the governmentto provide seed money and technical support for demonstration ofthe viability of home-based day care centers for poor women, asboth users and providers of the service.
Conclusions
Government investment in ECD has a high return. The benefits areof several different types, as summarized in Box 1-1. The benefitsand the kinds of investment required are clearer for health andnutrition than for early education. But Philippine studies confirmfindings in other countries that going to preschool has significantequity effects and is cost-effective in improving performance inelementary school. These studies give little guidance, however, on
I N T R O D U C T I O N 41

how early education programs should be designed. Operationsresearch and careful evaluation will be important in this area,but in the meantime, there is a case for strengthening the existingday care center program, provided it remains targeted on the dis-advantaged.
42 I M P R O V I N G E A R L Y C H I L D H O O D D E V E L O P M E N T

2. The Situation of Childrenin the Philippines
This chapter summarizes the data on the health, nutritional, andpsychosocial developmental status of preschool children in thePhilippines and discusses what makes children disadvantaged andwhich children in society are the worst-off. It concludes by outlin-ing the implications for action: ways in which the quality and use-fulness of the data for decisionmaking might be improved andwhat the priorities for intervention programs should be.
Developmental Status
A well-developed preschooler is free of disease, well nourished,and provided with appropriate intellectual, social, and emotionalstimulation in a caring environment. This section reviews the de-velopmental status of Filipino preschoolers in each of these dimen-sions, using quantitative data where available.
Health
CHILD SURVIVAL. The wide range of estimates from different sur-veys and studies makes it impossible to define the infant and childmortality rates in the Philippines with any certainty. Because of theconfusion, in 1991 the government of the Philippines set up a taskforce on infant mortality. This task force reached a consensus on aninfant mortality rate of 57 per 1,000 live births in 1990, the rate nowofficially adopted. The Philippines has not adopted the under-fivemortality rate as an official indicator. One unofficial estimate forthis, made by the University of the Philippines Population Insti-tute, is 82 per 1,000 live births in 1990.
Despite some controversy on the exact magnitude of death rates,it is clear that child survival has not improved as far or as fast as ithas in other East Asian countries. Thailand and the Philippines had
43

similar infant mortality rates in 1960, for example, but Thailand’srate is now about 30 as against the Philippines’ 57 per 1,000 livebirths. Figure 2-1 illustrates how poorly the reduction in death ratesin the Philippines compares with that in other East Asian countries.
DISEASE. The leading diseases among infants and children arerespiratory infections and their complications, and diarrhea. But asin other countries, weak data on the incidence and prevalence ofdisease make it difficult to draw any quantitative conclusionsabout amounts or trends of disease. According to the Departmentof Health’s statistics, respiratory infection and diarrhea ratesamong children increased sharply from 1980 to 1990, while at thesame time, death rates for the same diseases fell substantially. Butthe increasing figures for morbidity may say more about greaterattention to these diseases and better collection of statistics thanabout the actual occurrence of these diseases.
Nutrition
MICRONUTRIENT MALNUTRITION. The commonest form of malnu-trition in the Philippines is iron deficiency anemia. The reported
Singapore ���
�� ���
���
������ �����
��
����
����
���
���� ��������������
Thailand
Malaysia
Indonesia
Philippines
������� �������
200 40 60 80 100Percentage reduction
Infant mortality rate
��
Under-five mortality rate
Source: World Bank data.
Figure 2-1. Percentage Reduction in Death Rates,Selected Countries, 1960–90
44 I M P R O V I N G E A R L Y C H I L D H O O D D E V E L O P M E N T

rates are about 49 percent among infants and about 26 percentamong children ages 1 to 6. The high rate among infants reflectsthe fact that about 43 percent of pregnant and lactating women areanemic. Iron deficiency anemia has important adverse effects onchild growth and development, including intellectual performance.The high rates among pregnant women and infants in the Philip-pines are a serious cause for concern because children’s brains de-velop fastest in the womb and during the first year of life. What ismore, recent research has shown that children’s development isharmed by even milder levels of anemia than previously thought.WHO is therefore changing the threshold level at which children aredefined as anemic, and when the new standard is introduced in thePhilippines, an even higher proportion of children will be definedas anemic than is now the case.
There is also an extensive and severe problem of iodine defi-ciency in the Philippines. The effects of this deficiency include cre-tinism, mental retardation, reduced learning capacity, and hearingloss in infants and children. Iodine deficiency was traditionallymeasured as the proportion of the population suffering from goi-ter; by this measure, iodine deficiency was primarily a regionalproblem in the Philippines, with six regions of the country havingan especially high prevalence. However, recent research has re-vealed that subclinical levels of iodine deficiency also lead to seri-ous developmental disadvantage in children. A 1993 study ofnewborns in one Manila hospital revealed that 30 percent of thebabies tested suffered from subclinical iodine deficiency. Thisstudy is about to be repeated in other urban areas. The findingssuggest that iodine deficiency should be considered a nationalrather than a regional problem.
As with iodine deficiency, vitamin A deficiency was traditionallydefined as the proportion of population with clinical signs; by thismeasure, less than 1 percent of the preschool population in thePhilippines is deficient in vitamin A. However, over the past tenyears, research has shown that subclinical levels of vitamin A defi-ciency are highly correlated with increased death rates and thatvitamin A supplementation can reduce the child mortality rateby as much as 20 percent. Subclinical vitamin A deficiency is nota problem throughout the Philippines but is widespread in par-ticular populations. For example, a biochemical survey of 1- to6-year-old children in Davao City in 1992–93 showed 30 percent ofchildren with deficient blood and tissue levels of vitamin A.
PROTEIN-ENERGY MALNUTRITION (PEM). Defining the magnitude ofPEM is complicated because the Philippines has adopted a different
T H E S I T U A T I O N O F C H I L D R E N I N T H E P H I L I P P I N E S 45

reference standard for measuring it than the commonly used Inter-national Reference Standard for Growth, endorsed by WHO. Thedifferences are important. By the International Reference Standard,about 33 percent of children 0 to 59 months old were underweight(with weight for age less than two standard deviations) in 1992; bythe Philippines Reference Standard, only about 11 percent of chil-dren were. Using the International Reference Standard, whichmakes international comparisons possible, PEM in the Philippineswas worse in 1992 than in poorer countries such as Egypt, Kenya,Tanzania, and Zimbabwe (United Nations 1993b).
The Philippines Food and Nutrition Research Institute considersthe Philippines Reference Standard to be appropriate for the ge-netic makeup and growth patterns of the Filipino population.However, the International Reference Standard has been advocatedbecause the results of a global study carried out in the 1970sshowed that the elites of almost all populations had the same pat-tern of growth and reached the same height, that is, that geneticinfluences could be ignored on a population basis and that overalldeviations could be attributed to environmental effects. The find-ings of this study were presented in Eveleth and Tanner (1976),and, on the basis of these and other studies, common referencevalues were recommended for national use in WHO (1985). If, asseems probable, the international standard is the appropriate onefor problem definition, PEM in the Philippines is a major problem.
PEM is a significant national problem in terms of regional equityand trends over time. With regard to the former, PEM rates in 1992in the two worst-off regions of the country were more than twicewhat they were in the two best-off regions (Figure 2-2). Also aserious cause for concern and policy action is the slow rate of de-cline in PEM. During the 1980s, PEM declined more slowly in thePhilippines than in not only the better-off countries of East Asia(Malaysia, Thailand) but also the poorer countries of South Asia(Bangladesh, India, Pakistan) (United Nations 1993b). During the1990s, PEM declined faster, to a level of about 8 percent among 0- to6-year-old children in 1993. But by the International ReferenceStandard, this still means that about 29 percent of children aremoderately malnourished.
Psychosocial Development
Only one national survey of preschoolers’ psychosocial develop-ment has been conducted. The survey’s usefulness is hampered bythe fact that standards for measuring psychosocial developmentthat are specific to conditions in the Philippines have not been
46 I M P R O V I N G E A R L Y C H I L D H O O D D E V E L O P M E N T

developed. Indeed, there is no worldwide consensus on the bestway to measure this kind of development. Limited evidence makesit difficult to draw firm conclusions about the seriousness of theproblem and hence about the importance of investing in earlyeducation.
The national survey referred to above was a 1986 study of 0- to6-year-olds carried out by the Child and Youth Research Center(1988). The study assessed psychosocial development by measur-ing the child’s conformity with normative definitions of develop-mental stages in eating, elimination, grooming, dressing, coping,and play at different ages. Twenty marginal communities weresampled, including urban poor, offshore island, fishing, tribal, andplantation worker communities, and communities with high levelsof seasonal unemployment. The study found that most children’s
���� ���� ��
��� ������ ��
���
�� �� ���� ����� �� �� ��
������ ���
��� ����
��� ����� ��� ��� ����
���
��� ������ ����
�� ���
��� ��� ��� ���
���
���
��� ����
���NCR
III
IV
CAR
II
IX
VII
I
XI
XII
VIII
V
X
������������������������� �� �
0 10 20 30 40
PEM rate in 1992��
Food poverty rate in 1991
Region
Note: NCR, National Capital Region; CAR, Cordillera Administrative Region.Source: For nutrition data, Philippines, FNRI (1992); for food poverty data, final 1991 FIES
results.
Figure 2-2. Food Poverty and Protein-Energy Malnutrition (PEM)in the Philippines, by Region, 1991–92
T H E S I T U A T I O N O F C H I L D R E N I N T H E P H I L I P P I N E S 47

performance was within the norm, although about 10 percent ofchildren showed delays in language development and 5 percentshowed delays in cognitive development. If this study is valid, therelatively low levels of disadvantage in marginal communities sug-gest still lower levels in the broader population.
However, indirect evidence about preschoolers’ psychosocial de-velopment, based on how they do in elementary school, is moreworrying. Test results are lower than for some other East Asiancountries, and, although the Philippines has a 99 percent primaryschool enrollment rate, dropout rates are unacceptably high. Only68 percent of grade 1 entrants actually complete elementary school;60 percent of the 32 percent who drop out do so during grades 1and 2. It is not known how much of the dropout is due to poorschool readiness and how much to other factors, such as poverty,distance from school, inadequate school facilities and materials, orpoor-quality teaching; research on this is a high priority. However,high dropout rates and poor performance in school must partly bethe consequence of inadequate school readiness among Filipinochildren in terms of their ability to deal with different ways oflearning, their ability to socialize with large groups of childrentheir own age, and their language skills. The last is a particularproblem for preschoolers who have been brought up to speak alocal language and then have to adapt to teaching in both the na-tional language and English in primary school.
Causes of Disadvantage
What are the causes of death and disease, malnutrition, and poorpsychosocial development? Because of the lack of data on psycho-social development, most of the following discussion, as well asnearly all of the quantitative analysis, focuses on disease and mal-nutrition.
Disease
ECONOMIC DEVELOPMENT AND DISEASE. Trends in infant and childhealth indicators during the past thirty years have been closelyrelated to economic development and social sector spending. Thiscan best be seen through changes in the infant mortality rate, be-cause the morbidity data are not reliable enough for trend analysis.The infant mortality rate fell rapidly during the 1960s, when thePhilippines was prospering, but the decline stalled in the late 1970sand throughout the 1980s. This stall paralleled a period during theMarcos government when economic growth stagnated and there
48 I M P R O V I N G E A R L Y C H I L D H O O D D E V E L O P M E N T
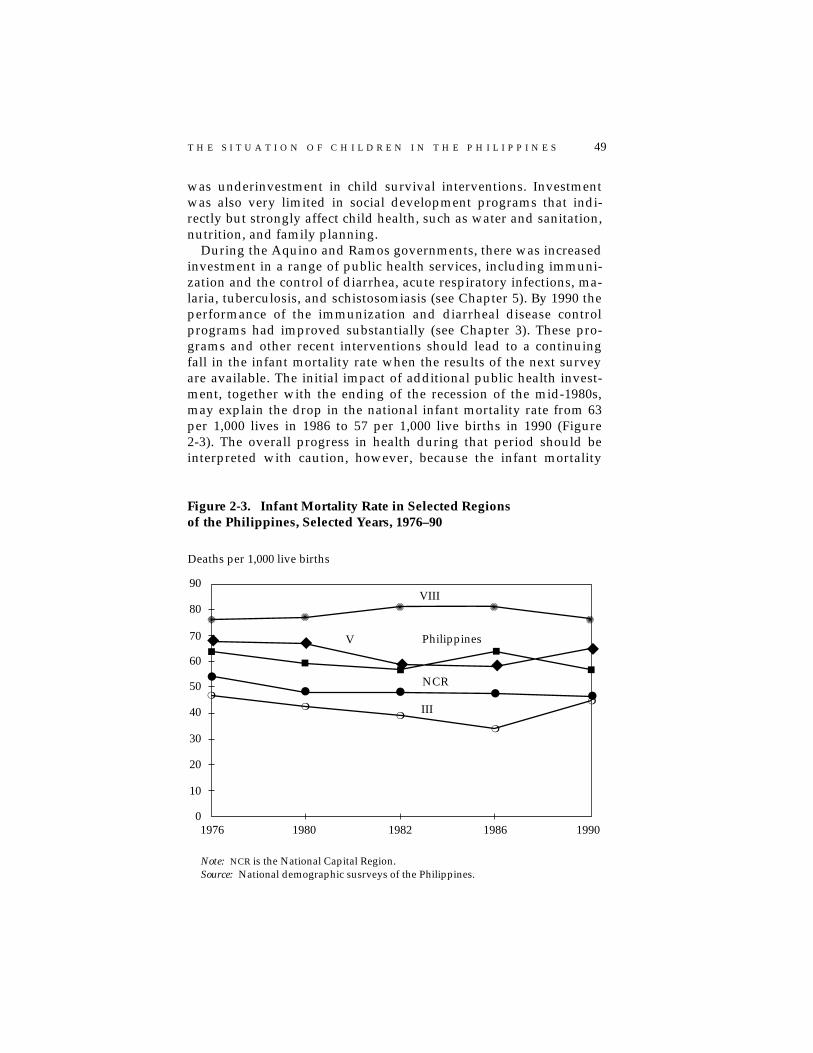
was underinvestment in child survival interventions. Investmentwas also very limited in social development programs that indi-rectly but strongly affect child health, such as water and sanitation,nutrition, and family planning.
During the Aquino and Ramos governments, there was increasedinvestment in a range of public health services, including immuni-zation and the control of diarrhea, acute respiratory infections, ma-laria, tuberculosis, and schistosomiasis (see Chapter 5). By 1990 theperformance of the immunization and diarrheal disease controlprograms had improved substantially (see Chapter 3). These pro-grams and other recent interventions should lead to a continuingfall in the infant mortality rate when the results of the next surveyare available. The initial impact of additional public health invest-ment, together with the ending of the recession of the mid-1980s,may explain the drop in the national infant mortality rate from 63per 1,000 lives in 1986 to 57 per 1,000 live births in 1990 (Figure2-3). The overall progress in health during that period should beinterpreted with caution, however, because the infant mortality
✺ ✺✺ ✺
✺
◆ ◆
◆
◆■
■■
■
●
● ● ● ●❍
❍❍
❍
❍
90
80
70
60
50
40
30
20
10
01976 1980 1982 1986 1990
VIII
V Philippines
NCR
III
Deaths per 1,000 live births
◆ ■
Note: NCR is the National Capital Region.Source: National demographic susrveys of the Philippines.
Figure 2-3. Infant Mortality Rate in Selected Regionsof the Philippines, Selected Years, 1976–90
T H E S I T U A T I O N O F C H I L D R E N I N T H E P H I L I P P I N E S 49

Figure 2-4. Causes of Infant Deaths in the Philippines, 1990
Note: “Other” includes measles (3 percent), meningitis (2 percent), and bronchitis (2percent).
Source: Philippines, Department of Health data.
Pneumonia(37 percent)
Respiratory conditionsof newborns(24 percent)
Diarrhea(7 percent)
Septicemia(6 percent)
Avitaminosis(5 percent)
Birth injuries(5 percent)
Other(7 percent)
Congenital defects(9 percent)
Source: Philippines, Department of Health data.
Figure 2-5. Causes of Infant Mortality in the Philippines, 1990
Bronchitis(38 percent)
Diarrhea(31 percent)
Influenza(14 percent)
Pneumonia(13 percent)
Measles(2 percent)
Other(2 percent)
50 I M P R O V I N G E A R L Y C H I L D H O O D D E V E L O P M E N T

rate actually increased in eight of the country’s thirteen regionsfrom 1986 to 1990. Figure 2-3 takes data from four regions to illus-trate the variance in trends. It also shows the continuing extremevariance in the levels of infant mortality rate between regions, withinfant mortality rates in the more backward regions, such as East-ern Visayas and parts of Mindanao, more than 50 percent higherthan those in the better-off parts of the country. Section D in thesupplement volume shows the 1990 infant mortality rates for eachof the regions.
THE PROXIMATE CAUSES OF DEATH AND DISEASE. The relative im-portance of different diseases in 1990 is summarized in Figures 2-4to 2-7. The charts demonstrate the overwhelming importance ofpneumonia as a cause of death for both infants and children. Theimportance of diarrhea-related dehydration as a cause of deathvaries significantly by region; in provinces such as Samar, wheresanitation and water supply are poor, it can account for as much ashalf of child deaths. The pattern of morbidity is similar. Amongboth infants and children, bronchitis and influenza—both of whichcan lead to pneumonia—make up more than half of reported mor-bidity. Diarrhea is the next most important disease. Malaria, al-though not a major child health problem at the national level, is aleading cause of morbidity in areas where it is endemic, and it isprobably underreported, being often recorded simply as fever.
As in other countries, the cause-of-death data oversimplify whatis actually happening. Most infant and child deaths are the resultof a combination of causes, only one of which is usually recorded.The risk of death rises in a nonlinear way with the number of risksa child faces. For example, a child suffering from malnutrition,diarrhea, and a respiratory infection has much more than threetimes the risk of dying than a child suffering from only one of thesepotential causes of death. PEM, which is unrecorded, is the greatesthidden cause of death. This multiple causation of death has impor-tant implications for the design of intervention programs—limitingthe effectiveness of programs to control a single disease and givinga correspondingly high payoff to an integrated approach to attack-ing disease and malnutrition.
Attacking disease among infants remains the priority, becausemore than two-thirds of the deaths of preschoolers occur amonginfants. Of these infant deaths, 46 percent occur within the firstmonth of life, and 35 percent within the first week, indicating thekey importance of educating mothers and providing antenatal careduring pregnancy and of providing services during the neonatalperiod. As for children, progress toward universal immunization
T H E S I T U A T I O N O F C H I L D R E N I N T H E P H I L I P P I N E S 51

Figure 2-6. Causes of Deaths of Children Ages 1 to 4in the Philippines, 1990
Note: “Other” includes bronchitis (2 percent), heart disease (2 percent), and otherdiseases (2 percent).
Source: Philippines, Department of Health data.
Pneumonia(61 percent)
Measles(19 percent)
Diarrhea(10 percent)
Accidents(4 percent)
Other(6 percent)
Figure 2-7. Causes of Morbidity in Children Ages 1 to 4in the Philippines, 1990
Source: Philippines, Department of Health data.
Bronchitis(39 percent)
Diarrhea(30 percent)
Influenza(14 percent)
Pneumonia(10 percent)
Measles(4 percent)
Other(3 percent)
52 I M P R O V I N G E A R L Y C H I L D H O O D D E V E L O P M E N T

may well have reduced the incidence of measles significantly since1990, leaving pneumonia and diarrhea as the main causes of death.
CONTRIBUTORY CAUSES OF DEATH AND DISEASE. Countries thathave rapidly improved child health have invested not only in di-rect interventions such as immunization and oral rehydration ther-apy, but also in programs that indirectly affect child deaths anddisease. Although these include all programs aimed at combatingpoverty and inequity, those that have the greatest impact on healthstatus are programs in the areas of water and sanitation, maternalhealth, family planning, and nutrition. Programs for female educa-tion have also been important, but pay off only in the long term.
Substantial improvements have been made in the coverage ofboth safe-water and sanitation programs: in Section E of the sup-plement volume, Figures 1 and 2, taken from World Bank (1993a),show coverage differences by region between 1980 and 1990 forboth programs. In most regions, more than two-thirds of familiesnow have adequate sanitation, and more than three-quarters haveaccess to safe water. But the same tables also show continuing re-gional differences, which are more marked for safe water than forsanitation. Lagging regions for access to safe water are II, IX, andXII, and for sanitation coverage, XI and XII.
Performance has been much less satisfactory in maternal healthcare programs, and especially in family planning, which is a keyhealth intervention for both mothers and children. The total fertil-ity rate in the Philippines is 4.1 and the modern-method contracep-tive prevalence rate a low 25 percent. Frequent, closely spacedbirths lead to a gradual depletion of the mother’s health and nutri-tional status and the mother’s capacity to nourish children in thewomb and care for them once born. The costs in terms of childmortality of failing to plan families are well established. For thePhilippines, it has been estimated (World Bank 1991) that both theinfant and child mortality rates would decline by as much as 25percent if pregnancy were avoided by women younger than twentyand older than forty-five, women who have four or more children,and women who are within fifteen months of their last birth.Underinvestment in and weak commitment to family planning inthe years prior to the Ramos government have taken a heavy toll ofchildren’s, as well as women’s, lives.
The links between severe malnutrition and high rates of infantmortality and morbidity have long been recognized. Through de-pressing the immune system, PEM makes children more liable tocatch infections and slower to recover from them; severe PEM canincrease the risk of death by up to eight times. Only more recently
T H E S I T U A T I O N O F C H I L D R E N I N T H E P H I L I P P I N E S 53

has research demonstrated that the risks are not limited to severePEM but form a gradually declining continuum through severe andmoderate PEM. Pelletier and others (1994a) have estimated con-tributory effects of PEM for fifty-three developing countries. Figure2-8 presents their data, for a sample of Asian countries, on theproportion of child deaths that are the combined result of infectionand PEM. “Moderate” malnutrition is associated with nearly half ofchild deaths in the Philippines, indicating that gains from furtherinvestment in child health programs may be limited unless accom-panied by equally determined efforts to improve nutrition.
Malnutrition
In every country, the nutritional status of children depends ontheir food security, their health, and the quality of the care theyreceive. Disentangling which of these factors are important causesof malnutrition is essential if governments are to choose the mostcost-effective balance of investment between programs to combatpoverty and food insecurity; health programs; and programs tochange behavior. The following sections discuss the causes of PEMat some length because these are not universally understood.
PEM, POVERTY, AND FOOD INSECURITY. Many legislators and gov-ernment officials in the Philippines assume, understandably, that
Source: Pelletier and others (1994a).
Figure 2-8. Percentage of Child Deaths Caused by a Combinationof Infection and Protein-Energy Malnutrition (PEM),Selected Countries
0 10 20 30 40 50 60
Percentage of child deaths in country
���
Severe PEM Moderate PEM
���������China
Indonesia
Philippines
Sri Lanka
Thailand ��
54 I M P R O V I N G E A R L Y C H I L D H O O D D E V E L O P M E N T

malnutrition is simply the result of poverty and lack of purchasingpower for food. This view is encouraged by the correlation that canbe seen at the broadest level between trends in economic growthand trends in malnutrition. Figure 2-9 shows the trends in thegross domestic product (GDP) index against the trends in wastingand stunting. It illustrates how rapidly falling malnutrition corre-lated with steady economic growth until 1982 and then how nutri-tional improvement slowed and, in the case of wasting, began todeteriorate during the period of economic crisis and slow growthbetween 1983 and 1992. Recently available survey data for 1993show a continuation in the trend of improvement in stunting anddeterioration in wasting. But a review of other data shows that therelationship between poverty and malnutrition is more compli-cated than the broad national trends suggest.
Two main definitions of poverty are used in the Philippines. Thepoverty line is the threshold below which people have insufficientincome to pay for minimum food and nonfood needs. The subsis-tence poverty, or food poverty, line is the threshold below which
Figure 2-9. Trends in Economic Growth and in Wastingand Stunting of Children Age 5 and Under, Philippines, 1978–92
Note: Wasting is low weight for height, an indicator of current malnutrition. Stuntingis low height for age, an indicator of cumulative malnutrition over time.
Source: For nutrition data, Philippines, FNRI surveys; for GDP index, derived from datain World bank (1993a).
✹
✹✹
✹✹
◆
◆◆
◆ ◆
■
■ ■■
■
19821978 1987 1990 1992
50
60
40
30
20
10
0
Stunted
Index of GDP
Wasted
Unit
T H E S I T U A T I O N O F C H I L D R E N I N T H E P H I L I P P I N E S 55

people have insufficient income to buy even their minimum re-quirements of food. The food poverty index is a more appropriatemeasure for nutrition comparisons than the poverty index is. Thegovernment estimated that about 20 percent of the population wasbelow the food poverty threshold in 1991. The levels at which boththresholds have been set have been criticized on methodologicalgrounds (World Bank 1993a); both may overestimate the amount ofpoverty. But for this analysis, the levels of these indicators are lesssignificant than their trends and their distribution across regions.
Food poverty fell from 24 percent of the population in 1985 to 20percent in 1988 and remained at about the 1988 level in 1991, ac-cording to the government statistics. These national trends hidegreat interregional variation. Between 1988 and 1991, food povertyfell quite sharply in the National Capital Region (NCR) and RegionsVI, VII, and VIII (most of the Visayas), whereas it rose in RegionsII, III, X, XI, and XII. What is of interest is to see how far changes inmalnutrition match these changes in food poverty. Between 1988and 1991, malnutrition fell in Regions III, VIII, and IX; food pov-erty did not fall in any of these regions. PEM increased significantlyin ten regions; food poverty increased significantly in only five.PEM and food poverty moved in completely opposite directions infour regions: in the NCR and Regions VI and VII, PEM rose whilepoverty declined, and in Region III nutritional status improvedwhile poverty worsened. Thus, when looking beyond the broad,national aggregates, rising and falling poverty levels seem to haveno clear correlation with movements in PEM.
Figure 2-2 shows the food poverty rate for 1991 and the preva-lence of underweight preschoolers for 1992 by region. (Comparingsurvey data for poverty and for PEM is difficult because they areseldom available for the same year. But although the comparison inFigure 2-2 is not exact, neither is it likely to be invalid, becausethese indicators do not change very substantially in a single year.)Clearly, for regional distribution as well as for trends over time,the relationship between PEM and food poverty is not close. Therelatively low levels of malnutrition in the very poor Regions V, IX,and X and the high levels of malnutrition in the better-off RegionsIII and the NCR stand out in particular as apparent anomalies. Thesame pattern, or lack of it, holds if PEM rates are compared withpoverty rates as opposed to food poverty rates.
Overall, therefore, the imperfect correlation between poverty,food security, and PEM suggests that other important causative fac-tors are at work. The following sections look at the importance ofhealth and care, as well as food security, in determining the nutri-tional status of preschoolers of different ages.
56 I M P R O V I N G E A R L Y C H I L D H O O D D E V E L O P M E N T

LOW BIRTH WEIGHT. About 15 percent of newborn babies weighless than the norm of 2.5 kg (the reported figure is 18 percent,but this may be an overestimate). For these children, PEM beginsin the womb because their mothers’ nutritional status duringpregnancy is inadequate to give the fetus the nutrients it needsto develop fully. Maternal nutrition is therefore a major determi-nant of child nutrition in the Philippines. Unfortunately, thereare no data from large samples on the nutritional status of preg-nant women. However, data from the 1993 Safe Motherhood Sur-vey (Philippines, National Statistics Office 1994) provide thefirst national-level assessment of the PEM status of women ofreproductive age in general. They show that more than 12 per-cent of women have a body mass index (a combined measure ofweight and height) less than 18.5, the level indicating chronicundernutrition and likely adverse effects on fetal growth forthose who are pregnant. A low body mass index affects morethan 15 percent of women who live in rural areas, of womenwho have no more than primary education, and of women lessthan 20 years old. These are the women who, when faced withthe additional biological demands of pregnancy, are likely tohave babies with low birth weights.
The causes of poor maternal nutrition before pregnancy are un-clear. Although there is evidence that intrahousehold allocation offood discriminates against women (Senauer, Garcia, and Jacinto1988), the same study showed that the difference between men’scaloric intake and women’s was much less than the difference be-tween the intakes of both men and women and the recommendeddaily allowance. Food insecurity is likely to explain a larger pro-portion of prepregnancy nutritional deficits than cultural and be-havioral factors. Undereating because of food insecurity is almostcertainly compounded during pregnancy by failure to adequatelyincrease food intake, either through ignorance of the additionalfood-energy demands of pregnancy or for other reasons, such asfear of having a large baby and a difficult delivery. The limitedevidence on this score is disturbing; the pregnant women fromthree poor provinces who were monitored in the Senauer studyincreased their caloric intake by less than a third of the additionrequired for adequate weight gain.
Additional food intake is also required during lactation to meetthe demands of producing breast milk. An important study of lac-tation in Cebu (Adair and Popkin 1992) showed that, for a highproportion of women, maternal weight loss after pregnancy cumu-lated through subsequent births in a cycle of maternal depletion.The study showed that, for poor rural women, energy intakes
T H E S I T U A T I O N O F C H I L D R E N I N T H E P H I L I P P I N E S 57

during lactation were low, at about half of recommended allow-ances. Of such women, no less than 28 percent started the nextpregnancy with a body mass index lower than 18.5. In addition tothe need for supplementary feeding for such at-risk pregnantwomen, these data indicate that family planning is important fornutrition, because better spacing of births allows more time forwomen to recover weight.
Finally, in addition to the short-term effect on low birth weightof how well women are nourished during their reproductive pe-riod, there is also a long-term intergenerational effect of malnutri-tion among women. Baby girls with low birth weights are likely togrow into small women, who in turn are more likely than averageto have small babies—a vicious cycle that can be broken only withimproved nutrition over a generation.
PEM AND FEEDING PRACTICES. It is unclear whether food insecu-rity, as expressed through maternal deficits during lactation, re-duces the availability of breast milk to the child. Much moreclear—from a detailed study of breastfeeding patterns in Cebu (Zo-hoori, Popkin, and Fernandez 1991)—is that the breastfeeding be-havior of a high proportion of mothers is inimical to the healthygrowth of the child. This study showed that by the age of 2 monthsonly 27 percent of infants were exclusively breastfed, with about 20percent being fed nonnutritious liquids in addition to breast milkand about 38 percent getting other nutritious liquids as well. Asidefrom the fact that other liquids are likely to be less nutritious thanbreast milk, research (Popkin and others 1990) has shown that,given the poor hygiene practices commonly prevailing in develop-ing countries, feeding additional foods or liquids at this age candouble or triple the likelihood of diarrhea, thus further threateningnutritional status.
The Cebu data are reinforced by national estimates derived fromthe 1993 National Demographic Survey (Philippines, National Sta-tistics Office 1994). Breastfeeding of children is less common in thePhilippines than in many developing countries. Among infantsyounger than 3 months, only a third are exclusively breastfed, andabout 17 percent are not breastfed at all. The remaining half aregiven water, other liquids, or soft foods in addition to breast milk.Weaning comes at an early age according to the survey. Between 4and 6 months, the proportion of infants who are exclusively breast-fed drops to less than 10 percent, and fewer than 2 percent ofchildren older than 6 months are exclusively breastfed. The links toinfection through contaminated food or drink are also suggestedby the fact that the highest incidence of diarrhea occurs among
58 I M P R O V I N G E A R L Y C H I L D H O O D D E V E L O P M E N T

weaned children 6 to 11 months old (17 percent), followed by chil-dren 12 to 23 months old (15.6 percent).
Complementary feeding becomes increasingly important afterthe age of 6 months because the child’s caloric requirements in-crease and can no longer be fully met by breast milk. Inadequatefeeding of solid foods can be due either to a late start to weaning orto the inadequacy of the amounts fed. Both the Cebu study and the1992 National Nutrition Survey indicate that, in the Philippines,weaning begins on time. The feeding problem appears to be relatedeither to the amount fed (the child is not fed to satiation) or to thefact that traditional weaning foods are not dense enough in caloriesto nourish the child adequately, even though it is no longer hun-gry. Because of the very small amounts of additional food requiredat this age, it is probable that the rise in PEM before the age of 2 isthe result of these kinds of poor feeding practices, rather than foodinsecurity. And it is probable that most mothers feed too little be-cause they do not realize their children are malnourished. Moder-ate PEM, the predominant form of PEM in the Philippines, is noteasily recognizable to the untrained eye.
The increase in PEM at this point is also due to the increasedprevalence of infections in the second year; both of the most preva-lent infections—diarrhea and acute respiratory infections—lead toweight loss. Increased exposure to infection arises from both greatermobility and increasing dependence on a frequently contaminatedfood supply. This takes place in conjunction with declining intakesof breast milk and its constituent maternal antibodies. Data fromCebu (Zohoori, Popkin, and Fernandez 1991) indicate that about 22percent of rural mothers and 46 percent of urban mothers havestopped breastfeeding by the time the child is 12 months old. Lowresistance to disease is also caused by the delays in the developmentof immunocompetence associated with malnutrition.
From the age of 2 onward wasting falls sharply (Figure 2-10).This pattern, seen in many developing countries, usually reflectsthe child’s growing immunity to infection, coupled with an in-creasing intake of solid foods as the child is able to eat for itselfrather than rely only on what it is fed by the mother. In the Philip-pines, the drop in wasting is from 15 percent to only about 5 per-cent of children. From this point on, PEM is less likely to be relatedto behavior and more likely to be related to food insecurity, be-cause the child’s food needs have increased and may be beyond thepurchasing power of the poorest families. (Food insecurity likely isalso the main cause of the high prevalence of wasting among 7- to10-year-old school-age children, which was a very worrying find-ing of the 1992 survey by the Food and Nutrition Research Institute.)
T H E S I T U A T I O N O F C H I L D R E N I N T H E P H I L I P P I N E S 59

The sharp decline in wasting after the age of 2 indicates that mostfamilies with a nutrition problem can afford to feed their childreneven when their children’s intakes are increasing and they are be-coming more expensive to feed. This has important implicationsfor policy: most of the PEM seen in preschoolers appears to bestunting caused by the legacy of poor feeding practices and poorhealth at the time of weaning, rather than being caused by foodinsecurity.
Although it is not possible to derive from the above analysis anyquantitative conclusions about the relative importance of food,health, and care in determining PEM in the Philippines, it is clearthat, especially for children under 3, disease and poor feeding prac-tices play a very important role. The conclusion for policy is that,although food insecurity is one important cause of malnutrition inthe Philippines, efforts to improve food security alone will not suf-fice to control malnutrition. They will need to be accompanied byequally determined efforts to improve health services (including
Source: Philippines, FNRI National Nutrition Survey.
Figure 2-10. Age-Specific Wasting and Stunting in the Philippines,1992
��������
������������������������
����������������
��������������������
��������������������
< 1 1 2 3 4
50
40
30
20
10
0
Wasting
�� Stunting
Age
Percentage of age-specific group
60 I M P R O V I N G E A R L Y C H I L D H O O D D E V E L O P M E N T

family planning) and the health and nutritional behavioral prac-tices of caregivers.
MICRONUTRIENT MALNUTRITION. Micronutrient malnutrition ismainly the result of the unbalanced diets of Filipino women andchildren, although parasites and geological conditions are also afactor. As with PEM, poor weaning practices—more specifically, aninadequate balance of nutrients in weaning foods—are a major fac-tor. The dietary iron intakes of pregnant and lactating women werereported by the National Nutrition Survey to be only 62 percentand 55 percent, respectively, of recommended levels in 1987. Fur-thermore, this iron is derived mostly from vegetables and hence ispoorly absorbed. Although vitamin C enhances iron absorptionfrom vegetables, per capita consumption of fruit and vegetablescontaining vitamin C has been declining in the Philippines. In ad-dition to diet, parasites—malarial, schistosomal, and helminthic—cause iron loss in ecological zones where these are prevalent. Lowuptake of iron from the diet, combined with accelerated loss fromreproduction and parasitic disease, rapidly depletes maternal ironstores. Inadequate iron stores are then established in the fetus, andiron deficiency anemia emerges in infancy.
Vitamin A deficiency results from low dietary intake of retinoland carotene from meat and green and yellow vegetables. It isprimarily a consequence of the cereal-based diet in the Philippines.Breast milk is an important source of vitamin A in early childhood,and low maternal stores result in the early onset of xeropthalmia inchildhood. The deficiency in children is also exacerbated by infec-tions, particularly measles and its complications.
Geological conditions explain low levels of iodine in the foodchain. Although there is no evidence that naturally occurring foodgoitrogens have a role in this condition, high levels of cassava in-take may be a problem in some areas. In endemic areas, iodinederived from the diet is inadequate to meet normal demands forwomen’s health and is exacerbated by the additional requirementsof reproduction. As with iron, the deficiency is passed on to thefetus and subsequently to the infant.
Inadequate Psychosocial Development
Persistent poor health and malnutrition are themselves importantcauses of inadequate psychosocial development. They can inhibitthe development of intelligence and of neurological and psycho-motor systems. Also, children who are ill or have PEM are lessactive; consequently, they play less, they respond less well to
T H E S I T U A T I O N O F C H I L D R E N I N T H E P H I L I P P I N E S 61
stimulation, they are less sociable, and they are less attentive totheir environment and learn less from it. Other important influ-ences on psychosocial development include the degree to whichchildren receive loving attention and stimulation from caregivers(this has both a time and a quality dimension), the amount andquality of interaction they have with other children, and the rich-ness of their environment in terms of the things they have to playwith or learn from. In general, the types of families who are leastlikely to be able to provide for the adequate psychosocial develop-ment of their children are the very poor and the children of poor,formal sector employees in urban areas.
The very poor have to work hardest to make ends meet. Both par-ents work long hours, when they can find work. Time spent withyoung children may be limited, especially at seasons of peak agri-cultural employment. Quality time with children may be still morelimited because very poor parents are themselves more likely to beill, malnourished, or tired, and so have less energy for childcare. Thevery poor are also least likely to be able to provide an appropriateenvironment for their children; they may have no protected watersupply and may live in unsanitary surroundings. And the verypoor are least likely to be able to pay for childcare while they work.
There is little hard data for the Philippines on the quantity andquality of childcare among the poor. However, the Cebu breast-feeding study (Zohoori, Popkin, and Fernandez 1991) found a clearseasonal pattern in the time spent on breastfeeding, with a thirty-three-minute difference in the daily time devoted to this activitybetween peak and trough, suggesting that agricultural work sig-nificantly affects caring practices. One study of women’s work andinfant care in Cebu (Doan and Popkin 1992) showed that nearly 60percent of mothers work outside the home, many of them in occu-pations that preclude taking their children with them. Grandmoth-ers become the primary caregivers to children in these cases. Thesame study showed that poor women with several preschoolerswere the mothers most likely to be working outside the home.Thus, economic necessity appears to impel into the labor marketthe poorest women, who may be in the weakest position to arrangeadequate care for their children.
Among the poor, those living in urban areas are likely to havethe greatest difficulty in providing adequately for the psychosocialdevelopment of their children, because a high (but unknown)proportion of them are migrants to the city who have left behindthem in the province the extended family network that providedchildcare services. Children who in the village might have been left
62 I M P R O V I N G E A R L Y C H I L D H O O D D E V E L O P M E N T

in the care of a grandmother, or someone else experienced in par-enting, may in the urban slum be left in the care of a sibling. Thistype of childcare problem extends also to many better-off parentswho are working in factories but not earning enough to pay fororganized day care. Because more than 37 percent of women par-ticipate in the work force in the Philippines, and rural-urban mi-gration rates remain high, this type of potential disadvantage islarge and growing.
The Worst-off
The Ramos government was elected with a special mandate to im-prove equity and empower the poor. This section summarizeswhat is known about who and where the most disadvantaged chil-dren are.
What Are the Risk Factors?
Depending on where they live and what kind of family they comefrom, children are subject to different types, levels, and combina-tions of developmental risk. At least six main types of risk factorscan be identified, as follows:
• Demographic. As noted above, infants are more at risk than chil-dren, and neonates are the most at-risk infants. Closely spacedchildren and children with many siblings are less likely to getadequate care, as are the children of single parents.
• Income-related. Income is heavily dependent on educationallevel and occupation. Particularly low-earning occupations inthe Philippines include those of part-time informal sectorworkers in urban areas; traditional fishermen; and landlesslaborers, who in addition to low wages suffer from seasonalemployment fluctuations and the energy demands of hardphysical work.
• Environmental. Children who live in environments which en-courage malaria, schistosomiasis, and helminths are at par-ticular risk, as are children who live where there is noprotected water supply or adequate sanitation.
• Geographic. Remoteness is also a risk factor. Children living onsmaller offshore islands, in coastal communities only reach-able by water, and in mountain and forest areas, are hardest toreach with outreach services and are hard to get to referralfacilities.
T H E S I T U A T I O N O F C H I L D R E N I N T H E P H I L I P P I N E S 63

• Peace and order. Armed conflict reportedly led to the displace-ment of 1.36 million people since 1986 (HEWSPECS 1994). Al-though since 1991 there has been a sharp decline ininsurgency-related violence, many of the areas previously af-fected still suffer from a legacy of inaccessibility and under-provision of services.
• Cultural. An estimated 1.0 million to 1.5 million preschoolers(10 to 15 percent of the preschool-age population) are childrenof indigenous communities, which can be defined as groupswith a social or cultural identity distinct from the dominantsociety, and this makes them vulnerable to being disadvan-taged in the development process. Section F in the supplementvolume summarizes the main population groups involved.The government wishes to give special priority to child devel-opment among these peoples.
Although any one of the above risk factors may be enough tocause disadvantage, the worst-off families are usually affected by acombination of risk factors. Indigenous communities, for example,are often very poor, live in remote areas, and live in areas that areor were areas of armed conflict. Slum and street children are thechildren of the very poor, live in extremely unhealthy environ-ments, are dependent on street foods for their nutrition, and havefew opportunities for stimulation and play.
Where Are the Worst-off?
Regions that have both high levels of infant mortality and high PEMrates among preschoolers are likely to be among the most disad-vantaged from a child development perspective. Figure 2-2 andSection D in the supplement volume indicate that the regions fall-ing in this category are V, VI, and VIII—Bicol and Eastern andWestern Visayas. In addition, Regions II, IX, and the CAR have highinfant mortality rate levels but lower PEM rates, and Regions I andVII have high PEM rates but lower infant mortality rates. If foodpoverty is included as an indicator, Regions X, XI, and XII also jointhe list, but none of them have very high infant mortality rates orPEM rates. Regions III, IV, and the NCR are the best-off, with lowrates for all three indicators.
However, comparing rates of disadvantage between regionsgives an inaccurate picture when the magnitude of the problem isdefined in numbers of disadvantaged children. For example, thesix worst regions as measured by PEM rates were, in order, VII, VI,I, V, IX, and VIII in 1992. But as measured in numbers of malnour-
64 I M P R O V I N G E A R L Y C H I L D H O O D D E V E L O P M E N T

ished preschoolers, the order is VI, VII, IV, V, the NCR, and I. Al-though Region IV and the NCR do not even figure in the top six forPEM rates, they are very important in relation to numbers. Betweenthem, in 1992, they contained more than 19 percent of the malnour-ished preschoolers in the Philippines.
Below the regional level, it becomes difficult to define childdisadvantage, because there are no reliable data for either infantmortality rate or PEM rates at the provincial or municipal level.The government has ranked provinces in terms of disadvantageusing a weighted indicator that includes measures of illiteracy,infant mortality, malnutrition, sanitation, and the head countand poverty gap definitions of poverty. For different program pur-poses, twenty-five and nineteen priority provinces have been de-fined. There is some argument about the appropriateness of themethodology for this ranking (see World Bank 1993a and Balisacan1993), both because the data for several of the constituent indica-tors are weak and because the weightings used are debatable.But what is perhaps most important is that simple targeting byprovince leaves extremely disadvantaged children in other prov-inces out of the count, and their numbers may be substantial. Forexample, neither the nineteen nor the twenty-five priority areasinclude the NCR, with its very large numbers of disadvantagedslum children.
There are, therefore, several problems in defining who andwhere the worst-off are. First, the statistics currently collectedare designed each to measure just one aspect of risk, but they arenot aggregated to measure the combinations of risk that definethe most disadvantaged. Second, the geographic areas, such asslums, in which the most disadvantaged live do not correspondto the geographic units, based on administrative structures, forwhich statistics are collected. Third, although we know whichtypes of families are likely to be worst-off and which broad geo-graphic areas they are most likely to be found in, the aggregateddata available do not permit identification of the families mostin need.
Implications for Action
The type, quality, and availability of data determine how good ajudgment can be made about what interventions to make andalso how well interventions can be targeted to client groups. Whatmight be done to make the data on children more useful? Whatare the most important intervention programs to improve childdevelopment?
T H E S I T U A T I O N O F C H I L D R E N I N T H E P H I L I P P I N E S 65

Data for Determining Interventions
RISK PROFILES. As stated earlier, intervening to tackle only onesource of disadvantage will do little to improve the overall statusof children suffering from combinations of risk. Collecting data onthe risk profiles of different types of disadvantaged groups is animportant first step in determining the set of program interven-tions that will best respond to their needs. The Department ofHealth is beginning an innovative project to try to determine theoverall health risks affecting slum dwellers in the Philippines, us-ing geographic information systems to overlay data on risks of dif-ferent types to give a total risk profile. Interventions will then beadapted to respond. This project will provide risk profiles for oneset of disadvantaged children. It would be useful to extend thisapproach to prepare risk profiles of other important disadvantagedchild groups, such as children of indigenous peoples and small-scale plantation workers.
IRON DEFICIENCY. As indicated, there is some uncertainty overthe levels of iron deficiency in infants. Intervening to reduce ane-mia in infants is much more expensive than it is for older childrenbecause infants can take iron only in liquid form, at the cost of P35($1.23) for each child treated, rather than the much cheaper tabletform. Because routine supplementation of all infants may not becost-effective, improving the data on infant iron deficiency wouldhelp to assist in deciding who should get supplementation.
PEM. Although the existing nutrition survey data give a goodpicture of infant and child PEM, anthropometric data on PEM inpregnant and lactating women are lacking, as indicated earlier.A survey to provide these data would help in defining strategiesfor improving women’s health and nutritional status and reducinglow birth weight. Better data on low birth weight would also beuseful, both because the current data are for hospital births, andhence may not be representative of the total population, andbecause the current data do not distinguish between prematurityand intrauterine growth retardation as causes of low birth weight.For all types of PEM, there is a great need for better qualitative dataon the beliefs and behaviors that lead to inadequate or improperfeeding.
PSYCHOSOCIAL DEVELOPMENT. The almost complete absence ofdata on the psychosocial development of children makes it difficultto decide what priority should be given to investment in this area
66 I M P R O V I N G E A R L Y C H I L D H O O D D E V E L O P M E N T

or what the needs of specific groups are. Before carrying out sur-veys in this area, it should be determined whether the indicatorsthat have been used to measure psychosocial development in thePhilippines are the most appropriate. Doing so would involve tak-ing the developmental standards for preschoolers that have beenused in the Philippines and other countries and adapting them tosocial and cultural conditions, both nationally and for specific cul-tural groups within the country. This would be a complex task forspecialists in sociology, education, and developmental psychology.Once this first step has been taken, the priority would be to carryout a survey of the developmental status of children as they enterschool. Data collected at this point in a child’s life are useful forreorienting both ECD interventions and school teaching methodsand content to make them appropriate for the needs of incomingchildren.
Data for Targeting and Monitoring
Although the main causes of disease and the related interventionsare well understood, the data for targeting risk groups and moni-toring progress in disease reduction remain weak.
MORBIDITY AND MALNUTRITION. As indicated, it is notoriouslydifficult to collect accurate morbidity data through statistics onservices. Yet targeting and monitoring morbidity will become moreimportant as attention shifts to child development as well as childsurvival. Developing an effective disease surveillance system atand below the provincial level will therefore be important. Withthis in mind, the Department of Health has been developing astreamlined set of health indicators for making rapid assessments,and these indicators will be piloted in two regions before beingused nationally. By 2000, the plan is for each region to have anepidemiology unit capable of training and supporting provincialstaff in applied epidemiology and cluster surveys. The plan alsocalls for trained personnel in the twenty-five priority provinces todisseminate public health information to local government officialsfor use in planning and monitoring.
Getting good data on the extent of micronutrient deficiency isalso impossible from statistics on services, because field staff can-not detect subclinical (but harmful) levels of deficiency during rou-tine contacts with patients; blood or tissue analysis is required.This is another area where development of a sentinel surveillancesystem for measuring levels and trends and targeting disadvan-taged groups will be important.
T H E S I T U A T I O N O F C H I L D R E N I N T H E P H I L I P P I N E S 67

THE MOST DISADVANTAGED. Mapping the geographic areas wherethe most disadvantaged are, as the Department of Health is doingin the case of slum dwellers, is a satisfactory targeting mechanismwhere the worst-off are concentrated together. But although someof the worst-off live together (for example, slum dwellers and someindigenous peoples), most disadvantaged children live scatteredamong families who are better-off. Targeting these disadvantagedchildren raises issues of design and cost-effectiveness, because themost accurate targeting systems are also the most difficult to man-age and the most expensive.
At least three different mechanisms are currently used or plannedto target services to at-risk families and individuals within commu-nities. First, the Department of Social Welfare and Developmentuses a family survey questionnaire that attempts to measure eco-nomic self-sufficiency, social adequacy, sociocultural factors, fam-ily functioning, and role performance. Second, in the provincestargeted by the government’s and UNICEF’s Area-Based Child Sur-vival and Development Program, field personnel screen for at-riskfamilies, defined as those with a moderately or severely malnour-ished preschooler and at least one of the following characteristics:a mother or father with chronic illness, an illiterate mother, a work-ing mother, and unemployed or underemployed parents. Underthe same project, high-risk families were defined as those with atleast three of these characteristics. Third, the Department of Healthnow plans to begin using a “life-cycle” mechanism, in which serv-ices will be focused on those in the most vulnerable stages of life,notably pregnant and lactating women and preschool children (seeSection G in the supplement volume for details).
Although all the above mechanisms have merit, it is also clearthat the complexity of targeting systems is increasing, calling intoquestion how often communities can cost-effectively be surveyedand how consistently and with what quality targeting decisionswill be made. These questions are a special concern in the moreuncertain environment since the responsibility for implementinghealth and family welfare services devolved.
One priority for dialogue between the social sector agencieswould therefore be the development of a “quick and clean” set ofindicators for identifying the most disadvantaged in each commu-nity and ensuring that they get access to the full range of servicesto which they are entitled. For children, such a system might bebased on first defining the target group of pregnant and lactatingwomen and preschoolers by implementing the life-cycle mecha-nism and then identifying families actually or potentially at risk
68 I M P R O V I N G E A R L Y C H I L D H O O D D E V E L O P M E N T

within this group by measuring family assets and PEM status asproxies for the whole range of indicators of disadvantage. Familyassets are suggested because they can be easily and objectivelymeasured and are a good proxy for income, which is difficult toassess (detailed proposals for setting up an asset-based welfare in-dicator can be found in World Bank 1995). Although growth moni-toring to measure PEM is much more difficult to carry out, there isno alternative to setting up high-quality, community-based growthmonitoring if parents are to become aware of and respond effec-tively to this major national problem (see Chapter 3). PEM is an-other good proxy for health, economic, and social disadvantage,and PEM status can be measured more easily at the communitylevel than morbidity.
Improving the quality of growth monitoring on a nationwidebasis will take five or six years. In the meantime, it is important toinvest in a national survey of nutritional status that has validitybelow the regional level; regionally based data are not very usefulfor planning because, since devolution, the region is no longer aunit for political decisionmaking. A UNICEF-financed nutrition sur-vey is already under way in twenty provinces; it would be usefulto extend this to national coverage. Cost considerations argue forsuch surveys to be limited to the provincial level, with efforts toobtain municipal-level data on PEM to await the development ofmore reliable statistics on services.
Priorities for Intervention Programs
The data on child health, nutrition, and psychosocial developmentsummarized in this chapter suggest that the main priorities shouldbe programs for:
• Child survival, with special attention to maintaining the Ex-panded Program on Immunization, acute respiratory infectioncontrol, oral rehydration therapy, and interventions aimed atneonatal mortality
• Disease control, with special attention to diarrhea and pneu-monia nationally, and to malaria, schistosomiasis, andhelminth control in heavily endemic areas
• Deficiency control, for iron, vitamin A, and iodine amongpregnant and lactating women as well as children
• PEM control programs, focusing on food security and behav-ioral change and on pregnant and lactating women as well aschildren
T H E S I T U A T I O N O F C H I L D R E N I N T H E P H I L I P P I N E S 69

• Early education, for disadvantaged children (however, thelack of hard data in this area makes it difficult to define theappropriate extent and type of intervention)
• Maternal care and birth-spacing, aimed at improving mothers’health and nutrition and reducing infant and child mortalityand malnutrition
• Water supply and sanitation in areas where limited coverageleads to high diarrhea rates.
70 I M P R O V I N G E A R L Y C H I L D H O O D D E V E L O P M E N T

3. Government Policies, Goals,and Intervention Programs
This chapter summarizes the government’s main policies and goalsfor the development of young children in the Philippines andreviews the main government intervention programs in health, nu-trition, and psychosocial development (nongovernmental interven-tions are discussed in Chapter 4). Each program is discussed interms of the structure and evolution of its service delivery, its im-pact, and the strengths and weaknesses of its design, and recom-mendations are made for improving its performance.
Only nationwide programs are reviewed here. In addition tothese, there are several smaller-scale programs and projects thatmay have important lessons for the design of national interven-tions but which the team doing the report on which this book isbased was unable to visit. These include the LAKASS Program of theNational Nutrition Council and the Area-Based Child Survival andDevelopment Program, which are briefly described in Sections Hand I, respectively, of the supplement volume.
Child Development Policies and Goals
The Philippines has a set of laws and policies, including a nationalplan of action for children, that strongly support child develop-ment. The government’s qualitative and quantitative goals for thesurvival, protection, and development of children are clear andambitious.
Laws
Philippine law provides unambiguous support for child develop-ment as opposed to just child survival. In addition to setting outbasic rights to adequate food, shelter, clothing, and protection, theChild and Youth Welfare Code (Presidential Decree 603) says that
71

the child has “the right to a well-rounded development of his per-sonality to the end that he may become a happy, useful and activemember of society” (Article 3). It specifies (Article 9) that “the childshall be given adequate care, assistance and guidance through hisvarious levels of growth, from infancy to early and later childhood.”And in Article 87 it encourages the organization in each barangay ofa local Council for the Protection of Children to promote, amongother things, the establishment of day care centers.
The 1987 Barangay Level Total Development and Protection ofChildren Act mandated more explicit support for child develop-ment. It obliged the Department of Social Welfare and Develop-ment to appropriate funds for establishing and maintaining daycare centers. The law specifies that these centers are to implement achild development program for preschoolers that includes, amongother things, referral and support for pregnant mothers; monitor-ing of births and completion of immunization; growth monitoringand supplementary feeding for nutrition; day care for children ofworking mothers; and intellectual and mental stimulation for chil-dren. The 1991 Local Government Code, which provided the legalmandate for the devolution of many social sector services to localgovernments, made the day care service, formerly the responsibil-ity of the Department of Social Welfare and Development, one ofthe frontline barangay services for which local governments wereto ensure budget support.
The Philippine Council for the Welfare of Children, which is anattached agency of the Department of Social Welfare and Develop-ment, is mandated by law (Presidential Decree 603) to coordinatethe implementation and enforcement of all laws promoting childand youth welfare and to formulate and evaluate policies, pro-grams, and services for the general welfare and protection ofyouth.
The Philippine Plan of Action for Children
In 1990 the Philippines signed the International Convention on theRights of the Child and endorsed the World Declaration on theSurvival, Protection, and Development of Children. Subsequent tothe 1990 World Summit for Children, the Council for the Welfare ofChildren produced a plan of action for children entitled “The Fili-pino Children: 2000 and Beyond,” which details the Philippines’commitment to extending the coverage, and improving the quality,of the full range of programs affecting child development.
In addition to the objective of establishing a day care center inevery barangay, the plan includes the following quantitative goals:
72 I M P R O V I N G E A R L Y C H I L D H O O D D E V E L O P M E N T

• Reduction of the infant mortality rate from 61 per 1,000 livebirths in 1990 to 37.6 by 2000
• Reduction in the prevalence of severely or moderately under-weight preschoolers from 14 percent in 1990 to 7 percent by2000
• Reduction in the rate of low birth weight to less than 10 per-cent
• Virtual elimination of the consequences of iodine deficiencydisorders in hyperendemic areas
• Virtual elimination of vitamin A deficiency and its conse-quences, including night blindness
• Provision of low-cost medicine and promoting health insur-ance for children.
Health Intervention Programs
The Structure of Services
The Department of Health was responsible for almost all publicsector health services before devolution in 1991. After devolution,the responsibility for implementing health services passed to the 60cities, 77 provinces, and more than 1,500 municipalities. The role ofthe Department of Health is now confined to policy formulation,regulation, monitoring, training, technical assistance, and the abil-ity to influence the priorities and performance of local govern-ments through the provision of matching grants for theimplementation of particular programs. The implications of devo-lution for both the Department of Health and the Department ofSocial Welfare and Development are discussed in more detail inChapter 4.
A restructuring at Department of Health headquarters in 1994should help to integrate both policy formulation and the develop-ment of projects and programs for child health. Eleven of the keyservices affecting children—in the areas of family planning, mater-nal and child health, and nutrition—are now under one under sec-retary, in charge of a newly created Office of Public Health. In thefield, the Department of Health maintains fifteen regional offices,through which it performs its technical assistance, training, andmonitoring functions for the local governments.
At the local government level, provincial governors and city andmunicipal mayors oversee health and other devolved services.Local health boards act as advisory committees to the local govern-ments’ chief executives and their councils. These boards includerepresentatives of the local government health staff and of the
G O V E R N M E N T P O L I C I E S A N D P R O G R A M S 73

Department of Health; elected officials; and local NGO and commu-nity leaders. Most tertiary-level referral facilities for children—thatis, the provincial and district hospitals, and the budgets to runthem—have been devolved to the provincial governors. First- andsecond-level facilities—barangay health stations and rural healthunits—are the responsibility of the municipalities.
At the periphery, the key health worker is the rural health mid-wife, who is responsible for maternal and child health outreachservices, as well as assisting with other disease control programs.In most provinces, a rural health midwife is available for about5,000 people, or three to five barangays (villages). During the pastfive years, with support from the World Bank, the Department ofHealth has hired an additional 2,500 rural health midwives, in-creasing the national strength by more than 20 percent. The newrural health midwives have been posted to remote and poorer ar-eas. In the majority of the twenty-five most-disadvantaged prov-inces (as defined by the Presidential Commission to Fight Poverty),the ratio of midwives to population is now about one for every2,000 or 3,000 people.
Midwives are assisted by barangay health workers, who volun-teer two or three hours a week at a barangay health station or ruralhealth unit; encourage community participation in health cam-paigns; and provide health education in their village. The barangayhealth worker movement has received varying degrees of encour-agement and support from different governments. The Ramos gov-ernment aims at building up a network of effective barangayhealth workers at a ratio of one for every twenty families in ruralareas and one for every fifty families in urban areas, where popula-tion densities are higher and access easier. It is hard to assess howmany barangay health workers there are, because many barangayhealth workers recruited and trained by previous governments areno longer active. But as a rough estimate, in a typical barangay ofabout 1,500 people, about ten individuals might be identified asbarangay health workers, of whom about half might be activeworkers.
About a quarter of the barangays in the Philippines have baran-gay health stations, simple clinics containing a few supplies andmedicines and staffed by a rural health midwife. The barangayhealth station serves as the health center for the two to five baran-gays covered by the rural health midwife. Health problems of anyseriousness are referred to the rural health unit, whose staffincludes a doctor and a public health nurse. A rural health unit isavailable for a population of about 20,000 people; a typical munici-
74 I M P R O V I N G E A R L Y C H I L D H O O D D E V E L O P M E N T

pality would have one or two of these facilities. District hospitalsare often severely underfunded; in practice, therefore, the mainreferral point from the rural health unit for a seriously ill childwould usually be the provincial hospital.
The Intervention Programs
The different child health intervention programs have had varyingimpact, depending on the levels of commitment and funding theyhave had, how hard their technology is to manage, and how longthey have been established. The immunization program, which hasa tried and tested technology, high commitment, and ample fund-ing, has been by far the most successful. The diarrhea program,which also has a well-tried technology, although one that is harderto implement, has been the next most successful. The program tocontrol acute respiratory infection and the family planning andmaternal care programs have so far had less impact, for reasonsdiscussed below.
IMMUNIZATION. By the mid-1980s the immunization program hadexpanded to include the six standard antigens, but a 1986 evalu-ation indicated that only 21 percent of children were fully immu-nized by that time. Subsequently, the world attention that UNICEFhelped to focus on immunization in the mid-1980s and the issuanceof a presidential proclamation calling for universal immunizationgalvanized attention and effort. “Fully immunized child” coveragerose to 80 percent by 1989 and 90 percent by 1993. This extraordi-nary success was made possible by a number of simultaneous in-puts, including strong political commitment, good programmanagement, a strengthened cold chain system, a well-developedtraining program, and an extremely effective interpersonal andmass media health education campaign. Another key strategy wasthe holding of national immunization days twice a year; these werevery successful in 1993 and 1994. The immunization program’snext target is to eliminate neonatal tetanus and polio by the end of1995.
In the short term, the main constraints to achieving this next goalare the managerial and financial uncertainties posed by devolu-tion. There are some worrying signs that the immunization pro-gram is faltering. Monitoring data show that, for most of the mainvaccines, coverage levels in 1993 were 2 to 3 percent less than in1992. Staff of the Department of Health regional office report thatmaterials for service provision, such as syringes and needles, are in
G O V E R N M E N T P O L I C I E S A N D P R O G R A M S 75

short supply; that attendance at training courses by field healthpersonnel has decreased; and that supervisory and outreach visitshave diminished because travel allowances have not been providedby local governments (the last two problems affect all the publichealth outreach programs). Measures to relieve these generic devo-lution-related constraints are discussed in Chapter 4. In brief, it isclear that there is a strong argument for the central government tocontinue supporting cost-effective “public good” services such asimmunization if local governments are unable to sustain these pro-grams effectively.
In the medium term, the integrity of the cold chain system willbe a major concern because most of the cold chain equipment wasinstalled in 1985 and is wearing out. A cold chain study plannedfor mid-1994 will provide detailed estimates of the rehabilitationneeds, which are likely to be substantial before 2000.
CONTROL OF DIARRHEAL DISEASES. The program for the control ofdiarrheal diseases was launched in the early 1980s. It has two mainthrusts—preventing diarrhea by promoting breastfeeding and hy-gienic practices, and managing diarrhea through the use of oralrehydration therapy (ORT). The program is primarily aimed at pre-schoolers because three-quarters of all deaths from diarrhea occurin this age group. The program expanded rapidly from 1986 to1992. Diarrhea training units were established at the national andregional levels for training rural health midwives and other fieldpersonnel; diarrhea management was incorporated into the medi-cal, nursing, and midwifery preservice training curricula; and pri-vate sector nurses and doctors were oriented in diarrheamanagement through their professional associations. A procure-ment and logistics system was developed to ensure that ORT wasavailable at all service outlets.
The information available does not permit as good an evaluationof the impact of the program to control diseases as is possible forimmunization. The Department of Health is assessing the pro-gram’s impact on mortality. There appears to have been a reduc-tion in the prescription of antibiotics and the use of intravenousfluids and antidiarrheal preparations and a corresponding increasein the use of ORT for the management of diarrhea. ORT use has beenvariously measured at 49.5 percent (the 1993 Demographic andHealth Survey) and 60 percent (the Department of Health’s 1992cluster surveys), the latter figure being an increase from only 15percent in 1985. Also, public hospitals are reporting lower admis-sions of cases of diarrhea, and the number of reported deaths fromdiarrhea has been falling since 1990.
76 I M P R O V I N G E A R L Y C H I L D H O O D D E V E L O P M E N T

The program plan for the control of diarrheal diseases was up-dated in late 1993. In the future, particular emphasis will be givento home management of diarrhea and to morbidity reductionthrough the promotion of the seven interventions recommended byWHO for preventing diarrhea. However, sustaining and building onthe program’s achievements will be difficult. Sustaining past levelsof achievement, given the uncertainties posed by devolution, willbe a bigger challenge than for immunization, because the programto control diarrheal diseases is more difficult to manage: immuni-zation lends itself to short national campaigns, whereas the controlof diarrheal diseases requires the behavioral change of mothers ona day-to-day basis. And with regard to the proposed new empha-ses of the program, no financing strategy has yet been developedfor the considerable additional resources required. Nor have thecost requirements been fully determined for the diarrhea morbidityreduction program—a key intervention if the Department ofHealth’s efforts for children are to be reoriented toward child de-velopment as well as child survival.
CONTROL OF ACUTE RESPIRATORY INFECTIONS. Although pneumo-nia is the major killer of children, in the Philippines as in othercountries the program for the control of acute respiratory infec-tions was the last to be developed, because it was only in the late1980s that tried, cost-effective technologies for field-level imple-mentation became available. The program was launched five yearsago, when various protocols were developed: a standard pneumo-nia detection protocol for use in homes and health facilities, a pro-tocol for managing pneumonia, and standards for providingservices at health facilities. Aside from the protocols, the main in-puts of the program are training; drugs, medicines, and suppliesfor case management; a referral system; and a monitoring andevaluation system.
The accomplishments in training have been impressive, with 80percent of rural health midwives, public health nurses, and doctorsand 30 percent of public hospital clinicians trained in the new pro-tocols. However, the current monitoring system does not permit adetermination of how far the new case management system is be-ing followed in the field. There is also a need for surveillance tomonitor trends in incidence. The Department of Health is seekingtechnical assistance to review the control of acute respiratory infec-tions and to help prepare the next five-year plan to develop theprogram further. Financing for this expanded program is uncer-tain, and, even at the current level of effort, problems of drugavailability are emerging. USAID and World Bank assistance from
G O V E R N M E N T P O L I C I E S A N D P R O G R A M S 77

ongoing projects for the control of acute respiratory infections andfor other child survival interventions was scheduled to come to anend in late 1994 or early 1995.
FAMILY PLANNING, WOMEN’S HEALTH, AND SAFE MOTHERHOOD. Incontrast to the weak commitment to and underfunding of familyplanning and maternal care during the 1980s, the Department ofHealth has made the program for family planning, women’shealth, and safe motherhood its flagship program and is imple-menting two major projects totaling more than P7 billion ($140million) to support its development. Issues and plans related tofamily planning, maternal care, and safe motherhood are reviewedin detail in World Bank (1991) and (1994c) and are not repeatedhere.
As indicated in Chapter 2, efforts to strengthen maternal careand family planning services under the above projects should sig-nificantly, though indirectly, affect infant mortality. However,these projects do not include specific interventions to directly re-duce the 35 percent of infant deaths that occur in the perinatalperiod, the time soon after childbirth. Work is needed to identifywhich of the leading causes of perinatal death can realistically betackled and to develop the case management protocols and inputrequirements for doing so. These protocols will need to be intro-duced into the training curricula to be developed for field healthstaff and traditional birth attendants under the above projects, be-cause perinatal services for infants must be delivered as an integralpart of delivery and postpartum care. Similarly, mothers who arelikely to give birth at home will need to be trained in how to iden-tify and refer at-risk babies; this training should be an integral partof the health education they will receive during prenatal contactswith health staff.
Workloads, Service Integration, and Targeting
The rural health midwife’s workload has increased significantly inrecent years, with intensified implementation of the programs forimmunization and the control of diarrheal diseases; the addition ofthe program to control acute respiratory infections; and continuingresponsibilities to assist the control programs for malaria, tubercu-losis, and schistosomiasis. The workload problem will be furtherexacerbated now that the major new family planning, women’shealth, and safe motherhood projects have begun. Barangay healthworkers can take on some of the work of community mobilizationand health education, but their time inputs are limited because
78 I M P R O V I N G E A R L Y C H I L D H O O D D E V E L O P M E N T

they are volunteers, and their limited skills mean they can makelittle contribution to delivering services. For example, a ruralhealth midwife’s skills are required for prenatal, obstetric, andpostpartum care; prescription of oral contraceptives; and the inser-tion and follow-up of intrauterine devices—all activities likely toincrease substantially in the next few years.
This growing problem implies the need to carefully review theratio of field staff to population and to plan more systematicallyhow the rural health midwife’s time should be used and how theworkload should be divided among her, the barangay health work-ers, and doctors and nurses at the rural health center. With regardto the first need, data are currently available only for the ratios ofrural health midwives to population by province. There are no databy municipality, nor is it known whether rural health midwives arewell distributed in relation to their target population within anygiven administrative area. A mapping exercise to determine this isrequired. It will be especially important to determine whether localgovernments are maintaining rural health midwives in remoter ar-eas, where demands for service may be less vocal than in the towns.
Adopting the life-cycle approach to integrating and targetingservices offers important potential gains in efficiency and effective-ness. Under this approach (see Section G in the supplement vol-ume), fieldworkers would focus on clients who are most at risk,and at the times in their lives when they are most at risk. Thismeans a systematic focus on pregnant and lactating women andchildren in the first five years of life, with particular attention tothe first two years of life, when malnutrition and infection peak.During the regular contacts with this priority client group, fieldstaff would provide a full range of services, rather than focusing onone particular program, or the current health education campaign,as has often happened in the past.
The life-cycle approach uses time more efficiently by focusingscarce resources on those most in need and by reducing unneces-sary contacts with at-risk families through integrating service pro-vision at each contact. This is also a more effective way to providepublic health care from a human perspective, because clients aretreated in a family context and in a holistic manner, rather than asimmunization cases or malnutrition cases. But reorganizing serv-ices in this way has major implications for the redesign of serviceprotocols, health education messages, training programs, and man-agement information systems, as well as field work routines. Ac-cordingly, the Department of Health plans to move ahead with thelife-cycle approach on a pilot basis under the Urban Health andNutrition Project, assisted by the World Bank and the Australian
G O V E R N M E N T P O L I C I E S A N D P R O G R A M S 79
International Development Assistance Bureau, and the Women’sHealth and Safe Motherhood Project, financed by a consortium.Successful implementation of this effort will be a key preconditionfor local governments to be able to manage a more intensive childhealth development effort, on top of the planned efforts to improvewomen’s health and intensify other programs.
Conclusions
With the exception of interventions to reduce deaths in the firstmonth of life, where prevention and case management protocolsneed to be carefully reviewed, the technical strategies for the keychild health interventions are well developed. The main constraintsfacing the program are institutional and financial. On the institu-tional side, two constraints stand out. First, there are worryingsigns that, at least under some local governments, delivery of pub-lic health services, including child health services, has been falter-ing since devolution. Strategies for dealing with this genericproblem are discussed in Chapter 4. Second, rising workloads forfield staff require a review of staffing ratios and a redesign of ap-proaches to targeting and delivering services if additional invest-ment in child health is to be absorbed and used effectively.
On the financial side, it must be recognized that at the time ofdevolution, local governments inherited a series of child healthprograms that were at different stages of development and effec-tiveness and that still suffered overall from the 1980s legacy ofunderfunding of primary care. Only the immunization programwas fully developed. The program for the control of diarrheal dis-eases had reached perhaps half of its full potential, and the acuterespiratory infection, maternal-perinatal care, and family planningprograms lagged far behind. Substantial additional financing is re-quired to achieve the nation’s child health goals, yet large-scaleUSAID and World Bank projects financing child health interventionsare ending. Chapter 5 attempts a rough estimate of the needs anddiscusses the prospects for raising financing from local govern-ment, the central government, and overseas aid sources.
Nutrition Intervention Programs
The Structure of Services
The structure of the Philippine nutrition program is more compli-cated than that of the health program because at least eight agen-cies have been involved on a major scale. The National Nutrition
80 I M P R O V I N G E A R L Y C H I L D H O O D D E V E L O P M E N T

Council, which is an attached agency of the Department of Agricul-ture, is the overall policymaking, coordinating, and monitoringbody and coordinates a substantial nutrition intervention programof its own, LAKASS (see Section H of the supplement volume). TheDepartment of Health is responsible for the micronutrient pro-gram, growth monitoring, nutrition education, and food supple-mentation of pregnant and lactating women and children under 3.The Department of Social Welfare and Development includes nu-trition in its day care program for 4- to 6-year-olds. CARE, CatholicRelief Services, and the Diocesan church program provide large-scale food aid for supplementary feeding in the PEM control pro-grams of the Department of Health and the Department of SocialWelfare and Development. The Department of Agriculture’s exten-sion program promotes home gardens. The National Food Author-ity runs a generalized subsidy program for rice. And many NGOsare involved in nutrition projects on a smaller scale.
Local governments are the main actors in nutrition, as they are inhealth. At the local government level, nutrition activities are over-seen by an intersectoral Nutrition Sub-Committee reporting to theSocial Development Committee of the local government council. Atthe periphery, the same rural health midwives, barangay healthworkers, and day care workers who are responsible for child healthand preschool development are also responsible for nutrition. Theyare assisted by barangay nutrition scholars, a cadre created by theNational Nutrition Council more than fifteen years ago. About1,000 new barangay nutrition scholars were trained each year dur-ing 1988–93 to increase coverage in deprived inner-city areas.Barangay nutrition scholars now number about 14,000, or aboutone for every three barangays. Like barangay health workers,barangay nutrition scholars average a couple of hours a day onnutrition work, ranging from helping with growth monitoring andsupplementary feeding, to micronutrient distribution and nutritioneducation. Barangay nutrition scholars are compensated with acci-dent insurance and an allowance that in most parts of the countryranges from P30 to P50 (less than $2) a month; in exceptional cases,such as the relatively well-off Cebu City, the allowance can be asmuch as P1,000 ($36).
Micronutrient Deficiency Control
Interventions against micronutrient deficiency can be divided intocorrective interventions (routinely administered supplements),maintenance interventions (fortification of dietary staples), andpromotional interventions (to increase the cultivation and con-
G O V E R N M E N T P O L I C I E S A N D P R O G R A M S 81

sumption of micronutrient-rich foods). These approaches have dif-ferent time horizons. The first can lead to significant reductions inprevalence within two years of effective implementation. The sec-ond can maintain the gains from corrective measures and help toaccelerate prevalence declines. Ideally, permanent resolution of mi-cronutrient deficiency problems lies with the third approach, butthis is also the hardest and slowest to implement, because of thedifficulty of educating people to change long-held dietary habits.Food fortification has therefore become a long-term intervention inmany developed countries, where it is pursued through an indus-trial policy framework in which governments provide the privatesector with incentives to fortify.
SUPPLEMENTATION. The Department of Health has given veryhigh priority to attacking micronutrient deficiency and has suc-ceeded in gaining strong political support for its efforts. A cam-paign approach has been used very effectively to increase coveragelevels for vitamin A and iodine supplements to about 80 percentfor the high-risk population groups. In 1993 a National Micronutri-ent Day with a major publicity campaign was used to distributeretinol (vitamin A) to all preschool children and iodine to pre-school children and women of childbearing age. In 1994, NationalImmunization Days were used to distribute retinol along withmeasles vaccine to infants and to give follow-up doses to older agegroups. With continued commitment from the Department ofHealth and local governments, the campaign approach promises tomake major inroads into iodine and vitamin A deficiencies. How-ever, given the difficulties of measuring subclinical levels of defi-ciency in the field, it is important to establish an effective sentinelsurveillance system to monitor the actual impact of the program inrisk groups with different characteristics, in addition to trackingprogram success by monitoring inputs.
Organizing an effective iron supplementation program is muchmore difficult, because iron supplements need to be taken daily orweekly, rather than twice a year or every two or three years, as inthe case of vitamin A and iodine. Iron supplementation cannottherefore be tackled through the relatively easy-to-manage cam-paign approach. Given that iron supplementation has some nega-tive side effects and leads to little visible or immediate positivechange in well-being, persuading mothers to supplement them-selves and their children regularly requires frequent contact and astrong relationship of trust between fieldworker and client. So far,the Department of Health’s maternal care program has not suc-ceeded in developing the regular contact and the quality of health
82 I M P R O V I N G E A R L Y C H I L D H O O D D E V E L O P M E N T

education that is required. This is a major goal of the Women’sHealth and Safe Motherhood Project, as is improvement of the lo-gistics system for supplying supplements. The introduction oflonger dosage intervals is presently being considered, which, ifadopted, should also make this intervention more acceptable toclients.
As indicated in Chapter 2, the very high level of iron deficiencyamong infants and children is a particular cause for concern. Be-cause the maternal iron supplementation program has not yet beenwell implemented, it is unclear how far improving iron storesamong mothers will reduce the deficiency among infants and chil-dren. In the interim, until the planned efforts to improve the mater-nal iron program have been implemented and evaluated, it makessense to continue at least to give liquid iron supplements to infantswith low birth weights, because these are the children at greatestrisk. However, the high cost and additional managerial complexityof giving supplemental iron to all infants 6 months to 11 monthsold and to all preschool children with PEM, as currently proposed,may not be justified; few countries have reckoned this interventionto be cost-effective.
An important complement to iron supplementation against ane-mia can be the control of parasitic diseases, where these are highlyprevalent. It is unclear how far parasites contribute to anemia indifferent population groups of children in different parts of thecountry. Geographic information system technology, which is cur-rently being introduced in the Philippines, offers the potential ofoverlaying data for the prevalence of anemia and different types ofparasitism to define which areas should be chosen for intensiveefforts to control parasites. It is likely, for example, that it would becost-effective to introduce routine intestinal deparasitization in cer-tain populations rather than to treat children on clinical criteriaalone, as is now done.
FORTIFICATION. Despite much research and some experimenta-tion, fortification has not so far been implemented on a large scalefor any of the three main micronutrients. The government is com-mitted to doing much more in this area. The salt iodization pro-gram, begun in four areas of the country in 1981 but not sustained,will be reinitiated, with special priority for the endemic Cordilleraregion. Quality assurance testing is about to begin of iodized ironproduced in two plants. Experimentation is also ongoing withcommunity-based iodization of local water supplies. Procter &Gamble, which has 95 percent of the margarine market, is fortify-ing margarine with vitamin A. The government is also discussing
G O V E R N M E N T P O L I C I E S A N D P R O G R A M S 83

large-scale fortification of rice, milk, and flour with this vitamin.The Food and Nutrition Research Institute developed technologyfor iron fortification of rice some years ago, but this has not beenimplemented on a large scale.
The Department of Health has been given the responsibility fororganizing the micronutrient fortification program. The depart-ment is highly committed to the effort, but faces two major con-straints. The first is the additional workload of organizing thevariety of fortification projects proposed, on top of plans to inten-sify other micronutrient and PEM control activities. The second isthe lack of specialized skills in an area that poses difficult techni-cal, institutional, legal, and marketing challenges and that involvesthe Department of Health in negotiations in the unfamiliar envi-ronment of private industry. A combination of these constraintshas resulted in a somewhat piecemeal approach to the fortificationprogram; ad hoc negotiations with individual producers have sub-stituted for well-thought-out industrywide plans. If the fortifica-t ion program is to unfold as the government hopes, theDepartment of Health should be enabled to draw on technical as-sistance from countries that have already been successful in thisarea, and an institutional development plan should be prepared toensure that the capacity is there to design, monitor, and evaluatethe effort.
PROMOTION OF DIETARY CHANGE. The Department of Agriculturesupports a home gardening program encouraging the cultivationof micronutrient-rich vegetables and fruits. It is planned to expandthis effort by developing school and community biointensive gar-dens. Also proposed in the Philippine Plan of Action for Nutritionis a revamped program of social marketing to encourage people toeat foods that are rich in micronutrients or that increase the absorp-tion of micronutrients, as do fruits and fats. An initial step in thisprogram was the campaign to promote the cultivation and con-sumption of malanggay as part of the 1993 National MicronutrientDay.
Although the campaign approach is a valuable one, the difficultyof changing dietary habits means that it must be complementedwith interpersonal health education efforts tailored to local dietsand practices and to individual families’ situations in terms of in-come and access to land. Much remains to be done to develop asound social marketing strategy at this level and to incorporateappropriate communication efforts into fieldworkers’ daily rou-tines. With intensification planned for so many of the Departmentof Health’s programs for women and children, there is a danger
84 I M P R O V I N G E A R L Y C H I L D H O O D D E V E L O P M E N T

that efforts to encourage dietary change will be lost among moreimmediate priorities, thus prolonging clients’ dependence on mi-cronutrient supplementation programs. Given the emergingoverload of field staff, and the difficulty of promoting dietarychange, it is realistic to focus health education in each local areaon just one or two dietary changes selected for their priority andlocal practicability.
The Department of Health and DSWD Programs to Control PEM
GROWTH MONITORING AND PROMOTION (GMP). Most PEM in thePhilippines is moderate rather than severe and hence is not easilydetected by the untrained eye. Growth monitoring is an essentialtool for demonstrating to parents, first, that their child is malnour-ished; second, how quickly children’s weights can decline in re-sponse to illness or underfeeding; and third, how quickly childrencan be brought back onto a normal growth path through better careand through feeding relatively small additional amounts of food.But although a valuable consciousness-raising and educationaltool, GMP is not easy to implement. As a major international reviewrecently concluded (Cervinskas, Gerein, and George 1992), GMPprograms require careful technical design and strong training andsupervisory support if they are to be effective; if poorly plannedand supported, GMP programs are as bad as no program at all.
Two approaches to growth monitoring have so far been tried inthe Philippines. Neither has worked well. The Under-Six ClinicProgram of the Department of Health was started by the NutritionService in 1975 as a growth-monitoring initiative and was movedto the Maternal and Child Health Service in 1983 with the aim ofmaking it an integrating mechanism for all health services foryoung children. Under this program, mothers are encouraged tobring their children to the barangay health station or rural healthcenter for monthly weighing, at which time health and nutritioneducation, immunization, and other services are delivered. Sup-port for this approach has been weak, perhaps because the Depart-ment of Health management has seen GMP as a strategy rather thana program in its own right. GMP has had no budget of its own (thenutrition budget of the Department of Health before devolutionwas less than half a percent of the departmental budget). Trainingprograms have been weak because procedural manuals were notdeveloped. And monitoring indicators for this activity have notbeen included in the management information system, thusreducing the incentive for implementation. As a result, many par-ents have no growth charts, charting is often irregular or of poor
G O V E R N M E N T P O L I C I E S A N D P R O G R A M S 85

quality, and growth monitoring is seldom used by fieldworkers asan effective tool for promoting growth.
The second approach to growth monitoring, Operation Timbang,is a nutritional screening program that takes place once a year. It isimplemented on a campaign basis, with the help of the rural healthmidwives, barangay nutrition scholars, and barangay health work-ers. Although Operation Timbang has helped to raise awareness ofPEM problems, it is generally agreed that the nutrition data pro-duced by Operation Timbang have been of poor quality, both be-cause many of the scales used were faulty and because ofinadequate worker training. But even if these problems are cor-rected, Operation Timbang cannot substitute for a more regulargrowth monitoring and promotion program as an interventionagainst PEM. An annual intervention is too infrequent to catch mostchildren in nutritional trouble and cannot educate parents by dem-onstrating monthly weight gains.
Two approaches to reorienting the GMP program have been ad-vocated, but these also do not promise to work well. In 1991 theNutrition Service of the Department of Health drafted a plan for acommunity-based nutrition program that would center on monthlygrowth monitoring by barangay health workers of all children 0 to60 months old. Good-quality implementation of such a plan is un-likely. On the one hand, if the Department of Health succeeds inincreasing the number of barangay health workers so that there isone for every twenty families, about forty barangay health workerswould monitor growth in an area typically covered by a ruralhealth midwife—a number impossible to train and supervise ade-quately. On the other hand, if the number of active barangay healthworkers remains small, the workload of GMP, with more than 225preschoolers in a typical barangay, would be more than can rea-sonably be expected of part-time volunteer workers. Aside frombeing unmanageable, attempting to provide monthly GMP to chil-dren 37 months to 60 months old would be a difficult “curative”intervention: most of these children are stunted, and the nutritionaldamage would be hard to undo.
Because of the difficulty of organizing good-quality GMP throughthe barangay health worker cadre, an alternative proposal has beento have monthly GMP carried out by the rural health midwife toensure good quality and to restrict it to infants. In that it targets theyounger age group, this is a more desirable “preventive” approach.But it is unclear whether educational contacts limited to the firstyear of life will be adequate to fully reorient mothers’ feeding andcare behaviors through the peak period of wasting, which extendswell past the first year of life (Figure 2-10). Nor are rural health
86 I M P R O V I N G E A R L Y C H I L D H O O D D E V E L O P M E N T

midwives likely to be able to implement even this restricted GMPprogram effectively. Past experience suggests that mothers will notbring their infants to the clinic a dozen times in a year. Yet therural health midwife, with 60 to 150 infants to care for (dependingon the size of her area), will have little time for outreach GMP work,given her growing responsibilities for improving child survivaland prenatal and obstetric care.
It is therefore recommended that the growth promotion programfor children under 6 be reoriented from a clinic to an outreachapproach, with monthly monitoring and counseling carried out inthe barangay, and that monthly growth monitoring be targeted onchildren during the peak period of wasting, that is, the first 24 or36 months of life (Figure 2-10), with only quarterly monitoring forolder preschoolers. The workload and staffing implications of tar-geting good-quality “preventive” growth promotion on the high-risk 0- to 24-month age group are discussed below.
FOOD SUPPLEMENTATION. About a million preschoolers a yearhave participated in three main supplementary feeding programs,one organized by the Department of Health with assistance fromCARE, covering about 334,000 children, and the others supervisedby the Department of Social Welfare and Development, throughCatholic Relief Services, covering about 275,000 children, andthrough the Diocesan church, covering about 386,000 children.Most of the food for these programs has been supplied by the U.S.government as part of PL 480 food aid. USAID plans to phase out itsPL 480 support for the Philippines over a two-year period, partlyin response to priorities for assistance in Sub-Saharan Africa, andpartly because of the perceived ineffectiveness of the Philippinesupplementary feeding program and the nutrition program ofwhich it is part. This rapid phase-out will force a radical reap-praisal of the supplementary feeding program, a task that was in-itiated in late 1993 by a committee chaired by the NationalNutrition Council and composed of staff representatives from theNational Nutrition Council, the Department of Health, and the De-partment of Social Welfare and Development.
Several design problems have constrained the effectiveness ofthe supplementation program. First, the foods offered werethose that the United States could spare, not necessarily the bestweaning foods or those most suited to local tastes. Second, muchof the food went to older children, rather than those at the peakages for wasting, many of whom were not covered by the pro-gram. Third, much of the food was distributed on a “take home”basis, so that an unknown quantity was shared with older family
G O V E R N M E N T P O L I C I E S A N D P R O G R A M S 87

members. Finally, depending on the implementing agency, chil-dren might stay in the feeding program for six to twenty-fourmonths, thus encouraging dependency on food assistance fromoutside the family. Program designers were ambivalent, and clientsdid not understand, as to whether supplementary feeding was agrowth promotion intervention designed to educate parents aboutbetter childcare or a food security intervention providing a safetynet for the very poor.
Because the withdrawal of PL 480 support will require muchtighter targeting of scarce resources, it provides an opportunity torethink the supplementary feeding program’s technical design.Four changes are recommended, corresponding to the constraintssummarized above.
• Substituting locally produced weaning foods of a requiredquality, suited to local tastes
• Tightly targeting supplementation on nutritionally at-riskpregnant women (to combat low birth weight) and on childrenages 6 months to 24 months or 6 months to 36 months whosegrowth is faltering or who are moderately or severely mal-nourished
• Feeding children on-site to ensure that they actually get thesupplement intended for them
• Restricting the time children spend in the supplementationprogram to three to six months and accompanying supple-mentation with intensive education on better care and feedingin the home; this will discourage dependency by sending themessage to parents that the food supplementation program isa short-term, educational effort, seeking to improve but notsubstitute for the parents’ own childcare efforts.
Food supplementation designed along the above lines can be animportant complement to nutrition education, because it enablesparents to see, from the growth chart, the difference that additionalsmall amounts of food can make. But the amount of supplementprovided, typically 300–400 kilocalories, or no more than a third ofa child’s requirements, is not enough—nor is it intended tobe enough—to fill the food gap in a food-insecure household. It isessential for nutrition policy to distinguish between food supple-mentation, which should be seen not as a “dole” but as a short-term,educational intervention integral to the child growth promotionprogram, and food subsidy, which may need to be provided for amuch longer term to a limited number of the very poor. Food sub-sidies are discussed separately below.
88 I M P R O V I N G E A R L Y C H I L D H O O D D E V E L O P M E N T

WORKLOAD AND STAFFING IMPLICATIONS. Given the importanceof poor caring practices as a cause of PEM (Chapter 2), it seemsunlikely that the Philippines can rapidly reduce moderate PEM toacceptable levels without retargeting and redesigning its growthpromotion and supplementary feeding program along the abovelines. Successfully managing such a program requires a lot a timefrom fieldworkers. For example, in a typical barangay of 1,500 peo-ple, there are 35 to 45 pregnant and lactating women and 70 to 90children 0 to 24 months old at any given time. The experience ofother countries suggests that the time implications of running agood-quality growth promotion program at the village level areoften underestimated. The lesson from the Tamil Nadu NutritionProgram in India—one of a very few high-quality growth promo-tion efforts in Asia—is that good growth charting and counselingtakes about three days a month; that running an on-site supple-mentary feeding and counseling program takes two to three hoursa day, six days a week; and that home visits and record-keepingaccount for an additional two to three hours a day.
The staffing issue to be resolved is whether it will be more cost-effective to entrust this work to a single paid worker in each baran-gay, who would work four to six hours a day on GMP or to divideresponsibility for GMP among several volunteer barangay healthworkers, each working fewer hours. The first option is stronglyrecommended. The time and dedication required to run GMPeffectively are significant. Because the workload has to be sus-tained daily, it cannot be compared to the intensive but brieftime contributions to immunization and micronutrient cam-paigns, in which volunteer workers have been most successful inthe past. Paying an incentive commensurate for work done is firstof all equitable, an important consideration in barangays wherevolunteers are themselves poor. Second, and equally important,payment allows program managers to hold workers accountablefor performance.
Aside from the drawbacks of inequity and lack of accountability,the use of volunteers poses problems related to the managementand cost of training and supervision. Because good-quality growthmonitoring and counseling are difficult and require careful train-ing and intensive follow-up, and because rural health midwivesare themselves increasingly overloaded, it will be very difficult forone rural health midwife to provide effective support for morethan three or four GMP workers, that is, one for each barangay. Theidea that employing larger numbers of volunteers for outreachwork is a cheap way of organizing GMP may be illusory. The highdropout rate of volunteers in the barangay health worker program
G O V E R N M E N T P O L I C I E S A N D P R O G R A M S 89

and hence the constant need to train new workers would add sig-nificantly to the workload and cost of program support.
Food Security Interventions
Broader policies affecting food security, such as the macroeconomicframework and the government’s antipoverty program, are beyondthe scope of this book. Here discussion is limited to a few impor-tant policy issues that directly affect young children with regard tothe two main government interventions in food security. These arelivelihood creation programs and the food subsidy program run bythe National Food Authority. This section also outlines the kind oftargeting and coordination that will be needed at the barangay andmunicipal levels to ensure that food security interventions reachthose most in need. More general proposals for developing a safetynet to ensure the food security of the very poor are discussed indetail in World Bank (1995).
LIVELIHOOD PROGRAMS. The government has made livelihoodcreation the centerpiece of its strategy to reduce poverty (Philip-pine Institute of Development Studies 1993). Analyzing thestrengths and weaknesses of current and proposed livelihood-crea-tion interventions would be a very substantial task, given the largenumber of programs fragmented among many implementing agen-cies and the difficult issues of equity and cost-effectiveness. Suchan analysis is beyond the scope of a book dealing only with youngchildren. Nevertheless, the types of livelihood programs the gov-ernment chooses, and the relative priority given to livelihood pro-grams as against other interventions, will significantly affect childdevelopment. Three issues stand out.
First, research in a number of countries has shown that it is notjust increases in employment and household income that are im-portant to improving food security but who controls additionalincome; income going to mothers is often more likely to improvechildren’s welfare than income going to fathers. This finding hasbeen corroborated for the Philippines in a study by Senauer,Garcia, and Jacinto (1988) indicating that an increase in husbands’wages increases the calorie allocation to husbands and wives butreduces the share of the family food basket going to children. In-creases in women’s wages increase the share of family calories go-ing to children. This strongly suggests that those designinglivelihood programs in the Philippines should favor interventionsincreasing women’s employment and incomes if the concern is forchild welfare as well as overall economic growth.
90 I M P R O V I N G E A R L Y C H I L D H O O D D E V E L O P M E N T

Second, several agencies, disappointed with the lack of successof growth monitoring and food supplementation programs in thePhilippines, are thinking of increased investment in livelihood pro-grams as a substitute. Although livelihood creation is an importantcomplement to a good GMP program, it cannot substitute for such aprogram, because, as has been shown for the Philippines, extraincome will not deal with poor caring practices that are such animportant cause of malnutrition in children under 3 (Chapter 2). Inthe food-insecure families studied by Senauer, for example, al-though the whole family ate less than the recommended daily al-lowance of calories, husbands ate 81 percent, wives ate 78 percent,and children ate only 64 percent of the daily allowance. Filipinoshave a well-deserved reputation for caring for children; this rela-tive deprivation of children is presumably because parents do notreadily appreciate the rapid change in protein and energy require-ments at this age, nor can they easily detect the first stages ofmalnutrition. Unless the Philippines develops a good, complemen-tary GMP program that demonstrates malnutrition, income in-creases from livelihood programs will have less effect than theyotherwise might on the nutritional status of children.
Finally, there are important equity concerns about too great areliance on livelihood creation to alleviate poverty and malnutri-tion. Evidence from many countries shows that new jobs go last ornot at all to the poorest, who, as the least educated and often themost remote, are least able to take advantage of opportunity whenit comes. Even though new jobs are the engine for economicgrowth and poverty reduction in the medium and long terms, thereis a strong case for developing a safety net to protect the nutri-tional status of the very poor, and their children, in the short term.One possible intervention for this purpose is discussed briefly inthe next section.
FOOD SUBSIDIES. The National Food Authority’s mandate is toimprove the food security of the consumer and to stabilize pro-ducer prices. Its impact on food security is discussed in detail inWorld Bank (1995). In brief, the National Food Authority spendsP2 billion to P3 billion ($71 million to $107 million) a year to fi-nance a generalized subsidy for rice sold through retail outlets.However, because this rice has represented only 2 to 11 percent ofconsumption, its effects on the market have not been big enough tosubstantially affect prices. Because the subsidy has been general,that is, spread thinly and not targeted specifically on poor consum-ers, the income transfer to the poor, as to other consumers, hasrepresented only about P2.60 ($0.09) for each kilo of rice, and this
G O V E R N M E N T P O L I C I E S A N D P R O G R A M S 91

saving has come at a very high administrative cost, equaling thecost of the subsidy for each kilo. Moreover, the geographic distri-bution of subsidized rice has not been equitable; for example, theNational Capital and the Cordillera regions, which together con-tain only 3.5 percent of the subsistence poor, received more than 40percent of the National Food Authority rice in 1993. Altogether, theNational Food Authority has been evaluated as both ineffectiveand inefficient at improving the food security of the poor.
From the perspective of improving the nutritional status ofyoung children, two more targeted uses for the funds now spent onthe National Food Authority would have a high payoff. The firstwould be to redirect funds to substitute for the withdrawal of PL480 food aid for children and to revamp the GMP program so that itoperates more effectively. The second would be to finance a new,tightly targeted food subsidy scheme, probably by providing foodstamps, to alleviate the food insecurity of the poorest families, whoare unlikely to get access to additional employment in the shortand medium terms. Ways to design and target such a program arediscussed in World Bank (1995). Of these two programs, the firstappears to be the priority, both because it will be more immedi-ately cost-effective to strengthen an existing program in whichthere are sunk costs than to start a new one and because no otherPEM intervention is likely to be successful until a good growthmonitoring program is in place and parents perceive that their chil-dren are malnourished. But a food security intervention, such as afood stamp scheme, will also be needed for the protection anddevelopment of children whose families, however well they areeducated in childcare, do not have the money to feed them prop-erly. GMP and food security interventions should be implementedtogether.
TARGETING AND COORDINATING FOOD SECURITY INTERVENTIONS.Careful thought will need to be given to the processes required atthe barangay and municipal levels to identify families in need offood security interventions, to decide which kinds of interventionsare most appropriate, and to coordinate the delivery of interventions.A process similar to UNICEF’s “Triple A” process—assessment ofthe nutrition problem, analysis of its causes, and action to intervene—will need to be developed at the municipal level.
Assessment might be done by monthly growth monitoring andby surveying household assets for targeting purposes, as discussedin Chapter 2. Analysis would involve the combined judgment ofthe barangay worker and supervisors in health and social welfareabout the relative importance of health, care, and food security as
92 I M P R O V I N G E A R L Y C H I L D H O O D D E V E L O P M E N T

causes of malnutrition. Where food insecurity is a significant factor,action would involve deciding which mix of available interventionswould be appropriate and working with the field staff of the rele-vant programs to ensure that the interventions are made available.For example, a family may need access to credit or livelihood pro-grams to increase food security over the medium and long terms,but they may also need immediate access to a food subsidy programto reduce malnutrition until income-generating activities can suc-cessfully be established. Considerable further work is required todevelop mechanisms for the integration of food security interven-tions at the local level, an issue that is revisited in Chapter 4.
Conclusions
The government’s commitment to reducing micronutrient malnu-trition is strong, and there is a real prospect of meeting the nationalgoal of eliminating vitamin A and iodine deficiencies as a publichealth problem by 2000. It is less clear that currently plannedmeasures to improve the iron supplementation program representthe most that can be done. Because anemia is the most commonform of malnutrition in the Philippines, a further strategy reviewwill be important. Enthusiasm to tackle micronutrient deficiencyon all fronts has stretched the resources of the Department ofHealth’s nutrition staff thinly, especially when it comes to workingwith industry to promote food fortification and to developing so-cial marketing programs to support local government efforts topromote dietary change. If implementation of the medium- andlong-term measures required to avoid continuing dependence onsupplementation is not to lag behind, it will be important tostrengthen the Department of Health’s planning and support ca-pacity in these areas and to ensure that the department can drawon the best program design experience from other countries. Prob-ably no other investment opportunity offers such potential impacton children at such low cost as does strengthening the micronutri-ent malnutrition control program.
In contrast to its commitment and initiative in the area of micro-nutrient malnutrition, the government has mounted no comparableeffort to improve the PEM control program. The growth monitoringand promotion program suffers from clear technical design prob-lems and from being a low priority, and large sums of money con-tinue to be wasted on a generalized food subsidy that does notprovide a worthwhile safety net for the food insecure. Despite acontinuing reduction in PEM rates, moderate malnutrition, as meas-ured by international standards, still affects more than a quarter of
G O V E R N M E N T P O L I C I E S A N D P R O G R A M S 93

preschoolers. And given the close links between PEM and childdeaths, continuing slow progress in reducing PEM may alsothreaten the achievement of national mortality reduction goals.
The proposed rapid phaseout of PL 480 support—the GMP pro-gram’s main financial resource—will presumably precipitate theprogram’s reform. And there are signs that the government may bemore willing to tackle the drain on public resources of the foodsubsidy program. It will be essential to use this opportunity toreform the nutrition program for the maximum benefit of pregnantwomen and young children, the most vulnerable members of soci-ety from a nutritional standpoint. Significant additional financingwould be required, first, to revamp the GMP program (includingthe payment of allowances for fieldworkers and the replacement offood aid with domestic resources) and, second, to develop a tar-geted food security intervention for the poorest. At a time of severefiscal constraints, this financing cannot come as an addition to pub-lic spending. Therefore, the National Food Authority’s substantialexpenditures on generalized food subsidies should be reallocatedto strengthen and develop a more effective and efficient PEM con-trol program.
Early Education
The Structure of Services
Before devolution, the Department of Social Welfare and Develop-ment was the main government agency involved in psychosocialdevelopmental or early education services. The department devel-oped two main programs in this area, aside from the food supple-mentation program discussed above: the Day Care Center Programand the Parent Effectiveness Service Program. The Day Care CenterProgram is by far the largest and is the main focus of discussion inthis chapter. Its name is somewhat confusing because the programtakes in children for only two to three hours a day and providesthem with organized early education; it is therefore really a pre-school education rather than a day care program. In addition, theDepartment of Education, Culture, and Sports provides preschooleducation for 6-year-olds, and the Department of Health has in-cluded a parent education component in its clinics for childrenunder 6; the latter seems to have had little impact and is not re-viewed here. A very large number of NGOs also provide preschooland day care services (see Chapter 4).
Since devolution, local government is mandated to provide theearly education services previously provided by the Department of
94 I M P R O V I N G E A R L Y C H I L D H O O D D E V E L O P M E N T

Social Welfare and Development. As with the Department ofHealth, the role of the Department of Social Welfare and Develop-ment is now one of policy development, coordination, monitoring,training, and technical assistance. The department maintains a net-work of offices in the regions to carry out its support role. At head-quarters, its activities for children are divided among threebureaus: the Bureau of Child and Youth Welfare, which supportsthe day care center program; the Bureau of Family and CommunityWelfare, which supports the parent effectiveness program (as wellas running a livelihood-creation program for the very poor); andthe Bureau of Emergency Assistance, which supports nutrition ac-tivities. The Department of Education, Culture, and Sports, how-ever, has not been devolved, and its preschool activities aremanaged from Manila by the Bureau of Elementary Education.
At the city and municipal levels, the main worker is the socialwelfare officer, a graduate-level staff member responsible for look-ing after the full range of social welfare programs. These includeemergency assistance, livelihood creation, beautification, and shel-ter programs, in addition to child development work. Dependingon the size of the municipality, the number of social welfare offi-cers can vary from one to three. Above the village level, therefore,the ratio of full-time, paid social welfare staff to clients is, on aver-age, a quarter of that of the health service, which would have atleast four rural health midwives and four health center staff in atypical municipality.
At the barangay level, the key worker is the day care worker, afull-time paraprofessional with a minimum of two years of collegeeducation. Although all day care workers do the same work, theydiffer very considerably in how much they are paid. Encadredworkers are paid P2,000 to P3,000 ($70 to $105) a month. They are asmall minority (less than 10 percent of day care workers) who wererecruited in the initial phase of the day care center program in the1980s. Recognizing that it did not have the budget for large-scaleexpansion of the program at these salary levels, the Department ofSocial Welfare and Development later moved to a less costly sys-tem of “volunteer” day care workers, who are paid allowances.Most local governments, who are now responsible for the day careworkers, pay them no more than the P500 ($18) allowance permonth mandated by law. This is supposed to be topped up with acontribution of about P250 ($9) a month from the community, al-though field visits suggest that community contributions are a frac-tion of this amount. In a few better-off municipalities, day careworker allowances paid by the local government may be as muchas P1,000 ($36) a month.
G O V E R N M E N T P O L I C I E S A N D P R O G R A M S 95

The Day Care Center Program
Public provision of day care started as early as 1964 but began on alarge scale only following passage of the 1978 Barangay Day CareLaw. Government-run day care centers are designed for thirty chil-dren at a time, and hence, where morning and afternoon sessionsare run, have a capacity for about sixty children; in practice, manyrun at far less than full capacity. The program is aimed at 4- to6-year-olds. The length of each session is two hours, organized ac-cording to a standard curriculum of informal education and organizedplay, which was developed at the national level. The day care cen-ter program has expanded steadily in recent years, with an espe-cially big jump in coverage after devolution (when local governmentswere mandated to provide this service). But the rapid expansion—from 13,900 centers in 1991 to more than 18,000 in 1992—was from asmall base, so that in 1992 still only 43 percent of barangays in thecountry had a government-provided day care center.
Systematic training of day care workers began in 1983, when,with assistance from UNICEF, the Department of Social Welfare andDevelopment launched the first Early Childhood Enrichment Pro-gram, which supported a needs assessment and a one-month train-ing program for 1,000 day care workers a year. But by the end ofthe second phase of the program in 1987, only about 45 percent ofthe 12,000 day care workers existing at that time had been trained.To reduce the backlog, the emphasis shifted to a new program oftwelve-day, on-the-job training, although the original training pro-gram was not discontinued. Under the new program, the numberof trainers was increased by allowing selected day care workers tobecome trainers. By the end of 1992, when there were about 18,000day care centers, about 12,500 day care workers had been trained.Of these about 4,300 had had the training as it was originally de-signed and 8,200 the on-the-job training (HEWSPECS 1994).
IMPACT AND QUALITY ISSUES. In the absence of a thorough evalu-ation of early education programs in the Philippines, or even alocally appropriate set of developmental standards for measuringperformance (Chapter 2), it is impossible to assess the impact of theday care center program. However, there is general agreement,supported by observations made on field visits, that quality is low.Educational materials are in very short supply in most centers.Most local governments do not budget for these, and communitycontributions for them are seldom forthcoming. In many centersmany of the materials that are in evidence have been paid for by
96 I M P R O V I N G E A R L Y C H I L D H O O D D E V E L O P M E N T

the day care worker herself. Similarly, the child stimulation andteaching skills of many day care workers appear to be weak, andthere is a tendency, common to many preschool programs aroundthe world, for the day care workers to focus on initial instruction inthe “three Rs” rather than on the organized play that is more de-velopmentally appropriate for this age group. Anecdotal informa-tion suggests that the work of day care workers who have had onlythe on-the-job training is of significantly lower quality than that ofthose with the full training.
Several factors combine to cause low quality. First, the length ofon-the-job training is insufficient for a good foundation, and theability of day care workers to act as good trainers when they donot have trainer training is questionable. Second, large classesmake good-quality stimulation and teaching difficult. Third, thelimited numbers and heavy workload of social welfare officersmake regular, good-quality supervision impossible. (The ratio ofsocial welfare officers to day care workers is usually in the range ofone to five or one to ten, depending on the number of barangayswith a day care center in a particular municipality. Although ratiosin this range would normally be considered reasonable for supervi-sion, the many different programs for which social welfare officersare responsible leave them with limited time for the on-the-jobtraining and supervision required by the day care center program.)Fourth, budget allocations by local governments for recurrent ex-penditures are low: allowances for day care workers are insuffi-cient to act as incentives, and there are low or no budgetallocations for educational materials. Allocations may be low be-cause of inability to pay, lack of understanding of what constitutesacceptable quality and the minimum inputs to achieve it, or lack ofinterest (some local governments may be more interested in fulfill-ing the letter of the Day Care Law and reaping the political re-wards of establishing new centers than in the quality of theservices provided).
To bring the day care center program up to an acceptable level ofquality, the following steps are suggested:
• Create an additional social welfare officer post in each munici-pality, a post dedicated to monitoring, supervising, and pro-viding training for early childhood development (ECD)activities. (The need for this post will become still more press-ing as local governments create more day care centers—therapid rate of growth in numbers seen since devolution seemsto be continuing.)
G O V E R N M E N T P O L I C I E S A N D P R O G R A M S 97

• Develop a training center in each region to provide social wel-fare officers who are in charge of day care centers with super-visory and trainer training.
• Define minimum standards for day care center quality, daycare worker allowances, and materials and other inputs.
• Limit class size to twenty children a session (a number alreadystretching the limits for good-quality care).
• Develop a program in which local governments undertake tocarry out agreed-upon improvements in quality in return for apackage of technical, financial, and training assistance fromthe Department of Social Welfare and Development. (Possibleways to structure such a program are discussed in Chapter 4.)
COVERAGE, ACCESS, AND EQUITY. Coverage and equity concernsexist at two different levels—within the barangay (which familiesget services) and nationally (how equitably the expansion of theday care center program is spread across the country).
A typical barangay may have about ninety children who are 4 or5 years old (it is assumed here that 6-year-olds will soon be ab-sorbed by the expansion of elementary education and will nolonger be potential clients of the day care center program). Of theseninety, no more than forty could be absorbed by one day care cen-ter if class size is reduced, as recommended above. There has beenno study of the socioeconomic levels of children who attend publicday care centers against those who do not go to an organized pre-school, but field visits suggest that the very poor may be crowdedout of the day care center system by the less poor.
If the public sector is to provide preschool services, these mustreach the most disadvantaged children. A selection mechanismshould be developed to ensure that the poorest are identified foraccess to the service. Obvious criteria for inclusion would be mal-nutrition, as shown by the growth monitoring program, and pov-erty, as shown by a family asset–based indicator that might bedeveloped for access to the food stamp safety net program recom-mended above. Adherence to the inclusion criteria for the verypoor could then become one of the conditions of local governmentaccess to an assistance package from the central government.
Such an approach might still not guarantee access for the verypoor living at the peripheries of villages. Nor may day care centersin barangay centers be a convenient service point for scatteredcommunities, for example, some indigenous communities. Ahome-based approach for the provision of early education may bemore appropriate in these circumstances. This approach, althoughtried only on an experimental basis in the Philippines, has proved
98 I M P R O V I N G E A R L Y C H I L D H O O D D E V E L O P M E N T

quite successful in several Latin American countries. In it, earlyeducation or day care services for six or seven neighborhood chil-dren are provided by a suitably qualified and trained local motherin her own home. Although this approach is recommended forensuring that poor people living at the periphery get access to serv-ices, it is unlikely to be a cost-effective substitute for thecenter-based program as a whole. This is because the training andsupervision requirements for such “satellite” centers would bealmost as high as for day care centers serving forty children. Yetto serve forty children in each barangay, about six home-basedcenters would need to be established, or about seventy-five foreach municipality, making the provision of good-quality supportimpossible.
Another dimension to the coverage and equity issue is the distri-bution of day care centers across the country and between munici-palities. Unlike the health system, where the ratio of rural healthmidwives to clients is now better than average in almost all thepoorer provinces, there are far fewer day care centers than averagein several of the poorest regions, especially in Eastern Visayas andparts of Mindanao (Figure 3-1). And, although there are no data on
Figure 3-1. Percentage of Barangays with Day Care Centers,by Region, 1992
Note: CAR, Cordillera Administrative Region; NCR, National Capital Region; ARMM,Autonomous Region of Muslim Mindanao.
Source: HEWSPECS (1994).
70
60
50
40
30
20
10
0
I II III IV V VI VII VIII IX X XI XII CAR NCR ARMM
Region
Percent
G O V E R N M E N T P O L I C I E S A N D P R O G R A M S 99

the distribution of day care centers opened since devolution, it isclear from field visits that there is also great variation within re-gions, with some municipalities having opened only one or twocenters since devolution and others having neared full coverage.What determines the difference appears to be the interest of thelocal mayor and council in this activity rather than how well off themunicipality is. A related policy issue is whether the central gov-ernment should provide financial incentives for lagging regionsand municipalities to develop their day care center networks. Thisissue is returned to in Chapter 5 in the context of discussion of thecosts of improving the quality and expanding the coverage of theday care center program.
The Preschool Education Program
The Department of Education, Culture, and Sports has definedimprovement of preschool education as one of four priority ar-eas for improving the quality of primary education. Preschoolhas assumed particular importance in the Philippines becauseprimary school has not begun until age 7. Concerned about thelack of school readiness of children coming into the system, thedepartment issued a policy document in 1971 encouraging itsschool divisions to establish preschool classes. And in 1989, itissued a departmental order defining the standards for the organi-zation and operation of preschools or kindergarten schools. Thesize of the department’s preschool program is quite small. In 1990–91, it ran 2,888 preschool classes with 165,997 enrollees. Since 1990the department has also been organizing summer preschools, inwhich the transition to formal school is eased by the integrationof ECD activities during the first eight weeks of grade 1. Both pro-grams use teachers and classrooms that are already with thedepartment.
Although there has been no formal evaluation of the depart-ment’s preschool program, a generally expressed concern is thatthe educational approach is too close to formal elementary school-ing, largely because preschool classes are taught by primary schoolteachers steeped in traditional methods. The department has re-cently responded by creating in each region a core of preschooltrainers whose job is to reorient the pedagogical approach. Also, in1993 the department allocated P100 million (about $3.5 million) tobegin a new community-based preschool program for 5- and 6-year-olds. It is not yet clear how this will be designed or how far itwill expand. Given the uncertainties about the most cost-effective
100 I M P R O V I N G E A R L Y C H I L D H O O D D E V E L O P M E N T

design for early education interventions (Chapter 1), experimenta-tion with different approaches by both the Department of SocialWelfare and Development and the Department of Education, Cul-ture, and Sports is desirable. Nevertheless, several considerationsargue against a rapid expansion of the new community-based pre-school program, if, as proposed at the time the study leading tothis book was made, it is to be limited to 5-year-olds.
Most countries have found the developmental needs of 5-year-olds better met by integrating them into preschool programs for 3-to 5-year-olds. It may also not be cost-effective to create a newprogram, which would require new teachers and buildings, for just5-year-olds. And third, the department is about to embark on anextensive program to improve the quality of primary education aswell as to extend it to 6-year-olds. Doing all this will severely limitthe department’s managerial capacity to develop a new programrequiring substantial reorientation from traditional practice. Fi-nally, as noted above, the department’s traditional pedagogical ap-proach affords it no comparative advantage in designing andimplementing the proposed community-based preschool program.Given the high costs of creating a new infrastructure for the 5-year-olds, small-scale experimentation with the proposed community-based approach, together with a careful evaluation of relativecost-effectiveness, would be desirable. At the same time, althoughthe day care center program currently suffers from poor technicalsupport and underfinancing and hence is of low quality, the daycare center program’s integration of 3- to 5-year-olds, its informaleducational approach, and its existing infrastructure all make it asuitable foundation for efforts to improve quality and expand cov-erage to the neediest children.
As the main “market” for preschoolers, the Department of Edu-cation, Culture, and Sports has a strong interest in the success ofECD; indeed, the success of departmental efforts to improve thequality of basic education will be affected by the success of thecountry’s ECD program. The department should therefore have astrong presence in developing policy and in planning for any ex-pansion or quality improvement of the ECD system. The Depart-ment of Education, Culture, and Sports and the Department ofSocial Welfare and Development should jointly address whatstandards should be set and how the curricula should be revised soas to provide a better-planned and smoother transition for childrenfrom informal preschool to formal school. This will require thatECD activities be incorporated into the curriculum to be devel-oped for the 6-year-olds coming into primary school and that basic
G O V E R N M E N T P O L I C I E S A N D P R O G R A M S 101

Filipino and English language instruction be more systematicallyincorporated into learning and play activities at day care centers.The sudden switch out of the vernacular and into these languagesin elementary school is a significant barrier to enjoyment andachievement in school for many poor children. A careful study ofthe psychosocial developmental status of children as they enterschool, as proposed in Chapter 2, would help in reorienting theelementary education system to fit the needs of disadvantagedchildren entering the system.
The Parent Effectiveness Service Program
To improve parenting skills, in 1978 the Department of Social Wel-fare and Development initiated the Parent Effectiveness ServiceProgram. Its main method of operation has been group discussionand instruction. These groups are led by day care workers andsocial welfare officers and consist of parents with preschool chil-dren, some of whom attend the day care center and some of whomdo not. The department has developed twelve-session plans forthis purpose, and the parents are encouraged to identify their ownchild-rearing needs and problems and to plan which topics shouldbe discussed and in what sequence. A 1989 evaluation of the pro-gram concluded that social welfare staff were not adequately pre-pared to teach parents because they had not mastered thenecessary skills themselves. These findings led to a revision of thecurriculum. Also at about this time, to expand the coverage of thisprogram, the department began to train parent volunteers who hadshown interest and leadership qualities to become trainers. Atpresent, coverage remains small, with only about 1,700 social wel-fare staff and 1,800 volunteers trained; the program probably hasnot affected more than 10 percent of the barangays. During 1993 apilot test was carried out using radio to extend coverage. Lessonsfrom the curriculum were aired, parents who were enrolled in theprogram were given assignments to try at home, and follow-uphome visits were arranged by trained staff and volunteers.
To consolidate and review experiences with the program, and asmandated by the Child and Youth Welfare Code, Parent EducationCongresses are conducted annually at barangay, municipal, pro-vincial, and regional levels, with a national-level congress heldevery three years. However, no recent independent evaluation ofthe program is available. Because the education of parents andchildren needs to be integrated, it does not seem appropriate tohave one bureau plan for this program and another bureau plan forthe day care center program, as is done now.
102 I M P R O V I N G E A R L Y C H I L D H O O D D E V E L O P M E N T

Day Care for Working Mothers
The so-called day care center program does not actually addressthe day care needs of working mothers because its hours of opera-tion are very limited. Nor, of course, does it attempt to address theneeds of parents with children under four. But, as noted in Chapter2, large and increasing numbers of mothers work outside thehome, often where it is difficult or undesirable to bring the child tothe workplace. The demand for services that combine the custodialcare of children with appropriate education and stimulation istherefore rising. Two ways to provide daylong care, includingearly education, are factory-based and home-based day care.
Recently, there has been a modest breakthrough in the provisionof day care services by factories for their female employees. Pio-neer corporations have included the Philippines Association ofFlour Millers, which has set up eight day care centers; GelmartInc., where day care for an 8,000-strong female work force wasprovided at the initiative of the employees’ union; and Rubber-world and North Atlantic Garments, where day care was recentlyincluded for the first time in a collective bargaining agreement.These efforts have been supported by the Department of SocialWelfare and Development and NGOs such as Arugaan, Save theChildren (U.S.A.), and Parents’ Alternatives. The spread of factory-based day care has been inhibited by economic recession and bythe lack of effective support systems for factory-based initiativesonce the decision to establish day care centers has been made. Aquestion for the Department of Social Welfare and Development, towhich the answer is unclear, is whether its staff should be in-creased to help meet these needs or whether they can adequatelybe met by the NGO community.
Most poor women do not work in factories and cannot affordinstitutionalized day care. The preferred form of day care for mostfamilies in the Philippines is therefore likely to be home-basedcare, along the lines suggested above for satellite day care centers.Experience from other countries indicates that the private sectorcan provide such care on a commercial basis (Chapter 1). As withfactory-based care, the issue is whether social welfare workersshould be involved in training and supporting home-based daycare. The evidence in the Philippines is that commercial, home-based care systems for poor women are not emerging as the resultof market forces and that poorer women with several preschoolersare more likely to work outside the home, often leaving their chil-dren with inadequate care arrangements (Chapter 2). There seemsto be a case on equity grounds, therefore, for local government
G O V E R N M E N T P O L I C I E S A N D P R O G R A M S 103

field staff to encourage and support the development of at leastone home-based day care center for each barangay, with participa-tion limited to members of the group of poor clients who are pri-orities for inclusion in the day care center program. Once thisdemonstration center is seen to be operating viably, market forcesshould lead to the establishment of others.
Conclusions
As with the psychosocial developmental status of preschoolers(Chapter 2), there has been almost no evaluation of the operationaleffectiveness of early education programs. It is now not possible toassess the impact of these programs. This situation needs to beremedied as a priority.
There should be a clear delineation of responsibility betweengovernment agencies for the implementation and support of earlyeducation programs. It is recommended that the day care centerprogram of the Department of Social Welfare and Development bestrengthened as the national public sector early education pro-gram, given its existing infrastructure covering more than a thirdof the country and the fact that it is de facto operating as a pre-school rather than a day care program.
Despite the absence of a good impact evaluation, it is clear thatthe quality of the day care center program is very low. Most localgovernments are preoccupied with expanding the numbers of cen-ters rather than seeing that they work well. Given the costs alreadysunk by the government in this program, which is mandated bylaw, additional investment to improve quality will have high re-turns. The reorientation required is significant, including improv-ing the curriculum, reducing the number of children in a session,increasing the number and effectiveness of supervisors, improvingthe performance of day care workers through better training andsupervision, increasing the allowance of day care workers to pro-vide an incentive for performance, and agreeing on a level of in-puts for day care centers that is the minimum required foracceptable quality. Introducing such changes will require that anassistance program for local governments be developed in whichlocal governments undertake to improve quality in return for apackage of technical, financial, and training assistance from theDepartment of Social Welfare and Development.
Although improving quality should be the first priority, earlyeducation services also need to be expanded in lagging regions andmunicipalities. Once the already existing day care centers are oper-ating at an acceptable level of quality, consideration should be
104 I M P R O V I N G E A R L Y C H I L D H O O D D E V E L O P M E N T

given to developing “satellite” home-based centers, which couldboth provide early education services for the 4- to 6-year-old chil-dren of very poor families living far from the barangay center andprovide day care facilities for the 2- to 6-year-old children of poor,working mothers.
G O V E R N M E N T P O L I C I E S A N D P R O G R A M S 105

4. Creating an Integrated,National Early Childhood
Development Program
The two previous chapters looked at problems and programs inhealth, nutrition, and psychosocial development separately becauseso far in the Philippines this is how these problems have mostly beenseen and how the intervention programs have mostly been managed.This chapter sets out a vision of how an integrated national earlychildhood development program in the Philippines might look. It at-tempts to incorporate the “best practice” approaches to ECD summa-rized in Chapter 1 and at the same time to build on what alreadyexists in the field rather than start from scratch with new servicedelivery systems that would be unaffordable and unacceptable.As is the nature of a sector review, the vision presented is broadand would need to be modified and fleshed out to turn it from ageneral proposal into a specific investment plan.
The first section of this chapter presents one vision of an ECDprogram model at the local level, looking at the core package ofservices that needs to be delivered, at the service delivery person-nel required, at job content, at methods for targeting services onpriority clients, at the needs for strengthening technical supportand supervision, and at the desirability of experimentation withdifferent approaches to delivering services, especially in early edu-cation. The second section looks at how communities and NGOsmight participate in program planning and implementation. Thethird section looks at how the ECD program might be managed andsupported by local governments and how the central and localgovernments might interact in this process. The final section looksat the central government’s broader role in providing policy guid-ance and technical support for the national ECD program.
The management processes proposed at the community and lo-cal government level are similar to those recommended under theIntegrated Approach to Local Development Management (IALDM),
106

which is being advocated as a planning and management mecha-nism for achieving the overall goals of the Philippine plan of actionfor children. This approach is summarized in Section J of the sup-plement volume. Rather than repeat the IALDM strategies here, thischapter attempts to complement and build on them. In particular,it considers the additional staff that would be needed to carry outECD programs at the local level, recommends specific roles andorganizational arrangements for NGO involvement, and proposes acontractual framework for joint ECD program planning and financ-ing by central and local governments.
An ECD Program Model
As noted in Chapter 1, ECD services in health, nutrition, and earlyeducation need to vary at different ages to meet the changingneeds of the child. Table 4-1 shows a set of core ECD services thatcorrespond to the major child development problems and needsdefined in Chapters 1 and 2. Table 4-1 also illustrates the changingnature of the package at different ages. The core package of serv-ices is the same as that proposed under the Philippine plan ofaction for children for meeting the minimum basic needs of chil-dren in health, nutrition, and early education.
Although inputs in health, nutrition, and psychosocial devel-opment are all important throughout the preschooler’s develop-ment, the balance between these inputs, and the workload theyimply, changes significantly at about the age of 3. During preg-nancy and the first three years of life, intensive health and nutri-tion inputs are needed because during this period the child is mostat risk of death or permanent developmental disadvantage from illhealth and malnutrition. After age 3, although health and nutritionrisks diminish, the workload implications of the psychosocial de-velopmental inputs change significantly. Before age 3, the child’sdevelopment involves mainly his or her interaction with parentsand siblings; after age 3, interaction with groups of other childrenbecomes important for the development of sharing and socializa-tion, and at this age organized early education activities becomeimportant.
Service Providers and Their Jobs
One way to respond to the different input and workload require-ments at different ages would be to split the primary responsibilityfor ECD services at the barangay level between two main workers,
C R E A T I N G A N I N T E G R A T E D , N A T I O N A L E C D P R O G R A M 107

Table 4-1, landscape
108 I M P R O V I N G E A R L Y C H I L D H O O D D E V E L O P M E N T

one for the pregnant and lactating women and children under age4 (0 to 36 months old) and one for children ages 4 to 5 (37 monthsto 60 months old). The primary responsibility for the older agegroup would be that of the day care worker, who would havespecial expertise in organized early education. The primary re-sponsibility for the younger age group would be that of the newpart-time, paid worker proposed in Chapter 3, who would havespecial expertise in nutrition. Henceforth, we will refer to this newworker as the child development worker.
A two-worker model is proposed because of the workload, deter-mined by the number of clients in a barangay and the time itwould take to deliver services. In a typical barangay of about 1,500people, the number of children receiving special attention at anyone time would be in the range of thirty to fifty for each worker,estimated as follows. For the child development worker, therewould be about forty-five pregnant and lactating women at anyone time, of whom ten to fifteen might be identified as being atparticular nutritional risk by arm banding (measuring the circum-ference of the upper arm), which is a good indicator of nutritionalstatus. The population of children 6 months to 24 months oldwould be about sixty-five, of whom up to twenty at a time mightbe in the supplementation program. For the day care worker, fortychildren, including the children of the poorest, would be served bythe day care center, and a further seven might be served by ahome-based center.
The time it would take for the proposed child developmentworker to provide various services is estimated in Chapter 3. High-quality growth promotion services, including growth monitoring,counseling, and supplementary feeding for the above numbers ofchildren, would probably require four to six hours of work a day,six days a week. Counseling for health and psychosocial develop-ment could be integrated into this work and would not thereforerequire significant additional time. But to this must be added timefor coordinating with the field staff of other programs to ensurethat integrated interventions (in terms of short-term food subsidyand longer-term livelihood programs) reach food-insecure families.As argued in Chapter 3, it is unlikely that the quality of service,input of time, and accountability required can be expected of vol-unteers, and for this reason the paid, part-time (six hours a day)position of child development worker is recommended.
To ensure that services are integrated, the job content of the childdevelopment worker and of the day care worker should be de-signed so that each can provide the full range of core health, nutri-tion, and psychosocial development services appropriate for her
C R E A T I N G A N I N T E G R A T E D , N A T I O N A L E C D P R O G R A M 109

age group. Thus, the child development worker would spend mostof her time on interventions related to health and nutrition, be-cause these are the priorities for pregnant and lactating womenand younger children. But she would also instruct adult familymembers in how to foster the psychosocial development of chil-dren. Dedicating a worker for the 0- to 3-year-olds should enablemore emphasis to be given to the psychosocial development ofchildren this age; this age group has gotten insufficient attentionfrom day care workers, who are preoccupied with running pre-school activities for older children. The day care worker wouldspend most of her time on organized early educational activitiesfor groups of children, because this is the primary need of the 4-and 5 year-olds. But the day care worker would also be responsiblefor responding to the health and nutritional needs of the 4- and5-year-olds, for example, by providing micronutrient supplementsand related nutrition education to parents.
Much more work needs to be done to determine how responsi-bilities for services and educational tasks should be divided amongchild development workers, day care workers, and other existingfieldworkers. In outline, the rural health midwife would likely re-tain responsibility for immunization and for those aspects of pre-natal care demanding her higher-level skills. Child developmentworkers and day care workers would likely take the main role inproviding other services and interpersonal information, education,and communication (IEC). A key area requiring detailed planning isdetermining which activities barangay health workers and barangaynutrition scholars would assist with and when and how they wouldwork with the child development workers and day care workers.
Targeting Services
Proposals for targeting child development services on those mostat risk were outlined in Chapters 2 and 3. There it was suggestedthat a survey be used to identify families with pregnant and lactat-ing women or preschool children and to determine which house-holds were particularly disadvantaged. The latter would bedetermined by an asset measure of poverty and by assessing thenutritional status of pregnant women through arm banding and ofchildren 0 to 6 years old through weighing. This survey would berepeated quarterly and carried out jointly with the community bythe child development worker and day care worker. Newly preg-nant and lactating women and children 0 to 3 years old would thenbe assigned to the care of the child development worker, whowould enter all the children into the monthly growth-monitoring
110 I M P R O V I N G E A R L Y C H I L D H O O D D E V E L O P M E N T

program, enter qualifying women and children into the feedingprogram, and enter qualifying families into the nutrition safety netprogram. Children 4 and 5 years old would be assigned to the careof the day care worker, who would enter qualifying children intothe day care center program or the nutrition safety net program, orboth.
In addition to the quarterly process for defining priority pro-gram clients, it is suggested that a special effort might be made toensure the convergence of services on the worst-off. This could bedone by instituting a “most at risk” list, also updated quarterly, forthe five or ten most disadvantaged children in each barangay. Theworkers carrying out the quarterly survey could jointly draw upthis list every month and then meet with their supervisors tojointly propose a combination of interventions, tailored to eachfamily’s circumstances. Rural health midwives and social welfareofficers would then work with the municipal authorities to ensurethat the necessary government support services were made avail-able to the families of these children.
From the point of view of gaining community support for theECD program, the targeting philosophy most likely to work is onethat includes the most disadvantaged but does not exclude all bet-ter-off children. Gaining community support is not an issue withthe health program because immunization and other activitiesbenefit everyone. The nutrition program is also likely to havewidespread benefits, and therefore widespread support, becausemicronutrient supplementation is required by almost all childrenand because interventions to counteract protein-energy malnutri-tion (PEM) also will not be confined to the poorest families. AsChapter 2 noted, PEM is not limited to food-insecure householdsbut also affects improperly weaned children from better-off house-holds. In the case of the preschool program, the price of commu-nity support for the program is likely to be the inclusion of somechildren of the better-off, provided this does not lead to the exclu-sion of disadvantaged children.
Technical Support and Supervision
As discussed in Chapter 3, infrequent supervision and on-the-jobtraining are believed to be important causes of the low quality ofthe day care center program. This is related to the fact that thecurrent ratio of supervisors and trainers to barangay-level workersis much less satisfactory in the day care center program than inhealth and nutrition programs. When the Barangay Day Care Cen-ter Law has been fully implemented and there is a day care center
C R E A T I N G A N I N T E G R A T E D , N A T I O N A L E C D P R O G R A M 111

in each barangay, there will be twenty to twenty-five day careworkers in a typical municipality. But at present staffing levelsonly one social welfare officer will be available to support them,and she must divide her time between the day care center programand a number of other social welfare activities. This level of staff-ing contrasts sharply with the situation in health, where there isone rural health midwife for every four or five barangays. Experi-ence from other countries in a variety of outreach programs inhealth, nutrition, and agricultural extension suggests that it is diffi-cult to achieve good-quality support when the ratio of supervisorsto workers is much worse than one to ten. Creating a new munici-pal-level post for the training and supervision of day care workersis therefore essential. Henceforth, we will refer to workers in thispost as early education trainers.
The devolution of program management responsibility to localgovernments offers an important opportunity to facilitate inte-grated supervision and technical support to the frontline workers.Where previously rural health midwives and social welfare officersreported up the hierarchy of their respective departments to Ma-nila, now both health and social welfare staff report to the munici-pal mayor. New training and supervision arrangements will needto be designed to exploit fully the new opportunities for coopera-tion between social sector field staff.
Field supervision needs to be reoriented so that its primaryfunction is on-the-job training and support rather than inspec-tion. Child development workers and day care workers needingsupport would be expected to call as needed on the rural healthmidwife, the social welfare officer, or the early education trainer.For example, where the child development worker thought that achild’s persistent malnutrition was disease-related, she wouldturn to the rural health midwife. Where she thought that it wasfood security-related, she would turn to the social welfare officerto explore the possibility of livelihood creation opportunities orsocial safety net support. Or, as another example, where the childdevelopment worker needed help with educating parents on thepsychosocial developmental needs of a 2-year-old, she would turnto the early education trainer. The potential should be explored forredesigning supervision routines so that on at least some occasionssocial welfare officers or early education trainers and rural healthmidwives make joint supervision and training visits to the baran-gays so as to provide integrated support to the child developmentworkers and day care workers. Both child development workers atthe barangay level, together with the social welfare officer/earlyeducation trainer and the rural health midwife, should meet fort-
112 I M P R O V I N G E A R L Y C H I L D H O O D D E V E L O P M E N T

nightly or monthly to make an integrated assessment of child de-velopment problems and progress and to agree on a joint agendafor action.
On-the-job training and support for peripheral workers throughsupervisory visits also need to be complemented by more formalin-service training. This would best be carried out by an integratedtraining team consisting of the public health nurse, the nutritionist,the rural health midwives, and the early education trainer, whotogether have the full range of child development skills. Trainingcurricula should be redesigned in two parts. A common core cur-riculum covering essential skills in all three subsectors might betaught to the two workers together so as to encourage a consistent,technical, team approach to child development in the barangay.Then each worker would receive more specialized training appro-priate for her area of emphasis—the child development worker infood supplementation, for example, and the day care worker inpreschool education. The use of training teams should be repli-cated at the regional level, with appropriate staff from the Depart-ment of Health and the Department of Social Welfare andDevelopment nominated to work together in evaluating the resultsof training in the field, in developing revised training curricula,and in jointly training municipal-level staff as trainers. Consider-able further work is needed to develop proposals for an integratedECD training strategy. As this strategy is developed, it would beimportant to plan for it to mesh with Department of Interior andLocal Government’s broader training strategy for strengthening lo-cal government: the Integrated Capability Building Program,which is being implemented through the Institute for Local Gov-ernment Administration.
Experimentation and Evaluation
The service delivery and support structure proposed above is onevision of how integrated ECD services might be organized at thefield level. But it is important to experiment with different ap-proaches to delivering services, especially in environments whererisks to children are high—in urban slum areas and among indige-nous peoples, for example. It is especially important to experimentwith different approaches to the delivery, training, and supervisionof early education, given that less is known about the relative cost-effectiveness of different approaches in this area than in health andnutrition. To judge which approaches are best requires careful lon-gitudinal evaluations, and this in turn requires strengthening thenational capacity to design and manage research and evaluation
C R E A T I N G A N I N T E G R A T E D , N A T I O N A L E C D P R O G R A M 113

related to early education in particular but also to ECD as a whole.This institutional strengthening need is discussed further below.
Community and NGO Participation
Official commitment to community and NGO participation in devel-opment programs in the Philippines is extremely strong. TheRamos government was elected on a platform of social justice andcommunity empowerment, and community empowerment is a cen-tral theme of the medium-term development plan. This plan andthe constitution of the Philippines both recognize NGOs as partnersof the government in the development process. Despite this strongcommitment, there is often confusion when community and NGOparticipation is discussed, because these terms can be used in dif-ferent ways. This section therefore first discusses terminology. Itthen reviews ways in which communities and NGOs are participat-ing in ECD and suggests how their current roles might develop tomake services respond better to clients’ needs and to give clientsmore control over services.
How “Community,” “NGO,” and “Participation” Are Defined
In the Philippines, “community” is most often used in a geographicand administrative sense. Thus, when government officials talk of“the local community,” what is generally meant is the geographiccommunity living in the local barangay, and when they talk of“community leaders,” what is meant is the barangay council. Inthis sense, the Philippines has a strong and universal set of com-munity institutions, in which the barangay council contains repre-sentatives of different parts of the village and in which differentbarangays are in turn represented on the municipal council. Devo-lution has given local councils much more importance because notonly municipalities but also barangays have a percentage of reve-nues allocated to them to spend at their discretion. Communityleaders must look both upward and downward: on the one hand,their job is to represent the local community to government at somehigher level; on the other hand, and increasingly since devolution,community leaders also are the government in the local area.
In addition to the more than 40,000 barangays and 1,500 munici-palities, which are the local communities in the geographic andofficial sense of the word, there are many more “communities ofinterest,” both within official communities and cutting acrossthem. For example, within barangays are occupational communi-ties, such as fishing and farming families, and income groups, such
114 I M P R O V I N G E A R L Y C H I L D H O O D D E V E L O P M E N T

as landlords and landless laborers, who may feel a stronger senseof community with their peers than with the barangay as a whole.Other communities, such as indigenous communities, may be scat-tered across several municipalities and interspersed among nonin-digenous families but nevertheless feel a strong sense ofcommunity. These community groups vary greatly in the degree towhich they act as or are represented as community interest groups.For example, indigenous communities may have little or no effec-tive voice in local affairs. And local elites tend to dominate baran-gay and municipal councils; the degree to which they effectivelyrepresent poorer income and occupational interest groups varieswidely.
Many community interest groups have formalized themselves as“People’s Organizations,” officially defined as “bona fide associa-tions of citizens with demonstrated capacity to promote the publicinterest and with identifiable leadership, membership, and struc-ture.” People’s Organizations are often registered as NGOs, but theyare a distinguishable type of NGO in that they are primarily en-gaged in representing and helping themselves, whereas most NGOsare set up to help others.
NGOs are defined by the National Economic and DevelopmentAuthority (NEDA) as “private, nonprofit, voluntary organizationscommitted to the task of socioeconomic development and estab-lished primarily for service.” The official definition includes sev-eral types of NGOs, such as primary NGOs, which directly provideservices; “intermediary” NGOs, which provide financing, training,or technical assistance for other NGOs; advocacy NGOs; and NGOnetworks, which link NGOs for information exchange or for any ofthe previous purposes. Here, the definition will also include thefor-profit private sector, in the broadest interpretation of the term.
There are many types and degrees of participation, with quitedifferent implications for community empowerment. At the weak-est end of the spectrum is consultation with clients, either aboutprogram design during the planning stage or program effective-ness during implementation. Financial participation—contributingin cash or kind to a program—is also a weak form of participation,unless it is coupled with increased control over the program inreturn for contributions. A community role in monitoring programperformance is a stronger form of participation, because it impliessome say in management. Full community empowerment comesonly when communities take over and run an organization or pro-gram, as with some agricultural cooperatives, for example. NGOsmay also participate in development programs in all these differentways. In addition, because of their expertise, NGOs may be organizers
C R E A T I N G A N I N T E G R A T E D , N A T I O N A L E C D P R O G R A M 115

and mobilizers of communities themselves. And they may be train-ers, advisors, and consultants to either people’s or governmentalorganizations.
Forms of Participation
CONSULTATION AND INFORMATION GATHERING. Processes for con-sultation with communities are built into the formal system of localgovernment, from the barangay assemblies at the lowest level tothe local health and education boards, which are each mandated tohave at least one NGO member, up to the Regional DevelopmentCouncils, a quarter of whose members must be drawn from NGOsand People’s Organizations. But these processes are not focusedexplicitly on ECD concerns, nor are they necessarily the best chan-nels for consulting the community groups most in need of ECDprograms: the processes are formal, the most disadvantaged maynot have equal access to them, and local officials may not have thetechnical skills to elicit the information required. Therefore, just asthe central government should set up a systematic process of con-sultation to find out local governments’ priorities and preferences,so should the central and local governments jointly set up a similarprocess with People’s Organizations, NGOs, and communities.
The initial consultations should focus on the level of demandthat clients are likely to have for the proposed interventions andthe kind of detailed program design that is likely to be most ac-ceptable. As an example of the first, the rapid expansion of the daycare center program by local governments indicates strong localdemand, but carefully structured consultation could help to deter-mine whether this demand is being expressed by the most disad-vantaged, as well as by better-off groups already more convincedof the value of early education. As an example of the second, con-sultation would help determine the types of supplementary foodsthat are most locally acceptable, the times of day that are conven-ient for mothers and children to come for supplementation, andhow supplementary feeding can be designed so that it is leastlikely to substitute for meals children are already getting.
Other important, and more general, questions for explorationwith both clients and service providers include the following. Whoare the main caregivers for preschoolers and how much time isavailable for child care? What are the main behavioral practiceswith regard to child health, nutrition, and early education? Whatare people’s perceptions of the main child development problemsaffecting their family and barangay? Whom do they see as the peo-ple worst affected? What child development services are they
116 I M P R O V I N G E A R L Y C H I L D H O O D D E V E L O P M E N T

aware of in their area? Do they have access to them? How do theyrate their performance? What kinds of services do they wish tohave? Do they pay for any services, and if so, how much? Wouldthey pay for other interventions, and if so, how much? Do peoplehave a voice in what is now going on in ECD? How could theirinvolvement be increased?
Because of the depth of information required, these consultationswould need to be carried out through small-sample focus groupsand structured interviewing rather than through large-scale ques-tionnaire surveys. Such consultations might best be contracted toNGOs that have the confidence of communities, the necessary ECDand social research skills, and the independence from government.In addition to carrying out such consultations in “typical” baran-gays, special care would be needed to stratify the sample so that itincluded a disproportionate number of communities and familiesof the types identified in Chapter 2 as being most at risk.
Very little qualitative information of the above kind is currentlyavailable. The results of such consultations are essential for devel-oping a “menu” of program options responding to local demandand appropriate for different circumstances. Such consultationsshould be repeated regularly once a program has begun so thatmidcourse corrections can be made on the basis of clients’ feedback;the service statistics produced by program monitoring systems can-not capture the qualitative dimensions of clients’ perceptions.
PERFORMANCE REVIEW BY CLIENTS. Performance monitoring in theECD program has mostly been designed to keep administrators upthe line informed, in keeping with the program’s historically cen-tralized, top-down structure. Redesigning the monitoring systemso that its primary function is to let local people know how wellthe program is serving them has great, unexploited potential forcommunity empowerment. Publicly posting a few well-chosen per-formance indicators at the day care center could stimulate clients’and village leaders’ interest and motivate workers. Useful modelsof community information systems already exist. Examples in thePhilippines include the ones developed by the Area-Based ChildSurvival and Development Program and the Integrated Approachto Local Development Management Program (see, respectively,Sections I and J of the supplement volume). And India has longdisplayed growth-monitoring information to encourage commu-nity participation and motivate workers. It would be useful to syn-thesize from these and other experiences in communityinformation systems a “best practice” approach to reflecting per-formance in health, in nutrition, and in early education.
C R E A T I N G A N I N T E G R A T E D , N A T I O N A L E C D P R O G R A M 117

It is suggested that the public posting of performance informa-tion be coupled with a redefinition of the function of parents’ com-mittees (now often dormant) to become parents’ monitoringcommittees. Currently, these committees meet when called by aday care worker, mainly to extract financial contributions fromparents or to provide information and education. It is proposedthat the system be reversed: that the parents’ committee call theworkers to meetings led by parents to review problems and prog-ress with the program. Such a reversal would be an important steptoward the eventual goal of community management.
Communities would be empowered and program performanceimproved if a “verbal autopsy” were done whenever a young childdied in the community. In verbal autopsies, community repre-sentatives, local service providers, and senior supervisors meet toestablish not only the immediate cause of death but also why theprogram failed to prevent or treat the problem and how a similaroutcome can be avoided in the future. Even though focused onchild survival rather than development, verbal autopsies couldnevertheless powerfully improve communities’ understanding andcontrol of the child development program and make workers moreaccountable to clients.
PLANNING AND MANAGING INTERVENTIONS. Although, as a com-munity empowerment goal, the child development program shouldroutinely consult with clients and involve them in program review,true community management is a more distant goal. Furthermore, itis probably attainable in the near future only for communities thathave the support and guidance of an experienced NGO.
A good model for fostering community management with theassistance of an experienced NGO is provided by the Department ofHealth’s Community Health Partnership Program. This programbegan in 1990 and is now expanding to forty-eight provinces, aftergood experience in an initial sixteen. Under the program, localNGOs are invited to form partnerships with local governments andPeople’s Organizations to jointly plan and carry out small-scalepublic health projects. The Department of Health provides plan-ning grants for partnership formation and planning workshops;project grants for implementing the plans; and institutional devel-opment grants for improving the capacity of a limited number ofNGOs in community mobilization and health development.The funds are managed by one of the NGOs as trustee for the part-nership. The program has successfully involved communities indefining their own priorities and building their planning and man-agement experience.
118 I M P R O V I N G E A R L Y C H I L D H O O D D E V E L O P M E N T

Where appropriate NGOs exist, it is recommended that this ap-proach be broadened to become the main local mechanism forplanning and managing child development, with three mainchanges of emphasis, as follows. First, the program content eligiblefor financing should be broadened beyond health to include nutri-tion and early education. Second, the initial focus of the partnershipshould become the development of an integrated ECD implementa-tion plan that would be negotiated with and partly financed by thecentral government. The concept of these jointly financed imple-mentation plans for ECD is further developed below in the discus-sion on program management under devolution. Third, in manyareas there would be a need to strengthen the municipal govern-ments’ role in the partnerships, which in many cases have beendominated by the NGOs or the provincial governments, or both.
A very large number of nonprofit NGOs are involved in directservice provision. But none of the three main sources of informa-tion currently have a good estimate of the numbers involved inECD. NEDA’s NGO directory lists 1,492 NGOs, of which 124 provideservices for children. Of these, only thirty-two specify preschoolchildren as their targets. But many NGOs will not have re-sponded to the NEDA survey, and many of the 1,492 listed areinvolved in multisectoral activities that include ECD, even if thisis not specified as the organization’s main focus in the directory.NGO records are also kept by the line agencies, although theseare limited to the NGOs they have accredited: in 1991, the Depart-ment of Social Welfare and Development had accredited onlyeighty child-caring institutions, and the Department of Health’sNGO directory listed only thirty-six NGOs active in health care forthe 0–6 age group. The third potential source of information, themain NGO network—the Caucus of Development NGO Networks(CODE-NGO)—keeps no figures on numbers involved in ECD, butthe fact that CODE-NGO is itself a coalition of ten NGO networks,one of which is itself a coordinating body for thirty-two sectoraland regional networks, gives some idea of the extent of the NGOmovement in the Philippines.
Although the number of NGOs has mushroomed since theAquino government opened the door to partnership, most of theNGOs involved in ECD are very small, have limited coverage insome of the geographic areas of greatest need, and range widely inthe quality of their work, many being more experienced at commu-nity mobilization than the technical aspects of ECD. Although theNGO movement clearly has a very significant contribution to makein child development, it is also clear that it is not poised to fill thelarge gaps in the quality and coverage of services. Therefore, in
C R E A T I N G A N I N T E G R A T E D , N A T I O N A L E C D P R O G R A M 119

addition to developing a financing window for NGO involvement inECD along the lines of the Community Partnerships discussedabove, there should be an aggressive program to develop NGOs’capacities in geographic areas where NGOs are currently inactive oractive on a small scale and where they have a particular compara-tive advantage. Most obviously, this program would be in areaswhere there are indigenous communities, where the program canespecially benefit from NGOs’ skills in listening; information, edu-cation, and communication; and community mobilization.
Hard information about the for-profit sector in ECD is in evenshorter supply than for nonprofit NGOs. Given the public’s unwill-ingness and inability to pay for preventive health care and nutri-tion interventions (see Chapter 5), the commercial sector is mostactive in preschool education. In 1991 the Department of Educa-tion, Culture, and Sports had accredited 1,313 private preschools,and it is believed that there are several times that number of small,nonaccredited preschools and day care centers. The presumption isthat most of these schools are in urban areas and cater to the better-off, but a survey is urgently needed to get a better idea of theschools’ numbers, regional distribution, fees, clientele in terms ofincome, and quality. Only then will it be possible to meaningfullyreview government policy toward the for-profit sector.
The government is adopting a somewhat passive stance in rela-tion to the private sector; its main involvement is accreditation. Amore proactive policy toward the private sector would be desir-able, beginning with experiments to improve the quality of privatesector services by providing technical assistance and training and,more radically, by franchising preschools on a contract basis. How-ever, given that such activities would increase rather than reducethe managerial burden on already stretched government staff,these possible interventions would need to be carefully evaluatedfor cost-effectiveness, including their hidden costs to government,before being undertaken on a large scale.
PROVIDING SUPPORT SERVICES. The small size of nearly all childdevelopment NGOs in the Philippines means that even the best willhave relatively little impact as direct service providers. The mostcost-effective way for the highest quality NGOs to use their scarceskills may therefore be to leverage them by helping them helpother institutions expand and improve the quality of their ownservices. The government is already drawing on the skills of someNGOs in this way. For example, the Nutrition Center of the Philip-pines has carried out a wide range of research and experimentation
120 I M P R O V I N G E A R L Y C H I L D H O O D D E V E L O P M E N T

in nutrition, and this has been drawn on by the government. HelenKeller International has assisted the Department of Health and theNational Nutrition Council with designing and implementing themicronutrient program. The Community of Learners Foundation ishelping the Department of Social Welfare and Development withcurriculum development. And Save the Children (U.S.A.) is work-ing with the Department of Social Welfare and Development andlocal governments to develop a resource center for child develop-ment training in the Visayas.
Ways in which NGO skills could be leveraged through contractswith the government might include:
• Providing technical expertise for implementing the pro-posed systematic consultations with local governments andcommunities
• Developing curricula for the proposed integrated ECD trainingfor day care workers, child development workers, and theirsupervisors/trainers
• Training trainers, working with the regional offices of the De-partment of Health and the Department of Social Welfare andDevelopment
• Experimenting with new approaches to service delivery andhelping to evaluate experiments carried out by others
• Helping to develop the institutional capacity of other NGOsoperating in underserved, especially disadvantaged areas
• Carrying out policy analysis and evaluation of program activitieson contract to the central support institutions (see further below).
Program Management under Devolution
When the Department of Health and the Department of Social Wel-fare and Development were devolved, beginning in 1991, the con-sequences for both departments were profound. The Departmentof Health lost about 40 percent of its budget and more than 45,000staff members, and the Department of Social Welfare and Develop-ment more than half its budget and more than 22,000 social welfareofficers and day care workers. The changes were also profound forlocal governments faced with new responsibilities for programmanagement and with considerable freedom of choice in how tospend the revenues newly allotted to them. This section reviewsthe changes for both levels of government and suggests directionsin which the management of the child development program mightevolve in response.
C R E A T I N G A N I N T E G R A T E D , N A T I O N A L E C D P R O G R A M 121

The Local Government Scene
The devolution process was initiated during the last year of theAquino government but was mainly implemented during 1992 and1993, in the first years of the Ramos government. Budgets and staffwere devolved rapidly during this period, the last central staff be-ing absorbed by local governments in 1993. The speed of the exer-cise meant that there was little time to train local governmentmanagers for their new responsibilities. Nor did mayors have aclear picture in advance of what funds they would receive andwhen. By mid-1994, the dust was only just beginning to settle.Fairly good information was available about which local govern-ments had benefited and which had lost financially from the devo-lution, but it was far from clear how the priorities of localgovernments would evolve over the medium term.
Initial reports from many local governments suggested that therevenue allocations they had received from the center were inade-quate to maintain services at predevolution levels. But this percep-tion was belied by a study of devolution in the health sector(World Bank 1994b), which showed that after devolution morethan 90 percent of municipalities were in fact as well off as before,if not better off. Nevertheless, the shortage of funds for the socialsectors experienced by many local governments was real, a prod-uct of the uncoordinated way in which devolution took place.Many local governments received their revenue allocations beforelearning the details of the social sector staff and activities theywould be responsible for absorbing and allocated funds for newinfrastructure projects that they later realized were needed to fi-nance existing programs. Tied into infrastructure contracts andobliged to pay the salaries of the staff they had inherited from thenational government, many local governments cut back the non-salary recurrent budget for social programs, sometimes the onlyfunds they had the discretion to cut.
The vast majority of local governments benefited rather than lostfrom devolution, and the World Bank study (World Bank 1994b)noted that the cities benefited far more than the municipalities.Furthermore, the cities, rather than the poorer rural and urban mu-nicipalities, had the better tax base for augmenting devolved reve-nues with additional resources of their own. Given that the citieswere in many cases already better off than the rural areas, devo-lution may have worsened rather than improved preexistinginequities in the distribution of resources. So although the localgovernments took on full responsibility for program management,the vast majority of them did not have the financial wherewithal to
122 I M P R O V I N G E A R L Y C H I L D H O O D D E V E L O P M E N T
remedy the deficiencies they inherited in the coverage and qualityof social sector services (Chapter 2). In short, outside the cities,local governments that were disadvantaged before devolution re-main disadvantaged, and wherever there was a case for centralgovernment support before devolution, this case remains valid af-ter devolution. The financial role of the central government in thepostdevolution environment is explored further in Chapter 5.
The study on the devolution of the health sector (World Bank1994b) looked only at the revenue and expenditure balance at thetime of devolution. There is very little evidence of how local gov-ernments have managed the social sectors since then; remedyingthe shortage of information in this area is a high priority. Fromanecdotal information and field visits, the picture appears to beextremely varied. Depending on the priorities of the local mayorand council, some local governments appear to have done more inthe social sectors, for example, by rapidly expanding the day carecenter program. Others have given the social sectors low priority,preferring to spend discretionary funds on roads and other physi-cal infrastructure projects.
Within the social sectors, certain patterns seem to be emerging.In social welfare, as noted in Chapter 3, local governments havegiven higher priority to establishing new day care centers than toimproving the quality of existing ones. And in health, also as notedin Chapter 3, cutbacks in travel allowances and reluctance to sendstaff for training courses are beginning to reduce the quantity andquality of field supervision and training, and shortages of mate-rials are an increasing cause for concern. The danger is that localgovernments will respond to public demand for preschool facilitiesand curative health care, especially in urban areas, at the expenseof educational quality and preventive health care, particularly inremoter areas. But too little time has elapsed since devolution, andtoo little information has been collected, for firm judgments abouttrends to be made.
The Institutional Role of the Central Government
The Department of Health and the Department of Social Welfareand Development have been gradually adapting to a new role.They no longer manage the programs they formerly ran but never-theless are expected by the Philippine legislature and the public toset policy and see that national objectives are met. Rather thanmanaging the programs directly, both departments are now learn-ing how to influence the way local governments manage the pro-grams. Using a combination of the three levers now available to
C R E A T I N G A N I N T E G R A T E D , N A T I O N A L E C D P R O G R A M 123

them, the departments provide training and technical assistance,market priority programs, and use incremental financing from thecenter to supplement and influence local government spending.These roles are discussed in turn below.
TRAINING AND TECHNICAL ASSISTANCE. Of the three roles, the pro-vision of training and technical assistance was the most familiar tothe departments because it was already a function of their regionaloffices. The main challenge of the Department of Health’s regionaloffices, which were already strong in most parts of the country, isto complement its existing capacity in technical training with anew capacity for training local governments in health service man-agement. Both the Department of Health and the local govern-ments are making a substantial investment in developing thiscapacity under the institutional development component of the De-partment of Health’s Women’s Health and Safe Motherhood Pro-gram. The Department of Social Welfare and Development,however, which was less than a seventh of the Department ofHealth’s size before devolution, will need not just to strengthen butto create a new training support capacity if it is to be able to servethe needs of the fast-growing day care center program.
For both departments, the regional training centers, even whenreoriented and expanded, will be too few and far removed to pro-vide for the training needs of more than 1,500 municipalities—anaverage of one hundred for each region. It will therefore also beimportant for the regional offices to work with the provincial gov-ernors in their areas to develop training support at the provinciallevel. Given that provincial budgets are limited and that the gover-nors’ first priority may be the support of programs for which theprovinces are directly responsible (such as the hospital network),central financing to develop the capacity to train at the provinciallevel will be necessary.
MARKETING AND INFORMATION-GATHERING. Since devolution, lo-cal governments can choose how much to invest in the social sec-tors; which of the social sector programs they will assign priorityto; and, within each program, which staff members will be sent fortraining and how often. If the national government wishes to ex-pand or improve the quality of the child development program, itwill first have to successfully advocate that program’s importanceand then market the specific kinds of interventions it believes willbe most effective. The central government has very little experiencein this. It does, however, have a cadre of staff with experience inthe social marketing of specific health and nutrition interventions
124 I M P R O V I N G E A R L Y C H I L D H O O D D E V E L O P M E N T

to families. With appropriate assistance from private sector mar-keting experts, these skills in social marketing can be reorientedtoward marketing the benefits of investment in child developmentand other social sector priorities to local governments.
Before a successful marketing effort can be developed, muchmore information is needed about local governments’ behavior,priorities, and levels of understanding with regard to child devel-opment. Surveys and focus group consultations will be needed toanswer, among others, the following questions. How has social sec-tor spending by local governments changed since devolution?What priority does child development have within social sectorspending? Within child development, how much is spent on im-proving quality and on nonsalary recurrent costs? What do localgovernments see as the main constraints affecting current childdevelopment activities? Do they perceive that there is a child mal-nutrition problem in their area? Do they perceive that nutritionand preschool activities are of such low quality that much of theirbenefit is lost? If they had additional money to invest, wherewould they put it? If offered additional funds by the national gov-ernment, would they be prepared to complement them with theirown, and if so, how much of their own? How fast are local govern-ment resources—internally generated and from revenue allot-ments—likely to grow?
FINANCING CHILD DEVELOPMENT. The market failure and cost-ef-fectiveness rationales for the central government to invest in childdevelopment are reviewed in Chapters 1 and 5. This section dis-cusses the managerial issues raised by the continuing need for fi-nancing. The central issue is the tension between, on the one hand,the national government’s need for consistency and accountabilityin the implementation of the policies and programs it finances and,on the other hand, the local governments’ wish to respond flexiblyto locally perceived priorities and needs, the facilitation of whichwas the main original rationale for devolution.
Of the devolved departments, the Department of Health hasmade the most progress in developing mechanisms for managingcentral financial support. The department is conscious of the needto maintain existing public health programs and to avoid centralfinancing being a substitute for local government investment thatmight otherwise have gone into health. Therefore, the Departmentof Health, through its regional offices, has negotiated with localgovernments a series of Comprehensive Health Care Agreements,in which local governments undertake to maintain existing levelsof service in the key public health programs as a precondition of
C R E A T I N G A N I N T E G R A T E D , N A T I O N A L E C D P R O G R A M 125

continued central financing. Because of the large number of localgovernments, these agreements have been negotiated with theprovinces, and it is the responsibility of the provinces to secure theparticipation of the municipalities in their area. The Department ofHealth then plans to enter into a series of additional agreements,annexed to the original agreement and part of it, governing thefinancing and implementation arrangements for each of the coreinvestment packages set out in its ten-year perspective plan. Thefirst of these is the package for Women’s Health and Safe Mother-hood. The Department of Health’s next priority is an investmentpackage for child development.
The Department of Social Welfare and Development has not yetdeveloped a similar mechanism for local government financing be-cause its resources for augmenting local governments have beenlimited to a few small-scale projects. But if the Department of So-cial Welfare and Development is to take a lead role in early educa-tion, as proposed here, it would be desirable for the Department ofSocial Welfare and Development to adopt a similar mechanism andfor the Department of Health, the Department of Social Welfareand Development, and the local governments to enter into joint“Child Development Program Agreements” that would integrateall investment in health, nutrition, and early education for pre-schoolers. These agreements would set out the respective parties’mutual understanding of which activities should have priority dur-ing a five- or six-year period; the targets to be achieved during theperiod; the resources required to reach these targets; and thechanging share of central and local government contributions, witha provision for the local government’s share to increase progres-sively with its revenue growth so as to ensure long-term sustain-ability. Annual action plans and budgets would then be negotiatedas the program proceeded, within the framework of the initialoverall agreement.
Flexibility in Implementation
Child Development Program Agreements would be advantageousto the central government in fostering consistency and account-ability. But they could become straitjackets for local governmentsand communities unless the agreements avoid standard blueprintsand build in flexibility of response to local needs. Three stepsshould be taken to ensure that they do. First, the central govern-ment should offer local governments a menu of options having adiffering balance of interventions and implementation arrange-ments for different risk, geographic, and cultural conditions.
126 I M P R O V I N G E A R L Y C H I L D H O O D D E V E L O P M E N T

Second, local governments should be encouraged to come up withvariations on these options, and the variations should then be ap-praised by and negotiated with the center. Finally, once implemen-tation begins, negotiation of the annual action plans should beapproached flexibly so that the program can be adjusted by mutualagreement in the light of the implementation experience.
Examples of ways in which the menu of options might differfrom local government to local government, or barangay to baran-gay, would include variations in the ratio of child developmentworkers to clients or in the way services are provided. With regardto the former, in certain communities, such as some slum or indige-nous communities, the majority of children might be seriously dis-advantaged, and in that case it might be necessary to providedouble the density of workers and services planned for a typicalbarangay. Some better-off communities, by contrast, will have toofew malnourished children to justify having a new child develop-ment worker. And over time, as malnutrition rates fall and privatesector preschool services expand, an increasing number of commu-nities will evolve to the point where a single child developmentworker can manage the program. Differing local conditions mayalso demand different kinds of services as well as differing worker-client ratios. For example, where communities are scattered, it maybe appropriate to develop more small, locally accessible, home-based preschools and rely less on the standard forty-child day carecenter model. And in urban slum areas, where extended familiesare not available, more attention will need to be paid to developingfull day care in addition to preschool services.
Central Support and Direction
Because of time and budget limitations, the study on which thisbook is based could neither look at all the support institutions nordo an in-depth analysis of any single one. More work would berequired, in consultation with the agencies and their clients in gov-ernment, to develop detailed recommendations and plans for insti-tutional development. The institutions discussed below are limitedto the Council for the Welfare of Children (CWC), which is the na-tional oversight agency for children; the National Nutrition Coun-cil (NNC); and the Food and Nutrition Research Institute (FNRI).
The Council for the Welfare of Children
The CWC was founded in 1978 with a mandate to coordinate andimplement the enforcement of laws relating to children, formulate
C R E A T I N G A N I N T E G R A T E D , N A T I O N A L E C D P R O G R A M 127

national policies and programs for children and monitor andevaluate their implementation, advocate new interventions whereappropriate, and mobilize resources for the sector. The CWC is anattached agency of the Department of Social Welfare and Develop-ment, with the secretary of the Department of Social Welfare andDevelopment as its chair. The governing board consists of repre-sentatives of eight government departments and three private indi-viduals. The board is supported by a technical managementcommittee consisting of the bureau and service heads of the maingovernment agencies dealing with children and of the heads ofselected NGOs. The committee operates through five sectoral pan-els, concerned with health and nutrition; population and socialwelfare; education; livelihood and shelter; and legal protection andwelfare. To support these panels, the CWC has a very small secre-tariat with thirty-six posts, of which twenty-eight were filled inmid-1994, and a budget of only P5 million ($180,000).
A significant accomplishment of the CWC has been the formula-tion of the Philippine plan of action for children (Chapter 3). It hasalso been active in formulating regulations for implementing theChild and Youth Welfare Code and the Juvenile Justice System; or-ganizing regional subcommittees for the welfare of children andguidelines for local councils for the protection of children; provid-ing technical assistance in drafting child-related congressional bills;and taking the lead in advocating for children. With assistance fromUNICEF, the CWC has also begun to work on a monitoring system forchild development interventions, but budget considerations haveprevented it from developing this beyond monitoring the limitedset of “Mid-Decade Goals” for children to covering the full range ofchild development activities in health, nutrition, and education.
The CWC’s small size, junior staffing levels, and lack of stature ingovernment have inhibited it from effectively analyzing key policyissues and influencing the spending levels of the line agencies thatcontrol the resources for children. Staffing issues are compoundedby the small size of the CWC’s discretionary budget. The CWC iscurrently obliged to seek resources where it can find them andhence risks having its priorities determined by the objectives ofother agencies, domestic or foreign, which have project money tooffer. If the CWC is to have credibility and influence with the majoractors in government, its structure will need to be reviewed and itsbudget increased very substantially. Its work program will need tobe carefully designed so that it avoids becoming an implementingagency and becomes proficient in policy analysis, coordination,monitoring, research, and evaluation. This suggests that the CWCstaff should be relatively small, but high in technical quality and
128 I M P R O V I N G E A R L Y C H I L D H O O D D E V E L O P M E N T

stature so that the institution is well placed to commission, man-age, and act on policy and review studies rather than build a newinfrastructure to carry out these studies itself.
Legislative action has recently been proposed to convert the CWCto an independent commission; to increase its central staff com-plement to about sixty professionals, who would work in fourdivisions—Policy Development, Planning, IEC/Training, and Re-search; and to create small regional offices with an advisory ratherthan implementation role. If enacted, this legislation would poten-tially give the CWC the independence, stature, and technical staff toplay an effective role as the apex institution for the ECD program.For this potential to be realized, it will be essential for the keyposts in the CWC to be at a high enough level to attract outstandingprofessionals in the child development field.
The National Nutrition Council
The NNC was founded in 1974 to coordinate the many institutionsby then active in nutrition in the Philippines; to provide policyguidance; to carry out monitoring, research, and evaluation; toraise resources; and to promote and pioneer new interventions.The NNC is responsible to a governing board consisting of the sec-retaries of ten government departments and three private sectorgroups. This board meets twice a year, often with representation atmuch lower levels than secretary. The NNC is an attached agency ofthe Department of Agriculture, to which it reports on a day-to-daybasis. The council is supported by a technical committee, headedby the director of the FNRI. The NNC’s operational work is con-ducted by a secretariat, headed by an executive director and madeup of three technical divisions: Nutrition Policy and Planning; Nu-trition Surveillance; and Nutrition Information and Education.There are also divisions for finance and administration. The staffnumbers around 150, about a third of them professionals. TheNNC’s budget appropriation of about P28 million (about $1 million)has remained roughly static over the past ten years and is equaledor outweighed by the support it receives from funding agencies. Byfar the most important is Japan’s four-year commitment of P50million (about $1.8 million) for the LAKASS program (described inSection H of the supplement volume), a second phase of which isbeing negotiated. Grants for other projects total P8 million to P10million (about $400,000).
The most important recent activity of the NNC’s Policy and Plan-ning Division has been its lead role in putting together the Philip-pine Plan of Action for Nutrition, the follow-up plan to the World
C R E A T I N G A N I N T E G R A T E D , N A T I O N A L E C D P R O G R A M 129

Nutrition Conference in Rome in 1992. The Philippine Medium-Term Food and Nutrition Plan, 1993–98, which reflects many of thegoals of the World Nutrition Conference and of the Philippine Planof Action for Children, was approved in principle by the cabinet in1993, but not with the funding needed to implement it. The NNChas also proposed ten nutrition-related bills to Congress, some atits own initiative and some at the request of legislators seekingtechnical help in their preparation. Although two have reached theAppropriations Committee, none have become law.
The NNC’s difficulties in influencing policy and budget allocationreflect a vicious circle in which some other nutrition councils inAsia also find themselves. The secretariat’s advisory role, tinybudget, and lack of political support and access give it little influ-ence over resource allocation decisions in the cabinet or over lineagencies with large budgets. The NNC’s low government salariesand lack of influence in turn make it difficult to hire the best staffand carry out high-quality policy analysis on issues important tothe cabinet and line agencies. Although the NNC has producedmany useful pieces of research, its lack of social science skills,among other factors, has meant that it has not fully addressedsome critical problems in child nutrition. Among these are the needfor a more rigorous analysis of the causes of PEM, the design flawsin the national growth promotion program, and the need to reallo-cate money assigned to the National Food Authority for food sub-sidies into more productive interventions.
A fundamental issue is whether the NNC should develop a com-parative advantage in one or two major missions or continue withits multiple missions, which include policy analysis and develop-ment, program coordination, nutrition surveillance, IEC, and coor-dination of the implementation of intervention programs. Of allinstitutions in the Philippines, the NNC has the clearest mandate fornutrition policy analysis, advocacy, and interagency coordination.Careful study is required of the NNC’s comparative advantage innutrition surveillance as against the FNRI’s, in IEC for program im-plementation (as opposed to high-level advocacy) as against theprivate sector’s, and in coordination of the delivery of services asagainst line agencies having the resources to support local govern-ments on a national scale.
The Food and Nutrition Research Institute
The FNRI started in 1947 as the Institute of Nutrition, a smallagency under the Department of Health. It acquired its presentname when it was put under the Department of Science and Tech-
130 I M P R O V I N G E A R L Y C H I L D H O O D D E V E L O P M E N T

nology upon that department’s creation in 1958. The FNRI’s princi-pal mandate is to define nutritional status, which it does throughmajor national surveys every five years, with updates on a smallerset of indicators in between. In addition, it sets technical standards,for example, weight and height standards for anthropometricmeasurements; develops new food products, such as weaningfoods and fortified rice and junk foods; and undertakes research ona wide variety of topics, ranging from overnutrition to food com-position and quality to behavioral issues such as breastfeeding.The FNRI’s staff numbers about 237, of whom about 150 are profes-sionals. Its budget is about P37 million ($1.3 million). An addi-tional third to a half of this amount comes from outside sources,depending on the year.
The FNRI’s survey and research work is generally regarded as ofhigh quality. However, a major issue—forced by budget considera-tions—is the small sample size of the national nutrition surveys,which means that they are valid only at the regional level. As notedin Chapter 2, the aggregated data, which are all that are available(aside from the unreliable Operation Timbang data), make it diffi-cult to target maternal and child nutrition interventions where theyare most needed. They are also not useful for program manage-ment, because they do not correspond to the administrative units thathave become important since devolution. Additional funds to in-crease the sample size so as to make future national nutrition surveysvalid at the provincial level would be well spent. Valid surveys at thislevel would enable better targeting and more cost-effective use of themuch larger sums going into intervention programs. Moreover, byproviding local governments and the public with accurate data forthe first time, the surveys would act as an incentive for lagging localgovernments to improve their performance in child nutrition.
Like the NNC, the FNRI is lacking in social scientists, and its re-search, although useful, has not gone far in addressing the criticalissues of causality, management, and cost-effectiveness noted above.How responsibility for this kind of work should be allocated betweenthe FNRI and the NNC is an important issue to resolve. Another iswhether the responsible institution, once chosen, should attempt tobuild up the capacity to do such work in-house, or whether it shouldcontract the work to other agencies that already have some of the tech-nical skills required.
Apex-Level Support for Early Education
Although apex-level support institutions are long established forhealth and nutrition, early education has no central-level body
C R E A T I N G A N I N T E G R A T E D , N A T I O N A L E C D P R O G R A M 131

Box 4-1. Recommended Structural and Procedural Changes to Foster Integration of Services for Early Childhood Development inthe Philippines
Barangay level
• Develop a social marketing program to increase communities’ un-derstanding of the concept of integrated ECD.
• Develop an integrated, community-based system and indicators tomonitor the performance of the ECD program.
• Revise the job descriptions of ECD workers to ensure integrated at-tention to health, nutrition, and early education.
• Develop work routines that allocate task responsibilities among full-time ECD workers and volunteer workers (barangay health workersand nutrition scholars).
• Develop joint in-service training programs for field staff.
Municipal level
• Develop a social marketing program to increase local governments’understanding of the concept of integrated ECD.
• Develop an integrated system to monitor the performance of ECDprograms at the local government level.
• Revise the job descriptions of ECD supervisors to ensure they pro-vide technical support to all field-level workers, rather than only tothe “health” or “social welfare” cadre.
• Develop joint in-service training programs for ECD supervisors.
Provincial and regional levels
• Develop an integrated system to monitor the performance of theECD program.
• Develop joint training programs for trainers of ECD trainers.
Central level
• Seek support from the Social Development Committee to pursue thevision of an integrated national ECD program.
• Strengthen working-level contacts between the line agencies respon-sible for ECD.
• Develop an integrated national investment program for ECD.• Strengthen the Council for the Welfare of Children as the national
apex institution for ECD.
132 I M P R O V I N G E A R L Y C H I L D H O O D D E V E L O P M E N T

giving it the same kind of support in advocacy, policy development,advice-giving, standards development, monitoring, operations re-search, and evaluation. An issue for government policymakers toconsider is whether this kind of institutional support—which willbe essential for improving the quality of early education in thePhilippines—should be developed by creating an entirely new gov-ernment institution. In a climate of fiscal concern and civil servicestreamlining, such an option should be avoided if effective alterna-tives can be found. Given that technical expertise in early educa-tion is more abundant in nongovernmental than in governmentalorganizations, a cost-effective alternative may be to create a net-work of governmental and nongovernmental organizations withexpertise in these areas as a support system for early education.Such a network would need guidance and coordination from asmall secretariat, which in turn would need discretionary budgetfunds to enable it to commission policy, operations research, evalu-ation, and other studies from qualified network members. If thenetwork rather than a new institution were created, it would benecessary to agree on an appropriate institutional home for theproposed secretariat.
Conclusions
It is possible to develop an integrated national ECD program thatbuilds on existing interventions, but it will require significant
Box 4-2. Proposed Investments to Strengthen Institutional Capacity at Various Levels for Early Childhood DevelopmentPrograms in the Philippines
• Barangay level: create a new position of child developmentworker for children under 4.
• Municipal level: create a new position of early education trainer.• Provincial and regional levels: strengthen the capacity to provide
training and support for municipal ECD programs.• Central level: strengthen the Council for the Welfare of Children
as the apex institution for the ECD program.
C R E A T I N G A N I N T E G R A T E D , N A T I O N A L E C D P R O G R A M 133

change in two directions: first, change in institutional process andstructure to ensure that existing services are integrated and, sec-ond, policy development, additional staff, supervision, and train-ing to ensure manageable workloads and good quality. Both sets ofchanges would have to be endorsed in principle by the Social De-velopment Committee before a detailed national ECD investmentplan is worked out.
Box 4-1 summarizes the structural and procedural changes that arerecommended at different levels of the system to foster integration.
Box 4-2 lists the main points in the system where significant in-vestments must be made to ensure good-quality services and good-quality technical and supervisory support. The costs of theseinvestments in institutional capacity are calculated in Chapter 5, asare the costs of noninstitutional inputs, such as civil works, equip-ment, and supplies, which are also required to strengthen and ex-pand the ECD program.
134 I M P R O V I N G E A R L Y C H I L D H O O D D E V E L O P M E N T

5. Financing EarlyChildhood Development
What are the trends and levels of public sector spending on earlychildhood development (ECD) in the Philippines and how does thespending compare with what other Asian countries spend? Howmuch additional money will be needed to improve the quality andcoverage of ECD services so as to meet national goals over the nextsix years? Where might the money for strengthening and expand-ing the ECD program in the short term—and sustaining it in thelong term—come from? These are some of the questions that willbe dealt with in this chapter.
Trends and Levels in Spending
Social Sector Expenditure
Manasan and Llanto (1994) have summarized trends in social sec-tor spending in the Philippines during the 1980s and early 1990s.Social sector spending rose significantly after 1986, with the endingof the economic crisis of the mid-1980s and the coming into powerof the Aquino government, which was committed to the poor.From 3.2 percent of gross national product (GNP) during 1975–85,social sector expenditure rose to 4.1 percent of GNP during 1986–93.Social sector spending also rose significantly as a proportion ofgovernment spending net of debt service, rising from 24 percentduring 1983–85 to 30.1 percent during 1986–93. However, squeezedby increased spending to service debt, the social allocation ratio—social sector spending as a proportion of all government spending—rose more modestly, from 16.7 percent during 1983–85 to 18.5percent during 1986–93. Debt service has emerged as the maincomponent of government spending, making up 38 percent ofthe budget during 1986–93 as against 8.3 percent during 1975–82.To have increased the share of social sector spending during this
135

period, when total government spending net of debt serviceshrank, is an achievement. Nevertheless, this achievement has tobe seen in perspective. At 20 percent in 1993, the social allocationratio no more than returned to its 1975–82 level, comparing unfa-vorably with that of several Asian countries (Figure 5-1).
Within social sector expenditure, education has the largest shareat 63 percent (Figure 5-2). But because the education budget isalmost entirely spent on schoolchildren, it is health expenditure,with only 16 percent of the share, that has the greatest impact onpreschoolers. During the economic crisis of 1983–85, spending oneducation and health fell to about 6.0 percent and 0.5 percent ofGNP, respectively. The drop in health spending was sharper than ineducation—a 40 percent fall in health as against a 10 percent fall ineducation spending as a proportion of GNP. Spending on educationrecovered to 13 percent of GNP in 1991 and 10.6 percent of GNP in1993, but spending on health rose only to 1.0 percent of GNP in 1990and then fell back to 0.5 percent again in 1993. This level comparespoorly with levels in several other Asian countries (Figure 5-3).
Real public spending on health per capita in 1990 was less than10 percent greater than it was in 1983, just before the economiccrisis. The World Development Report Investing in Health (World
Note: The social allocation ratio is social sector spending as a percentage of all govern-ment spending.
Source: Manasan and Llanto (1994).
Figure 5-1. Social Allocation Ratio, Selected Asian Countries, 1988
0 5 10 15 20 25 30 35 40
Indonesia
Philippines
India
Bangladesh
Malaysia
Thailand
13
18
20
24
29
37
136 I M P R O V I N G E A R L Y C H I L D H O O D D E V E L O P M E N T

Source: World Bank (1993a).
Figure 5-2. Sectoral Shares of Social Spending in the Philippines,1991
Education(63 percent)Health
(16 percent)
Social welfare(6 percent)
Land reform(4 percent)
Housing andcommunity
development(3 percent)
Other(8 percent)
Figure 5-3. Health Spending as a Percentage of GNP,Selected Asian Countries, Average for 1980–89
Source: World Bank (1993a).
0 0.2 0.4 0.6 0.8 1.0 1.2 1.4
Indonesia
Philippines
Thailand
Malaysia
India
Bangladesh
0.7
1.0
1.1
1.3
1.3
1.4
Percent
F I N A N C I N G E A R L Y C H I L D H O O D D E V E L O P M E N T 137

Table 5-1, landscape
138 I M P R O V I N G E A R L Y C H I L D H O O D D E V E L O P M E N T

Bank 1993b) estimated that the cost of a minimum package ofpublic health and clinical services (that is, excluding hospital care)would be about $12 per head for a typical low-income country.In 1990, just before devolution, total public sector spending onhealth in the Philippines was about P115, or about $4.10 per head(World Bank 1993b), of which less than a quarter went to preven-tive care.
Expenditure on Early Childhood Development
It is impossible to make an estimate of total spending on ECD in thePhilippines because of the lack of data about private sector spend-ing. We can therefore estimate only an order of magnitude of pub-lic sector spending.
The main spending affecting preschoolers is on immunizationand the programs to control diarrheal diseases and acute respira-tory infections. The budgets for each of the three programs in 1994,together with the relevant sources of financing, are given in Table5-1. Total spending was P880 million ($31.4 million), of which theimmunization program absorbed 70 percent.
Table 5-2 sets out 1994 budgets for nutrition, totaling P854 mil-lion ($30.5 million). It leaves out the National Food Authority’sspending on the consumer subsidy, because this is not aimed atchildren, nor does it appear to benefit them significantly (Chapter3). Spending on child nutrition is probably overestimated, becausethe “Other programs” category includes some expenditures notaimed solely at children. Table 5-2 illustrates the nutrition pro-gram’s extreme dependence on PL 480 resources, which made upmore than half the program budget in 1994. As noted in Chapter 3,the proposed phaseout of PL 480 support will necessitate a radicalreappraisal of the program.
Table 5-3 summarizes the budget for early education in 1994, to-taling P373 million ($13.3 million). These figures are particularlyuncertain. On the one hand, they may overestimate normal spend-ing levels, because the 1994 budget included a P95.2 million ($3.4million) congressional insertion of money from the countrywidedevelopment fund, which may not be repeated in later years. Onthe other hand, many local governments have been rapidly ex-panding their day care center networks since devolution, althoughwhat they have been spending is unknown. The P169 million ($6million) shown for local government spending on the day care cen-ter program in 1994 in the table includes only what was devolvedto them for this program.
F I N A N C I N G E A R L Y C H I L D H O O D D E V E L O P M E N T 139

A very rough estimate of planned spending on early childhooddevelopment in 1994 is therefore P2,107 million (about $75 million),or about $7.80 for each preschooler. This figure would fall to P1,581million (about $56 million), or about $5.90 a head with the phasingout of the PL 480 program and if the apparently exceptional 1994congressional insertion for early education is not repeated.
Conclusions
In relation to some other Asian countries, the Philippines is under-spending on social sector development. Spending on preschool
Table 5-2. Public Spending Budgeted for Early Childhood Nutritionin the Philippines, 1994
Source of financing Millions of pesos
Department of Health’s budget 86.1Foreign assistance to the Department of Health 34.0Devolved personnel from the Department of Health 162.0Supplementary feeding program of the Department of Social Welfare and Development 6.8Supplementary feeding programs of local governments 52.5PL 480 431.2World Food Programme 75.5Other programs 5.8
Total 853.9
Table 5-3. Public Spending Budgeted for Early Education in the Philippines, 1994
Source of financing Millions of pesos
Congressional insertion 95.2 Local government spending on day care program 169.0 Preschool program of Department of Education, Culture, and Sports 100.0 United Nations Children’s Fund 8.9
Total 373.1
Source: World Bank and ADB data. See Section K of the supplement volume.
140 I M P R O V I N G E A R L Y C H I L D H O O D D E V E L O P M E N T

children gets only a small share of the low overall allocation to thesocial sectors. Of spending on health, less than 10 percent goes forprograms primarily aimed at preschoolers, despite the fact thatthese are the programs that will have the greatest impact on deathand disease rates, given the epidemiology of the Philippines.Spending on child nutrition, a crucial area because of the very highlevels of both micronutrient and protein-energy malnutrition(PEM), is dwarfed by the unproductive spending on consumer foodsubsidies. Public spending on early education is about 40 percentof spending on child health, consistent with the very low coverageof the early education program. Low spending on early childhooddevelopment is a matter of great human concern because of thepoor developmental situation of young children as measured byseveral indicators (Chapter 2). It is also a matter of great economicconcern because of the important role that investment in humanresources has played in the success of the high-growth “East Asianmiracle” countries.
There are few signs of positive change in the above situation; infact, there are some signs that things will get worse. In health,although spending as a proportion of GNP began to recover afterthe economic crisis of the mid-1980s, this ratio fell again after 1991and is now back where it was then. In nutrition, spending may fallby nearly half as PL 480 support phases out. In early education, thesituation is uncertain; if the 1994 congressional insertion is not re-peated, spending may also fall in that subsector.
It is difficult to quantify how far away the Philippines is fromwhat it “should” be spending on child development, because thereare no generally accepted norms for this. One estimate (Selowsky1981) suggests that low-income developing countries should spend1.4 to 2.2 percent of GNP on this sector. On that basis, and assum-ing, overoptimistically, that the private sector would provide halfthe financing, the government should be spending about five timesas much on ECD as it does now. But the best way to arrive at anestimate of spending requirements is to build them up from theunit costs and quantities needed to reach desired levels of coverageand quality. The next section attempts to do this.
Six-Year Financing Needs
Here we estimate the investment needed by 2000 to achieve thenation’s child development goals. The strategies costed in health,nutrition, and early education are those recommended in previouschapters.
F I N A N C I N G E A R L Y C H I L D H O O D D E V E L O P M E N T 141

Strategies and Assumptions
The health strategy costed includes, first, the consolidation andexpansion of a set of well-established national core programs, in-cluding the Expanded Program on Immunization (EPI), control ofdiarrheal diseases, and control of acute respiratory infections. Themain capital replacement cost would be for the EPI cold chain. Sec-ond, costing includes interventions for schistosomiasis, malaria,and helminth control in provinces where these are important con-tributors to child death and disease, and includes nationalstrengthening of the disease sentinel surveillance system. Third, itis assumed that the midwife cadre will expand at a rate in line withpopulation growth.
In nutrition, the core intervention costed is the development of anational program for growth monitoring and promotion, includingshort-term supplementary feeding of selected children and preg-nant women, and interventions to eliminate vitamin A and iodinedeficiency and to reduce iron deficiency. The nutrition costing in-cludes the cost of adding a child development worker in eachbarangay, as proposed above, although this worker would assistwith health and early education as well as nutrition interventions(Chapter 4). Finally, costs for information, education, and commu-nication (IEC); training; and monitoring and evaluation are in-cluded.
In early education, the main strategies costed are the strengthen-ing of the existing day care centers through the provision of im-proved materials, training, and supervision, including the creationof a new early education trainer post in each municipality (Chapter4); the establishment of a day care center in poor barangays notnow covered by the program; and the establishment of a demon-stration “satellite” home-based day care center in each barangay.For each of the above areas, further details of the costing assump-tions are given below and in Section K of the supplement volume.
Because of the many uncertainties involved in the costing, theestimates represent no more than a rough order of magnitude.Among the uncertainties that might affect costs significantly, fourstand out. First, policymakers in the central government may optfor different assumptions than those made below about interven-tions and program phasing. Second, now that devolution has takenplace, the types of child development programs that are imple-mented, and the pace at which they expand, will be determined bylocal, not central, government. Without widespread consultationwith local governments, it is impossible to know whether the type,scale, and pace of investment contemplated below will prove to be
142 I M P R O V I N G E A R L Y C H I L D H O O D D E V E L O P M E N T

realistic. Third, as noted in Chapter 4, the program design willvary significantly in different areas, both in the ratios of staff andother inputs to clients and in the way services are delivered. Order-of-magnitude costing must inevitably be based on standard programinputs to a standard, “typical” barangay, whereas in practice, localconditions, project inputs, and project costs will vary. Finally, thebrief study on which this book is based did not allow for a full-scale costing exercise. Many of the unit costs and quantities as-sumed below would need to be revised when specific investmentproposals are prepared. To allow the reader to recalculate costsusing alternative assumptions, Section K of the supplement vol-ume contains details of all unit costs and quantities. All costs are in1994 prices, with no allowance for inflation.
Finally, the investment requirements for ECD are presented in theform of financing gaps between resources currently available andresources required. A distinction is drawn below between the over-all financing gap, which would be filled by a mixture of centraland local financing, and what might be termed the “magna carta”financing gap.1 The latter represents the difference between whatlocal governments are theoretically obligated to pay (from the startof 1995) for a recently negotiated, so-called magna carta benefitpackage for health fieldworkers and what the local governmentsare able to pay. The distinction is important on two counts. First,these benefits may or may not be continued by local governments,depending on their ability to pay; therefore, it is of interest to showtheir order of magnitude separately. Second, the benefits are theonly costs among the incremental investment requirements that areclearly the obligation of local rather than central government. Acost-sharing policy between central and local government—dis-cussed under Sourcing below—will need to be set up for the re-maining, and far larger, portion of the financing gap. For thisreason also, it is important to distinguish between the two ele-ments of the overall gap.
Financing Needed for Health
Of the three child development subsectors, the costs for health areprobably least controversial. This is partly because the main inter-vention programs are in place and following appropriate strategies(Chapter 3); the investment requirements are more for building onand consolidating existing plans than for funding changes in strat-egy. It is also because a major exercise, documented in Alanoand others (1993), was recently undertaken by the Departmentof Health and UNICEF to calculate the costs of reaching the
F I N A N C I N G E A R L Y C H I L D H O O D D E V E L O P M E N T 143

Table 5-4
144 I M P R O V I N G E A R L Y C H I L D H O O D D E V E L O P M E N T

nation’s mid-decade health goals. The costs assumed below forhealth essentially take the unit costs and quantities from thisstudy and extrapolate them, taking into account changes inpopulation size.
Table 5-4 shows estimates of investment requirements in childhealth. This estimate diverges from the costings in the Alano studyin three significant ways. First, an allowance is made for invest-ment in schistosomiasis, malaria, and helminth control programsin the ten provinces where these are most likely to affect childhealth. Second, costs are included for expanding and improvingthe disease surveillance program (see Chapter 2). Third, a reduc-tion has been made for joint cost savings for items such as training,IEC, and monitoring and evaluation, where improvements in onesystem can serve the needs of several child health intervention pro-grams. The estimates of resources that will be available reflect in-tentions of Department of Health program managers and the localoffices of the main aid donors in 1994. Based on the above assump-tions, the financing gap in child health is P2,695 million (about$96.3 million) over six years. This includes a magna carta gap ofP774 million (about $27.6 million) and a remaining gap of P1,922million (about $68.6 million).
Financing Needed for Nutrition
Cost estimates for the micronutrient program were included in theAlano study, and these are used as the basis for the micronutrientprogram costs here. The main departure is to assume higher levelsof achieved coverage—90 percent for women and children, ratherthan the 65 to 80 percent range adopted in the Alano study. Thisassumption reflects the high priority given in this book to attackingmicronutrient deficiencies, because of both the severity of the prob-lem in the Philippines and the extraordinarily high cost-benefit ra-tio of investment in this area. As with the estimates for childhealth, joint cost savings have been assumed for training, IEC, andmonitoring and evaluation.
Because the PEM control program needs substantial restructuring(Chapter 3), the program has been completely recosted on the basisof inputs of successful growth promotion programs elsewhere. Themajor costing assumptions are therefore enumerated here in moredetail. Program coverage has been assumed to be all rural barangaysplus half the urban population (in practice, as noted in Chapter 4,some rural barangays may not require a new PEM control program,whereas barangays that are especially disadvantaged may require
F I N A N C I N G E A R L Y C H I L D H O O D D E V E L O P M E N T 145

double the average resources of staff and other inputs). An allow-ance of P700 (about $25) a month has been assumed for the pro-posed new child development worker as being the minimumincentive required for good-quality work four to six hours a day.Lump sum costs of P84 million (about $3 million) each have beenassumed for the monitoring and evaluation and IEC inputs. It hasbeen assumed that the phasing of implementation of the revampedPEM program would be over a six-year period, with an additionalsixth of the target population covered each year. This relativelyslow phasing reflects the substantial reorientation that appears tobe required in the PEM program.
For supplementary feeding, it has been assumed that children 6months to 24 months old who are eligible for feeding would re-ceive a 400-calorie supplement six days a week for three months.However, the cost of supplementary feeding for children is diffi-cult to calculate because of uncertainties about the cost for a rationof food and the percentage of the target population who would befed each year. The former is uncertain because the cost of a rationin current feeding programs in the Philippines, P2.40 (about $0.09),seems high by international standards. The latter is uncertain be-cause both the number of growth-faltering children and the rate atwhich malnutrition will fall are unknown. Table 5-5, therefore, pre-sents a sensitivity analysis of the annual cost of supplementing thediets of 385,000 children—the number of children of target age whowould come into the program each year, assuming that implemen-tation would expand evenly over six years.
Table 5-6 shows cost estimates for the nutrition program, using alow estimate for supplementary food. For this table, it is assumedthat the cost of an appropriate weaning food can be reduced to P2(about $0.07) for each child-ration and that no more than 18 per-cent of the children would be in the supplementation program atany time. Supplementation costs for children would then be P924
Table 5-5. Sensitivity Analysis of the Cost of Supplementary Foodper 385,000 Children in the Philippines (millions of pesos)
Percentage of children fed
At P1.4per ration
At P2.0per ration
At P2.4per ration
18 30 43 52 25 42 60 72 33 55 79 95
Source: World Bank and ADB data. See Section K of the supplement volume.
146 I M P R O V I N G E A R L Y C H I L D H O O D D E V E L O P M E N T

Table 5-6
F I N A N C I N G E A R L Y C H I L D H O O D D E V E L O P M E N T 147

Table 5-7
148 I M P R O V I N G E A R L Y C H I L D H O O D D E V E L O P M E N T

million ($33 million) over six years. Furthermore, it is assumed that25 percent of pregnant women would receive a 600-calorie supple-ment six days a week for six months to ensure coverage of womenlikely to have a baby with a low birth weight. Supplementationcosts for pregnant women for six years would then be about P714million ($25.5 million). Total supplementary food costs for childrenand pregnant women would be about P1,640 million ($58.6 million).In this scenario, the rough order of magnitude of the investmentfinancing gap in nutrition is P3,400 million (about $121 million),including a magna carta gap of P393 million (about $14 million).
Table 5-7 uses a high estimate for supplementary food costs.(Later tables use nutrition program costs that are an average of thelow and high estimates.) For the high estimate, it is assumed thatfood costs would be P2.40 (about $0.09) for each child-ration (aboutthe cost of supplementary feeding in the Catholic Relief Serviceprogram today) and that 25 percent of children on average wouldbe in the supplementation program. Supplementation costs forchildren would then be P1,530 million (about $55 million) over sixyears. It is also assumed that 30 percent of pregnant women wouldbe supplemented at the higher unit cost of food, in which case thesupplementation cost for women would be P1,030 million (about$37 million). In this scenario, the rough order of magnitude of theinvestment financing gap in nutrition is P4,283.6 million (about$153 million), of which P393 million ($14 million) is the magnacarta financing gap. In both scenarios, the costs of the food supple-mentation program continue to rise over the six-year period, re-flecting continuing program expansion. From year seven onward,supplementation costs would likely fall as the program reachedfull geographic coverage and malnutrition rates declined.
Financing Needed for Early Education
The inputs envisaged for early education divide into two types:those for improving the quality of the existing day care center sys-tem, and those for expanding its coverage. Costing for improvingquality is based on six main assumptions. First, 30 percent of theexisting day care centers would require an investment of an averageof P2,000 (about $71) to make them safe for children. Second, exist-ing day care workers would receive reorientation training at thebeginning of the program and refresher training three years later.Third, the allowances of existing day care workers would betopped up by an average of P300 (about $11) each month to P800(about $29) each month to reflect a minimum incentive for a full-time job. Fourth, a new position of early education trainer would
F I N A N C I N G E A R L Y C H I L D H O O D D E V E L O P M E N T 149

Table 5-8
150 I M P R O V I N G E A R L Y C H I L D H O O D D E V E L O P M E N T

be created and filled in each municipality. Fifth, learning materialsand an allowance for building maintenance would be provided ateach of the 20,500 existing day care centers. Sixth, training institu-tions would need to be strengthened (but because the strategy fordoing this is unclear, provision is made for this through a lumpsum).
Costing for the expansion of coverage assumes the following.First, as with the nutrition program, the coverage target would beall rural barangays plus half the urban population, and on thisbasis, 13,215 new day care centers would be established, togetherwith the provision of a day care worker, furniture, materials, andan allowance for building maintenance. Second, the cost of build-ing and furnishing a day care center would be only P89,800 (about$1,395), because designs based on local materials would be used.Third, one satellite (home-based) center would be established ineach of the 33,715 targeted barangays, requiring costing for aworker, materials, and training. (Again, as noted in Chapter 4, theratio of day care centers to home-based centers may not be one toone, but would vary, depending on local settlement patterns andneeds.) Fourth, the allowance for the home-based worker would beP400 (about $14) each month, reflecting the lesser hours and re-sponsibility for this work. Fifth, P5,000 (about $178) would be pro-vided for the repair and remodeling of homes to make themsuitable for preschool and day care purposes. Sixth, the new daycare centers would be phased in evenly over a six-year period, andthe home-based centers over a five-year period beginning a yearlater. (The delay would give time to improve the quality of existingday care centers before home-based centers are added to the sys-tem.) Details of all these assumptions are given in Section K of thesupplement volume.
Table 5-8 summarizes the investments required to improve thequality and coverage of early education. On the basis of an evenphasing in of new centers over six years, the order of magnitude ofthe investment financing gap is about P3,490 million (about $124million).
Conclusion
Based on the above assumptions, the cost over a six-year period ofmeeting the financing gap to bring the national ECD program up toa level of quality and coverage sufficient to meet national targetswould be P9.6 billion to P10.5 billion ($342 million to $374 million).If the cost is a middle-of-the-range figure of P10 billion (about$35.8 million), then P1.12 billion (about $40 million) would be the
F I N A N C I N G E A R L Y C H I L D H O O D D E V E L O P M E N T 151

magna carta gap and P8.88 billion (about $317 million) the remain-ing gap, to be filled by a mix of local, central, and foreign aidfinancing. Table 5-9 shows the breakdown of these costs by subsec-tor, assuming investment in the middle of the range. It indicatesthat, overall, the resources currently planned for ECD are about 47percent of needs. But the percentage shortfall is least in the healthsubsector, which has the most mature program, and is substantialboth in the nutrition sector, after the withdrawal of PL 480 assis-tance, and in early education, reflecting the limited resources thathave gone into the Department of Social Welfare and Develop-ment. About 38 percent of the gap is in nutrition, about 35 percentin early education, and about 27 percent in health.
The above cost estimates are conservative in at least two ways.First, they assume, for simplicity’s sake, an even phasing of invest-ment over six years in both PEM control and early education. Inpractice, it is likely that the phasing of investment may be signifi-cantly slower at the beginning, to allow time for pilot testing of theintegrated package of activities under the new circumstances ofdevolution. But it is also possible that, with successful pilot experi-ence, the expansion phase thereafter could be more rapid. If so, thebuild-up of costs would be faster and the total program costs corre-spondingly greater. It would be useful to carry out a sensitivityanalysis using different phasing assumptions, based on govern-ment guidance on its intentions for the program. For the PEM pro-gram, it has been assumed that supplementation would be limitedto eligible children 6 months to 24 months old; a case could also bemade for widening this to children 6 months to 36 months old,which would substantially increase costs.
Table 5-9. Early Childhood Development Program: Estimated Costs,Resources, and Financing Gap, Philippines, 1994–99 (millions of pesos)
Health Nutrition Education Total
Total resources required 7,128 6,793 4,937 18,857Available resources 4,433 2,951 1,451 8,835Resources as a percentage of cost 62 43 29 47Financing gap 2,695 3,842 3,486 10,023 Magna carta gapa 774 394 0 1,168 Remaining gap 1,922 3,448 3,486 8,855Financing gap (millions of dollars) 96 137 124 358
a. See the note to Table 5-4.Source: World Bank and ADB data. See Section K of the supplement volume.
152 I M P R O V I N G E A R L Y C H I L D H O O D D E V E L O P M E N T

Finally, the financing requirements are heavily weighted towardrecurrent costs, which make up more than 85 percent of the total.There are three main reasons for this. First, as will be discussed,ECD interventions are in their nature recurrent cost-intensive. Sec-ond, the need for erecting buildings is minimized through the pro-posed use of the barangay day care center as the convergence pointfor all three subsectoral programs. Third, construction costs areminimized through the proposed use of local materials for day carecenters. The cost of building and renovating day care centers, infact, makes up more than half of the capital costs of the investmentprogram; if it were possible to rent suitable accommodations insome areas, the recurrent cost-intensiveness of the program couldrise still further.
Sourcing and Sustaining the Financing
What are the recurrent cost implications of a strengthened na-tional ECD program, and who should pay for it? To answer thesequestions we consider in turn the structure and build-up of thefinancing gap, potential financers of the program, the need to de-velop a cost-sharing policy, and the data required to develop sucha policy.
Structure and Build-up of the ECD Program Financing Gap
Although all ECD expenditures are properly regarded as humanresource investments in an economic sense, in a financial sense ECDexpenditures divide into a mix of one-time capital costs and recur-rent operational costs (particularly as repeated expenditures haveto be made in order to invest in successive generations of children).In fact, ECD program interventions are by nature recurrent cost-intensive, because for the most part they consist of workers’ sala-ries, drugs and vaccines, food and micronutrient supplements,educational materials, and in-service training. Such costs make upabout 80 percent of the “remaining” gap. The capital costs forstrengthening the ECD program consist mostly of the costs of estab-lishing new day care and home-based centers, which make upabout 80 percent of capital costs; the costs of replacing cold chainequipment are the other significant capital cost.
On the basis of the assumptions and estimates made above, thefinancing gap for the ECD program would build up quite rapidlyover six years to a requirement of about P2.36 billion (about $84million) in year six (Table 5-10). Of the “remaining” gap of P8.85billion ($316 million) in 1999, about 95 percent would be recurrent
F I N A N C I N G E A R L Y C H I L D H O O D D E V E L O P M E N T 153

costs, because the bulk of capital investment would already havetaken place by the sixth year of the program.
The recurrent costs of the program would continue to rise untilyear six, simply because of the assumption made that investmentin system expansion for PEM and early education would be spreadover six years. After full coverage is reached in year six, recurrentcosts should begin to fall. The main reasons for the anticipated fallwould be, first, reduced costs for the immunization program (thelargest element of health costs; see Table 5-4) as neonatal tetanusand polio were eliminated and, second, reduced supplementaryfeeding costs (the largest element of nutrition costs, see Tables 5-6and 5-7) as the prevalence of PEM declined. However, it is difficultto quantify how great and how fast this decline would be. As anestimate for planning purposes, assume that the incremental recur-rent cost burden of the ECD program over existing expenditureswould be P1.5 billion to P2 billion ($54 million to $71 million) ayear for five to ten years. Given the difficult fiscal situation in thePhilippines, costs in this range mean that issues of financing andsustainability will be of paramount policy importance.
Who Should Pay?
This section reviews in theoretical terms the potential financingcontributions of service users, NGOs, local governments, the centralgovernment, and donors from the standpoints of ability and will-ingness to pay, as well as equity and sustainability. It also suggestswhat the government would need to consider in developing a cost-sharing policy for ECD.
Table 5-10. Estimated Build-up of the Financing Gap of the EarlyChildhood Development Program, Philippines, 1994–99(millions of pesos)
1994 1995 1996 1997 1998 1999 Total
Health 446 456 409 451 472 461 2,695Nutrition 0 423 615 760 903 1,142 3,842Education 311 487 552 693 688 755 3,486Total 757 1,367 1,576 1,904 2,063 2,357 10,023
Magna carta gapa 0 223 228 234 238 244 1,168 Remaining gap 757 1,143 1,347 1,670 1,825 2,113 8,855
a. See the note to Table 5-4.Source: World Bank and ADB data. See Section K of the supplement volume.
154 I M P R O V I N G E A R L Y C H I L D H O O D D E V E L O P M E N T

SERVICE USERS. Although government financing of ECD programsis strongly justified on cost-benefit and social welfare arguments(Chapter 1), contributions from users are desirable both to ease thefinancing burden on government and to increase users’ ownershipof the program. There appear to be no available data on users’ability and willingness to pay for ECD programs, and it wouldtherefore be important to use the proposed client consultationprocess (Chapter 4) to find out more about this. It is known thatusers make small contributions to the materials and salary costs ofrunning day care centers. But the lack of materials in most centerssuggests that these contributions fall far short of targets, and an-swers to inquiries on field visits indicate that day care workers areoften the main providers of teaching materials, from their own pay.
With better community mobilization, and with better-trainedworkers and higher-quality services on offer, users’ willingness tomake a financial contribution for services would probably increase.But it should also be remembered that the strengthened nutritionand early education services that form the bulk of proposed pro-gram costs would be targeted on the poorest—on families withmalnourished children and on the poorest third of the barangay inthe case of the day care program. Ability to pay among this groupwould therefore be very limited, and seeking significant contribu-tions from them would quickly become regressive. Future contri-butions from service users are likely to rise at the same pace as thegeneral alleviation of poverty. Substantial financing contributionsfrom users are therefore likely to emerge in the long term, ratherthan the medium term, as the poorest become less poor. Currently,it would seem appropriate to explore the imposition of nominaluser charges, with the aim of increasing users’ involvement in theprogram and the program’s accountability to users rather thanwith the aim of cost recovery.
NGOs. As with users, there are no data on the financing of NGOcontributions to the ECD program. But NGOs’ ability to substantiallyexpand their project coverage from their own resources is likely tobe extremely limited, because they depend on user charges andcharitable contributions. Although a very large number of NGOs areinvolved in early education on a sustained basis, their work is sus-tainable either because they are serving a better-off clientele withthe ability to pay or because they use fees from better-off clients tocross-subsidize poorer clients. Better-off clients are more plentifulin the urban areas, and it is doubtful whether NGOs can signifi-cantly increase their services in rural areas through self-financing.
F I N A N C I N G E A R L Y C H I L D H O O D D E V E L O P M E N T 155

It would therefore seem appropriate to use public funds to helpNGOs expand their activities as community mobilizers and provid-ers of good-quality services (see Chapter 4), rather than to look toNGOs as a significant source of funds. Cost-sharing arrangementswith NGOs should be developed, as they have been in the Commu-nity Health Partnership scheme (described in Chapter 4), so thatgovernment resources do not substitute for contributions that NGOswould otherwise have made.
BARANGAYS AND LOCAL GOVERNMENTS. Although the implemen-tation role of barangays and local governments after devolution isclear, policy with regard to the financing role of local governmentsin social sector programs after devolution is still being developed.Once again, the lack of data on ability and willingness to pay con-strains the government’s ability to develop an appropriate policy.And the very large variation in local governments’ ability and will-ingness to pay makes policy formulation all the more difficult.Nevertheless, it is possible to make certain generalizations as abroad framework for policy development.
At the time of devolution, Internal Revenue Allotments (IRAs) tolocal governments were made on the basis of a political consensusto increase the total share of resources going to local governments.But although there was an attempt to ensure that the aggregateincrease in IRAs for all local governments was more than enough topay for the costs of all national services devolved to local govern-ments, in practice the specific IRA shares of individual local govern-ments often did not correspond well with the cost of devolvedservices to be absorbed by the local government. In fact, provincesand municipalities took on much higher costs of devolved func-tions in relation to their increased IRA share than did cities andbarangays. Because cities were already paying for most health andwelfare services before devolution, their additional IRA shares havebeen more available for other purposes, aside from just maintain-ing devolved services. Because barangays ended up with expandedIRA shares without corresponding cost assignments for devolvedfunctions, their resources are also free for new initiatives. Manyprovinces and municipalities, however, are already facing difficul-ties in maintaining funding for devolved services at levels set bythe national government before devolution. Their capacity to fi-nance expansion or improved services is extremely limited in themedium term. This has important implications. If the case for sub-stantial additional ECD funding is accepted, the financial situationof most provinces and municipalities after devolution will not al-low them to pay the full costs of a strengthened program. If the
156 I M P R O V I N G E A R L Y C H I L D H O O D D E V E L O P M E N T

case made here for government financing of ECD is accepted, then asubstantial proportion of this funding would need to come fromcentral sources, and the central government would need to developa financing policy that would take into account differences in thelocal governments’ ability and willingness to pay.
It is possible to conceive of a set of differing financing ap-proaches for local governments with differing characteristics. Atone extreme of the spectrum are very poor municipalities, withlarge populations in relation to their revenue base and very badECD indicators. Having inherited an inadequate infrastructure andbudget and with little capacity to earn revenue, such local govern-ments have no prospect of financing a strengthened and expandedECD program from their own resources, even if they wish to do so.Because the 1991 devolution was not designed to correct for exist-ing inequities in infrastructure and access to services, it would nowseem appropriate for the central government to finance a largeshare of incremental program expenditures and then gradually re-duce its share as the local government’s ability to pay increasedover time. At the same time, public policy must recognize that thelocal government’s ability to pay cannot grow fast enough to ab-sorb more than a portion of recurrent program costs at the end ofsix years. In this case, there is a rationale for continued centralgovernment subvention to sustain ECD activities over the mediumand long terms on cost-benefit, externality, and equity grounds.
At the other extreme might be the well-off city that is able to paymost of the costs of an expanded ECD program but chooses not todo so in favor of spending on other sectors. Because of the nationalimportance of the ECD program, it would seem appropriate for thecentral government to use advocacy, including cost-effectivenessdata, to persuade the local government to invest in the sector, andto offer matching funds as a means of encouragement. At the sametime, central funding should be conditional on the local govern-ment’s significantly increasing over time its share of total spendinggoing to ECD so that central spending did not simply substitute forthe local government’s obligations.
Most local governments in the Philippines fall between these ex-tremes, having some understanding of the value of ECD invest-ment, although an imperfect concept of what ECD entails, andhaving a significant ability to cost-share on an increasing basisover time, although not enough resources to pay for a strengthenedand expanded program in the short term. Here it would seem appro-priate to divide these local governments into different wealth classesand to decide, for each wealth class, an appropriate year-one costshare, year-six cost share, and rate of increase in cost-sharing. A
F I N A N C I N G E A R L Y C H I L D H O O D D E V E L O P M E N T 157

fairly simple matrix showing changing cost shares over time bywealth class could be developed, which could then become a uni-form and transparent basis for financing negotiations between cen-tral and local governments. However, local governments wouldneed to be convinced that the basis of such a cost-sharing matrixwas equitable, and this would require better data on ability to pay.
Aside from directly financing the costs of ECD interventions, lo-cal governments could also be the agents for implementing ECDcost recovery measures involving user contributions, voluntarycommunity contributions, and NGO contributions. If a local govern-ment’s total ability to pay is defined in terms of its own actual andpotential revenues, plus the extent of households with some meansto pay for ECD services, plus the presence of NGOs with some capac-ity to finance ECD services, then it may be possible to define localgovernments’ cost shares on the basis of their overall capacity tomobilize all these sources of financing.
THE CENTRAL GOVERNMENT. As indicated above, financing fromthe central government is needed to help meet the gap betweenestimated costs and available resources. The central governmentshould fill a proportion of the financing gap in the short term whilelocal governments’ revenues and ability to pay grow. It should filla large proportion of the financing gap over the long term for verypoor local governments with very limited prospects for revenuegrowth. And it should provide matching financing to stimulateincreased local financing for ECD and ensure that local govern-ments that underspend reach a target level of spending on ECD as apercentage of their overall spending. The mechanism for imple-menting each of these roles would be the negotiation of the ChildDevelopment Program Agreements proposed in Chapter 4.
Unfortunately, it is impossible to estimate how much central fi-nancing is needed for ECD without empirical work on local govern-ments’ ability to pay. Assuming, for the sake of discussion, thatcentral financing may be required to fill 60 to 80 percent of thefinancing gap, this would imply a need for P6 billion to P8 billion($214 million to $285 million) over six years, or up to P1.3 billion toP1.8 billion ($46 million to $64 million) a year, based on the pro-posed program’s sixth-year incremental recurrent cost require-ments. The central government has several options for sourcing itscontribution to the ECD program: line agency budgets withinplanned ceilings for ECD; reallocations within line agency budgetswithin the planned departmental budget ceiling; or increments toline agency budgets. The increments in turn could be financed
158 I M P R O V I N G E A R L Y C H I L D H O O D D E V E L O P M E N T

from interdepartmental budget reallocation, external aid, orincreases in overall government spending. Although additionalgovernment spending on ECD is strongly justified in cost-benefitterms, for macroeconomic reasons recourse to additional govern-ment spending may be difficult and should be a last resort afterother options have been explored.
There is a sharp contrast between the likely ability to pay of theDepartment of Health and the Department of Social Welfare andDevelopment. The Department of Health was several times the sizeof the Department of Social Welfare and Development before devo-lution and has had significant budget increases since devolution,leaving it with a 1994 budget of more than P7 billion. The Depart-ment of Health’s Five-Year Investment Plan contains a tentativeallocation of about P5 billion for ECD. The Department of SocialWelfare and Development, by contrast, lost most of its resources atthe time of devolution and has had only small budget increasessince then; its 1994 budget of about P0.76 billion contained negli-gible expenditure for centrally financed investment projects, andits current budget ceiling will not permit significant investment inearly education or in replacing resources lost to the nutrition pro-gram by the withdrawal of PL 480 resources. Financing of astrengthened ECD program would therefore imply a substantial in-crease in the Department of Social Welfare and Development’sbudget ceiling; whether this would also be required for the Depart-ment of Health is unclear.
The potential for sourcing increased resources for ECD from real-location within government budgets is substantial. Manasan andLlanto (1994) calculated the potential for raising additional reve-nues for health, nutrition, and education through reallocation (aswell as other measures, such as more effective tax collection, whichare outside the scope of this book). Within departmental budgets,the measures they analyzed included a reduction in the overheadexpenditures of the Department of Health’s central staff and theimposition of user charges for hospital care (together yielding upto P900 million a year, some of which could be reallocated to ECD),and a reduction in the Department of Social Welfare and Develop-ment’s administrative overhead (yielding up to P100 million ayear). Across departmental budgets, there is the potential to reallo-cate more than P1 billion from the National Food Authority’sgeneralized food subsidy. A very strong case can be made for real-locating these National Food Authority funds into child nutrition,because these resources are already allocated for nutrition but arenot being effectively spent.
F I N A N C I N G E A R L Y C H I L D H O O D D E V E L O P M E N T 159

DONORS. It will take time for local government revenues to growand absorb an increasing share of ECD program costs and for thecentral government to agree on and implement intra- and inter-departmental resource allocation measures. In the interim, the cen-tral government would be faced with a sharp increase in ECDprogram expenditures, which could be met partly through in-creased commitments of foreign aid. Most bilateral and multilat-eral donors have accorded increased priority to social sectorinvestments in recent years. However, few of the major donors tothe Philippines are currently allocating significant funds to childdevelopment, despite its high returns. If the government were todemonstrate high-level commitment to integrating, strengthening,and expanding the ECD program, a strong case could be made tothe donor community to review their sectoral resource allocationsand increase their support for ECD.
It would be desirable for increased donor commitments for ECDto contain as large an element of grant financing as possible. Itwould also be desirable for donor financing to be packaged on aconsortium basis, in the form of a single large project in support ofthe national ECD program. This would assist the government indeveloping a consistent national ECD strategy and program. Itwould also have administrative advantages, which have becomeespecially important in the managerially complex postdevolutioncontext, because it would permit the central government to negoti-ate with local governments a single program (with built-in flexibil-ity) rather than a fragmented set of projects following differentprocurement, disbursement, monitoring, and reporting procedures.
Data Requirements
Although the central government can begin to develop the frame-work for a central government–local government cost-sharing pol-icy based on the general considerations outlined above, developinga specific cost-sharing matrix as a basis for negotiating agreementscan be done only after more data are collected on what local gov-ernments currently spend on ECD, and how willing they are to payfor a strengthened ECD program. A desk review of existing data inthis area is being carried out. This review is likely to conclude thatexisting data are inadequate. If so, the review’s findings would beused to develop recommendations for the design of a field surveyof ability and willingness to pay. This survey would need to beundertaken simultaneously with the development of detailed pro-posals for investments in the ECD program.
160 I M P R O V I N G E A R L Y C H I L D H O O D D E V E L O P M E N T

Conclusions
The Philippines is now spending about P195 ($7.80) a preschooleron ECD, an amount that without further investment will fall toabout P150 ($5.90) a child as existing child survival projects cometo an end and donor support for the PL 480 nutrition program isphased out. To achieve the national goals for children, it is esti-mated that the nation should be investing about $11 a child—anincrease of about 40 percent. The total increment required over asix-year period is estimated at about P10 billion (about $400 mil-lion), with an incremental recurrent cost requirement of about P1.5billion to P2 billion ($54 million to $71 million) a year for five to tenyears.
Although responsibility for ECD has been devolved to local gov-ernments, most provinces and municipalities are not able tostrengthen and expand their programs, because the funds de-volved to them are essentially sufficient only to maintain their pre-devolution infrastructure and recurrent spending, which areinadequate. There is a strong case for continued central govern-ment support for ECD on the grounds of cost-effectiveness, marketfailure, and equity. However, it is essential to devise a cost-sharingpolicy that will ensure that support from the central governmentdoes not simply substitute for efforts that local governments andcommunities could otherwise make. Local governments shouldtherefore be asked to pay for an increasing share of ECD programcosts over time, as their revenues grow. The size of this shareshould vary with the local government’s ability to pay and its ECDneeds. Cities, which did well from devolution, can pay a higherproportion. But it must be recognized that there will be a need forlong-term central support for very poor municipalities with badECD indicators if the ECD program is to be sustained over the me-dium and long terms.
Much of the central financing required of the Department ofHealth can be raised within planned departmental budget ceilings.The Department of Social Welfare and Development, however,would require an increased ceiling to finance the strengtheningand expansion of the day care center program. Reallocation of re-sources within and between government departments could alsofree up substantial additional funds for ECD, if this is designated asa national priority. With the upcoming withdrawal of PL 480 sup-port, a particularly strong case can be made for reallocating expen-ditures by the National Food Authority for food subsidies into aneffective nutrition program for children. However, budget realloca-
F I N A N C I N G E A R L Y C H I L D H O O D D E V E L O P M E N T 161

tions are politically difficult and will take time. Time is also re-quired for local government revenues to grow to a point wherelocal governments can sustain an increasing share of the ECD pro-gram. In the interim, foreign aid could help to fill the financinggap. The donor community is putting few resources into ECD; astrong case could be made for donors to substantially increase theircommitments if the government decides that reorienting andstrengthening the ECD program is a national priority.
Note
1. “Magna carta” is the name given by the government of the Philippines for a specificpackage of benefits that was awarded by the central government to health field staff, butthat has not always been paid by the local governments after devolution.
162 I M P R O V I N G E A R L Y C H I L D H O O D D E V E L O P M E N T

108
Table 4-1. Proposed Services for Early Childhood Development at Different Stages of Life
Stage Health Nutrition Early education
Pregnancy Immunization against tetanusSupplementation with ironPrenatal care and instructionIdentification and referral of high- risk pregnancies
Arm bandingNutrition educationSupplementation With iodine (ending 1995) With caloriesa
Education on childcareProtecting child from dangerEncouraging child’s attachment with adultsProviding motor and sensory stimulation
Infancy Newborn careImmunizationTreatment Of diarrhea Of acute respiratory infectionEducation About malaria About acute respiratory infection
Education On breastfeeding On weaningGrowth monitoring and promotionSupplementation With vitamin A With irona
With caloriesa
As above
Ages 2–3 In addition to above, parasite controla
Growth monitoring and promotionSupplementation With vitamin A With irona
With caloriesa
In addition to above, child development In thinking skills In independence In self-control In play
Ages 4–6 As above Growth monitoring and promotionSupplementation With vitamin A With irona
In addition to above, child development In fine motor skills In language skills In cooperation and sharing In prewriting and reading skills
a. If required.

138
Table 5-1. Public Spending Budgeted for Key Early Childhood Health Programs in the Philippines, 1994(millions of pesos)
Program
Depart-ment ofHealth
Localgovern-
ment
UnitedNations
Children’sFund
U.S.Agency
for Inter-nationalDevelop-
ment
WorldHealth Organi-zation
PhilippineHealth
Develop-ment
Project
CanadianInter-
nationalDevelop-
mentAgency
RotaryClub
Australian Inter-
nationalDevelop-
mentAssistance
Bureau
UrbanHealth
andNutrition
Project Total
Expanded Pro- gram on Immunization 399.3 119.7 13.3 13.7 1.9 0.0 27.4 34.2 6.8 0.0 616.3Control of diarrheal diseases 47.4 29.9 4.4 3.4 0.6 0.0 0.0 0.0 0.0 0.0 85.7Control of acute res- piratory infections 53.7 18.5 4.8 8.8 1.3 9.0 0.0 0.0 0.0 2.9 98.9Control of infectious diseases 12.6 0.0 0.0 0.0 0.0 0.0 0.0 0.0 0.0 0.0 12.6Disease surveillance 62.0 0.0 0.0 4.8 0.0 0.0 0.0 0.0 0.0 0.0 66.8
Total 575.0 168.1 22.5 30.8 3.7 9.0 27.4 34.2 6.8 2.9 880.3
Source: World Bank and ADB data. See Section K of the supplement volume.

144
Table 5-4. Health Program: Estimated Costs, Resources Available, and Financing Gap, Philippines, 1994–99(millions of pesos)
1994 1995 1996 1997 1998 1999 Total
Expanded Program on Immunization 312.8 362.1 437.6 479.5 502.0 469.5 2,563.4Control of acute respiratory infections 98.9 104.7 101.1 96.9 95.6 99.5 596.7Control of diarrheal diseases 109.8 106.4 94.0 93.6 94.8 96.2 594.7Polioa 213.9 210.1 120.0 122.3 124.8 127.3 918.4Neonatal tetanusa 240.1 239.8 213.9 215.5 217.1 218.1 1,344.5Measlesa 132.3 129.6 88.5 90.5 92.6 94.7 628.2Infectious diseases 26.5 26.5 26.5 26.5 26.5 26.5 158.7Disease surveillance 228.1 54.1 53.5 52.0 52.0 53.5 493.2Joint cost savings –36.0 –33.9 –26.9 –24.5 –24.9 –23.6 –169.9Total resources required 1,326.3 1,199.3 1,108.0 1,152.3 1,180.5 1,161.6 7,128.0Available resources 880.3 742.9 699.4 701.3 708.1 700.7 4,432.6Financing gap 445.9 456.4 408.7 451.0 472.4 460.9 2,695.3 Magna carta gapb 0.0 147.8 151.2 154.6 158.2 161.8 773.6 Remaining gap 445.9 308.7 257.5 296.4 314.2 299.0 1,921.8
a. The additional costs to meet the reduction and eradication goals are shown here separately from the routine costs for the Expanded Program onImmunization.
b. The difference between what local governments are theoretically obligated to pay (from the start of 1995) for a recently negotiated, so-called magnacarta, benefit package for fieldworkers and what the local governments are able to pay; the central government has no obligation to help meet this gap.
Source: World Bank and ABD data. See Section K of the supplement volume.

147
Table 5-6. Nutrition Program: Estimated Costs (Low Estimate), Resources, and Financing Gap, Philippines, 1994–99(millions of pesos)
1994 1995 1996 1997 1998 1999 Total
Micronutrient supplementation 503.4 514.8 525.7 537.4 549.3 561.5 3,192.2PEM control Equipment 10.0 10.0 10.0 10.0 10.0 10.0 60.0 Allowances for child development workers 46.9 93.8 140.8 187.7 234.6 281.5 985.4 Supplementary food 78.1 156.3 234.4 312.6 390.7 468.8 1,640.9 Training, IEC, monitoring and evaluation 51.5 51.5 51.5 51.5 51.5 51.5 308.8Total resources required 690.0 826.4 962.4 1,099.1 1,236.1 1,373.3 6,187.3Available resources 853.9 447.9 413.1 427.1 444.2 364.8 2,951.0
Financing gap 0.0 378.5 549.3 672.0 791.9 1,008.6 3,400.3 Magna carta gapa 0.0 75.0 77.0 79.0 80.0 82.0 393.0 Remaining gap 0.0 303.5 472.3 593.0 711.9 926.6 3,007.3
Note: Low estimate: supplementary food costs are calculated at P2 (about $0.07) for each child-ration, with supplements being received by, on average,18 percent of the children and 25 percent of pregnant women. PEM is protein-energy malnutrition; IEC is information, education, and communication.
a. See the note to Table 5-4.Source: World Bank and ADB data. See Section K of the supplement volume.

148
Table 5-7. Nutrition Program: Estimated Costs (High Estimate), Resources, and Financing Gap, Philippines, 1994–99(millions of pesos)
1994 1995 1996 1997 1998 1999 Total
Micronutrient supplementation 503.4 514.8 525.7 537.4 549.3 561.5 3,192.2PEM control Equipment 10.0 10.0 10.0 10.0 10.0 10.0 60.0 Allowances for child development workers 46.9 93.8 140.8 187.7 234.6 281.5 985.4 Supplementary food 122.3 244.6 366.9 489.2 611.5 733.8 2,568.4 Training, IEC, monitoring and evaluation 51.5 51.5 51.5 51.5 51.5 51.5 308.8Total resources required 734.1 914.7 1,094.9 1,275.8 1,456.9 1,638.3 7,114.7Available resources 853.9 447.9 413.1 427.1 444.2 364.8 2,951.0
Financing gap 0.0 466.8 681.8 848.7 1,012.7 1,273.6 4,283.6 Magna carta gapa 0.0 75.0 77.0 79.0 80.0 82.0 393.0 Remaining gap 0.0 391.8 604.8 769.7 932.7 1,191.6 3,890.6
Note: High estimate: supplementary food costs are calculated at P2.40 (about $0.09) for each child-ration, with supplements being received by, onaverage, 25 percent of the children and 30 percent of pregnant women. PEM is protein-energy malnutrition; IEC is information, education, andcommunication.
a. See the note to Table 5-4.Source: World Bank and ADB data. See Section K of the supplement volume.

150
Table 5-8. Early Education Program: Estimated Costs, Resources, and Financing Gap, Philippines, 1994–99 (millions of pesos)
1994 1995 1996 1997 1998 1999 Total
Existing system Allowances for day care workers 123.0 123.0 123.0 123.0 123.0 123.0 738.0 Salaries of social welfare officers 46.0 46.0 46.0 46.0 46.0 46.0 275.7 Subtotal 169.0 169.0 169.0 169.0 169.0 169.0 1,013.7 Improvements in quality Rehabilitation of day care centers 6.2 6.2 0.0 0.0 0.0 0.0 12.3 Strengthening of training institutions 5.4 4.6 4.6 4.6 4.6 4.6 28.4 Training of social welfare officers and early education trainers 8.0 0.0 0.0 5.8 0.0 0.0 13.8 Training of day care workers 16.0 0.0 0.0 6.7 0.0 0.0 22.7 Salaries of new early education trainers 91.9 91.9 91.9 91.9 91.9 91.9 551.5 Topping up of allowances for additional day care workers 73.8 73.8 73.8 73.8 73.8 73.8 442.8 Learning materials and maintenance 81.7 20.1 20.0 81.7 20.0 20.0 243.7 Parent effectiveness materials 0.3 0.3 0.3 0.3 0.3 0.3 1.8 Subtotal 283.2 196.9 190.7 264.8 190.7 190.7 1,317.0 System expansion Day care centers Construction, furnishings, and materials 197.9 197.9 197.9 197.9 197.9 197.9 1,187.6 Allowances for new day care workers 21.1 42.3 63.4 84.6 105.7 126.9 444.0 Training of new day care workers 1.7 1.7 1.7 3.1 3.1 3.1 14.6 Teaching supplies and maintenance 11.0 21.9 32.9 43.9 54.8 65.8 230.3 Home-based centers Home upgrading 0.0 33.7 33.7 33.7 33.7 33.7 168.6 Allowances 0.0 32.4 64.7 97.1 129.5 161.8 485.5 Training 0.0 5.3 5.3 5.3 8.9 8.9 33.6 Start-up materials 0.0 5.1 5.1 5.1 5.1 5.1 25.3 Recurrent materials 0.0 0.0 1.7 3.3 5.0 6.6 16.5 Subtotal 231.8 340.3 406.4 474.0 543.8 609.9 2,606.1
Total resources required 683.9 706.1 766.1 907.7 903.4 969.5 4,936.8 Available resources 373.1 218.8 214.2 215.1 214.9 214.9 1,451.0 Financing gap 310.9 487.3 551.8 692.6 688.5 754.6 3,485.8
Source: World Bank and ADB data. See Section K of the supplement volume.

Bibliography
The word “processed” describes informally reproduced works thatmay not be commonly available through library systems.
Abella, Carmencita, Jaime Tan, Norbert Hirschhorn, and ChrisHermann. 1991. “The Child Survival Program Mid-Term Evalu-ation.” USAID, Asia Bureau, Washington, D.C. Processed.
Adair, Linda S. 1992. “Postpartum Nutritional Status of FilipinoWomen.” University of North Carolina at Chapel Hill, School ofPublic Health, Department of Nutrition. Processed.
Adair, Linda S., and Ernesto Pollitt. 1985. “Outcome of MaternalNutrition Supplementation: A Comprehensive Review of theBacon Chow Study.” American Journal of Clinical Nutrition 41:948–78.
Adair, Linda S., and Barry M. Popkin. 1992. “Prolonged LactationContributes to Depletion of Maternal Energy Reserves in FilipinoWomen." University of North Carolina at Chapel Hill, School ofPublic Health, Department of Nutrition, and The Carolina Popu-lation Center. Processed.
Alano, Jr., Bienvenido P., Aurora S. Villarosa, Belinda P. Alano,Milagros F. Silva, Rhais M. Gamboa, and Antonio O. Periquet.1993. “Cost Estimates of the Philippines’ Mid-Decade Goals.”Corporate Assistance and Resource Associates, Inc., Manila.Processed.
Balisacan, Arsenio M. 1993. “Design of a Poverty-Targeted FoodSubsidy Program in the Philippines.” Development Alternatives,Inc.; C. E. Virata and Associates; John Mellor and Associates; andthe Asian Institute of Management in association with Chemon-ics International; Louis Berger International, Inc.; and AccessAsia, Manila. Processed.
Barba, Corazon V., Adelisa C. Ramos, and Raymundo CelestinoF. Habito, Jr. 1990. “Growth Monitoring: Interpretation ofGrowth Curves.” Department of Health Nutrition Service, Manila.Processed.
163

Barker, D. J. P., ed. 1992. “Fetal and Infant Origins of Adult Dis-eases.” British Medical Journal.
Barth, Gerald A. 1983. “Street Foods: Informal Sector Food Prepara-tion and Marketing in the Philippines.” Equity Policy Center,Manila. Processed.
Bautista, Victoria A., ed. “Public Administration Bulletin.” Univer-sity of the Philippines, College of Public Administration, Centerfor Policy and Administrative Development, Manila. Processed.
Beaton, G. H., and Rae Mortorell. 1993. Effectiveness of Vitamin ASupplementation in the Control of Young Child Morbidity and Mor-tality in Developing Countries. ACC/SCN Nutrition Policy Discus-sion Paper 13. New York: United Nations.
Behrman, Jere R. 1992. The Economic Rationale for Investigating Nu-trition in Developing Countries. Washington, D.C.: USAID.
Bhargava, Alok. n.d. “Modelling the Health of Filipino Children.”University of Houston, Department of Economics. Processed.
Bisgrove, Eilene Z., Barry M. Popkin, and Corazon Barba. 1991.“Profiling Infant-feeding Patterns in Cebu, Philippines.” Univer-sity of North Carolina, at Chapel Hill, Carolina Population Cen-ter. Processed.
Black, Maggie. 1991. Philippines: Children of the Runaway Cities.Florence: UNICEF, International Child Development Centre.
Bondad, Myra P., and Adelisa C. Ramos. 1990. “Systems Analysisof Operation Timbang.” Department of Health Nutrition Service,Manila. Processed.
Bouis, Howarth E. 1990. “Evaluating Demand for Urban and RuralPopulations in the Philippines: Implications for Nutrition Policyunder Economic Recovery.” World Development 18(2):281–99.
Bouis, Howarth E., Laurence Haddad, and Eileen Kennedy. 1992.“Does It Matter How We Survey the Demand for Food? Evidencefrom Kenya and the Philippines.” Food Policy (October): 349–60.
Briend, Andre, and Abdul Bari. 1989. “Critical Assessment of theUse of Growth Monitoring for Identifying High-Risk Children inPrimary Health Care Programmes.” British Medical Journal 298:1611–14.
Cervinskas, J., N. M. Gerein, and S. George. 1992. “Growth Promo-tion for Child Development: Proceedings of a Colloquium Heldin Nyeri, Kenya, 12–13 May 1992.” International DevelopmentResearch Center, Ottawa. Processed.
Chandra, Ranjit Kumar. 1991. “Nutrition and Immunity: Lessonsfrom the Past and New Insights into the Future.” American Jour-nal of Clinical Nutrition 53:1087–1101.
Chavez, A., and C. Martinez. 1981. “School Performance of Supple-mented and Unsupplemented Children from a Poor Rural Area.”
164 B I B L I O G R A P H Y

In A. E. Harper and K. Davis, eds., “Nutrition in Health andDisease and International Development: Symposia from the XIIInternational Congress on Nutrition.” Progress in Clinical and Bio-logical Research. Vol. 77. New York: Alan R. Liss.
______. 1982. Growing Up in a Developing Community. Guatemala City,Guatemala: Institute of Nutrition of Central America and Panama.
Chavez, A., C. Martinez, and B. Soberanes. 1992. “A 24-Year Studyof Well-Nourished and Malnourished Children Living in a PoorMexican Village.” In Longitudinal Country Nutrition and HealthResearch. Boston: INFDC.
Child and Youth Research Center. 1988. “Impact Evaluation of theEarly Childhood Enrichment Program, 1983–1987.” Quezon City.Processed.
Congress of the Philippines. 1986. “The Child and Youth WelfareCode: Presidential Decree No. 603 (As Amended).” Manila.Processed.
Dargent-Molina, Patricia, S. A. James, D. A. Strogatz, and D. A.Santz. 1994. “Association between Maternal Education and InfantDiarrhea in Different Household and Community Environmentsof Cebu, Philippines.” Social Science and Medicine 38(2): 343–50.
Dawson, Susan, and Mila Mates. 1991. The Application of Quantita-tive Research Methods (RAP) in the Investigation of Community-BasedHealth Management and Community Health Worker Sustainability in12 Rural Villages, Panay Island, Philippines. Iloilo Field Office,Philippines: Save the Children Federation (U.S.A.).
Doan, Rebecca Miles, and Barry M. Popkin. 1992. “Women’s Workand Infant Care in the Philippines.” Institute for Health and Hu-man Services Research, Tallahassee, Fla. Processed.
Eveleth, P., and John Tanner. 1976. Worldwide Variation in HumanGrowth. International Biological Program 8. Cambridge: Cam-bridge University Press.
Florencio, Cecilia A. 1980. “Household Behavior: The Nutritionists’Perspective.” In Hans Bingswanger, ed., Rural Household Studiesin Asia. Singapore University Press.
______. 1987. “The Academic Achievement of Elementary SchoolPupils and Biological, Educational, and Familial Factors (Focuson Nutrition).” University of the Philippines, Department of Nu-trition, Manila. Processed.
______. 1989a. Food and Freedom. Quezon City: University of thePhilippines Press.
______. 1989b. “The Nutritional Welfare of Filipinos and the Philip-pine Food and Nutrition Program.“ University of the Philip-pines, Center for Integrative and Development Studies, QuezonCity. Processed.
B I B L I O G R A P H Y 165

Florencio, Cecilia A., Azucena B. Limbo, Alma M. Jose, andEmiliana M. Manago, eds. 1993. Food, Nutrition, and Health Pro-motion: Directory of Institutions and Resource Persons in the Philip-pines. Quezon City: ASEAN.
Florentino, Rodolpho F., G. M. Villavieja, J. P. Boquecosa, and F. F.Bacos. “The Nutrition Situation in Metro Manila.” Food and Nu-trition Research Institute, Department of Science and Technol-ogy, Manila. Processed.
Fogel, Robert W. 1994. “Economic Growth, Population Theory, andPhysiology: The Bearing of Long-term Processes on the Makingof Economic Policy.” The American Economic Review 84 (June,3):369–95.
Garcia, Marito, and Per Pinstrup-Andersen. 1987. “The Pilot FoodPrice Subsidy Scheme in the Philippines: Its Impact on Income,Food Consumption, and Nutritional Status.” Research Report 61.International Food Policy Research Institute, Washington, D.C.Processed.
Ghassemi, Hossein. 1992. “Supplementary Feeding in Programmesin Developing Countries: Lessons of the 1980s.” Asia Pacific Jour-nal of Clinical Nutrition 1:131–52.
Gillespie, Stuart, John Kevany, and John Mason. 1991. ControllingIron Deficiency. ACC/SCN Nutrition Policy Discussion Paper 9.New York: United Nations.
Gillespie, Stuart, and John Mason, eds. 1994. Controlling Vitamin ADeficiency. ACC/SCN Nutrition Policy Discussion Paper 14. NewYork: United Nations.
Glewwe, Paul, and Hanan Jacoby. 1993. Delayed Primary School En-rollment and Childhood Malnutrition in Ghana: An Economic Analy-sis. LSMS Working Paper 98. Washington, D.C.: World Bank.
Goertzen, Donald. 1991. “Rural Development to Counter Commu-nists: The Silent War.” Far Eastern Economic Review 23 (August).
Greenspan, Allison. 1992. “Poverty in the Philippines: The Impactof Family Size.” Asia-Pacific Population and Policy 21 (June).
Haddad, Laurence, and Howarth E. Bouis. 1991. “The Impact ofNutritional Status on Agricultural Productivity: Wage Evidencefrom the Philippines.” Oxford Bulletin of Economics and Statistics53(1, February):45–68.
Harmatz, Zvi. 1993. “Investment Strategy for an ORT/EC Community-Based Project, Province of La Union, Philippines.” Organizationfor Educational Resources and Technological Training, MetroManila. Processed.
Hernandez, Jose Rafael S. 1993. “Social Marketing Communica-tions: Its Contribution to the Philippine Child Survival Pro-
166 B I B L I O G R A P H Y
gram.” Republic of the Philippines, Department of Health, ChildSurvival Program, Manila. Processed.
HEWSPECS (Health, Education, and Welfare Specialists, Inc.). 1994.“Early Childhood Development in the Philippines.” Manila.Processed.
Horton, Susan. 1988. “Birth Order and Child Nutritional Status:Evidence from the Philippines.” Economic Development and Cul-tural Change 36(2):341–54.
Information Nutrition Action Foundation, Inc. 1994. “CommunityDevelopment to Combat Childhood Malnutrition in Urban PoorCommunities.” Manila. Processed.
Kelly, Alan, and John Kevany. 1994. Maternal Anthropometry andPregnancy Outcomes: A WHO Collaborative Project for Meta-Analysis.Dublin: Trinity College, Department of Community Health andGeneral Practice.
Klein, R. E., C. Yarbrough, R. E. Lasky, and J. P. Habicht. 1974.“Correlations of Mild to Moderate Protein-Malnutrition amongRural Guatemalan Infants and Preschool Children. In J. Cravioto,L. Hambraeus, and B. Vahlquist, eds. Early Malnutrition and Men-tal Development. Uppsala, Sweden: Almquist and Wiksell.
Knudsen, Odin K. 1981. The Economics of Supplemental Feeding ofMalnourished Children: Leakages, Costs, and Benefits. World BankStaff Working Paper 451. Washington D.C.: World Bank.
Krasovec, Katherine, and Mary Ann Anderson, eds. n.d. “MaternalNutrition and Pregnancy Outcomes: Anthropometric Assessment.”Proceedings of the meeting Maternal Anthropometry for Predictionof Pregnancy Outcomes held under the joint sponsorship of theUnited States Agency for International Development, MotherCare,Pan American Health Organization, and World Health Organiza-tion. Washington, D.C., 23–25 April 1990. Processed.
Lenniger, Beryl. 1992. Nutrition, Health, and Learning: Current Issuesand Trends. Newton, Mass.: Educational Development Center.
Levin, Henry M., Ernesto Pollitt, Rae Galloway, and JudithMcGuire. 1993. “Micronutrient Deficiency Disorders.” In Dean T.Jamison, W. Henry Mosley, Anthony R. Measham, and Jose LuisBobadilla, eds., Disease Control Priorities in Developing Countries.New York: Oxford University Press.
Loevinsohn, Benjamin P. 1993. “Setting Quantitative Objectives inHealth Sector Programs: Lessons Learned from the PhilippineChild Survival Programs.” Republic of the Philippines, Depart-ment of Health, Child Survival Program, Manila. Processed.
Manasan, R. G., and G. M. Llanto. 1994. “Financing Social Pro-grams in the Philippines: Public Policy and Budget Restructur-
B I B L I O G R A P H Y 167

ing.” Philippines Institute of Development Studies, Manila. Proc-essed.
Maria, Manuel O. 1993. “The Field Health Services InformationSystem: Its Role in Decentralizing Health Services in the Philip-pines.” Republic of the Philippines, Department of Health, ChildSurvival Program, Manila. Processed.
Martorell, Ray. 1992. “Overview of Long-Term Nutrition Interven-tion Studies Carried Out in Guatemala, 1968–1988.” Food and Nu-trition Bulletin 14:270–77.
Martorell, Ray, J. Rivera, H. Kaplowitz, and Ernesto Pollitt. 1992.“Long-Term Consequences of Growth Retardation during EarlyChildhood.” In M. Hernandez and J. Argente, eds., HumanGrowth: Basic and Clinical Aspects. Elsevier Press.
Martorell, Ray, and Nevin Scrimshaw. 1995. “The Effects of Im-proved Nutrition in Early Childhood: The Institute of Nutritionof Central America and Panama (INCAP) Follow-up Study.” TheJournal of Nutrition 25(45, April supplement).
McKay, H., L. Sinisterra, A. McKay, H. Gomez, and P. Loreda.1978. “Improving Cognitive Ability in Chronically DeprivedChildren.” Science 200:270–78.
Mingat, Alain, and Jee-Peng Tan. 1995. “Do Preschool ProgramsImprove Elementary School Outcomes? Evidence from the Phil-ippines.” World Bank, Human Development Department, Wash-ington, D.C. Processed.
Mora, J. O., M. G. Herrera, and S. G. Sellers. 1981. “Nutrition, So-cial Environment, and Cognitive Performance of DisadvantagedColombian Children at Three Years.” In Nutrition in Health andDisease and International Development. Symposia from the 12th In-ternational Congress on Nutrition. New York: Alan R. Liss.
Myers, R. G. 1992. The Twelve Who Survive. London and New York:Routledge.
National Task Force on Social Mobilization/Partners in Research,Training, and Community Organization. n.d. “A Review of Exist-ing Policy Statements and Legislation Related to Child Survivaland Development.” Processed.
Nutrition Foundation, Inc. 1993. “Joint Micronutrient Mission tothe Philippines: A Needs Assessment and Policy Formulation Ex-periment to Improve Micronutrient Malnutrition.” Submitted tothe USAID, Office of Nutrition, Washington, D.C. Processed.
Orihuela-Egoanil, Emilia. 1993. “Programmes de Nutrition en MilieuRural aux Philippines.” Social Science and Medicine 37(8):995–1003.
Pearson, Roger. 1995. Thematic Eradication of UNICEF Support toGrowth Monitoring. Evaluation and Research Working Paper 2.New York: UNICEF.
168 B I B L I O G R A P H Y

Pelletier, David. 1994. “The Relationship between Child Anthro-pometry and Mortality in Developing Countries: Implications forPolicy, Programs, and Future Research.” The Journal of Nutrition124(105, October supplement):2047s–2081s.
Pelletier, David L., E. A. Frongillo, D. G. Schroeder, and J. P.Habicht. 1994a. “The Effects of Malnutrition on Child Mortalityin Developing Countries.” Cornell University, Cornell Food andNutrition Policy Program, Ithaca, N.Y. Processed.
______. 1994b. “A Methodology for Estimating the Contribution ofMalnutrition to Child Mortality in Developing Countries.” TheJournal of Nutrition 124(105, October supplement):2106s–2122s.
Pelletier, David L., and Roger Shrimpton. 1994. “The Role of Infor-mation in the Planning, Management, and Evaluation of Com-munity Nutrition Programmes.” Health Policy and Planning 9(2):171–84.
Perlas, Leah, M. D. Kuizon, R. T. Tajaon, and J. A. Desmacido.1992. “Iron Status of Pregnant Filipino Women as Measured bySerum Ferritin.” Southeast Asian Journal of Tropical Medicine andPublic Health 23(4):691–97.
Philippine Institute of Development Studies. 1993. “A Strategy toFight Poverty.” Paper prepared for the Presidential Commissionto Fight Poverty. Manila. Processed.
Philippines, Government of the. n.d. “Directory of Non-Govern-ment Organizations in the Philippines.” National Economic andDevelopment Authority. Manila. Processed.
______. 1991. Education for All: A Philippine Plan of Action 1991–2000. Vol. 1, Plan Document; Vol. 2, Programs and Projects.Manila: The National Committee on Education for All.
______, Council for the Welfare of Children. 1993. “Data on Chil-dren.” Manila. Processed.
______, ______. n.d. “The Filipino Children: 2000 and Beyond,Philippine Plan of Action for Children.” Manila. Processed.
______, Department of Health. 1991a. Integrating Services for Moth-ers and Children. Manual No. 1: General Guidelines. Manila:Department of Health, Child Survival Program.
______, ______. 1991b. Process-Oriented Management Reporting Sys-tem for the Partnership for Community Health Development. Im-plementation Manual, 1st ed. Manila: Community HealthService.
______, ______. n.d. “DOH Nutrition Polices and Strategies 1992–1996.” Manila. Processed.
______, ______. n.d. “DOH Plan of Action for the Survival, Develop-ment , and Protect ion of Phi l ippine Children.” Manila .Processed.
B I B L I O G R A P H Y 169

______, ______, Nutrition Service. 1990. A Compilation of Abstracts ofStudies and Researches. Manila: Department of Health and HelenKeller International.
______, ______, ______. 1991. “Community-Based Planning andManagement of Nutrition Program. Rural Health Unit, Trainer’sGuide—Modules 4–7.” Manila. Processed.
______, Department of Social Welfare and Development. n.d.“Guidelines for the Local Government Units in the Formulationof Social Welfare and Community Development Plans, Policies,and Programs at the Local Level.” Manila. Processed.
______, FNRI (Food and Nutrition Research Institute), Departmentof Science and Technology. 1994. “The Nutritional Status of Fili-pino Children Using the International Growth Reference.” Manila.Processed.
______, ______. Annual. Annual Report. Manila.______, Food and Nutrition Research Institute, Department of Sci-
ence and Technology, and Enfants et Developpement. 1989. “Nu-trition Survey of Selected Depressed Barangays in Navotas,Metro Manila.” Manila. Processed.
______, National Nutrition Council. 1987. “Philippine Food andNutrition Program.” Metro Manila. Processed.
______, ______. 1993a. “NNC Infokit.” Makati, Metro Manila. Processed.______, ______. 1993b. “Philippine Plan of Action for Nutrition:
Medium-Term Philippine Food and Nutrition Plan (1993–1998).”Metro Manila. Processed.
______, National Statistics Office. 1994. “Philippines National SafeMotherhood Survey 1993.” Draft report. Demographic andHealth Surveys, Macro International. Manila. Processed.
Philippines, Government of the, and UNICEF. 1992. “Programmeof Cooperation for Child Survival, Protection, and Developmentin the Philippines—Master Plan of Operations between theGovernment of the Philippines and UNICEF 1994–1998.” Manila.Processed.
______. 1993a. “Filipino Children at the Crossroads: Opportunitiesfor Funding.” Manila. Processed.
______. 1993b. “Summary—Programme of Cooperation for ChildSurvival, Protection, and Development in the Philippines 1994–1998.” National Economic and Development Authority andUnited Nations Children’s Fund, Manila. Processed.
______. 1993c. “Summary—Situation Analysis: Children and Womenin the Philippines, 1992.” National Economic and Develop-ment Authority and United Nations Children’s Fund, Manila.Processed.
170 B I B L I O G R A P H Y

______. 1994. “Terminal Implementation Review—Third Programmeof Cooperation between the Government of the Philippinesand UNICEF 1988–1993 (CPC III) Synthesis Report.” Manila.Processed.
Pinstrup-Andersen, Per, Susan Burger, Jean-Pierre Habicht, andKaren Peterson. 1993. “Protein-Energy Malnutrition.” In Dean T.Jamison, W. Henry Mosley, Anthony R. Measham, and Jose LuisBobadilla, eds., Disease Control Priorities in Developing Countries.New York: Oxford University Press.
Pinstrup-Andersen, Per, David L. Pelletier, and Harold Alderman.1995. Child Growth and Nutrition in Developing Countries: Prioritiesfor Action. Ithaca, N.Y.: Cornell University Press.
Pollitt, Ernesto. 1991. Malnutrition and Infection in the Classroom.New York: United Nations Educational, Scientific, and CulturalOrganization.
Pollitt, Ernesto, K. S. Gorman, P. L. Engle, Ray Martorell, andJ. Rivera. 1993. “Early Supplementary Feeding and Cognition.”Monographs of the Society for Research in Child Development 58(7).
Popkin, Barry, L. S. Adair, J. S. Akin, Robert Black, John Briscoe,and Wilhelm Flieger. 1990. “Breast-Feeding and Diarrheal Mor-bidity.” Pediatrics 86:874.
Quisumbing, Maria Agnes R. n.d. “The Effects of Food Price andIncome Policies on the Nutrition of Low-Income Groups: APhilippine Case Study.” Paper submitted to the United Na-tions University Taskforce on the Impact of Agricultural FoodSupply Policies on Nutrition and Health Status, Quezon City.Processed.
Raneses, Nestor O., Ferdinand G. Manegdeg, and Adelisa C.Ramos. 1990. “An Operations Research and Systems AnalysisStudy of Weighing Scales Used for Growth Surveillance (Opera-tion Timbang) and Monitoring Program.” Department of Health,Nutrition Service. Manila. Processed.
Salvosa-Loyola, Carmencita, and Adelisa C. Ramos. 1990. “Improv-ing the Midwife’s Performance in Measuring and RecordingBody Weights of 0–6 Year Old Preschoolers.” Department ofHealth, Nutrition Service. Manila. Processed.
Save the Children (U.S.A.). 1993. “Workplace-Related ChildcareServices, Philippines." Philippines Field Office, Manila. Processed.
Schweinhart, L. J., and David P. Weikart. 1993. Significant Benefits:The High/Scope Perry Preschool Study through Age 27. Monograph.Ypsilanti, Mich.: High/Scope Press.
Scrimshaw, Nevin. 1995. “The New Paradigm of Public Health Nu-trition.” American Journal of Public Health 85(5):622–24.
B I B L I O G R A P H Y 171

Sebastian, Roberto S. 1992. “Rejoinder to the Global NutritionChallenge: Lessons and Issues in the Philippines.” Country state-ment to the International Conference on Nutrition, Rome.Department of Agriculture, Manila. Processed.
Selowsky, Marcelo. 1981. “Nutrition, Health, and Education: TheEconomic Significance of Complementarities at an Early Age.”Journal of Development Economics 9(3):331–46.
Senauer, Benjamin, Marito Garcia, and Elizabeth Jacinto. 1988.“Determinants of the Intrahousehold Allocation of Food in theRural Philippines.” American Journal of Agricultural Economics 70(1):170–79.
Senauer, Benjamin, and Marito Garcia. 1991. “Determinants of theNutrition and Health Status of Preschool Children: An Analysiswith Longitudinal Data.” Economic Development and CulturalChange 39 (2, January).
Solter, Steven L. 1993a. “Area/Program-Based Health Planning inthe Philippines.” Department of Health, Child Survival Program,Manila. Processed.
______. 1993b. Paying for Performance: An Approach to Donor Fundingin the Philippines. Manila: Department of Health, Child SurvivalProgram.
Sommerfelt, A. G., and M. K. Stewart. 1994. Children’s NutritionStatus. Demographic and Health Surveys Comparative Studies12. Calverton, Md.: Macro International, Inc.
Taguiwalo, Mario M. 1992. Implementing the Philippine Child SurvivalStrategy. Manila: Department of Health, Child Survival Program.
Tan, Jee-Peng, Julia Land, and Paul Coustere. Forthcoming. “Put-ting Inputs to Work in Elementary Schools: What Can Be Done inthe Philippines?” Economic Development and Cultural Change.
Tan, Michael Lim. 1992. “Philippine Health Matters 1992—Women’s Health in the Philippines: A Critical Analysis.” In HealthAlert. Vol. VIII, special issue 129/130:1–40.
Tuazon, Maria, J. M. van Raaij, J. G. Hautuast, and C. V. Barba.1987. “Energy Requirements of Pregnancy in the Philippines.”The Lancet 14(November):1129–33.
UNICEF. 1991. “Nutritional Status of Filipino Pre-School ChildrenUsing NCHS Values 1987.” Manila. Processed.
______. 1993. “1995 Mid-Decade Goals for Filipino Children, A Callto Action towards Philippines 2000.” Manila. Processed.
______. 1994. “Goals for Children and Development in the 1990s:Achieving the Mid-Decade Goals of 1995, East Asia and PacificRegion.” Manila. Processed.
UNICEF. Annual. “The Situation of Children and Women in thePhilippines.” Manila. Processed.
172 B I B L I O G R A P H Y

United Nations. 1993a. “Nutritional Issues in Food Aid.” Papersfrom the ACC/SCN Session Symposium. Administrative Com-mittee on Coordination, Subcommittee on Nutrition, Geneva.Processed.
______. 1993b. “Second Report on the World Nutrition Situation,”vol. II. Administrative Committee on Coordination, Subcommit-tee on Nutrition, Geneva. Processed.
Villavieja, Gracia M., Wilma L. Molano, Corazon M. Cerdena, RubyD. Lana, Elinita V. Castillo, Cynthia A. Nones, Josephine P. Bo-quecosa, Herminia SP. Abaya, Emerita A. Feliciano, Milagros C.Chavez, and Estrella F. Palafox. 1992. “1992 Update on the Nutri-tion Situation of Filipino Children.” Nutritional Assessment andMonitoring Division, FNRI, Manila. Processed.
Waaler, Hans. 1983. “Height, Weight, and Mortality: The Norwe-gian Experience.” Acta Medica Scandinavica supplementum 679.
Waterlow, J. C. 1992. Protein-Energy Malnutrition. London: EdwardArnold.
World Bank. 1990. “Colombia, Community Child Care, and Nutri-tion Project Staff Appraisal Report.” Human Resources Division,Country Department III, Latin America and the Caribbean Re-gional Office, Washington, D.C. Processed.
______. 1991. “New Directions in the Philippines Family PlanningProgram.” Report 9579-PH. World Bank, Country Department II,Asia Regional Office, Washington, D.C. Processed.
______. 1992. “Mexico: The Initial Education Strategy.” Washing-ton, D.C. Processed.
______. 1993a. “The Philippines: An Opening for Sustained Growth.”Report 11061-PH. Country Department I, East Asia and PacificRegional Office, Washington, D.C. Processed.
______. 1993b. World Development Report 1993: Investing in Health.New York: Oxford University Press.
______. 1994a. Enriching Lives: Overcoming Vitamin and MineralMalnutrition in Developing Countries. Washington, D.C.
______. 1994b. “Philippines. Devolution and Health Services: Man-aging Risks and Opportunities.” Report 12343-PH. CountryDepartment I, East Asia and Pacific Regional Office, Washington,D.C. Processed.
______. 1994c. “Women’s Health and Safe Motherhood Project.”Staff Appraisal Report 13566-PH. East Asia and Pacific CountryDepartment, Washington, D.C. Processed.
______. 1995. “Philippines. Social Safety Net Programs: Target-ing, Cost-effectiveness, and Options for Reform.” CountryDepartment I, East Asia and Pacific Regional Office, Washington,D.C. Processed.
B I B L I O G R A P H Y 173

World Health Organization. 1985. “Energy and Protein Require-ments: Report of a Joint FAO/WHO/UNU Expert Consultation.”WHO Technical Report Series 724. Geneva. Processed.
Young, Mary Eming. 1995. Investing in Young Children. World BankDiscussion Paper 275. Washington, D.C.
Zohoori, Namrar, Barry M. Popkin, and M. E. Fernandez. 1991.“Breast-Feeding Patterns in the Philippines.” University of NorthCarolina at Chapel Hill, Carolina Population Center. Processed.
174 B I B L I O G R A P H Y