improving fcc unit performance - refining...
TRANSCRIPT

PROPRIETARY INFORMATION© 2014 KBC Advanced Technologies plc. All Rights Reserved.
Improving FCC Unit Performance
Mel Larson, Principal Consultant & Joni Lipkowitz, Consultant
May 2014

PROPRIETARY INFORMATIONPROPRIETARY INFORMATION
Biography
Melvin G. LarsonPrincipal Consultant
Profile
• Principal Consultant at KBC with over 31 years experience as a Chemical Engineer.
• Responsibilities include but are not limited to specialty consulting in FCC, serving as Project Manager on
various KBC projects, and as Manager / Principal Advisor on 150 KBPD grassroots refinery build.
• Consulting services specialize in process troubleshooting and profit improvement analysis in the FCC,
Unsaturates Gas Plant, Alkylation and Naphtha Reformer areas.
• 10+ years refinery hands-on experience with unique awareness to day-to-day operations / troubleshooting.
KBC Experience
• Technical Advisor to National Oil Company’s new Latin American refinery project. FEL-0 through FEL III
assistance in complete complex and build both strategic and in detailed work assistance with owner, licensors
and EPC firm.
• Served as project manager on Profit Improvement Programs with extensive international experience, working
in USA, Europe, Australia, South America, South Korea and Japan.
• Worked as key advisor on a grassroots complex refinery build. Personal responsibilities required overall
refinery knowledge and capability to manage and coordinate multiple disciplines on both client and company
aspects of the work.
• Assisted majors in various troubleshoot operations on FCC, including excessive catalyst losses, the re-
optimization of operation for higher conversion with existing equipment.
• Identified and implemented charge rate increase in USGC FCC by 3 kbpd without investment and over 20%
additional capacity in Japanese FCC Unit without investment.
• Coordinated FCC and Unsaturate Gas Plant analysis on major Yield and Energy Surveys throughout the
world. The unsaturate gas plant analysis often includes rigorous simulation of the facilities.
Education
• B.S. in Chemical Engineering from Rose-Hulman Institute of Technology.
KBC Advanced
Technologies Inc.
15021 Katy Freeway
Suite 600
Houston, TX 77094
Tel +1 281 597 7943
Mob +1 281 831 8202
Fax +1 281 616 0900

PROPRIETARY INFORMATIONPROPRIETARY INFORMATION
Biography
Joni LipkowitzConsultant
Profile
• KBC Consultant with over five years experience as a Chemical Engineer.
• Worldwide experience in Downstream and Upstream Oil & Gas specializing in Field Services.
• Has travelled globally 100% with accountability to manage and lead multi-million dollar projects at client sites.
Prior Experience
• Worked for UOP for 4 years in various positions, gaining diverse experience.
• As a Chief Technical Advisor in Field Operating Services, advised clients regarding start-up, revamp,
turnaround, checkout, inspection, installation, optimization and performance evaluation in Chile, Lithuania,
Trinidad and Tobago, India, Canada, South Korea, China, Hawaii, Louisiana, and Indiana.
• Led and supervised teams of 4 to 6 Advisors through demonstration of technical knowledge and organization
to perform checkout of new units and verify as-built construction meets design specifications, while ensuring
crew safety, managing and exceeding customer expectations, and training customer operators and engineers.
• Held the positions of Process Engineer in Fluidized Catalytic Cracking (FCC), Alkylation & Treating Technical
Services and Career Development Engineer in FCC Pilot Plant Operations.
• Recognized with the Honeywell Silver Bravo Award “Technical & Functional Excellence” for outstanding
support to technical specialists, allowing them to focus on customer needs in a timelier manner.
• Led and supervised teams of operators for FCC Pilot Plants to ensure productivity, quality, and safe operation.
Education & Languages
• B.S. in Chemical Engineering from Rose-Hulman Institute of Technology.
• Fluent in Spanish, proficient in German, and familiar with Japanese/Mandarin.
KBC Advanced
Technologies Inc.
15021 Katy Freeway
Suite 600
Houston, TX 77094
Tel +1 281 597 7979
Mob +1 832 638 1650
Fax +1 281 616 0900
PROPRIETARY INFORMATIONPROPRIETARY INFORMATION
Abstract
• The advent of shale oil or Light and Tight Oils (LTO) into the refining
industry has dramatically affected refinery operations.
The FCC has been impacted with substantial feed quality changes.
The result is operating severity adjustments for desired product quality
specifications while meeting environmental emission standards.
Post-WWII baby boomers are retiring, taking with them knowledge and
experience in unit operations, engineering, design, and control systems.
However, FCC engineers of today can hone their skills and knowledge by
utilizing methodologies and analytical tools proven to improve performance.
• KBC will present troubleshooting experiences that utilize methods and
practices proven to be efficient and effective in day to-day-operations.
The use of Petro-SIM as a simulation tool will be highlighted based on
worldwide experience in monitoring and optimizing unit performance.
KBC will be available to demonstrate Petro-Sim for interested attendees.
4

PROPRIETARY INFORMATIONPROPRIETARY INFORMATION
Outline
• FCC Feed with Light & Tight Oils (LTO)
Operational Considerations
Feed Contaminants
• Catalyst System
Catalyst Losses
Performance Monitoring/Baselining
Particle Size Distribution (PSD)
Circulation Issues
Velocity Profiles
Cyclones Operation Guidelines for FCCs
Reactor-Regenerator Troubleshooting Tips
Troubleshooting Checklist
• Unit Constraints for Processing LTO
Main Column and Gas Plant
Water Issues
Optimizing for Max Olefin Operating Mode
5

PROPRIETARY INFORMATIONPROPRIETARY INFORMATION
FCC Feed with Light & Tight Oils
6

PROPRIETARY INFORMATIONPROPRIETARY INFORMATION
FCC Feed with Light & Tight Oils
7
Disengaging Section
Air fromMain Air Blower
Air Grid Distributor
Air Heater
Spent Catalyst
Standpipe
Flue Gas toFlue Gas Coolers
Reactor Overhead Vapor toMain Column Fractionator
ReactorCyclones
2
4
3
1
ReactorStripper Stripping/
Fluffing Steam
ReactorRiser
Feed Injector Nozzles
Raw Oil
Fluidization Ring
Regenerated Catalyst Standpipe
Slide Valve
Regenerator
Plenum
Riser
Reactor
Regenerated Catalyst
Spent Catalyst
Operational Considerations◦ Open Capacity
• Wet Gas Compressor • Air Blower
◦ Heat Balance Management• Adding Carbon
Deep-cut VGO Recycle to Riser Bottom
• Catalyst Change ◦ Catalyst Circulation
Standpipe Flux rate (lbs/ft2/sec)
Slide Valve Size / Opening Standpipe Diameter Pressure Balance
Velocity Profile in Regenerator Feed Nozzle Steam Usage Lower Stripping Steam

PROPRIETARY INFORMATIONPROPRIETARY INFORMATION
Feed Contaminants
• Metals (Ni, V) dehydrogenate feedstocks to coke and H2 gas
• Metals (V, Na, Fe) deactivate FCC catalyst
• Nickel Traps may be placed into the catalyst to attenuate Nickel effects
Agglomeration
Solid State Diffusion
• Antimony (Sb) or Bismuth (Bi) can attenuate Nickel effect
• Characteristics of Iron (Fe) Contamination
Loss of bottoms cracking / conversion
Increased dry gas and delta coke
Decreased catalyst ABD
8
PROPRIETARY INFORMATIONPROPRIETARY INFORMATION
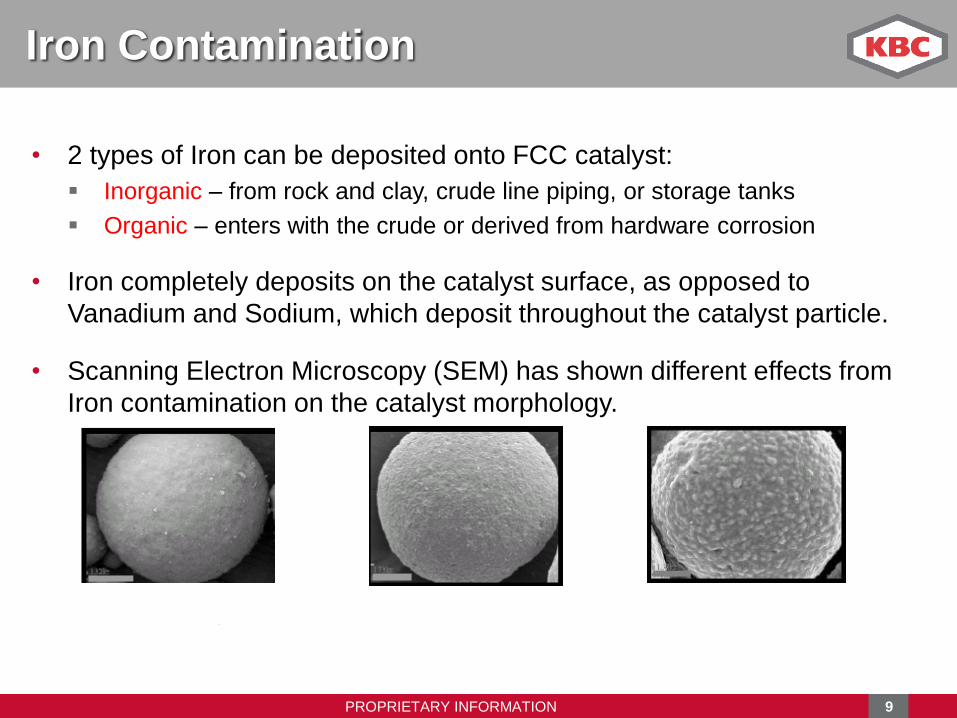
Iron Contamination
• 2 types of Iron can be deposited onto FCC catalyst:
Inorganic – from rock and clay, crude line piping, or storage tanks
Organic – enters with the crude or derived from hardware corrosion
• Iron completely deposits on the catalyst surface, as opposed to
Vanadium and Sodium, which deposit throughout the catalyst particle.
• Scanning Electron Microscopy (SEM) has shown different effects from
Iron contamination on the catalyst morphology.
Fresh Catalyst Normal E-Cat Nodulated E-Cat
9
PROPRIETARY INFORMATIONPROPRIETARY INFORMATION
Catalyst System
7 April 2014 10

PROPRIETARY INFORMATIONPROPRIETARY INFORMATION
Catalyst Losses
11
• The four primary indicators of catalyst loss are:1. Increased Main Column Bottoms ash content
2. Increased Regenerator Flue Gas fines collection
3. Increased catalyst make-up rates at the same withdrawal rate
4. Decreased catalyst withdrawal rates at the same catalyst make-up rates
• Changes in catalyst loss rates can result from:1. Operating outside operating window for superficial velocities
Applies to Reactor or Regenerator
Results in increased/decreased loadings to the cyclones
2. Improper functioning of the cyclones
3. Mechanical damage
4. Physical damage to the catalyst
5. Off-spec catalyst manufacture (increased softness, increased fines content)

PROPRIETARY INFORMATIONPROPRIETARY INFORMATION
Performance Monitoring / Baselining
• Performance monitoring/baselining is important for troubleshooting
because today’s FCC Engineer has greater responsibility due to:
Increased safety regulations
Stricter emissions requirements
Required HAZOP Analyses
New processing requirements
Etc.
• Process monitoring is important to establish a means for consistency in:
Heat Balance
Cat-to-Oil
Catalyst Circulation
Key performance variables (i.e. conversion, product yields, etc.)
12

PROPRIETARY INFORMATIONPROPRIETARY INFORMATION
Particle Size Distribution (PSD)
• Typically vendors supply catalyst with a reasonable range of particle sizes.
Operating at cyclone velocities not specified could result in less than ideal
PSD with too low of a concentration of smaller particle sizes.
Too much fines in the e-cat would be an indication of catalyst attrition.
• Certain catalysts will have higher quantities of fines in the fresh catalyst.
Fresh catalyst with high fines usually shows up as regenerator losses.
Catalyst with a high attrition index will show up as losses from Rx and Rg.
• Particle strength can be adversely affected by thermal or chemical damage.
Thermal damage is typically caused by upsets or extended torch oil use.
Catalyst poisons affecting catalyst include Ca and K.
• Insufficient fines distribution can be more difficult to circulate depending on unit:
Vertical standpipe
60°angled pipe
“J bend” design
7 April 2014 13

PROPRIETARY INFORMATIONPROPRIETARY INFORMATION
PSD: “Good” vs. “Bad”
7 April 2014 14
• The FCC requires catalyst with the following to effectively circulate:
Larger (>100 microns) particles
Smaller (< 40 microns) particles
• 5% fines between 0-40 microns are needed for fluidization
>10% fines could indicate an attrition source or a soft catalyst
A softer catalyst may result in excessive fines
A harder catalyst may erode equipment and result in fluidization issues
• Typical average particle size (APS) is 70-90 microns
• 2 typical catalyst loss occurrences include:
Decrease In 0-40 micron fraction
No decrease In 0-40 micron fraction
PROPRIETARY INFORMATIONPROPRIETARY INFORMATION
Recommended Baseline Data
15
• When troubleshooting, it is important to have a baseline of “normal” losses:
Total tons/day lost
Typical PSD for each location
Stack isokinetic testing.
• Do baseline at a minimum annually.
The atypical data can be compared to the baseline to determine root causes.
i.e., if PSD of losses is much smaller than normal, catalyst attrition is likely.
• It is recommended that the refiner collect the following baseline data:
Wt-flow of catalyst in the net slurry
Wt-flow of catalyst collected by the flue gas emissions control equipment
Wt-flow of catalyst escaping the stack
Wt-flow of fresh catalyst and additives entering the unit
Wt-flow of equilibrium catalyst withdrawn from the unit
PSD of the ash in the net slurry

PROPRIETARY INFORMATIONPROPRIETARY INFORMATION
Tracking & Analyzing PSD
16
• E-cat PSD should be monitored and trended with each update of E-
cat data sheets from the catalyst supplier.
Fresh catalyst and additive PSD should be monitored and trended with each
new certification sheet from the supplier, as well.
The net slurry ash PSD should be monitored and trended at least monthly.
• The catalyst vendor will usually do net slurry ash PSD if requested. Ask your supplier for detailed analysis of 1-20 microns for all samples.
This information will not be provided on e-cat data sheets unless requested.
Refiner is ultimately responsible for tracking and analyzing PSD.

PROPRIETARY INFORMATIONPROPRIETARY INFORMATION
Catalyst Circulation
17
• Original design feeds are not the feeds of operation today (lower sulfur feeds). Most US FCCs designed between 1960-1975 have had several revamps.
Revamps in the US were considered for operating on high carbon feeds.
Now these units are operating on low carbon feeds raising C/O operations.
• Higher catalyst circulation rates may cause catalyst attrition problems. Increased attrition from higher circulation rates may cause the catalyst PSD to change.
• Standpipe flux and slide valve (SV) control is different: Achieving higher flux through the standpipe requires opening the SV more.
dP across the slide valve is not a function of SV opening.
dP is dependent upon the catalyst stacked up against the slide valve.
• Consider mass fluxes for standpipes: Design case of 150 lbs/ft2-sec now runs at ≥350 lbs/ft2-sec
What does that mean for SV opening and comfort of operations?
• Refiners can artificially limit operation of their FCCs based upon perceived
limits of standpipe flux; remember to differentiate SV dP from SV opening.

PROPRIETARY INFORMATIONPROPRIETARY INFORMATION
Velocity Profiles
18
• In general, if equipment is operated >> higher than design,
high velocity can cause catalyst carryover, have the impact of
NOT getting sufficient cyclone performance, and skew PSD.
• Superficial Velocity
LTO feeds require less air to the regenerator.
During startup, the regenerator is operated at low pressure with
high superficial velocities.
During normal operations, superficial velocities > 3.8 ft/s in the
regenerator will tend to increase catalyst entrainment in the
disengaging space above the catalyst bed.
• Regenerator Inlet Cyclone Velocity
When running inlet velocities too low, units can selectively lose
more fines due to poor angular velocity and fluidization.
De-fluidization in standpipes or above slide valves can result in
gas bubbles and erratic differential pressure readings across slide
valves, resulting in conservative operations and lost opportunities.

PROPRIETARY INFORMATIONPROPRIETARY INFORMATION
Cyclones Operation Guidelines for FCCs
19
Cyclone Inlet Velocity Cyclone Behavior Comments
< 35 ft/s Re-entry of large quantity of catalyst into gas will
be evident while velocity will not be enough to
accelerate and send particles to cyclone wall.
Only at startup; otherwise
low efficiencies, plugged dip
legs, or mechanical damage
leading to a pressure
imbalance can occur.
36 - 45 ft/s Separation efficiency will increase with increase of
velocity. The efficiency will be around 70%-80%.
High regenerator-side losses
46 - 65 ft/s Efficiency ~ 95% (at low velocity range) but will
increase quickly to 99.99% at 65 ft/s .
Secondary cyclones designed at 88% efficiency.
Overall efficiency is > 95%; PSD is important.
Ideally 1st stage cyclones
operate 55 - 65 ft/s ; PSD
changes not per design.
66 - 75 ft/s Erosion will not become an issue until >> 75ft/s. 1st stage velocities must be
limited to 75ft/s maximum
and 85 ft/s in 2nd stage.
76 - 79 ft/s Cyclone erosion / fines generation due to attrition.
The efficiency of solid recovery could be reduced.
20-30% chance of run life <
3 years due to excess losses
and cyclone damage.
>> 80 ft/s High cyclone erosion and catalyst attrition.
Operation will become unstable as catalyst cannot
be drained through the dip legs due to high ΔP.
Overloading cyclone dip legs
and massive carry over can
occur.
PROPRIETARY INFORMATIONPROPRIETARY INFORMATION
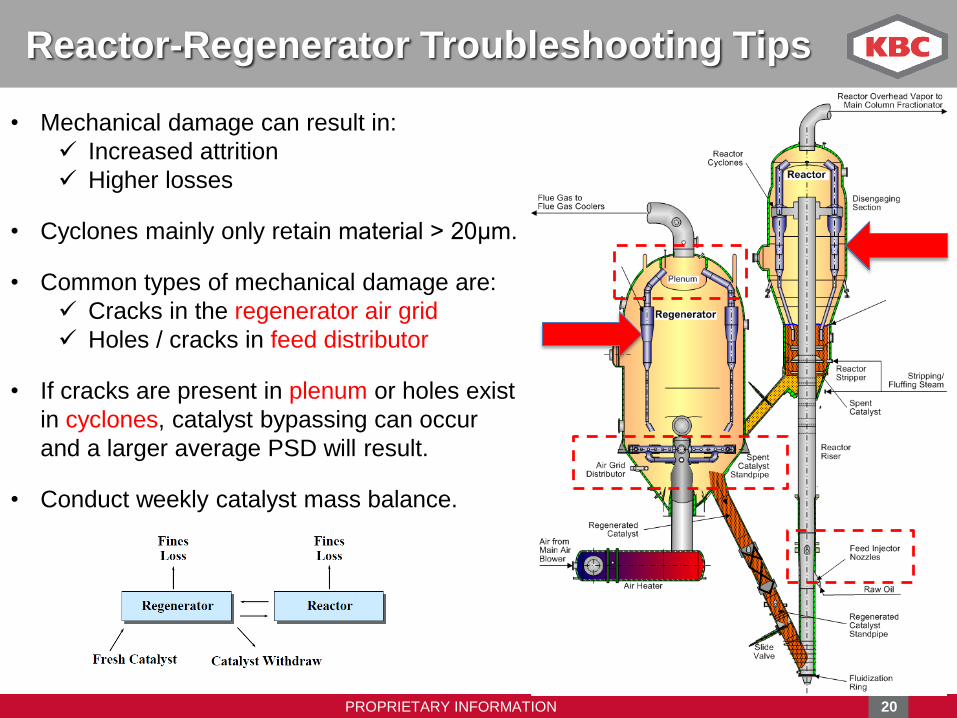
Reactor-Regenerator Troubleshooting Tips
20
• Mechanical damage can result in:
Increased attrition
Higher losses
• Cyclones mainly only retain material > 20μm.
• Common types of mechanical damage are:
Cracks in the regenerator air grid
Holes / cracks in feed distributor
• If cracks are present in plenum or holes exist
in cyclones, catalyst bypassing can occur
and a larger average PSD will result.
• Conduct weekly catalyst mass balance.
PROPRIETARY INFORMATIONPROPRIETARY INFORMATION
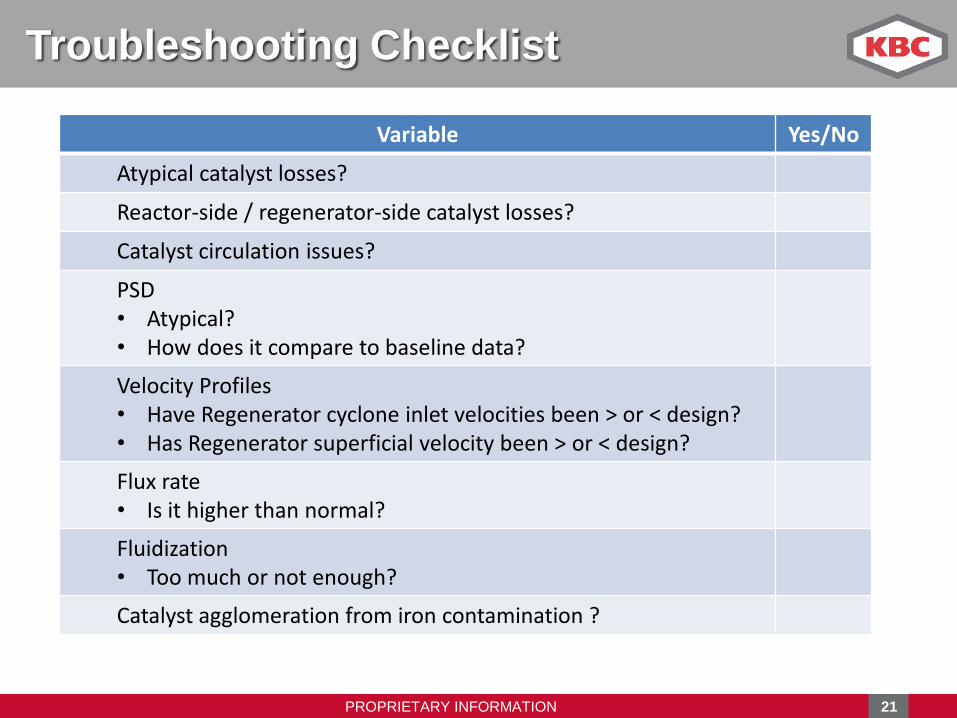
Troubleshooting Checklist
21
Variable Yes/No
Atypical catalyst losses?
Reactor-side / regenerator-side catalyst losses?
Catalyst circulation issues?
PSD• Atypical?• How does it compare to baseline data?
Velocity Profiles• Have Regenerator cyclone inlet velocities been > or < design?• Has Regenerator superficial velocity been > or < design?
Flux rate• Is it higher than normal?
Fluidization• Too much or not enough?
Catalyst agglomeration from iron contamination ?

PROPRIETARY INFORMATIONPROPRIETARY INFORMATION
Unit Constraints for Processing Light & Tight Oils
22

PROPRIETARY INFORMATIONPROPRIETARY INFORMATION
Unit Constrains for LTO: Main Column & Gas Plant
23
PROPRIETARY INFORMATIONPROPRIETARY INFORMATION
Main Column
24
• Refiners who wish to produce slurry for the carbon black market may need to
push the slurry API very low via reactor severity and main column operation.
To avoid MCB coking, quench (sub-cool) the slurry in the bottom of the
tower with cooled slurry exiting one of the steam generators.
Slurry catalyst content usually does not directly cause coking problems.
Plugging can occur when large quantities of catalyst are lost from the
reactor or with low slurry heat exchanger velocities.
To prevent catalyst plugging or erosion in exchangers, maintain velocity
(v) in the slurry exchanger tubes as : 3.7 ft/s < v < 7.0 ft/s.
• When running heavy feeds with a low matrix activity catalyst at low conversion,
it is still possible to minimize coking with control changes of the main column.
LCO draw rate can be controlled to limit the slurry gravity at a minimum of
2API or the slurry viscosity at a maximum of 25Cs at 99C.
These limits can be adjusted to minimize coking in the MCB circuit.

PROPRIETARY INFORMATIONPROPRIETARY INFORMATION
Main Column (Continued)
25
• The most common fouling in FCC Slurry System is coking, influenced by:
1. Temperature
Coke build-up rate increases greatly when bottoms temperature > 700F
Most operations try to maintain bottoms temperature < 690F
When fouling is observed, it is important to lower temperature < 680F
2. Residence Time
Refers to time the slurry spends in the column, not the entire system.
Once slurry is heat exchanged, temperature and coking stops.
Min. circ. rate to prevent coking is 6 gpm/ft2 of column cross-sec. area.
3. Slurry Quality
It is more difficult to control slurry quality.
The major variables that effect slurry quality are:
Feedstock type
Catalyst type
Reactor severity
Main column operation

PROPRIETARY INFORMATIONPROPRIETARY INFORMATION
Flooding Towers in Main Column & Gas Plant
26
• Assuming existing towers in Gas Plants were designed in the mid-1970s for lower
conversion than achieved today, flooding towers during normal operations can occur.
• KBC’s tray sizing tool can be utilized to model existing towers in specific units and
help troubleshoot tray flooding by identifying, confirming, and defining solutions.
• Consider the following columns:
o Main Fractionator Main Fractionator pressure drop will impact unit hydraulics
• Slide valve delta pressure
o Catalyst circulation may as pressure drop in fractionator
• Operation of air blower and wet gas compressor
o Debutanizer Tower Debutanizer flooding may be mitigated by the following:
• Relaxing FCC gasoline RVP target
• Reducing debutanized gasoline lean oil to the primary absorber
• Charge rate reduction
• Conversion reduction
• Feed quality adjustment
Economic evaluation is required to determine the most appropriate mitigation option
• All mentioned mitigation actions typically incur an economic penalty

PROPRIETARY INFORMATIONPROPRIETARY INFORMATION
Unit Constraints for LTO: Water System
27
• Proper wash water injection is important in maintaining reliable operation of the
overhead condenser circuits and vessels in the Main Column and Gas Plant to: Reduce corrosion and fouling rates
Decrease hydrogen blistering
Diminish weld cracking
Minimize the risk of gasoline corrosion
Control the accumulation of heat stable salts in the amine treating system
• Maintain pH of wash water as follows:1. Main column receiver and reflux drum water boots - between 8.0 and 9.0
2. High pressure receiver (HPR) water boot - above 7.5
• Field check the pH of the wash water from the main column receiver and the
HPR water boots at the FCC unit on a regular basis.
• Lab pH values are typically > field due to the release of H2S before lab testing.
• Fresh wash water should contain minimum contaminants (salts or dissolved O2).
• Suggested sources are oxygen free water and BFW before alkalinity adjustment.
PROPRIETARY INFORMATIONPROPRIETARY INFORMATION
Optimizing for Max Olefin Operating Mode
28
• KBC modeling tools can be used to predict yields and optimize operations
• General guidelines for optimizing FCC units for max olefin mode include:
Decrease hydrocarbon partial pressure
Increase reactor temperature (increases catalyst circulation rate & coke yield)
ZSM-5 addition
Increase catalyst cooler duty (if applicable to your unit) to maintain a
relatively constant cat-to-oil ratio
Adjust acceleration zone velocity to minimize back mixing in the riser
Adjust stripping steam
Monitor H2 in coke

PROPRIETARY INFORMATIONPROPRIETARY INFORMATION
Q&A
29