improving federal statistics for industry studies
TRANSCRIPT

THE GEORGE WASHINGTON INSTITUTE OF PUBLIC POLICY
Improving Federal Statistics for Industry Studies
Andrew Reamer, Research Professor
Presented at the Industry Studies Association Annual Conference
Kansas City, Missouri
May 29, 2013
(Revised June 11, 2013)
805 21ST STREET, NW MEDIA AND PUBLIC AFFAIRS BUILDING, SIXTH FLOOR WASHINGTON, DC 20052
202-994-0970 FAX 202-994-8913 WEB www.gwu.edu/~gwipp

Improving Federal Statistics for Industry Studies
Table of Contents
Introduction 3
Summary of Recommendations 5
Enterprise as Unit of Analysis 7
Business Classification 8
Industry Output 12
International Trade and Investment 14
Entrepreneurship 23
Industry Research & Development 25
Workforce 26
Business Microdatabases 34
Endnotes 38

Introduction
Federal economic statistics are an important resource for industry studies. Only the federal government has the resources, authority, and inclination to produce a broad and deep array of industry-specific data that are objective, reliable, relevant, consistent over space and time, and readily accessible to users. At the same time, the annual cost of the federal economic statistical system covering the workings of $16 trillion economy is less than $2 billion.
The origins of each of the three primary economic statistical agencies—the Census Bureau, the Bureau of Economic Analysis, and the Bureau of Labor Statistics—can be traced to 19th century congressional mandates for industry analyses to guide tariff and manufacturing policies. Initially, Congress’ demand for these studies stemmed from the fact that tariffs were the government’s primary revenue source and that many members, particularly Whigs and Republicans, sought to promote neo-mercantilist policies that protected domestic markets for American manufacturers. After the Civil War, U.S. manufacturers, and their representatives in Congress, were increasingly interested in statistics that would facilitate exports. In the late 19th century, the Census Bureau produced the nation’s first comprehensive sets of industry studies, an extraordinary achievement.1 In the first third of the 20th century, the Commerce Department—particularly under Secretary Herbert Hoover—very much saw as part of its mission producing data for detailed industry analyses by the public and private sectors.2
After World War II, the primary mission of the BEA, BLS, and the economic side of the Census Bureau became to provide the data needed by the practitioners of the newly eminent science of macroeconomics. At the same time, with the U.S. the one industrialized nation left standing, global geopolitics took precedence over any concerns about sustaining economic competitiveness. As a consequence of these developments, the production of data for industry analyses became of less interest to Congress and Administrations than had been the case historically. This lack of interest has been maintained even as the U.S. economy has become increasingly vulnerable to global competition. In the last 30 years, Congress generally has been indifferent to modest Administration requests to improve economic statistics, even for macroeconomic purposes.3 Further, a growing number of Republican members have become hostile to federal data collection. Recently, for instance, Rep. Jeff Duncan (R-SC) and 14 colleagues sponsored a bill to prohibit the Census Bureau from conducting any survey outside of that needed to apportion Congress every ten years.
Over the last 20 years, concurrent with this bad news has been the good news of remarkable advances in information technology (IT) and statistical methods. These advances have greatly expanded federal data collection, analysis, and product development capacities while lowering costs.
• Dramatic IT improvements over the past 15 years o allow the federal government to analyze enormous volumes of microdata, particularly
administrative records, at very low cost; o provide millions of users with direct, on-line, customized access to federal public use
data in formats that are easily manipulated; and o enable federal statistical agencies to build tools that allow users to analyze microdata,
under strict confidentiality protection, to identify trends in the movements of
Andrew Reamer, “Improving Federal Statistics for Industry Studies” 3

businesses and workers—such as hires and fires, place of work in relation to place of residence, and paths taken through the education system and into the job markets.
• Improvements in statistical methods (such as data swapping, noise infusion, and synthetic data) allow agencies to reduce the number of table cell non-disclosures while protecting confidentiality.4
• As a result of advances in IT and statistical methods, the government’s options for providing researcher access to large databases of individual records, while fully protecting confidentiality, have greatly expanded.
• IT advances mean that private-sector organizations are able to electronically collect, analyze, and disseminate large volumes of data as well, which has not been the case historically. So in ways not previously possible, the federal government has opportunities to obtain large private-sector databases, take advantage of enormous private-sector cloud computing capabilities, and use private-sector open data platforms to disseminate their statistics.
This paper’s aim is to provide a series of recommendations that address the holes in the federal data system, seek to shore up efforts vulnerable to political hostility or indifference, and aim to take advantage of the major advances in IT. Taken as a set, the recommendations represent an attempt to restore federal data production for industry analysis to its historically prominent place.
The recommendations are organized into eight sections:
• Enterprise as Unit of Analysis • Business Classification • Industry Output • International Trade and Investment • Entrepreneurship • Industry Research & Development • Workforce • Business Microdatabases
A table summarizing the recommendations, with costs (if known), is provided below. Detailed discussion of the recommendations follows.
Andrew Reamer, “Improving Federal Statistics for Industry Studies” 4

Improving Federal Statistics for Industry Studies: Summary of Recommendations
Added Annual Cost#
Enterprise as Unit of Analysis
Census Bureau Build a longitudinal enterprise database $1M
Business Classification Census Bureau Share IRS-derived business data with BLS and BEA New law*
BLS and ETA Classify establishments by business processes TBD
BEA Provide industry accounts by legal type of firm $500K
OMB Classify establishments by industry of parent $0
Industry Output BEA Sustain quarterly GDP-by-industry $500K**
International Trade and Investment BEA Improve statistics on trade in services “Small investment” +
Measure trade in value-added (TiVA) by industry TBD
Improve data on foreign direct investment $3.9M*
CBP Complete International Trade Data System $10M (one time)
BLS Prepare input price index $11M +
Produce price indices for imported/exported services $12M +
Create foreign currency price index $140K+
Entrepreneurship Census Bureau Complete 2012 Survey of Business Owners $10M (over 5 years)**
EDA Provide grants for regional entrepreneurship databases TBD
SBA + others Address needs for small business finance statistics $10M (over 5 years)
Industry Research & Development NCSES Publish detailed industry R&D tables on a timely basis $3M
Institute survey of nonprofit R&D (mainly hospitals) $2M*
Andrew Reamer, “Improving Federal Statistics for Industry Studies” 5
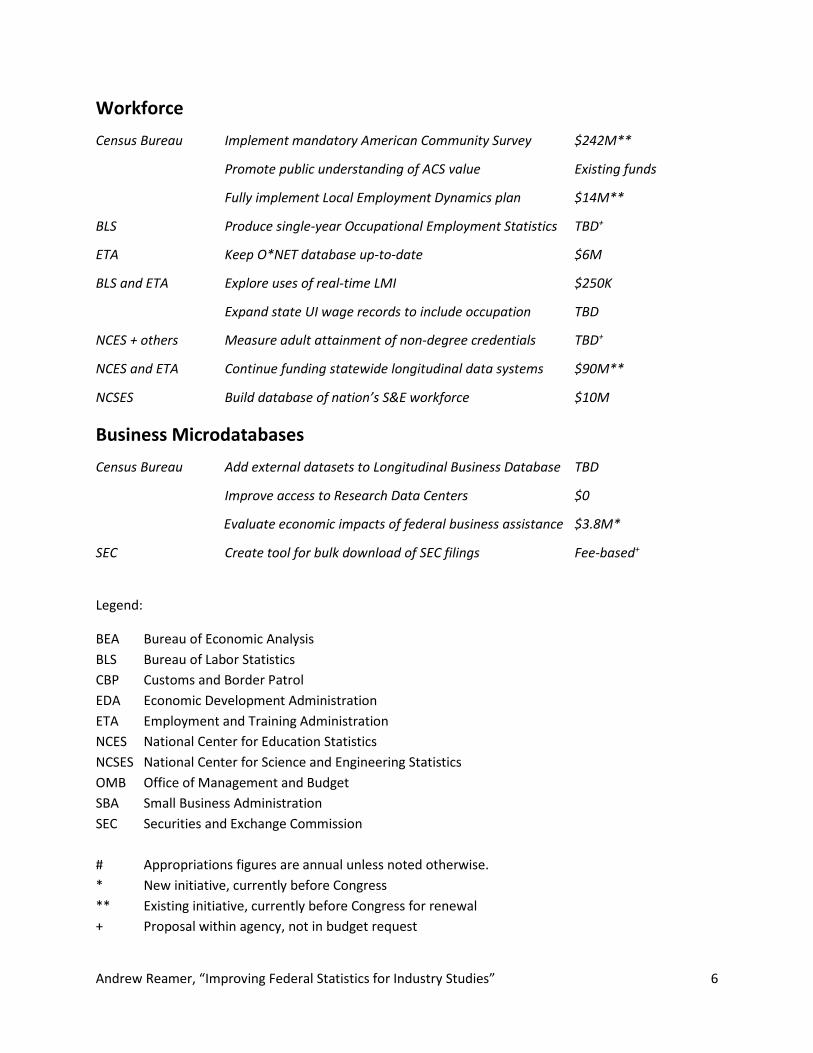
Workforce Census Bureau Implement mandatory American Community Survey $242M**
Promote public understanding of ACS value Existing funds
Fully implement Local Employment Dynamics plan $14M**
BLS Produce single-year Occupational Employment Statistics TBD+
ETA Keep O*NET database up-to-date $6M
BLS and ETA Explore uses of real-time LMI $250K
Expand state UI wage records to include occupation TBD
NCES + others Measure adult attainment of non-degree credentials TBD+
NCES and ETA Continue funding statewide longitudinal data systems $90M**
NCSES Build database of nation’s S&E workforce $10M
Business Microdatabases Census Bureau Add external datasets to Longitudinal Business Database TBD
Improve access to Research Data Centers $0
Evaluate economic impacts of federal business assistance $3.8M*
SEC Create tool for bulk download of SEC filings Fee-based+
Legend:
BEA Bureau of Economic Analysis BLS Bureau of Labor Statistics CBP Customs and Border Patrol EDA Economic Development Administration ETA Employment and Training Administration NCES National Center for Education Statistics NCSES National Center for Science and Engineering Statistics OMB Office of Management and Budget SBA Small Business Administration SEC Securities and Exchange Commission # Appropriations figures are annual unless noted otherwise. * New initiative, currently before Congress ** Existing initiative, currently before Congress for renewal + Proposal within agency, not in budget request
Andrew Reamer, “Improving Federal Statistics for Industry Studies” 6

Enterprise as Unit of Analysis
Congress should provide the Census Bureau with about $1 million annually to maintain a longitudinal enterprise database.
The federal economic statistical system collects and produces data almost entirely on an establishment basis. Although 95 percent of all businesses are single-establishment, multi-establishment firms account for 55 percent of private nonfarm employment.5 Without a robust set of enterprise-based statistics, it is difficult to fully know the structure and dynamics of the nation’s industries.
The Census Bureau published enterprise statistics as part of each economic census between 1954 and 1992. In 2009, a Census Bureau Working Group on Enterprise Statistics made the business case for a new Enterprise Statistics Program (ESP) that would be substantially more ambitious than the traditional version.6 As a result, enterprise statistics will be generated as part of the 2012 Economic Census. Topics include enterprise operating revenues and net sales, IP royalties and license fees, and manufacturing activities, including outsourcing. Economic Census enterprise data will be linked with enterprise data from other Census surveys and federal administrative records to produce a series of reports in late 2015.
The Census Bureau working group estimated that for additional annual funding of $600,000-$1.2 million, the bureau could construct and regularly update a longitudinal enterprise database by incorporating new Census and non-Census firm records as they become available. Examples of possible data elements include industry, size, age, legal type, owner characteristics, locations, employment, payroll, sales/receipts, trade, capital spending, outsourcing, patents, finances, foreign operations of U.S. firms, and direct investment in the U.S. of foreign firms. The new database could generate annual data products profiling industry structure and dynamics. Topics could include, for instance, firm size and type, foreign and domestic ownership, firm births and deaths, firm expansions and contractions, mergers and acquisitions, innovation, and outsourcing.
A longitudinal enterprise database would aid industry analysts in examining, for instance:
• the impacts of firm characteristics on firm and industry outcomes, by industry • the extent to which enterprises classified in one industry own establishments in different
industries7 • the effect of technological change on corporate focus (e.g., IBM’s shift to a services firm) • differences in industry and company performance • patterns of evolution from non-employer to employer firms
The new ESP would provide these outcomes without fielding a new survey, unlike the old program. Consequently, the working group estimated, only 4-8 additional FTEs would be needed to sustain the effort (approximately $0.6-1.2 million annually).
Andrew Reamer, “Improving Federal Statistics for Industry Studies” 7

Business Classification
To enable federal statistical agencies to produce one consistent picture of U.S. industry structure, Congress should allow the Census Bureau to share IRS-derived business data with the Bureau of Labor Statistics and the Bureau of Economic Analysis.
Presently, the IRS tax code gives the Census Bureau access to IRS Federal Tax Information (FTI) for all businesses, BEA access to corporate FTI only, and BLS no FTI access. Further, BLS and BEA cannot look at any Census Bureau data that contains IRS-derived information.
As a result, Census, BLS, and BEA cannot synchronize their business microdata. While Census builds its Business Register from its own surveys and firm-level FTI, BLS constructs its Business Establishment List from states’ unemployment insurance filings, at the establishment level. As a consequence, the business lists maintained by Census and BLS differ substantially in terms of industry classification, jobs per establishment, payroll per establishment, and even whether a firm is single- or multi-establishment.
• About 30 percent of U.S. establishments are classified as belonging to different industries by the Census and BLS registers.
• The BLS register lists more establishments than the Census register. • The Census register reports more employment and payroll than BLS. • The management and manufacturing sectors exhibit very large differences in payroll
numbers. The Census register lists about $95 billion more in management payroll than BLS, while BLS reports about $86 billion more in manufacturing payroll.
• The Census register reflects higher payroll at the national level, but payroll in 27 states lower than that for BLS.8
• Only 77 percent of Employer Identification Numbers, which are the only identifier available on both lists, measure firm payroll within +/-2.5% of that in the other list.9
BEA uses both business registers to construct its economic accounts; because of the dissimilarity between the lists, the agency must impute large portions of its data. These multiple incongruencies result in a confusing picture of U.S. industrial structure.
For over five years, the Commerce, Labor and Treasury departments of the Bush and Obama administrations have worked with multiple committees in Congress to craft, and gain support for, a “data synchronization” law allowing the Census Bureau to share IRS-based data with other federal economic statistical agencies. Specifically, the proposed legislation would grant BEA access to IRS-derived Census data and allow BLS and the Census Bureau to synchronize their business lists. Unfortunately, despite safeguards to ensure that the legislative changes would not lead to compromises in FTI confidentiality, proponents have not been able to surmount every roadblock. It is in the nation’s economic interest that Congress pass this law.10
Andrew Reamer, “Improving Federal Statistics for Industry Studies” 8
Of help going forward, Census and BLS recently signed an agreement, as authorized under current law, that Census will give BLS multi-establishment firm data that does not contain FTI. The aim of the data sharing agreement is “to develop consistent industry classifications of establishments and companies and improve multi-location coverage, thus improving the comparability and accuracy of Federal economic statistics.”11 The Census Bureau’s Business Register includes over 168,000 multi-establishment companies that represent 1.8 million affiliated establishments.12 This reconciliation effort will not cover the 6.0 million single-establishment companies with paid employees that are in the register.
In cooperation with the Employment and Training Administration, BLS should classify business establishments by business processes and functions.
The global economy is evolving towards “trade in tasks,” with national specialization by task and function.13 It has been understood for some time that U.S. regions also specialize by function.14 The application of a typology of business processes and functions to U.S. establishments would significantly improve understanding of U.S. industrial activity.
In order to understand the nature of jobs lost due to mass layoffs, BLS developed a typology of nine business processes, each of which includes specific business functions.15 Six categories are “core business processes”:
• strategic management • procurement, logistics, and distribution (sample functions: buying, receiving, shipping,
packing) • operations • product or service development • marketing, sales, account management (sample functions: advertising, billing, marketing) • customer and after-sales service (sample functions: call center, customer service, technical
support)
Three categories are “support business processes” that assist core processes, but are not directly related to the firm’s principal activity:
• general management and firm infrastructure (sample function: administrative and clerical support)
• human resource management (sample functions: recruiting, training, payroll) • technology and process development (sample functions: computer systems development,
data processing, software and IT services)
BLS developed the typology on the basis of firm responses to an open-ended question about the primary and secondary functions of laid-off workers.16
Classification of BLS employment data by industry and business process would boost understanding of industry structure and dynamics. With the cooperation of ETA, process classification could take place concurrently with industry classification within each state’s unemployment insurance (UI) system. Once
Andrew Reamer, “Improving Federal Statistics for Industry Studies” 9

established, the annual cost of maintaining this data collection would be relatively small, a few million dollars annually.
Researchers Timothy Sturgeon and Gary Gereffi indicate:
It is the bottom-up methodology used by the BLS – beginning with literal responses rather than using a list that researchers develop subjectively or iteratively with industry informants – along with its exhaustive, exclusive, and generic character, that gives us a high level of confidence in the BLS list.
The growing use of business function lists in survey research suggests a need to delve within the firm to observe the details of organizational design, organizational change, outsourcing and industrial location. Clearly, new realities are spurring researchers to develop these new metrics. In our view, the sooner a business function classification scheme can be standardized and broadly deployed, the better.17
Sturgeon and Gereffi propose to expand the number of business processes from nine to 12, by subdividing three BLS categories.18
Congress should provide BEA with $500,000 annually to prepare industry economic accounts by legal organization of firm, including sole proprietorships, partnerships, S corporations, and C corporations.
Data collected by BEA are not fully disaggregated by legal type of firm, impeding understanding of the structure of key industries. In particular, data on partnerships and proprietorships are now combined; data on S corporations and limited liability corporations are folded into the data on all corporations.
At an additional annual cost of about $500,000, breaking out economic activity by industry and legal organization would add a new dimension to understanding the structure of U.S. industries. When BEA proposed this initiative in its FY2011 and FY2012 budget requests, however, Congress did not fund it.19
OMB should revamp NAICS so that analysts can see data on all the establishments in a particular industry sector.
Business classification systems allow analysts to see the structure of the traded sector over time and space, and so provide the framework for competitiveness analysis.
NAICS is based on a production-oriented concept, meaning that it groups establishments into industries according to similarity in the processes used to produce goods or services. Within the NAICS system, codes are determined based upon the "primary business activity" of the establishment. Establishments are a single physical location where business is conducted or where services or industrial operations are performed (e.g. a factory, mill, or store). An enterprise, on the other hand, may consist of more than one location performing the same or different types of economic activities. Unlike its predecessor Standard Industrial Classification (SIC) system, each establishment of that enterprise is assigned a separate NAICS code based on its own primary business activity (generally the one that generates the most revenue for the establishment), not the industry of its parent.20
Andrew Reamer, “Improving Federal Statistics for Industry Studies” 10

So, for instance, the headquarters of an automaker is classified as being part of the "Management of Companies and Enterprises" industry, not the manufacturing industry. Similarly, an automaker's warehouse is classified under "Warehousing and Storage." As a consequence, it is difficult to obtain a clear count of employment and earnings actually tied to each industry.21 OMB should consider reverting to a classification scheme that would allow analysts to see all jobs and wages tied to a particular industry, distinct from particular establishment products or services.
The current system of industry classification presents distortions for analysts and policymakers seeking to describe, track, and assess individual traded industries.
Andrew Reamer, “Improving Federal Statistics for Industry Studies” 11
Industry Output
Congress should ensure that BEA’s annual budget includes sufficient funds ($500,000) to sustain publication of the forthcoming quarterly estimates of GDP-by-industry.
For the last several years, BEA has published a series of prototype quarterly estimates of GDP-by-industry. The latest version was for 2009-2011, released in December 2012. 22 These estimates were made possible by congressional appropriations in early 2009 for quarterly Census Bureau surveys of businesses across all services and manufacturing industries.
BEA indicates that it will begin regular publication of quarterly GDP-by-industry estimates in April 2014. Each quarter’s estimates would be available four months after its end. The first official release, then, would cover the fourth quarter of 2013.
According to BEA, the new data will “provide more timely information on the accelerations, decelerations, and turning points in economic growth at the industry level” and allow “for a more complete analysis of business cycle dynamics and the sources of U.S. economic growth.” Measures by industry will include gross output, real GDP, real value added, chain-type price indices, and chain-type quantity indices. They should become highly useful to industry analysts.
Users of this new data series should recognize BEA’s effort and persistence in bringing them into being and, as a consequence, not take their continued existence for granted, as recent history indicates.
In 2003, the Census Bureau started collecting quarterly data from a small number of services industries. At the same time, it asked Congress for approximately $8 million so it could survey all services industries each quarter. As Census already fully covered goods, congressional approval of full coverage of services would allow BEA to produce, for the first time, reliable quarterly estimates of GDP-by-industry. On the assumption that Congress would fund the Census Bureau’s request, BEA set forth a four-year schedule for researching, testing, and producing quarterly GDP-by-industry estimates, with the first set of estimates scheduled to be published in FY2007.
Unfortunately, Congress did not fund the Census Bureau’s request for FY2004. Between FY2005 and FY2008, Census continued to make the $8 million request and each time Congress turned it down. While BEA was able to make research progress on quarterly GDP-by-industry, it did not have the Census Bureau numbers on which to base a series.
In early 2009, finally, the 111th Congress approved the Census Bureau’s $8 million request. Less than a year later, in the Commerce Department’s FY2011 budget request, BEA asked Congress for funds to prepare, among other data improvements, quarterly GDP-by-industry. It prefaced its request with this statement:
The federal economic statistical system – charged with providing key actionable intelligence on the status, trends, and dynamics of the American economy – fell short in providing the advanced warning signs of a building economic crisis. In no small part, this shortcoming was
Andrew Reamer, “Improving Federal Statistics for Industry Studies” 12

due to an inability to see, both at the detailed and aggregate levels, warning signs of systematic risk. This was not a result of a lack of attention, competence, or focus, but rather the exceptional tempo of change and evolution occurring in the economy and the existing statistical system’s inability to keep pace.
BEA repeated its request in the FY2012 budget and Congress again turned it down. For FY2013, BEA asked for $500,000 to produce the quarterly GDP-by-industry figures. Congress approved that expenditure as part of the March 2013 budget agreement.
Andrew Reamer, “Improving Federal Statistics for Industry Studies” 13

International Trade and Investment
Congress should provide BEA with the “small investment of resources” the agency says it needs to implement recommendations to improve statistics on trade in services.
Trade in services comprises 22 percent of all U.S. trade and about seven percent of U.S. GDP. BEA estimates that U.S. services exports in 2012 were $630 billion, up from $288 billion in 2000; for services imports, the parallel figures are $435 billion and $219 billion.
Despite the importance of trade in services to the economy, BEA’s trade in services data do not provide the same level of data quality and industry detail as does its trade in goods data.23 In 2010, the Commerce Department reported to Congress on the state of statistics on U.S. trade in services.24 The report proposed a series of steps by BEA to improve these statistics. Among the proposals are:
• Add new information on insurance, financial services, computer software, and manufacturing services, in line with international trade data standards
• Expand existing surveys to collect data on U.S. firm operating characteristics and purchases of services from U.S. and foreign suppliers
• Incorporate business characteristics from existing Census surveys • Increase survey coverage of small firms • Ensure that the BEA sampling frame is consistent with the Census Bureau’s Economic Census • Use existing data to determine the origins of imported services, for example, intrafirm
trades and outsourcing by U.S.-based firms
According to the Commerce Department report, implementation would require “a small investment of resources” and Congressional passage of the “data synchronization” law (discussed earlier) allowing the Census Bureau to share IRS-derived data with BEA.
BEA should determine the appropriate methods for measuring trade in value-added (TiVA) by industry and then prepare an FY2015 budget initiative for Commerce Department and OMB review.
In recent years, global supply chain networks have become more complex and geographically diffused.
From automobiles, electronics, and plastics, to software development or clothing, many goods and services today are provided via global supply chains. . . . The Apple iPod is a prominent example of a good produced via a global supply chain. Apple is headquartered in the United States and most of its R&D, marketing, top management, and corporate functions are located in the United States. The iPod’s hard drive, however, was designed in Japan by Toshiba and built in factories in China and the Philippines. The controller chip was designed by the U.S. firm Portal Player, but is produced by firms in either Taiwan or the United States. Other parts are manufactured in Japan, Thailand, Taiwan, Korea, and Singapore. Finally, the iPod is assembled by Taiwanese manufacturing firms in China.25
Andrew Reamer, “Improving Federal Statistics for Industry Studies” 14

Developing countries’ share of global intermediate good (sic) imports rose from 5.2 per cent to 29.6 per cent from 1988 to 2006, while their share of intermediate goods exports increased even more dramatically, from 3.9 per cent to 31.7 per cent.26
There are several consequences to this phenomenon. First, nations are becoming specialized in particular tasks, distinct from particular industries. Second, “[a]s countries become more vertically specialized, their imports and exports are increasingly composed of intermediate goods and services that are moving to the next stage in the chain.” Third, increased trade in intermediate goods and services substantially raises the amount of world trade taking place.27
The U.S. International Trade Commission (USITC) indicates that the impacts of these developments on the role of U.S. establishments have been substantial.
[S]upply chains have rearranged the pattern of U.S. trade, increasingly concentrating the production and export of skill-intensive goods and services in the United States while relocating other, less skill-intensive activities to other countries. Global supply chains have induced many leading U.S. companies to change their business models, refocusing on coordinating the assets and expertise of their business partners, and placing less emphasis on owning all key technological and managerial assets. . . . The effect of global supply chains on U.S. wages and employment varies for workers in different industries and occupations, and may also depend on the extent to which U.S. multinationals concentrate their activities in high-income or low-income countries.28
As complex multinational supply chains develop, traditional trade statistics are increasingly less able to provide a true view of the functions and value added provided by each nation. Johnson and Noguera note that the difference between value added to exports and the total value of gross exports can vary quite widely:
Trade in intermediate inputs accounts for as much as two thirds of international trade. By linking production processes across borders, this input trade creates two distinct measurement challenges. First, conventional gross trade statistics tally the gross value of goods at each border crossing, rather than the net value added between border crossings. This well-known “double-counting” problem means that conventional data overstate the domestic (value added) content of exports. Second, multi-country production networks imply that intermediate goods can travel to their final destination by an indirect route. For example, if Japanese intermediates are assembled in China into final goods exported to the U.S., then Chinese bilateral gross exports embody third party (Japanese) content. Together, “doublecounting” and multi-country production chains imply that there is a hidden structure of trade in value added underlying gross trade flows. . . .
[W]e find that the ratio of value added to gross exports (VAX ratio) varies substantially across countries and sectors. Across sectors, . . . VAX ratios are substantially higher in Agriculture, Natural Resources, and Services than in Manufactures. . . . Moving from aggregate to bilateral data, VAX ratios differ widely across partners for individual countries.
Andrew Reamer, “Improving Federal Statistics for Industry Studies” 15

For example, U.S. exports to Canada are about 40% smaller measured in value added terms than gross terms, whereas U.S. exports to France are essentially identical in gross and value added terms. . . . [T]he U.S.–China deficit is approximately 30–40% smaller when measured on a value added basis, while the U.S.–Japan deficit is approximately 33% larger. These adjustments point to the importance of triangular production chains within Asia.29
In a sophisticated use of international input-output data, economists at the USITC estimate that in 2004 less than a third of domestic value added in U.S. exports was in final goods consumed by importing nations:
• 32.5 percent U.S. domestic value added (DVA) in final goods consumed by importing nations • 27.6 percent DVA in intermediate exports used by importing nations to make final goods for
domestic consumption • 14.6 percent DVA in intermediate exports used by importing nations to produce items for
export • 12.4 percent DVA in intermediate exports to which importing nations added value and
shipped back to the U.S. • 12.9 percent foreign value added in gross exports (particularly from Canada and Mexico)30
In the last three years, a number of international and multinational organizations, including the World Trade Organization (WTO), the World Bank, OECD, and the European Commission, have recognized the need for TiVA data for policy purposes and the inability of current national and international statistical systems to produce such data. These organizations are actively pursuing the development of useful approaches to measuring TiVA. Of note:
• The World Trade Organization’s Made in the World Initiative (MiWi) was created “to support the exchange of projects, experiences and practical approaches in measuring and analysing trade in value added.”31
• Measuring Trade in Value-Added: An OECD-WTO joint initiative o OECD and the WTO agreed to develop a methodology for measuring trade in value-
added using inter-country input-output tables; sustain a network of relevant multilateral, national, academic, and research institutions; and encourage discussion on the implications of measuring trade in value added and “trade in tasks” on policy.
o The just released OECD-WTO TiVA database (May 2013) presents indicators for 58 economies (including all OECD countries, Brazil, China, India, Indonesia, Russian Federation and South Africa) covering the years 1995, 2000, 2005, 2008 and 2009 and broken down by 18 industries.32
o OECD’s STAN Bilateral Trade Database by Industry and End-use (BTDIxE) “presents international trade in goods broken down both by industrial sectors and by end-use categories allowing, for example, insights into the patterns of trade in intermediate goods between countries to track global production networks and supply chains, and helping to address policy issues such as trade in value added and trade in tasks.”33
Andrew Reamer, “Improving Federal Statistics for Industry Studies” 16

• World Input-Output Database (WIOD), WIOD Consortium, sponsored by the European Commission – “developed to analyse the effects of globalization on trade patterns, environmental pressures and socio-economic development across a wide set of countries.”34
At the same time, USITC staff and American academic researchers are recognized worldwide as being in the forefront of the development of models and options for estimating trade in value added.
• J. Bradford Jensen (Peterson Institute for International Economics/Georgetown University) pioneered the use of business microdata to estimate the extent to which U.S. firms import intermediate inputs from abroad. Specially, as a Census Bureau Research Data Center investigator, he catalyzed the development of the Longitudinal Firm Trade Transaction Database (LFTTD), which connects foreign trade transaction data assembled by the U.S. Census Bureau and U.S. Customs with the Center for Economic Studies’ Longitudinal Business Database (LBD). The LFTTD is now a Census Bureau dataset.35
• Economists at USITC, led by Robert Koopman, and in academia are pushing the state-of-the-art in the use of Inter-Country Input-Output tables to estimate, and disaggregate by type of, trade in value added.36 Koopman and colleagues also published an approach to measuring value-added in gross exports.37
• Timothy J. Sturgeon (MIT Industrial Performance Center) and Gary Gereffi (Duke University) have made a cogent proposal for classifying trade in value added data by a modified version of the BLS typology of business processes.38 o “Data collected according to a standardized set of generic business functions can
provide researchers and policymakers with a better map of the value chain, reveal the roles that domestic establishments, firms, and industries play within GVCs, and offer a unique view of the competitive pressures facing domestic firms and industries.”
• Gereffi, Sturgeon, and John Humphrey have identified five types of global value chains, differentiated by governance.39 Their aim is to encourage the creation of trade in value added datasets that can be used to track types of governance over time.
• Sturgeon, et al. have conducted a National Organizations Survey (using a $1 million NSF grant) to identify enterprise practices in the geographic dispersal of business functions.40
• USITC economists have published the most extensive, in-depth analysis of the U.S. position in global supply chains and the impact of these chains on the U.S. economy.41
The American Economic Association Committee on Economic Statistics commissioned a comprehensive review of the state of data for studying international trade and foreign direct investment. The authors assessed the two alternative approaches for measuring trade in value added (microdata and input-output). Recommendations include:
• “It is assumed that the proportion of intermediates that an industry purchases from abroad is equal to the share of total domestic consumption in that industry that is imported: this is the ‘proportionality assumption. To go beyond the proportionality assumption, it would be necessary to track imports by firm and industry . . . . Short of this, some improvement to the
Andrew Reamer, “Improving Federal Statistics for Industry Studies” 17

measure of offshoring obtained using this assumption can be achieved by restricting the economy-wide share of imports in domestic consumption to be the share of total intermediate imports in domestic intermediate use. This is done using additional information in the data on the End-use classification for imports, which distinguishes products as either intermediates or final goods.”
• “In the future, a more direct solution at the industry level would be for BEA to begin distinguishing between domestic- or foreign-produced inputs in the construction of the input-output tables. In other words, the number of rows in the “Make” matrix could be doubled: outputs could be distinguished by whether they are delivered to a domestic demander or a foreign demander (via exports) and, likewise, the “Use” matrix could distinguish between domestic or foreign supplied inputs.”
• “[M]ore work is needed in the construction of measures of goods and services offshoring using the firm-level datasets collected by BEA and the Census Bureau.”
• “While data on trade in services are now available at a more disaggregate level than at any other time, more detail is sorely needed.”
• “An alternative classification scheme used for U.S. merchandise imports that can also be used to make some headway on measuring offshoring, even without firm-level data, is the classification of ‘general imports’ versus ‘imports for consumption.’”42
In the AEA report, a Council of Foreign Affairs report, and various convenings, economists say that trade in value added should be done at the enterprise, not establishment, level.43
The USITC, U.S. academic researchers, WTO, OECD, World Bank, and European Commission have become part of a world-wide conversation regarding the development of methods for measuring trade in value added (TiVA). Clearly, the production of accurate, detailed measures of U.S. TiVA would be an important resource for understanding the role of U.S. establishments in the world economy. BEA has begun to explore the desirability, feasibility, and best methods of preparing such measures.44 It should continue to do so, seek Industry Studies Association input in the process, and craft a budget initiative based on its findings for Commerce Department and Office of Management and Budget review for the FY2015 budget.
Congress should approve BEA’s FY2014 initiative ($3.9 million) to substantially improve data collection on foreign direct investment.
Foreign direct investment (FDI) in the United States is an important source of U.S. jobs, income, and competitiveness. BEA indicates that in 2011, the U.S. direct investment position of foreign-owned firms was $2.548 trillion, including $838 billion in manufacturing. In 2010, these establishments employed 5.8 million workers, including 2.1 million in manufacturing.
Current, detailed FDI are a boon to industry researchers. However, due to last-minute budget cuts in late 2007, BEA was forced to cut data on greenfield FDI, increase FDI survey reporting thresholds, and eliminate state-level FDI data on manufacturing employment, property plant and equipment, and
Andrew Reamer, “Improving Federal Statistics for Industry Studies” 18

commercial property. As a result, researchers’ abilities to analyze industry dynamics and trust in data reliability have declined.45
In the FY2010 and FY2011 budgets, BEA asked for a little over $3 million in order to rebuild the FDI data program. Each time, Congress did not provide the funds. In its FY2014 budget request, BEA now has proposed a “Build It Here, Sell It Everywhere” initiative ($3.9 million) that would field a more detailed FDI survey. The new effort would differentiate between greenfield investments and acquisitions; restore state-level FDI subcategories; and “provide detailed information, by country and industry, on assets, sales, employment, trade, research and development, taxes, value added, and other measures of affiliates' activities . . . .”46
Significant improvements in the coverage and detail of BEA’s FDI data are essential for the purposes of industry analysis. Congress should provide BEA with the small amount of money required to implement its FY2014 budget initiative.
Congressional authorizing and appropriations committees should indicate that completion of the International Trade Data System is a priority. Further, Congress should provide an additional $10 million to complete the project.
As part of the Security and Accountability For Every (SAFE) Port Act of 2006, Congress mandated the creation of the International Trade Data System (ITDS) as an “electronic trade data interchange” to be operated by U.S. Customs and Border Protection (CBP).
ITDS is a project to build an electronic “single-window” for reporting imports and exports to the government. Currently, traders must make redundant reports to multiple agencies (often on paper). When completed, ITDS will allow traders to make a single electronic report, and the relevant data will be distributed to the appropriate agencies. Costs will be reduced for business and government. Agencies will obtain data more quickly, be able to process cargo more expeditiously, and be better able to identify unsafe, dangerous, or prohibited shipments. . . .
Currently, 47 agencies, including CBP, are working together to implement ITDS. The interagency ITDS Board of Directors, chaired by the Treasury Department, coordinates interagency participation in ITDS. CBP is responsible for building and operating ITDS.47
While the primary purpose of ITDS is cargo security, an explicit goal is to “[p]rovide access to more accurate, complete, and timely international trade information.”48 The Census Bureau is an active member of ITDS, largely due to its management of the Automated Export System (AES). CBP and Census have agreed to expand the data elements collected through AES to support other agencies’ export-related missions. CBP is developing a new automated export manifest system that would link with AES and is placing AES on a “modern hardware platform, in part to facilitate authorized sharing of data with other trade-processing systems.” One expected result is the incorporation of export declaration and manifest data into Census Bureau export statistics.
Andrew Reamer, “Improving Federal Statistics for Industry Studies” 19

The development of ITDS offers an opportunity for Census to enhance its foreign trade statistics by gaining access to new and more timely import and export data, including data on value added. By extension, BEA’s international accounts would be improved. Further, BLS would have access to export manifest data to improve the accuracy of price indices for goods exports and transportation services.
Between FY2008 and FY2011, Congress annually appropriated $16 million for ITDS. At the start of FY2013, the ITDS account had $31 million in unspent funds. CBP indicates that these funds are insufficient to complete the project, the funds are subject to reallocation to other priorities, contractor support has been eliminated, and government staff rotation and retirement is quickly increasing the risk of substantial problems.49 Given the relatively small amount of funds involved and the potential of ITDS to improve trade and trade statistics, it is recommended that Congress indicate that completion of ITDS is a priority and provide the additional funds necessary to complete the system.
Congress should provide BLS with the funds to prepare an input price index--$1.6 million a year for a three-year pilot and then $11 million a year for full implementation.
Accurate import price and productivity data are essential to competitiveness policy. However, economists have discovered, and BLS concurs, that the agency is underestimating improvements in terms of trade and overestimating manufacturing productivity growth (by 10-20 percent) because it incorrectly attributes to greater productivity the drop in intermediate input prices that occur when a manufacturer shifts from a domestic to foreign supply source.50 This means that overall U.S. economic growth may not have been as strong as originally calculated, with “phantom” increases to GDP.51 It appears to be a particular problem for the U.S. computer industry, according to the Information Technology and Innovation Foundation.52
BLS proposes to correct this inaccurate estimation of productivity by creating an input price index that differentiates between U.S. and foreign suppliers. Currently, BLS uses the Producer Price Index or the International Price Program’s Import Price Index to deflate the prices of inputs produced in other countries. However, these are not direct measures of the differences in the value of the inputs and their use likely leads to overestimates in productivity, such as that noted above. In contrast, a new input price index would more accurately reflect the different value of inputs produced domestically versus internationally. BLS already produces a number of price indices, and developing this new input price index would build on those programs. Furthermore, BLS has already taken steps to identify the feasibility of constructing this new input price index and would begin developing the actual index through a pilot program that establishes an input index on the materials costs for manufacturers. While BLS has not estimated total costs of a full-fledged effort, it has identified the factors that would affect total costs.53
In its FY2013 report covering the Labor Department, the Senate Appropriations Committee indicated: “The Committee recommendation includes sufficient funds to initiate a pilot input price index that would track price changes as establishments shift from domestic to foreign sources. Within this pilot project, the Committee directed BLS to develop a competitiveness audit that would compare the price of selected imports with comparable domestically produced goods and services.” However, as Congress
Andrew Reamer, “Improving Federal Statistics for Industry Studies” 20

funded the Labor Department for FY2013 under a continuing resolution, the Senate committee’s report language did not take force.
Congress should increase BLS base funding by $12 million to enable the agency to produce import and export price indices that fully cover traded services.
For 2012, the U.S. had a record $196 billion surplus on trade in services, compared to a $735 billion deficit on trade in goods. Services accounted for 22 percent of U.S. trade. As services continue to grow as a portion of both the U.S. economy and international trade, policymakers and researchers need thorough and accurate information on the relative prices of traded services, by industry, in order to fully assess the nation’s competitiveness. A complete set of trade in services price indices would allow the construction of “real” trade flows; price comparisons of similar foreign and domestic service industries; and better informed services trade negotiations. Further, current, accurate import and export prices for services would aid business decision-making in those sectors.
However, the BLS International Price Program (IPP) now only covers air passenger fares and air freight charges, amounting to just ten percent of U.S. services imports and seven percent of U.S. services exports. Absent are export and import price trends for key sectors such as business, professional, and technical services (such as management and consulting services, R&D and testing services, and computer and data processing services); financial and insurance services; education services; and telecommunications.
Because of fiscal year 2008 budget cuts, BLS was forced to drop coverage of prices of export travel and tourism, ocean liner freight, and postsecondary education (foreign students coming to the U.S.). Prior to these cuts, IPP covered only 20 percent of imported services and 35 percent of exported services.
The IPP continues to cover 100 percent of U.S. goods imports and exports. Due to the limited price coverage for traded services, the IPP measures prices for 84 percent of total imports (goods and services) and just 72 percent of total exports.54
BLS estimates that the additional annual cost to expand IPP services coverage would be $12 million. By FY2017, services coverage would reach 52 percent for imports and 34 percent for exports and would grow in succeeding years until coverage is complete.
Congress should increase BLS base funding by $140,000 to enable the agency to maintain a foreign currency price index.
At present, industry analysts cannot easily see the price of U.S. exports and imports from the perspective of foreign buyers and sellers. As BLS indicates:
From the point of view of a buyer in a foreign country, how the price of U.S. exports changes in foreign currency terms is more relevant than how the price changes in U.S. dollar terms. The price trend for U.S. exports in any given foreign currency can differ from the price trend in U.S. dollar terms, depending on how the value of the U.S. dollar varies relative to that currency. For example, a buyer in Canada may purchase a U.S. item that increases 5 percent
Andrew Reamer, “Improving Federal Statistics for Industry Studies” 21

in U.S. dollar terms. However, if the Canadian dollar rises by 10 percent compared with the U.S. dollar over the same period, in Canadian dollar terms, the item is actually 5 percent cheaper.55
Creating a foreign currency price index would allow U.S. policymakers, business decision-makers, and analysts to identify shifts in competitiveness in response to fluctuations in the value of the dollar, distinct from changes in cost and quality specific to individual U.S. and foreign goods and services. BLS has taken initial steps toward creating such an index. Its completion requires only coding testing and updating; production of the index would require minimal resource commitment by BLS staff. According to BLS, the annual cost would be $140,000.
Andrew Reamer, “Improving Federal Statistics for Industry Studies” 22

Entrepreneurship
Congress should ensure that the Census Bureau has sufficient appropriations to complete the 2012 Survey of Business Owners.
As part of the quinquennial Economic Census, the Census Bureau conducts the Survey of Business Owners (SBO), the nation’s most comprehensive analysis of business entrepreneurship. For 2012, the Census Bureau plans to survey 1.75 million firms, down from 2.3 million in 2007. The 2012 SBO will include statistics on business characteristics (e.g., age, sources of capital, export activity, e-commerce) and business owner characteristics (including gender, Hispanic origin, race, age, nation of birth, education level, and veteran status), disaggregated by industry, type of business, geography, and firm size.56
The first wave of surveys of the 2012 SBO are to be mailed in June 2013, with a second wave in June 2014, and data publication in 2015. Due to budget sequestration, doubts have been raised regarding the Census Bureau’s capacity to conduct the survey. Given the importance of business development to U.S. job creation, Congress should make sure that the Census Bureau has sufficient funds (roughly $10 million over five years) to carry out this effort.
The Economic Development Administration should consider creating a small grant program to support the development of regional entrepreneurship databases.
In order to understand the evolution of the strong entrepreneurial economy in North Carolina’s Research Triangle from the research park first inhabited in the 1960s, University of North Carolina professor Maryann Feldman is leading the effort to build a detailed database of Research Triangle businesses and their development over time. Feldman and her team began with a 1,800-firm database created by another professor. Using a wide variety of sources, the current version includes detailed information on all known business establishments in technology-intensive industries (e.g., life sciences, information and communication technology, and business services) that located in the Research Triangle metropolitan region between 1962 and the present, including 4,200 firms. Record elements include annual employment, profitability, sales, and patent filings; history of founding, spin-offs, mergers, acquisitions, and bankruptcies; venture capital, government financing, and IPO history; government contracts; and founder work and educational history (which helps identify networks and spin-offs).57
The Research Triangle database has become highly valuable for understanding the dynamics of regional economic competitiveness through business development. The creation of similar databases in other metropolitan areas would be useful, not only for the purposes of local development, but also because a series of place-specific databases would allow interarea research that could help identify those factors that stimulate entrepreneurship and competitiveness. Professor Feldman recently received a $420,000 grant from NSF to construct a transferable framework for studying regional entrepreneurship dynamics in other regions. The results are due in May 2015.
Andrew Reamer, “Improving Federal Statistics for Industry Studies” 23

The U.S. Commerce Department’s Economic Development Administration is encouraged to follow the progress of the UNC effort and, if appropriate, consider the desirability of creating a small grant program to support development of a series of regional entrepreneurship databases in exchange for periodic reports on research results as well as provision to CES for linkage to the LBD.
The president should direct the Small Business Administration to convene an interagency working group to identify and address needs for small business finance statistics.
New small businesses are important job generators.58 However, they often have difficulty obtaining the credit they need.59 Unfortunately, dynamics of small business finance are not well known, impeding the design of private and public efforts to address financing gaps.
The Federal Reserve Board (FRB) collected this information every five years or so, from 1987 to 2003, through the Survey of Small Business Finance (SSBF), gathering information on owner and firm characteristics (including financial resources and services used) of firms with fewer than 500 employees. However, the FRB cancelled the 2008 SSBF ($5 million cost) because, it said, the survey had been conducted under varying economic conditions and there was no need to spend additional funds. Then the Great Recession got underway.
Since the demise of the SSBF, there has not been one large, consistent, and standardized source of small business finance information. While the FRB, the Federal Deposit Insurance Corporation, the Treasury Department, the Small Business Administration (SBA), Census Bureau, the new Consumer Finance Protection Bureau, and the new Office of Financial Research all collect useful data, their efforts are not coordinated and integrated.
Consequently, it is suggested that the president issue a memorandum directing the SBA to organize a working group of the appropriate agencies and provide a proposal to OMB in nine months for a comprehensive, integrated effort to monitor small business finance conditions. As part of its work, the group might consider a number of survey proposals published in response to the SBFF cancellation.60
Andrew Reamer, “Improving Federal Statistics for Industry Studies” 24

Industry Research & Development
Congress should raise the budget base of the National Center for Science and Engineering Statistics by $3 million so the agency has the resources to publish detailed annual tables on industry R&D and innovation on a timely basis.
The National Science Foundation’s National Center for Science and Engineering Statistics (NCSES) is the primary federal data source for R&D expenditures. NCSES is a small agency. Its FY2012 budget was $36 million; its proposed FY2014 budget is $41 million.
NCSES obtains annual business R&D data by engaging the Census Bureau to manage the Business R&D and Innovation Survey (BRDIS). BRDIS replaced the long-standing, and far shorter, Survey of Industrial Research and Development (SIRD) as of 2008. BRDIS asks for information on five topics: financial measures of R&D, including worldwide and domestic activity; R&D activity funded by others; R&D employment; measures related to R&D management and strategy; and measures related to intellectual property, technology transfer and company performance.
BRDIS should be a rich resource of R&D and innovation data by industry. However, while data collection has been completed for four calendar years (2008-2011), NCSES has yet to publish any BRDIS tables by industry other than one very general table for 2008-2009.61 The latest detailed R&D tables by industry are from the 2007 SIRD, published in 2011.
Public policy and industry analysts need detailed BRDIS data by industry that are much more current. Congress should provide NCSES with a small amount of additional funds, about $3 million, to produce the detailed tables for 2008 through 2011 and install the resources to publish future annual reports with as little time lag as possible.
Congress should approve the NCSES FY2014 request for $2 million to institute an annual survey of R&D carried out by nonprofits other than universities (which are primarily hospitals).
In 2009, nonprofit organizations outside of universities accounted for 4.4 percent of U.S. R&D expenditures and 5.7 percent of R&D funded by the federal government.62 The last NSF survey of nonprofit R&D efforts was conducted for 1997—all subsequent estimates have been extrapolated from those data. Consequently, the post-1997 estimates are less reliable than those for other performer categories and provide no detail by industry.
The 1997 survey showed that 72 percent of 1997 nonprofit R&D spending focused on medical, health, and biological sciences and the bulk of that work took place in free-standing medical research institutes and hospitals.63 The current distribution of nonprofit R&D is unclear.
Congress should provide NCSES with the requested $2 million to conduct an annual survey of nonprofit R&D spending.
Andrew Reamer, “Improving Federal Statistics for Industry Studies” 25

Workforce
Congress should fully approve Census Bureau budget requests to conduct the American Community Survey and retain households’ legal responsibility to answer the survey fully and truthfully. The Census Bureau should promote greater public understanding of the value of participating in the ACS.
The Census Bureau has conducted the American Community Survey (ACS) since 2005, as the replacement for the decennial census “long form,” the data from which became quickly out of date. The ACS provides annual data on workforce characteristics valuable for industry analysis, including occupation, industry, educational attainment, undergraduate major, journey to work, age, sex, race, ethnicity, ancestry, and language spoken at home. The origins of the ACS can be traced back to the 1790 Census, which at the suggestion of Rep. James Madison included questions beyond those needed for enumeration. From that time forward, households have been legally required to fully and truthfully answer census questions.
In recent years, efforts have been undertaken in the House of Representatives to eliminate the ACS or at least eliminate the legal requirement to participate. In 2012, the House approved a measure prohibiting the spending of any funds on the ACS and on enforcing the mandatory response. Neither provision was present in the final Commerce Department appropriations bill. However, this year, bills with a similar intent again have been introduced. These efforts are catalyzed by constituent complaints about the intrusiveness of ACS questions, Census Bureau efforts to obtain answers, data misuse, and the potential for a $5,000 fine.
To allay these issues and maintain a fully funded, mandatory ACS (FY2014 request $242 million), the Census Bureau should better educate Congress regarding the multiplicity of uses of the ACS, provide House members with ACS data customized by congressional district, and address households’ concerns. Regarding the latter:
• The Census Bureau should make available to ACS recipients information on ACS uses by state and place.
• The Census Bureau should create an ACS partnership program, modeled on the decennial one and involving trusted third-party organizations willing to give constituents information and reassurance on ACS data uses and confidentiality.
• Congress should exempt Census Bureau household surveys from the uniform federal penalties and allow fine caps to revert to those in the Census Bureau statute—$100 for nonresponse and $500 for false statements.
• The Census Bureau should review and revise staff protocols and incentives so that non-responders do not feel harassed. It also might consider creating a hotline or ombudsman for constituents.
The Census Bureau is diligently working to address household concerns and expects to unveil new initiatives over 2013. It has created an ombudsman position to field respondent complaints.
Andrew Reamer, “Improving Federal Statistics for Industry Studies” 26

The Census Bureau’s Local Employment Dynamics program should be supported in its full-scale development.
The Census Bureau’s Local Employment Dynamics (LED) program is a remarkable effort that allows analysts to explore the flows of workers and their jobs over time and space. LED is made possible by advanced IT that allows computers to link and analyze hundreds of millions of establishment and employee wage records from state unemployment insurance systems. An experimental program for a decade, Congress approved permanent status for the program in 2009. With annual funding of $14 million, LED is in the midst of a three-year expansion plan.
At present, LED offers two online tools of value to industry researchers:
• Quarterly Workforce Indicators (QWI) analyzes workplace dynamics such as hires, fires, turnover, and wage levels by industry, geography (state, metro, county, and workforce investment area), and demographic characteristics (age, sex, race, ethnicity, and educational attainment).
• OnTheMap visualizes where people work in relation to where they live—users can custom-define an area and filter by worker characteristics such as industry, age, and educational attainment.
A planned third product, a job-to-job flows tool, will allow analysis of the movement of selected cohorts of workers (e.g., in a particular industry and geography, with particular demographic characteristics) through labor markets over time and space. For instance, analysts could determine:
• the extent to which workers remain in a regional cluster when they change jobs • which pairs of industries tend to experience an exchange of workers • how an industry’s job paths differ for young women and young men • outcomes for workers discharged or laid off from a particular industry, in terms of speed,
industry, location, and wages of reemployment • the career trajectories of individuals educated in the science, technology, engineering and
math (STEM) fields compared to those with degrees in other fields • the job outcomes for persons who obtain a particular type of educational credential or
attend a particular type of training program • the characteristics of effective trade adjustment assistance programs
Census Bureau researchers have conducted several prototype analyses to understand and demonstrate the possibilities.64
LED has the potential to transform analysts’ understanding of how industries work. Congress should ensure that the Census Bureau has sufficient resources to fully fund LED.
Andrew Reamer, “Improving Federal Statistics for Industry Studies” 27

Through some combination of improved modeling and expanded sample size, BLS should enable the Occupational Employment Statistics program to produce annual, rather than three-year average, estimates of employment by occupation by industry.
The Occupational Employment Statistics (OES) program produces data on jobs and earnings in about 800 occupations, by industry.65 The OES program is a collaboration between BLS and state LMI agencies—BLS provides administration and technical support (e.g., identification of members of the sample, the physical survey materials) and states conduct the new survey of 200,000 establishments every six months. Each May, BLS releases OES estimates based on data collected from 1.2 million establishments over the prior six surveys, with wages from the five earliest surveys adjusted by the Employment Cost Index.66 OES data are available for the nation, state, and metropolitan areas and provide the basis for national and state occupational projections.
Producing OES estimates on the basis of three years of surveys limits the usefulness of the data, for several reasons:
• The rolling three-year survey period does not allow analysts to construct time series. As a result, they cannot accurately track changes in occupational structure and demand by industry over time.
• The three-year average does not allow analysts to see rapid structural or cyclical changes in employment or wages.
• Using ECI-adjusted older wage data reduces estimate reliability.
In its FY2011 budget request, BLS asked for an additional $6.1 million to expand the OES sample sufficiently to produce single-year estimates and allow year-to-year comparisons. Congress did not fund this request. As an alternative, BLS is looking at creating single-year estimates through linking OES and National Compensation Survey data. BLS is urged to continue in this effort and find satisfactory means of generating one-year occupational data by industry.
Congress should provide ETA with an additional $8 million annually to ensure that the O*NET occupational database is complete, current, and includes emerging occupations.
Operating since 2001, ETA’s Occupational Information Network (O*NET) Data Collection Program maintains a database on the detailed characteristics of nearly 900 occupations, using a taxonomy based on the federal Standard Occupational Classification (SOC). Occupational characteristics include industries, tasks, tools, knowledge, skills, abilities, work values, work styles, basic and cross-functional skills, education, and organizational context. Information is collected through surveys of employed workers and occupational experts.
O*NET’s primary use is as a guide for students, workers, educators, and employers in making occupation-related decisions. The O*NET database is accessible through O*NET OnLine, a Web-based application.67 The website averages 1.1 million visitors monthly; the associated O*NET Resource Center (a suite of O*NET-related tools) receives 305,000 visit per month.
Andrew Reamer, “Improving Federal Statistics for Industry Studies” 28

Annual funding for O*NET is $4.6 million. At this budget level, O*NET can update profiles of only 100 occupations a year. Moreover, O*NET must allocate some funds to identify and add information on new and emerging occupations.68 While O*NET can revise high demand occupations on a more frequent basis, clearly many occupational profiles are not current, particularly given the rapid pace of technology change.
In 2010, a panel of the National Academies of Science conducted a thorough review of O*NET and made a series of technical, methodological, and administrative recommendations. In the report chapter on research uses of O*NET, the panel noted:
Since its inception in 1999, O*NET has become the primary database used by labor market researchers to assess how the skill requirements of jobs in the United States have changed over the recent past and how these requirements are likely to evolve. Relative to human capital measures and occupational categories, O*NET has three key strengths for this kind of research:
1. It offers the only contemporaneous U.S. data source that comprehensively measures what workers in America do at their jobs. That is, to the panel’s knowledge, O*NET does not have any close substitutes or close competitors as a source of information on the content of jobs performed by the U.S. workforce.
2. O*NET provides a tool for comparing job attributes and skill requirements across occupations at a point in time—for example, operators, fabricators, and laborers relative to farm occupations—and for evaluating changes in these job attributes over time.
3. O*NET provides an exceptionally rich set of scales for assessing job content along numerous dimensions.
The O*NET database is used with increasing frequency and prominence by economists and sociologists studying the evolution of the labor market. Three areas of particular focus have been the effects of computerization on labor demand, the susceptibility of U.S. jobs to international offshoring, and the impact that low-skilled immigrants have on the employment and earnings of U.S. natives. 69
However, the panel concludes, O*NET has significant limitations for research due to problems (mostly budget-related) in survey design, data collection, and data dissemination. Among many items, the panel noted that the current state of O*NET does not allow researchers to explore how occupations have evolved over time.
In light of O*NET’s value and high return on a small investment, it is recommended that Congress add $8 million to O*NET’s annual budget, for a total of $12.6 million, so that the program has the resources to regularly refresh the database and implement National Academies panel recommendations. These included better communicating O*NET attributes to researchers, providing researchers with additional
Andrew Reamer, “Improving Federal Statistics for Industry Studies” 29

statistics by occupation, making available successive waves of survey responses for longitudinal analysis, and providing researcher access to microdata under conditions of confidentiality.
Congress should provide BLS and ETA with $250,000 to explore the use of real-time labor market information in improving the reliability of a variety of employment data series and tools.
Real-time labor market information is an emerging web tool for tracking the extent and nature of employers’ demand for labor by occupation, industry, and geography. Real-time LMI vendors, both for-profit and nonprofit, regularly collect and aggregate online job ads and analyze them in terms of industry, occupation, skills, tasks, credential requirements, wage, and geography.70 Real-time LMI is built on advanced capacities for mining data from online job openings and artificial intelligence software that aggregates this information across a variety of publicly accessible databases.
The advent of advanced IT has enabled non-federal organizations to collect large volumes of non-standard information that have potential use, with proper care, in the construction of federal statistics. Recent research conducted by the author for Jobs for the Future’s Credentials That Work initiative indicates that real-time LMI has the potential to enhance a number of federal employment datasets and references, including:
• the 2017 revision of the Standard Occupational Classification system, particularly regarding emerging occupations
• BLS ten-year employment projections, particularly regarding emerging occupations • O*NET • measurement of job openings in the BLS Job Openings and Labor Turnover Survey • BLS monthly Current Employment Statistics at the state and metro level • ETA’s Industry Competency Initiative (goal: “promote an understanding of the skill sets and
competencies that are essential to educate and train a globally competitive workforce.”)71
BLS and ETA have expressed interest in exploring the uses of real-time LMI for the above purposes. However, they indicate that they lack the funds necessary to purchase seat licenses from real-time LMI vendors. It is recommended that Congress provide the agencies with $250,000 to support this potentially valuable work.
To improve the breadth of data available for industry research, BLS, ETA, and the state workforce agencies should collaborate on expanding the required fields of state unemployment insurance wage records.
State unemployment insurance systems provide the establishment and employee records that are the basis for the nation’s near-universal employment datasets—the BLS Quarterly Census of Employment and Wages (QCEW) and the Census Bureau’s Local Employment Dynamics program—as well as the emerging efforts of SLDS to measure labor market outcomes of educational experiences.
At present, the employee wage record does not include valuable information such as occupation, hours worked, and pay rate. In April 2013, the federal-state Workforce Information Council commissioned a
Andrew Reamer, “Improving Federal Statistics for Industry Studies” 30

study to explore the desirability and feasibility of enhancing the UI wage record to include these and other data elements, with the draft final report expected in April 2014.
The addition of data elements could substantially enrich research on workforce dynamics within and across specific industries. BLS and ETA leadership are encouraged to support federal-state efforts to enhance the UI wage record.
Federal statistical agencies should continue to develop means for accurately determining the extent to which U.S. adults hold non-degree postsecondary credentials—including subbaccalaurate educational certificates, professional licenses, and industry-recognized certifications—by industry.
A postsecondary credential—such as an associate’s degree, a community college certificate, an occupational license, or industry-recognized certification—is fast becoming a prerequisite for a worker to gain a stable career with decent wages.72
In recent decades, the number of adults with a certificate from a community college or vocational program has grown enormously. According to Georgetown University’s Center on Education and the Workforce:
• NCES awards data show that over 1 million certificates were awarded in 2010, compared to 300,000 in 1994.
• Certificates have grown from 6 percent of postsecondary awards in 1980 to 22 percent of awards today.
• Those who get a certificate earn, on average, 20 percent more than those without a postsecondary credential.73
Traditionally, however, federal statistical agencies have collected information on degree attainment alone. As a result, the nation does not have a clear picture of the extent to which its adult population holds non-degree postsecondary credentials, the nature of these credentials, and characteristics of credential holders, including occupation, industry, and wages.
In late 2009, a series of federal agencies—including the National Center for Education Statistics (NCES), Census Bureau, BLS, OMB, and the National Center for Science and Engineering Statistics (NCSES)—organized an interagency working group to develop new survey-based measures of work-related credentials. The Interagency Working Group on Expanded Measures of Enrollment and Attainment (GEMEnA) indicates that several member agencies intend to collect data on certifications and licenses and that NCES will improve the capacity of existing surveys to measure subbaccalaurate educational certificates.74 In a recent test of pilot questions, GEMEnA found that a substantial portion of the nation holds a non-degree credential.75 In 2013, it will be testing a mail version of the survey.
GEMEnA’s work is vital to generating data for workforce analysis by industry. NCES and its partner agencies are to be commended for, and encouraged to continue, their important work.
Andrew Reamer, “Improving Federal Statistics for Industry Studies” 31

Congress should approve NCES and ETA budget requests for improving statewide longitudinal data systems that examine employment and earnings outcomes for participants in particular educational credential programs.
Statewide longitudinal data systems (SLDS) are NCES-supported, state-managed efforts that track individual progress through formal education programs (pre-kindergarten to postsecondary) and into the labor market. SLDS grants are authorized by Title II of the Educational Technical Assistance Act of 2002 (No Child Left Behind). Since FY2006, 47 states and DC have received at least one SLDS grant, totaling $612 million over five rounds of funding. In the latest round (FY2012), the SLDS program gave out $97 million in grants.
The initial objective of the SLDS Grant Program was to enable state and local K-12 school systems to understand the relationship between educational outcomes and factors such as neighborhood, school, curricula, and family characteristics. In later grant rounds, NCES required SLDS to incorporate postsecondary student records and labor market outcomes, such as employment and earnings, in order to identify the personal, educational, and institutional influences on postsecondary experience and labor market outcomes.
ETA has a small complementary program, the Workforce Data Quality Initiative, which provides $1 million grants to state LMI agencies to help state education agencies gain access to workforce data, particularly UI employee wage records, for inclusion in the SLDS. ETA has held two rounds of grant competition, for a little over $12 million each. ETA received another $6.5 million from Congress for FY2012 and opened competition for those funds in March 2013.76
Of interest to industry researchers, a number of SLDS are building on-line tools that show workforce outcomes by individual postsecondary institution and credential program. To date, five states have posted data.77 One current limitation of these databases is that workforce outcomes data is limited to in-state workers, that is, those in that state’s unemployment insurance system. At present, efforts are underway to have all 50 states and DC join a UI data-sharing compact, Wage Record Interchange System (WRIS) 2.78
A network of 50 SLDS with robust workforce outcomes data would be a rich resource for industry researchers. For FY 2014, the Department of Education has requested $85 million for the SLDS Grant Program; the Department of Labor has asked for $6 million for the WDQI. Congress should approve these requests.
Congress should provide the National Center for Science and Engineering Statistics with an additional $10 million annually so the agency can build a multi-dimensional, multi-sourced database of the nation’s science and engineering workforce, by industry.
Since its predecessor’s founding in the early 1950s, NCSES has maintained near-exclusive reliance on sponsored surveys. As a consequence, the nature of the agency’s workforce publications has not changed significantly for several decades. They continue to provide tables of NCSES survey data on the nation’s stock of science and engineering (S&E) degree-holders, baccalaureate and above.79 The primary
Andrew Reamer, “Improving Federal Statistics for Industry Studies” 32

geography is the nation, with some tables available by state. The Scientists and Engineers Statistical Data System (SESTAT), the online tool for S&E workforce data analysis, includes only workers with at least a bachelor’s degree and offers Census regions (e.g., West North Central) as the lowest level of geography. The content and form of these resources are not particularly useful for industry analysis.
NCSES is strongly encouraged to adjust its approach to the gathering, analysis, and dissemination of S&E workforce data, including:
• utilizing external workforce data sources, such as the ACS, the OES, Local Employment Dynamics (Census), SLDS, O*NET, and real-time LMI
• covering S&E workers without a bachelor’s degree • producing analyses of the presence and role of S&E workers in individual industries • preparing profiles of the geography of the S&E workforce, including the presence in regional
industry clusters • regularly consulting with researchers regarding their data needs • offering a public use microdatabase with a reasonable level of industry and geographic
detail • providing a sophisticated, online analytic and visualization tools80
In order to carry out these recommendations, NCSES requires a budget substantially above its current $34 million base. It is recommended that Congress increase the NCSES base by $10 million so that the agency has the capacity to generate the data and analyses of greater utility to industry researchers. If Congress deems it important that the U.S. be globally competitive, it seems appropriate for the nation’s S&E statistical agency to be given the resources to carry out the work with 21st century methods and technologies.
Andrew Reamer, “Improving Federal Statistics for Industry Studies” 33

Business Microdatabases
The Census Bureau’s Center for Economic Studies should expand the Longitudinal Business Database to include external datasets such as those on foreign trade, patents, foreign direct investment, and management and organizational practices.
The Longitudinal Business Database (LBD) is maintained by the Center for Economic Studies (CES) in the Census Bureau. The LBD contains the universe of all U.S. business establishments with paid employees that are listed in the Census Bureau's Business Register. The LBD has a number of unique qualities, including:
• records on almost 24 million establishments, covering 1975 to present, with birth and death year information
• data on all employer establishments in scope for the Economic Census (i.e., all manufacturing, mining, construction, retail, wholesale, service, TCU and FIRE establishments), as well as public administration and other out-of-scope entities
• a complete, accurate set of longitudinal linkages of establishment records • detailed flags that describe, for each establishment, the nature of the linkages over each
year the establishment is observed in the data • information on establishment size, industry, location and ownership, permitting researchers
to analyze establishment demographics • the potential to link to external establishment and firm records
While the LBD currently provides researchers with access to a unique set of longitudinal business records, upgrades will enable more sophisticated analyses of industry dynamics. The Census Bureau is presently in the process of creating two new database variants of the LBD, one with a trade focus and one with an innovation focus. The first will link the LBD to import and export data from the Customs and Border Patrol’s International Trade Data System. The second will link to patent data from the U.S. Patent and Trademark Office. The plan is for these databases to be operational in 2014. One difficulty for both efforts is that the external records do not allow easy identification of location of the establishment, the LBD unit of analysis.
CES also is considering the integration of BEA foreign direct investment (FDI) data and data from the Census Management and Organizational Practices Survey (MOPS). The Census Bureau’s $3.5 million budget initiative to expand its capacity to evaluate federal programs (discussed below), includes funds to acquire new external datasets.
The Census Bureau should improve the ability of researchers to access microdata through its Research Data Center program.
The Census Bureau’s Research Data Center (RDC) program, managed by CES, provides academic researchers with special sworn status that allows them to electronically access individual business, household, and worker records for research purposes only.81 Nationwide, there are 14 RDC program
Andrew Reamer, “Improving Federal Statistics for Industry Studies” 34

partners, typically universities.82 The RDC program is a highly valuable resource for creating knowledge about the dynamics of U.S. industries.
At present, RDC program procedures for allowing researchers to gain access to business microdata can be lengthy and time-consuming. Researchers must undergo a rigorous multi-stage proposal process that includes pre-proposal discussions; submission and approval of a preliminary proposal; submission of the final proposal; review and approval by Census Bureau staff and outside experts on the basis of scientific merit, benefit to Census, importance of non-public data to the project, feasibility, and risk of disclosure; approval from the IRS if Federal Tax Information is involved; depending on the microdata requested, permissions from other federal agencies, other Census programs, state agencies, and the survey sponsors; and consultations with the RDC administrator at each step. Researchers must undergo a background check, acknowledge that they can be prosecuted if they deliberately or unintentionally disclose the confidential data, and participate in annual training at the RDC on confidential data.
CES is well aware that this process discourages researchers from submitting proposals and seeks ways to improve the process. Revising that process to facilitate non-government researcher microdata access, while fully protecting confidentiality and the Census Bureau’s interests, would be of benefit to industry studies.
Congress should approve the Census Bureau’s request for $3.8 million to build the capacity of Center for Economic Studies economists and Research Data Center participants to evaluate the economic impacts of federal assistance programs.
In recent years, Congress and the Bush and Obama Administrations have placed strong emphasis on the use of program performance measurement to drive spending decisions. In May 2012, Acting OMB Director Jeffrey Zientz advised agencies:
Since taking office, the President has emphasized the need to use evidence and rigorous evaluation in budget, management, and policy decisions to make government work effectively. This need has only grown in the current fiscal environment. Where evidence is strong, we should act on it. Where evidence is suggestive, we should consider it. Where evidence is weak, we should build the knowledge to support better decisions in the future. Agencies should demonstrate the use of evidence throughout their Fiscal Year (FY) 2014 budget submissions. Budget submissions also should include a separate section on agencies' most innovative uses of evidence and evaluation . . . .83
Consistent with the president’s emphasis, the Census Bureau has proposed two related FY2014 budget initiatives (totaling $3.8 million) to build the capacity of CES and the associated Research Data Center Network to support the evaluation of federal programs assisting businesses and individuals. As one approach, researchers would compare data on assisted businesses with those in a control group. With the requested funds, CES would add data files, support RDC researchers’ use of these files, add hardware, hire staff, and publish research documentation.
Andrew Reamer, “Improving Federal Statistics for Industry Studies” 35

The expanded RDC database would be a valuable resource to researchers interested in studying the impacts of federal assistance programs on particular industries. Congress should approve the Census Bureau’s request.
The Securities and Exchange Commission should create a revenue-funded bulk download tool that would allow industry researchers ready access to the full set of firm SEC filings.
Securities and Exchange Commission (SEC) filings are a very rich source of information on the structure, relationships, activities, and locations of U.S. corporations. Text analyses of these public data would greatly enhance understanding of firm and establishment characteristics and their impacts on competitiveness.
However, while SEC filings are publicly available, they are difficult to obtain in bulk because the agency's public access system, EDGAR (Electronic Data Gathering, Analysis, and Retrieval), is outdated and cumbersome. EDGAR’s underlying technology has not been improved since 1997. While EDGAR accommodates text-based searching, it is not interactive—consequently, users cannot navigate directly to the data they need. The EDGAR system becomes more opaque as disclosure documents continue to grow longer, reflecting more complex business arrangements and new disclosure obligations.
In response to the inaccessibility of SEC's public disclosure system, a cottage industry that culls and re-disseminates SEC filings has arisen. However, only industry analysts with adequate resources to pay for these third-party services can access the repurposed data. As a result, many analysts cannot see valuable, intelligible public data on U.S. businesses.
Consequently, the SEC is encouraged to add bulk download capability to its public data access system. The SEC’s Analytics Branch Chief, Jonathan Karp, is exploring such a possibility. After examining a similar system in New Zealand, under the Fulbright Program, Mr. Karp offers the following recommendations, which the SEC is urged to implement:
1) Provide the public with ad hoc, high-volume, machine-to-machine access directly from the SEC at no charge. Make use of cost-effective technologies, such as web services, to improve direct transmission of all disclosure data, irrespective of format or type, and irrespective of the status of various initiatives to improve accounting rules or data formats.
2) Eliminate any real or perceived requirements to review, redact, edit or otherwise prepare disclosure data for public access. Issue formal guidance clarifying that disclosure filers are legally liable for public viewing of data filed publicly, including any information considered private or confidential, whether requested by the agency or not, whether filed directly or by proxy.
3) Eliminate the post-intervention concept of “dissemination” and replace it with a registry-style disclosure model reflecting the primacy of direct public access.
Andrew Reamer, “Improving Federal Statistics for Industry Studies” 36

4) Fund the dissemination of disclosure data through disclosure filing fees, or at least in a manner that is entirely separate from the agency’s contractual arrangements with its internal systems developers.84
Andrew Reamer, “Improving Federal Statistics for Industry Studies” 37

1 In the 1930s, Samuel Stouffer wrote “In the 1880's, research in economics, sociology, political science, and education had hardly begun. . . . The social science research in Francis A. Walker's census of 1880, and in publications of the 1890 census completed under the supervision of Carroll D. Wright, probably was more significant, both in quantity and quality, than all the university research of the period put together. ... When one goes back a half century to the regular census volumes of 1880 and 1890, before the establishment of a permanent Bureau, one is astonished at both the quality and volume of analytical research in a period when the social sciences in the universities were still branches of philosophy, with little interest in data.” Quoted in Meyer H. Fishbein, “The Census of Manufactures: 1810-1890,” National Archives and Records Service, 1973, p. 31. 2 Secretary Hoover instituted annual business surveys and the publication of the monthly Survey of Current Business (now a BEA publication), encouraged cooperative data gathering, and sought to educate business decision-makers about the importance and use of data. A Census Bureau ethos of collaboration with trade associations on survey design and data collection continues to this day. 3 For instance, between 1991 and 2008, Congress rejected 13 annual Administration budget requests of about $8 million to collect data on all services industries on a regular basis. Congress approved the request on the fourteenth try, in March 2009. The prior rejections meant that quarterly data on finance, insurance, and real estate were not available at the onset of the Great Recession. 4 Jerome P. Reiter, “Statistical Approaches to Protecting Confidentiality for Microdata and Their Effects on the Quality of Statistical Inferences,” Public Opinion Quarterly, Vol. 76, No. 1, Spring 2012, pp. 163–181. 5 “Distribution of firms by number of establishments, first quarter 2005, not seasonally adjusted, in thousands,” Business Employment Dynamics program, Bureau of Labor Statistics, December 2005. 6 “Business Case for an Enterprise Statistics Program: Report of the Working Group on Enterprise Statistics,” Census Bureau, 2009. 7 The “Company Statistics” report of the 1954 Economic Census provides a large fold-out matrix that lays out industry or company against industry of establishment. 8 Randy Becker, Joel Elvery, Lucia Foster, C.J. Krizan, Sang Nguyan, and David Talan, “A Comparison of the Business Registers Used by the Bureau of Labor Statistics and the Bureau of the Census,” paper presented at the Joint Statistical Meetings, 2005. 9 Joel Elvery, Lucia Foster, C.J. Krizan, and David Talan, “Preliminary Micro Data Results from the Business List Comparison Project,” paper presented at 2006 Joint Statistical Meetings. 10 For a summary of the data synchronization effort, see Adrienne Pilot, “Data Synchronization: Leveraging Existing Business Data to Better Measure the Economy,” AMSTATNews, November 1, 2011. 11 In January 2012, the Census Bureau announced its intention to share data on multi-location businesses with BLS that are collected through its Economic Census and the Company Organization Survey (untainted by FTI). Census Bureau, “Proposed Data Sharing Activity,” Federal Register, January 27, 2012. 12 “U.S Census Bureau’s Budget Estimates, Fiscal Year 2013,” U.S. Census Bureau, February 2012. 13 Gene M. Grossman and Esteban Rossi-Hansberg, “Trading Tasks: A Simple Theory of Offshoring,” American Economic Review, vol. 98, no. 5, 2008, pp. 1978–1997; World Trade Organization, “Made in the World Initiative,” brochure, 2011:
[A] fundamental change . . . has been taking place in the structure of international trade. This change is referred to in various ways: vertical specialization, production sharing, trade in tasks, or supply chain trade, to cite just a few. What these all indicate is that much of trade these days comprises components or intermediate goods and services that pass from economy to economy before becoming part of a final traded product.
14 Daniel Carlson and Paul Sommers, “What the IT Revolution Means for Regional Economic Development,” The Brookings Institution, February 2003. 15 The data for the Mass Layoff Statistics program provides information on firms which have at least 50 initial unemployment claims in a five week period as well as the workers who experienced the separation. Due to budget sequestration, BLS is permanently shutting down the MLS program.
Andrew Reamer, “Improving Federal Statistics for Industry Studies” 38

16 Sharon Brown, “Business Processes and Business Functions: A New Way of Looking at Employment,” Monthly Labor Review, December 2008. 17 Timothy J. Sturgeon and Gary Gereffi, “Measuring success in the global economy: international trade, industrial upgrading, and business function outsourcing in global value chains,” Transnational Corporations, Vol. 18, No. 2, August 2009, p. 23. 18 Ibid. 19 For a discussion of this budget request, see: Economics and Statistics Administration, ”Economic and Statistical Analysis Budget: Budget Estimates, Fiscal Year 2012,” February 2011, pp. 40-44. 20 The primary business activity of an establishment is determined by relative share of production costs and/or capital investment (or other values such as revenue, value of shipments, or employment, which are often used as proxies). 21 How many manufacturing-related jobs does Detroit have? The Bureau of Economic Analysis says that in 2000 the Detroit metropolitan area had 467,000 manufacturing jobs, according to the SIC system, and that in 2001 the area had 371,000 manufacturing jobs, according to NAICS, a decrease of 97,000. In 2001, the region also had 44,000 jobs in the management of companies and enterprises, a category that did not exist in 2000. Other SIC manufacturing jobs shifted to NAICS categories such as transportation and warehousing. In contrast, the Bureau of Labor Statistics shows a NAICS-consistent change in manufacturing jobs of 392,000 to 359,000 between 2000 and 2001, a 32,000 job decline (BLS converted SIC data to NAICS back to 1990). BEA data include the self-employed, which tends to make its numbers a bit higher. That BEA’s job decline number is three times that for BLS can be attributed to the classification change. Under NAICS, then, it is now not possible to know how many jobs in the Detroit region are actually tied to the manufacturing industry. 22 Bureau of Economic Analysis, “Note on the December 2012 Update of Prototype, Quarterly GDP by Industry Statistics,” December 20, 2012. 23 Data are provided by “type of service,” which is not the same as NAICS industry. Types of service include travel, passenger fares, freight services, port services, royalties and license fees, industrial processes, film and television tape distribution, education, financial services, insurance services, telecommunications, and business, professional, and technical services (further subdivided). 24 Secretary of Commerce, in Consultation with the Secretary of Labor, “Report to the Committee on Finance of the Senate and the Committee on Ways and Means of the House of Representatives on Trade in Services Statistics,” January 2010. 25 U.S. International Trade Commission, The Economic Effects of Significant U.S. Import Restraints, Seventh Update 2011, Publication 4253, August 2011, p. 3-1. 26 Timothy J. Sturgeon and Gary Gereffi, op. cit. 27 U.S. International Trade Commission, op. cit., p. 3-3. 28 Ibid., p. 3-23. 29 Robert C. Johnson and Guillermo Noguera, “Accounting for Intermediates: Production Sharing and Trade in Value Added,” Journal of International Economics, v. 28, March 2012, pp. 224-236. 30 Robert Koopman, William Powers, Zhi Wang, and Shang-Jin Wei, “Give Credit Where Credit Is Due: Tracing Value Added in Global Production Chains,” Working Paper 16426, National Bureau of Economic Research, September 2010 (revised September 2011). 31 World Trade Organization, “Made in the World Initiative,” brochure, 2011. 32 Measuring Trade in Value Added: An OECD-WTO joint initiative. “Indicators of trade in value added are derived from the OECD Input-Output Tables, which were integrated into a global system using additional information on Bilateral Trade in goods by Industry and End-use (BTDIxE), International Trade in Services (TIS) and STAN industry databases.” 33 OECD, “Bilateral Trade in Goods by Industry and End-use Category.” 34 European Commission, “World Input-Output Database.” 35 Census Bureau, “Longitudinal Firm Trade Transactions Database (LFTTD).” Papers relying on the LFFTD include: Andrew Bernard, Bradford Jensen, and Peter Schott, “Importers, exporters and multinationals: a portrait of firms in the U.S. that trade goods,” in Producer Dynamics: New Evidence from Micro Data, ed. Timothy Dunne, J. Bradford Jensen, and Mark J. Roberts, 133-63. Chicago: University of Chicago Press, 2009; Robert C. Feenstra (UC-Davis) and
Andrew Reamer, “Improving Federal Statistics for Industry Studies” 39

J. Bradford Jensen (Georgetown University), “Evaluation Estimates of Materials Offshoring from U.S. Manufacturing,” October 2009; and Ron Jarmin, C.J. Krizan, and John Tang (Census Bureau), “Outsourcing, Offshoring, and Trade: Identifying Foreign Activity Across Census Data Products,” October 2009. 36 Koopman et al., op.cit.; Johnson and Noguera, op. cit. 37 Robert Koopman, Zhi Wang, and Shang-Jin Wei, “Tracing Value-added and Double Counting in Gross Exports,” NBER Working Paper No. 18579, November 2012. 38 Timothy J. Sturgeon and Gary Gereffi, op. cit. 39 Gary Gereffi, John Humphrey, and Timothy Sturgeon, “The governance of global value chains,” Review of International Political Economy, vol. 12, no. 1, 2005. 40 Timothy Sturgeon, et al., “Direct Measurement of Global Value Chains: Collecting Product- and Firm-Level Statistics on Value Added and Business Function Outsourcing and Offshoring,” final draft, Industrial Policy Center, MIT, April 2, 2012. 41 U.S. International Trade Commission, op. cit. 42 Robert C. Feenstra et al., “Report on the State of Available Data for the Study of International Trade and Foreign Direct Investment,” Working Paper 16254, National Bureau of Economic Research, August 2010. 43 Council on Foreign Relations, U.S. Trade and Investment Policy, Independent Task Force Report No. 67, 2011, pp. 15-16. 44 Maria Borga and Jiemin Guo, “Trade in Value Added,” presentation to the BEA Advisory Committee, May 10, 2013. 45 Feenstra et al., op.cit., p. 21. 46 Economics and Statistics Administration, “Economic and Statistical Analysis Budget: Budget Estimates, Fiscal Year 2014, As Presented to Congress, April 2013,” p. 33-34. 47 “Report to Congress on the International Trade Data System,” December 2012, p. ii. 48 “Vision, Mission and Goals,” International Trade Data System website, August 14, 2012. 49 “Report to Congress on the International Trade Data System,” December 2012. 50 William Alterman, “Producing an Input Price Index,” paper prepared for Conference on Measurement Issues Arising from the Growth of Globalization, November 2009; Michael Mandel and Susan Houseman, “Not all productivity gains are the same. Here's why.”, “What Matters,” McKinsey and Company, June 1, 2011. 51 Michael Mandel, “The Real Cost Of Offshoring,” Bloomberg Businessweek, June 18, 2007. 52 Stephen J. Ezell and Robert D. Atkinson, “The Case for a National Manufacturing Strategy,” Information Technology & Innovation Foundation, 2011. 53 Alterman, op.cit. On p. 14: “Assuming the methodological and data collection issues can be resolved, and assuming the Bureau is able to collect the necessary data from respondents, there remains the question of the cost of developing and maintaining these new indexes. On the one hand, the collection, review and verification of data for inclusion in price indexes still has a significant labor-intensive component, usually requiring a substantial level of expertise in economics and/or statistics. On the other hand, a significant (but unknown) amount of the necessary resources, both in human capital as well as data processing applications, may be shared with the Bureau’s other industrial price programs, (the IPP and the PPI). Any Bureau effort to produce an input price index past the research phase would require resources sufficient cover collecting approximately 15,000 items and publishing approximately 600 6-digit Material Codes (which are similar to NAICS codes). The process for developing these series would extend over several years. Extending the set of indexes to cover the three additional phases would entail an additional annual cost.” 54 Department of Labor, “FY 2014 Congressional Budget Justification: Bureau of Labor Statistics,” April 2014. 55 Bureau of Labor Statistics, “Import and Export Prices: First Quarter 2010,” Focus on Prices and Spending, Vol. 1, No. 1, May 2010. 56 According to the SBO website: “The SBO universe is stratified by state, industry, frame, and whether the company has paid employees. The Census Bureau selects large companies, including those operating in more than one state, with certainty. These companies are selected based on volume of sales, payroll, or number of paid employees. All certainty cases are sure to be selected and represent only themselves (i.e., have a selection probability of one and a sampling weight of one). The certainty cutoffs vary by sampling stratum, and each stratum
Andrew Reamer, “Improving Federal Statistics for Industry Studies” 40

is sampled at varying rates, depending on the number of firms in a particular industry in a particular state. The remaining universe is subjected to stratified systematic random sampling.” 57 Additional firms are identified using newspapers, on-line media, and regional corporate directories. Firm-specific data and information are obtained from the National Establishment Time Series (NETS), which organizes Dun and Bradstreet records, the U.S. Patent and Trademark Office, and firm websites, annual reports, and press releases; Firm data and information include annual employment, profitability, sales, patent filings, mergers, acquisitions, and bankruptcies. Federal, state, and local government contracts are tracked as well. Founder information on career and educational history are taken from LinkedIn; this information enables the tracing of spin-offs. 58 Kelly Edmiston, “The Role of Small and Large Businesses in Economic Development,” Economic Review, Federal Reserve Bank of Kansas City, Second Quarter 2007. 59 Alicia Robb, “The Landscape for Small Businesses and Entrepreneurs,” Conference on Small Business and Entrepreneurship during an Economic Recovery, hosted by the Federal Reserve Board of Governors, November 9, 2011. 60 Alicia Robb, “Beyond the Late, Lamented Survey of Small Business Finances,” APDU Newsletter, March/April 2010, Association of Public Data Users, pp. 7-9; E.J. Reedy and Alicia Robb, “A proposal to improve our understanding of entrepreneurship using the Survey of Business Owners and Self-Employed Persons,” 2008 Kauffman Symposium on Entrepreneurship and Innovation Data. 61 Raymond Wolfe, “Business R&D Performed in the United States Cost $291 Billion in 2008 and $282 Billion in 2009,” InfoBrief, National Center for Science and Engineering Statistics, National Science Foundation, NSF 12-309, March 2012, Table 2. 62 National Science Foundation, “National Patterns of R&D Resources: 2009 Data Update,” June 2012. 63 Top performers included the Howard Hughes Medical Institute, the Mayo Foundation, and the Memorial Sloan Kettering Cancer Center. See National Science Foundation, “Research and Development Funding and Performance by Nonprofit Organizations: Fiscal Years 1996 and 1997,” NSF 02-303, October 2001. 64 Henry Hyatt and Erika McEntarfer, “Job-to-Job Flows in the Great Recession,” American Economic Review, vol. 102, no. 3, May 2012, pp. 580–83; Ron Jarmin, “Job-to-Job Flows: Sneak Peak at upcoming innovations from the Longitudinal Employer-Household Dynamics (LEHD) Program,” slide presentation, September 2010. 65 See Bureau of Labor Statistics, Occupational Employment Statistics. 66 “May 2011 estimates are based on responses from six semiannual panels collected over a 3-year period: May 2011, November 2010, May 2010, November 2009, May 2009, and November 2008. . . . The OES program uses the BLS Employment Cost Index (ECI) to adjust survey data from prior panels before combining them with the current panel's data.” Bureau of Labor Statistics, “Occupational Employment and Wages -- May 2011,” News Release, March 27, 2012. 67 O*NET Online, National Center for O*NET Development. 68 The National Center for O*NET Development, “New and Emerging (N&E) Occupations: Methodology Development Report,” March 2006. 69 National Research Council, A Database for a Changing Economy: Review of the Occupational Information Network (O*NET), 2010, Chapter 9, “Uses in Research,” pp. 172-174. 70 See links to real-time LMI vendors at http://www.gwu.edu/~gwipp/innovregstats2.htm#Jobs. 71 Industry Competency Initiative, Employment and Training Administration. 72 “Over the past three decades, higher education has become a virtual must for American workers. Between 1973 and 2008, the share of jobs in the U.S. economy which required postsecondary education increased from 28 percent to 59 percent. According to our projections, the future promises more of the same. The share of postsecondary jobs will increase from 59 to 63 percent over the next decade. High school graduates and dropouts will find themselves largely left behind in the coming decade as employer demand for workers with postsecondary degrees continues to surge.” Anthony P. Carnevale, Nicole Smith, and Jeff Strohl, “Help Wanted: Projections of Jobs and Education Requirements through 2018,” Executive Summary, Center for Education and the Workforce, Georgetown University, 2010, p. 1. 73 Anthony P. Carnevale, Stephen J. Rose, and Andrew R. Hanson, “Certificates: Gateway to Gainful Employment and College Degrees,” Center for Education and the Workforce, Georgetown University, 2012.
Andrew Reamer, “Improving Federal Statistics for Industry Studies” 41

74 Sharon A. Boivin and Isaiah L. O’Rear, “Measurement Strategies for Identifying Holders of Certificates and Certifications,” National Center for Education Statistics, presented at 2012 Federal Committee on Statistical Methodology Research Conference, January 2012. 75 “Based on the ATES Pilot Study, approximately 38 percent of adults reported holding a certification, license, or subbaccalaureate educational certificate in 2010–11, which translates into roughly 82 million adults in the United States. About 30 percent of adults reported holding a certification or license and 14 percent reported they earned a certificate.” From National Center for Education Statistics, “The Adult Training and Education Survey (ATES) Pilot Study: Technical Report,” April 2013, p. v. The report emphasizes (p. 4) that “The research effort described in this summary was undertaken for questionnaire and procedural development purposes only. The information collected and published from this effort should not be used to generate or cite population estimates or other statistics because the sample design and data collection procedures for this pilot study were not intended for that purpose, but rather to support the evaluation of questionnaire items.” 76 Workforce Data Quality Initiative, Employment and Training Administration. 77 Economic Success Metrics Program, Collegemeasures.org. 78 Wage Record Interchange System (WRIS) 2, Employment and Training Administration. 79 See, for example, National Science Foundation, “Characteristics of Scientists and Engineers in the United States: 2006,” NSF 11-318, September 2011. 80 NCSES’ new Science and Engineering Indicators 2012 State Data Tool represents a significant move in the right direction. 81 Data sources include, but are not limited to, the Economic Census, the LBD, the Annual Survey of Manufactures, the 2010 Census, the American Community Survey, the Current Population Survey, the Local Employment Dynamics program. 82 Looking at the RDC map, the centers are located near the nation’s borders—east, south, west, and north. 83 Jeffrey D. Zientz, “Use of Evidence and Evaluation in the 2014 Budget,” M-12-14, OMB, May 18, 2012. 84 Jonathan F. Karp, “Can the US Import ‘Sunlight’ from New Zealand?: An Assessment of New Zealand’s Model for Corporate Financial Disclosure,” August 2011, with funding from the sponsors of the Ian Axford (New Zealand) Fellowships in Public Policy.
Andrew Reamer, “Improving Federal Statistics for Industry Studies” 42