improving flood modelling and visualisation using remote
TRANSCRIPT
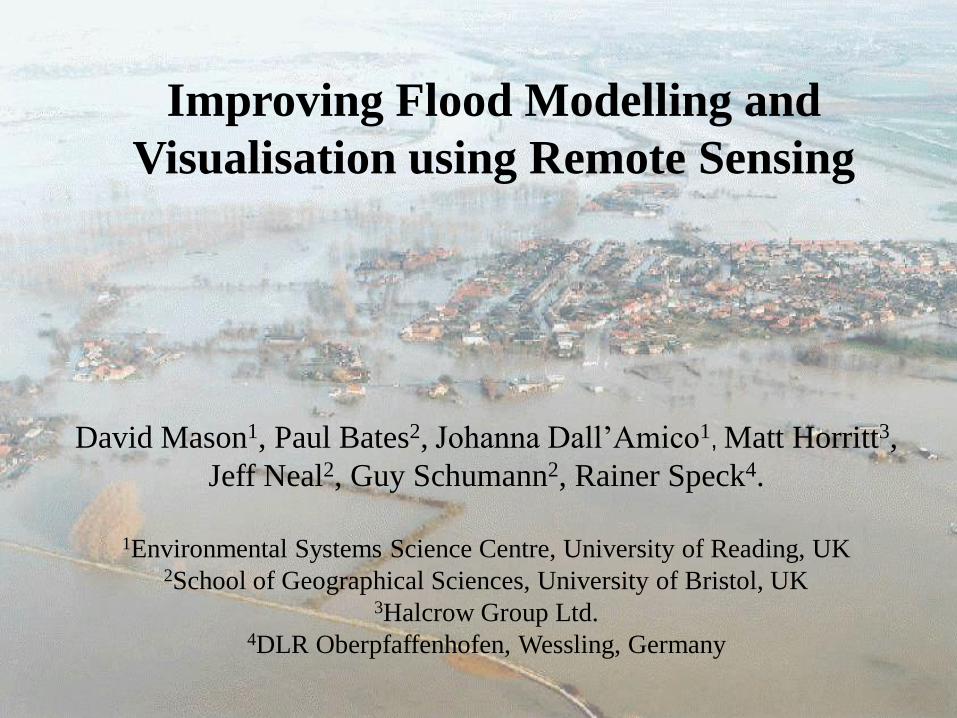
Improving Flood Modelling and
Visualisation using Remote Sensing
David Mason1, Paul Bates2, Johanna Dall’Amico1, Matt Horritt3,
Jeff Neal2, Guy Schumann2, Rainer Speck4.
1Environmental Systems Science Centre, University of Reading, UK2School of Geographical Sciences, University of Bristol, UK
3Halcrow Group Ltd.4DLR Oberpfaffenhofen, Wessling, Germany
Predictions of flood extent
Used -
– for maintaining flood defences
– for emergency flood relief management
– for risk assessment
Object is to improve flood models by using remotely sensed
data (SAR, LiDAR) to validate and parameterise the
models.
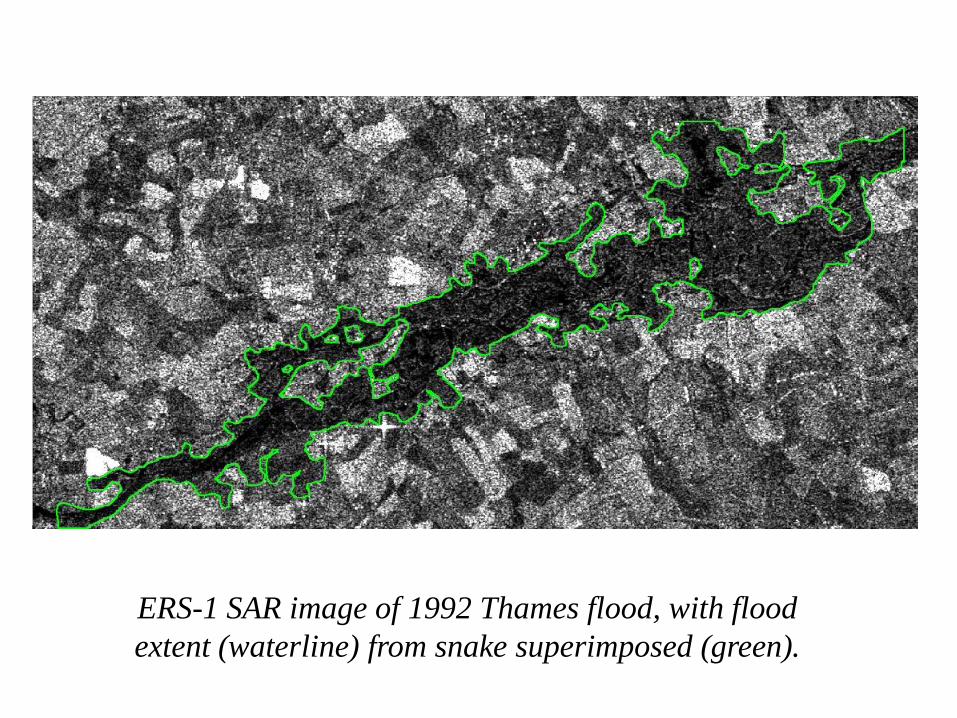
ERS-1 SAR image of 1992 Thames flood, with flood
extent (waterline) from snake superimposed (green).
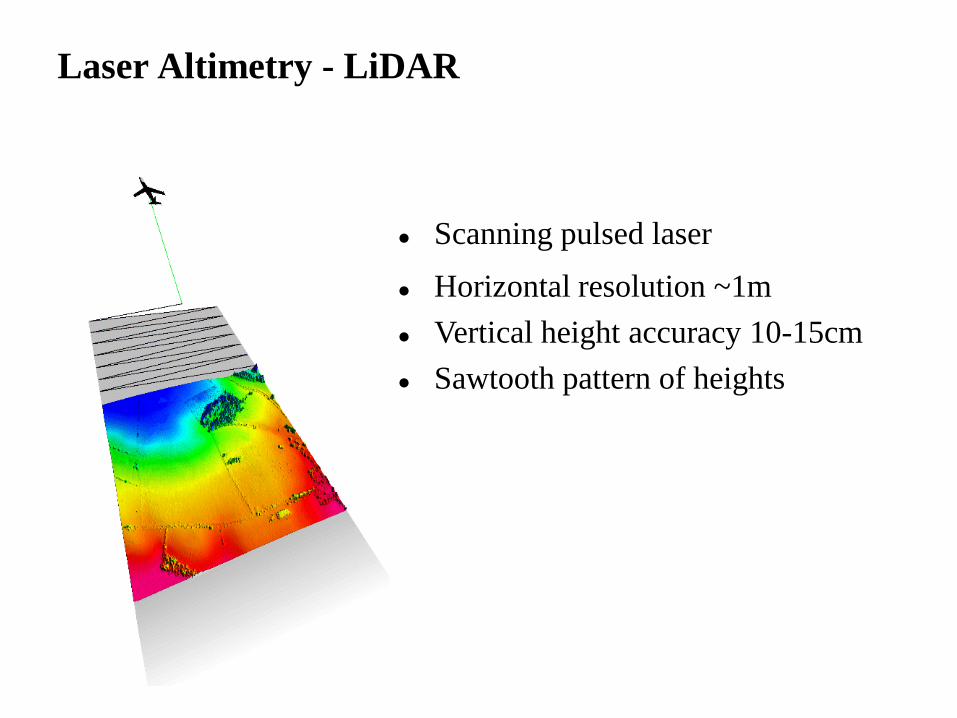
Laser Altimetry - LiDAR
Scanning pulsed laser
Horizontal resolution ~1m
Vertical height accuracy 10-15cm
Sawtooth pattern of heights
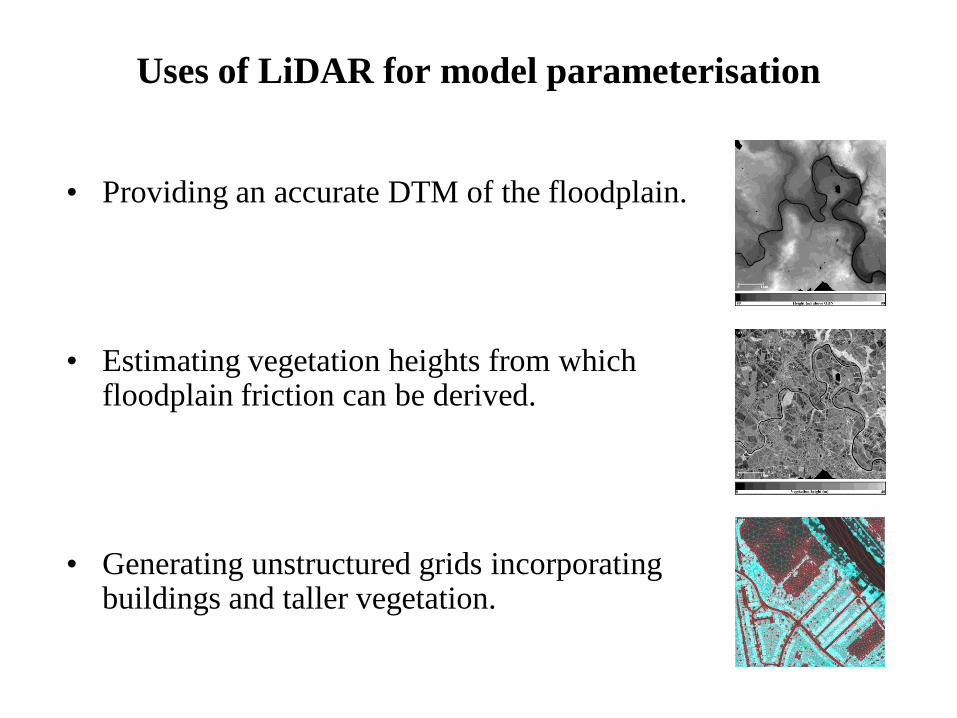
Uses of LiDAR for model parameterisation
• Providing an accurate DTM of the floodplain.
• Estimating vegetation heights from which floodplain friction can be derived.
• Generating unstructured grids incorporating buildings and taller vegetation.
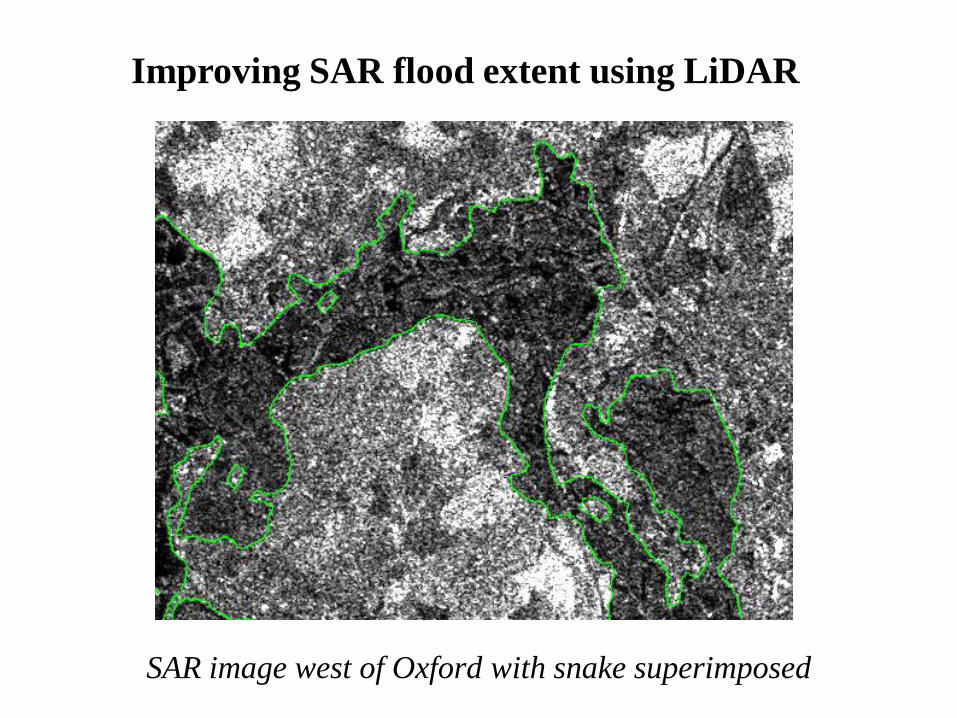
SAR image west of Oxford with snake superimposed
Improving SAR flood extent using LiDAR
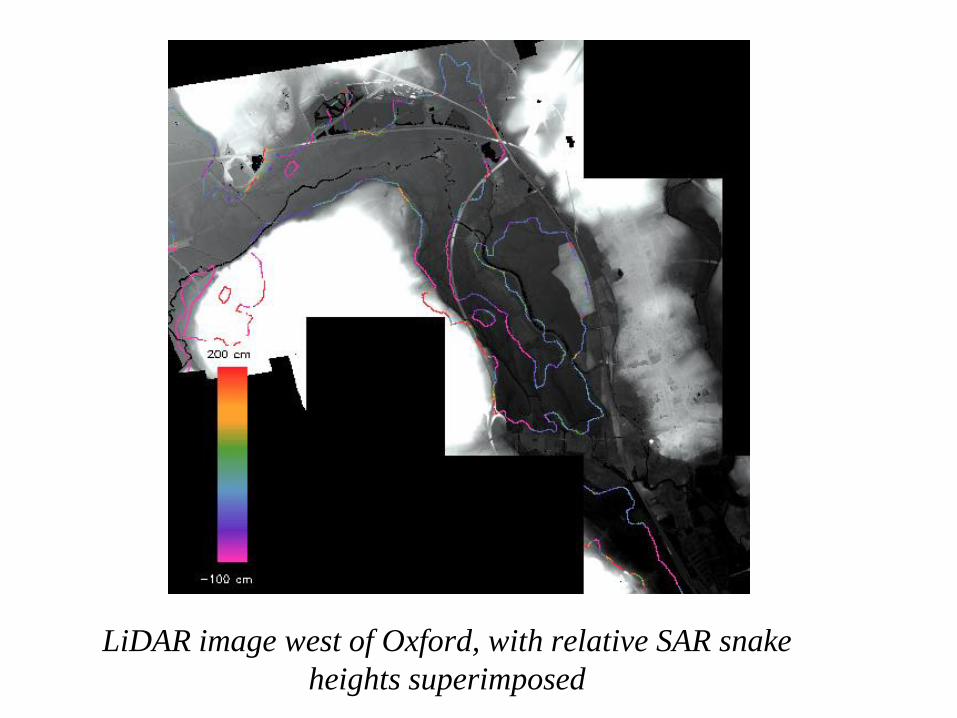
LiDAR image west of Oxford, with relative SAR snake
heights superimposed
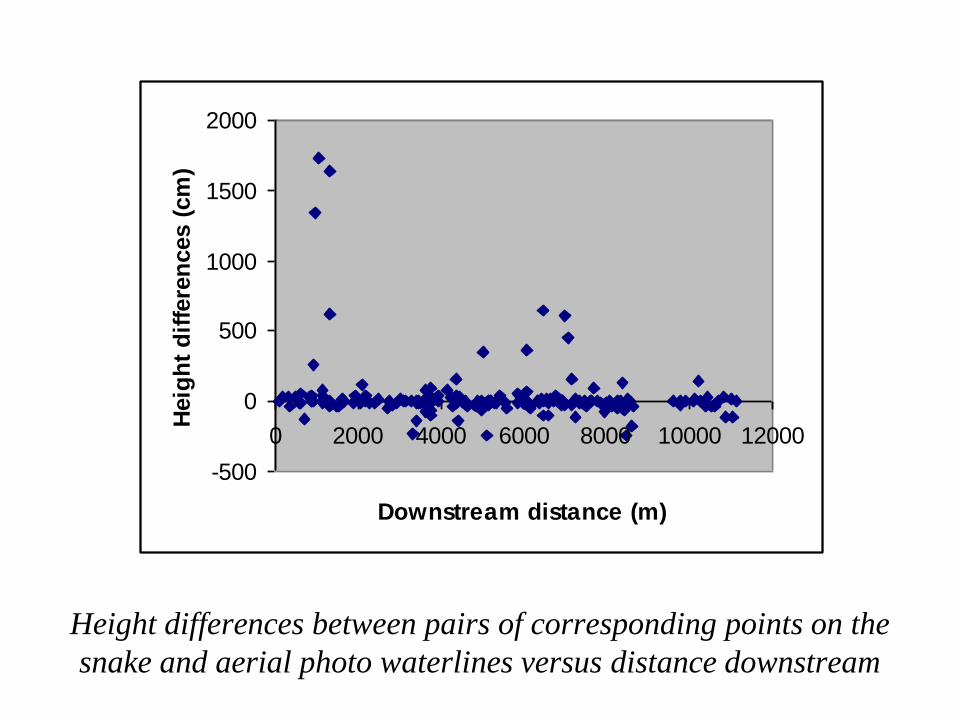
Height differences between pairs of corresponding points on the
snake and aerial photo waterlines versus distance downstream
-500
0
500
1000
1500
2000
0 2000 4000 6000 8000 10000 12000
Downstream distance (m)
Heig
ht
dif
fere
nces (
cm
)
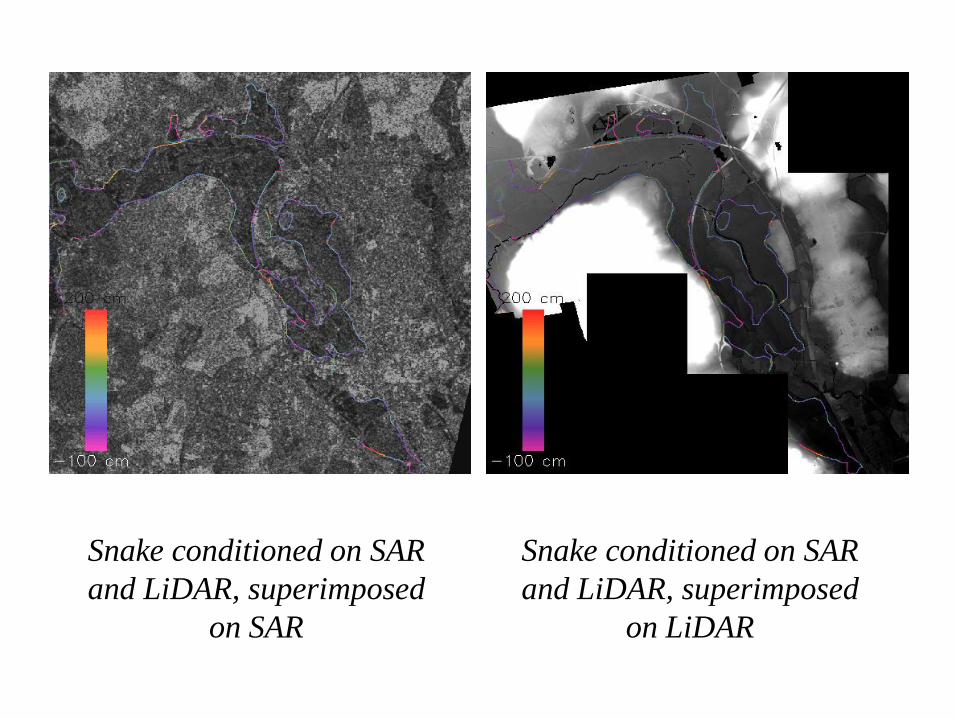
Snake conditioned on SAR
and LiDAR, superimposed
on SAR
Snake conditioned on SAR
and LiDAR, superimposed
on LiDAR
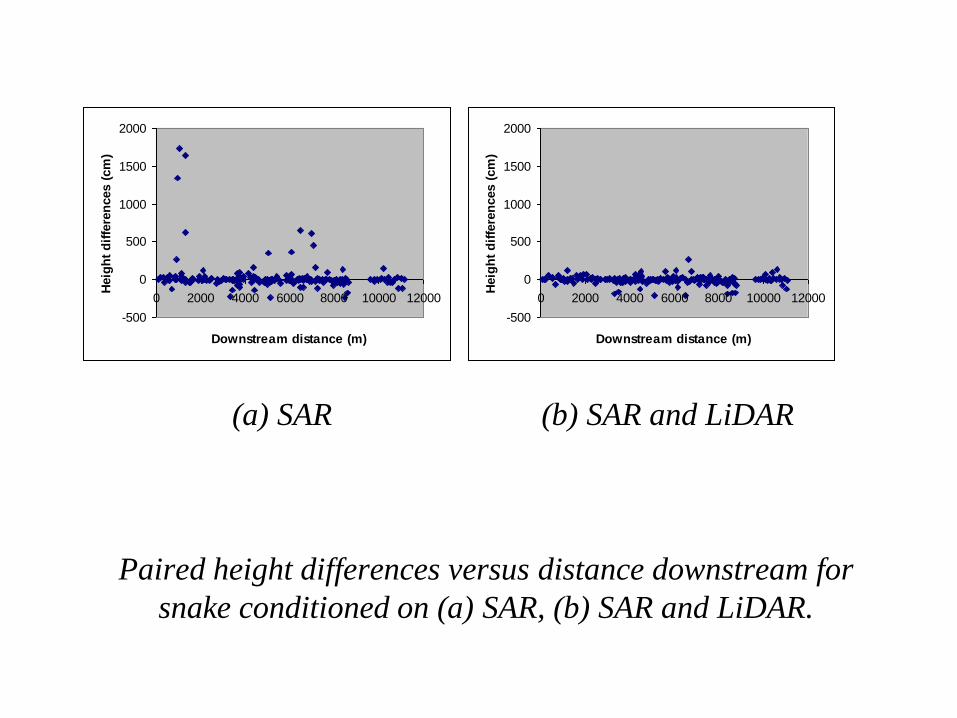
Paired height differences versus distance downstream for
snake conditioned on (a) SAR, (b) SAR and LiDAR.
-500
0
500
1000
1500
2000
0 2000 4000 6000 8000 10000 12000
Downstream distance (m)
Heig
ht
dif
fere
nces (
cm
)
-500
0
500
1000
1500
2000
0 2000 4000 6000 8000 10000 12000
Downstream distance (m)
Heig
ht
dif
fere
nces (
cm
)
(a) SAR (b) SAR and LiDAR
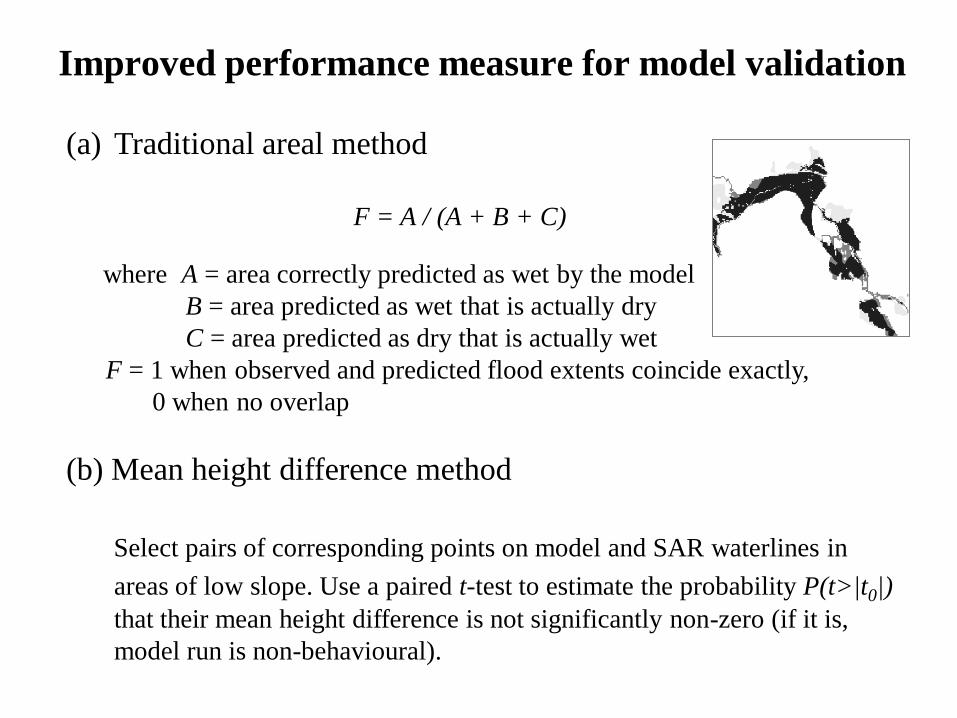
Improved performance measure for model validation
(a) Traditional areal method
F = A / (A + B + C)
where A = area correctly predicted as wet by the model
B = area predicted as wet that is actually dry
C = area predicted as dry that is actually wet
F = 1 when observed and predicted flood extents coincide exactly,
0 when no overlap
(b) Mean height difference method
Select pairs of corresponding points on model and SAR waterlines in
areas of low slope. Use a paired t-test to estimate the probability P(t>|t0|)
that their mean height difference is not significantly non-zero (if it is,
model run is non-behavioural).
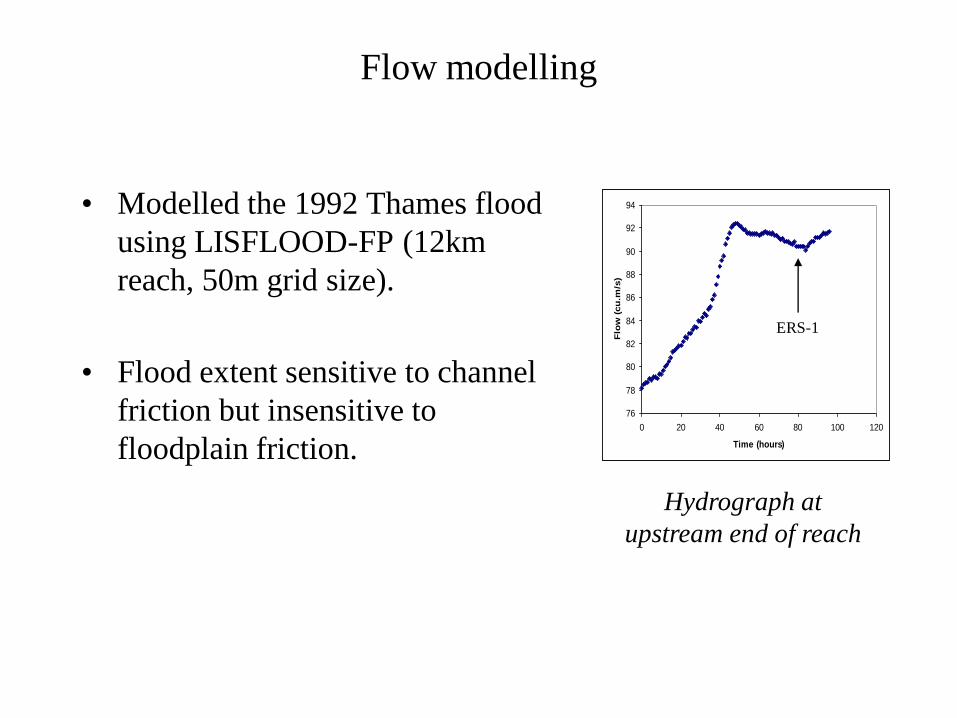
Flow modelling
• Modelled the 1992 Thames flood
using LISFLOOD-FP (12km
reach, 50m grid size).
• Flood extent sensitive to channel
friction but insensitive to
floodplain friction.
76
78
80
82
84
86
88
90
92
94
0 20 40 60 80 100 120
Time (hours)
Flo
w (
cu
.m/s
)
ERS-1
Hydrograph at
upstream end of reach
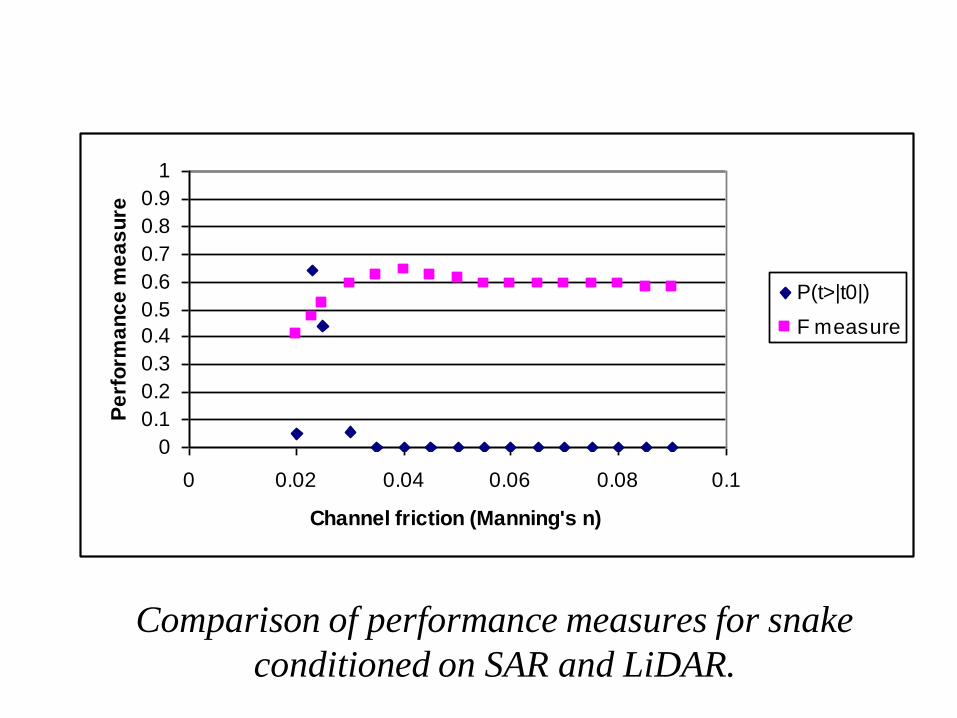
Comparison of performance measures for snake
conditioned on SAR and LiDAR.
0
0.1
0.2
0.3
0.4
0.5
0.6
0.7
0.8
0.9
1
0 0.02 0.04 0.06 0.08 0.1
Channel friction (Manning's n)
Pe
rfo
rma
nc
e m
ea
su
re
P(t>|t0|)
F measure
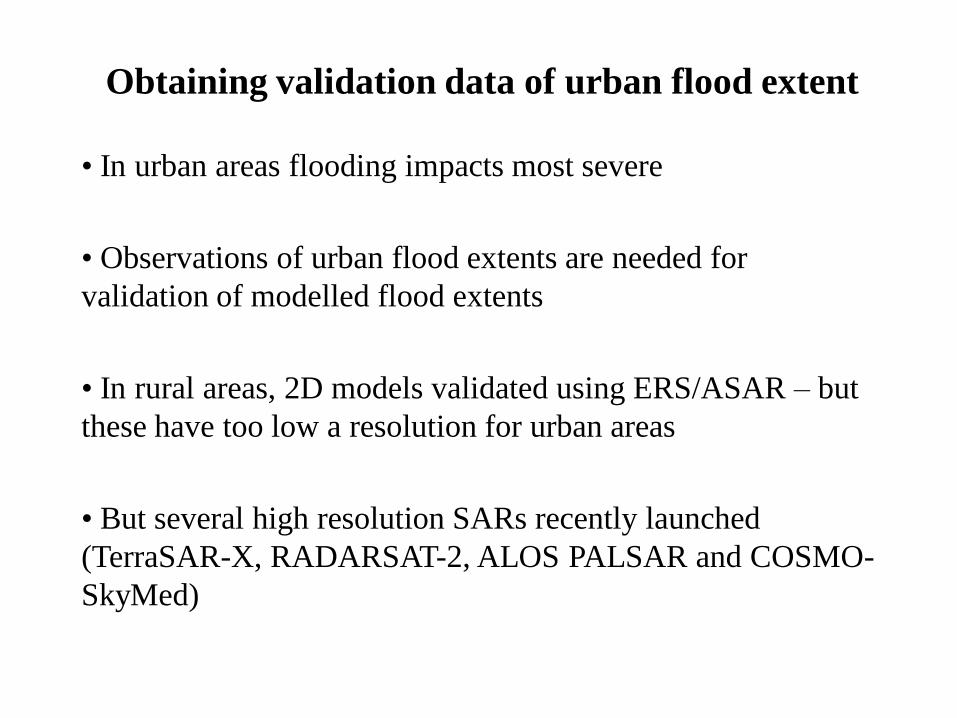
Obtaining validation data of urban flood extent
• In urban areas flooding impacts most severe
• Observations of urban flood extents are needed for
validation of modelled flood extents
• In rural areas, 2D models validated using ERS/ASAR – but
these have too low a resolution for urban areas
• But several high resolution SARs recently launched
(TerraSAR-X, RADARSAT-2, ALOS PALSAR and COSMO-
SkyMed)
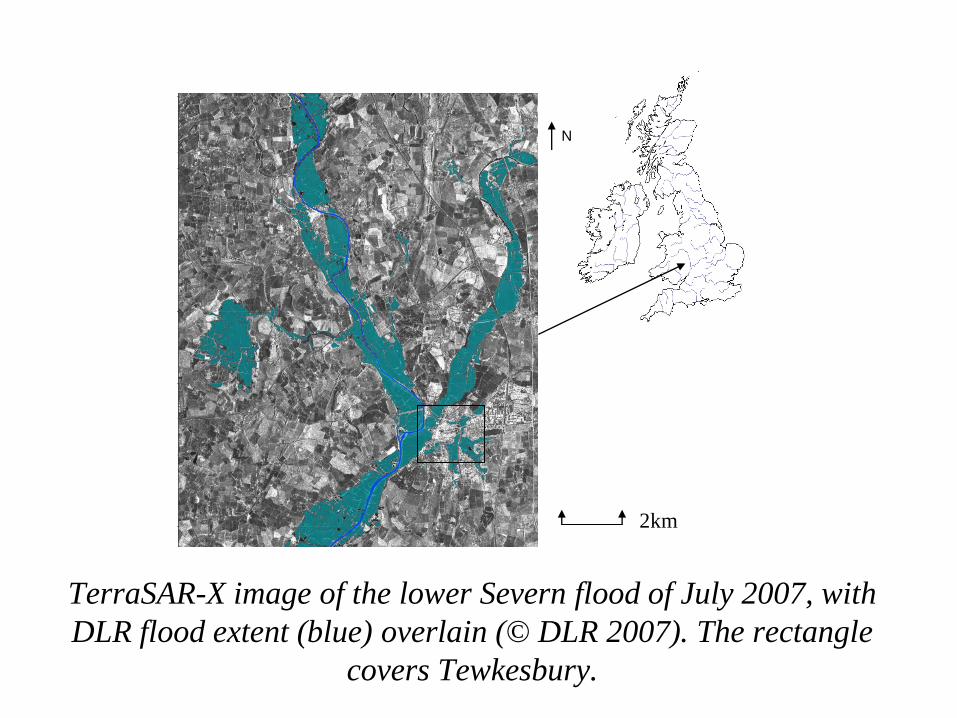
TerraSAR-X image of the lower Severn flood of July 2007, with
DLR flood extent (blue) overlain (© DLR 2007). The rectangle
covers Tewkesbury.
N
2km
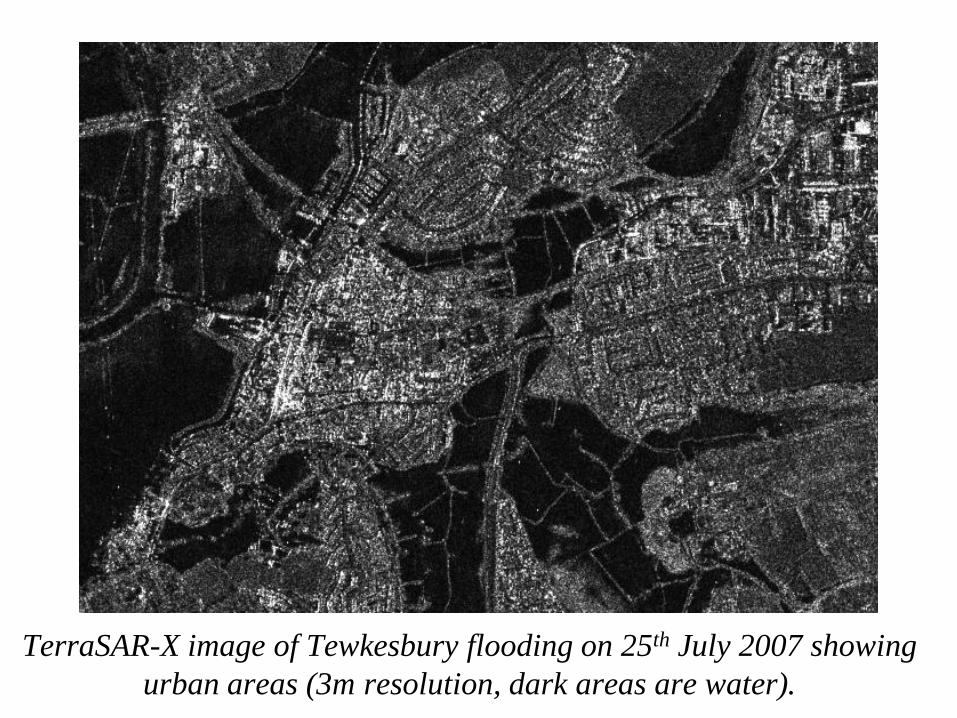
TerraSAR-X image of Tewkesbury flooding on 25th July 2007 showing
urban areas (3m resolution, dark areas are water).
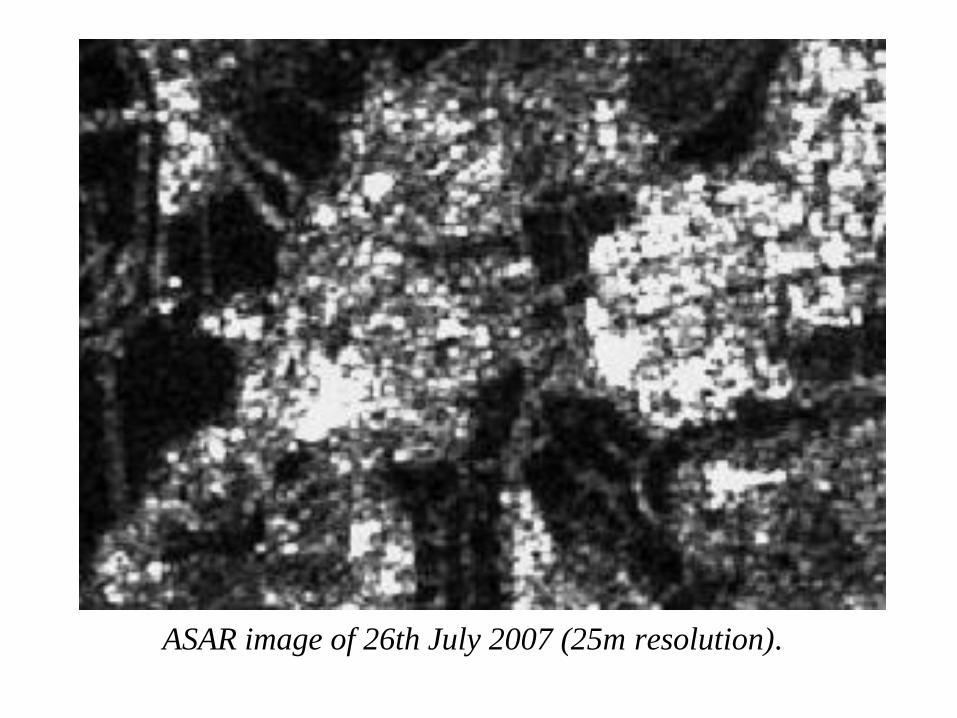
ASAR image of 26th July 2007 (25m resolution).
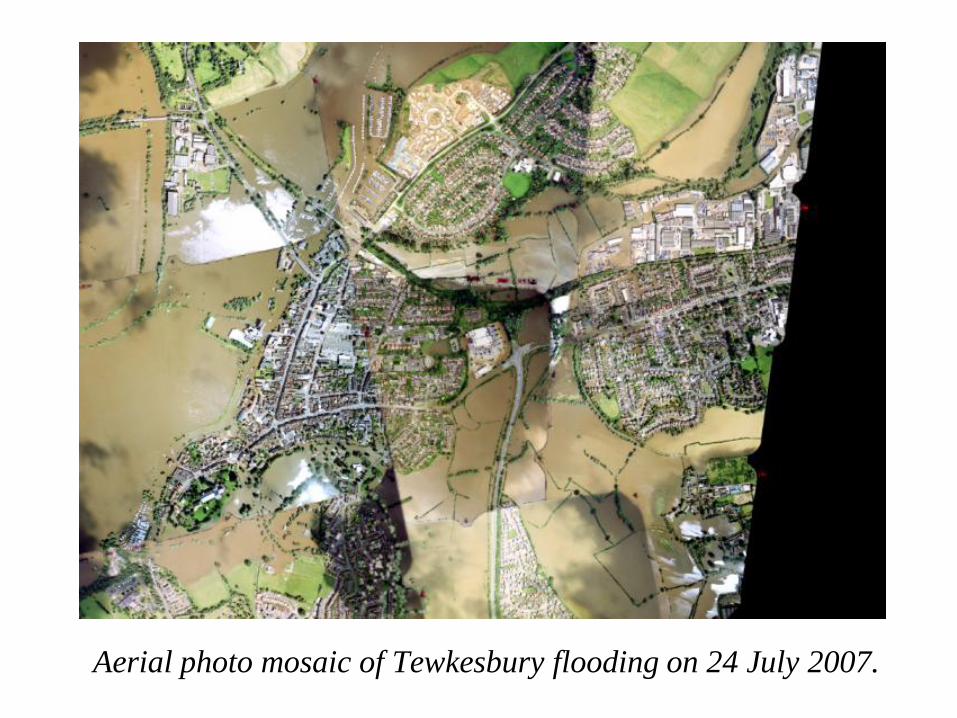
Aerial photo mosaic of Tewkesbury flooding on 24 July 2007.
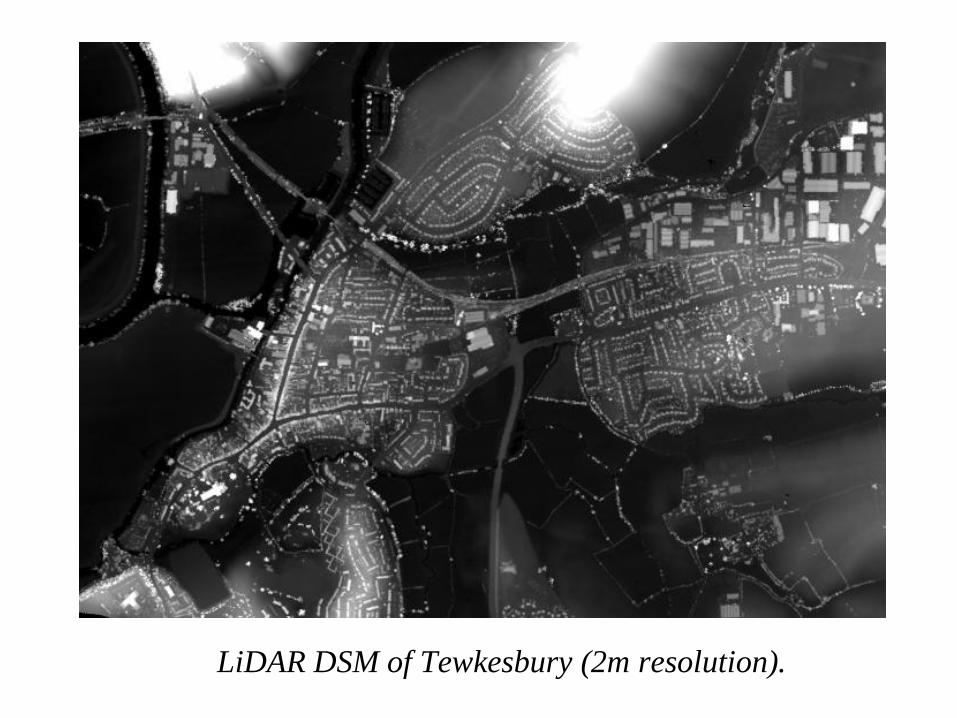
LiDAR DSM of Tewkesbury (2m resolution).
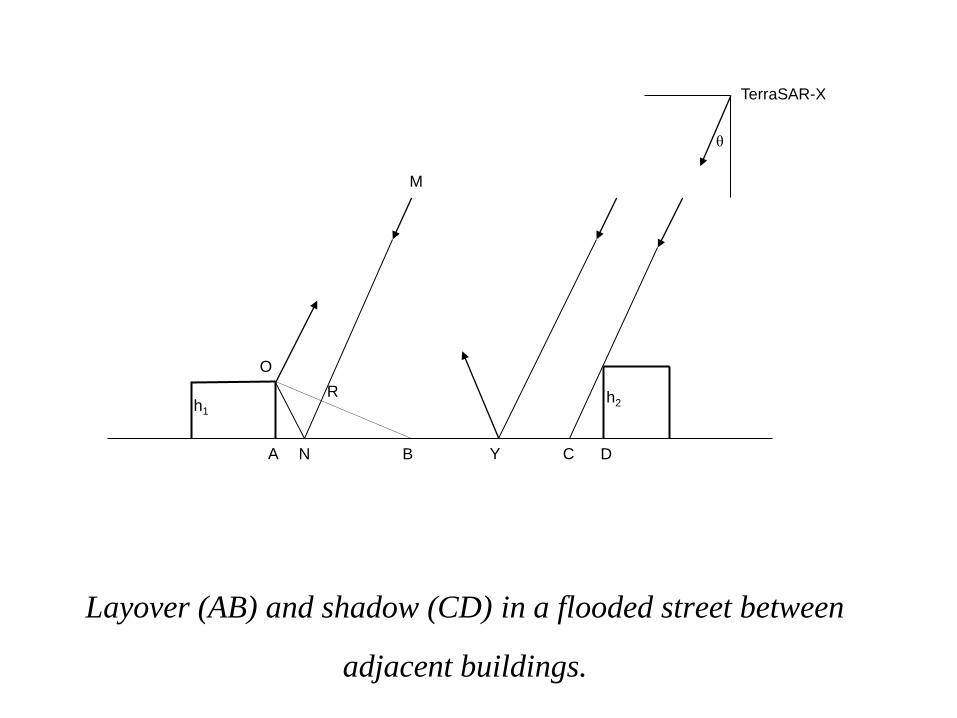
Layover (AB) and shadow (CD) in a flooded street between
adjacent buildings.
h1h2
A N B Y C D
O
θ
TerraSAR-X
M
R
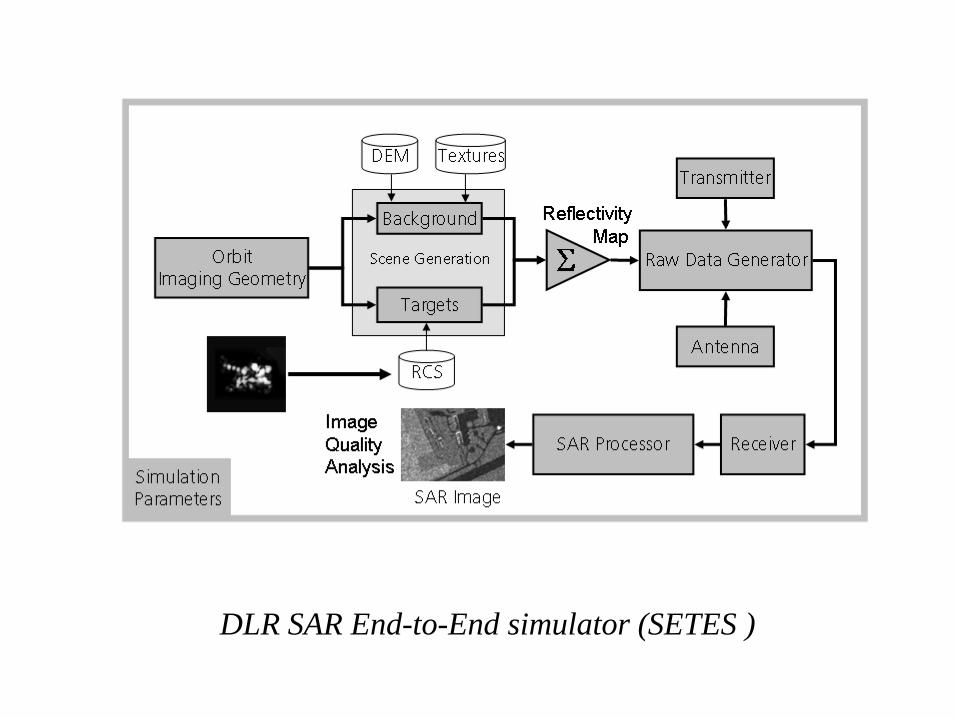
DLR SAR End-to-End simulator (SETES )
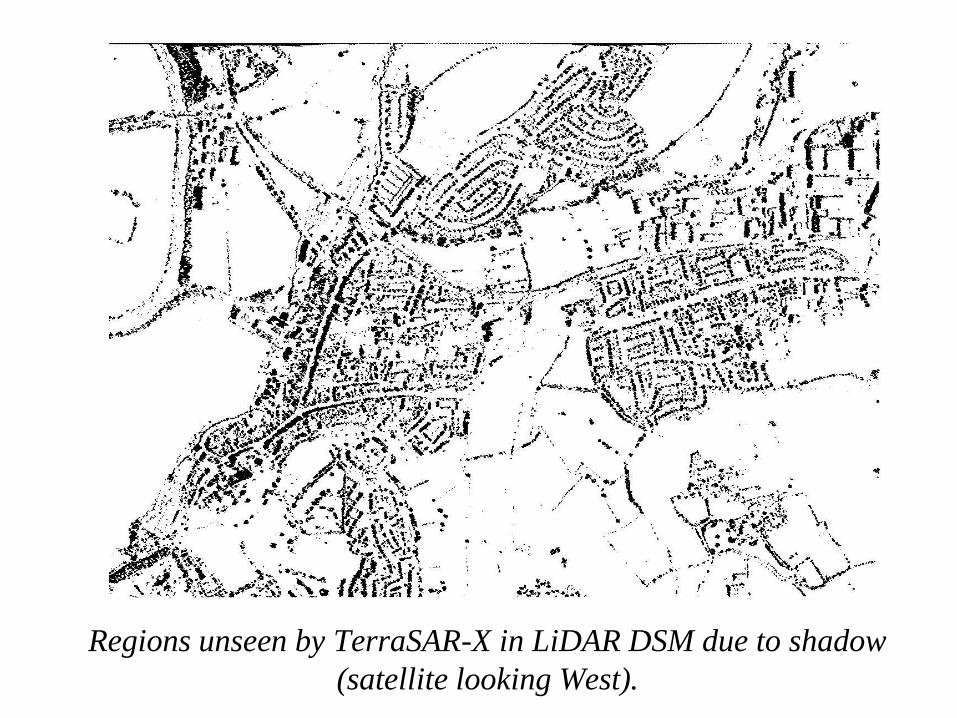
Regions unseen by TerraSAR-X in LiDAR DSM due to shadow
(satellite looking West).
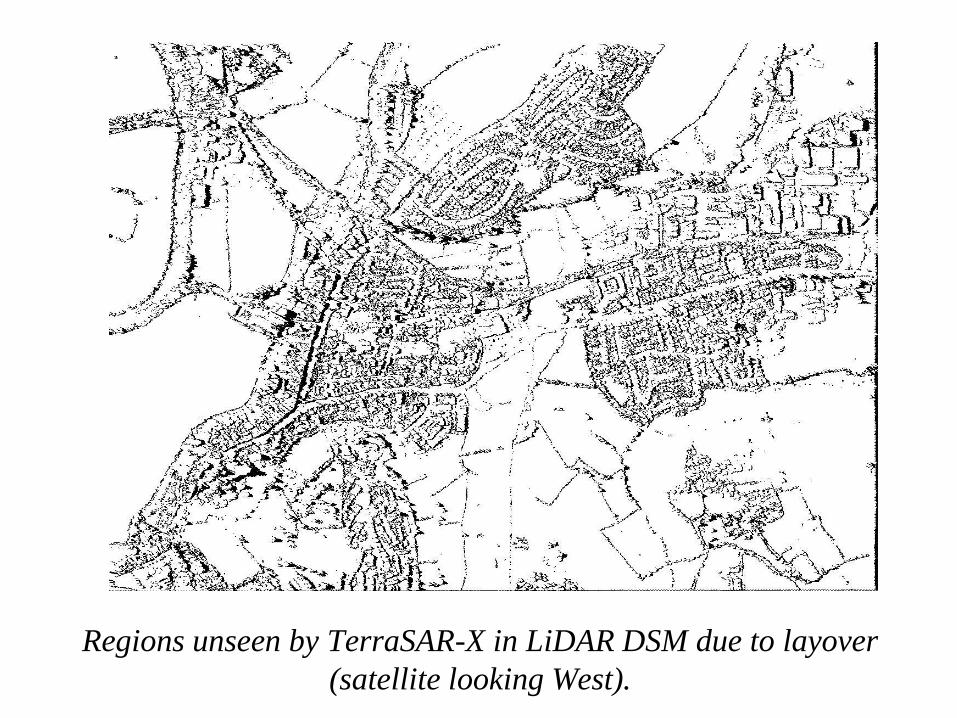
Regions unseen by TerraSAR-X in LiDAR DSM due to layover
(satellite looking West).
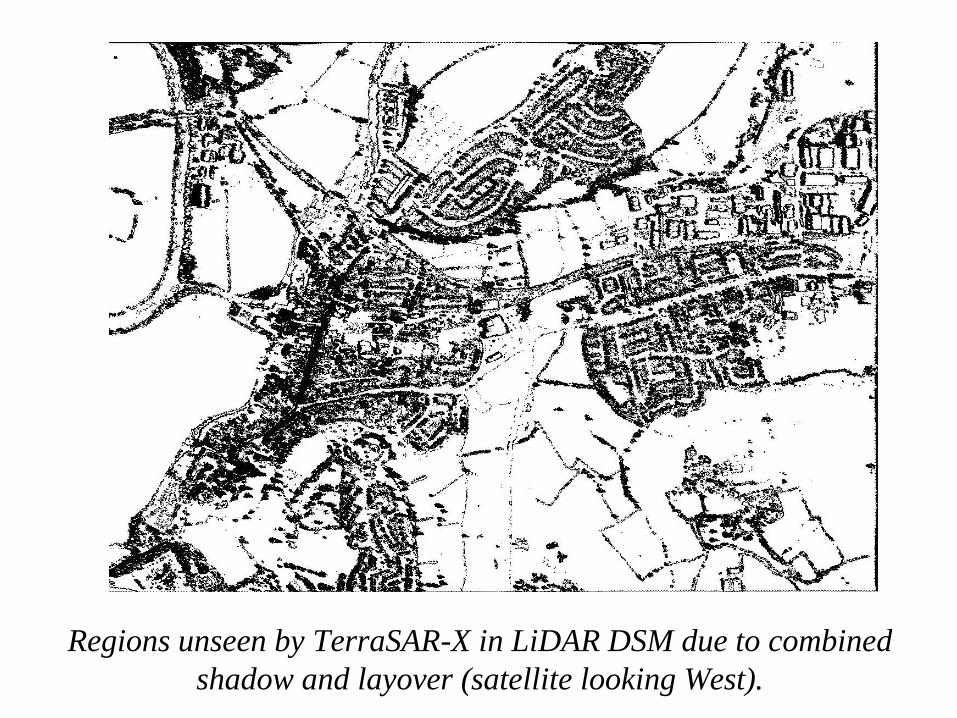
Regions unseen by TerraSAR-X in LiDAR DSM due to combined
shadow and layover (satellite looking West).
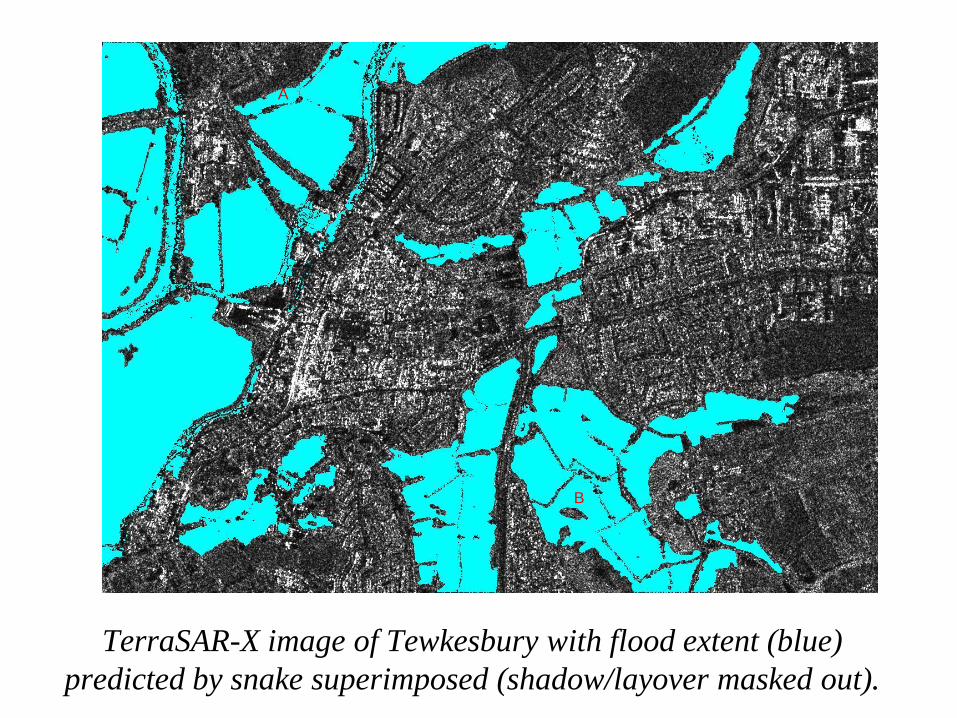
TerraSAR-X image of Tewkesbury with flood extent (blue)
predicted by snake superimposed (shadow/layover masked out).
B
A
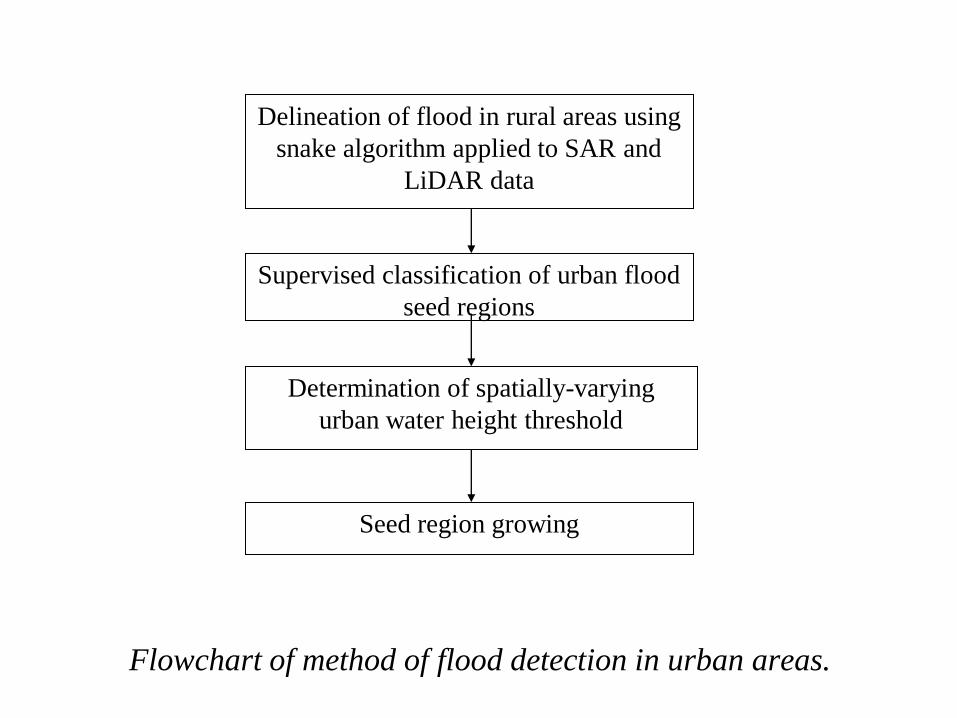
Flowchart of method of flood detection in urban areas.
Delineation of flood in rural areas using
snake algorithm applied to SAR and
LiDAR data
Supervised classification of urban flood
seed regions
Determination of spatially-varying
urban water height threshold
Seed region growing
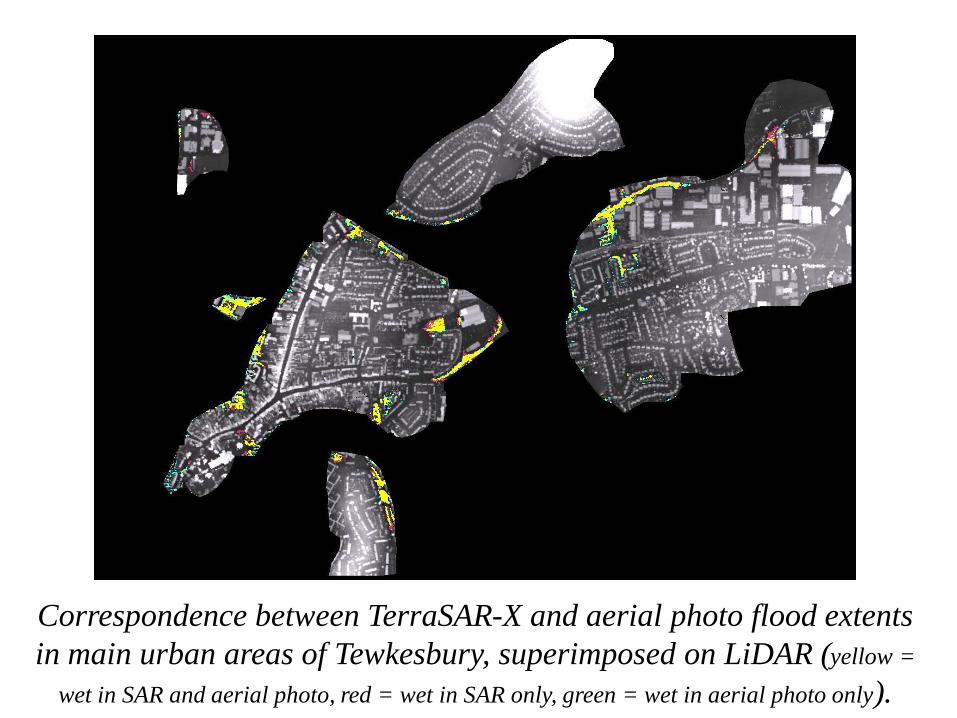
Correspondence between TerraSAR-X and aerial photo flood extents
in main urban areas of Tewkesbury, superimposed on LiDAR (yellow =
wet in SAR and aerial photo, red = wet in SAR only, green = wet in aerial photo only).
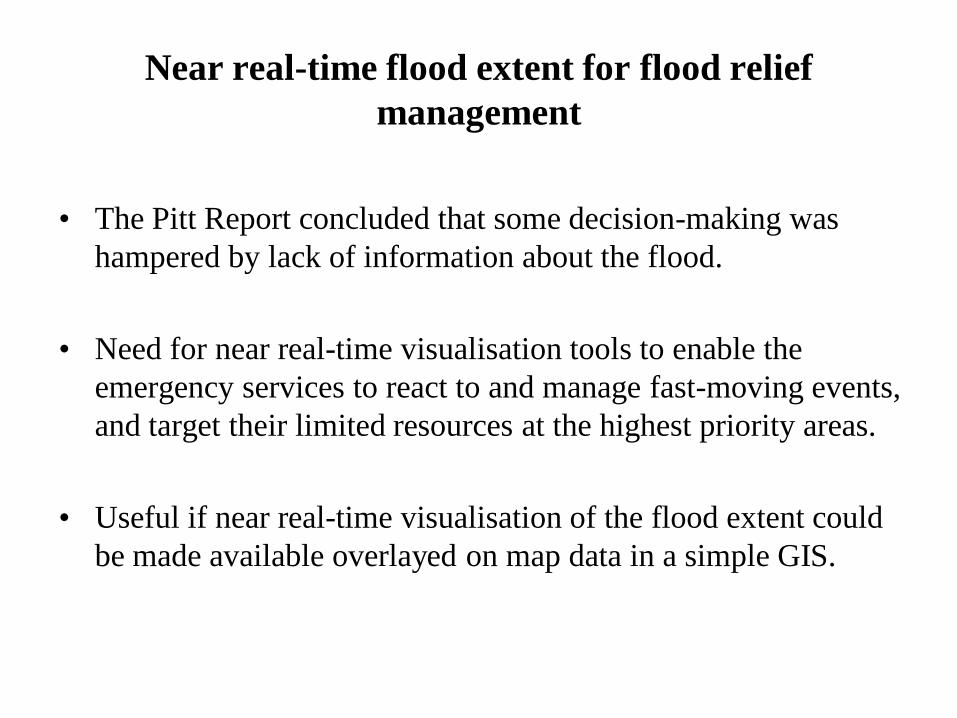
Near real-time flood extent for flood relief
management
• The Pitt Report concluded that some decision-making was
hampered by lack of information about the flood.
• Need for near real-time visualisation tools to enable the
emergency services to react to and manage fast-moving events,
and target their limited resources at the highest priority areas.
• Useful if near real-time visualisation of the flood extent could
be made available overlayed on map data in a simple GIS.
International Charter for Space and Major Disasters
• Charter has been set up to provide exactly this type of data.
• EA invoked the Charter for the first time in the UK in June
2007.
• EA unable to use the ERS-2 SAR image supplied because not
geometrically corrected.
• TerraSAR-X images can be registered to single pixel accuracy
rapidly and automatically.
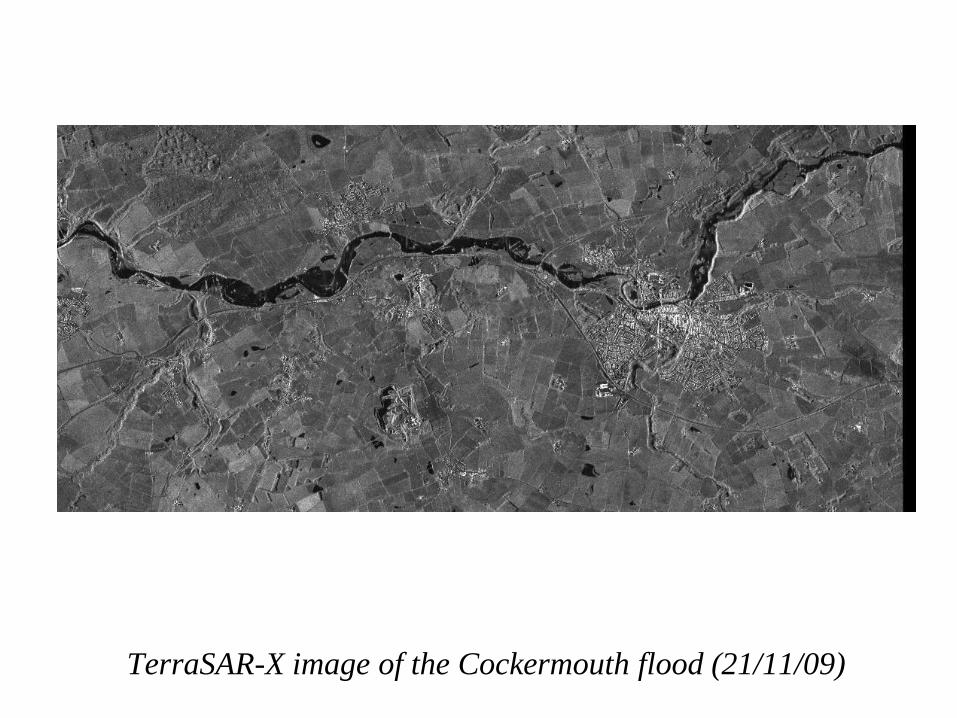
TerraSAR-X image of the Cockermouth flood (21/11/09)
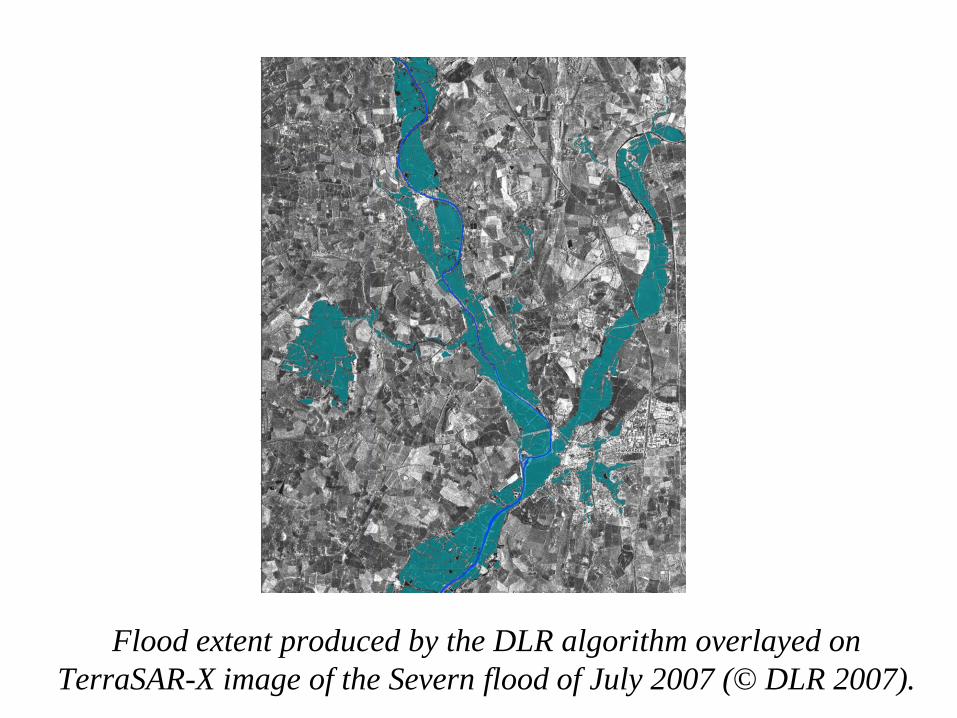
Flood extent produced by the DLR algorithm overlayed on
TerraSAR-X image of the Severn flood of July 2007 (© DLR 2007).
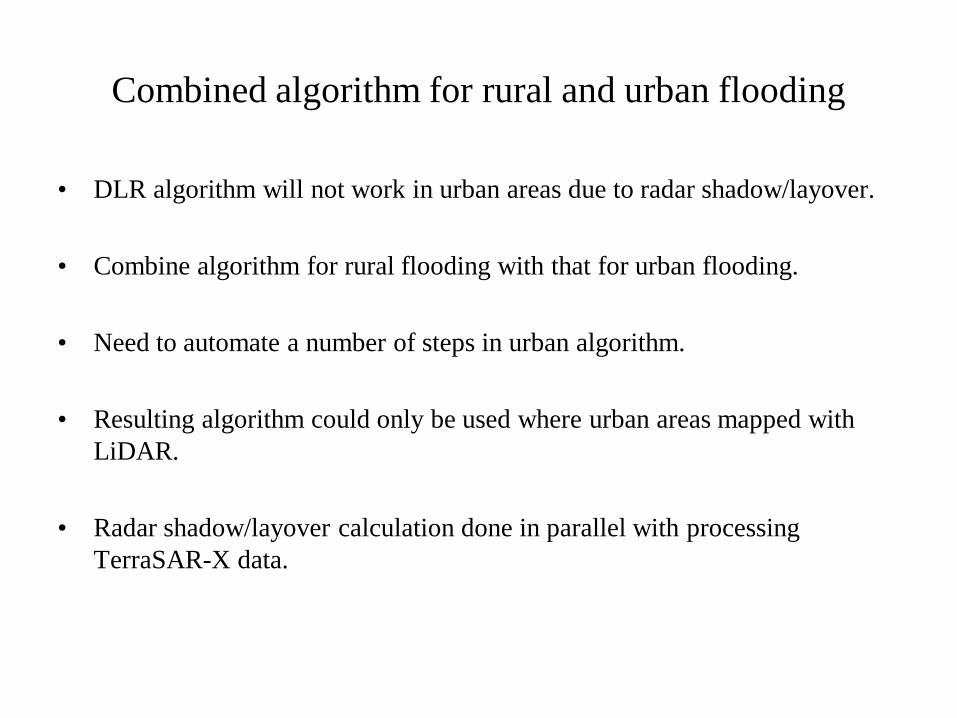
Combined algorithm for rural and urban flooding
• DLR algorithm will not work in urban areas due to radar shadow/layover.
• Combine algorithm for rural flooding with that for urban flooding.
• Need to automate a number of steps in urban algorithm.
• Resulting algorithm could only be used where urban areas mapped with
LiDAR.
• Radar shadow/layover calculation done in parallel with processing
TerraSAR-X data.
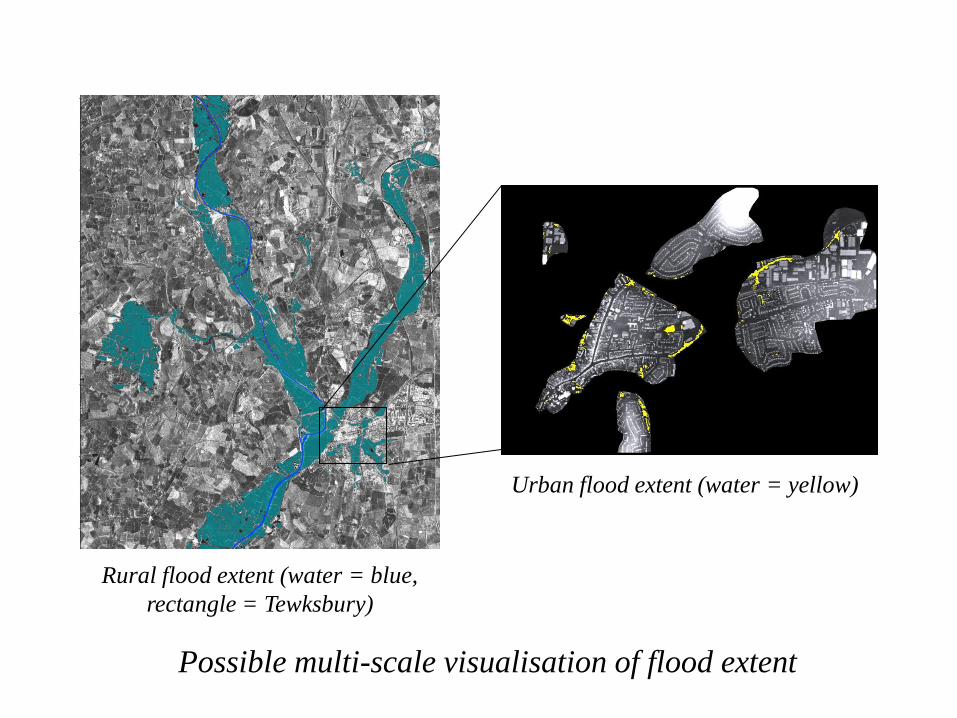
Possible multi-scale visualisation of flood extent
Rural flood extent (water = blue,
rectangle = Tewksbury)
Urban flood extent (water = yellow)