improving learning in south african schools: the quality ... 2005.pdf · the quality learning...
TRANSCRIPT

Improving Learning in South African Schools:The Quality Learning Project (QLP)
Summative Evaluation (2000 to 2004)
A Kanjee & CH Prinsloo
August 2005
HUMAN SCIENCES RESEARCH COUNCIL
Free
dow
nloa
d fr
om w
ww
.hsr
cpre
ss.a
c.za
Compiled by the Assessment Technology and Education Evaluation Research Programme,Human Sciences Research Council
Funded by the Business Trust Intervention Programme Managed by JET Education ServicesEvaluation by the Human Sciences Research Council
Published by HSRC PressPrivate Bag X9182, Cape Town, 8000, South Africawww.hsrcpress.ac.za
© 2005 Human Sciences Research Council
First published 2005
All rights reserved. No part of this book may be reprinted or reproduced or utilised in any form or by any electronic, mechanical, or other means, including photocopying and recording, or in any information storage or retrieval system, without permission in writing from the publishers.
ISBN 0-7969-2145-8
Cover Design and Layout: Vinesh NaidooProduction: Shereno Printers
Distributed in Africa by Blue Weaver PO Box 30370, Tokai, Cape Town, 7966, South AfricaTel: +27 (0) 21 701 4477Fax: +27 (0) 21 701 7302email: [email protected]
Distributed in Europe and the United Kingdom by Eurospan Distribution Services (EDS)3 Henrietta Street, Covent Garden, London, WC2E 8LU, United KingdomTel: +44 (0) 20 7240 0856Fax: +44 (0) 20 7379 0609email: [email protected]
Distributed in North America by Independent Publishers Group (IPG)Order Department, 814 North Franklin Street, Chicago, IL 60610, USACall toll-free: (800) 888 4741All other enquiries: +1 (312) 337 0747Fax: +1 (312) 337 5985email: [email protected]
www.ipgbook.com
Free
dow
nloa
d fr
om w
ww
.hsr
cpre
ss.a
c.za

CONTENTS
LIST OF FIGURES AND TABLES vi
LIST OF ANNEXURES vii
ACKNOWLEDGEMENTS viii
PREFACE x
ABBREVIATIONS USED FOR THE QLP DISTRICTS xi
Map showing location of Quality Learning Project (QLP) districts xi
EXECUTIVE SUMMARY xii
Background 1
Framework for the Evaluation Study 1
Evaluation Methodology and Research Design 3
Evaluation Criteria 6
Success of the Quality Learning Project 7
Results of the QLP Evaluation 10District-level Functioning 10School-level Functioning 11Classroom-level Functioning 13Learner Context and Performance 18Intervention Coverage and Quality 20Effects of Interventions on Functioning 21Effects of Improved Functioning on Learner Performance 22Effects of Interventions on Learner Performance 22Additional Observations Emanating from the Path Analysis 23
Concluding Statements and Recommendations 24Recommendations 24
Recommendations on Methodology and Design 24District-level Recommendations 26School-level Recommendations 27Classroom-level Recommendations 28Causal Modelling Recommendations 28
Conclusion 29
NOTES 37
HUMAN SCIENCES RESEARCH COUNCILv
CONTENTS
QLP SUMMATIVE EVALUATION
Free
dow
nloa
d fr
om w
ww
.hsr
cpre
ss.a
c.za

LIST OF FIGURES AND TABLES
Figures
Map showing location of Quality Learning Project (QLP) districts xi
Figure A: The QLP model at district, school and teacher level 2
Figure B: Number of schools in the evaluation survey and case-study samples 3
Figure C: District-functionality levels in 2004 and change from 2002 to 2004 10
Figure D: School-functionality levels in 2004 and change from 2002 to 2004 12
Figure E: Grade 9 mathematics classroom-functionality levels in 2004 and changefrom 2002 to 2004 14
Figure F: Grade 11 mathematics classroom-functionality levels in 2004 and changefrom 2002 to 2004 14
Figure G: Grade 9 language classroom-functionality levels in 2004 and changefrom 2002 to 2004 15
Figure H: Grade 11 language classroom-functionality levels in 2004 and changefrom 2002 to 2004 15
Figure I: National mean mathematics scores for QLP and control schoolsby year and grade 18
Figure J: National mean language scores for QLP and control schoolsby year and grade 19
Figure K: Index scores for district-intervention coverage and quality by year 20
Figure L: Index scores for school-intervention coverage and quality by year 21
Figure M: Index scores for teacher-intervention coverage and quality by year,subject and grade 21
Tables
Table I: Indicators at Grade 12 level of the success of the QLP (from 2000 to 2004) xiii
Table A: Total sample obtained for mid-term and summative evaluations 4
Table B: Number of schools sampled per district 4
Table C: Change in Grade 12 learner performance between 2000 and 2004across QLP and control schools by province 8
Table D: Indicators at Grade 12 level of the success of the QLP (from 2000 to 2004) 9
HUMAN SCIENCES RESEARCH COUNCILvi
FIGURES AND TABLES
QLP SUMMATIVE EVALUATION
Free
dow
nloa
d fr
om w
ww
.hsr
cpre
ss.a
c.za

LIST OF ANNEXURES
(Graphs comprising findings from the path analyses)
Annexure 1:Standardised path weights for modelling Grade 9 mathematics causal patterns 30
Annexure 2:Standardised path weights for modelling Grade 9 language causal patterns 31
Annexure 3:Standardised path weights for modelling Grade 11 mathematics causal patterns 32
Annexure 4:Standardised path weights for modelling Grade 11 language causal patterns 33
Annexure 5:Standardised path weights for modelling matriculation pass rate causal patterns 34
Annexure 6:Standardised path weights for modelling matriculation English pass rate causal patterns 35
Annexure 7:Standardised path weights for modelling Grade 12 (SG) mathematics pass rates 36
HUMAN SCIENCES RESEARCH COUNCILvii
ANNEXURES
QLP SUMMATIVE EVALUATION
Free
dow
nloa
d fr
om w
ww
.hsr
cpre
ss.a
c.za

ACKNOWLEDGEMENTS
The hard work and commitment of many dedicated individuals and organisations have over five years made itpossible to bring the formal QLP evaluation to a close by publishing the final, summative report. All contributionsare appreciated and are hereby acknowledged.
The Business Trust is acknowledged for providing the funding for this project.
Acknowledgement is made of JET Education Services and the Business Trust for managing the QLP and forproviding valuable support and assistance through the project Steering Committee and other mechanisms. NickTaylor, Anele Davids, Hemant Waghmarae, Jackie Moyana, and Leigh-May Moses, all from the QLP programmemanagement team of JET Education Services and Charles Barnard, Brian Whittaker, Mdu Ndhlovu and NomfundoMqadi, with Theuns Eloff at the outset, from Business Trust, all deserve special mention. They contributedcontinued guidance throughout the project, with considerable effort and time spent on many rounds of commentto draft versions of instruments and documents of many kinds, and especially the baseline, mid-term and currentsummative reports.
The Department of Education is acknowledged for its continually increasing role in direct communications andmeetings between the HSRC and participants at national and provincial level (at the Director General’s office andthrough strategic planning sessions, respectively).
Consortium members and service providers are thanked for valuable inputs at various stages and throughfeedback sessions, Partners Forum meetings, and otherwise.
Acknowledgement is made of the fieldworkers and observers, especially through contracts with AC Nielsen,assisted by Mictert in 2002, and the many qualified teachers, as well as the data-capturing team of Datanet underthe guidance of Pio Combrink.
Professor Johann Mouton is thanked for his comments and ongoing advice, mainly on methodology, during thefirst half of the study.
Special mention has to be made of the contributions by district managers, regional or circuit managers(institutional development officials), learning area specialists, school principals, teachers, learners and theircaregivers, for allowing researchers into their institutions, offices, classrooms and lives, and for makingthemselves available for observations, interviews, the completion of questionnaires, and for making learnersavailable for sitting for performance tests.
The role of and contributions by the official QLP co-ordinators in the office of JET Education Services are alsoacknowledged. The QLP co-ordinators became an institutionalised channel through which certain business wasconducted just so much more efficiently. Access to the districts and schools, and district-level and interventioninformation collection are two cases in point. [The co-ordinators were: Alfred Mabina (Gauteng); Kedibone Boka(Mpumalanga); Darwin Solomon (Northern Cape); Noel Daniels (Western Cape); Samuel Nkosi (KwaZulu-Natal,Inanda and Ixopo districts); Thulani Dlamini (KwaZulu-Natal, Ubombo district); Rose Machobane (North WestProvince); Nosipho Nxiweni (Free State); Vuyani Mrwetyana (Eastern Cape); and Maxwell Malatji (Limpopo).]
Marcel Croon, professor at Tilburg University in the Netherlands, is thanked for providing invaluable assistanceand training in 2002/3, and again in 2004/5, with the data modelling and analysis, and with related software.
HUMAN SCIENCES RESEARCH COUNCILviii
ACKNOWLEDGEMENTS
QLP SUMMATIVE EVALUATION
Free
dow
nloa
d fr
om w
ww
.hsr
cpre
ss.a
c.za

Shereno Printers must be mentioned for printing and packing research instruments within very tight schedulesduring the three evaluation years, and also for producing the mid-term technical report, this summative report,and its technical companion report.
Wordsmiths English Consultancy is acknowledged for language editing, formatting and laying out the manuscriptof the mid-term technical report in 2003, and for language editing this summative report and its technicalcompanion report in 2005.
Professor H.S. Bhola, Professor Brahm Fleisch, and Hersheela Narsee are thanked for reviewing the finalmanuscript and for their helpful comments and assistance in improving it.
The following HSRC team members (listed alphabetically) are also noted with gratitude for their respective rolesas part of the evaluation team at different points in time during the final evaluation phase following 2003:1 BrutusMalada, Carla Pheiffer, Elsie Venter, Gerda Diedericks, Godwin Khosa, Heidi Paterson, Hendrik de Kock, LeratoMashego, Lolita Winnaar, Makola Phurutse, Matthews Makgamatha, Natalie le Roux, Nicolaas Claassen, SannieReyneke, Sophie Strydom, Vijay Reddy, Xola Mati and Zinhle Kgobe.
HUMAN SCIENCES RESEARCH COUNCILix
ACKNOWLEDGEMENTS
QLP SUMMATIVE EVALUATION
1 Participation and contributions during the mid-term and baseline evaluations are acknowledged in the appropriate reports following those periods.
Free
dow
nloa
d fr
om w
ww
.hsr
cpre
ss.a
c.za
PREFACE
This report marks the end of a unique, long-term and extensive teaching and learning intervention programme,the Quality Learning Project (QLP). In concluding the evaluation activities of the QLP, a reflection on theevaluation processes and findings is desirable. For this reason, some of the most important functions and roles ofthe QLP and its evaluation are placed in perspective. In doing so, the report emphasises the crucial nature andfunction of evaluation for teaching and learning, more so in view of the transformation context of the SouthAfrican education system.
At the most apparent and immediate level, this summative report provides a conclusive account to the sponsorsof the QLP of how successfully the funds of the project have been spent.
Additional value also lies in reflecting more deeply on the complexities inherent in large-scale and lengthyendeavours such as the QLP. These reflections carry a positive verdict about the methods and models selected forthe QLP intervention programme and its evaluation. Finally, the reflections allow affirmation of the policydecision implicit in undertaking the QLP work at the outset. In this regard, professional and policy experts canfind justification in the soundness, replicability and sustainability of the road travelled by the QLP.
This report also provides background information on the interventions as well as on the evaluation design andmethodology of the QLP, its findings, and the conclusions and recommendations derived from the findings.
HUMAN SCIENCES RESEARCH COUNCILx
PREFACE
QLP SUMMATIVE EVALUATION
Free
dow
nloa
d fr
om w
ww
.hsr
cpre
ss.a
c.za

ABBREVIATIONS USED FOR THE QLP DISTRICTS
Lu = LusikisikiFl = FlagstaffLi = LibodeThM = Thabo MofutsanyanaJSM = Johannesburg South MegaSeW = Sedibeng WestIn = InandaIx = IxopoUb = UbomboMo = MoreteleMa = MafikengZe = ZeerustKa = KarooBo = BolobeduKo = KonekwenaZb = ZebedielaWCME = Western Cape Metropole East
Map showing location of Quality Learning Project (QLP) districts*
* District labels appear next to markers indicating the centroid of the particular district. It has to be noted that for certain districts, such as Zeerust and Karoo, actual district areas may be quite large.
HUMAN SCIENCES RESEARCH COUNCILxi
ABBREVIATIONS
QLP SUMMATIVE EVALUATION
Free
dow
nloa
d fr
om w
ww
.hsr
cpre
ss.a
c.za

HUMAN SCIENCES RESEARCH COUNCILxii
EXECUTIVE SUMMARY
EXECUTIVE SUMMARY
The summative report of the Quality Learning Project (QLP) encapsulates the evaluation work of the projectspanning the past five years. In addition, it focuses on the successes and findings of the QLP, and the implicationsand recommendations flowing from the evaluation study. The details underpinning the summative report can befound in the technical companion report.
The success of the QLP
The QLP adopted a specific theoretical model for interventions designed to improve learning and teaching inschools, and for evaluating the success of these interventions. As such, the hierarchical levels of the system(districts, schools and classrooms) were taken into account. Observations were made at three points in time tostudy trends and causal patterns. Comparisons were also made between project and control schools.
Performance targets for the QLP were set at the outset. QLP schools were to show an improvement, measured byoverall learner performance, against a comparable sample, by the end of 2004. What was required was:
• A 10% improvement in mean overall matriculation pass rate;• A 10% improvement in mean mathematics pass rate; and• A 10% improvement in mean English Second Language pass rate.
However, pass rates, when used as sole indicators, have certain weaknesses. For example, small increases fromlow baselines (previous poor matriculation results) appear as large improvements. Moreover, schools are able toartificially inflate Grade 12 pass rates by holding back potentially unsuccessful Grade 11 learners or by requiringlearners to take subjects at the Standard Grade (SG). These targets were therefore refined after the 2002 mid-termevaluation, using categories that more reliably reflected school-performance outcomes. These categories were:
(a) The increase in the absolute number of learners passing, as an indication of the quantitative improvementof learner results;
(b) The increase in the number of learners passing with university exemption, and with mathematics atHigher Grade (HG), rather than Standard Grade (SG), as an indication of an improvement in quality ofthe learner results; and
(c) The increase in matriculation pass rate, as an indication of improved efficiency in learner results.Table I compares the performance of QLP evaluation schools with that of control schools in terms of thefinal evaluation criteria adopted. It shows that the matriculation results of QLP schools consistentlyimproved more than those of control schools with respect to quantity, quality and efficiency.
QLP SUMMATIVE EVALUATION
Free
dow
nloa
d fr
om w
ww
.hsr
cpre
ss.a
c.za

Table I: Indicators at Grade 12 level of the success of the QLP (from 2000 to 2004)
Selected indicators at school level (Grade 12) Percentage points by which improvement
in QLP schools is higher than in control schools
QUANTITY OF OUTPUTNumber of learners passing matriculation examinations 16.84Number of learners passing English Second Language (HG) 36.03
QUALITY OF OUTPUT
Number of learners passing with endorsement (exemption) 61.79Number of learners passing mathematics (HG) 924.19#Number of learners passing mathematics (SG) 0.70*
EFFICIENCY OF OUTPUT
Overall school matriculation pass rate 8.20
# The very low baseline of 6 in QLP schools increased by 55, resulting in this high percentage point increase.For control schools, 133 was reduced by 10 to show a decline of 7.52 percentage points.
* QLP schools were discouraged from having an increase in the number of learners in this category; hence, the change in quality of output was not significantly higher than that obtained in the baseline study.
Trends and causal patterns
The QLP evaluation focused on identifying the impact of the intervention programmes on district, school andclassroom functioning as well as on learner performance.
Functionality within QLP districts improved at each level for the period from 2002 to 2004, as is evident fromthe findings outlined below:
• Overall district functioning improved over time, but did not surpass moderate functioning levels. Thestrongest improvements (by more than 10% over the duration of the project) were in the design and useof job descriptions, financial management, within-district planning, school-support planning, and school-support implementation.
QLP schools fared much better than control schools in:
• Overall school functioning, with the greatest contributions coming from the supply and use of resourcesand facilities, learning support materials (LSMs), curriculum leadership, school management, and schooladministration;
• Aspects of mathematics teacher and classroom functioning, including teacher competency (mainlyexperience and qualifications) (Grade 9), curriculum coverage (Grade 11), lesson pedagogy (Grade 9),access to and use of LSMs (Grade 9), classroom practices (Grades 9 and 11), and homework practices(Grade 11);
• Aspects of language teacher and classroom functioning (with a focus on reading and writing), includingteacher competency (mainly experience and qualifications) (Grade 9), curriculum coverage (Grades 9 and11), pitching lessons at the appropriate level for learners (Grade 9), lesson pedagogy (Grade 9), andclassroom practices (Grades 9 and 11); and
HUMAN SCIENCES RESEARCH COUNCILxiii
EXECUTIVE SUMMARY
QLP SUMMATIVE EVALUATION
Free
dow
nloa
d fr
om w
ww
.hsr
cpre
ss.a
c.za

• Overall teacher and classroom functioning, at the level of Grade 9 mathematics only. (Languageclassroom and teacher functioning, at the levels of Grades 9 and 11, also improved over time, whilemathematics classroom and teacher functioning remained stable, but at a high level of functionality.)
With regard to learners, two observations are warranted:
• Learner perceptions and attitudes fluctuated and even sometimes declined over the period of the project.
• In terms of learner performance at the national level, a marked improvement was observed only in thecase of writing skills (language) for Grade 11 learners. Learners fared better in selecting correct informationfor mathematics and for reading and writing than they did in constructing responses, especially wheredemands were more abstract and challenging. Learners who took the test in their home language (Englishor Afrikaans) obtained higher scores. Similar trends were noted in the control schools, although theirscores were always higher given that the control schools were not part of the QLP sample (and thus weredeemed not to require any interventions).
The outcomes of the causal modelling and analyses of the programme’s effects, between 2002 and 2004, areindicated below.
• There has been consistency over time with regard to interventions, functioning and learner performanceacross all levels, subjects and grades, indicating that critical mass and impetus, once achieved, can besustained.
• There are many indications that service providers targeted interventions dynamically and interactively inareas that needed them most.
• Interventions improved functioning in areas targeted by the QLP. This is evidenced in improved schoolfunctioning driven by good classroom and teacher interventions. District interventions also played a rolein improving school functioning.
• Improved functioning within the QLP led to better learner performance in many instances. This appliedespecially in cases of school and teacher/classroom functioning.
• QLP interventions led to improved learner performance in some cases. The positive effects of districtinterventions on Grade 11 mathematics performance during 2003/4, and of language-teacherinterventions on overall matriculation pass rates in 2003/4 are especially significant (bearing in mind thatlanguage interventions focused on language across the curriculum).
• The dosage and quality of QLP interventions were subject to the risk of fatigue effects over time, makingimprovements harder to sustain. District coverage and Grade 9 language-teacher interventions were theexceptions.
HUMAN SCIENCES RESEARCH COUNCILxiv
EXECUTIVE SUMMARY
QLP SUMMATIVE EVALUATION
Free
dow
nloa
d fr
om w
ww
.hsr
cpre
ss.a
c.za

Recommendations
The complete technical report and the summative report contain detailed recommendations emerging from thestudy. A selection of the most significant recommendations is provided below.
• Policy makers need to sustain and enhance the programme’s benefits. This can best be done by adoptinglogical, structured, integrated and comprehensive approaches to school development, based on soundtheoretical principles. For example, greater attention needs to be paid to the role of language in learning,given that reading and writing skills, abstract thinking, and producing meaning are central learningobjectives. In addition, resource allocation should be prioritised according to need. It is especiallyimportant to monitor and evaluate all policy effects.
• Education planners need to provide integrated and coherent intervention plans to improve teaching andlearning. Such plans should earn the support and commitment of participants through appropriateengagement, and should adhere to sound frameworks and models. Interventions should target the earlierstages of school life rather than focus on matriculation learners.
• Education managers in districts and provincial offices should sustain their efforts to manage their school-support and monitoring roles. Visionary supervision, mentorship and leadership are required, with dueregard for capacity, infrastructure and process.
• Curriculum developers should support teaching and learning by producing relevant, practical, and high-standard learning content underpinned by solid foundational knowledge.
• School management teams (SMTs) should nurture the professional development of their teachers throughgood mentoring and motivation. Sound management, discipline, and curriculum leadership (the heartbeatof the school) are crucial to this process.
• The provision of adequate numbers of excellent teacher trainers and mentors (including learning areaspecialists (LASs) or subject advisors) can no longer be neglected. These are needed to support teachersthrough mentoring, motivation, and technical (learning area or subject) assistance.
• Classroom teachers should not compromise on teaching time and curriculum coverage. The dignity ofteacher-learner relationships and interactions, discipline, and the provision of sufficient facilities andlearning materials all have to be maintained. Lack of subject expertise should not be allowed to kill theinherent curiosity of learners and the joy and fun of learning. Commitment and passion characterise goodrole models.
• Parents and learners should pursue every opportunity for reading, and should value all learning.
• Funding agencies should support large-scale, long-term and complex interventions and evaluations similarto those undertaken by the QLP, given the sheer scale of the challenges of the education system.
• Evaluators should pursue sophisticated methodologies, designs, methods, models, data management andstatistical analyses, in keeping with complex programme characteristics. Secondary analysis, capacitydevelopment, and evaluation should be supported.
• Book publishers should seek to disseminate findings from and information on interventions and studiessuch as this one.
HUMAN SCIENCES RESEARCH COUNCILxv
EXECUTIVE SUMMARY
QLP SUMMATIVE EVALUATION
Free
dow
nloa
d fr
om w
ww
.hsr
cpre
ss.a
c.za

HUMAN SCIENCES RESEARCH COUNCILxvi
HSRC • QLP 2005
QLP SUMMATIVE EVALUATION
Free
dow
nloa
d fr
om w
ww
.hsr
cpre
ss.a
c.za
Background
The Quality Learning Project (QLP) was a multi-level, multi-site educational intervention that aimed to improvelearner performance in 524 South African high schools.
The QLP was underpinned by the understanding that mathematics and language are the foundations for allfurther learning, and that teachers should foster the development of better mathematics, reading and writingskills. For this reason, the improvement of mathematics, reading and writing skills was the main focus of the QLP.In order to ensure that schools obtained effective support and monitoring from districts and that the goodpractices gained from the project would be institutionalised, the programme also focused on the development ofdistrict systems and officials.
In improving the quality of learning outcomes, the QLP adopted a systemic approach, which entailed improving:
• Learning outcomes in the languages of instruction and mathematics in Grades 8 to 12 in 524 schools;• The teaching of mathematics, and reading and writing skills in 524 schools;• The effectiveness of governance and management in 524 schools; and• The effective management of 17 district offices in the nine provinces.
The QLP aimed to achieve the above by developing management capacity at district and school levels, and byimproving the classroom skills of teachers to enhance learner performance.
During the first two years of implementation, the key outcomes of the QLP were streamlined so that:
each provincial cohort of the QLP schools would, by the end of 2004, show an improvement in schoolperformance measured by overall learner performance with special emphasis on:
• A 10% improvement in mean overall matriculation pass rate;• A 10% improvement in mean mathematics pass rate; and• A 10% improvement in mean English Second Language pass rate, against a comparable sample of control schools drawn for the province (JET QLP proposal).
Framework for the Evaluation Study
The final evaluation framework for the formative and summative evaluation studies was derived from the baselineevaluation model applied to the QLP. Before the end of 2002, amendments were made to the original evaluationmodel, and integrated into the theoretical position that underpinned the intervention programme and evaluationproject. The original hierarchical process model for evaluation was improved through these amendments. Thisled to the addition of control schools, the extension of observational data to all sites, the concomitant reductionin evaluation sample size, as well as various improvements and amendments to the instruments used for datacollection. (In addition, some factors associated with the availability and coverage of intervention data for theperiod 2000 to 2002 determined that the effect of interventions would only be modelled for the purposes of thesummative evaluation.) The QLP therefore was a theory-driven intervention, and was underpinned and informedby the following model:
IF the demands [to perform better] on the school and teacher are increased AND we enable the districtto provide high quality support to the schools AND we train the school governing bodies and schoolmanagement teams (SGBs, SMTs, etc.) to manage their schools more effectively AND we train theteachers to teach mathematics and the languages better, THEN we should get improved TEACHINGQUALITY IN THE CLASSROOMS which WILL LEAD TO IMPROVED LEARNER PERFORMANCE.
HUMAN SCIENCES RESEARCH COUNCIL1
BACKGROUND
QLP SUMMATIVE EVALUATION
Free
dow
nloa
d fr
om w
ww
.hsr
cpre
ss.a
c.za

HUMAN SCIENCES RESEARCH COUNCIL2
FRAMEWORK FOR THE EVALUATION STUDY
QLP SUMMATIVE EVALUATION
The interventions made by the programme at various levels of the education system (district, school andteacher/classroom) were aimed at building institutional capacity to manage, support and monitor educationalactivities between the district and the school, as well as between the school and the teacher.
Figure A demonstrates the articulation and operationalisation of each of the three levels of the QLP. It indicatesthe primary expected outcomes at each level, and how these outcomes were defined operationally. The figurealso shows which indicators were identified as relevant and measurable, and finally points out the sources andmethods of evidence that had to be utilised at a given level.
The theoretical model provided conceptual coherence and integrity for the QLP interventions, as well asanalytical guidance for its evaluation.
Figure A: The QLP model at district, school and teacher level
EFFECTIVE FUNCTIONING OFDISTRICT OFFICE
• Effective organisationaldevelopment, planning andmanagement
• Effective HR management• Effective financial management
Effective school support
Effective school monitoring
Effective school development planning
EFFECTIVE FUNCTIONING OFSCHOOL
• Effective school management• Effective human resource
performance monitoring• Effective school administration
(tracking of learners)
OUTCOMES
• Improved learnerparticipation in class
• Improved learnerperformance
EFFECTIVE CURRICULUMMANAGEMENT
• Monitoring delivery ofcurriculum
• Support of teachers• Instructional leadership
EFFECTIVE TEACHER
• More effective management oflearning programmes
• Improved assessment practices• More effective use of Learning
Support Material (LSM)
Free
dow
nloa
d fr
om w
ww
.hsr
cpre
ss.a
c.za

HUMAN SCIENCES RESEARCH COUNCIL3
EVALUATION METHODOLOGY AND RESEARCH DESIGN
QLP SUMMATIVE EVALUATION
Evaluation Methodology and Research Design
The QLP Steering Committee, comprising staff from JET Education Services, the Business Trust, the Departmentof Education (DoE), and the HSRC (through representatives from the evaluation team), accepted the improvedlogic model for the QLP, which made explicit the details at the different levels, focused the evaluation, andintegrated the evaluation with the intervention programme.
A core feature of this project was the establishment of an explicit and common framework to ensure that allintervention and evaluation activities would be aligned over time. For the evaluation study, a disadvantage wasthat some continuity was sacrificed between the initial evaluation model and the new evaluation framework. Theformer had already served as the basis for the HSRC’s instrument development and data collection for baselinepurposes. The longer-term benefits of these changes, though, outweighed the short-term delays anddiscontinuities related to the baseline study.
A first implication of the change from the baseline study was that many of the instruments had to be amended.Although strong efforts were made to keep core design aspects as consistent as possible, the changes did implythat specific questions were improved upon. The changes also meant that certain sources of data or the ways inwhich data was collected were adjusted to modes that were considered more likely to render reliable and validfindings (for example, a shift was made from questionnaire responses to observations).
A second change to the earlier evaluation studies was the evaluation sample. The reduction in the number ofexperimental schools to 70 in 2002 from 102 in the original 2000 baseline sample implied a certain loss in datacomparability over time, but brought the benefit of added commonality (and with it the opportunity fortriangulation) between the data sources underpinning the self-reporting and performance measurementinstruments, and the case studies and observations.
Thirdly, the revised evaluation model included 16 control schools from across four of the QLP districts. Thisfeature had not added value during the mid-term evaluation, but became important for the trend analyses from2002 to 2004. The inclusion of control schools in the evaluation assisted in the evaluation of the performance ofthe experimental schools undergoing interventions against the control schools, which did not receive anyinterventions. As a result, the initial disadvantages of the loss of continuity in monitoring programme impact atthe mid-point of the programme were turned into advantages for the final summative evaluation phase in 2004.
Final 2002 and 2004 evaluation sample figures are shown in Figure B and Tables A and B.
Figure B: Number of schools in the evaluation survey and case-study samples
Total QLP schools - 524
Experimental schools70
Control schools16
Free
dow
nloa
d fr
om w
ww
.hsr
cpre
ss.a
c.za

HUMAN SCIENCES RESEARCH COUNCIL4
EVALUATION METHODOLOGY AND RESEARCH DESIGN
QLP SUMMATIVE EVALUATION
Table A: Total sample obtained for mid-term and summative evaluations
Target group QLP 2004 QLP 2002 Control 2004 Control 2002
Learners1 2 033 2 067 368 430
Teacher questionnaires 271 259 48 46
Class observations 403 405 79 84
School principals 66 67 12 14
Circuit managers 39 29 - -
District managers 15 17 - -
Mathematics learning area specialists 11 15 - -
Language learning area specialists 11 13 - -
Table B: Number of schools sampled per district2
Provinces Number of Survey Site-visit QLP Control3
Districts QLP schools sample in sample in sample in schoolsper district 2000 2000 (2002)/2004 (2002)/2004
Eastern Cape*Lusikisiki 21 1 1 (2)2Flagstaff 31 5 3 (3)3Libode 37 7 3 (7)7
Free StateThabo Mofutsanyana 29 6 2 (4)4 (3)3
GautengJohannesburg South Mega 39 4 2 (4)4 (3)3Sedibeng West 27 4 2 (4)4
KwaZulu-NatalInanda 21 4 2 (3)3Ixopo 27 6 2 (4)4Ubombo 27 6 2 (4)4
Mpumalanga *Moretele 32 10 2 (4)4
North WestMafikeng 31 3 2 (3)3Zeerust 36 12 2 (5)4 (4)3
Northern CapeKaroo 32 6 2 (4)4
LimpopoBolobedu 30 10 3 (4)4 (1)1Konekwena 36 6 2 (5)5 (2)1Zebediela 24 6 2 (2)2 (1)1
Western CapeWestern Cape Metro East 34 6 2 (5)5
Total 514 102 36 (67) 66 (14) 12
1 Figures are based on Grade 9 reading and writing instruments - i.e. the lowest number of learners per school.
2 Districts* were restructured after the sample was selected, which resulted in a skewed distribution of schools selected in the final sample. Also, one school was later classified under the Lusikisiki district, and not under Flagstaff.
3 Reflects the realised sample.
Free
dow
nloa
d fr
om w
ww
.hsr
cpre
ss.a
c.za

HUMAN SCIENCES RESEARCH COUNCIL5
EVALUATION METHODOLOGY AND RESEARCH DESIGN
QLP SUMMATIVE EVALUATION
A useful component of the summative evaluation was the availability of sound, useful and complete interventiondata. However, the conversion of information for quality control and monitoring purposes into intervention datafor the mid-term evaluation and report early in 2003 proved to be an insurmountable task. As a result, it wasdecided not to incorporate correlation analyses in the mid-term report, but rather to re-design the format in whichthe intervention information would be collected. This was also done with a view to converting the informationinto indices and indicators in the same way as the other QLP evaluation data had been converted.
Against this background, it comes as no surprise that the lessons learnt as the programme interventions andevaluation processes unfolded were many. One could not expect much different from a first venture of this kind,in terms of content, rigour and scale. Thus, the expectation that the summative report would provide manyvaluable findings has not been unfulfilled.
The characterisation of the HSRC’s role as both “independent” and “formative” evaluator proved to be a useful,but sometimes contradictory, requirement. In the formative sense, participation often occurred to share earlyinsights, which were used to direct subsequent interventions and their implementation. This participation tookplace immediately after the baseline and mid-term reports, during many feedback forums, strategic planningsessions, programme management and steering committee meetings, and service provider discussions. Suchcontact also had the benefit of sensitising the evaluation team to many of the dynamics of the QLP programme.This increased the understanding of the evaluation team about many of the issues at stake, and of how to collectreliable and objective data on such issues. It also conveyed much insight into the process and benefits of ascientific evaluation to future beneficiaries and other stakeholders. However, some contamination of objectivitymay have occurred, as respondents often formulated ideas, some realistic and others not, about desirableoutcomes anticipated by the evaluators.
The evaluation team had to surrender some control of the approach followed in the collection of data. Forexample, intervention data was obtained from the QLP management team, while district-level information wascollected by QLP provincial co-ordinators. This was in some ways a useful occurrence, as liabilities associatedwith strict independence, such as alienation and the non-credibility of the evaluator, could have led to losses interms of access to, and collaboration with, the programme participants.
All said, a reasonable compromise on the processes for the summative evaluation was achieved. The complexityand magnitude of both the intervention programme management as well as the evaluation process should not beunderestimated. The instrument development, data management, and analytical skills required were extensive,as were the skills required for research design, sampling, and methodology in general. Continuity and criticalmass in terms of human resource expertise were therefore central to the success of the project. In addition, thelogic model that drove both the interventions as well as the evaluation provided a unifying approach to theproject that secured coherence and integrity for the whole venture.
Free
dow
nloa
d fr
om w
ww
.hsr
cpre
ss.a
c.za

HUMAN SCIENCES RESEARCH COUNCIL6
EVALUATION CRITERIA
QLP SUMMATIVE EVALUATION
Evaluation Criteria
One could at the outset, in addition to the path analysis that the HSRC undertook, compare the QLP(experimental) and control schools in terms of available information, although this comparison falls outside theoriginal sampling and design decisions taken at the beginning of the evaluation project. Reasonably completematriculation statistics are available for this purpose. As a result, and subsequent to the preliminary discussionsand findings presented in December 2003 as a separate report (Grade 12 results of QLP schools: Supplement tothe QLP mid-term evaluation (2002/2003)), additional analyses along three dimensions were undertaken. Thesewere to determine:
(a) The increase in the absolute number of learners passing their matriculation examinations as well asEnglish (HG) as an indication of the quantitative improvement of learner results;
(b) The increase in the number of learners passing with university exemption, and with mathematics atHigher Grade, rather than Standard Grade, as an indication of an improvement in quality of the learnerresults; and
(c) The increase in matriculation pass rate, as an indication of improved efficiency in learner results.
One advantage of this approach is that the control and QLP schools could be compared more directly. In four ofthe provinces, the initial allocation of schools, and early changes to this allocation, resulted in a small numberof schools falling outside the QLP eventually. These schools formed the control-school sample. In these cases, itcan be assumed that district contextual and impact factors had been quite similar for the QLP and controlschools, which only or mainly, again by assumption, differed in terms of receiving QLP interventions, or not. Asa result, differences in learner performance changes over time can be ascribed to the QLP interventions,especially at school and teacher or classroom levels.
For further consistency in terms of the approach followed thus far in the evaluation, it was decided to stick to thesample of 70 QLP and 16 control schools. Given that the control schools only existed in four provinces, two setsof comparisons were made. First, direct comparisons were made between QLP and control schools for the fourprovinces in which control schools were available. Second, broader comparisons were made between QLPschools in all nine provinces and control schools located in the four provinces.
Such analyses would also be in the spirit of initial intentions to keep a close watch on the improvement in thematriculation results of the schools participating in the QLP as one of the criteria set for evaluating the project’ssuccess. Another basis for such a comparison is the initial criteria set for evaluating the key outcomes of the QLP4,already cited verbatim in the background to this report.
4 QLP proposal to Business Trust (1999).
Free
dow
nloa
d fr
om w
ww
.hsr
cpre
ss.a
c.za

HUMAN SCIENCES RESEARCH COUNCIL7
SUCCESS OF THE QUALITY LEARNING PROJECT
QLP SUMMATIVE EVALUATION
Success of the Quality Learning Project
The report focuses on two questions: did the QLP model and intervention programme make a difference toteaching and learning in terms of both processes and outcomes? (more bluntly, was the QLP worth the effort?)and, secondly, how can the lessons learnt from the QLP be made applicable to other similar programmes?
Table C portrays the findings based on the refined criteria used in the supplementary report released in December2003. Data for the control and QLP schools is directly comparable for only four provinces. However,comparisons were also made between the data of these control schools and the QLP schools from all nineprovinces.
The increase in the numbers of learners that had passed was calculated for all QLP schools, then aggregated byQLP district, and totalled for all QLP schools in the nine provinces, and for the QLP schools in the four provinces,where control schools were also present. The percentage change from 2000 to 2004 was then calculated in eachinstance. The same procedure was followed with regard to the numbers of learners passing Grade 12 with orwithout university exemption (or endorsement), mathematics (HG and SG), and English (HG, Second Language),as well as the overall matriculation pass rate. Towards the bottom of Table C, comparisons are reported between:(1) the QLP schools in all nine provinces and the control schools in the four provinces; and (2) the control schoolsin the four provinces and the corresponding QLP schools in these provinces.
Table C provides information on the change in Grade 12 learner performance, aggregated by province, from2000 to 2004 in terms of:
• The number of learners passing their matriculation examinations (e.g., 53 or 10.3% more learners in theEastern Cape passed their matriculation examinations in 2004 compared to 2000);
• The number of learners passing their matriculation examinations with exemption;
• The number of learners passing English HG;
• The number of learners passing mathematics HG and mathematics SG; and
• The overall pass rate.
A summary of these results is presented in Table D in terms of the quantity, quality and efficiency indicatorsdeveloped to determine the success of the QLP programme.
Free
dow
nloa
d fr
om w
ww
.hsr
cpre
ss.a
c.za

HUMAN SCIENCES RESEARCH COUNCIL8
SUCCESS OF THE QUALITY LEARNING PROJECT
QLP SUMMATIVE EVALUATION
Table C: Change in Grade 12 learner performance between 2000 and 2004 across QLP and control schools by province
Province Overall Overall English HG Maths HG Maths SG Overall pass/group passes exemptions rate
No % No % No % No % No % % pts %
QLP Schools
EC 53 10.33 35 145.83 9 0.82 14 1400.00 159 47.18 11.46 38.73
FS 78 147.17 19 271.43 5 2.72 1 32 266.67 39.10 222.07
GP 206 46.50 84 158.49 262 40.49 31 1033.33 40 31.25 20.79 41.72
KZN 111 28.32 39 58.21 274 63.43 0 126 92.65 23.29 56.10
MP -49 -28.65 -8 -42.11 -380 -57.23 0 8 24.24 3.20 9.50
NW -53 -16.83 -11 -33.33 39 8.41 15 500.00 43 38.39 -1.52 -2.77
NC -19 -14.39 10 90.91 -36 -22.09 1 20.00 -3 -9.38 22.11 35.17
LM -57 -9.34 25 21.74 177 23.98 8 71 77.17 12.57 24.09
WC 135 39.47 1 3.57 214 54.18 11 115 155.41 18.36 36.88
All QLP 405 13.63 194 54.34 564 11.79 81 324.00 591 61.82 15.72 37.12
4 QLP 174 12.24 117 56.25 483 23.76 55 916.67 186 54.07 15.48 31.95
Control Schools
FS -24 -12.06 6 11.76 -182 -47.52 -5 -15.15 18 26.87 25.84 63.51
GP 71 16.67 12 10.91 390 153.54 -19 -24.68 133 114.66 5.15 7.65
NW -84 -26.42 -40 -40.82 -337 -92.58 4 17.39 26 20.47 -2.13 -2.69
LM -13 -9.03 6 20.00 -16 -8.84 10 5 16.13 31.25 70.97
4 Contr -50 -4.60 -16 -5.54 -145 -12.27 -10 -7.52 182 53.37 13.94 23.75
Differences between QLP and Control-school Performances *
Q > C4 455 18.23 210 59.88 709 24.05 91 331.52 409 8.45 1.78 13.38
Q4 > C4 224 16.84 133 61.79 628 36.03 65 924.19 4 0.70 1.53 8.20
* In the first row, numbers and percentages pertaining to learners from QLP schools in all nine provinces are compared to the control-school figures from the four provinces, while in the second row, direct comparisonsare made between the statistics of learners from the QLP and control schools in the four provinces for whichequivalent data was available.
It is clear from Tables C and D that the initial project objectives were met almost without exception. (It is usefulto point out that JET Education Services made similar comparisons for purposes of quality control and programmemanagement on information about all 524 schools, taking provincial and national figures and trends from allnon-QLP schools as the comparative basis. These analyses also overwhelmingly reflect the outcomes listedabove.)
Free
dow
nloa
d fr
om w
ww
.hsr
cpre
ss.a
c.za
HUMAN SCIENCES RESEARCH COUNCIL9
SUCCESS OF THE QUALITY LEARNING PROJECT
QLP SUMMATIVE EVALUATION
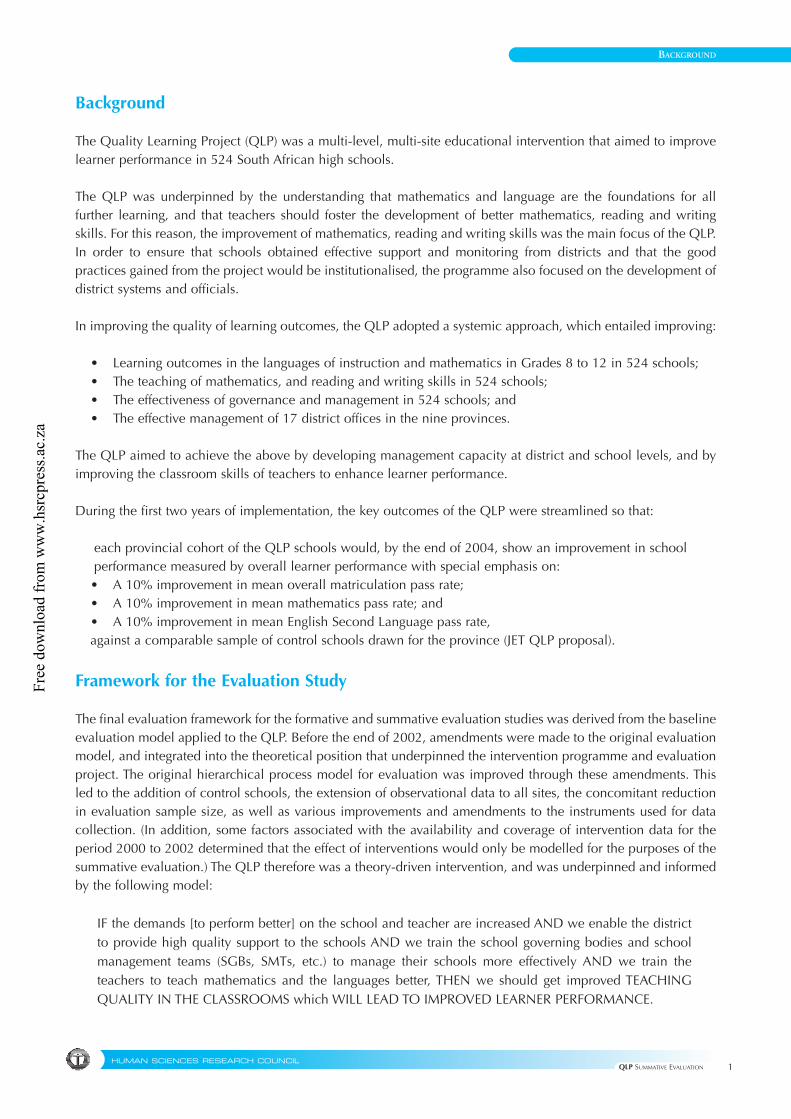
Table D: Indicators at Grade 12 level of the success of the QLP (from 2000 to 2004)
Selected indicators at school level (Grade 12) Percentage points by which improvement
in QLP schools is higher than in control schools
QUANTITY OF OUTPUT
Number of learners passing matriculation examinations 16.84Number of learners passing English Second Language (HG) 36.03
QUALITY OF OUTPUT
Number of learners passing with endorsement (exemption) 61.79Number of learners passing mathematics (HG) 924.19#Number of learners passing mathematics (SG) 0.70*
EFFICIENCY OF OUTPUT
Overall school matriculation pass rate 8.20
# The very low baseline of 6 in QLP schools increased by 55, resulting in this high percentage point increase. For control schools, 133 was reduced by 10 to show a decline of 7.52 percentage points.
* QLP schools were discouraged from having an increase in the number of learners in this category; hence, the change in quality of output was not significantly higher than that obtained in the baseline study.
In terms of quantity improvements (that is, the overall number of learners passing matriculation examinations),pass rates in QLP schools were approximately 17 percentage points higher than those in control schools. Forlearners passing English (HG, Second Language), the difference, when compared across the four provinces thatcomprised both QLP and control schools, was 36 percentage points in favour of the QLP schools. However, whencomparing QLP schools in all nine provinces to the control schools from the four provinces, the increase wasslightly lower at 24 percentage points.
In terms of quality improvements (that is, the number of learners passing their matriculation examinations withendorsement, and with mathematics at HG), QLP schools managed to achieve increases in matriculationexemptions that were 60 to 62 percentage points higher than those of the control schools. The growth trendtowards producing candidates with a pass in mathematics at HG level is also markedly more dramatic in QLPschools, at 332 percentage points (for QLP schools from all nine provinces against control schools in fourprovinces) and at 924 percentage points (direct comparison across four provinces) higher than control schools.However, very low baselines contributed to some inconsistency and to the seemingly large changes. The QLPand control schools were rather similar in terms of the increases in the number of candidates passingmathematics at SG level. This finding can be seen as positive, in that QLP schools were deliberately encouragedto prepare teachers and learners to consider offering mathematics at a higher level only.
Improvement in efficiency (as based on the overall increase in matriculation pass rate) was higher by eight to 13percentage points in QLP schools above control schools. Given that only potentially successful candidates couldhave been allowed through to Grade 12 from Grade 11, this figure is not as meaningful as the figures indicatingquality and quantity improvements. Nevertheless, the comparative picture is informative.
Pass-rate changes (as shown in the technical report) were also compared for Grade 12 English (HG) andmathematics (SG). In the case of English, improvements in QLP schools were greater than those in control schoolsby 19 percentage points (34% improvement in QLP schools above the 15% in control schools) when directcomparisons were made in the four provinces. The figure dropped to 11 percentage points when the full QLPgroup in all nine provinces was considered (26% improvement in QLP schools above the 15% in control schools).In the case of Grade 12 mathematics (SG), improvements in QLP schools exceeded those in control schools by
Free
dow
nloa
d fr
om w
ww
.hsr
cpre
ss.a
c.za

HUMAN SCIENCES RESEARCH COUNCIL10
RESULTS OF THE QLP EVALUATION
QLP SUMMATIVE EVALUATION
just over seven percentage points (94% improvement in QLP schools above the 87% in control schools) in directcomparisons made in the four provinces. The figure changed to three percentage points in favour of the controlschools when the full QLP group in all nine provinces was considered (the 84% improvement in QLP schools isbelow the 87% in the control schools).
Results of the QLP Evaluation
Analysis was conducted to determine the effect of the QLP interventions on the functioning of districts, schoolsand classrooms as well as on the performance of learners.
District-level Functioning
Of all the levels in the education system, the district level seemed to be most directly affected by earlyrestructuring processes in the Department of Education (DoE). As late as 2004, 13 districts indicated that theyhad undergone restructuring, with some indicating that such events had occurred five times. It is reasonable toassume that provincial restructuring exercises would have undermined the QLP model and impacted negativelyon key elements for improving the quality of schooling.
Figure C shows the change in district-functioning levels from 2002 to 2004 (see scale on the left-hand side). Thesechanges are indicated by the bars in the figure. For district functionality, change scores ranged from -6 to +6. Amoderate improvement is observed when all the district scores are combined. While district functioning inGauteng, KwaZulu-Natal and Limpopo provinces deteriorated, it showed a marked improvement in the Free Stateand Northern Cape provinces and in the district of Zeerust.
Markers (black dots) indicate the level of district functioning in 2004, and represent the index scores (indicatedon the right-hand side in the figure), which range on a scale from 0 to 13. Score values below 4.5 can beconsidered low, while those above 9.5 are high. Scores in between this range are considered moderate. Mostdistricts still function only at moderate levels, with low functionality noted in the Limpopo province andSedibeng West district. (See Tables 3.14 and 3.15 in the technical report for additional details.)
Figure C: District-functionality levels in 2004 and change from 2002 to 2004
The functionality of districts was measured on the basis of 13 indices, which were constructed according to theQLP model (see Figure A). Scores for 11 indices fell in the moderate category. The two exceptions were the
Free
dow
nloa
d fr
om w
ww
.hsr
cpre
ss.a
c.za

HUMAN SCIENCES RESEARCH COUNCIL11
RESULTS OF THE QLP EVALUATION
QLP SUMMATIVE EVALUATION
existence and use of organograms, which fell in the high category, and appropriate financial managementpractices, which fell in the low category. A noteworthy improvement from the 2002 functioning levels is evidentboth in terms of individual indices and the overall district-functionality index.
Results of the statistical modelling reveal that QLP interventions affected district functioning (especially during2003/4), as well as functioning at other levels of the system; namely, school and classroom levels. Evidence alsoindicates that the programme targeted interventions at those points where the needs were greatest.
The QLP model posited that districts drive the improvement of learner performance, mainly through schoolsupport and monitoring. The latter specifically covers the quality of school practices pertaining to schoolmanagement and development, curriculum management and development, and teacher-learner interactions inthe classroom.
Functioning levels are still moderate for the majority of indicators, with the financial management indicator ofgreatest concern. However, the fact that most of the individual indices and the overall functionality indeximproved from 2002 to 2004 is one of the most exciting outcomes of this evaluation.
Modelling suggests that these increases can partly be attributed to the interventions (district and other), especiallyto the principle of efficiency of resource usage, which was applied by targeting interventions where the need wasgreatest.
The “distance” between districts and classrooms/learners is perhaps still quite large, and the implementation ofa district-based school-development model is still in its infancy. This situation, paired with continued instabilityand restructuring, and large numbers of dysfunctional districts in some provinces, could explain the absence oflarger or more immediate effects of interventions on the improvement of districts and learner performance.
It is recommended that the rationale, model and logic of district-based school improvement be acceptedas sound. However, lack of resources and capacity, poor infrastructure, and related issues still pose avast challenge. Despite these challenges, this project indicates that good order, discipline and the will tosucceed can make the district level a strong force in facilitating desired change in schools.
Many of the comments made in the mid-term report remain valid, and it is worth being reminded about these:
• Instability, inappropriate structures and lack of resources at the district level of the education system impactdramatically on the transition between the general and further education and training bands.
• The lack of parity between the ranks and roles ascribed to various officials in districts across the provincescreates uncertainty, and issues related to reporting lines, hierarchies, and authority need to be clarified so thatinterference with school (teacher) support and monitoring can be avoided.
• More critical comparisons are needed between the school-effectiveness and school-improvement approaches(more recently referred to as the outside-in and inside-out approaches to school improvement), especiallywith a view to interrogating existing practices and policy making within the national education system.
School-level Functioning
Figure D shows the change in overall school functionality from 2002 to 2004 by district, for QLP and controlschools. Change is indicated by the bars in the figure, against the scale on the left-hand side. For school-levelfunctionality, change scores ranged from -3 to +8. A moderate improvement in school-level functioning scores is
Free
dow
nloa
d fr
om w
ww
.hsr
cpre
ss.a
c.za

HUMAN SCIENCES RESEARCH COUNCIL12
RESULTS OF THE QLP EVALUATION
QLP SUMMATIVE EVALUATION
observed for QLP schools while control schools scores are shown to have deteriorated very slightly. The scale onthe right-hand side and the index markers indicate the level of school functioning in 2004. The index has amaximum value of 18, with scores of 0 to 6 classified as low. Most schools fell within the moderate range scoreof 7 to 12.
Figure D: School-functionality levels in 2004 and change from 2002 to 2004
QLP schools in the Inanda and Ubombo districts improved most. QLP schools from the district of Lusikisiki andcontrol schools from Bolobedu and Konekwena achieved low scores on school functionality, while only the QLPschools from Inanda fell within the high category in 2004. (Tables 4.23 to 4.25 in the technical report can beconsulted for complete information.)
As evidenced in the technical report, resource levels at schools were also moderate, and improved in QLPschools, but not in control schools. However, great disparities existed in resource levels in schools betweendistricts. Schools in Gauteng, Northern Cape and Western Cape districts were better resourced than theircounterparts in the Eastern Cape and Limpopo provinces. Despite improvements in resources in QLP schools, theresults highlight the fact that many schools were still poorly provisioned.
Classroom adequacy, expressed mainly in terms of class size and the teacher-learner ratio, was found to havedeteriorated over the years, although there was less of a negative effect with respect to shortages of classroommaterials in teaching and learning. The control schools seemed to have deteriorated in terms of classroomadequacy and the effect of shortages of classroom materials on teaching and learning, suggesting that the QLPschools have experienced improved physical conditions as a result of the interventions employed at theseschools.
As revealed in the technical report, an increase in the monitoring of curriculum delivery in schools by the SMTsand heads of department (HODs) is evident, although the overall monitoring of curriculum delivery in mostschools was still rated as moderate at the time that the data was collected in 2004. The existence of learningprogrammes and syllabi and the monitoring of assessment practices were rated relatively low for all schools. Acomposite index of curriculum management, covering aspects of curriculum monitoring, support andinstructional leadership, showed some improvement, with the majority of schools achieving a moderate to highrating in 2004.
Free
dow
nloa
d fr
om w
ww
.hsr
cpre
ss.a
c.za

HUMAN SCIENCES RESEARCH COUNCIL13
RESULTS OF THE QLP EVALUATION
QLP SUMMATIVE EVALUATION
The composite index for teacher support in schools was rated moderate to high for more than half of the districts.However, as the technical report indicates, further support to schools is required in the Eastern Cape, and theNorth West and Limpopo provinces. On the index for curriculum leadership, schools in nine of the 17 districtsfrom five provinces fell within the low category, indicating that a great deal of improvement is required in thisarea. In addition, the index for professional development indicated a widespread need for further interventionacross schools in the various districts.
School management, incorporating aspects of school development planning, management, finances andadministration, appears to have benefited most from the QLP. Not only were the index values for QLP schools inthe moderate to high range, but they also showed a definite improvement. For control schools, scores remainedstable at moderate levels in terms of the index score. The competency profiles of school principals in QLPschools, which reflect their management experience and highest qualifications, remained stable at a moderatelevel with respect to the index score.
Central here are factors such as sound school management; mentoring of teachers; curriculum leadership; staffdevelopment; monitoring systems and records to identify problems early and to rectify them; and the broadercontribution of the financial, administrative and human resources environments to school-level functioning. Firmevidence indicates that QLP schools improved more than control schools, or functioned at higher levels at least,with regard to the following indicators: availability of resources and facilities; reducing the effect of shortages ofLSMs; curriculum leadership; school development planning; school management; and administration andfinancial practices.
Statistical modelling produced at least three sets of evidence pertaining to interventions and system functioning.First, school functionality (as defined through the indicators and indices) seemed to ensure good learnerperformance consistently. This could also signal a positive feedback “loop” in terms of which good schools attractgood learners who bring more accolades to the schools’ performance and functioning. Second, QLP serviceproviders efficiently targeted interventions where they were needed most. Third, teacher interventions seemed tobe beneficial to school functioning, presumably through the transfer of acquired skills to school-managementdynamics.
It was pointed out in the mid-term report that structural deficiencies will take more time to remedy, as they lieoutside the control of schools. However, many in-school practices can be (and have been) identified for moreimmediate attention and improvement. Therefore, it seems warranted to ascribe many of the observedimprovements to the interventions of the QLP.
It is recommended that similar approaches to school improvement be adopted in other school-improvement programmes of the DoE.
Classroom-level Functioning
Figures E to H provide information on the changes in classroom/teacher functioning from 2002 to 2004, and the2004 levels of functionality by grade (Grades 9 and 11) and subject. The full picture can be obtained from Table5.60, as well as from Table 5.59 (language) and Table 5.30 (mathematics), in the technical report. As in the caseof other levels, the bars and left-hand scale indicate increases or decreases in functionality and are expressed interms of changed index scores. For classroom functionality, change scores ranged from -8 to +18. The scale ofthe overall index appears on the right-hand side, and the markers indicate classroom functioning by each districton this index in 2004. Index scores could range from 0 to 64, with 0 to 21 being considered as low, 22 to 42 asmoderate, and 43 to 64 as high.
Free
dow
nloa
d fr
om w
ww
.hsr
cpre
ss.a
c.za

HUMAN SCIENCES RESEARCH COUNCIL14
RESULTS OF THE QLP EVALUATION
QLP SUMMATIVE EVALUATION
Figure E shows that, in general, the functioning of QLP teachers/classrooms for Grade 9 mathematics improvedmore than that of control schools. Functioning levels in QLP schools ranged from moderate to high.
Figure E: Grade 9 mathematics classroom-functionality levels in 2004 and change from 2002 to 2004*
*The Flagstaff and Libode samples only comprised senior secondary schools.
For Grade 11 mathematics teacher/classroom functioning (Figure F), QLP teachers/classrooms improved less thandid the control schools.
Figure F: Grade 11 mathematics-classroom functionality levels in 2004 and change from 2002 to 2004
Figure G shows that the functioning of QLP teachers/classrooms for Grade 9 language improved slightly more than thatof control schools. Functioning levels ranged from moderate to high.
Free
dow
nloa
d fr
om w
ww
.hsr
cpre
ss.a
c.za

HUMAN SCIENCES RESEARCH COUNCIL15
RESULTS OF THE QLP EVALUATION
QLP SUMMATIVE EVALUATION
Figure G: Grade 9 language classroom-functionality levels in 2004 and change from 2002 to 2004*
*The Flagstaff and Libode samples only comprised senior secondary schools.
For Grade 11 language teacher/classroom functioning (Figure H), QLP teachers/classrooms improved slightly lessthan did the control schools.
Figure H: Grade 11 language classroom-functionality levels in 2004 and change from 2002 to 2004
About 15 indices were constructed to measure the functionality of mathematics and language classes in the QLPschools, based on observation and interview data and teacher responses to questionnaires. Some salient aspectsof such changes in functioning are briefly referred to below.
• Index scores for teaching competency in QLP schools improved noticeably and consistently from 2002onwards, while scores for control schools deteriorated. Most teachers (mathematics and language) wererated high on this index.
Free
dow
nloa
d fr
om w
ww
.hsr
cpre
ss.a
c.za

HUMAN SCIENCES RESEARCH COUNCIL16
RESULTS OF THE QLP EVALUATION
QLP SUMMATIVE EVALUATION
• Learners’ perceptions about the quality of the teaching force varied widely by grade, subject, year andschool status (QLP or control), and no consistent trends were evident.
• For mathematics learners, overall school attitudes (learner attitudes to learning the subject, to school, andto the management and school climate) improved more in the QLP schools than in the control schools.For language learners, however, overall school attitudes improved more in the control schools than in theQLP schools.
• The availability of physical resources (i.e., chairs, tables, desks, and space) also varied inconsistently acrossgrades, subjects and school status (QLP and control schools).
• The availability of teaching resources was rated low in terms of the 2004 index score in both grades formathematics as well as language. However, language-teaching resources increased in both grades duringthe period of the intervention, while for mathematics Grade 9 teaching resources increased and for Grade11 they decreased. Improvement in mathematics and language resources for Grades 9 and 11 was higherin the QLP schools than in the control schools.
• The number of QLP workshops and follow-up activities that both mathematics and language teachersreportedly attended decreased during the final phase of the programme.
• The scores for the management and delivery of learning programmes increased gradually after 2002 inboth the QLP and the control schools. The majority of the schools, for both mathematics and language,fell within the moderate to high categories. An exception was schools in the Gauteng province, which fellwithin the low category.
• Mathematics and language curriculum coverage generally improved in both the QLP and the controlschools in both grades.
• The index for conducting lessons appropriately in terms of the level of cognitive demand revealed that, in2004, the majority of classes were largely functional for both mathematics and language in both the QLPand the control schools. Both the QLP and the control schools improved marginally over time.
• The level of functionality of mathematics and language classrooms in terms of teacher-questioningpractices was rated as moderate to high in the majority of cases, and improved from 2002 for both the QLPand the control schools.
• Usage rates of portfolios were high, and had improved since 2002 in both the QLP and the control schools.The QLP schools did not outperform the control schools in this regard.
• Teachers’ access to LSMs, still largely rated as low to moderate, varied inconsistently across subjects, yearsand school status.
• In terms of learner participation, performance was generally rated as moderate, and had increased acrossthe years for the QLP and the control schools, with the exception of the Grade 11 score for language,which had decreased in the control schools.
• Learner classwork improved consistently over the years in the QLP schools. The 2004 index score formathematics in the QLP schools was generally rated as high, and for language as moderate. For the controlschools only mathematics index scores improved.
Free
dow
nloa
d fr
om w
ww
.hsr
cpre
ss.a
c.za

HUMAN SCIENCES RESEARCH COUNCIL17
RESULTS OF THE QLP EVALUATION
QLP SUMMATIVE EVALUATION
• Teacher homework practices seemed to have deteriorated since 2002 in both the QLP and the controlschools. However, the 2004 index score for homework remained at a moderate level for mathematics andlanguage in both the QLP and the control schools.
In general, the QLP schools outperformed the control schools in terms of classroom functionality in mathematicsover time. For example, with regard to Grade 9 activities, such improvements included teacher experience,lesson pedagogy, assessment and classwork. With respect to Grade 11 activities, factors such as curriculumcoverage, classwork, and homework contributed towards improving the mathematics index score over time.
With regard to reading and writing in both grades, the QLP schools often outperformed the control schools interms of classroom functionality over time. For Grade 9 activities, such improvements included teacherexperience, curriculum coverage, cognitive demand of the lesson, lesson pedagogy, and classwork. At Grade 11level, aspects of classroom functionality such as curriculum coverage and classwork impacted positively on theindex scores.
In considering the overall classroom-functionality index, however, it was found that mathematics classroompractices, at the level of Grade 9, was the only category where the QLP schools outperformed the control schools.Language classroom practices in Grades 9 and 11 for QLP schools, as well as mathematics classroom practicesin Grade 11 for QLP schools, were not found to be significantly different to language and mathematics classroompractices in parallel grades in control schools.
This in itself may be a very significant observation. It could be the (partial) result of specific efforts instituted byservice providers after the release of the mid-term evaluation report, in which it was pointed out that there wasa risk that schools focus too much on, or pay exclusive attention to, senior grades and especially mathematics.Such awareness may have led to targeting more interventions at the Grade 9 level, although still at mathematicsclassroom practices. The normal classroom practices for language and the strong focus on senior mathematicslearners, especially at non-QLP schools, may have continued unabated in the meantime.
Separate reporting of mathematics and language trends is undertaken in Chapter 5 of the technical report. Theinitial sense that learners in higher grades receive greater attention, as does mathematics rather than language,remains relevant. Indicators that revealed these two trends typically included the provision of learning resources,curriculum planning documents and management, and curriculum coverage. The practice of paying greaterattention to mathematics and to Grade 11 learners is probably due to the emphasis placed by the DoE and otherstakeholders on improving matriculation results, especially in the face of calls for the provision of high-levelhuman resources in the fields of mathematics, science and technology. There is, thus, a danger that the focus onhigher grades may be short-sighted, as the foundation required to produce solid final-year school students isneglected for shorter-term gains.
Greater attention should be directed at how best to provide broad-based, integrated improvements tocurriculum and teacher practices.
In addition, the promotion of a “language-across-the-curriculum” approach is crucial to improved curriculumpractice. Two aspects of this approach can be singled out.
Teacher development programmes should focus on the effective use of LSMs, the optimal improvementof assessment practices, and the enhancement of access to support materials.
Free
dow
nloa
d fr
om w
ww
.hsr
cpre
ss.a
c.za

HUMAN SCIENCES RESEARCH COUNCIL18
RESULTS OF THE QLP EVALUATION
QLP SUMMATIVE EVALUATION
The quality of curriculum implementation in classrooms should be improved. The curriculum needs tobe covered systematically and sufficiently, lesson planning needs to improve, and learning programmesneed to be more effectively managed.
In terms of evaluating the role of teacher/classroom interventions and functioning in improving learnerperformance, a number of observations are pertinent. Teacher interventions could often be linked toimprovements in school functioning. Teacher functioning was often, with the exception of the findings derivedfrom Grade 11 language data, linked to learner performance in all grades, especially in 2004. The findings interms of language data signals that language ability is a much more intrinsic capacity that is gained by learnersthemselves, presumably through exposure to opportunities and through a desire to read, and that secondaryschool is too late a stage for improving this ability. Teacher interventions, in turn, could be linked directly withteacher functioning and especially with overall matriculation and English (Second Language) pass rates.
Learner Context and Performance
Across all districts, no significant changes were detected in learner profiles for 2000, 2002, and 2004. Theperceptions and attitudes of learners, although generally positive, seem to have become more negative towardscertain areas, such as the learning of mathematics and languages, teaching and learning conditions, the teachingability of their teachers, and assessment and homework practices. The remaining areas remained constant orincreased marginally over the five years. Learner scores on the Grade 9 and Grade 11 tests indicate relatively lowperformance across both grades and subjects.
A comparison of the scores achieved in QLP schools between 2000 and 2004 shows no change over this periodfor both grades and subject areas. Control schools revealed a similar trend. However, the matriculation scores inthe same schools improved from 2000 to 2004 in both learning areas. The findings are summarised in Figures Iand J.
Figure I: National mean mathematics scores for QLP and control schools by year and grade
For mathematics, a significantly higher performance was recorded for the knowledge domain as compared to thecomprehension and application domains across all three years of testing and both grades in the QLP schools. Theknowledge domain in mathematics improved marginally across the years in QLP schools, while that in controlschools remained the same.
Free
dow
nloa
d fr
om w
ww
.hsr
cpre
ss.a
c.za

HUMAN SCIENCES RESEARCH COUNCIL19
RESULTS OF THE QLP EVALUATION
QLP SUMMATIVE EVALUATION
Figure J: National mean language scores for QLP and control schools by year and grade
As the technical report indicates, a significant improvement was noted (although scores remained low) in theperformance of Grade 11 learners on tasks that assessed writing skills in the QLP schools. This trend was notfound in the control schools.
Overall, no significant improvements or declines in the national mean scores were noted and the performancelevel of the control schools remained significantly higher than the performance of the QLP schools for bothlearning areas and grades.
Analysis of performance scores by district shows that schools in Ubombo, Moretele and Bolobedu, more oftenthan schools in the other districts, achieved very low results for both learning areas and grades.
Additional analysis of the effect of gender and home language on learner performance showed that the effect ofgender was minimal, except for Grade 11 mathematics, where boys generally obtained higher scores. However,the home language of learners had a profound impact on their performance. Learners whose home language wasthe same as the language of the test scored significantly higher than their peers, except in the case of Grade 9mathematics learners.
In addition, across both grades and subject areas, learner scores were significantly lower on tasks that requiredthem to produce their own responses as opposed to selecting the correct answer from a given set of responses.
There was very little evidence to differentiate between learners in the QLP and the control schools in terms oftheir background. This is not surprising, as the school contextual circumstances and home conditions of learnerstogether form a pervasive system, which is not expected to change suddenly. Also, learners were not the directtarget (recipients) of the interventions. However, perceptions of the class environment, especially where itcomprised learner interaction and responses to classwork, as well as the order and discipline surroundingteaching and learning conditions, were rated more positively over time. Learners were also increasingly exposedto opportunities to attend extra lessons outside school.
There are various explanations for the poor performance behind the scores obtained by learners in Grades 9 and11 over the period of the study. First, QLP interventions did not target learners directly; hence, the long-term lageffect of attempts to correct systemic and other imbalances that had been inculcated over years in South African
Free
dow
nloa
d fr
om w
ww
.hsr
cpre
ss.a
c.za
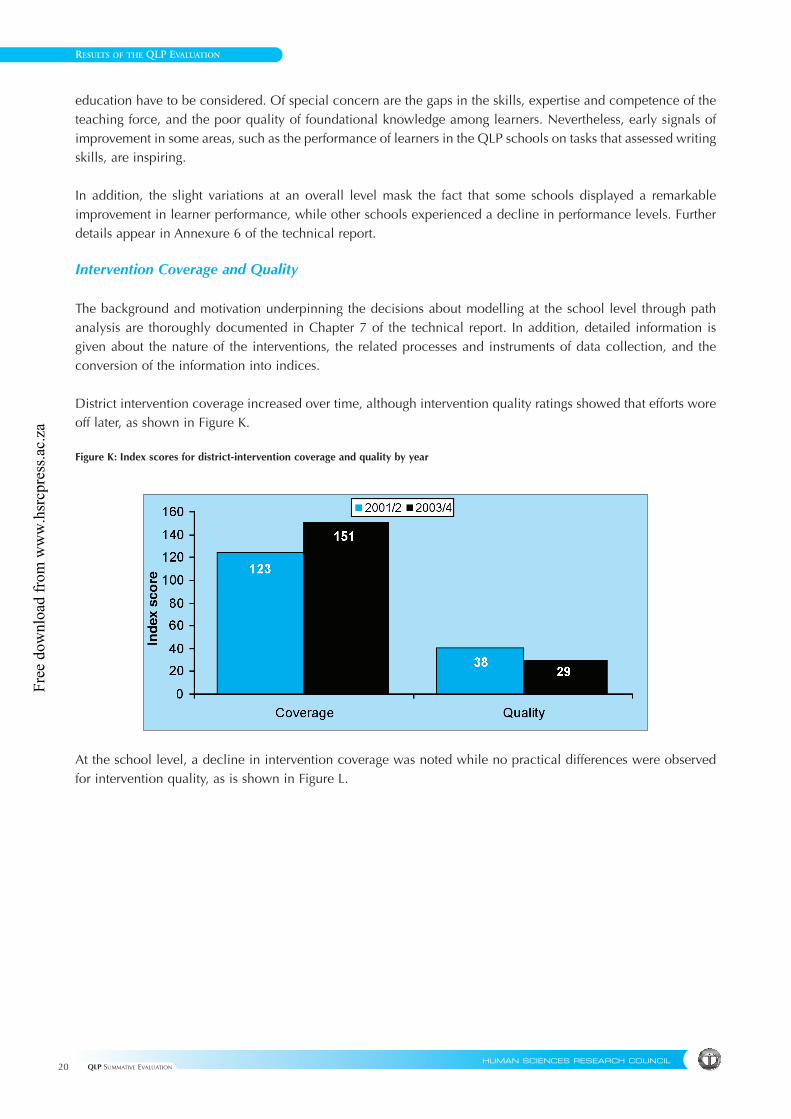
HUMAN SCIENCES RESEARCH COUNCIL20
RESULTS OF THE QLP EVALUATION
QLP SUMMATIVE EVALUATION
education have to be considered. Of special concern are the gaps in the skills, expertise and competence of theteaching force, and the poor quality of foundational knowledge among learners. Nevertheless, early signals ofimprovement in some areas, such as the performance of learners in the QLP schools on tasks that assessed writingskills, are inspiring.
In addition, the slight variations at an overall level mask the fact that some schools displayed a remarkableimprovement in learner performance, while other schools experienced a decline in performance levels. Furtherdetails appear in Annexure 6 of the technical report.
Intervention Coverage and Quality
The background and motivation underpinning the decisions about modelling at the school level through pathanalysis are thoroughly documented in Chapter 7 of the technical report. In addition, detailed information isgiven about the nature of the interventions, the related processes and instruments of data collection, and theconversion of the information into indices.
District intervention coverage increased over time, although intervention quality ratings showed that efforts woreoff later, as shown in Figure K.
Figure K: Index scores for district-intervention coverage and quality by year
At the school level, a decline in intervention coverage was noted while no practical differences were observedfor intervention quality, as is shown in Figure L.
Free
dow
nloa
d fr
om w
ww
.hsr
cpre
ss.a
c.za

HUMAN SCIENCES RESEARCH COUNCIL21
RESULTS OF THE QLP EVALUATION
QLP SUMMATIVE EVALUATION
Figure L: Index scores for school-intervention coverage and quality by year
Language-teacher intervention coverage and quality at both grade levels remained consistent over time. Formathematics, however, teacher-intervention coverage decreased visibly while intervention quality remained thesame. (See Figure M.)
Figure M: Index scores for teacher-intervention coverage and quality by year, subject and grade
Effects of Interventions on Functioning
The impact of the QLP interventions resulted in an improvement in the functioning of many districts, schools andclassrooms as documented in the tables and figures appearing in Chapter 7 of the technical report.
Interventions improved the functioning of districts, schools and classrooms, even over a short span of four yearsin the following ways:
• District interventions improved district functioning;• District interventions also led to better mathematics-classroom functioning; • Teacher interventions improved teaching practices; and • Teacher interventions consistently predicted improvement of school functioning, presumably because
teachers applied their new skills in school-management activities.
Free
dow
nloa
d fr
om w
ww
.hsr
cpre
ss.a
c.za

HUMAN SCIENCES RESEARCH COUNCIL22
RESULTS OF THE QLP EVALUATION
QLP SUMMATIVE EVALUATION
In addition, evidence was found that interventions had been targeted at areas where the need was greatest withinthe QLP.
For future intervention programmes this evidence suggests that it is possible to dedicate resources to selectedareas to improve the functioning of the system.
Effects of Improved Functioning on Learner Performance
This section of the report describes how learner performance was directly impacted upon by the improvement indistrict, school and classroom functioning. The most salient effects of the improved functioning on learnerperformance are noted below.
• Improved district functioning resulted in better Grade 11 mathematics performance.• Improved school functioning resulted in higher learner scores in Grade 9 mathematics and language for
2002 and 2004. A similar pattern was noted for Grade 11 language, while for Grade 11 mathematicslearner performance scores were higher for only 2002.
• Improved school functioning also resulted in higher matriculation pass rates in language in 2004.• Higher classroom functioning resulted in higher Grade 9 mathematics scores for 2002 and 2004; higher
Grades 9 and 11 language scores in 2002; and higher Grade 11 mathematics scores in 2004.• Better language-classroom functioning resulted in an improvement in the overall matriculation pass rates
in 2002.
Effects of Interventions on Learner Performance
The evaluation found it useful to report on the effects of specific interventions on learner performance, as thesepoint to areas where similar interventions could be fruitful.
• District interventions in 2003/4 resulted in higher Grade 11 mathematics scores in 2004.• More/better language-teacher interventions in 2003/4 were associated with lower Grade 9 language scores
in 2004 and fewer/poorer language-teacher inventions in 2003/4 were associated with higher Grade 9language scores in 2004. Additional analysis revealed that this was because the service provider targetedschools that had lower scores.
• Good language-teacher interventions in 2003/4 had a direct positive impact on the overall 2004matriculation pass rates in schools (see Annexure 5 of this report).
• High school functionality was the result of good language-teacher interventions, which resulted in highGrade 12 English pass rates (see Annexure 6 of this report).
• With regard to mathematics (SG), no effects of interventions or functionality were detected inmatriculation pass rates (see Annexure 7 of this report).
Modelling at the level of mathematics (HG) was not possible because of the low numbers of enrolled learners.
Interventions were targeted dynamically and interactively within the QLP where they were needed most. Thisfinding suggests that the QLP adopted responsive management practices and made appropriate decisions aboutstrategies and resources over the duration of the project.
Free
dow
nloa
d fr
om w
ww
.hsr
cpre
ss.a
c.za

HUMAN SCIENCES RESEARCH COUNCIL23
RESULTS OF THE QLP EVALUATION
QLP SUMMATIVE EVALUATION
Additional Observations Emanating from the Path Analysis
Schools in which the Grades 9 and 11 mathematics and language learners had obtained higher scores in 2002maintained higher performance levels in 2004. This is also true for overall matriculation pass rates as well asmathematics Grade 12 pass rates.
There is consistency and stability in intervention levels and system functioning over time. This finding signals thatonce critical mass and impetus are achieved, it is not too difficult to sustain them.
The evaluation study confirms that the functioning of districts, schools and classrooms had a positive impact onlearner performance.
The transfer of effects from year to year (2002 to 2004) in terms of interventions, functionality and learnerperformance signals stability in the sense of continuous resource allocation and effort in the same specificlocations. The fact that teacher interventions predicted school functionality could be ascribed to the applicationof newly developed skills by teachers in improving the functioning of both classrooms and schools.
School and teacher/classroom functioning predicted improved learner performance. In terms of the indicatorsand indices developed within the QLP model, this result provides specific information with regard to theapproach and focus required to improve ailing education systems, or parts of them, quickly.
For mathematics, at the level of Grade 11, district interventions predicted learner performance in the 2003/4period. This finding provides evidence that direct interventions by districts can result in improved learnerperformance as witnessed in the national and provincial efforts to improve mathematics matriculation pass rates.
With regard to overall matriculation pass rates, the success of language-teacher interventions in improving overalllearner performance across subjects in the 2003/4 period is very meaningful.
District restructuring (see Section 7.3 of the technical report) appears either to have had a positive effect in termsof improving conditions and functioning, or to have served as an additional burden of uncertainty and disorder,depending on whether the focus of the evaluation was on interventions, functionality or learner performance.QLP interventions sometimes served as a catalyst in aid of restructuring parts of the system, while at other timesthey were regarded as a burden on the system. Learner performance in non-restructured environments wasalmost always at a higher level than in restructured environments.
The effort, coherence and management of interventions of the QLP can, without a doubt, be said to have beencomprehensive, and at a scale not witnessed in South Africa before. The general impression is that of well-structured and well-integrated delivery. Limited infrastructure and capacity in the education system in somedistricts, and restructuring have been flagged as threats to the coherence and sufficiency of certain interventions.The disjuncture between school management, curriculum development and curriculum management was citedas a case in point. So was the risk of confusing the mere existence of documents, structures and systems with theeffective and efficient application of these documents, structures and systems.
Free
dow
nloa
d fr
om w
ww
.hsr
cpre
ss.a
c.za
HUMAN SCIENCES RESEARCH COUNCIL24
CONCLUDING STATEMENTS AND RECOMMENDATIONS
QLP SUMMATIVE EVALUATION
Concluding Statements and Recommendations
The findings of the summative evaluation indicate small to moderate changes in overall functionality at thedistrict, school and classroom levels. Learner performance mean scores at the national level showed nosignificant changes over time, while significant changes did occur at the level of schools. (Both positive andnegative changes were detected. Learner performance improved significantly in schools that had received goodinterventions and functioned well, while learner performance decreased in schools that had received poorinterventions and functioned poorly.)
Issues that may have impacted negatively on learner performance were the restructuring of the districts; a generaldecline in attendance of QLP workshops and follow-up activities by teachers after 2002; the deterioration ofcurriculum coverage in some districts; poor physical resources; and little or no access to LSMs.
The national mean percentage scores of learners in Grades 9 and 11 mathematics and language evaluation testsdid not change significantly over the period of the project. A significant and nuanced change worth noting is theimprovement of the performance of learners on tasks that assessed writing skills. Overall, a small improvementfor all grades and subject areas, except for Grade 11 mathematics, was observed. This is perhaps an indicationof the beginning of significant improvements in future performance levels. The study recognises that quick fixesin South Africa’s complex and severely compromised education system would be an unrealistic expectation.
In drawing the summative evaluation report to a close, a number of lessons ”from the field”, so to speak, arepresented below. There is an obligation to transfer the vast array of benefits and lessons learnt from this projectto the national education system, and also to ensure the sustainability of the effort of many participants madeover many years and at great cost.
Recommendations
In the next few paragraphs, conclusions are drawn from and recommendations made on the basis of theextremely rich set of observations that has been made, especially in terms of the trend descriptions detailed inChapters 3 to 6 of the technical report (as also summarised under the section entitled “Results of the QLPEvaluation” above). Aspects of system functioning that improved in QLP schools above the extent of the changesin control schools receive prominence. The causal modelling results reported in Chapter 7 of the technical report(again see the section mentioned above) are also examined. A concerted effort was made to identify, from asmany angles as possible, the factors that can be associated with improvement of district, school and classroomfunctionality and learner performance. The approach followed below is to bring the most meaningfulobservations and findings of the evaluation to the attention of the many role players in the system in the form ofrecommendations aimed at the transfer of the benefits outlined in this report to the broader system countrywide.
Recommendations are presented first in terms of methodology for similar projects, followed by recommendationson district, school and classroom levels, and on the effect of interventions.
Recommendations on Methodology and Design
The QLP evaluation report comprised a systematic, model-driven framework agreed upon by funders, managers,service providers and evaluators. This proved to be the single most important organising principle to keep theactivities of the project aligned and co-ordinated.
Free
dow
nloa
d fr
om w
ww
.hsr
cpre
ss.a
c.za

HUMAN SCIENCES RESEARCH COUNCIL25
CONCLUDING STATEMENTS AND RECOMMENDATIONS
QLP SUMMATIVE EVALUATION
It is recommended that sound programme conceptualisation, as well as the terms of reference forevaluation, be finalised prior to the commencement of the project in the field. Data collection andevaluation should occur independently from interventions, perhaps with a third party consulting in theinterface between intervention and evaluation processes.
It is recommended that not only future impact evaluations and research, but also interventions andactivities pertaining to school improvement be commensurate with an extensive, logical, structured,integrated and comprehensive organising principle, such as that achieved in the QLP, to guaranteesuccess, and guide the monitoring of progress.
A number of findings, often observed in schools, districts and provinces, point to the favouring of senior learnersand their performance above junior learners (i.e., Grades 11 and 12 above Grade 9), as well as mathematicsabove language. The QLP findings indicate that language interventions, especially from a perspective of languageacross the curriculum, impacted positively on learner performance.
It is recommended that education interventions be comprehensive and integrated, commence early inschool life, and cover a broad range of subjects, particularly in the area of language. Policy makers,educational managers, subject advisors, subject committees, and teachers should ensure that theoutcomes or effects of these interventions are sustainable and permanent.
The findings indicated that service providers frequently targeted interventions where they were most neededwithin the QLP, suggesting the optimal use of available resources.
It is recommended that programme implementers work from sound data to enable them to concentrateany interventions on those target groups most in need of these interventions, and not to waste resourceson parts of the system already functioning well.
The QLP evaluation study employed advanced data analysis techniques to analyse the complex data anddetermine the impact of the project.
The use of advanced analysis techniques is recommended for any future efforts to evaluate andmonitor school-improvement programmes.
There remains a large volume of information in the technical report as well as raw data, which require bothadditional analysis and further dissemination.
The findings of the QLP need to be disseminated widely, at all levels of the system. This entails thedevelopment of customised presentations to different role players, who have different needs and operateat different levels. More detailed analyses of the relationship between system functionality andperformance outcomes may be required to make such dissemination as meaningful as possible. Inaddition, it will be useful to locate the findings of the QLP within broader theoretical paradigms, and toexplore new theoretical approaches to interventions for school improvement.
Project methodology and sampling changed mid-way between 2000 and 2002. This created many additionallogistical and other ramifications for the intervention and evaluation tasks.
To measure change, do not change the measures. This truism demands that participants in assessment,evaluation and monitoring should at the outset adopt the appropriate approach and instruments, andshould adhere to the effort for the duration of the project.
Free
dow
nloa
d fr
om w
ww
.hsr
cpre
ss.a
c.za

HUMAN SCIENCES RESEARCH COUNCIL26
CONCLUDING STATEMENTS AND RECOMMENDATIONS
QLP SUMMATIVE EVALUATION
The validity of the QLP data was enhanced by the theoretical basis of the evaluation and the types of dataobtained (interviews, document review, surveys, observations and performance tests). Thus, all data collectedaccurately reflected prevailing conditions and practices as opposed to merely recording their existence from self-reported information.
Efforts should be maintained to triangulate all information in projects designed to monitor educationalprogress. This especially entails strengthening quantitative, self-reported, questionnaire-based data andinformation, which easily suffers from halo effects and other validity threats, by supplementing themwith observations, document reviews and interviews.
Sampling processes at some stages in the QLP evaluation were determined by budget limitations and otherconstraints, such as the limited availability of information for the purpose of drawing up sample frames andstructural changes in the system. These constraints imposed limitations on the eventual analyses.
In instances where samples are used to monitor and evaluate the impact of intervention programmes, allproject participants should ensure that sample sizes are sufficient and that samples are drawn on thebasis of relevant and up-to-date information.
An arsenal of tools and instruments was developed for the QLP. While a significant amount of this informationwas useful for, and directly relevant to, the evaluation, some data had limited value, resulting in informationoverload. Subsequent changes in the evaluation design addressed this “overload”.
Project evaluators and managers should focus only on covering essential, core phenomena in well-conceptualised ways, by this means reducing the volume of data collected, and the consequent data-management complications.
Substantive attempts were made to ensure a very good fit between curriculum contents and the samples of tasksin learner-assessment instruments through specification tables, proper item-development procedures, andvalidation processes.
Test developers and users should not accept any reduction in quality pertaining to performanceassessment instruments because valid, reliable and secure tools are essential to monitoring. In addition,comparability across learners and other sub-groups, and continuity over time should be taken intoconsideration.
Quality-assurance procedures in the QLP evaluation with regard to training standards, fieldwork manuals,monitoring of fieldworkers, scoring and coding of data, data cleaning and management, etc. wereuncompromisingly strict so that valid findings could be ensured.
Quality control should not be merely a concept or be assumed, but should be documented throughrelevant comparisons by means of empirical data.
As presented in Table 2.1 in the technical report, a range of indicators was monitored across the levels of theevaluation model. These are reflected upon next.
District-level Recommendations
Working from a district-based model made sense for the project, with respect to both the interventions as wellas their evaluation. This conclusion is based on many findings pointing to the impact that district interventions
Free
dow
nloa
d fr
om w
ww
.hsr
cpre
ss.a
c.za

HUMAN SCIENCES RESEARCH COUNCIL27
CONCLUDING STATEMENTS AND RECOMMENDATIONS
QLP SUMMATIVE EVALUATION
had on district functioning and on learner performance. In addition, significant differences in learnerperformance were also observed between districts that had and those that had not experienced restructuring.
It is recommended that district managers, provincial officials, school principals and management staffcontinue to consider the district level as an important part of the delivery chain of quality teaching andlearning. Role players should be made aware that district functioning should be optimal in terms ofcapacity, infrastructure and processes to allow districts to play their rightful role in their relevanthierarchical position in the system.
Chapter 3 of the technical report describes those aspects of district functioning that improved most over time.These include the use of job descriptions, financial planning and management, and within-district planning. Ofspecial importance for delivery are also school-support planning and the implementation of school-supportactions. However, the decreasing index scores related to the adoption and use of school-categorisation systemsto identify schools and subjects in need of attention is cause for concern.
It is recommended that those aspects of district functioning that improved most be prioritised in futureorganisational development initiatives. The findings suggest that clear roles and proper planning andmanagement (including financial accountability) form the foundations of sound school-support plansand their implementation. Future interventions should commence by confirming that the organisationalstructures and resources are in place, before management development and organisational developmentand planning are attended to in an integrated way.
School-level Recommendations
Information about both the QLP and the control schools is provided in Chapter 4 of the technical report, which,at a general level, shows that school functioning improved by more than 10% in QLP schools, while no changewas observed in the control schools. This difference can clearly be attributed to the interventions of the QLP. Theareas in which improvement in QLP schools was greater than that in control schools include the provision andcondition of facilities, resources and infrastructure; the reduction of the negative effects of shortages ofinstructional materials on teaching and learning; needs-based teacher training and mentoring in terms of theprovision of curriculum leadership; the existence and functioning of SGBs and SMTs; and the existence andeffective use of records, especially for assets, LSMs, stockrooms and finances, as proof of effective schooladministration. All of these areas concur with strong mandates given to QLP service providers for effectingimprovement.
School principals and managerial staff, including their line-function departments at the district andprovincial levels, should ensure continuous development and training of SMTs and governing bodies.
Management should focus on the establishment and execution of sound curriculum-leadership capacityand practices, given that curriculum is the heartbeat of the school.
Mentoring and coaching should be central elements of professional development interventions.
Schools should be assisted to ensure that they are organised, orderly, efficient entities that functionoptimally in terms of administration, records, discipline, and financial practices.
Free
dow
nloa
d fr
om w
ww
.hsr
cpre
ss.a
c.za

HUMAN SCIENCES RESEARCH COUNCIL28
CONCLUDING STATEMENTS AND RECOMMENDATIONS
QLP SUMMATIVE EVALUATION
Classroom-level Recommendations
The summary tables in the mathematics section in Chapter 5 (Tables 5.30a and 5.30b) in the technical reportshow that the QLP schools outperformed the control schools, with regard to Grade 9 activities, in terms ofsuperior use made by teachers of lesson pedagogy, assessment, and classwork practices. With respect to Grade11 activities, curriculum coverage, classwork practices and homework practices are included among thoseactivities in which the QLP schools outperformed the control schools.
With regard to reading and writing (language) classroom practices (see Tables 5.59a and 5.59b in the technicalreport), the instances in which the QLP schools outperformed the control schools in terms of improvement overtime, for Grade 9 activities, were curriculum coverage, cognitive demand of the lesson, lesson pedagogy, andclasswork. With respect to Grade 11 activities, curriculum coverage and classwork are again included.
It is recommended that curriculum mentors, such as LASs, principals and HODs, concentrate on theimprovement of teacher/classroom practices, such as pedagogy, managing the teaching-learninginteraction, assessment, and class and homework tasks.
In many instances, evidence was found of teachers placing greater emphasis on the mathematics classroom asopposed to the language classroom, and on Grade 11 learners as opposed to Grade 9 learners.
It is recommended that interventions and practices should be evenly spread across both learning areasand grades, especially given the effect of language interventions and practices on learner performance andpass rates.
Causal Modelling Recommendations
The findings on the impact of project interventions through the application of statistical modelling are reportedin detail in Chapter 7 of the technical report.
Readers are referred to details pertaining to levels of learning (Grades 9, 11 or 12; and HG or SG), the subjectsat stake (mathematics, or reading and writing/English), and the type of criterion scores predicted (learner marks,pass rates, or numbers of learners passing in a category), which have been employed to investigate the varioustrends and paths. The information presented in the technical report, and summarised in this report, indicatesthose cases in which: (a) interventions improved functionality and/or learner performance; and (b) functionalityimproved learner performance. In addition, seven path diagrams graphically indicate the significant regressioncoefficients. (See Annexures 1 to 7 towards the end of this report.)
It is recommended that appropriate modelling techniques be used to identify causal patterns for factorsaffecting learner performance.
Service providers and their programme managers should be made aware that initial intervention impetusmay be followed by a decreasing trend once the initial energy and excitement start to wane.
The evaluation research team, in collaboration with other role players in this long-term evaluationproject, should embark on activities designed to uncover, organise and structure the more detailed linksbetween different types of intervention, the circumstances under which they occur, and aspects offunctionality, at the various levels of the system, that can be related to learner-performanceimprovements.
Free
dow
nloa
d fr
om w
ww
.hsr
cpre
ss.a
c.za
HUMAN SCIENCES RESEARCH COUNCIL29
CONCLUDING STATEMENTS AND RECOMMENDATIONS
QLP SUMMATIVE EVALUATION
The findings of this evaluation covered trends between 2000 and 2004 pertaining to the impact of theinterventions at the district, school and classroom levels. Given the short period covered by the interventions, thesustainability of the interventions is as yet unknown. This information is crucial to determine which interventionshave the greatest long-term positive effect on the system and the cost-effectiveness of these interventions. Thiswill enable the isolation of specific interventions, which can be applied at the national level for improving theeducation system.
It is recommended that this evaluation be replicated within two to four years to determine whichinterventions retained their impacts and effects on district, school and classroom functioning as well ason learner performance over time.
Conclusion
The summative evaluation revealed significant improvements in overall classroom, school and districtfunctionality, as well as in specific learner-performance scores and pass rates as a result of the QLP interventions.It is hoped that stakeholders will engage with the findings of the study and adopt the lessons learnt in theirrespective domains of jurisdiction and activity. In this way the functioning of districts, schools and teachers willbe enhanced, thus leading to an improvement in the quality of the education provided to learners.
The challenge is to ensure that the impressive gains made are sustainable over time. An appropriate responsewould be to establish a forum that brings together relevant role players to attend to this task. In such an approach,attention has to be given to the optimal allocation of resources directed at those factors and processes mostamenable to change and best aligned with desirable outcomes and improvements, as has been demonstrated inthis study.
Free
dow
nloa
d fr
om w
ww
.hsr
cpre
ss.a
c.za

HUMAN SCIENCES RESEARCH COUNCIL30
ANNEXURES
QLP SUMMATIVE EVALUATION
Annexure 1: Standardised path weights for modelling Grade 9 mathematics causal patterns
Maths Teacher2001/02
School 2001/02
District 2001/02
Maths Class 2002
School 2002
District 2002
-.26 .30
.26
.55
.16
.85
.37
.50 -.31 .40 .33 .29 .41 .34
.14
Maths Teacher2003/04
School 2003/04
District 2003/04
Maths Class 2004
School 2004
District 2004
2001—2002
2003—2004
.73
Maths Gr 92002 %
Maths Gr 92004 %
Learnerperformance
FunctioningInterventions
.35
Free
dow
nloa
d fr
om w
ww
.hsr
cpre
ss.a
c.za

HUMAN SCIENCES RESEARCH COUNCIL31
ANNEXURES
QLP SUMMATIVE EVALUATION
Annexure 2: Standardised path weights for modelling Grade 9 language causal patterns
Lang Teacher2001/02
School 2001/02
District 2001/02
Lang Class 2002
School 2002
District 2002
-.42
-.32
.37
.39
.15
.80
.37
.49 -.38 .28 .57 .39 .29
-.15
Lang Teacher2003/04
School 2003/04
District 2003/04
Lang Class 2004
School 2004
District 2004
2001—2002
2003—2004
.39
.70
Lang Gr 92002 %
Lang Gr 92004 %
Learnerperformance
FunctioningInterventions
.29
Free
dow
nloa
d fr
om w
ww
.hsr
cpre
ss.a
c.za

HUMAN SCIENCES RESEARCH COUNCIL32
ANNEXURES
QLP SUMMATIVE EVALUATION
Annexure 3: Standardised path weights for modelling Grade 11 mathematics causal patterns
Maths Teacher2001/02
School 2001/02
District 2001/02
Maths Class 2002
School 2002
District 2002
-.21
.31.23
.25
.37
.20
.51
.33
.48 -.34 .30 .50 .65 .37 .27
.31
Maths Teacher2003/04
School 2003/04
District 2003/04
Maths Class 2004
School 2004
District 2004
2001—2002
2003—2004
.24
-.15
-.23
.40
Maths Gr 112002 %
Maths Gr 112004 %
Learnerperformance
FunctioningInterventions
Free
dow
nloa
d fr
om w
ww
.hsr
cpre
ss.a
c.za

HUMAN SCIENCES RESEARCH COUNCIL33
ANNEXURES
QLP SUMMATIVE EVALUATION
Annexure 4: Standardised path weights for modelling Grade 11 language causal patterns
Lang Teacher2001/02
School 2001/02
District 2001/02
Lang Class 2002
School 2002
District 2002
-.41
.38
.35
.35.41
.13
-.15
.36
.19
.44 -.33 .27 .31 .67 .39-.33
Lang Teacher2003/04
School 2003/04
District 2003/04
Lang Class 2004
School 2004
District 2004
2001—2002
2003—2004
.32
.33
.38
.33
Lang Gr 112002 %
Lang Gr 112004 %
Learnerperformance
FunctioningInterventions
.83
Free
dow
nloa
d fr
om w
ww
.hsr
cpre
ss.a
c.za

HUMAN SCIENCES RESEARCH COUNCIL34 QLP SUMMATIVE EVALUATION
Annexure 5: Standardised path weights for modelling matriculation pass rate causal patterns
Lang Teacher2001/02
School 2001/02
District 2001/02
Lang Class Gr 11 2002
School 2002
District 2002
-.41
.33
.22
.58
.42
.32
.37
.45 -.37 .27 .30 .67.34 .39 .28
.30
Lang Teacher2003/04
School 2003/04
District 2003/04
Lang Class Gr 11 2004
School 2004
District 2004
2001—2002
2003—2004
.32
.21 .19 -.33
School-Overall
School-Overall
Gr 12 pass rateFunctioningInterventions
ANNEXURES
Free
dow
nloa
d fr
om w
ww
.hsr
cpre
ss.a
c.za

HUMAN SCIENCES RESEARCH COUNCIL35QLP SUMMATIVE EVALUATION
Annexure 6: Standardised path weights for modelling matriculation English pass rate causal patterns
Lang Teacher2001/02
School 2001/02
District 2001/02
Lang Class Gr 11 2002
School 2002
District 2002
-.27
-.47
.22
-.56
-.28
-.25
.39
.40
.31
.36
.45 -.37 .27 .31 .66.33 .37 .22
Lang Teacher2003/04
School 2003/04
District 2003/04
Lang Class Gr 11 2004
School 2004
District 2004
2001—2002
2003—2004
.33
.23 .23 -.35
English HG2nd Lang
English HG2nd Lang
Gr 12 pass rateFunctioningInterventions
ANNEXURES
Free
dow
nloa
d fr
om w
ww
.hsr
cpre
ss.a
c.za

HUMAN SCIENCES RESEARCH COUNCIL36 QLP SUMMATIVE EVALUATION
Annexure 7: Standardised path weights for modelling Grade 12 (SG) mathematics pass rates
Maths Teacher2001/02
School 2001/02
District 2001/02
Maths Class Gr 11 2002
School 2002
District 2002
.30
.32
.62
.29
.44 -.40 .33 .47 .66 .32.30.27
Maths Teacher2003/04
School 2003/04
District 2003/04
Maths Class Gr 11 2004
School 2004
District 2004
2001—2002
2003—2004
.26
-.20-.22
21
.34
MathematicsSG
MathematicsSG
Gr 12 pass rateFunctioningInterventions
ANNEXURES
Free
dow
nloa
d fr
om w
ww
.hsr
cpre
ss.a
c.za