improving nanoparticle diffusion in a tumor collagen ... nanoparticle...improving nanoparticle...
TRANSCRIPT
TSpace Research Repository tspace.library.utoronto.ca
Improving Nanoparticle Diffusion in a Tumor Collagen Matrix by Photo-thermal
Gold Nanorods
Vahid Raeesi and Warren C. W. Chan
Version Post-Print/Accepted Manuscript
Citation (published version)
V. Raeesi, W. C. W. Chan, “Improving Nanoparticle Diffusion in a Tumor Collagen Matrix by Photo-thermal Gold Nanorods,” Nanoscale 8, 2016, pp. 12524-12530.
Publisher’s Statement The final publication is available at Royal Society of Chemistry via http://dx.doi.org/10.1039/C5NR08463F.
How to cite TSpace items
Always cite the published version, so the author(s) will receive recognition through services that track citation counts, e.g. Scopus. If you need to cite the page number of the TSpace version (original manuscript or accepted manuscript) because you cannot access the published version, then cite the TSpace version in addition to the published version using the permanent URI (handle) found on the record page.
InvitationforSpecialIssueonCancerNanomedicine
1
Improving nanoparticles diffusion inside tumor collagen by photo-thermal gold nanorods Vahid Raeesi1, 2 and Warren Chan*1-4 1Department of Material Science and Engineering, University of Toronto, Toronto M5S 3E1, Canada, 2Institute of Biomaterials and Biomedical Engineering, University of Toronto, Toronto, Ontario M5S 3G9, Canada, 3Department of Chemical Engineering, University of Toronto, Toronto, Ontario M5S 3E5, Canada, 4Department of Chemistry, University of Toronto, Toronto, Ontario M5S 3H6, Canada.
Abstract. Collagen (I) impairs the targeting of nanoparticles to tumor cells by obstructing their diffusion inside dense tumor interstitial matrix. Especially, this makes large nanoparticles (> 50nm) to reside near the tumor vessels and thereby compromises their functionality. Here we propose a strategy to locally improve nanoparticle transport inside collagen (I) component of the tumor tissue. We first used heat generating gold nanorods to alter collagen (I) matrix by local temperature elevation. We then explored this impact on the transport of 50nm and 120nm inorganic nanoparticles inside collagen (I). We demonstrated increase in average diffusivity of 50nm and 120nm in the denatured collagen (I) by ~ 14 and ~ 21 fold, respectively, compared to intact untreated collagen (I) matrix. This study shows how nanoparticle-mediated hyperthermia inside tumor tissue can improve the transport of large nanoparticles (>50nm) through collagen (I) matrix. The ability to increase nanoparticles diffusion inside tumor stroma allows their targeting or other functionalities to take effect, thereby significant impact. A major focus in cancer nanomedicine is to transport nanoparticles to cells within tumor milieu1-3.
Nanoparticles are designed as imaging probes4-6 and therapeutic agents7-10 to target tumor cells. To
target tumor cells, nanoparticles are surface modified with a ligand that is specifically recognized
by tumor cells11,12 and are then injected into the bloodstream. These nanoparticles are next
transported through blood circulation to the tumor vessels, where it has been proposed to escape
the leaky tumor vessels via enhanced permeability and retention mechanism13-15. Once
nanoparticles cross the vessel wall, they need to be transported through the tumor interstitial
matrix to reach the cells. Collagen (I), a major protein in the tumor interstitium16, forms a dense
3D network of fibrilar structure in the interstitial space between the tumor cells and blood vessels,
and acts as the dominant physiological barrier against diffusion inside the tumor17-19. This poses a
great challenge for many nanoparticle designs, especially for larger sizes (e.g., 100 nm) that get
InvitationforSpecialIssueonCancerNanomedicine
2
stuck within the collagen network20. If the nanoparticles are unable to diffuse through the tumor
interstitial matrix, they will reside near the vessel. There are two consequences to this: (1) targeted
nanoparticles will not be able to interact with receptors on the cells, and (2) tumor retention may
be shortened as they can easily diffuse out of the tumor because of high interstitial pressure
(IFP)21. The inability of nanoparticles to transport through the tumor interstitial matrix may be a
reason that a number of recent studies showed a lack of difference in total tumor accumulation
between active and passive-design nanoparticles22-25. Hence, there is a need to develop strategies
to alter the tumor matrix to enable transport of nanoparticles through it. A number of strategies
have been proposed: (a) the use and incorporation of proteolytic enzyme collagenase26 in the
nanoparticle design27-29 and (b) design of larger nanoparticles to degrade and release smaller
nanoparticles within the tumor matrix30. However, these strategies have limitations. First, free
collagenase can not be systematically administered as collagen is the structural protein in other
organs31 or it may lose activity during nanoparticle formulation process32. Second, conversion of
large particle assemblies to small nanoparticles require intricate design chemistry to minimize
degradation during circulation33 and rapid release34 within tumor matrix before being cleared by
elevated IFP35. Given the heterogeneity of tumors plus variable tumor retention rates based on
nanoparticle physical-chemical properties, it may be difficult to design a unified nanosystem for
this purpose.
Here we proposed a strategy to locally improve nanoparticle transport inside collagen (I)
component of the tumor tissue. In a collagen (I) µ-channel setup, we first introduced gold
nanorods (GNRs) to alter the collagen (I) matrix under near-infrared (NIR) light stimulation. We
showed local irreversible denaturation of collagen (I) fibrils by using GNR’s to photo-thermally
increase the local temperature to 45-55°C. We then introduced two sizes of 50nm and 120nm
nanoparticles with the same surface chemistry into both treated and untreated collagen (I) µ-
InvitationforSpecialIssueonCancerNanomedicine
3
channels. We demonstrated increase in average diffusivity of 50nm and 120nm in the denatured
collagen (I) by ~ 14 and ~ 21 fold, respectively, compared to intact untreated collagen (I) matrix.
This study shows how nanoparticle-mediated hyperthermia inside tumor tissue can improve the
transport of large nanoparticles (>50nm) through collagen (I) matrix.
GNRs were selected for this study because the heat generated by these nanoparticles have
a theoretical photo-thermal (PTT) conversion efficiency of > 90% with NIR wavelength excitation
between 700-850nm. Also, this wavelength range has been shown to yield the largest tissue
penetration depth36. GNRs have been applied for single cancer therapy as a hyperthermia agent37-
40 or as part of a combinatorial strategy for synergistic killing41-43 of tumor cells. The experimental
set-up to study the effect of GNRs generated heat on transport through a collagen (I) matrix is
described in figures 1a and b. The glass µ-chip had two reservoirs, which were connected through
a µ-channel. We filled the channel with bovine collagen (I) solution and neutralized it to form
rigid gel structure in 4hrs. The collagen (I) matrix appeared turbid inside the µ-channel (Figure
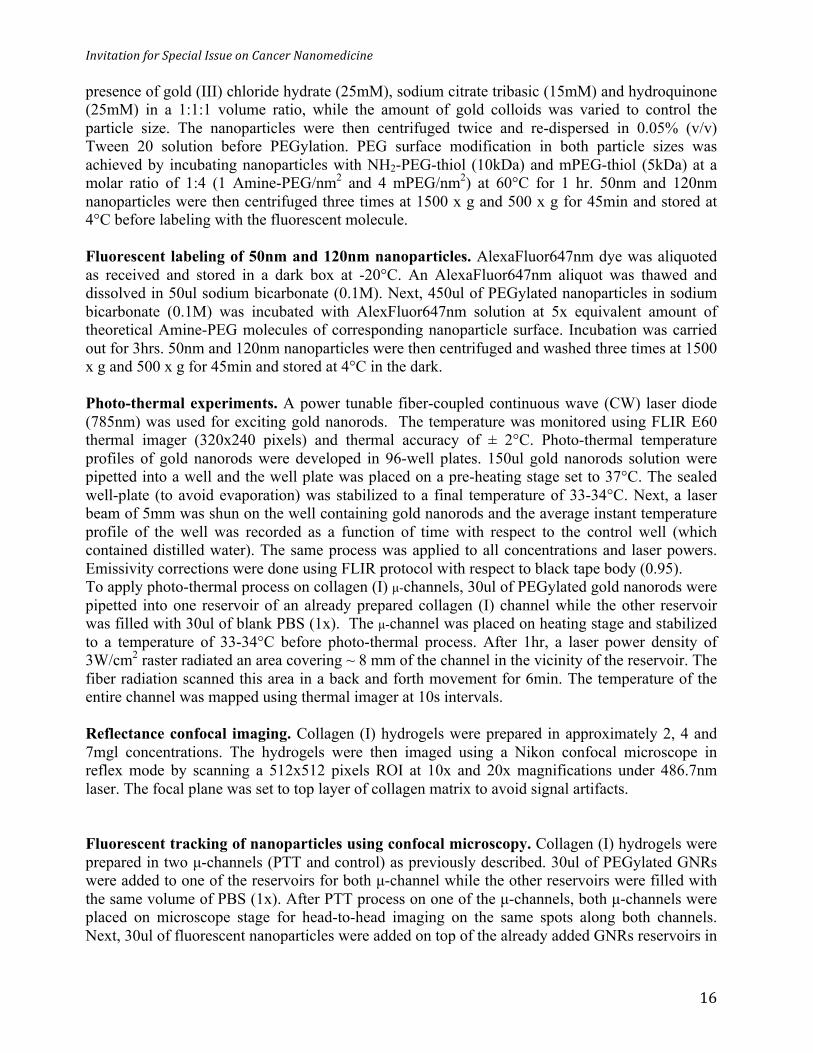
1c). Reflectance confocal imaging revealed a porous structure with randomly oriented collagen
fibers at a concentration ranging from 2-7 mg/mL (Figure S1). A 7mg/ml collagen concentration
(Figure 1d) was used for most experiments as it was in the range of the reported collagen (I)
contents in tumors44. The transport mode in our setup was diffusion (derived by concentration
gradient) as there was no convective flow (Peclet number ~ 0). GNRs were synthesized via a
directional growth of gold seeds in cetyltrimethyl ammonium bromide (CTAB) surfactant and
ascorbic acid41,45(See Materials Methods in the Supplement Section). Next, GNRs were coated
with polyethylene glycol (PEG) to stabilize them in a buffer medium. The GNRs had an average
length to width ratio of 28nm x 7nm (Figure 2a), longitudinal absorption peak at 750nm and a
transverse peak at 520nm (Figure 2b). 30µl GNRs were added to one reservoir and the other
reservoir was filled with equal volume of phosphate buffered saline (PBS). Then we used a
InvitationforSpecialIssueonCancerNanomedicine
4
continuous wavelength near-IR laser (785nm) to excite the GNRs and the temperature was
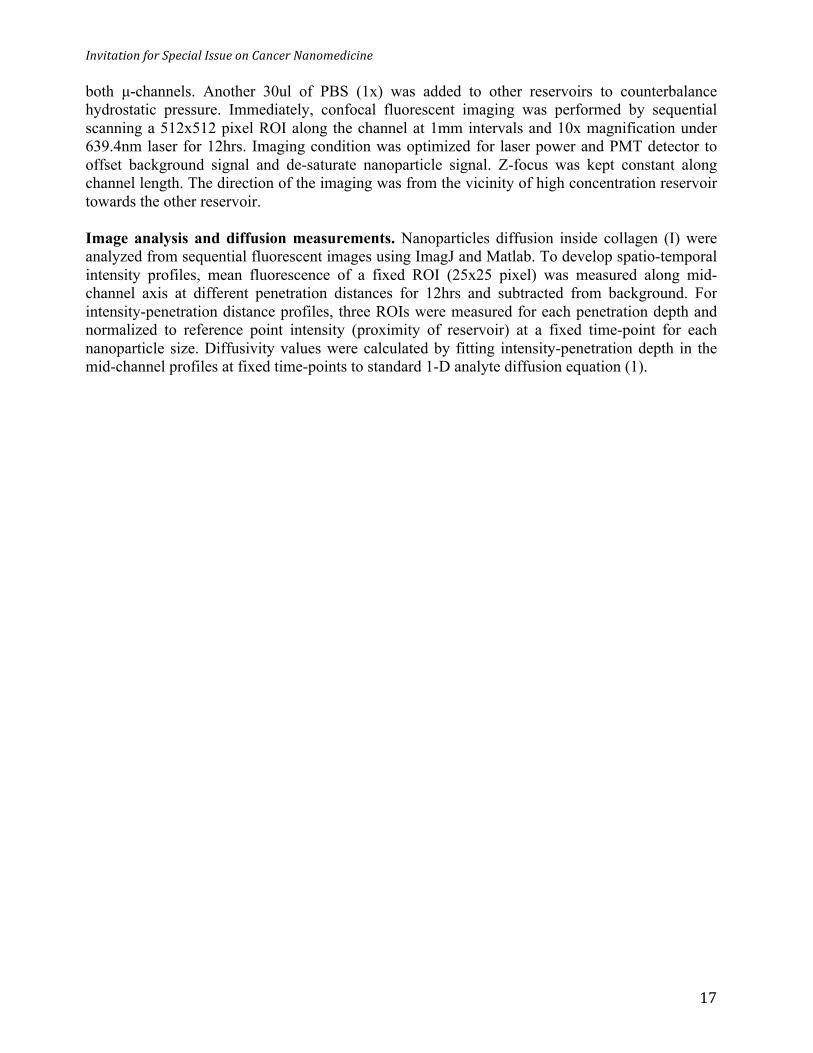
monitored using thermal imaging. We first correlated the relationship between GNR concentration
and laser power to control temperature elevation (Figure 2c and S2). We utilized this
characterization to study the effect of heat on collagen (I) gel structure in the µ-channels. We
raster irradiated the channel horizontally with a 5 mm diameter laser beam in one side of the µ-
channel. We optimized the GNR concentration (6nM), laser power density (3W/cm2) so that the
channel exposed-area exhibit an average temperature between 45-55°C, in the range of reported
collagen (I) denaturation temperatures46,47 (See figure 2d) When the µ-channel was heated, the
exposed area became clear (Figure 2d). The heated medium converted from a dense hydrogel to a
liquid-like medium. We detected no reflectance signal from collagen fibrils within a photo-
thermally exposed area (Figure 2e and f) with 88% loss of turbidity (as measured by absorbance
measurements at 405 nm48) compared to non-exposed areas (Figure 2g), suggesting the
disappearance of collagen fibers. After cooling, the fiber structure did not re-form, indicating
irreversible denaturation of collagen fibers. This is likely due to the transformation of the native
triple helical structure into a random coiled structure as reported by previous studies46,49. This
change in conformation was further confirmed by the observation of agglomerates at the bottom of
the channel wall (Figure 2h).
The GNR’s PTT experiments clearly showed that the fibrilar structure was altered in the
collagen (I) matrix. We next evaluated whether this change in collagen (I) matrix will lead to an
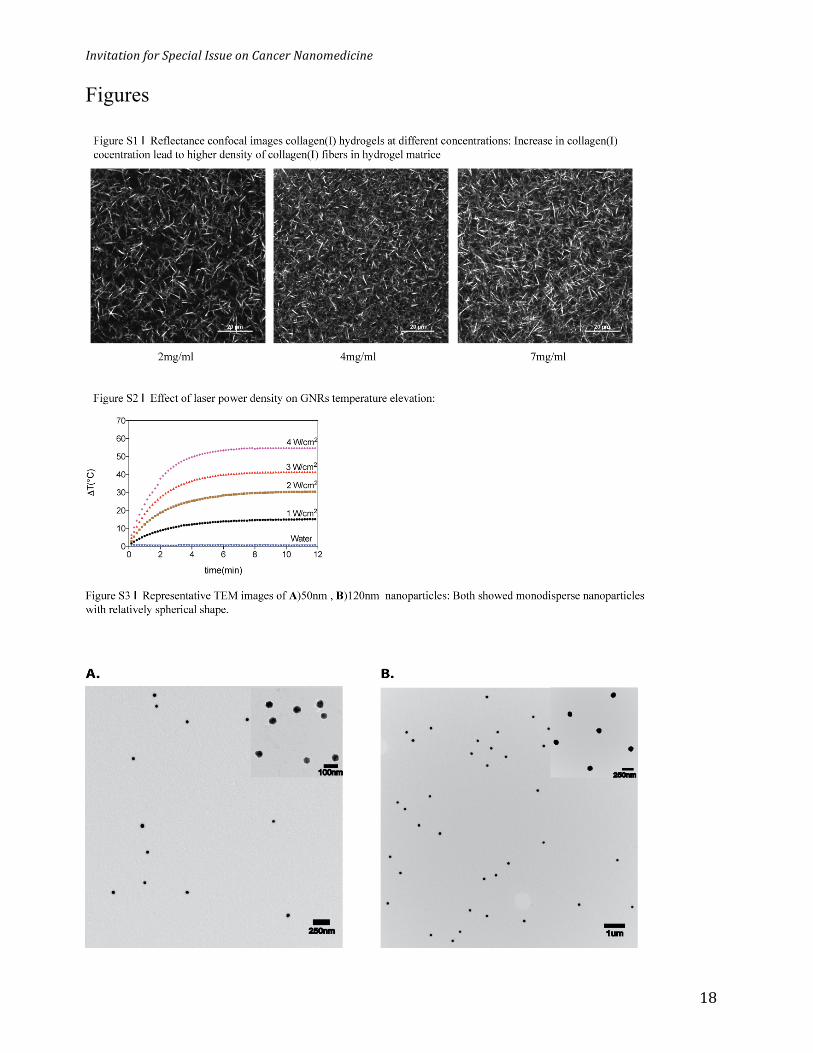
increase in transport of spherical nanoparticles. We selected gold nanoparticles of 50 and 120 nm
core diameters as model particle systems. These spherical gold nanoparticles were synthesized
using a hydroquinone-seed mediated growth method and surface coated with polyethylene glycol
and AlexaFluor dye molecules using previous developed methods from our laboratory (Figure 3a,
See materials and methods). This dye was selected because it can be excited at 647 nm and the
InvitationforSpecialIssueonCancerNanomedicine
5
emission is far from the plasmon band of the gold nanoparticles, so that minimal quenching of the
dye by gold nanoparticle surface would occur. The 50nm and 120nm nanoparticles showed
plasmon peaks at 535nm and 595nm, respectively (Figure 3b). TEM images revealed their size
and shape with narrow size distribution (Figure S3) and this was supported by dynamic light
scattering measurements with a PDI < 0.06.
To demonstrate GNR’s PTT effect on diffusion, we added GNRs (6nM) in one reservoir of
both µ-channels and then illuminated the channel with a laser for 6min using our previously
optimized conditions. We then added the fluorescently-tagged nanoparticles on top of the GNRs
reservoir and then traced the motion of the nanoparticles as it was diffusing along the collagen (I)
matrix channel length using confocal fluorescence microscopy (Materials and Methods). Images
were recorded in 12hrs at different distances along the µ-channel and processed using ImageJ and
Matlab to develop spatio-temporal intensity profiles and calculate diffusivity values, respectively.
The confocal fluorescent images in figure 3c illustrate the diffusion of the 50nm (red) and 120nm
(green) nanoparticles along the collagen (I) matrix channel before and after PTT treatment. The
red/green colors are meant to distinguish between 50nm and 120nm nanoparticles and not
indicative of actual emission channel. The diffusion direction is from left (high concentration) to
right (low concentration) at the same time point and the position for each particle size. Regardless
of nanoparticle size, in untreated collagen (I) matrix, the average intensity along the channel
length is low and most of the nanoparticles are populated at the left end of the channel whereas in
a photo-thermally treated (PTT) collagen (I) matrix, we detected higher average fluorescence
intensity through the entire length of the channel. Qualitatively, we can make two conclusions. (1)
At a defined time t, the number of nanoparticles along the length of the channel is higher in PTT-
treated channel for both nanoparticle sizes. (2) At the same nanoparticle concentration, the
penetration depth through the collagen (I) matrix is increased when PTT is applied. This suggested
InvitationforSpecialIssueonCancerNanomedicine
6
that there was an increase in the diffusivity of nanoparticles through the collagen (I) matrix after
PTT. We further scrutinized these results by developing intensity profile along the mid-channel
for each particle size. Figure 3d,e show temporal intensity profiles for the 50nm nanoparticles in
control and PTT-treated µ-channels, respectively. The PTT process increased the rate of intensity
change compared to an intact collagen (I) matrix, regardless of the penetration depth. For a fixed
penetration depth (same concentration gradient), the rate of increase in intensity can be a measure
of how resistant the medium is against diffusion. For penetration depth of 0-500µm, we calculated
~ 9 fold increase in the intensity rate for PTT treated channel. This means in PTT denatured
collagen (I) matrix, 50nm nanoparticles reached their initial local maximum concentration 9 times
faster than intact collagen (I) matrix (control). We then plotted the normalized intensity versus
penetration depth at t = 4hrs which was the required time for x = 0 (Reference point) to reach its
maximum point (Figure 3f). For penetration depth of 100µm-1000µm, we found 2.1-18.0 fold
increase in the intensity. We inferred in PTT treated channel, the local concentration of 50nm
nanoparticles at different penetration depth was increased. Also, an increase in the intensity from
0% to 54% at x =1,000µm suggests that the penetration depth in PTT-treated channel was
increased. The effect of the PTT process for 120 nm particles followed the same trend as 50 nm
nanoparticles, shown in Figure 3g, h. 120nm nanoparticles reached saturation in PTT-treated
channel in ~ 3hrs while in untreated channel the signal for the same spot started to saturate after
12 hrs. 120 nm nanoparticles showed fluorescent signals at 500 µm for PTT treat collagen (I)
matrix as compared to untreated matrix. This suggested more than a 300µm increase in
penetration depth for 120nm nanoparticles. We quantified the change in collagen (I) matrix
diffusivity (D) by developing intensity profiles versus penetration distance at fixed time points and
fitted the data to fick’s law solution:
InvitationforSpecialIssueonCancerNanomedicine
7
𝐶 𝑥, 𝑡 = 𝐴 𝑒𝑟𝑓𝑐( !! !"
) (1)
where C denotes nanoparticle intensity, x represents diffusion distance and t shows imaging time.
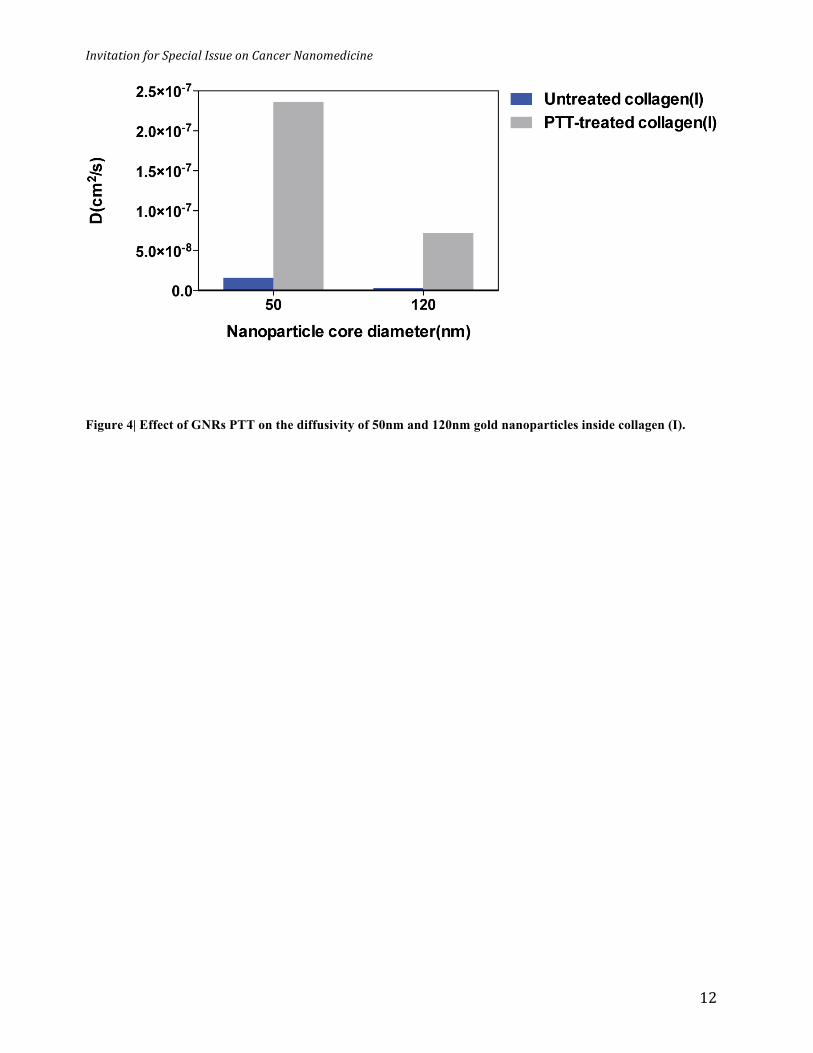
Figure 4 demonstrates the change in diffusivity of 50 nm and 120 nm inside the collagen (I)
matrix during the PTT. In the absence of PTT, 50nm nanoparticles showed an effective diffusivity
value of 1.62x10⁻⁸ cm2/s through the collagen (I) matrix channel compared to 3.39x10⁻⁹ cm2/s for
the 120nm sized gold nanoparticles. Interestingly, PTT process increased the effective diffusivity
of the 50 nm gold nanoparticle by ~ 14 fold (2.36x10⁻⁷cm2/s) versus ~ 21 (7.22 x10⁻⁸ cm2/s) fold
for 120 nm nanoparticles. From this data, the diffusivity of the 120 nm nanoparticle is 4.5 times
slower than the 50 nm through the collagen (I) matrix. Considering inverse proportionality of D
vs. hydrodynamic radius in the Stokes-Einstein equation, a 2.4 times decrease in diffusivity based
on core nanoparticle diameters is calculated. This discrepancy may be explained by a combination
of different hydrodynamic radius after PEGylation/Dye conjugation and surface charge density
between the 50nm and 120nm nanoparticles. Interestingly, we found PTT process showed ~1.5
fold higher effect on diffusivity enhancement for 120nm versus 50nm. If one rules out average
measurement errors and that PTT from GNRs homogeneously denatures collagen matrix, one
would expect the same ratio of enhancement in diffusivity for both nanoparticle sizes. However,
from Stokes-Einstein equation, D is inversely proportional to the term µR, where µ is medium
viscosity and R is hydrodynamic radius. This suggests that the PTT effect from GNRs may
inhomogeneously denature collagen fibers inside its network. This is supported by our earlier data
that random coiled microstructures were detected at the bottom of the channel, suggesting that
inhomogeneous viscosity appears inside the denatured collagen (I) matrix. So, what does this
mean in terms of nanotherapeutic delivery to tumor cells? Larger nanoparticles such as the 120
nm can carry more therapeutic agents to cancer cells than smaller nanoparticles but previous
studies showed that these larger nanoparticles typically reside near the tumor vasculature. There
InvitationforSpecialIssueonCancerNanomedicine
8
could be a trade-off between the diffusivity of smaller nanoparticles through the tumor
extracellular matrix versus the larger nanoparticles. Here, we showed the transport limitations of a
larger nanoparticle can be negated by thermally denaturing the collagen (I) matrix first, which can
potentially remove the barrier for transport of larger nanoparticles to tumor cells.
In conclusion, we used an in vitro model to show that a 2-step process can enhance the
penetration of nanoparticles transport within a collagen matrix. The first step requires the
denaturation of collagen structure by using gold nanorods heating, which effectively opens up the
collagen (I) matrix for larger nanoparticles to transport through. We clearly showed a deeper
penetration depth of 50 and 120 nm spherical gold nanoparticles within the collagen (I) matrix
after gold nanorod priming. Further experiments will require the confirmation of improved
transport of larger nanoparticles through the tumor matrix in animal models. The tumor
extracellular matrix may prevent the transport of nanoparticles to the targeted tumor cells and the
use of gold nanorods heating may prime the tumor for the “actual” nanoparticle therapeutic or
diagnostic formulation to be successfully delivered to the tumor cells. The incorporation of heat-
generating components that denatures the tumor extracellular matrix may allow entire
nanosystems to be transported through the tumor extracellular matrix and achieve specific tumor
cell targeting.
Acknowledgements. WCWC would also like to acknowledge the Canadian Institute of Health
Research, Natural Sciences and Engineering Research Council, Prostate Cancer Canada for
supporting his research program
InvitationforSpecialIssueonCancerNanomedicine
9
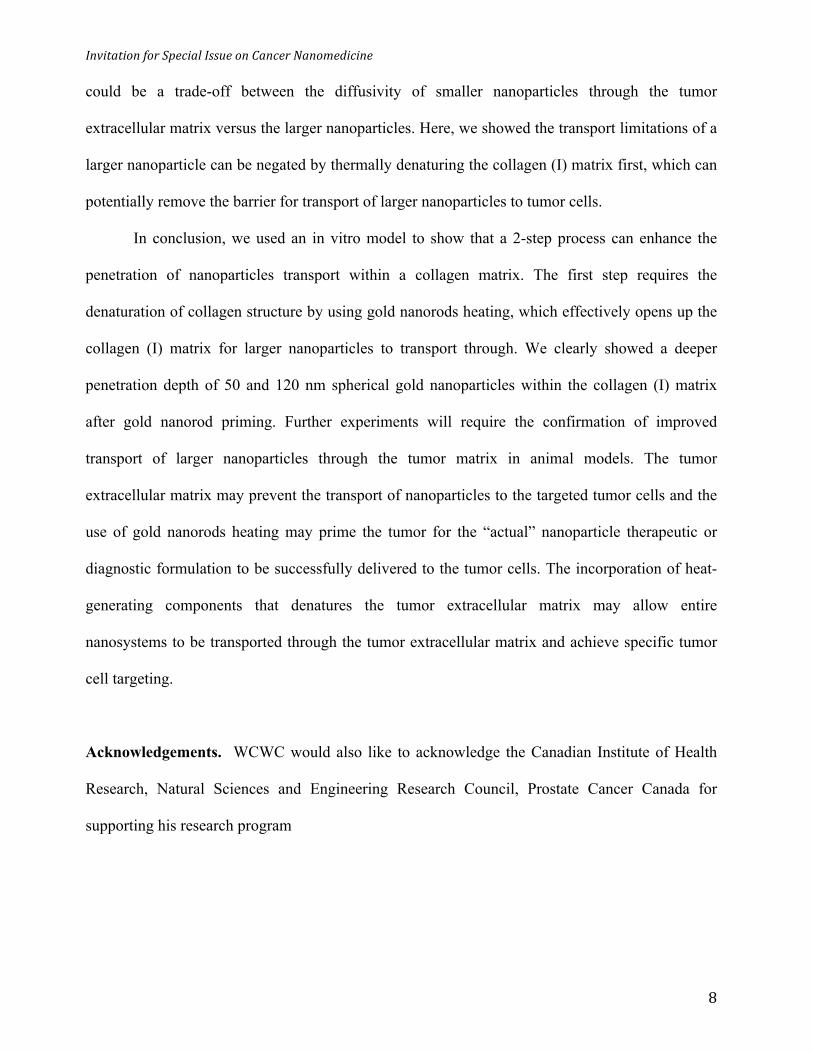
Figure 1| Design of the tumor collagen (I) matrix barrier model. A) Schematic of the µ-chip design. B) XY- plane projection of the µ-channel: The µ-channel dimensions are 17mm x 3.8mm x 0.4mm (L x W x H), which can accommodate 30µl collagen (I) hydrogel. The thin glass slide at the bottom would enable imaging by confocal fluorescence microscopy along the µ-channel. C) Optical image of the µ-channels filled with intact collagen (I) proteins between the reservoirs appear turbid. D) Reflectance confocal image of the collagen (I) matrix at 7mg/ml concentration inside a µ-channel.
InvitationforSpecialIssueonCancerNanomedicine
10
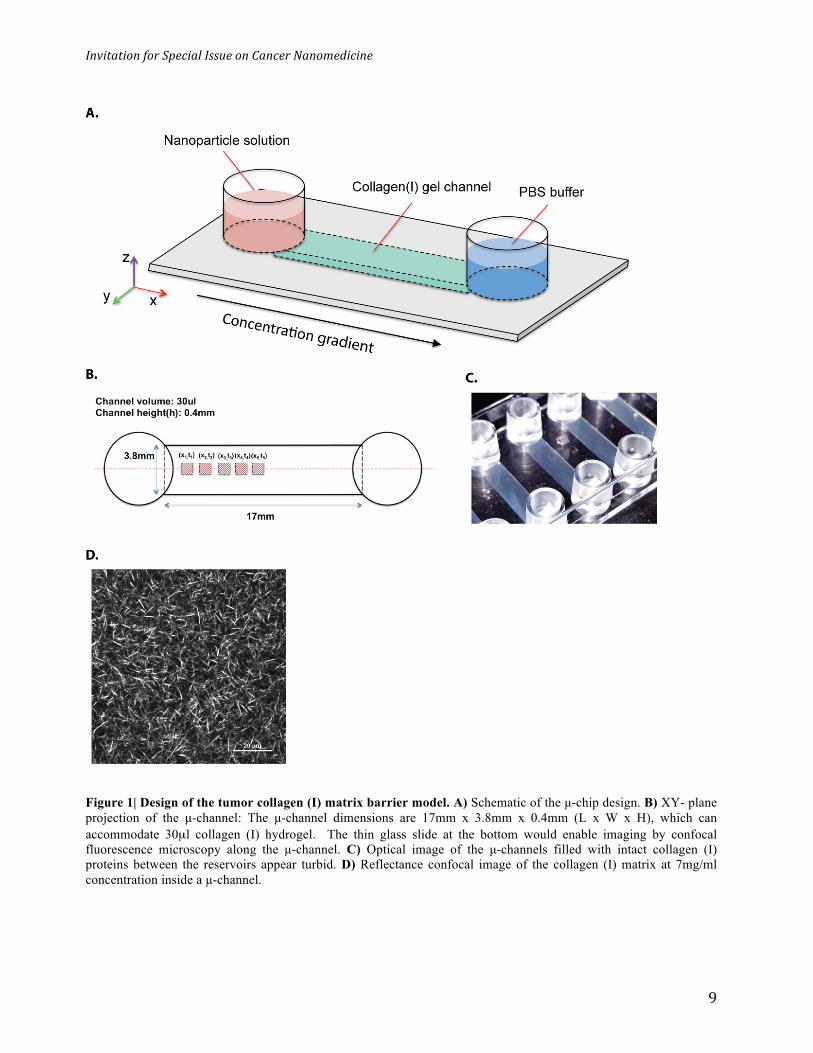
Figure 2| Effect of photo-thermal GNRs on collagen (I) matrix. A) Representative TEM image of gold nanorods with an aspect ratio of ~ 4. B) Absorption spectrum of gold nanorods, which showed longitudinal and transverse plasmon peaks at 750nm and 520nm, respectively. C) Photo-thermal characteristics of GNRs under fixed 3W/cm2 laser power density as a function of concentration. D) Thermographic image of the µ-chip during PTT process on GNRs injected into the channel. The GNR elevated the local channel temperature (red/yellow color) to an average of ~ 47°C after raster illumination of laser beam (3W/cm2) over ~ 8mm channel length for 6 min. E) Optical image of the collagen µ-channels after PTT process. The collagen hydrogel appeared clear. F) Reflectance confocal image of the channel after PTT. G) Normalized absorption of collagen (I) hydrogel at 405nm before and after PTT process. H) Transmittance confocal image of the PTT affected channel area.
InvitationforSpecialIssueonCancerNanomedicine
11
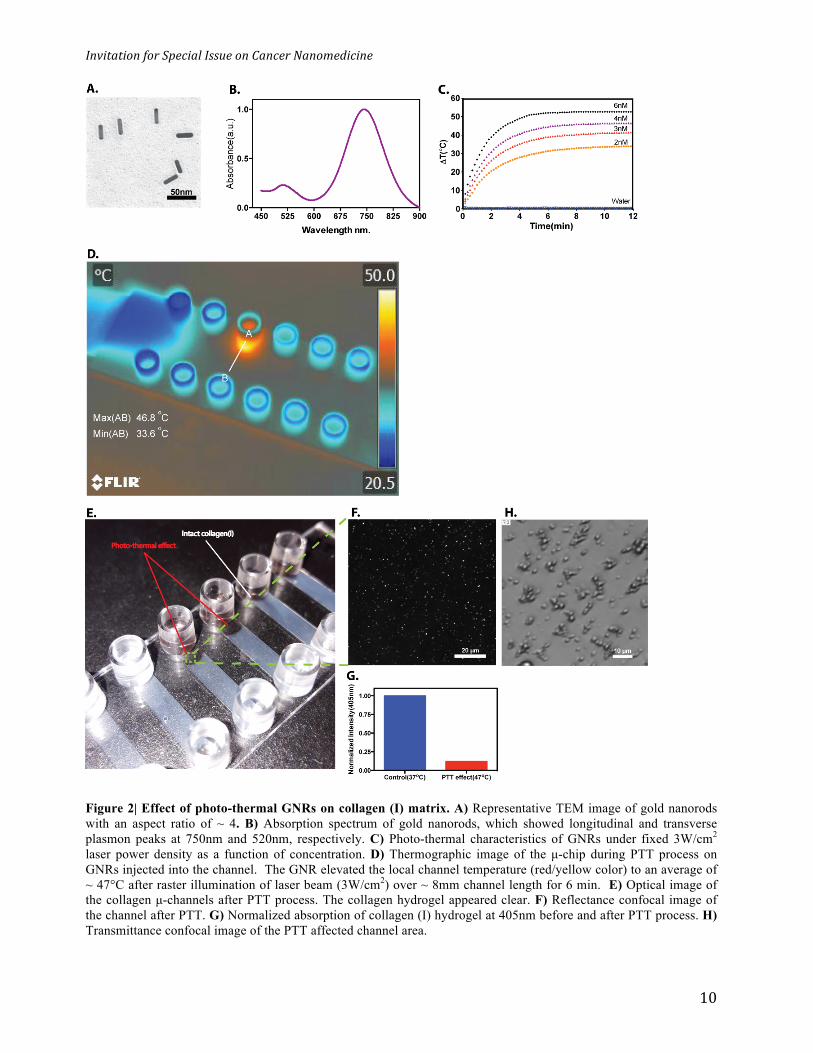
Figure 3| Effect of Photo-thermal GNRs on diffusion inside collagen (I). A) Schematic of the process to PEGylate and surface modify the gold nanoparticles with AlexFluor647nm. B) Absorption spectrum of fluorescent Alexafluor (647nm)-conjugated gold nanoparticles. C) Representative confocal images of two parallel channels with and without PTT process for 50nm and 120nm fluorescently tagged gold nanoparticles. The red/green colors are meant to distinguish between 50nm and 120nm nanoparticles and not indicative of actual emission channel. D) Mid-channel intensity profile for 50nm without PTT. E) Mid-channel intensity profile for 50nm with PTT. F) Penetration depth profile for 50nm at t=4 hrs with and without PTT. G) Mid-channel intensity profile for 120nm without PTT. H) Mid-channel intensity profile for 120nm with PTT. I) Penetration depth profile for 120nm at t=2.5hrs with and without PTT.
InvitationforSpecialIssueonCancerNanomedicine
12
Figure 4| Effect of GNRs PTT on the diffusivity of 50nm and 120nm gold nanoparticles inside collagen (I).
InvitationforSpecialIssueonCancerNanomedicine
13
References: 1 R. K. Jain and T. Stylianopoulos, Nat Rev Clin Oncol, 2010, 7, 653–664. 2 E. Ruoslahti, S. N. Bhatia and M. J. Sailor, The Journal of Cell Biology, 2010, 188, 759–768. 3 W. Jiang, B. Y. Kim, J. T. Rutka and W. C. Chan, Expert Opin. Drug Deliv., 2007, 4, 621–
633. 4 J. V. Jokerst, T. Lobovkina, R. N. Zare and S. S. Gambhir, Nanomedicine, 2011, 6, 715–728. 5 V. P. Zharov and D. O. Lapotko, IEEE J. Select. Topics Quantum Electron., 2005, 11, 733–
751. 6 L. Y. T. Chou and W. C. W. Chan, Advanced Healthcare Materials, 2012, 1, 714–721. 7 L. Zhang, F. Gu, J. Chan, A. Wang, R. Langer and O. Farokhzad, Clin Pharmacol Ther,
2007, 83, 761–769. 8 J. Hrkach, D. Von Hoff, M. M. Ali, E. Andrianova, J. Auer, T. Campbell, D. De Witt, M.
Figa, M. Figueiredo, A. Horhota, S. Low, K. McDonnell, E. Peeke, B. Retnarajan, A. Sabnis, E. Schnipper, J. J. Song, Y. H. Song, J. Summa, D. Tompsett, G. Troiano, T. Van Geen Hoven, J. Wright, P. LoRusso, P. W. Kantoff, N. H. Bander, C. Sweeney, O. C. Farokhzad, R. Langer and S. Zale, Science Translational Medicine, 2012, 4, 128ra39–128ra39.
9 C. J. Langer, M. A. Socinski and O. K. J, Proc. Am. Soc. Clin. Oncol., 2005, 23, No. 16S: LBA7011
10 D. Yoo, H. Jeong, C. Preihs, J.-S. Choi, T.-H. Shin, J. L. Sessler and J. Cheon, Angew. Chem. Int. Ed., 2012, 51, 12482–12485.
11 A. P. R. Johnston, M. M. J. Kamphuis, G. K. Such, A. M. Scott, E. C. Nice, J. K. Heath and F. Caruso, ACS Nano, 2012, 6, 6667–6674.
12 T. A. ElBayoumi and V. P. Torchilin, Clinical Cancer Research, 2009, 15, 1973–1980. 13 M. E. Davis, Z. G. Chen and D. M. Shin, Nat Rev Drug Discov, 2008, 7, 771–782. 14 C. J. Cheng, G. T. Tietjen, J. K. Saucier-Sawyer and W. M. Saltzman, Nat Rev Drug Discov,
2015, 14, 239–247. 15 S. D. Perrault, C. Walkey, T. Jennings, H. C. Fischer and W. C. W. Chan, Nano Lett., 2009,
9, 1909–1915. 16 Y.-L. Yang, S. Motte and L. J. Kaufman, Biomaterials, 2010, 31, 5678–5688. 17 P. A. Netti, D. A. Berk, M. A. Swartz, A. J. Grodzinsky and R. K. Jain, Cancer Research,
2000, 60, 2497–2503. 18 S. Ramanujan, A. Pluen, T. D. McKee, E. B. Brown, Y. Boucher and R. K. Jain, Biophysical
Journal, 2002, 83, 1650–1660. 19 O. Tredan, C. M. Galmarini, K. Patel and I. F. Tannock, JNCI Journal of the National
Cancer Institute, 2007, 99, 1441–1454. 20 A. Pluen, Y. Boucher, S. Ramanujan, T. D. McKee, T. Gohongi, E. di Tomaso, E. B. Brown,
Y. Izumi, R. B. Campbell, D. A. Berk and R. K. Jain, Proceedings of the National Academy of Sciences, 2001, 98, 4628–4633.
21 L. T. Baxter and R. K. Jain, Microvascular Research, 1989, 37, 77–104. 22 E. A. Sykes, J. Chen, G. Zheng and W. C. W. Chan, ACS Nano, 2014, 8, 5696–5706. 23 E. Huynh and G. Zheng, WIREs Nanomed Nanobiotechnol, 2013, 5, 250–265. 24 S. Kunjachan, R. Pola, F. Gremse, B. Theek, J. Ehling, D. Moeckel, B. Hermanns-Sachweh,
M. Pechar, K. Ulbrich, W. E. Hennink, G. Storm, W. Lederle, F. Kiessling and T. Lammers, Nano Lett., 2014, 14, 972–981.
25 D. B. Kirpotin, Cancer Research, 2006, 66, 6732–6740. 26 M. Magzoub, S. Jin and A. S. Verkman, The FASEB Journal, 2007, 22, 276–284.
InvitationforSpecialIssueonCancerNanomedicine
14
27 T. T. Goodman, P. L. Olive and S. H. Pun, IJN, 2007, 2, 265–274. 28 S. Murty, T. Gilliland, P. Qiao, T. Tabtieng, E. Higbee, A. A. Zaki, E. Puré and A. Tsourkas,
Part. Part. Syst. Charact., 2014, 31, 1307–1312. 29 S. J. Kuhn, S. K. Finch, D. E. Hallahan and T. D. Giorgio, Nano Lett., 2006, 6, 306–312. 30 C. Wong, T. Stylianopoulos, J. Cui, J. Martin, V. P. Chauhan, W. Jiang, Z. Popovic, R. K.
Jain, M. G. Bawendi and D. Fukumura, Proceedings of the National Academy of Sciences, 2011, 108, 2426–2431.
31 R. K. Jain, J. Clin. Oncol., 2013, 31, 2205–2218. 32 M. R. Villegas, A. Baeza and M. Vallet Regí, ACS Appl. Mater. Interfaces, 2015,
151013114646000. 33 F. Tewes, E. Munnier, B. Antoon, L. Ngaboni Okassa, S. Cohen-Jonathan, H. Marchais, L.
Douziech-Eyrolles, M. Soucé, P. Dubois and I. Chourpa, European Journal of Pharmaceutics and Biopharmaceutics, 2007, 66, 488–492.
34 A. P. Esser-Kahn, S. A. Odom, N. R. Sottos, S. R. White and J. S. Moore, Macromolecules, 2011, 44, 5539–5553.
35 R. K. J. S R Chary, Proceedings of the National Academy of Sciences of the United States of America, 1989, 86, 5385–5.
36 Z. Qin and J. C. Bischof, Chem. Soc. Rev., 2012, 41, 1191. 37 C. Ungureanu, R. Kroes, W. Petersen, T. A. M. Groothuis, F. Ungureanu, H. Janssen, F. W.
B. van Leeuwen, R. P. H. Kooyman, S. Manohar and T. G. van Leeuwen, Nano Lett., 2011, 11, 1887–1894.
38 T. B. Huff, M. N. Hansen, Y. Zhao, J.-X. Cheng and A. Wei, Langmuir, 2007, 23, 1596–1599.
39 W.-S. Kuo, C.-N. Chang, Y.-T. Chang, M.-H. Yang, Y.-H. Chien, S.-J. Chen and C.-S. Yeh, Angew. Chem. Int. Ed., 2010, 49, 1–6.
40 T. B. Huff, L. Tong, Y. Zhao, M. N. Hansen, J.-X. Cheng and A. Wei, Nanomedicine, 2007, 2, 125–132.
41 T. S. Hauck, T. L. Jennings, T. Yatsenko, J. C. Kumaradas and W. C. W. Chan, Adv. Mater., 2008, 20, 3832–3838.
42 K. C. Hribar, M. H. Lee, D. Lee and J. A. Burdick, ACS Nano, 2011, 5, 2948–2956. 43 D. Wang, Z. Xu, H. Yu, X. Chen, B. Feng, Z. Cui, Bin Lin, Q. Yin, Z. Zhang, C. Chen, J.
Wang, W. Zhang and Y. Li, Biomaterials, 2014, 35, 8374–8384. 44 S. Ramanujan, A. Pluen, T. D. McKee, E. B. Brown, Y. Boucher and R. K. Jain, Biophysical
Journal, 2002, 83, 1650–1660. 45 N. R. Jana, Small, 2005, 1, 875–882. 46 C. A. Miles and A. J. Bailey, Proceedings of the Indian Academy of Sciences - Chemical
Sciences, 1999, 111, 71–80. 47 L. Bozec and M. Odlyha, Biophysical Journal, 2011, 101, 228–236. 48 A. O. Brightman, B. P. Rajwa, J. E. Sturgis, M. E. McCallister, J. P. Robinson and S. L.
Voytik-Harbin, Biopolymers, 2000, 54, 222–234. 49 N. T. Wright and J. D. Humphrey, Annu. Rev. Biomed. Eng., 2002, 4, 109–128.
InvitationforSpecialIssueonCancerNanomedicine
15
Supplementary information: Materials and Methods Materials. Chemical reagents related to nanorods and nanoparticles synthesis were purchased from Sigma-Aldrich. Methoxy-terminated poly (ethylene glycol)(mPEG-thiol, 5kDa) and Amine-terminated PEG (NH2-PEG-thiol, 10kDa) were purchased from Laysan Bio and Rappe polymere, respectively. Bovine collagen (I) solution of different concentrations 10, 6 and 3mg/ml was purchased from Advanced Biomatrix. RPMI 1640 culture media was purchased from Gibco. µ-slideVI0.4 (Cat#80606) chambers were purchased from ibidi. Other biological reagents were purchased from Sigma-Aldrich and Invitrogen. Preparation of collagen (I) hydrogels inside µ-channels. µ-slide channels were pre-cooled on ice. To make ~ 7mg/ml collagen hydrogel, 300ul of bovine collagen (I) solution (10mg/ml) was mixed respectively with 50ul phosphate buffer solution (PBS, 10x), 10ul sodium hydroxide (0.1M) and 120ul RPMI (1640) media (containing 10% fetal bovine serum and 1% penicillin streptomycin) and kept cool in ice. Next, 30ul(µ-channel volume) of the above mixture was pipetted into the opening of each µ-channel through one reservoir. The µ-slide was then placed in an incubator, held at 37°C and 5% CO2, for 4hrs to ensure assembly of intact collagen (I) matrix. Finally, 40ul of PBS (1x) was added to each pair of reservoirs to maintain humidity and avoid drying of hydrogels before use. For the preparation of the other 2 and 4mg/ml collagen hydrogels, initial bovine collagen (I) solutions of 3 and 6mg/ml were used with proportional ratios of PBS (10x), NaOH (0.1M) and RPMI media. Growth of gold nanorods and their surface-modification with PEG. Gold nanorods with an aspect ratio of 4.1 were synthesized via modified seed-mediated technique. First, a seed solution was prepared by rapid injection of sodium borohydride (1.2ml, 0.01M) into a mixture of HAuCl4 (0.5ml, 0.01) and cetyltrimethyl ammonium bromide (19.5ml, 0.1M) under vigorous stirring. The resulting solution was heated to 60°C for 20min on a stir plate followed by cooling to room temperature. Next, a growth solution was prepared containing HAuCl4 (49.5ml, 0.01M), cetyltrimethyl ammonium bromide (CTAB, 950ml, 0.1M). To this solution, AgNO3 (5ml, 0.01M) and ascorbic acid (7ml, 0.1M) were added subsequently. The yellow color solution became clear. Finally, 20ml of the seed solution was added to the growth solution under moderate stirring and left overnight. The resulting nanorods were centrifuged at 15000 x g for 30 min twice, washed with deionized water (DI, NanopureTM H2O) and re-dispersed in DI water. To modify the surface of the gold nanorods with PEG, purified nanorod solution (1nM) was added dropwise in 1:1 volume ratio to mPEG-thiol (1mg/ml, 5k) and allowed to moderately stir at room temperature for 3 hrs. The nanorods were then centrifuged three times at 8000 x g for 20min to remove excess PEG and CTAB. Synthesis of spherical 50nm and 120nm gold nanoparticles and their surface PEGylation. 50nm and 120nm gold nanoparticles were synthesized via hydroquinone-seeded growth. First, 15nm gold nanoparticles were prepared by reducing gold (III) chloride hydrate (25mM) with sodium citrate tribasic (1mM) under reflux while being vigorously stirred at a volume ratio of 0.125. The as-prepared seed was stored in 0.01% (v/v) Tween 20 solution. Next, 50nm and 120nm gold nanoparticles were prepared by further growth of 15nm gold seeds (100x diluted) in the
InvitationforSpecialIssueonCancerNanomedicine
16
presence of gold (III) chloride hydrate (25mM), sodium citrate tribasic (15mM) and hydroquinone (25mM) in a 1:1:1 volume ratio, while the amount of gold colloids was varied to control the particle size. The nanoparticles were then centrifuged twice and re-dispersed in 0.05% (v/v) Tween 20 solution before PEGylation. PEG surface modification in both particle sizes was achieved by incubating nanoparticles with NH2-PEG-thiol (10kDa) and mPEG-thiol (5kDa) at a molar ratio of 1:4 (1 Amine-PEG/nm2 and 4 mPEG/nm2) at 60°C for 1 hr. 50nm and 120nm nanoparticles were then centrifuged three times at 1500 x g and 500 x g for 45min and stored at 4°C before labeling with the fluorescent molecule. Fluorescent labeling of 50nm and 120nm nanoparticles. AlexaFluor647nm dye was aliquoted as received and stored in a dark box at -20°C. An AlexaFluor647nm aliquot was thawed and dissolved in 50ul sodium bicarbonate (0.1M). Next, 450ul of PEGylated nanoparticles in sodium bicarbonate (0.1M) was incubated with AlexFluor647nm solution at 5x equivalent amount of theoretical Amine-PEG molecules of corresponding nanoparticle surface. Incubation was carried out for 3hrs. 50nm and 120nm nanoparticles were then centrifuged and washed three times at 1500 x g and 500 x g for 45min and stored at 4°C in the dark. Photo-thermal experiments. A power tunable fiber-coupled continuous wave (CW) laser diode (785nm) was used for exciting gold nanorods. The temperature was monitored using FLIR E60 thermal imager (320x240 pixels) and thermal accuracy of ± 2°C. Photo-thermal temperature profiles of gold nanorods were developed in 96-well plates. 150ul gold nanorods solution were pipetted into a well and the well plate was placed on a pre-heating stage set to 37°C. The sealed well-plate (to avoid evaporation) was stabilized to a final temperature of 33-34°C. Next, a laser beam of 5mm was shun on the well containing gold nanorods and the average instant temperature profile of the well was recorded as a function of time with respect to the control well (which contained distilled water). The same process was applied to all concentrations and laser powers. Emissivity corrections were done using FLIR protocol with respect to black tape body (0.95). To apply photo-thermal process on collagen (I) µ-channels, 30ul of PEGylated gold nanorods were pipetted into one reservoir of an already prepared collagen (I) channel while the other reservoir was filled with 30ul of blank PBS (1x). The µ-channel was placed on heating stage and stabilized to a temperature of 33-34°C before photo-thermal process. After 1hr, a laser power density of 3W/cm2 raster radiated an area covering ~ 8 mm of the channel in the vicinity of the reservoir. The fiber radiation scanned this area in a back and forth movement for 6min. The temperature of the entire channel was mapped using thermal imager at 10s intervals. Reflectance confocal imaging. Collagen (I) hydrogels were prepared in approximately 2, 4 and 7mgl concentrations. The hydrogels were then imaged using a Nikon confocal microscope in reflex mode by scanning a 512x512 pixels ROI at 10x and 20x magnifications under 486.7nm laser. The focal plane was set to top layer of collagen matrix to avoid signal artifacts. Fluorescent tracking of nanoparticles using confocal microscopy. Collagen (I) hydrogels were prepared in two µ-channels (PTT and control) as previously described. 30ul of PEGylated GNRs were added to one of the reservoirs for both µ-channel while the other reservoirs were filled with the same volume of PBS (1x). After PTT process on one of the µ-channels, both µ-channels were placed on microscope stage for head-to-head imaging on the same spots along both channels. Next, 30ul of fluorescent nanoparticles were added on top of the already added GNRs reservoirs in
InvitationforSpecialIssueonCancerNanomedicine
17
both µ-channels. Another 30ul of PBS (1x) was added to other reservoirs to counterbalance hydrostatic pressure. Immediately, confocal fluorescent imaging was performed by sequential scanning a 512x512 pixel ROI along the channel at 1mm intervals and 10x magnification under 639.4nm laser for 12hrs. Imaging condition was optimized for laser power and PMT detector to offset background signal and de-saturate nanoparticle signal. Z-focus was kept constant along channel length. The direction of the imaging was from the vicinity of high concentration reservoir towards the other reservoir. Image analysis and diffusion measurements. Nanoparticles diffusion inside collagen (I) were analyzed from sequential fluorescent images using ImagJ and Matlab. To develop spatio-temporal intensity profiles, mean fluorescence of a fixed ROI (25x25 pixel) was measured along mid-channel axis at different penetration distances for 12hrs and subtracted from background. For intensity-penetration distance profiles, three ROIs were measured for each penetration depth and normalized to reference point intensity (proximity of reservoir) at a fixed time-point for each nanoparticle size. Diffusivity values were calculated by fitting intensity-penetration depth in the mid-channel profiles at fixed time-points to standard 1-D analyte diffusion equation (1).
InvitationforSpecialIssueonCancerNanomedicine
18
Figures