improving power system reliability and resiliency …...improving power system reliability and...
TRANSCRIPT
Improving Power System Reliability and Resiliency through Enhanced Modeling
and Advanced Software Tools
Marianna Vaiman, V&R EnergyIEEE PES Policy Technical Support Task Force
FERC Technical Conference Washington, D.C. • June 26 – 28, 2017
1

Contents1. Improving Reliability through Enhanced
Power System Modeling2. Improving Resiliency of the Grid through
Advanced Software Tools3. Related IEEE Activities4. Future Work5. Conclusions
2

1. Improving Reliability through Enhanced Power System Modeling
3

Improving Reliability through Enhanced Power System Modeling• Enhanced State Estimation (SE)
– Importance of minimizing/removing the pseudoloads
– Creating a back-up State Estimator platform using synchrophasors
– Dynamic state estimation
• Bridging real-time and planning power system models by using a node-breaker model
4

Power System State Estimator• Main tool to assess reliability and stability of a power
system in real-time environment at a utility/ISO:– Basis for all advanced applications and market applications
• Designed to produce a system state based on the “best estimate” of the system voltages and phase angles:– Provided that there are errors in the measured quantities; and – That there is a redundancy in measurements
• Minimizes the sum of the squares of the differences between the measured and estimated values of variables:– Voltage magnitude– Real and reactive power flows on the branches
5

BFGS Method• Real and imaginary parts of voltages at all buses in a
power system network are considered as variables of the objective function
• An optimization algorithm – an effective quasi-Newton BFGS (Broyden, Fletcher, Goldfarb, Shanno) Method – Unlike the commonly used Newton method, BFGS method
does not require a time-consuming calculation of the Hessian matrix of second derivatives of the function to be minimized
– Instead, the Hessian matrix is approximated using an expression that is based on the difference of gradients at the end and at the beginning of each minimization step
6
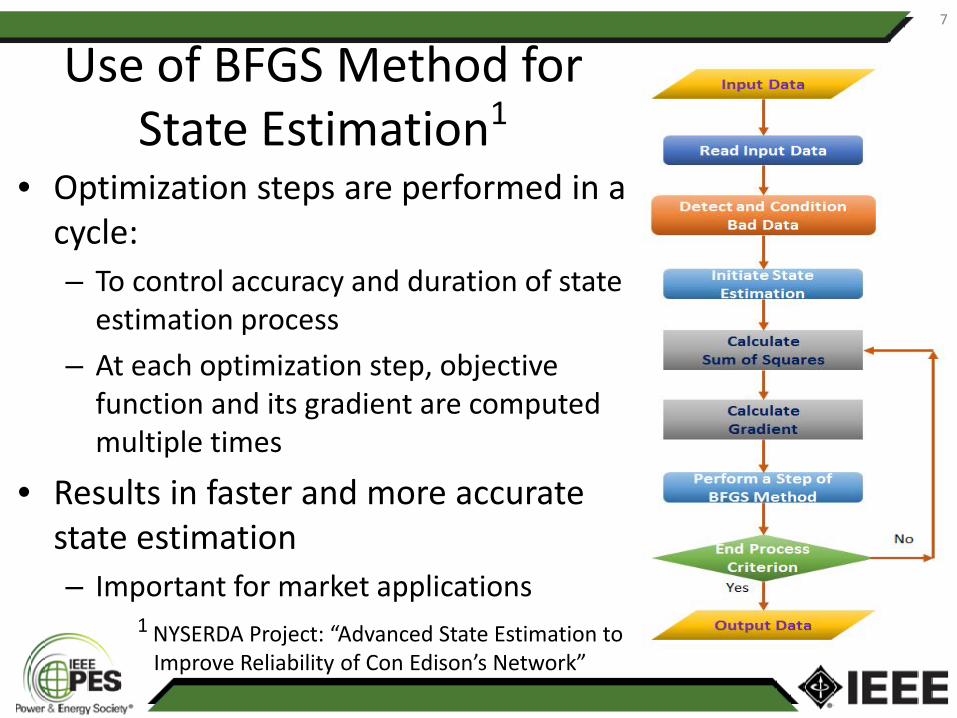
Use of BFGS Method for State Estimation1
• Optimization steps are performed in a cycle:– To control accuracy and duration of state
estimation process – At each optimization step, objective
function and its gradient are computed multiple times
• Results in faster and more accurate state estimation– Important for market applications
7
1 NYSERDA Project: “Advanced State Estimation toImprove Reliability of Con Edison’s Network”

Advantages of Using BFGS Method• Distribution of the difference
between measured and estimated values of voltage magnitude– Small, ranges from –0.0095 p.u. to
0.0087 p.u., which is less than 1%.
8
• Major advantage is creating an SE case with negligibly small pseudo-loads
Bus From Number
Bus To Number
Real Power Flow, p.u.
Reactive Power Flow, p.u.
12xxx9 12xxx9 0.297342 0.202057
12xxx9 12xxx5 -0.29935 -0.18745
Pseudo-Load, p.u. -0.002 0.014605
• When converted to MW and MVAr, pseudo-loads = 0.2 MW and 1.46 MVAr
• Such small pseudo-loads may be neglected when an SE case is created

Linear State Estimator• Linear State Estimator (LSE) is based on PMU
measurements of voltage and current:– Voltage and current vectors are considered as the state
variable
• Advantages of LSE:– Improves quality of PMU data– Speed of state estimation due to using a direct non-iterative
solution– A comparison check for the conventional state estimator– A backup to the conventional SE solution if it fails (for
example, experiences convergence issues)
9

• Bad data detection, including:– Bad PMU data;– Bad SCADA data;– Bad system parameters;– Errors in the process of conventional state estimation.
• Topology estimation, if breaker status is not available• Separating bad data with an onset of an event
Functionalities of LSE10
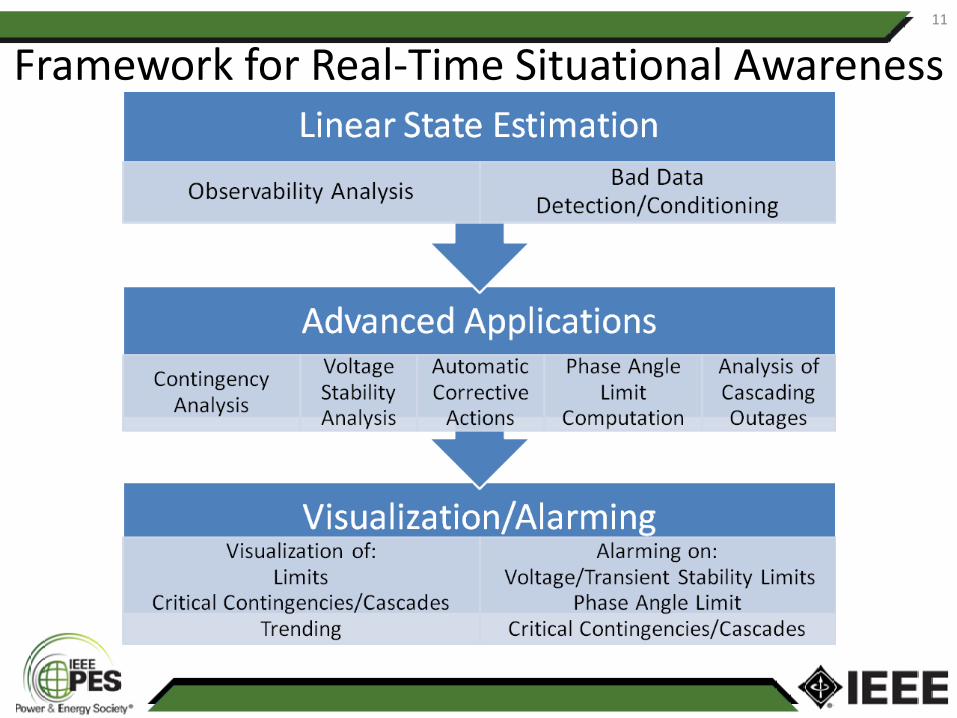
Framework for Real-Time Situational Awareness11

Components of LSE Framework2
• Multi-step process:1. Several pre-screening
techniques 2. Data range checks3. Combination of
filtering and smoothing techniques based on Kalman filter
4. Linear state estimation
5. End-to-end machine learning
2 DOE Peak Reliability Synchrophasor Project (PRSP) with CAISO, IPC, Peak,SCE, SDGE, and V&R Energy
12
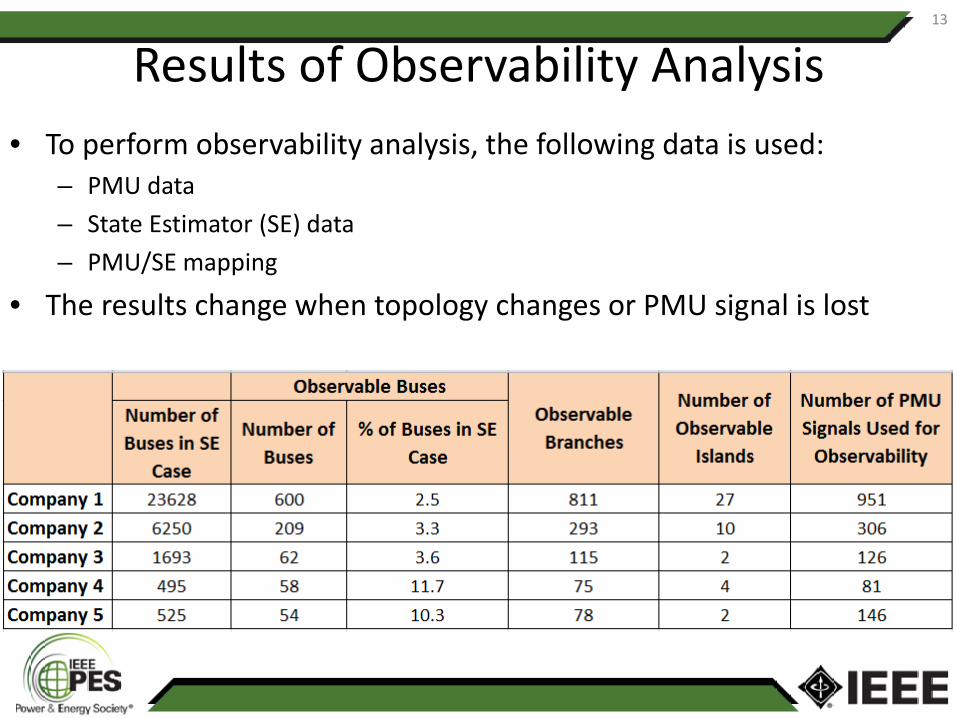
Results of Observability Analysis• To perform observability analysis, the following data is used:
– PMU data– State Estimator (SE) data– PMU/SE mapping
• The results change when topology changes or PMU signal is lost
13

Measurement – Based VSA14
Source - V&R Energy. 2017 ISGT Panel Session: “Industry Best Practices in Using Synchrophasor Technology”
• Based on cases created by Linear State Estimator

Comprehensive Voltage Management• Hybrid solution would work
best – each method offers benefits• Model-free methods
– Good for dynamic voltage instability detection and trend monitoring
– Able to distinguish FIDVR from voltage instability even if voltage is very low
• VSA methods: accurate margins if accurate models and good scenarios
• Hybrid - Nothing “falls between the cracks”: – If VSA model not accurate, model-free will detect instability; converse also
true– Could automatically trigger “out of sequence” SE/VSA on instability
15
Source – Quanta Technology. 2017 WECC JSIS Meeting
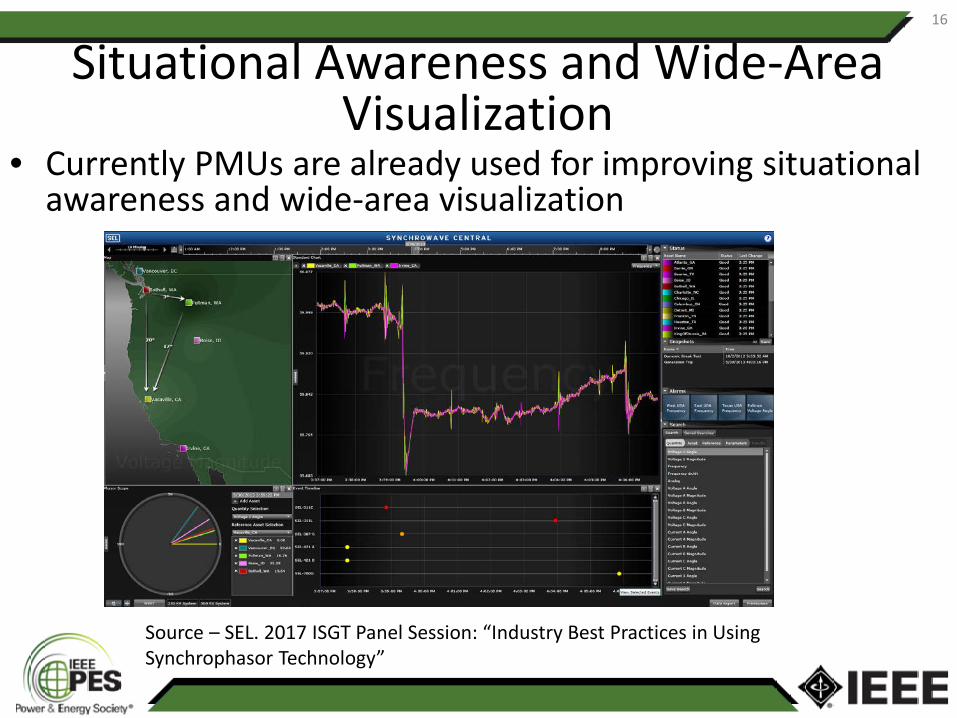
Situational Awareness and Wide-Area Visualization
• Currently PMUs are already used for improving situational awareness and wide-area visualization
16
Source – SEL. 2017 ISGT Panel Session: “Industry Best Practices in Using Synchrophasor Technology”
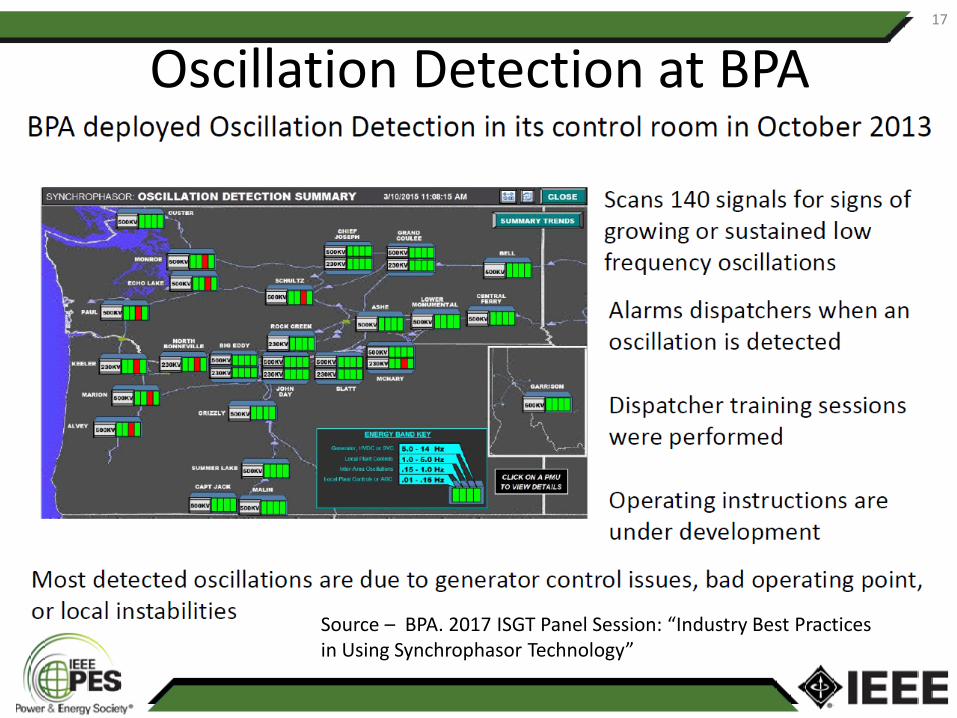
Oscillation Detection at BPA17
Source – BPA. 2017 ISGT Panel Session: “Industry Best Practices in Using Synchrophasor Technology”
Dynamic State Estimation (DSE)• The objective of Dynamic State Estimator (DSE) is to
predict dynamic behavior of a power system for: – (1) preserving transient stability of the system, and – (2) guaranteeing quality of transient processes
• Inputs for DSE are:– Electrical parameters (voltage, current, etc.) directly measured
by PMUs in vector form– Scalar parameters (rotor angle, frequency, frequency
derivative, mechanical power, excitation voltage and current, etc.), which may be measured by PMUs or estimated, if PMU data is not available
• For some types of generators, PMUs may directly measure rotor angles
18
Capabilities of DSE• Predictive capability• Estimation of dynamic parameters using Kalman filters:
– Rotor angle, rotor slip– System inertia– Damping
• Identify in real-time dynamic disturbances in the system, faults, switching, etc.
• Real-time control capabilities;• Analysis and prediction of both electromechanical and those
electromagnetic processes which are relatively slow:– Important for control purposes, maintaining transient stability, and
guaranteeing quality of transient processes• Identifying non-synchronous behavior of generators• Use for development of protection schemes
19
Use of a Node-Breaker Model• Bridges real-time and off-line analyses • Includes three different frameworks for using node-
breaker model:– Using node-breaker State Estimator case for both real-time
and off-line analyses:• Case can be saved as a node-breaker or bus-branch model
– Creating a “hybrid” model based on the planning case such that a part of the model is node-breaker and a part is in bus-branch model
– Inserting real-time data into planning model:• Inserting State Estimator case into a planning case• Inserting historical real-time measurements into a planning case
20

Use of Node-Breaker Model for Voltage Stability Analysis
• Voltage stability analysis (VSA):– Runs multiple user-defined scenarios– Computations performed for each scenario are:
• Determining interface limits• Performing PV-curve analysis• Performing VQ-curve analysis
• Automatic AC contingency analysis• Reading of existing real-time RAS• Topology processing• Satisfies Cyber Security requirements
21
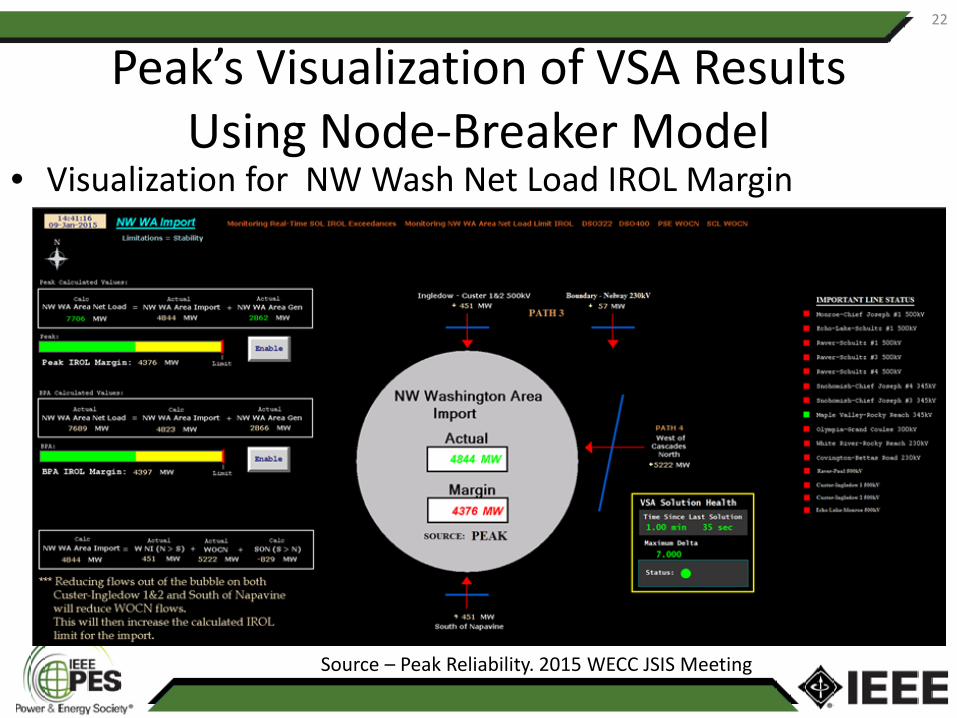
Peak’s Visualization of VSA Results Using Node-Breaker Model
22
Source – Peak Reliability. 2015 WECC JSIS Meeting
• Visualization for NW Wash Net Load IROL Margin

Use of Node-Breaker Model for OnlineCascading Analysis at ISONE3
On-line PCM Off-line PCM
• Adjusted SE • Extended CTG*
• Results• Reports
PCM Settings• Scenarios• CTG labels• Monitoring• PCM criteria
Web based viewer
IIS • Results• Reports
On-line: automatic run every 6-7 min
Off-Line
Archive• Adjusted SE• Extended CTG
• EMS power flow cases • Contingencies
EMS • State Estimation (SE) • Contingencies (CTG)
ROSE Adaptor• EMS model adjustment• Creation of Stuck Breaker CTG
State Estimation: Every 3 minStudy mode: by request
User’s PC
* Extended CTG include selected N-2 used in Day-Ahead processes and all Stuck Breaker. Total ~6,000 x 3 = 18,000 CTGs
23
3 2016 FERC Technical Conference, “Use of Online Cascading Analysis for Reducing the Risk of Blackouts”, presentation by ISO NE

2. Improving Resiliency of the Grid through Advanced Software Tools
24
Improving Resiliency of the Grid• NERC CIP-014 standard
– Protect critical stations - if inoperable/damaged as a result of a physical attack could result in “widespread instability, uncontrolled separation, or cascading”
• Automated cascading analysis:– Steady-state stability perspective– Transient stability perspective
• On-line cascading analysis• Use of synchrophasors to predict cascades
25

2015 CFWG Survey: What are the main objectives for performing cascading outages analysis?
26
Source: NATF
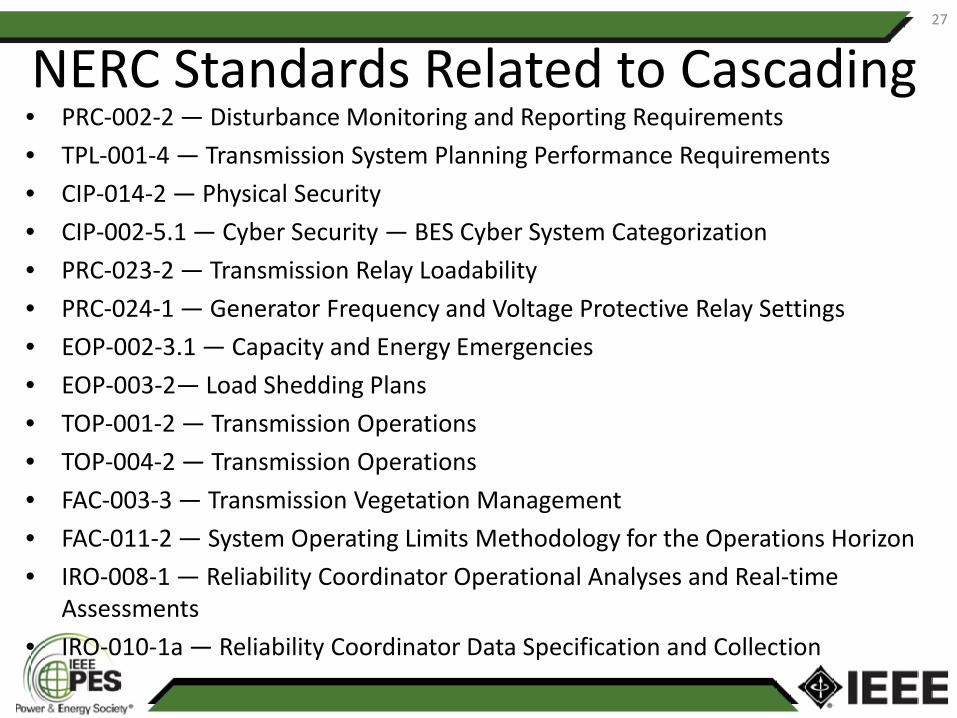
NERC Standards Related to Cascading• PRC-002-2 — Disturbance Monitoring and Reporting Requirements• TPL-001-4 — Transmission System Planning Performance Requirements• CIP-014-2 — Physical Security• CIP-002-5.1 — Cyber Security — BES Cyber System Categorization• PRC-023-2 — Transmission Relay Loadability• PRC-024-1 — Generator Frequency and Voltage Protective Relay Settings• EOP-002-3.1 — Capacity and Energy Emergencies• EOP-003-2— Load Shedding Plans• TOP-001-2 — Transmission Operations• TOP-004-2 — Transmission Operations• FAC-003-3 — Transmission Vegetation Management• FAC-011-2 — System Operating Limits Methodology for the Operations Horizon• IRO-008-1 — Reliability Coordinator Operational Analyses and Real-time
Assessments• IRO-010-1a — Reliability Coordinator Data Specification and Collection
27

2015 CFWG Survey: Is cascading outage analysis an automated process?
28
Source: NATF

What is a Cascading Outage?Various Definitions:• IEEE PES Cascading Failure Working
Group (CFWG) definition: Cascading Failure is a Sequence of Dependent Failures of Individual Components that successively Weakness the Power System
Propagation Mechanisms:• Equipment failures• Protection Failures• Control actions failure• Tree Contact• Operator error• Thermal overloads• Voltage violations• Voltage instability• Computer or software errors /failures• Stalled motors triggered by low
voltages or off-nominal frequency • Generator rotor dynamic instability• Insufficient reactive power resources• Etc.
29
Initiating Events:• Natural disasters• High winds • Contact between conductors and
vegetation, • Human error, • Etc.

Idaho Power Automated Analysis of Cascading Outages: Steady-State Analysis4
• Fast sequential contingency simulation is used to identify potential cascading modes.
• Outages are consecutively applied until:– System fails to solve due to voltage
instability;– Thermal/voltage violations are
alleviated or drop below the thresholds.
• Loss of load and generation is monitored and reported
• Probabilities of initiating events and consequences may be added
30
4 2017 IEEE PES General Meeting Tutorial: “Industry Best Practices, Needs, and Challenges in Cascading Analysis”
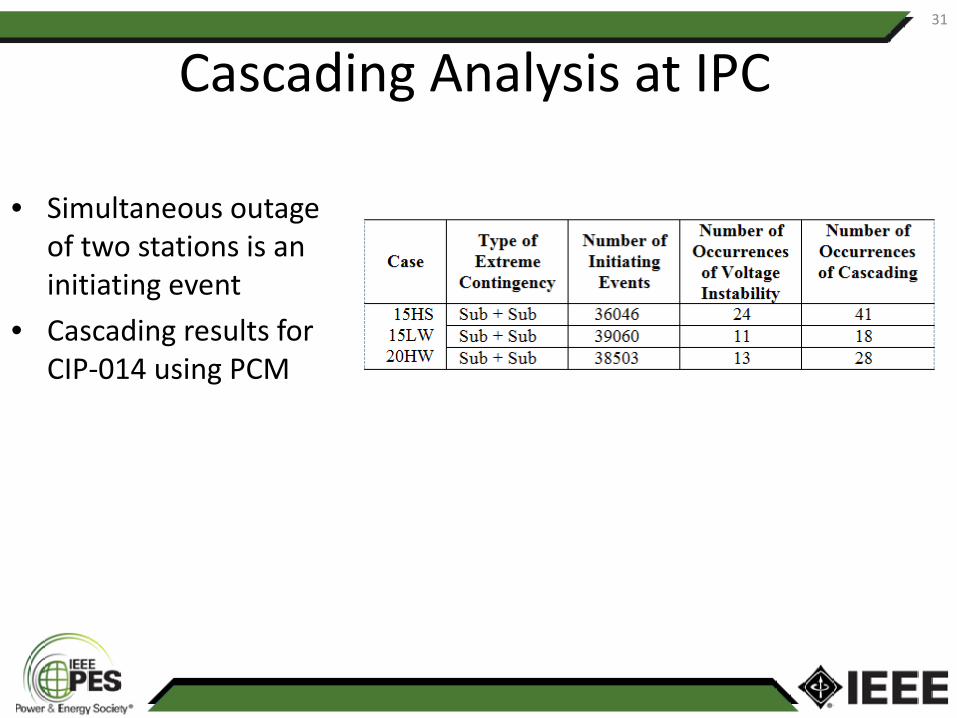
Cascading Analysis at IPC
• Simultaneous outage of two stations is an initiating event
• Cascading results for CIP-014 using PCM
31
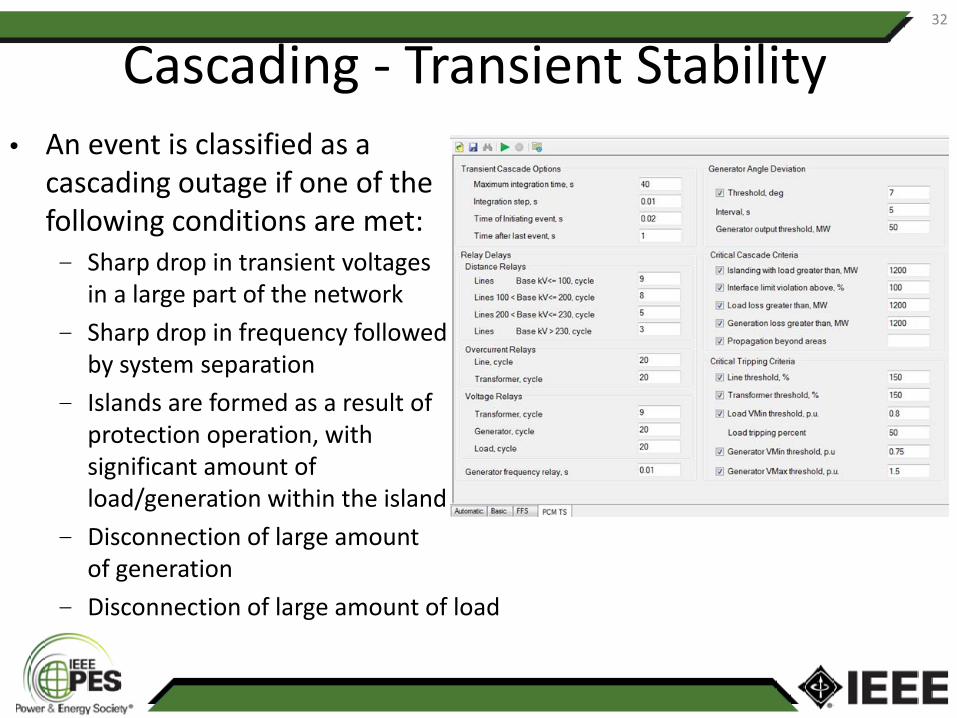
Cascading - Transient Stability• An event is classified as a
cascading outage if one of the following conditions are met:– Sharp drop in transient voltages
in a large part of the network– Sharp drop in frequency followed
by system separation– Islands are formed as a result of
protection operation, with significant amount of load/generation within the island
– Disconnection of large amount of generation
– Disconnection of large amount of load
32
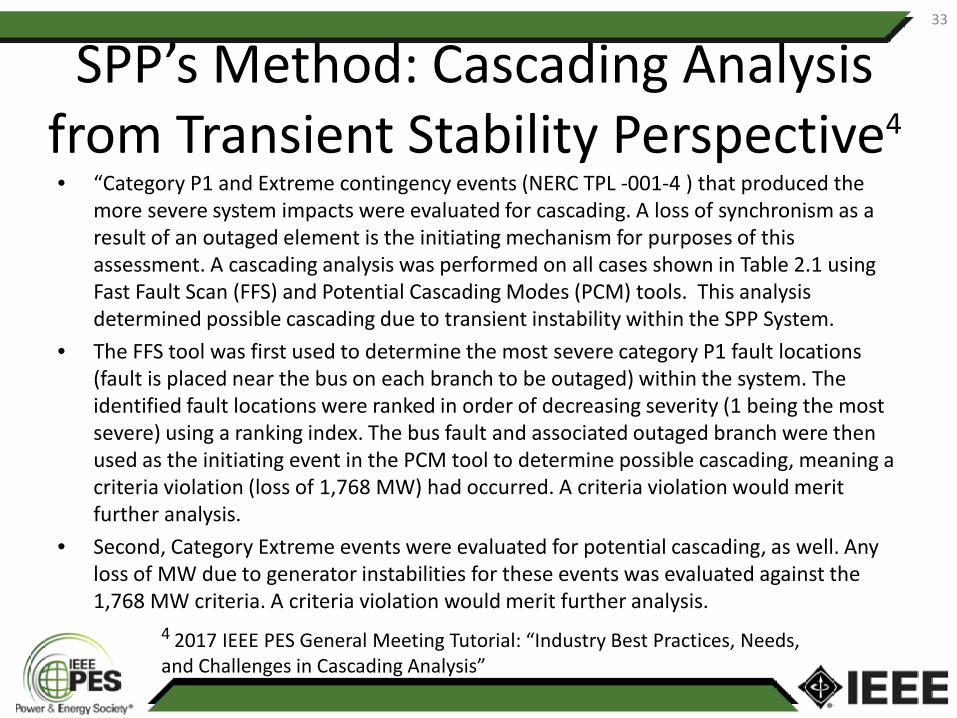
SPP’s Method: Cascading Analysis from Transient Stability Perspective4
• “Category P1 and Extreme contingency events (NERC TPL -001-4 ) that produced the more severe system impacts were evaluated for cascading. A loss of synchronism as a result of an outaged element is the initiating mechanism for purposes of this assessment. A cascading analysis was performed on all cases shown in Table 2.1 using Fast Fault Scan (FFS) and Potential Cascading Modes (PCM) tools. This analysis determined possible cascading due to transient instability within the SPP System.
• The FFS tool was first used to determine the most severe category P1 fault locations (fault is placed near the bus on each branch to be outaged) within the system. The identified fault locations were ranked in order of decreasing severity (1 being the most severe) using a ranking index. The bus fault and associated outaged branch were then used as the initiating event in the PCM tool to determine possible cascading, meaning a criteria violation (loss of 1,768 MW) had occurred. A criteria violation would merit further analysis.
• Second, Category Extreme events were evaluated for potential cascading, as well. Any loss of MW due to generator instabilities for these events was evaluated against the 1,768 MW criteria. A criteria violation would merit further analysis.
33
4 2017 IEEE PES General Meeting Tutorial: “Industry Best Practices, Needs, and Challenges in Cascading Analysis”

Analysis of Potential Cascading Modes (PCM) – Transient Stability
• Distance relays are modeled to simulate using zone 1 protection of 55% of the line impedance for each transmission line– Delays for lines are as follows: <100kV (9cy); 100–200kV (8cy); 200-
230kV(5cy);<230kV(3cy); – Delays for transformers is 4cy
• Over-current relays are modeled to simulate a 50% overcurrent with a 2000 MW maximum load loss.
• Under-Voltage relays are modeled to simulate using a voltage threshold of 0.1 p.u. for transient voltage responses.
• Under-Frequency relays are simulated using an angle threshold of 180 degrees for rotor angle changes
• Gen angle – initial gen angle > angle threshold
34
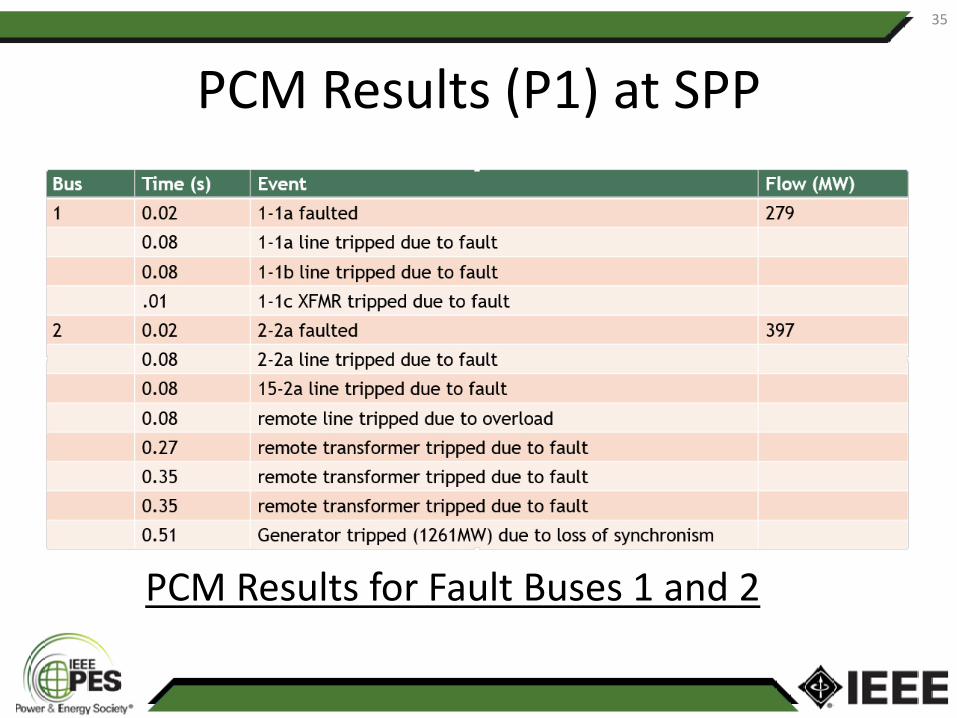
PCM Results (P1) at SPP35
PCM Results for Fault Buses 1 and 2

On-Line Cascading Analysis at ISONE336
• Can be used as a basis for IROL (Inter-Regional Operational Limit) violation analysis and compliance
• Can be a basis of consistent, quantifiable and auditable process of IROL violation analysis
• Is a practical instrument to satisfy generic NERC requirements of IROL compliance
• Current industry practice based on classification of IROL interfaces can be dramatically improved by using cascading analysis
• ISO-NE is targeting two goals by creating online Cascading Analysis
– Preventing the risk of uncontrolled outages and blackouts
– Dramatically improve IROL compliance3 2016 FERC Technical Conference, “Use of Online Cascading Analysis for Reducing the Risk of Blackouts”, presentation by ISO New England

ISONE Modeling of Cascading Process37
• Power flow case• Initiating contingencies
(N-2 and STK)
Tier 0Apply contingency i
Thermal overloadLines 0…N0
Low voltagesLoads 0…K0
Trip Lines 0…N0
Trip Loads 0…K0
Tier 1Solve power flow
Thermal overloadLines 1…N1
Low voltagesLoads 1…K1
Trip Lines 1…N1
Trip Loads 1…K1
Voltage collapse Islanding
Total MW of tripped load
and generation
Report
Continue Tiers till cascade stops
Take next contingencyi=i+1
Violation of “Stability” interface
•Full AC solution for all contingencies
38
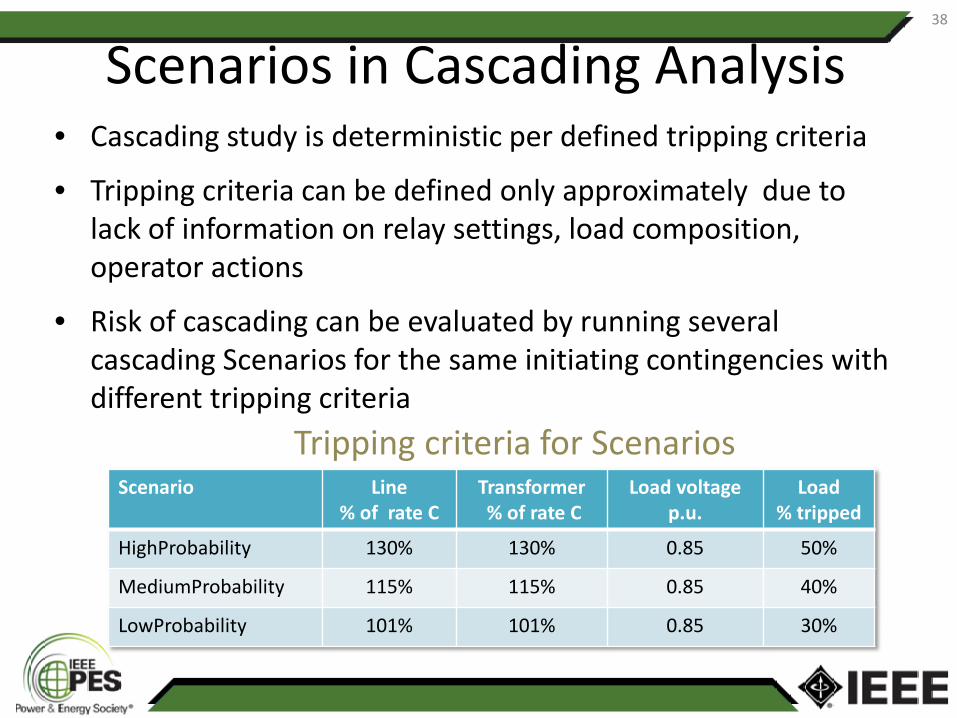
Scenarios in Cascading Analysis• Cascading study is deterministic per defined tripping criteria
• Tripping criteria can be defined only approximately due to lack of information on relay settings, load composition, operator actions
• Risk of cascading can be evaluated by running several cascading Scenarios for the same initiating contingencies with different tripping criteria
Scenario Line % of rate C
Transformer% of rate C
Load voltagep.u.
Load% tripped
HighProbability 130% 130% 0.85 50%
MediumProbability 115% 115% 0.85 40%
LowProbability 101% 101% 0.85 30%
Tripping criteria for Scenarios

39
ISONE On-line GUI to View Results
Summary Report Detail report
High level results Historical view
Filtering fool

PMUs for Predicting Cascading Outages• Functionalities to predict/prevent cascading outages:
– Situational awareness and wide-area visualization– Early detection of events
• Variations of reactive/active injections• Complements the information coming from breaker status signals
– Voltage stability analysis• Used to compute voltage stability margins• PMU-based alarms are issued when voltage stability margin is
small/decreasing– Phase Angle Monitoring
• Monitors high angle displacements to detect highly loaded lines• Importance of phase angle limit computation in real time
– Oscillatory analysis• Predicts unstable oscillations which may trigger line trippings
40

PMUs for Mitigation/Restoration from Cascading Outages
• PMU measurements allow for faster and more accurate relay operation and enabling RAS
• Wide area oscillation damping control• Advanced defense functions, like coordinated wide area
load shedding actions, controlled islanding, etc.
41

PMU Applications for Cascading Analysis
Phase angle and voltage monitoring
Using PMU measurements to compute system steady-state stability limits and predict proximity to voltage collapse
Source: M.Ya. Vaiman, M.M. Vaiman, S. Maslennikov, E. Litvinov, X. Luo, “Calculation andVisualization of a Power System Stability Margin Based on the PMU Measurements”, 2010IEEE SmartGridComm:31 - 36
42
42

• Voltage magnitude and phase angle are equal indicators of voltage collapse because– Voltage collapses and angle
experiences uncontrollable change at the same level of stressing
• In many cases, it’s more effective to monitor P𝜹𝜹-curve than PV-curve– Voltage remains almost constant over a wide range of
stressing, while angle significantly changes
Phase Angle for Steady-State Voltage Stability Analysis5
43
5 Source: V&R Energy, Patent Pending
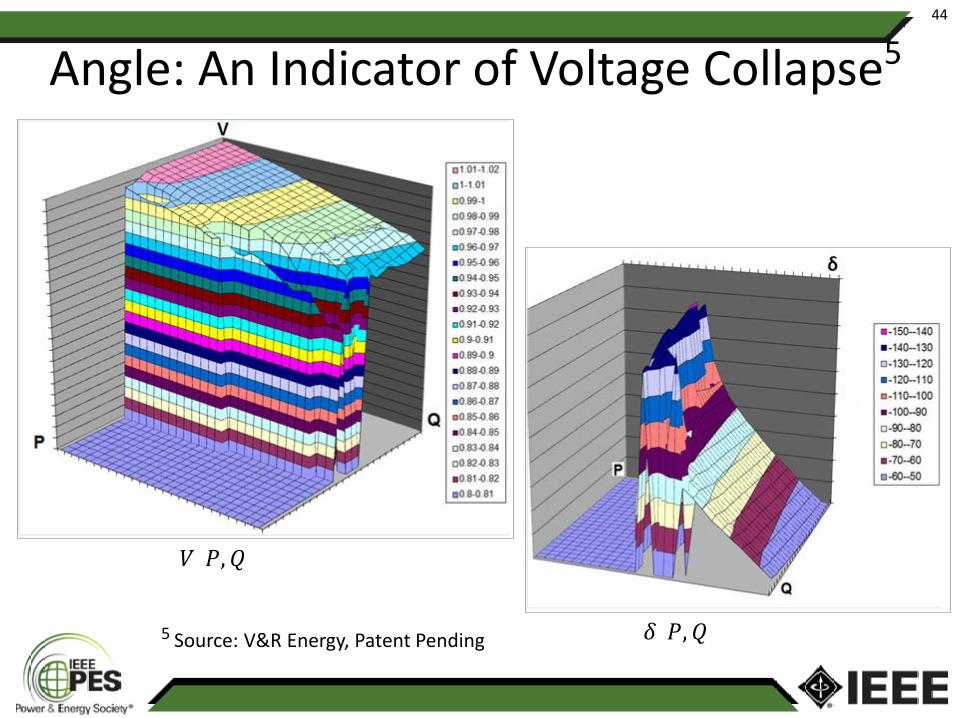
Angle: An Indicator of Voltage Collapse5
𝛿𝛿(𝑃𝑃,𝑄𝑄)
𝑉𝑉(𝑃𝑃,𝑄𝑄)
5 Source: V&R Energy, Patent Pending
44

3. Related IEEE Activities
45

IEEE PES Resource Center• Tutorials, webinars, technical publications• Online training platform - Next GenEEI
46

• Tutorials include:– Synchrophasors Estimation and Control of Power System Dynamics– Smart Grid 308 – Distributed Energy Resources– IEEE 1547 Standard for Interconnecting Distributed Energy Resources with
Electric Power Systems– Industry Best Practices, Needs, and Challenges in Cascading Analysis: Tutorial
and Training– Managing Uncertainties in the Future Grid: Evolution of EMS Control Centers -
Synchrophasor Solution– Cybersecurity of the Electric Power Transmission and Distribution System
47

2017 IEEE ISGT Conference• 2017 ISGT – Washington, D.C. April, 2017• Panel Sessions Included:
– Industry Best Practices in Using Synchrophasor Technology– Opportunities and Challenges for PMU Implementation in
Distribution Systems and Microgrids– Cloud Computing and Cybersecurity Issues for Power Grid
Applications
• Tutorials included:– Managing Uncertainties in the Future Grid: Evolution of
EMS Control Centers - Synchrophasor Solutions– DER Integration Course - Impacts on T&D– Introduction to Smart Grid Data and Analytics
48

4. Future Work
49

Future Work – Industry Needs• Computing phase angle limit in real-time:
– Wide-area and for line reclosing
• Determining the most dangerous direction of system stressing in real-time:– What is the combination of flows on all interfaces such that the system
margin to collapse is the smallest?
• Real-time voltage stability analysis:– Separating local vs. global voltage collapse and quantifying voltage
collapse – Separating numerical vs. physical voltage stability
• Accessing system health in real-time, simultaneous AGC/AVC systems’ control, and many more challenges!
50
5. Conclusion
51

Conclusion• IEEE PES offers expertise and technical resources to
facilitate development, adoption, and sharing of new methodologies, and provide training on new technologies
52