improving prediction accuracy of memory interferences for
TRANSCRIPT
HAL Id: hal-02401625https://hal.inria.fr/hal-02401625
Submitted on 10 Dec 2019
HAL is a multi-disciplinary open accessarchive for the deposit and dissemination of sci-entific research documents, whether they are pub-lished or not. The documents may come fromteaching and research institutions in France orabroad, or from public or private research centers.
L’archive ouverte pluridisciplinaire HAL, estdestinée au dépôt et à la diffusion de documentsscientifiques de niveau recherche, publiés ou non,émanant des établissements d’enseignement et derecherche français ou étrangers, des laboratoirespublics ou privés.
Improving Prediction Accuracy of Memory Interferencesfor Multicore Platforms
Cédric Courtaud, Julien Sopena, Gilles Muller, Daniel Gracia
To cite this version:Cédric Courtaud, Julien Sopena, Gilles Muller, Daniel Gracia. Improving Prediction Accuracy ofMemory Interferences for Multicore Platforms. RTSS 2019 - 40th IEEE Real-Time Systems Sympo-sium, Dec 2019, Hong-Kong, China. �hal-02401625�
Improving Prediction Accuracy of MemoryInterferences for Multicore Platforms
Cedric CourtaudSorbonne Universite/LIP6
InriaThales
Julien SopenaSorbonne Universite/LIP6
Gilles MullerInria
Sorbonne Universite/[email protected]
Daniel Gracia PerezThales
Abstract—Memory interferences may introduce importantslowdowns in applications running on COTS multi-core proces-sors. They are caused by concurrent accesses to shared hardwareresources of the memory system. The induced delays are difficultto predict, making memory interferences a major obstacle to theadoption of COTS multi-core processors in real-time systems. Inthis article, we propose an experimental characterization of ap-plications’ memory consumption to determine their sensitivity tomemory interferences. Thanks to a new set of microbenchmarks,we show the lack of precision of a purely quantitative character-ization. To improve accuracy, we define new metrics quantifyingqualitative aspects of memory consumption and implement aprofiling tool using the VALGRIND framework. In addition, ourprofiling tool produces high resolution profiles allowing us toclearly distinguish the various phases in applications’ behavior.Using our microbenchmarks and our new characterization, wetrain a state-of-the-art regressor. The validation on applicationsfrom the MIBENCH and the PARSEC suites indicates significantgain in prediction accuracy compared to a purely quantitativecharacterization.
Index Terms—real-time, real-time systems, COTS, multi-core,interferences, memory interferences, characterization, profiling,experimental, provisioning, dynamic timing analysis, machinelearning, inference
I. INTRODUCTION
Commercial Off The Shelf (COTS) multi-core platformsoffer computational power and energy efficiency at a lowprice, making them appealing targets for the development ofcomplex embedded systems. Unfortunately, the adoption ofCOTS multi-core platforms is hindered by memory interfer-ences which are due to the sharing of components of thememory hierarchy (caches, interconnects, DRAM chips andcontrollers,...) between cores, for cost and efficiency reasons.Memory interferences cause significant and hard-to-predictoverheads, and they considerably challenge traditional timinganalyses [1], which often results in unusably high estimatedWCETs for real-time applications. In fact, accurately pre-dicting memory interference overheads remains a difficultproblem. Thus, the choice of a COTS hardware platform fora system requires a thorough study involving a substantialnumber of tests.
In this paper, we present a novel approach to estimate theinterference overhead of an application based on a charac-terization of its behavior. Such estimation can be used in
practice to quickly assess the suitability of a platform for aparticular workload and ease the hardware provisioning ofreal-time systems. Our work is based on the observation thatexisting approaches to determine interference overhead relyonly on bandwidth measurement which leads to conservativepessimistic values [2] [3]. We make three contributions. First,we introduce a new set of microbenchmarks that allow tocover a wide range of memory behavior varying both in natureand intensity. With these microbenchmarks, we show thatthe memory bandwidth leads indeed to compute inaccurateinterference values. Second, we propose new metrics for quan-tifying the qualitative aspects of memory behavior. Since mostof these metrics are not measurable using hardware counters,we have implemented a profiling tool using the VALGRIND1
framework [4]. Our profiling tool generates high resolutionprofiles of the application memory behavior, allowing one todistinguish various phases in the execution of an application.Third, using random forest regressors [5], we compare howdifferent characterizations of the memory traffic generated byour microbenchmarks perform for the inference of the over-head suffered by other applications. Results show a substantialgain of prediction accuracy with our new metrics.
Our results are as follows:
• We evaluate the effects of memory interferences on 1568distinct cases of memory behavior on a iMX6.q SabreLite board [6]: a COTS platform, originally designed forautomotive applications, which is currently widely usedin the industry.
• We show the limits of a purely quantitative metric, withdifference of execution time overhead exceeding 200%for similar observed bandwidth.
• We have implemented a profiler using the VALGRINDframework to generate high resolution profiles of thememory behavior. In a case study, we show that theseprofiles allow to split applications into phases of equiva-lent overhead.
• For different memory traffic characterizations, we eval-uate how precisely random forests [5] trained on mi-
1The profiling tool and the microbenchmarks presented in this paper will bemade available at the following url: http://julien.sopena.fr/ressources/memory-interference
crobenchmarks data can infer the overhead suffered by78 phases from 29 applications of the MIBENCH and thePARSEC [7] suites. Compared to a purely quantitativecharacterization, our new metrics reduce both the aver-age absolute and squared error of the validation set byrespectively 50% and 74.4%.
This article is organized as follows. In Section II, we presentour microbenchmarks and evaluate the range of behavior theycover. This section also presents our interference measuremethodology. In Section III, we discuss of the quantitativecharacterization of memory consumption behaviors, definequalitative metrics, and presents our high resolution profilingapproach. In Section IV, we evaluate the relevance of ournew characterization. Finally, we present the related work inSection V, before concluding and discussing future work inSection VI.
II. EVALUATING THE IMPACT OF MEMORY INTERFERENCES
In this section, we present a methodology to study theimpact of interferences on a given hardware platform. First wepresent a set of microbenchmarks that cover a wide range ofmemory behavior. Then we describe the experimental platformused in this article. This is followed by a description of ourinterference measurement protocol. Finally, we evaluate therange of sensitivity covered by our microbenchmarks.
A. Memory microbenchmarks
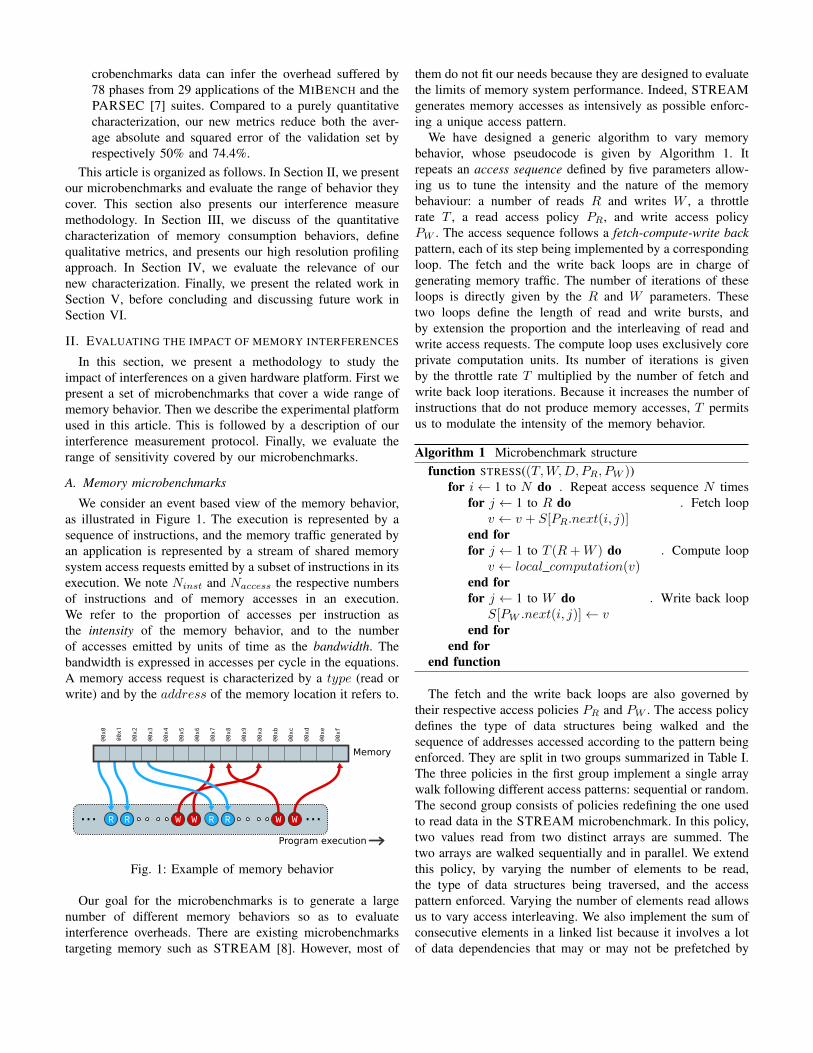
We consider an event based view of the memory behavior,as illustrated in Figure 1. The execution is represented by asequence of instructions, and the memory traffic generated byan application is represented by a stream of shared memorysystem access requests emitted by a subset of instructions in itsexecution. We note Ninst and Naccess the respective numbersof instructions and of memory accesses in an execution.We refer to the proportion of accesses per instruction asthe intensity of the memory behavior, and to the numberof accesses emitted by units of time as the bandwidth. Thebandwidth is expressed in accesses per cycle in the equations.A memory access request is characterized by a type (read orwrite) and by the address of the memory location it refers to.
R WR R WR... ...W
Program execution
W
Memory
@0x1
@0x4
@0x2
@0x3
@0x5
@0x6
@0x8
@0x7
@0x9
@0xa
@0xb
@0xc
@0xd
@0xe
@0xf
@0x0
Fig. 1: Example of memory behavior
Our goal for the microbenchmarks is to generate a largenumber of different memory behaviors so as to evaluateinterference overheads. There are existing microbenchmarkstargeting memory such as STREAM [8]. However, most of
them do not fit our needs because they are designed to evaluatethe limits of memory system performance. Indeed, STREAMgenerates memory accesses as intensively as possible enforc-ing a unique access pattern.
We have designed a generic algorithm to vary memorybehavior, whose pseudocode is given by Algorithm 1. Itrepeats an access sequence defined by five parameters allow-ing us to tune the intensity and the nature of the memorybehaviour: a number of reads R and writes W , a throttlerate T , a read access policy PR, and write access policyPW . The access sequence follows a fetch-compute-write backpattern, each of its step being implemented by a correspondingloop. The fetch and the write back loops are in charge ofgenerating memory traffic. The number of iterations of theseloops is directly given by the R and W parameters. Thesetwo loops define the length of read and write bursts, andby extension the proportion and the interleaving of read andwrite access requests. The compute loop uses exclusively coreprivate computation units. Its number of iterations is givenby the throttle rate T multiplied by the number of fetch andwrite back loop iterations. Because it increases the number ofinstructions that do not produce memory accesses, T permitsus to modulate the intensity of the memory behavior.
Algorithm 1 Microbenchmark structurefunction STRESS((T,W,D,PR, PW ))
for i← 1 to N do . Repeat access sequence N timesfor j ← 1 to R do . Fetch loop
v ← v + S[PR.next(i, j)]end forfor j ← 1 to T (R+W ) do . Compute loop
v ← local computation(v)end forfor j ← 1 to W do . Write back loop
S[PW .next(i, j)]← vend for
end forend function
The fetch and the write back loops are also governed bytheir respective access policies PR and PW . The access policydefines the type of data structures being walked and thesequence of addresses accessed according to the pattern beingenforced. They are split in two groups summarized in Table I.The three policies in the first group implement a single arraywalk following different access patterns: sequential or random.The second group consists of policies redefining the one usedto read data in the STREAM microbenchmark. In this policy,two values read from two distinct arrays are summed. Thetwo arrays are walked sequentially and in parallel. We extendthis policy, by varying the number of elements to be read,the type of data structures being traversed, and the accesspattern enforced. Varying the number of elements read allowsus to vary access interleaving. We also implement the sum ofconsecutive elements in a linked list because it involves a lotof data dependencies that may or may not be prefetched by
the target hardware. Finally, varying the access pattern allowsus to vary the stress put on the prefetchers.
To build the benchmark suite, we retain thirteen of the 112
possible combinations of read and write access policies. Fiveare combinations of policies of the first group, two of thesebeing particularly frequent in embedded systems. In the firstcase, data are read and written sequentially. Such behavior oc-curs for instance with the memcpy function. The second casecorresponds to random reads followed by sequential writes.This behavior is found when data are gathered from varioussources (sensors for instance). We also consider the duals ofthese behaviors, namely fully random accesses (random readsand random writes) and data scattering (sequential reads andrandom writes). Finally, we consider the case of lookup tablesbeing used in the fetch and the write back loop, in order tomimic the case of the copy of linked data structures. The eightremaining combinations reproduce and extend the structureof STREAM: the read access policy is picked from the firstgroup and data are written sequentially. To imitate the behaviorof STREAM, we fixed the R and the W parameters. Howeverthe traffic can still be throttled.
B. Experimental platform
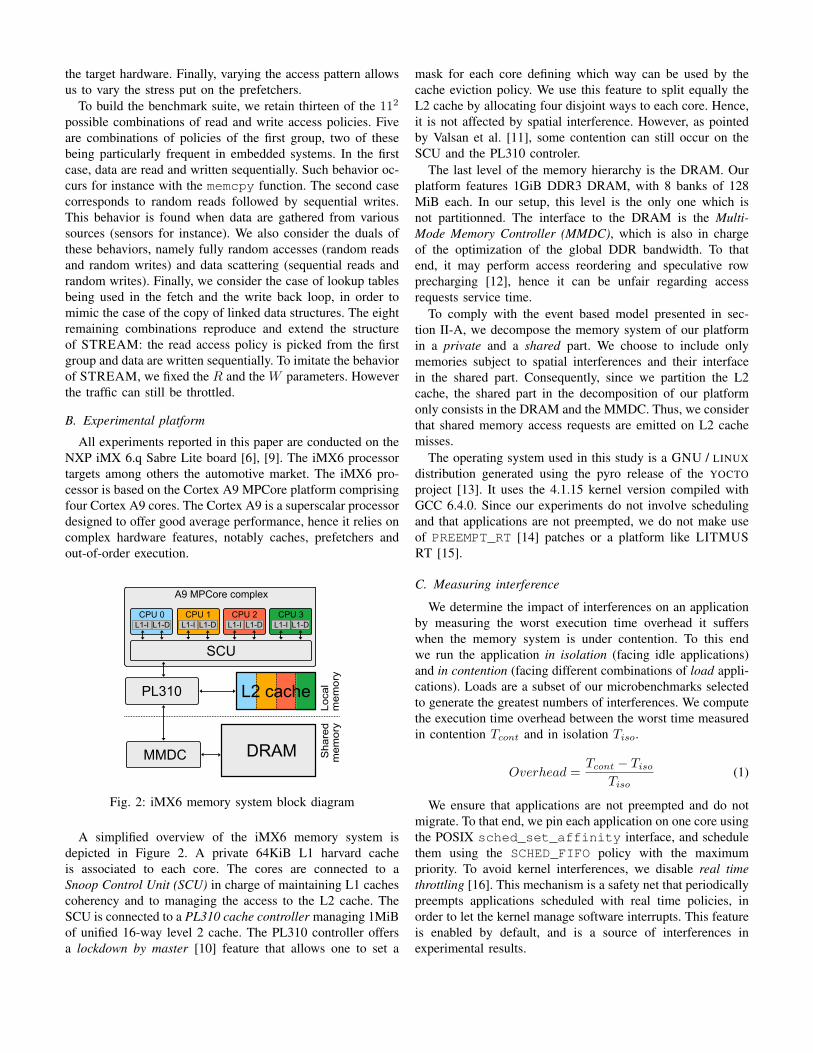
All experiments reported in this paper are conducted on theNXP iMX 6.q Sabre Lite board [6], [9]. The iMX6 processortargets among others the automotive market. The iMX6 pro-cessor is based on the Cortex A9 MPCore platform comprisingfour Cortex A9 cores. The Cortex A9 is a superscalar processordesigned to offer good average performance, hence it relies oncomplex hardware features, notably caches, prefetchers andout-of-order execution.
Fig. 2: iMX6 memory system block diagram
A simplified overview of the iMX6 memory system isdepicted in Figure 2. A private 64KiB L1 harvard cacheis associated to each core. The cores are connected to aSnoop Control Unit (SCU) in charge of maintaining L1 cachescoherency and to managing the access to the L2 cache. TheSCU is connected to a PL310 cache controller managing 1MiBof unified 16-way level 2 cache. The PL310 controller offersa lockdown by master [10] feature that allows one to set a
mask for each core defining which way can be used by thecache eviction policy. We use this feature to split equally theL2 cache by allocating four disjoint ways to each core. Hence,it is not affected by spatial interference. However, as pointedby Valsan et al. [11], some contention can still occur on theSCU and the PL310 controler.
The last level of the memory hierarchy is the DRAM. Ourplatform features 1GiB DDR3 DRAM, with 8 banks of 128MiB each. In our setup, this level is the only one which isnot partitionned. The interface to the DRAM is the Multi-Mode Memory Controller (MMDC), which is also in chargeof the optimization of the global DDR bandwidth. To thatend, it may perform access reordering and speculative rowprecharging [12], hence it can be unfair regarding accessrequests service time.
To comply with the event based model presented in sec-tion II-A, we decompose the memory system of our platformin a private and a shared part. We choose to include onlymemories subject to spatial interferences and their interfacein the shared part. Consequently, since we partition the L2cache, the shared part in the decomposition of our platformonly consists in the DRAM and the MMDC. Thus, we considerthat shared memory access requests are emitted on L2 cachemisses.
The operating system used in this study is a GNU / LINUXdistribution generated using the pyro release of the YOCTOproject [13]. It uses the 4.1.15 kernel version compiled withGCC 6.4.0. Since our experiments do not involve schedulingand that applications are not preempted, we do not make useof PREEMPT_RT [14] patches or a platform like LITMUSRT [15].
C. Measuring interference
We determine the impact of interferences on an applicationby measuring the worst execution time overhead it sufferswhen the memory system is under contention. To this endwe run the application in isolation (facing idle applications)and in contention (facing different combinations of load appli-cations). Loads are a subset of our microbenchmarks selectedto generate the greatest numbers of interferences. We computethe execution time overhead between the worst time measuredin contention Tcont and in isolation Tiso.
Overhead =Tcont − Tiso
Tiso(1)
We ensure that applications are not preempted and do notmigrate. To that end, we pin each application on one core usingthe POSIX sched_set_affinity interface, and schedulethem using the SCHED_FIFO policy with the maximumpriority. To avoid kernel interferences, we disable real timethrottling [16]. This mechanism is a safety net that periodicallypreempts applications scheduled with real time policies, inorder to let the kernel manage software interrupts. This featureis enabled by default, and is a source of interferences inexperimental results.
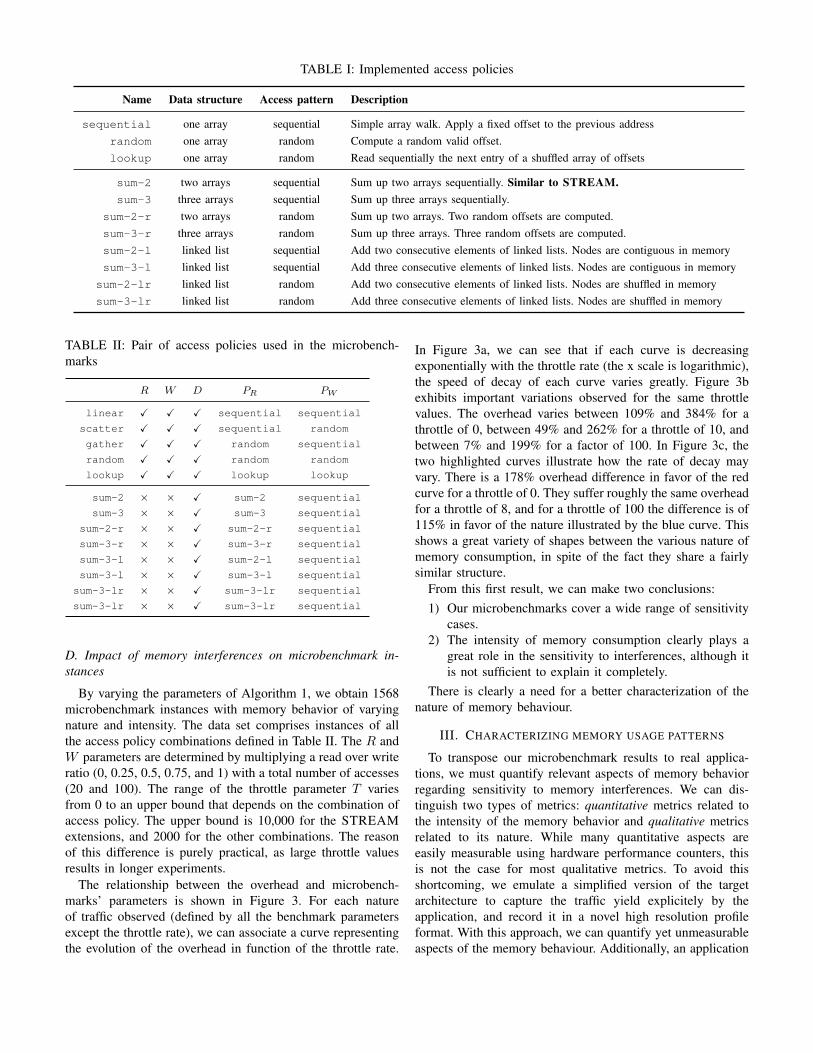
TABLE I: Implemented access policies
Name Data structure Access pattern Description
sequential one array sequential Simple array walk. Apply a fixed offset to the previous addressrandom one array random Compute a random valid offset.lookup one array random Read sequentially the next entry of a shuffled array of offsets
sum-2 two arrays sequential Sum up two arrays sequentially. Similar to STREAM.sum-3 three arrays sequential Sum up three arrays sequentially.
sum-2-r two arrays random Sum up two arrays. Two random offsets are computed.sum-3-r three arrays random Sum up three arrays. Three random offsets are computed.sum-2-l linked list sequential Add two consecutive elements of linked lists. Nodes are contiguous in memorysum-3-l linked list sequential Add three consecutive elements of linked lists. Nodes are contiguous in memorysum-2-lr linked list random Add two consecutive elements of linked lists. Nodes are shuffled in memorysum-3-lr linked list random Add three consecutive elements of linked lists. Nodes are shuffled in memory
TABLE II: Pair of access policies used in the microbench-marks
R W D PR PW
linear X X X sequential sequential
scatter X X X sequential random
gather X X X random sequential
random X X X random random
lookup X X X lookup lookup
sum-2 × × X sum-2 sequential
sum-3 × × X sum-3 sequential
sum-2-r × × X sum-2-r sequential
sum-3-r × × X sum-3-r sequential
sum-3-l × × X sum-2-l sequential
sum-3-l × × X sum-3-l sequential
sum-3-lr × × X sum-3-lr sequential
sum-3-lr × × X sum-3-lr sequential
D. Impact of memory interferences on microbenchmark in-stances
By varying the parameters of Algorithm 1, we obtain 1568microbenchmark instances with memory behavior of varyingnature and intensity. The data set comprises instances of allthe access policy combinations defined in Table II. The R andW parameters are determined by multiplying a read over writeratio (0, 0.25, 0.5, 0.75, and 1) with a total number of accesses(20 and 100). The range of the throttle parameter T variesfrom 0 to an upper bound that depends on the combination ofaccess policy. The upper bound is 10,000 for the STREAMextensions, and 2000 for the other combinations. The reasonof this difference is purely practical, as large throttle valuesresults in longer experiments.
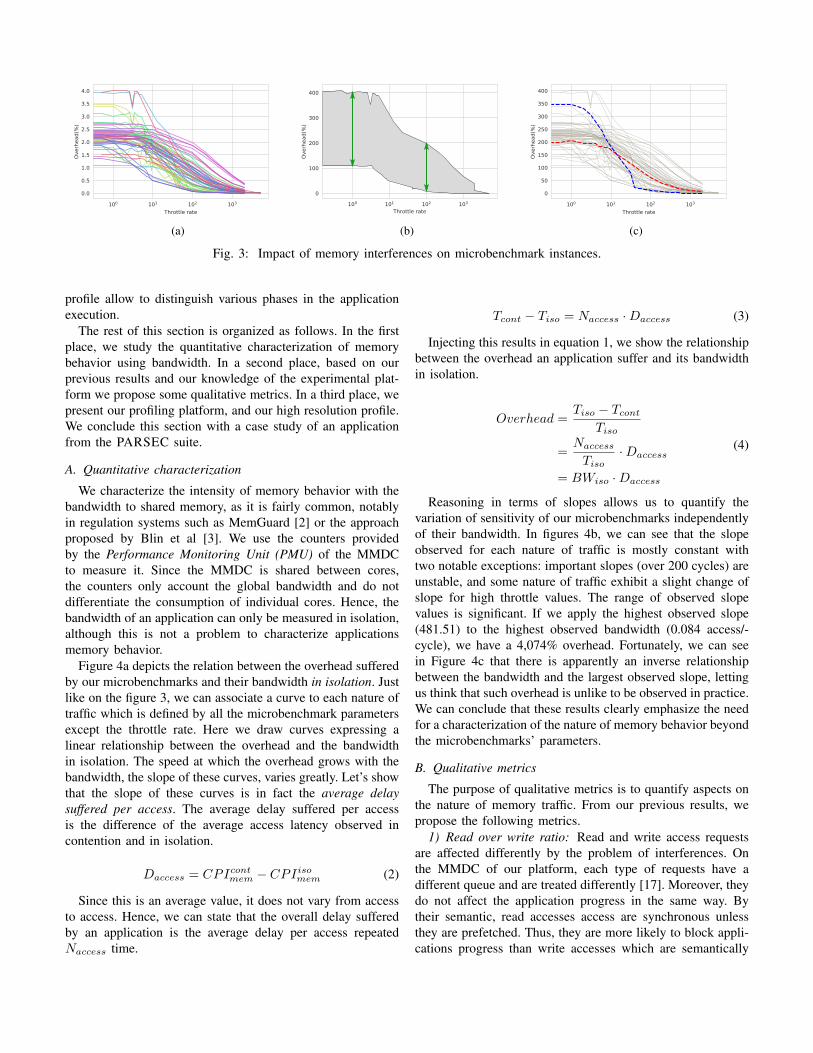
The relationship between the overhead and microbench-marks’ parameters is shown in Figure 3. For each natureof traffic observed (defined by all the benchmark parametersexcept the throttle rate), we can associate a curve representingthe evolution of the overhead in function of the throttle rate.
In Figure 3a, we can see that if each curve is decreasingexponentially with the throttle rate (the x scale is logarithmic),the speed of decay of each curve varies greatly. Figure 3bexhibits important variations observed for the same throttlevalues. The overhead varies between 109% and 384% for athrottle of 0, between 49% and 262% for a throttle of 10, andbetween 7% and 199% for a factor of 100. In Figure 3c, thetwo highlighted curves illustrate how the rate of decay mayvary. There is a 178% overhead difference in favor of the redcurve for a throttle of 0. They suffer roughly the same overheadfor a throttle of 8, and for a throttle of 100 the difference is of115% in favor of the nature illustrated by the blue curve. Thisshows a great variety of shapes between the various nature ofmemory consumption, in spite of the fact they share a fairlysimilar structure.
From this first result, we can make two conclusions:1) Our microbenchmarks cover a wide range of sensitivity
cases.2) The intensity of memory consumption clearly plays a
great role in the sensitivity to interferences, although itis not sufficient to explain it completely.
There is clearly a need for a better characterization of thenature of memory behaviour.
III. CHARACTERIZING MEMORY USAGE PATTERNS
To transpose our microbenchmark results to real applica-tions, we must quantify relevant aspects of memory behaviorregarding sensitivity to memory interferences. We can dis-tinguish two types of metrics: quantitative metrics related tothe intensity of the memory behavior and qualitative metricsrelated to its nature. While many quantitative aspects areeasily measurable using hardware performance counters, thisis not the case for most qualitative metrics. To avoid thisshortcoming, we emulate a simplified version of the targetarchitecture to capture the traffic yield explicitely by theapplication, and record it in a novel high resolution profileformat. With this approach, we can quantify yet unmeasurableaspects of the memory behaviour. Additionally, an application
100 101 102 103
Throttle rate
0.0
0.5
1.0
1.5
2.0
2.5
3.0
3.5
4.0
Over
head
(%)
(a) (b)
100 101 102 103
Throttle rate
0
50
100
150
200
250
300
350
400
Over
head
(%)
(c)
Fig. 3: Impact of memory interferences on microbenchmark instances.
profile allow to distinguish various phases in the applicationexecution.
The rest of this section is organized as follows. In the firstplace, we study the quantitative characterization of memorybehavior using bandwidth. In a second place, based on ourprevious results and our knowledge of the experimental plat-form we propose some qualitative metrics. In a third place, wepresent our profiling platform, and our high resolution profile.We conclude this section with a case study of an applicationfrom the PARSEC suite.
A. Quantitative characterization
We characterize the intensity of memory behavior with thebandwidth to shared memory, as it is fairly common, notablyin regulation systems such as MemGuard [2] or the approachproposed by Blin et al [3]. We use the counters providedby the Performance Monitoring Unit (PMU) of the MMDCto measure it. Since the MMDC is shared between cores,the counters only account the global bandwidth and do notdifferentiate the consumption of individual cores. Hence, thebandwidth of an application can only be measured in isolation,although this is not a problem to characterize applicationsmemory behavior.
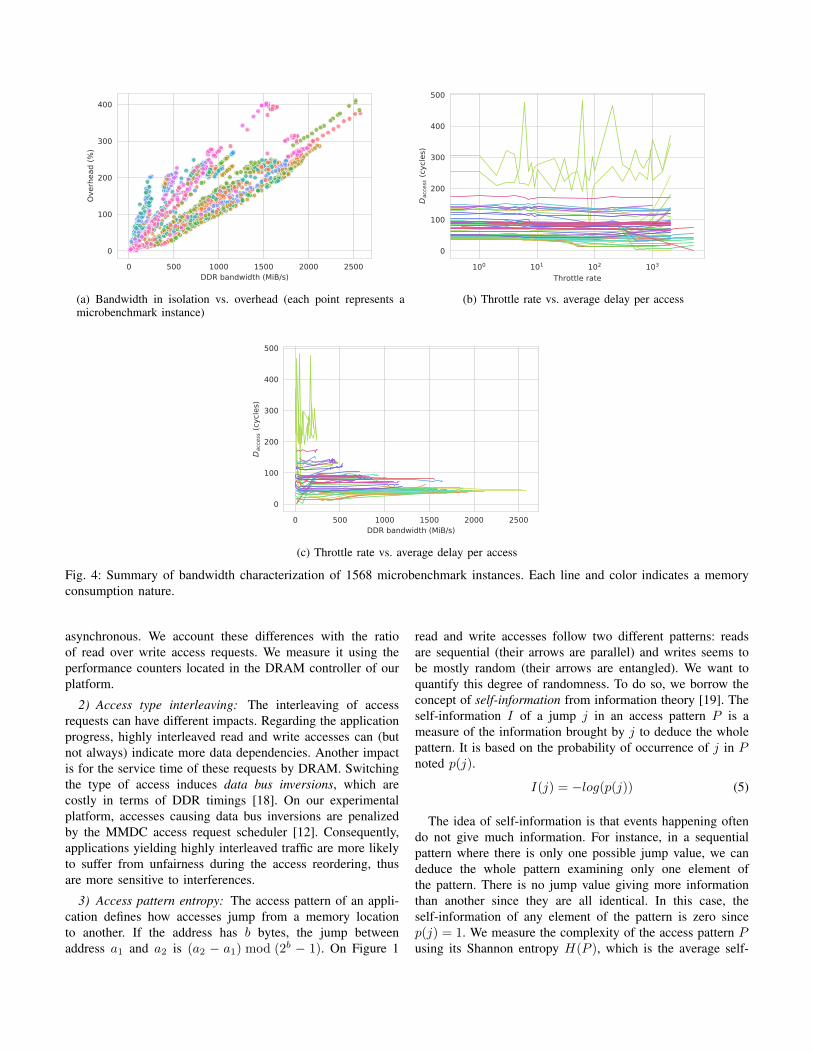
Figure 4a depicts the relation between the overhead sufferedby our microbenchmarks and their bandwidth in isolation. Justlike on the figure 3, we can associate a curve to each nature oftraffic which is defined by all the microbenchmark parametersexcept the throttle rate. Here we draw curves expressing alinear relationship between the overhead and the bandwidthin isolation. The speed at which the overhead grows with thebandwidth, the slope of these curves, varies greatly. Let’s showthat the slope of these curves is in fact the average delaysuffered per access. The average delay suffered per accessis the difference of the average access latency observed incontention and in isolation.
Daccess = CPIcontmem − CPIisomem (2)
Since this is an average value, it does not vary from accessto access. Hence, we can state that the overall delay sufferedby an application is the average delay per access repeatedNaccess time.
Tcont − Tiso = Naccess ·Daccess (3)
Injecting this results in equation 1, we show the relationshipbetween the overhead an application suffer and its bandwidthin isolation.
Overhead =Tiso − Tcont
Tiso
=Naccess
Tiso·Daccess
= BWiso ·Daccess
(4)
Reasoning in terms of slopes allows us to quantify thevariation of sensitivity of our microbenchmarks independentlyof their bandwidth. In figures 4b, we can see that the slopeobserved for each nature of traffic is mostly constant withtwo notable exceptions: important slopes (over 200 cycles) areunstable, and some nature of traffic exhibit a slight change ofslope for high throttle values. The range of observed slopevalues is significant. If we apply the highest observed slope(481.51) to the highest observed bandwidth (0.084 access/-cycle), we have a 4,074% overhead. Fortunately, we can seein Figure 4c that there is apparently an inverse relationshipbetween the bandwidth and the largest observed slope, lettingus think that such overhead is unlike to be observed in practice.We can conclude that these results clearly emphasize the needfor a characterization of the nature of memory behavior beyondthe microbenchmarks’ parameters.
B. Qualitative metrics
The purpose of qualitative metrics is to quantify aspects onthe nature of memory traffic. From our previous results, wepropose the following metrics.
1) Read over write ratio: Read and write access requestsare affected differently by the problem of interferences. Onthe MMDC of our platform, each type of requests have adifferent queue and are treated differently [17]. Moreover, theydo not affect the application progress in the same way. Bytheir semantic, read accesses access are synchronous unlessthey are prefetched. Thus, they are more likely to block appli-cations progress than write accesses which are semantically
0 500 1000 1500 2000 2500DDR bandwidth (MiB/s)
0
100
200
300
400Ov
erhe
ad (%
)
(a) Bandwidth in isolation vs. overhead (each point represents amicrobenchmark instance)
100 101 102 103
Throttle rate
0
100
200
300
400
500
Dac
cess
(cyc
les)
(b) Throttle rate vs. average delay per access
0 500 1000 1500 2000 2500DDR bandwidth (MiB/s)
0
100
200
300
400
500
Dac
cess
(cyc
les)
(c) Throttle rate vs. average delay per access
Fig. 4: Summary of bandwidth characterization of 1568 microbenchmark instances. Each line and color indicates a memoryconsumption nature.
asynchronous. We account these differences with the ratioof read over write access requests. We measure it using theperformance counters located in the DRAM controller of ourplatform.
2) Access type interleaving: The interleaving of accessrequests can have different impacts. Regarding the applicationprogress, highly interleaved read and write accesses can (butnot always) indicate more data dependencies. Another impactis for the service time of these requests by DRAM. Switchingthe type of access induces data bus inversions, which arecostly in terms of DDR timings [18]. On our experimentalplatform, accesses causing data bus inversions are penalizedby the MMDC access request scheduler [12]. Consequently,applications yielding highly interleaved traffic are more likelyto suffer from unfairness during the access reordering, thusare more sensitive to interferences.
3) Access pattern entropy: The access pattern of an appli-cation defines how accesses jump from a memory locationto another. If the address has b bytes, the jump betweenaddress a1 and a2 is (a2 − a1) mod (2b − 1). On Figure 1
read and write accesses follow two different patterns: readsare sequential (their arrows are parallel) and writes seems tobe mostly random (their arrows are entangled). We want toquantify this degree of randomness. To do so, we borrow theconcept of self-information from information theory [19]. Theself-information I of a jump j in an access pattern P is ameasure of the information brought by j to deduce the wholepattern. It is based on the probability of occurrence of j in Pnoted p(j).
I(j) = −log(p(j)) (5)
The idea of self-information is that events happening oftendo not give much information. For instance, in a sequentialpattern where there is only one possible jump value, we candeduce the whole pattern examining only one element ofthe pattern. There is no jump value giving more informationthan another since they are all identical. In this case, theself-information of any element of the pattern is zero sincep(j) = 1. We measure the complexity of the access pattern Pusing its Shannon entropy H(P ), which is the average self-
information of the elements of the sequence. It is also thenumber of bits required to encode the whole pattern.
H(P ) = E[I(P )] = −∑j∈P
p(j)log(p(j)) (6)
Applications with high entropy are likely to have poorlocality, and consequently an increased memory consumptionof system components such as DRAM rows. It is also ameasure of difficulty for the speculation mechanisms to workeffectively. Self information can be seen as a cost for aprefetcher to accurately predict future accesses from the past,and by extension to mitigate the impact of interferences.
4) Impact of service time degradation: The nature of thememory consumption of an application does not only affect thetime taken by the memory controller to serve access requestsbut also how this service time impacts applications progress.Instructions causing memory accesses have a significantlylonger completion time than others. Since the intensity I ofthe memory traffic is the number of accesses by instruction,it has a significant impact on the application’s progress speedmeasured in cycles per instruction (CPI). In fact, the CPIrate of an application can be expressed as the combination ofthe CPI of instructions producing memory accesses and theCPI of other instructions.
CPIiso = I · CPIisomem + (1− I) · CPIisocomp (7)
The value of CPIisomem is highly dependent on the timeTserv taken by the memory controller to serve memory ac-cesses. On average, this time depends on the nature of thetraffic. For instance, an access request can be served muchmore quickly if the corresponding row is already loaded inthe row buffer. Thus, accesses in a memory traffic exhibitingpoor locality will be longer to serve on average, as corre-sponding rows are less likely to be loaded. However, forarchitectural reasons (pipelines, out of order execution, non-blocking caches, . . . ), Tserv is rarely exactly reflected in thevalue of CPImem. We express this difference using an impactfactor noted τ .
CPImem = τ · Tserv (8)
By injecting this definition of CPImem in Equation 7 wecan compute τ as follows.
τ =CPI − (1− I) · CPIcomp
I · Tserv(9)
The value of τ is rarely equal to 1. In practice it can be lesseror greater. The first case indicates that the hardware is able tocompensate the DRAM service time, thanks to features likepipelining and out-of-order execution. Conversely, the secondcase τ indicates that the service time of the DRAM is only apart of the overall memory access delay. This can be explainedby the impact of other memory system components, but alsoby timing anomalies [20].
We measure Tserv using the PMU of the MMDC. Theintensity is measured using the number of accesses measured
on the MMDC and the number of instructions measured on thecore’s PMU. For the value of CPIcomp, we use a conservativeapproach and take the highest CPI value achievable on theplatform.
C. Profiling platform
Most of the qualitative metrics we just described are notmeasurable using hardware counters. That is why we mustuse some kind of simulation in order to measure them. Theproblem is that COTS hardware generally has two charac-teristics: it is rather complex and its precise behavior is notthoroughly documented. We avoid this drawback by stickingto our event based memory consumption representation: thememory consumption of an application is a stream of accessrequests emitted to a black box shared memory system. In oursetup, the shared memory is the DRAM, hence we considerthat an access is triggered on L2 cache misses. We havedeveloped a tool to reproduce the stream of access requestsyielded during an application execution. It is based on theCacheGrind platform of the VALGRIND [4] dynamic binaryinstrumentation framework. Except for the cache hierarchy,the target hardware is treated as a black box.
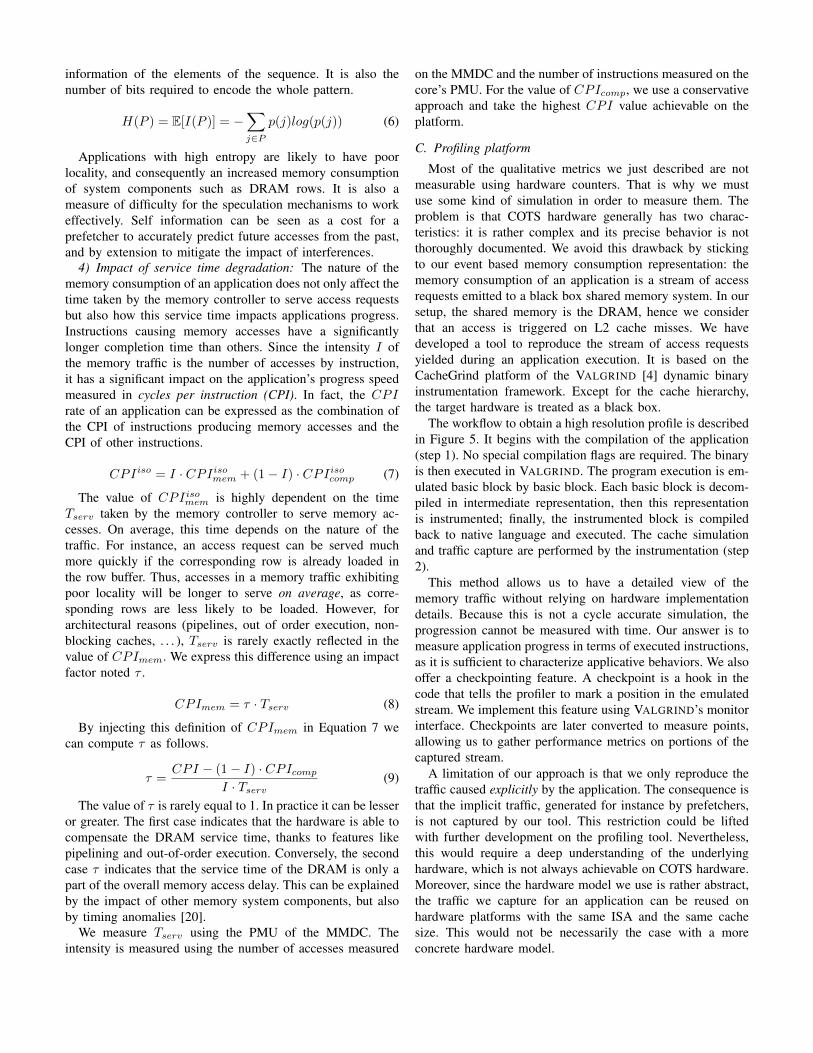
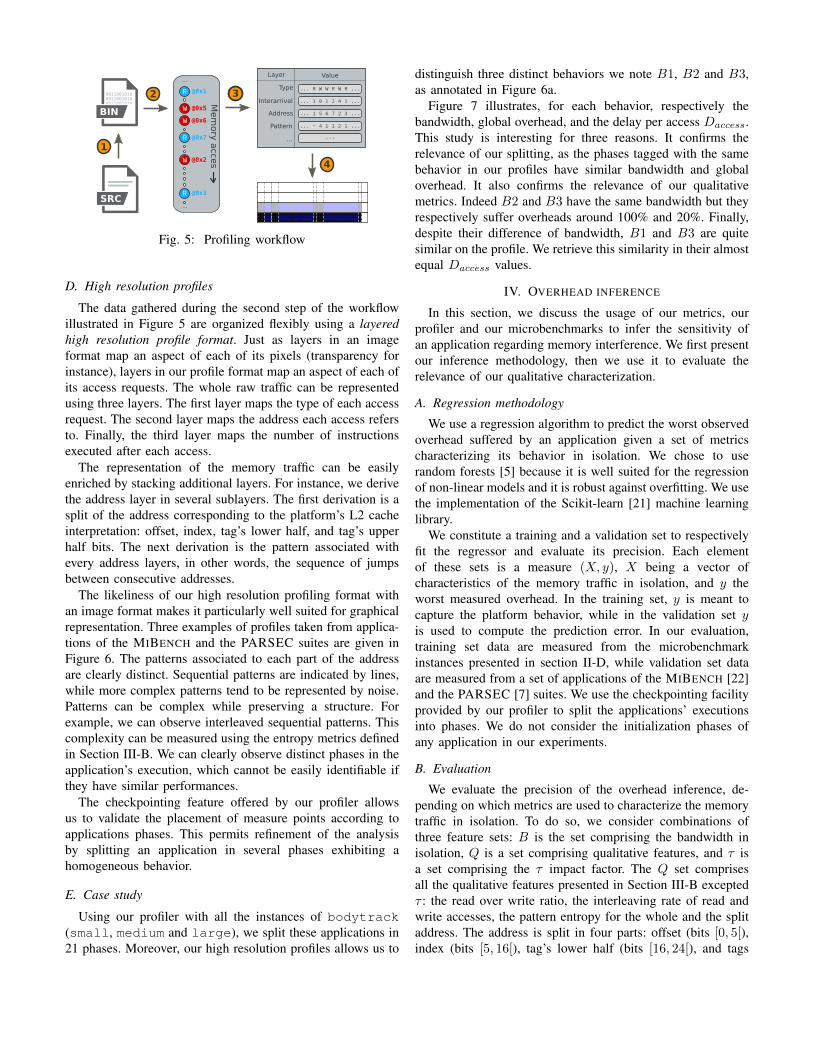
The workflow to obtain a high resolution profile is describedin Figure 5. It begins with the compilation of the application(step 1). No special compilation flags are required. The binaryis then executed in VALGRIND. The program execution is em-ulated basic block by basic block. Each basic block is decom-piled in intermediate representation, then this representationis instrumented; finally, the instrumented block is compiledback to native language and executed. The cache simulationand traffic capture are performed by the instrumentation (step2).
This method allows us to have a detailed view of thememory traffic without relying on hardware implementationdetails. Because this is not a cycle accurate simulation, theprogression cannot be measured with time. Our answer is tomeasure application progress in terms of executed instructions,as it is sufficient to characterize applicative behaviors. We alsooffer a checkpointing feature. A checkpoint is a hook in thecode that tells the profiler to mark a position in the emulatedstream. We implement this feature using VALGRIND’s monitorinterface. Checkpoints are later converted to measure points,allowing us to gather performance metrics on portions of thecaptured stream.
A limitation of our approach is that we only reproduce thetraffic caused explicitly by the application. The consequence isthat the implicit traffic, generated for instance by prefetchers,is not captured by our tool. This restriction could be liftedwith further development on the profiling tool. Nevertheless,this would require a deep understanding of the underlyinghardware, which is not always achievable on COTS hardware.Moreover, since the hardware model we use is rather abstract,the traffic we capture for an application can be reused onhardware platforms with the same ISA and the same cachesize. This would not be necessarily the case with a moreconcrete hardware model.
... R W W R W R ...
... 1 0 1 2 4 1 ...
... 1 5 6 7 2 3 ...
... - 4 1 1 2 1 ...
...
Type
Interarrival
Address
Pattern
...
ValueLayer
1
2 3
4
SRC
0011001010
00110010100011001010
BIN
Tag
MSB
Tag
LSB
Inde
xO
ffset
W
R
W
W
R
R...
...
Mem
ory
acce
s
@0x1
@0x7
@0x3
@0x5
@0x6
@0x2
Fig. 5: Profiling workflow
D. High resolution profiles
The data gathered during the second step of the workflowillustrated in Figure 5 are organized flexibly using a layeredhigh resolution profile format. Just as layers in an imageformat map an aspect of each of its pixels (transparency forinstance), layers in our profile format map an aspect of each ofits access requests. The whole raw traffic can be representedusing three layers. The first layer maps the type of each accessrequest. The second layer maps the address each access refersto. Finally, the third layer maps the number of instructionsexecuted after each access.
The representation of the memory traffic can be easilyenriched by stacking additional layers. For instance, we derivethe address layer in several sublayers. The first derivation is asplit of the address corresponding to the platform’s L2 cacheinterpretation: offset, index, tag’s lower half, and tag’s upperhalf bits. The next derivation is the pattern associated withevery address layers, in other words, the sequence of jumpsbetween consecutive addresses.
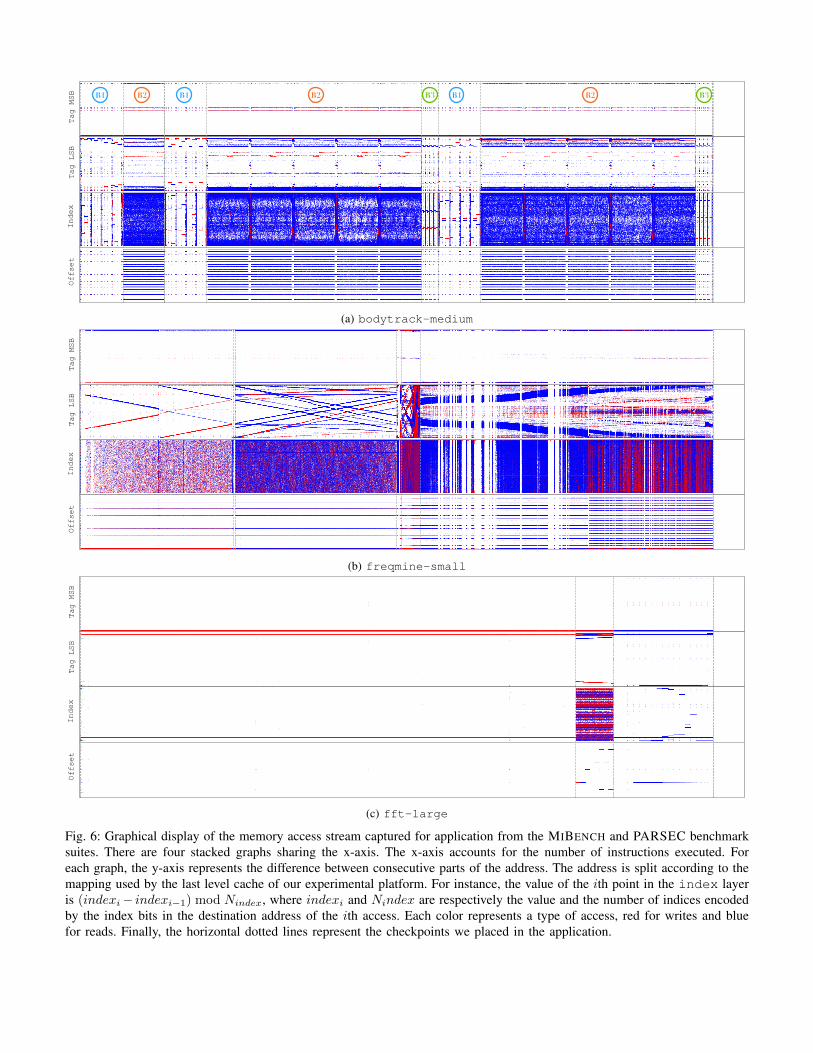
The likeliness of our high resolution profiling format withan image format makes it particularly well suited for graphicalrepresentation. Three examples of profiles taken from applica-tions of the MIBENCH and the PARSEC suites are given inFigure 6. The patterns associated to each part of the addressare clearly distinct. Sequential patterns are indicated by lines,while more complex patterns tend to be represented by noise.Patterns can be complex while preserving a structure. Forexample, we can observe interleaved sequential patterns. Thiscomplexity can be measured using the entropy metrics definedin Section III-B. We can clearly observe distinct phases in theapplication’s execution, which cannot be easily identifiable ifthey have similar performances.
The checkpointing feature offered by our profiler allowsus to validate the placement of measure points according toapplications phases. This permits refinement of the analysisby splitting an application in several phases exhibiting ahomogeneous behavior.
E. Case study
Using our profiler with all the instances of bodytrack(small, medium and large), we split these applications in21 phases. Moreover, our high resolution profiles allows us to
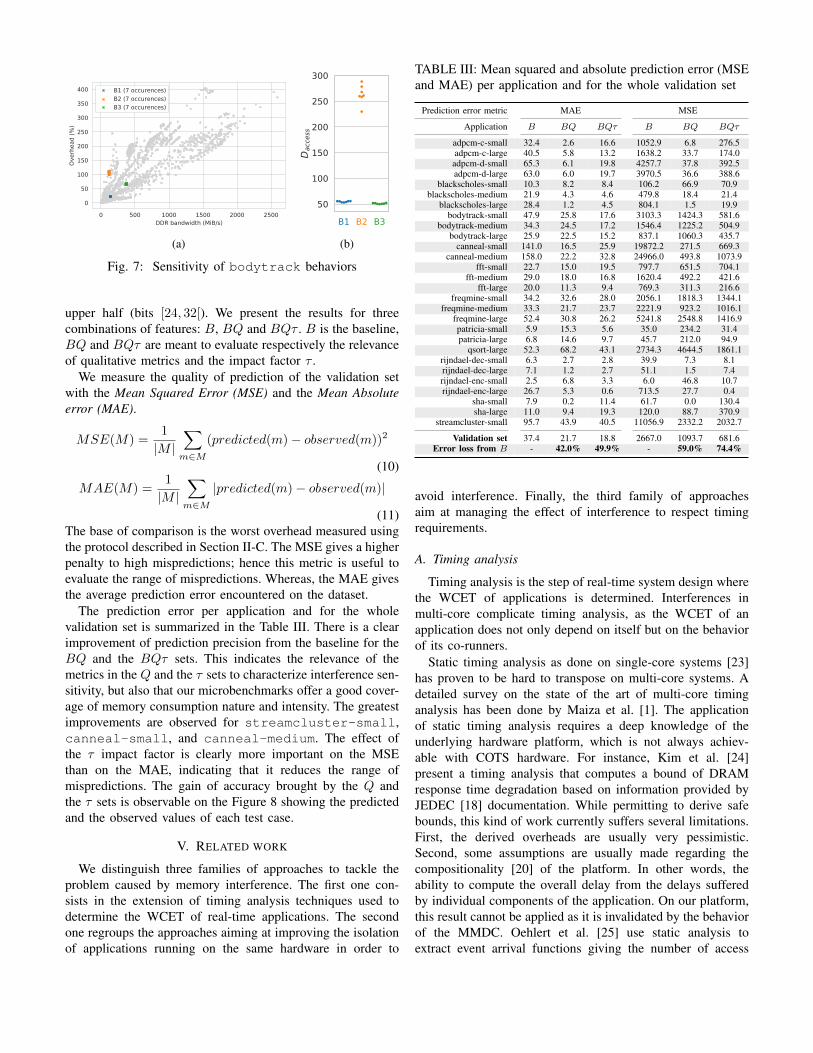
distinguish three distinct behaviors we note B1, B2 and B3,as annotated in Figure 6a.
Figure 7 illustrates, for each behavior, respectively thebandwidth, global overhead, and the delay per access Daccess.This study is interesting for three reasons. It confirms therelevance of our splitting, as the phases tagged with the samebehavior in our profiles have similar bandwidth and globaloverhead. It also confirms the relevance of our qualitativemetrics. Indeed B2 and B3 have the same bandwidth but theyrespectively suffer overheads around 100% and 20%. Finally,despite their difference of bandwidth, B1 and B3 are quitesimilar on the profile. We retrieve this similarity in their almostequal Daccess values.
IV. OVERHEAD INFERENCE
In this section, we discuss the usage of our metrics, ourprofiler and our microbenchmarks to infer the sensitivity ofan application regarding memory interference. We first presentour inference methodology, then we use it to evaluate therelevance of our qualitative characterization.
A. Regression methodology
We use a regression algorithm to predict the worst observedoverhead suffered by an application given a set of metricscharacterizing its behavior in isolation. We chose to userandom forests [5] because it is well suited for the regressionof non-linear models and it is robust against overfitting. We usethe implementation of the Scikit-learn [21] machine learninglibrary.
We constitute a training and a validation set to respectivelyfit the regressor and evaluate its precision. Each elementof these sets is a measure (X, y), X being a vector ofcharacteristics of the memory traffic in isolation, and y theworst measured overhead. In the training set, y is meant tocapture the platform behavior, while in the validation set yis used to compute the prediction error. In our evaluation,training set data are measured from the microbenchmarkinstances presented in section II-D, while validation set dataare measured from a set of applications of the MIBENCH [22]and the PARSEC [7] suites. We use the checkpointing facilityprovided by our profiler to split the applications’ executionsinto phases. We do not consider the initialization phases ofany application in our experiments.
B. Evaluation
We evaluate the precision of the overhead inference, de-pending on which metrics are used to characterize the memorytraffic in isolation. To do so, we consider combinations ofthree feature sets: B is the set comprising the bandwidth inisolation, Q is a set comprising qualitative features, and τ isa set comprising the τ impact factor. The Q set comprisesall the qualitative features presented in Section III-B exceptedτ : the read over write ratio, the interleaving rate of read andwrite accesses, the pattern entropy for the whole and the splitaddress. The address is split in four parts: offset (bits [0, 5[),index (bits [5, 16[), tag’s lower half (bits [16, 24[), and tags
(a) bodytrack-medium
(b) freqmine-small
(c) fft-large
Fig. 6: Graphical display of the memory access stream captured for application from the MIBENCH and PARSEC benchmarksuites. There are four stacked graphs sharing the x-axis. The x-axis accounts for the number of instructions executed. Foreach graph, the y-axis represents the difference between consecutive parts of the address. The address is split according to themapping used by the last level cache of our experimental platform. For instance, the value of the ith point in the index layeris (indexi− indexi−1) mod Nindex, where indexi and Nindex are respectively the value and the number of indices encodedby the index bits in the destination address of the ith access. Each color represents a type of access, red for writes and bluefor reads. Finally, the horizontal dotted lines represent the checkpoints we placed in the application.
0 500 1000 1500 2000 2500DDR bandwidth (MiB/s)
0
50
100
150
200
250
300
350
400
Over
head
(%)
B1 (7 occurences)B2 (7 occurences)B3 (7 occurences)
(a) (b)
Fig. 7: Sensitivity of bodytrack behaviors
upper half (bits [24, 32[). We present the results for threecombinations of features: B, BQ and BQτ . B is the baseline,BQ and BQτ are meant to evaluate respectively the relevanceof qualitative metrics and the impact factor τ .
We measure the quality of prediction of the validation setwith the Mean Squared Error (MSE) and the Mean Absoluteerror (MAE).
MSE(M) =1
|M |∑m∈M
(predicted(m)− observed(m))2
(10)
MAE(M) =1
|M |∑m∈M
|predicted(m)− observed(m)|
(11)The base of comparison is the worst overhead measured usingthe protocol described in Section II-C. The MSE gives a higherpenalty to high mispredictions; hence this metric is useful toevaluate the range of mispredictions. Whereas, the MAE givesthe average prediction error encountered on the dataset.
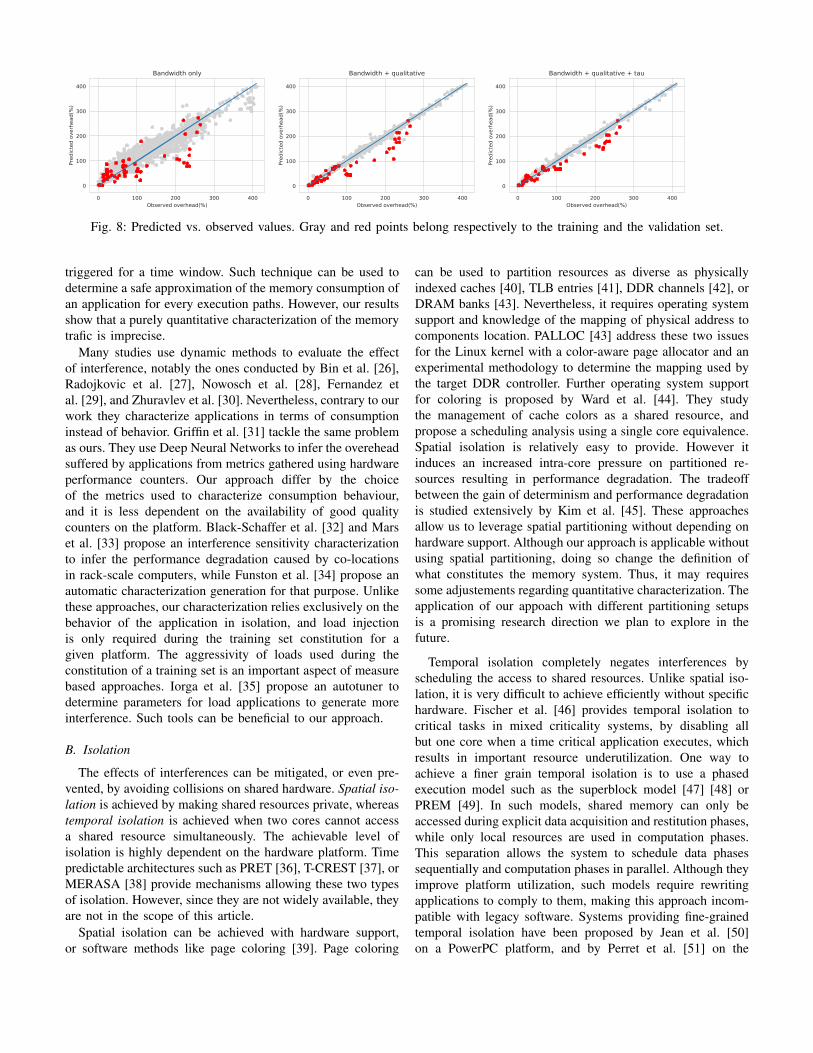
The prediction error per application and for the wholevalidation set is summarized in the Table III. There is a clearimprovement of prediction precision from the baseline for theBQ and the BQτ sets. This indicates the relevance of themetrics in the Q and the τ sets to characterize interference sen-sitivity, but also that our microbenchmarks offer a good cover-age of memory consumption nature and intensity. The greatestimprovements are observed for streamcluster-small,canneal-small, and canneal-medium. The effect ofthe τ impact factor is clearly more important on the MSEthan on the MAE, indicating that it reduces the range ofmispredictions. The gain of accuracy brought by the Q andthe τ sets is observable on the Figure 8 showing the predictedand the observed values of each test case.
V. RELATED WORK
We distinguish three families of approaches to tackle theproblem caused by memory interference. The first one con-sists in the extension of timing analysis techniques used todetermine the WCET of real-time applications. The secondone regroups the approaches aiming at improving the isolationof applications running on the same hardware in order to
TABLE III: Mean squared and absolute prediction error (MSEand MAE) per application and for the whole validation set
Prediction error metric MAE MSE
Application B BQ BQτ B BQ BQτ
adpcm-c-small 32.4 2.6 16.6 1052.9 6.8 276.5adpcm-c-large 40.5 5.8 13.2 1638.2 33.7 174.0adpcm-d-small 65.3 6.1 19.8 4257.7 37.8 392.5adpcm-d-large 63.0 6.0 19.7 3970.5 36.6 388.6
blackscholes-small 10.3 8.2 8.4 106.2 66.9 70.9blackscholes-medium 21.9 4.3 4.6 479.8 18.4 21.4
blackscholes-large 28.4 1.2 4.5 804.1 1.5 19.9bodytrack-small 47.9 25.8 17.6 3103.3 1424.3 581.6
bodytrack-medium 34.3 24.5 17.2 1546.4 1225.2 504.9bodytrack-large 25.9 22.5 15.2 837.1 1060.3 435.7
canneal-small 141.0 16.5 25.9 19872.2 271.5 669.3canneal-medium 158.0 22.2 32.8 24966.0 493.8 1073.9
fft-small 22.7 15.0 19.5 797.7 651.5 704.1fft-medium 29.0 18.0 16.8 1620.4 492.2 421.6
fft-large 20.0 11.3 9.4 769.3 311.3 216.6freqmine-small 34.2 32.6 28.0 2056.1 1818.3 1344.1
freqmine-medium 33.3 21.7 23.7 2221.9 923.2 1016.1freqmine-large 52.4 30.8 26.2 5241.8 2548.8 1416.9patricia-small 5.9 15.3 5.6 35.0 234.2 31.4patricia-large 6.8 14.6 9.7 45.7 212.0 94.9
qsort-large 52.3 68.2 43.1 2734.3 4644.5 1861.1rijndael-dec-small 6.3 2.7 2.8 39.9 7.3 8.1rijndael-dec-large 7.1 1.2 2.7 51.1 1.5 7.4rijndael-enc-small 2.5 6.8 3.3 6.0 46.8 10.7rijndael-enc-large 26.7 5.3 0.6 713.5 27.7 0.4
sha-small 7.9 0.2 11.4 61.7 0.0 130.4sha-large 11.0 9.4 19.3 120.0 88.7 370.9
streamcluster-small 95.7 43.9 40.5 11056.9 2332.2 2032.7
Validation set 37.4 21.7 18.8 2667.0 1093.7 681.6Error loss from B - 42.0% 49.9% - 59.0% 74.4%
avoid interference. Finally, the third family of approachesaim at managing the effect of interference to respect timingrequirements.
A. Timing analysis
Timing analysis is the step of real-time system design wherethe WCET of applications is determined. Interferences inmulti-core complicate timing analysis, as the WCET of anapplication does not only depend on itself but on the behaviorof its co-runners.
Static timing analysis as done on single-core systems [23]has proven to be hard to transpose on multi-core systems. Adetailed survey on the state of the art of multi-core timinganalysis has been done by Maiza et al. [1]. The applicationof static timing analysis requires a deep knowledge of theunderlying hardware platform, which is not always achiev-able with COTS hardware. For instance, Kim et al. [24]present a timing analysis that computes a bound of DRAMresponse time degradation based on information provided byJEDEC [18] documentation. While permitting to derive safebounds, this kind of work currently suffers several limitations.First, the derived overheads are usually very pessimistic.Second, some assumptions are usually made regarding thecompositionality [20] of the platform. In other words, theability to compute the overall delay from the delays sufferedby individual components of the application. On our platform,this result cannot be applied as it is invalidated by the behaviorof the MMDC. Oehlert et al. [25] use static analysis toextract event arrival functions giving the number of access
0 100 200 300 400Observed overhead(%)
0
100
200
300
400
Pred
icted
ove
rhea
d(%
)Bandwidth only
0 100 200 300 400Observed overhead(%)
0
100
200
300
400
Pred
icted
ove
rhea
d(%
)
Bandwidth + qualitative
0 100 200 300 400Observed overhead(%)
0
100
200
300
400
Pred
icted
ove
rhea
d(%
)
Bandwidth + qualitative + tau
Fig. 8: Predicted vs. observed values. Gray and red points belong respectively to the training and the validation set.
triggered for a time window. Such technique can be used todetermine a safe approximation of the memory consumption ofan application for every execution paths. However, our resultsshow that a purely quantitative characterization of the memorytrafic is imprecise.
Many studies use dynamic methods to evaluate the effectof interference, notably the ones conducted by Bin et al. [26],Radojkovic et al. [27], Nowosch et al. [28], Fernandez etal. [29], and Zhuravlev et al. [30]. Nevertheless, contrary to ourwork they characterize applications in terms of consumptioninstead of behavior. Griffin et al. [31] tackle the same problemas ours. They use Deep Neural Networks to infer the overeheadsuffered by applications from metrics gathered using hardwareperformance counters. Our approach differ by the choiceof the metrics used to characterize consumption behaviour,and it is less dependent on the availability of good qualitycounters on the platform. Black-Schaffer et al. [32] and Marset al. [33] propose an interference sensitivity characterizationto infer the performance degradation caused by co-locationsin rack-scale computers, while Funston et al. [34] propose anautomatic characterization generation for that purpose. Unlikethese approaches, our characterization relies exclusively on thebehavior of the application in isolation, and load injectionis only required during the training set constitution for agiven platform. The aggressivity of loads used during theconstitution of a training set is an important aspect of measurebased approaches. Iorga et al. [35] propose an autotuner todetermine parameters for load applications to generate moreinterference. Such tools can be beneficial to our approach.
B. Isolation
The effects of interferences can be mitigated, or even pre-vented, by avoiding collisions on shared hardware. Spatial iso-lation is achieved by making shared resources private, whereastemporal isolation is achieved when two cores cannot accessa shared resource simultaneously. The achievable level ofisolation is highly dependent on the hardware platform. Timepredictable architectures such as PRET [36], T-CREST [37], orMERASA [38] provide mechanisms allowing these two typesof isolation. However, since they are not widely available, theyare not in the scope of this article.
Spatial isolation can be achieved with hardware support,or software methods like page coloring [39]. Page coloring
can be used to partition resources as diverse as physicallyindexed caches [40], TLB entries [41], DDR channels [42], orDRAM banks [43]. Nevertheless, it requires operating systemsupport and knowledge of the mapping of physical address tocomponents location. PALLOC [43] address these two issuesfor the Linux kernel with a color-aware page allocator and anexperimental methodology to determine the mapping used bythe target DDR controller. Further operating system supportfor coloring is proposed by Ward et al. [44]. They studythe management of cache colors as a shared resource, andpropose a scheduling analysis using a single core equivalence.Spatial isolation is relatively easy to provide. However itinduces an increased intra-core pressure on partitioned re-sources resulting in performance degradation. The tradeoffbetween the gain of determinism and performance degradationis studied extensively by Kim et al. [45]. These approachesallow us to leverage spatial partitioning without depending onhardware support. Although our approach is applicable withoutusing spatial partitioning, doing so change the definition ofwhat constitutes the memory system. Thus, it may requiressome adjustements regarding quantitative characterization. Theapplication of our appoach with different partitioning setupsis a promising research direction we plan to explore in thefuture.
Temporal isolation completely negates interferences byscheduling the access to shared resources. Unlike spatial iso-lation, it is very difficult to achieve efficiently without specifichardware. Fischer et al. [46] provides temporal isolation tocritical tasks in mixed criticality systems, by disabling allbut one core when a time critical application executes, whichresults in important resource underutilization. One way toachieve a finer grain temporal isolation is to use a phasedexecution model such as the superblock model [47] [48] orPREM [49]. In such models, shared memory can only beaccessed during explicit data acquisition and restitution phases,while only local resources are used in computation phases.This separation allows the system to schedule data phasessequentially and computation phases in parallel. Although theyimprove platform utilization, such models require rewritingapplications to comply to them, making this approach incom-patible with legacy software. Systems providing fine-grainedtemporal isolation have been proposed by Jean et al. [50]on a PowerPC platform, and by Perret et al. [51] on the
Kalray MPPA-256 platform, although these implementationsrely on platform-specific features. Our approach could beused to improve the performance of this kind of approachby determining the sensitive phases for which strict temporalisolation should be enforced and insensitive one that do notrequire this level of protection against interference.
C. Interference regulation
Regulation systems [52] can be seen as a relaxed form oftemporal isolation. Instead of avoiding interference at all cost,a regulation system manages resources so that time-criticalapplications fulfill their deadline requirements. This kind ofapproach is well suited for mixed criticality systems, wherethey can be used to protect real-time applications from theinterference caused by non-critical applications.
Kritikakou et al. propose a distributed WCET con-troller [53] [54] to that end. In this approach, the code ofreal-time applications is instrumented with observation pointsin charge of tracking application progress. If an observationpoint detects an unacceptable slowdown in the applicationprogress, it sends a request to a distributed WCET controllerto suspend non-critical tasks. The main difficulty to applythis method is the placement of observation points, althoughwe believe our approach could provide some assistance forthat task. Indeed, our high resolution profile format allowsto clearly distinguish applications phases, hence to identifyzone of interests in applications code. Moreover, the clearlydistinctive visual pattern opens the possibility to use computervision techniques to automate applications splitting.
An alternative approach is proposed by Blin et al. [3] tokeep under a specified threshold the slowdown caused bybest efforts application to a real-time one. In this approach,an interference model of the hardware platform is built usingmeasures. The model associates a local and a global bandwidthto the worst observed overhead suffered by an applicationconsuming the local bandwidth in isolation when the globalbandwidth is observed. Knowing the consumption of the real-time application, a run-time control system periodically use theinterference model to infer the delay the application suffers,and suspend best effort tasks when the cumulated overheadreaches a threshold specified by the system designer. Ourapproach can be directly beneficial to this approach as itconsists in generating accurate interference model. However,some extensions are required to predict the overhead sufferedunder a specific system load.
Memguard [2] is a bandwidth regulator. Each core has amemory access budget. Hardware performance counters areused to track the number of memory access made by eachcore. When an application spends all its access budget, aninterruption is raised and the task is suspended until the nextregulation period. The level of interference is managed bykeeping the overall bandwidth below a threshold, resultingin hardware resource underutilization. Our approach could beused to account the sensitivity of applications in a workloadand adjust the guaranteed bandwidth thresholds accordingly inorder to improve platform utilization.
VI. CONCLUSION AND FUTURE WORK
In this article, we have presented an experimental approachto characterize relevant aspects of the memory consumptionto their sensitivity to memory interferences. We have intro-duced a set of microbenchmarks allowing us to reproducea wide range of memory consumptions, both in nature andintensity, at a sufficiently large scale to use machine learningtechniques. We have put in evidence the lack of precision of apurely quantitative characterization of memory consumption.In response, we have defined qualitative metrics quantifyingthe type of accesses, their interleaving, locality, or their impacton application progress. We have developed a tool to measurethose aspects that also capture high resolution profiles allowingus to clearly identify distinct consumption behaviors in an ap-plication. Finally, we have used our microbenchmarks and ourcharacterization to infer the overhead suffered by applicationsof the MIBENCH and the PARSEC suites. Results show asignificant improvement of quality prediction compared to apurely quantitative characterization, showing the relevance ofour metrics and the representativity of our microbenchmarks.
In the future, we will explore several directions to improvethis work. The first direction we want to explore is to use ourapproach to evaluate more hardware platforms. The second oneis to build a set of conservative predictor that does not allowunderestimations. This can involve the development of specificinference algorithms or new interference models incorporatingour characterization. The third direction is to widen the scopeof consumption behavior covered by our microbenchmarksand to find new relevant metrics. Finally, the last direction wewant to explore is the automation of measure points placement,using computer vision techniques and code analysis.
ACKNOWLEDGEMENTS
We would like to offer special thanks to our colleaguesRedha Gouicem and Damien Carver for their precious help inthe improvement of this manuscript.
REFERENCES
[1] C. Maiza, H. Rihani, J. M. Rivas, J. Goossens, S. Altmeyer, and R. I.Davis, “A survey of timing verification techniques for multi-core real-time systems,” 2018.
[2] H. Yun, G. Yao, R. Pellizzoni, M. Caccamo, and L. Sha, “Memguard:Memory bandwidth reservation system for efficient performance isola-tion in multi-core platforms,” in Real-Time and Embedded Technologyand Applications Symposium (RTAS), 2013 IEEE 19th. IEEE, 2013,pp. 55–64.
[3] A. Blin, C. Courtaud, J. Sopena, J. Lawall, and G. Muller, “Maximizingparallelism without exploding deadlines in a mixed criticality embeddedsystem,” in Real-Time Systems (ECRTS), 2016 28th Euromicro Confer-ence on. IEEE, 2016, pp. 109–119.
[4] N. Nethercote and J. Seward, “Valgrind: a framework for heavyweightdynamic binary instrumentation,” in ACM Sigplan notices, vol. 42, no. 6.ACM, 2007, pp. 89–100.
[5] L. Breiman, “Random forests,” Machine learning, vol. 45, no. 1, pp.5–32, 2001.
[6] Sabre board for smart devices based on the i.mx6quad applications processors. [Online]. Available:https://www.nxp.com/support/developer-resources/evaluation-and-development-boards/sabre-development-system/sabre-board-for-smart-devices-based-on-the-i.mx-6quad-applications-processors:RD-IMX6Q-SABRE
[7] C. Bienia, S. Kumar, J. P. Singh, and K. Li, “The parsec benchmark suite:Characterization and architectural implications,” in Proceedings of the17th international conference on Parallel architectures and compilationtechniques. ACM, 2008, pp. 72–81.
[8] J. D. McCalpin, “Memory bandwidth and machine balance in currenthigh performance computers,” IEEE Computer Society Technical Com-mittee on Computer Architecture (TCCA) Newsletter, pp. 19–25, Dec.1995.
[9] i.MX 6Dual/6Quad Applications Processor Reference Manual, p.204-205.
[10] PL310 Cache Controller Technical Reference Manual, p.327-328.[11] P. K. Valsan, H. Yun, and F. Farshchi, “Taming non-blocking caches to
improve isolation in multicore real-time systems,” in 2016 IEEE Real-Time and Embedded Technology and Applications Symposium (RTAS).IEEE, 2016, pp. 1–12.
[12] i.MX 6Dual/6Quad Applications Processor Reference Manual, p.3852.[13] The yocto project. [Online]. Available: https://www.yoctoproject.org[14] Technical details of preempt rt patch. [Online]. Available: https://wiki.
linuxfoundation.org/realtime/documentation/technical\ details/start[15] J. M. Calandrino, H. Leontyev, A. Block, U. C. Devi, and J. H.
Anderson, “Litmusˆ rt: A testbed for empirically comparing real-timemultiprocessor schedulers,” in 2006 27th IEEE International Real-TimeSystems Symposium (RTSS’06). IEEE, 2006, pp. 111–126.
[16] “Scheduling - rt throttling,” https://wiki.linuxfoundation.org/realtime/documentation/technical\ basics/sched\ rt\ throttling.
[17] i.MX 6Dual/6Quad Applications Processor Reference Manual, p.3834-3835.
[18] JEDEC, “Specification, ddr3 sdram,” 2010.[19] C. E. Shannon, “A mathematical theory of communication,” Bell system
technical journal, vol. 27, no. 3, pp. 379–423, 1948.[20] S. Hahn, J. Reineke, and R. Wilhelm, “Towards compositionality in
execution time analysis: definition and challenges,” ACM SIGBEDReview, vol. 12, no. 1, pp. 28–36, 2015.
[21] F. Pedregosa, G. Varoquaux, A. Gramfort, V. Michel, B. Thirion,O. Grisel, M. Blondel, P. Prettenhofer, R. Weiss, V. Dubourg, J. Vander-plas, A. Passos, D. Cournapeau, M. Brucher, M. Perrot, and E. Duch-esnay, “Scikit-learn: Machine learning in Python,” Journal of MachineLearning Research, vol. 12, pp. 2825–2830, 2011.
[22] M. R. Guthaus, J. S. Ringenberg, D. Ernst, T. M. Austin, T. Mudge,and R. B. Brown, “Mibench: A free, commercially representativeembedded benchmark suite,” in Proceedings of the fourth annual IEEEinternational workshop on workload characterization. WWC-4 (Cat. No.01EX538). IEEE, 2001, pp. 3–14.
[23] R. Wilhelm, J. Engblom, A. Ermedahl, N. Holsti, S. Thesing, D. Whal-ley, G. Bernat, C. Ferdinand, R. Heckmann, T. Mitra et al., “Theworst-case execution-time problem—overview of methods and surveyof tools,” ACM Transactions on Embedded Computing Systems (TECS),vol. 7, no. 3, p. 36, 2008.
[24] H. Kim, D. De Niz, B. Andersson, M. Klein, O. Mutlu, and R. Ra-jkumar, “Bounding memory interference delay in cots-based multi-coresystems,” in Real-Time and Embedded Technology and ApplicationsSymposium (RTAS), 2014 IEEE 20th. IEEE, 2014, pp. 145–154.
[25] D. Oehlert, S. Saidi, and H. Falk, “Compiler-based extraction of eventarrival functions for real-time systems analysis,” in 30th EuromicroConference on Real-Time Systems (ECRTS 2018). Schloss Dagstuhl-Leibniz-Zentrum fuer Informatik, 2018.
[26] J. Bin, S. Girbal, D. G. Perez, A. Grasset, and A. Merigot, “Studying co-running avionic real-time applications on multi-core cots architectures,”in Embedded Real Time Software and Systems conference, vol. 15, 2014.
[27] P. Radojkovic, S. Girbal, A. Grasset, E. Quinones, S. Yehia, andF. J. Cazorla, “On the evaluation of the impact of shared resourcesin multithreaded cots processors in time-critical environments,” ACMTransactions on Architecture and Code Optimization (TACO), vol. 8,no. 4, p. 34, 2012.
[28] J. Nowotsch and M. Paulitsch, “Leveraging multi-core computing archi-tectures in avionics,” in 2012 Ninth European Dependable ComputingConference, May 2012, pp. 132–143.
[29] M. Fernandez, R. Gioiosa, E. Quinones, L. Fossati, M. Zulianello, andF. J. Cazorla, “Assessing the suitability of the ngmp multi-core processorin the space domain,” in Proceedings of the tenth ACM internationalconference on Embedded software. ACM, 2012, pp. 175–184.
[30] S. Zhuravlev, S. Blagodurov, and A. Fedorova, “Addressing sharedresource contention in multicore processors via scheduling,” in ACMSigplan Notices, vol. 45, no. 3. ACM, 2010, pp. 129–142.
[31] D. Griffin, B. Lesage, I. Bate, F. Soboczenski, and R. I. Davis, “Forecast-based interference: modelling multicore interference from observablefactors,” in Proceedings of the 25th International Conference on Real-Time Networks and Systems. ACM, 2017, pp. 198–207.
[32] D. Black-Schaffer, N. Nikoleris, E. Hagersten, and D. Eklov, “Band-width bandit: Quantitative characterization of memory contention,” inProceedings of the 2013 IEEE/ACM International Symposium on CodeGeneration and Optimization (CGO). IEEE Computer Society, 2013,pp. 1–10.
[33] J. Mars, L. Tang, R. Hundt, K. Skadron, and M. L. Soffa, “Bubble-up: Increasing utilization in modern warehouse scale computers viasensible co-locations,” in Proceedings of the 44th annual IEEE/ACMInternational Symposium on Microarchitecture. ACM, 2011, pp. 248–259.
[34] J. Funston, M. Lorrillere, A. Fedorova, B. Lepers, D. Vengerov,J.-P. Lozi, and V. Quema, “Placement of virtual containers onNUMA systems: A practical and comprehensive model,” in 2018USENIX Annual Technical Conference (USENIX ATC 18). Boston,MA: USENIX Association, 2018, pp. 281–294. [Online]. Available:https://www.usenix.org/conference/atc18/presentation/funston
[35] D. Iorga, T. Sorensen, and A. F. Donaldson, “Do your cores play nicely?a portable framework for multi-core interference tuning and analysis,”arXiv preprint arXiv:1809.05197, 2018.
[36] I. Liu, J. Reineke, and E. A. Lee, “A pret architecture supporting concur-rent programs with composable timing properties,” in 2010 ConferenceRecord of the Forty Fourth Asilomar Conference on Signals, Systemsand Computers, Nov 2010, pp. 2111–2115.
[37] M. Schoeberl, S. Abbaspour, B. Akesson, N. Audsley, R. Capasso,J. Garside, K. Goossens, S. Goossens, S. Hansen, R. Heckmann et al.,“T-crest: Time-predictable multi-core architecture for embedded sys-tems,” Journal of Systems Architecture, vol. 61, no. 9, pp. 449–471,2015.
[38] T. Ungerer, F. Cazorla, P. Sainrat, G. Bernat, Z. Petrov, C. Rochange,E. Quinones, M. Gerdes, M. Paolieri, J. Wolf et al., “Merasa: Multicoreexecution of hard real-time applications supporting analyzability,” IEEEMicro, vol. 30, no. 5, pp. 66–75, 2010.
[39] R. E. Kessler and M. D. Hill, “Page placement algorithms for largereal-indexed caches,” ACM Transactions on Computer Systems (TOCS),vol. 10, no. 4, pp. 338–359, 1992.
[40] R. Mancuso, R. Dudko, E. Betti, M. Cesati, M. Caccamo, and R. Pel-lizzoni, “Real-time cache management framework for multi-core archi-tectures,” in 2013 IEEE 19th Real-Time and Embedded Technology andApplications Symposium (RTAS). IEEE, 2013, pp. 45–54.
[41] S. A. Panchamukhi and F. Mueller, “Providing task isolation via TLBcoloring,” in 21st IEEE Real-Time and Embedded Technology andApplications Symposium, 2015, pp. 3–13.
[42] S. P. Muralidhara, L. Subramanian, O. Mutlu, M. Kandemir,and T. Moscibroda, “Reducing Memory Interference in MulticoreSystems via Application-aware Memory Channel Partitioning,” inProceedings of the 44th Annual IEEE/ACM International Symposiumon Microarchitecture, ser. MICRO-44. New York, NY, USA: ACM,2011, pp. 374–385, event-place: Porto Alegre, Brazil. [Online].Available: http://doi.acm.org/10.1145/2155620.2155664
[43] H. Yun, R. Mancuso, Z.-P. Wu, and R. Pellizzoni, “Palloc: Drambank-aware memory allocator for performance isolation on multicoreplatforms,” in Real-Time and Embedded Technology and ApplicationsSymposium (RTAS), 2014 IEEE 20th. IEEE, 2014, pp. 155–166.
[44] B. C. Ward, J. L. Herman, C. J. Kenna, and J. H. Anderson, “Outstandingpaper award: Making shared caches more predictable on multicoreplatforms,” in 2013 25th Euromicro Conference on Real-Time Systems.IEEE, 2013, pp. 157–167.
[45] N. Kim, B. C. Ward, M. Chisholm, J. H. Anderson, and F. D. Smith,“Attacking the one-out-of-m multicore problem by combining hardwaremanagement with mixed-criticality provisioning,” Real-Time Systems,vol. 53, no. 5, pp. 709–759, 2017.
[46] S. Fisher, “Certifying applications in a multi-core environment: Theworld’s first multi-core certification to sil 4,” SYSGO white paper, 2013.
[47] G. Durrieu, M. Faugere, S. Girbal, D. Gracia Perez, C. Pagetti, andW. Puffitsch, “Predictable flight management system implementation ona multicore processor,” in Embedded Real Time Software (ERTS’14),2014.
[48] A. Schranzhofer, R. Pellizzoni, J.-J. Chen, L. Thiele, and M. Caccamo,“Timing analysis for resource access interference on adaptive resource
arbiters,” in 2011 17th IEEE Real-Time and Embedded Technology andApplications Symposium. IEEE, 2011, pp. 213–222.
[49] R. Pellizzoni, E. Betti, S. Bak, G. Yao, J. Criswell, M. Caccamo, andR. Kegley, “A predictable execution model for cots-based embeddedsystems,” in 2011 17th IEEE Real-Time and Embedded Technology andApplications Symposium. IEEE, 2011, pp. 269–279.
[50] X. Jean, “Hypervisor control of cots multicores processors in order toenforce determinism for future avionics equipment,” Ph.D. dissertation,PhD Thesis, Telecom ParisTech, 2015.
[51] Q. Perret, P. Maurere, E. Noulard, C. Pagetti, P. Sainrat, and B. Tri-quet, “Temporal isolation of hard real-time applications on many-coreprocessors,” in 2016 IEEE Real-Time and Embedded Technology andApplications Symposium (RTAS), April 2016, pp. 1–11.
[52] S. Girbal, X. Jean, J. Le Rhun, D. G. Perez, and M. Gatti, “Deterministicplatform software for hard real-time systems using multi-core cots,” inDigital Avionics Systems Conference (DASC), 2015 IEEE/AIAA 34th.IEEE, 2015, pp. 8D4–1.
[53] A. Kritikakou, C. Pagetti, O. Baldellon, M. Roy, and C. Rochange, “Run-time control to increase task parallelism in mixed-critical systems,” in2014 26th Euromicro Conference on Real-Time Systems. IEEE, 2014,pp. 119–128.
[54] A. Kritikakou, C. Rochange, M. Faugere, C. Pagetti, M. Roy, S. Girbal,and D. G. Perez, “Distributed run-time wcet controller for concurrentcritical tasks in mixed-critical systems,” in Proceedings of the 22ndInternational Conference on Real-Time Networks and Systems. ACM,2014, p. 139.