improving state school finance systems: new realities ... · improving state school finance systems...
TRANSCRIPT
Improving State School Finance Systems: New Realities Create Need to Re-Engineer
School Finance Structures Allan Odden CPRE Occasional Paper Series OP-04 Consortium for Policy Research in Education University of Pennsylvania Graduate School of Education
8 Copyright 1999 by the Allan Odden and the Consortium for Policy Research in Education

IMPROVING STATE SCHOOL FINANCE SYSTEMS Odden Contents List of Tables ..................................................................................................................................v Biography..................................................................................................................................... vii Acknowledgments ....................................................................................................................... vii Executive Summary ..................................................................................................................... ix Introduction....................................................................................................................................1 Traditional School Finance ...........................................................................................................2
The New Nature of School Finance Differences and Why Traditional GTB Programs Are Inadequate....................................................................................................6
The New School Finance .............................................................................................................10
Determining an Adequate Spending Level.........................................................................12 Simulating the Results of Providing an Adequate Fiscal Base..........................................14 Adjustments for Special Needs...........................................................................................21 An Econometric Approach .................................................................................................24 Summary ............................................................................................................................25
Additional Elements to Spur High Performance ......................................................................25
Move to More School-Based Financing ............................................................................26 Reinvent Teacher Compensation .......................................................................................27 Provide School-Based Performance Incentives.................................................................28
Re-Conceptualize School Finance Adequacy as a National Issue ...........................................29 References .....................................................................................................................................31 Appendix A: Status of School Finance in a Western State, 1996-97 .......................................39 Appendix B: Status of School Finance in a Midwestern State, 1996-97 .................................41 End Notes ......................................................................................................................................43 CPRE Occasional Paper Series, OP-04 iii
IMPROVING STATE SCHOOL FINANCE SYSTEMS Odden
CPRE Occasional Paper Series, OP-04 iv

IMPROVING STATE SCHOOL FINANCE SYSTEMS Odden List of Tables Table 1: Status of School Finance in a Northeastern State, Late 1970s .........................................3 Table 2: Status of School Finance in a Northeastern State, Late 1970s with a GTB at
$135,000 ..............................................................................................................................5 Table 3: School Finance in State A, 1994-95, K-12 Districts ........................................................7 Table 4: School Finance in State B, 1994-95, K-12 Districts ........................................................8 Table 5: School Finance in State C, 1994-95, K-12 Districts ........................................................9 Table 6: Simulated Results of a Foundation Program in State A, 1994-95 .................................15 Table 7: Simulated Results of a Foundation Program in State B, 1994-95 .................................16 Table 8: Simulated Results of a Foundation Program in State C, 1994-95 .................................17 Table 9: Simulated Results of a Foundation Program with a 90/90 Second Tier GTB in
State A, 1994-95 ................................................................................................................18 Table 10: Simulated Results of a Foundation Program with a 90/90 Second Tier GTB in
State B, 1994-95 ................................................................................................................19 Table 11: Simulated Results of a Foundation Program with a 90/90 Second Tier GTB in
State C, 1994-95 ...............................................................................................................20 Table 12: Costs Above an AAdequate@ Foundation Expenditure Base of a 90/90 GTB Versus
an Extra $1,000 for Each Free/Reduced Price Lunch Student .........................................22 CPRE Occasional Paper Series, OP-04 v

IMPROVING STATE SCHOOL FINANCE SYSTEMS Odden
CPRE Occasional Paper Series, OP-04 vi

IMPROVING STATE SCHOOL FINANCE SYSTEMS Odden Biography Allan Odden, CPRE=s Co-Director for the School Finance Program Area, is Professor of Educational Administration in the School of Education at the University of Wisconsin-Madison. Odden is one of the nation=s pre-eminent school finance experts. He is also a national expert in education policy, school-based management, and teacher compensation. He co-directed CPRE=s Finance Center from 1990-1996. Previously, Odden was a professor in the University of Southern California=s School of Education. His most recent books include Education Policy Implementation (1992), School Finance: A Policy Perspective (1992, with Lawrence O. Picus), Rethinking School Finance: An Agenda for the 1990s (1992), Educational Leadership for America=s Schools (1995, with Eleanor Odden), Paying Teachers for What They Know and Do (1997, with Carolyn Kelley), and Financing Schools for High Performance: Strategies for Improving the Use of Educational Resources (1998, with Carolyn Busch). Acknowledgments The research reported in this report was supported by a grant (No. OERI-R308A60003) to the Consortium for Policy Research in Education from the National Institute on Educational Governance, Finance, Policymaking and Management, Office of Educational Research and Improvement, U.S. Department of Education and the Wisconsin Center for Education Research, School of Education, University of Wisconsin-Madison. Opinions expressed in this report are those of the author and do not necessarily reflect the views of the National Institute on Educational Governance, Finance, Policymaking and Management; the Office of Educational Research and Improvement; the U.S. Department of Education; the institutional partners of CPRE; or the Wisconsin Center for Education Research.
CPRE Occasional Paper Series, OP-04 vii

IMPROVING STATE SCHOOL FINANCE SYSTEMS Odden
CPRE Occasional Paper Series, OP-04 viii
IMPROVING STATE SCHOOL FINANCE SYSTEMS Odden Executive Summary School finance is at a crossroads. The traditional focus on fiscal disparities across school districts within a state might no longer be the most salient school finance issue in an era in which the primary education goal nationally and within every state is to teach students well enough to meet new rigorous performance standards. First, the focus on spending differences across districts is only about money. Yes, extensive differences caused largely by widely varying property tax bases across districts have been unfair historically. But school finance programs designed to remedy this tax base problem have not been very efficient in reducing spending differences, nor in reducing the linkages between spending and wealth. Indeed, in many states today that have new school finance programs, there are still significant spending differences and those differences are still strongly tied to local wealth. Further, the potential for new school finance programs to raise spending in many low-wealth districts often has been passed over by those districts in favor of low school tax rates instead. In short, the traditional strategies for reducing spending differences across districts caused by variations in the local tax base have not worked very well. Further, such a policy focus, at best, addresses issues of fiscal fairness, but it does not address the more substantive issues of student performance and how to use resources more effectively to boost student achievement. Given that the driving education goal across the country is to teach students to high standards, the new focus of school finance
should be on this agenda. The goal should be first to determine a spending base that is Aadequate@ to fiscally support an education program that can teach the average student to those standards, and second, it should determine how to use those resources to produce results. This suggests a foundation type of school finance program. Because some students require more services to reach those standards, the foundation base should be augmented by an extra amount of money for at least three major categories of studentsCthose from low-income backgrounds, the disabled, and those who need to learn English. Research shows that an extra $1,000 for each student from a low-income background is about the level needed for that category of student. Research also shows that it costs about an extra 130 percent to serve all disabled students. Additional research needs to be conducted to determine appropriate augmentations for non-English speaking students. All dollar figures should be adjusted by an education price index to ensure equal purchasing power of the education dollar. In short, the new type of school finance structure that aligns the finance system with the policy system goal of teaching students to ambitious proficiency standards would consist of five elements: $ A base spending level that would be
considered Aadequate@ for the average child;
CPRE Occasional Paper Series, OP-04 ix

IMPROVING STATE SCHOOL FINANCE SYSTEMS Odden $ An extra amount of money for each
child from a low-income background, approx-imately $1,000 in a combination of federal Title I and state compensatory education dollars;
$ An extra 130 percent for each disabled
student; $ An extra amount for each student who
needs to learn English; and $ A price adjustment for all dollar figures
to ensure comparable spending power. Alternatively, the structure could include just a foundation level and an overall Acost@ adjustment that would reflect varying student needs, education prices, scale economies or diseconomies, and efficiency. But, additional economic research is needed to implement with confidence such a holistic cost-adjustment approach. Although the foundation base level of spending might be approximated by the median spending level in many states, in many other statesCparticularly those in the South and WestCthe median would be insufficient. Preliminary research suggests that the national median is the lowest level of current spending that would approximate an Aadequate@ spending level. Thus, the foundation base might be set at the national or state median, whichever is higher. Implementing this approach, however, would require a new federal role in school finance; one that is focused on those states that cannot or do not now provide a level of fiscal resources for education that would allow their schools to select and implement a school-wide strategy robust enough to
teach their students to high and rigorous performance standards. On top of these foundation elements, school finance systems could be strengthened by performance enhancement elements. Three major elements are suggested: $ Providing school sites with substantial
control over their resources so they can reallocate funds to the needs of more effective, higher-performing school strategies;
$ Changing teacher compensation to
provide salary increases for the knowledge, skills, and competencies teachers need to teach a more rigorous curriculum and to engage in the required school restructuring and resource reallocation actions; and
$ Using school-based performance
incentives that provide monetary rewards for schools that consistently improve student achievement from one year to the next.
In sum, school finance systems are aging and in need of change. The traditional focus on fiscal equity needs to give way to the issue of adequacy, and education programs and finance systems need to be re-engineered to contain strategies that allow and stimulate schools to teach students to high standards. Though the details of all elements of such a strategy are not completely known, many are, and states should move as quickly as possible to design and implement these new and more effective approaches to school finance structures.
CPRE Occasional Paper Series, OP-04 x
IMPROVING STATE SCHOOL FINANCE SYSTEMS Odden
Introduction
In a recent article on state school finance systems, CPRE researchers Allan Odden and William Clune (1998) argue that state school finance systems are Aaging structures in need of renovation.@ They identify and discuss several reasons for that assertionCprimarily, the ineffectiveness of such systems for improving fiscal equity across districts over the past several decadesCand they make several concrete suggestions for how such systems could be strengthened. They also argue that state school finance structures are not aligned with current standards- and school-based education reforms, particularly reforms that focus on teaching students to high standards. Odden and Clune address the need for performance incentives and recommend three key programs. In parallel lines of analyses, several economists new to school finance issues also identified the faults of state school finance systems (Downes & Pogue, 1994; Duncombe, Ruggiero & Yinger, 1996; Ladd & Yinger, 1994; Ruggiero, 1996). Responding to these critiques, CPRE economist Andrew Reschovsky has been researching various remedies to school finance problems from these perspectives (Reschovsky, 1996; Imazeki & Reschovsky, 1998). In short, state school finance systems are coming Aunder attack,@ not just because they are failing to do the job for which they were created, but because these old systems
are inadequate both for current finance problems and for the ambitious education and education finance challenges that states face at the dawn of the 21st century. This paper elaborates on these latter inadequacies and recommends short-term changes that states can make to their school funding structures in order to accommodate the more fundamental and long-term changes proposed by Odden, Clune, and Reschovsky. The paper is divided into four sections. The first shows how the nature of school finance inequities has changed dramatically in several states and demonstrates how the solutions of standard school finance formulas in such contexts actually exacerbate fiscal disparities. This section suggests that fiscal inequities, which have been the focus of school finance policy throughout this decade, have become a somewhat dated policy problem in school finance. The second section of this paper argues that a new Adriving problem@ must structure a discussion of school finance policy in the future, and it proposes that this Aproblem@ rests in determining the level of funding needed to teach both average and special needs students to high standards. It then demonstrates how school finance structures could be re-engineered to accomplish this goal, thus shifting school finance policy analysis away from fiscal equity and toward educational adequacy.
Section three discusses several elements of a new school finance system that could be created to enhance the performance of schools: getting lump sum budgets to school
sites (strategies that also would position the system to fund public school choice, charter schools, contracts, and other school-based policy initiatives); changing teacher
CPRE Occasional Paper Series, OP-04 xi

IMPROVING STATE SCHOOL FINANCE SYSTEMS Odden compensation to connect directly with actual measures of knowledge and skills (rather than education units, degrees, and seniority); and using school-based performance incentives. Because teaching students to high, common standards is a national education goal, the last section of this paper also raises the issue of school financing from a national perspective and shows anew why the focus on within-state education finance policy may no longer be appropriate given the evolving national goal of teaching students to common standards. This section outlines why a new federal role in school finance might be needed to ensure that all schools have an adequate level of funds to educate their students to high performance standards. Traditional School Finance Academic and policy conversations about school finance inequities today and in the past have generally focused on traditional issues. The traditional Aproblem@ was that base spending per pupilCthat is, spending exclusive of resources for special student needs and/or price differences across districtsCvaried substantially across districts. The disparities in base spending per pupil did not stem from differences in local tax efforts or from local support for education, but from large differences in the property tax base per pupil. In designing locally administered school systems, states generally gave local governments the authority to raise money for schools by levying property taxes. But when states determined school district
boundaries, districts ended up with widely varying levels of property wealth per pupil and thus large differences in the ability to raise local dollars to support public education. Districts with above-average property tax bases per pupil traditionally were able to spend at above-average levels with below-average tax rates, while districts with below-average tax bases spent at below-average levels even with above-average tax rates. School finance policy debates throughout the twentieth century, including most school finance texts (see, for example, Guthrie, Garms, & Pierce, 1988; Odden & Picus, 1992, Chapter 1; Swanson & King, 1997) and most court cases (Underwood, 1995), focused on these types of fiscal inequities. To be sure, some individuals pointed to spending differences per se, regardless of whether they were related to varying tax bases, and argued that they should be impermissible in a state education system (Wise, 1968). But the bulk of discussion centered on the links between spending differences and local property wealth per pupil (see also Coons, Clune, & Sugarman, 1970). Table 1 is an example of these phenomena. These data reflect the school finance situation of school districts in a northeastern state around 1978. The data are organized by Adeciles@ with decile 1 being the poorest or lowest category in property wealth per pupil and decile 10 being the wealthiest. (There are different numbers of districts but approximately equal numbers of students in each decile.) Property wealth per pupil varied by a factor of almost 10-to-1 between the poorest and richest deciles. More
CPRE Occasional Paper Series, OP-04 2

IMPROVING STATE SCHOOL FINANCE SYSTEMS Odden important, tax rates also varied by decile, but the highest tax rates were in the poorest deciles and the lowest tax rates were in the highest deciles. Indeed, the inverse
CPRE Occasional Paper Series, OP-04 3

IMPROVING STATE SCHOOL FINANCE SYSTEMS Odden
Table 1 Status of School Finance in a Northeastern State, Late 1970s
Decile
Revenues (per pupil)
Assessed
Value Per Pupil (at market
value)
Local Property
Tax Rate (percent)
State Aid
(per pupil)
1
$2,094
$36,670
3.04
$978
2
2,215
46,845
2.83
888
3
2,277
55,203
2.69
794
4
2,281
64,875
2.56
620
5
2,322
71,762
2.44
572
6
2,405
81,913
2.35
477
7
2,601
92,949
2.33
437
8
2,718
106,195
2.17
411
9
3,033
135,496
1.95
388
10
3,593
306,766
1.05
366
Horizontal Equity
Coefficient of Variation: 12.3 McLoone Index: 0.96
Fiscal Neutrality Correlation: 0.97 Wealth Elasticity: 0.20
Source: CPRE analysis of state data.
relationship between tax rate and local property wealth per pupil was very consistentCthe higher the property wealth per pupil, the lower the tax rate. As a result, spending per pupil also varied substantially. State aid only modestly offset the large property-wealth advantages. The spending differences reflected a direct relationship with property wealth per
pupilCthe higher the property wealth per pupil, the higher the spending despite the fact that the tax rates were lower. In statistical terms, the coefficient of variation of spending per pupil was 12.3 percent and the McLoone Index was 0.96. The correlation between spending and wealth was high at 0.97, with an equally high elasticity of 0.2.
This example shows the inherent inequity of traditional school finance systems. The data
CPRE Occasional Paper Series, OP-04 4

IMPROVING STATE SCHOOL FINANCE SYSTEMS Odden reflect the school finance reality in most states for most of the twentieth century. Spending per pupil varied significantly, was inversely linked to tax effort, and was strongly linked to the size of the local property tax base per pupil. The system was structurally unfair. Low property-wealth districts were doubly disadvantagedCthey not only had high tax rates but also had low education expenditures and a lower quality education program. High property-wealth districts were doubly advantagedCthey had both low tax rates and high education expenditures and, in most cases, a higher quality and more attractive education program. Although the strength of the connection between spending and education quality was debated, most policymakers and policy analysts admitted some connection and viewed the overall structure as unfair. The underlying problem was seen as the inequality of property wealth per pupil. The way to remedy the problem was to make the ability to raise funds for schools more equal across districts. In school finance parlance, the solution was to enact a guaranteed tax base (GTB) or Adistrict power equalizing@ program, i.e., a program that guaranteed to all or nearly all districtsCrich or poorC some high-level tax base. Such a program would allow local districts to tap the same size tax base and, by setting a tax rate, to determine the level of spending. In this way, districts could determine for themselves the quality level of the local education program, rather than being constrained by the circumstance of being a low-wealth district. The tax rate would be applied to the statewide GTB so the same amount of money per pupil would be raised from state and local sources for both poor and rich
districts, i.e., for all districts with a local tax base equal to or less than the GTB. In such a program, higher spending per pupil would require a higher tax rate. Thus, differences in education spending per pupil might remain, but spending differences would result from varying tax rates, reflecting differing levels of commitment to education; these differ-ences would not be caused by the unequal distribution of the local tax base. Most analysts suggested that the GTB should be set at a very high level, say the average of Decile 9 or $135,000 (see Table 1). This would allow all districts below that level of wealth to spend at a level of $3,375 if they levied the average tax rate of 2.5 percent (2.5 percent times $135,000). Such a program would allow poor districtsC districts with a low level of property wealth per pupilCnot only to reduce their local tax rates but also to substantially raise their education spending! Conceptually, such a program would provide property tax relief to the higher taxing poor districts and also allow those districts to raise education spending. In short, a high-level GTB school finance program would remedy the core problem of school financeCthe unequal distribution of the local property tax base. Statistically, the anticipated results are reflected in Table 2, the simulated impact of a GTB at $135,000. The results show that spending is more related to tax rates than to property wealth per pupil. Spending disparities dropped, with the coefficient of variation declining from 12.3 percent to 4.7 percent and the McLoone Index rising from 0.959 to 0.964. In terms of the connection between spending and wealth, the simulated
CPRE Occasional Paper Series, OP-04 5

IMPROVING STATE SCHOOL FINANCE SYSTEMS Odden GTB program decreased the correlation
Table 2
Status of School Finance in a Northeastern State, Late 1970s with a GTB at $135,000
Decile
Revenues (per pupil)
Assessed Value
Per Pupil (at market
value)
Local Property
Tax Rate (percent)
State Aid
(per pupil)
1
$3,101
$36,670
2.30
$2,259
2
3,020
46,845
2.24
1,972
3
2,951
55,203
2.19
1,745
4
2,869
64,875
2.13
1,490
5
2,807
71,762
2.08
1,315
6
2,792
81,913
2.07
1,098
7
2,872
92,949
2.13
895
8
2,825
106,195
2.09
603
9
3,033
135,496
2.24
0
10
3,593
306,766
1.17
0
Horizontal Equity
Coefficient of Variation: 0.047 McLoone Index: 0.96
Fiscal Neutrality Correlation: 0.28 Wealth Elasticity: 0.02
Source: CPRE analysis of state data.
coefficient from 0.97 to 0.28 and reduced the wealth elasticity from 0.20 to 0.02. These simulated impacts are similar to other empirical research on the short-term impacts
of school finance reform in the late 1970s (Odden, Berne, & Stiefel, 1979).
Yet, even for the traditional school finance situation, some argued for just a foundation type of school finance program under the rationale that the state fiscal interest in education was to provide funding only for a
minimal education program. Moreover, most states enacted foundation programs as their core school finance strategy (Gold, Smith, & Lawton, 1995). Such a program boosts the level of expenditure for the lower spending
CPRE Occasional Paper Series, OP-04 6
IMPROVING STATE SCHOOL FINANCE SYSTEMS Odden districts and perhaps provides them with property tax relief as well. But foundation programs often were set too low and, in most cases, became out of date quickly; they were set at a specific dollar level and not adjusted annually for inflation. And the Anew@ type of school finance problem described below holds for many states with foundation equalization programs. The New Nature of School Finance Differences and Why Traditional GTB Programs Are Inadequate As is often the case in public policy, actual impacts over a longer period of time are difficult or even impossible to predict. This certainly has been true of school finance in many states. Three quite different states provide good examples. All three states enacted different versions of school finance reforms over the 1975-1995 time period. State A implemented a generous Areward for effort@ GTB-type program in the late 1970s, but then changed it to a foundation-type program in the 1980s, so it represents a foundation school finance equalization approach. State B implemented a com-bination foundation-GTB program, which was continuously enhanced over those 20 years, so that in 1995, the GTB was set at the 95th percentile of property wealth per pupil, with a minimum tax rate that provided a minimum expenditure of just over $3,000 per pupil, and with the GTB providing aid up to the 90th percentile of spending. State C created and implemented a fully funded GTB-type programCwith the largest element guaranteeing the property wealth per pupil of the district at the 93rd per-centileCfor spending up to about the 60th percentile of expenditure per pupil. So these
states reflect the impact of three different types of school finance equalization programs: foundation, GTB, and combin-ation foundation-GTB. To a greater or lesser degree, all three states deferred actual spending decisions to local districts. Tables 3, 4, and 5 show the status of school finance in these three states in 1995, with the data organized by decile of spending from state and local sources per pupil, again excluding spending for special needs students.1 The results do not reflect the anticipated impacts. There are still wide spending disparities and, whatever the core school finance equalization strategy, spending per pupil is still highly associated with property wealth per pupilCthe higher the wealth, the higher the spending! But the linkages between spending and tax rates have changed dramatically. In all three cases, although spending per pupil increases with property wealth per pupil, so does the local tax rate for schools. In all three states, the higher the tax rate, the higher the spend-ing. Higher property-wealth-per-pupil districts have higher spending per pupil but also have the highest tax rates in the three states. Conversely, lower property-wealth-per-pupil districts still have lower spending per pupil but now also have the lowest tax rates. What happened? First, overall spending per pupil increased in real terms in all three states: 122 percent, 144 percent, and 144 percent, respectively, from 1980 to 1995, using the consumer price index as the deflator (National Center for Education Statistics, 1998). Indeed, school finance reform generally has led to higher overall
CPRE Occasional Paper Series, OP-04 7

IMPROVING STATE SCHOOL FINANCE SYSTEMS Odden spending (Murray, Evans, & Schwab, forthcoming). But it seems that the new
CPRE Occasional Paper Series, OP-04 8

IMPROVING STATE SCHOOL FINANCE SYSTEMS Odden
Table 3 School Finance in State A, 1994-95
K-12 Districts
Decile
Revenues (per pupil)
Assessed Value
Per Pupil (at market value)
Local Property Tax
Rate (percent)
1
$2,987
$118,969
1.11
2
3,221
90,120
1.17
3
3,288
103,279
1.17
4
3,426
140,218
1.18
5
3,562
157,524
1.26
6
3,665
150,897
1.34
7
3,829
200,460
1.31
8
4,049
217,998
1.36
9
4,411
254,362
1.44
10
5,973
523,521
1.24
Horizontal Equity
Coefficient of Variation: 19.5 McLoone Index: .92
Fiscal Neutrality Correlation: .90 Wealth Elasticity: .23
Source: CPRE analysis of state data.
school finance programs, which would have let the lower property-wealth-per-pupil districts increase their spending to average or higher levels while also lowering their tax rates, were not used for that purpose. Rather, lower wealth districts appeared to use the potential of the higher tax base provided by the new programs primarily to lower their tax rates from an above-average to a below-average level. The data show that while lower wealth districts still tend to have
below-average spending levels, they do so because they also have below-average tax rates. Although the high level GTBs in both states B and C would allow these lower wealth-per-pupil districts to spend at substantially higher levels with only modestly higher tax rates, the districts generally chose not to do so. They chose low tax rates that, in turn, produced low expenditure levels. In short, many of the low-wealth districts did not behave as anticipated
CPRE Occasional Paper Series, OP-04 9

IMPROVING STATE SCHOOL FINANCE SYSTEMS Odden when provided with a high
CPRE Occasional Paper Series, OP-04 10

IMPROVING STATE SCHOOL FINANCE SYSTEMS Odden
Table 4
School Finance in State B, 1994-95 K-12 Districts
Decile
Revenues (per pupil)
Assessed Value
Per Pupil (at market value)
Local Property
Tax Rate (percent)
1
$2,893
$103,238
0.60
2
3,042
126,874
0.61
3
3,130
140,313
0.63
4
3,258
157,754
0.63
5
3,400
207,211
0.67
6
3,632
220,635
0.70
7
3,922
251,595
0.83
8
4,219
280,519
0.86
9
4,687
312,488
0.89
10
5,343
386,903
1.07
Horizontal Equity
Coefficient of Variation: 20.4 McLoone Index: .91
Fiscal Neutrality Correlation: .75 Wealth Elasticity: .32
Source: CPRE analysis of state data.
GTB program. The same was true for low-wealth districts in the foundation program state. The high-wealth districts also seemed to engage in unpredictable behavior. As these states implemented their school finance reforms over the past 20 years, it seems that the higher wealth districts, which had enjoyed both a spending and tax rate
advantage, decided to maintain their spending lead but could do so only by raising their local tax efforts for schools. Yes, some of the exceedingly wealthy districts still can spend at a high level because of their very high wealth, but with the state guaranteeing the tax bases of the districts at the 90th to 93rd percentiles, a wealth advantage exists only for a small percentage of districts, and most of these
Table 5
CPRE Occasional Paper Series, OP-04 11

IMPROVING STATE SCHOOL FINANCE SYSTEMS Odden
School Finance in State C, 1994-95 K-12 Districts
Decile
Revenues (per pupil)
Assessed Value
Per Pupil (at market value)
Local Property
Tax Rate (percent)
1
$4,860
$164,138
1.36
2
5,188
179,004
1.45
3
5,310
147,378
1.48
4
5,350
180,601
1.50
5
5,468
172,183
1.53
6
5,569
195,932
1.55
7
5,713
196,185
1.59
8
5,962
196,601
1.73
9
6,231
222,376
1.84
10
6,828
351,184
1.74
Horizontal Equity
Coefficient of Variation: 9.87 McLoone Index: .95
Fiscal Neutrality Correlation: .59 Wealth Elasticity: .14
Source: CPRE analysis of state data.
have a wealth advantage just above what the state will guarantee. For the bulk of the districts in the top third of property wealth per pupil, therefore, higher spending is primarily produced by higher tax rates for school purposes, reflecting the desire of their taxpayers to provide a high quality and expensive education system.
Overall, spending disparities did drop in states that had court cases, and states responded with school finance reforms (Evans, Murray, & Schwab, 1997). But the decrease was modest, averaging between 16 and 25 percent depending on the statistical measure used.
In sum, the impact of new school finance systems did little to reduce fiscal inequities. Instead, the new programs led to overall increases in education spending, but during
that process lower-wealth districts dropped their tax rates to below the average and settled for below-average spending-per-pupil levels, while higher wealth districts
CPRE Occasional Paper Series, OP-04 12
IMPROVING STATE SCHOOL FINANCE SYSTEMS Odden maintained their spending advantage by raising their tax rates and thus their spending. The result was continued spending disparities, although this time driven more rationally by local tax-rate differences rather than by the accident of the maldistribution of the local property tax base. Only a modest change occurred in these states= fiscal equity statisticsCthose measuring spending disparities and those measuring the connection between spending and property wealth. It should be noted that many economists predicted this behavioral response (Fastrup, 1997; Feldstein, 1975; Ladd, 1975; Ladd & Yinger, 1994; Reschovsky, 1994). GTB-type programs, and even foundation programs for some districts, lower the local Aprice@ of spending on education. Rather than just tapping the local tax base at a high tax rate to spend an extra $100 per pupil, the district can tap the new program and increase that amount of spending at a much lower tax rate. When prices are lowered for desired commodities, such as education, people usually buy more of that commodity. So economic theory would predict increased education spending overall with school finance formulas that lower education Aprices,@ which is what happened in these
states. Second, research showed that the demand elasticity for education in low- property-wealth districts (which was also frequently low in average-household-income districts), was low, and the demand elasticity was high in higher-wealth, higher household- income districts, such as metropolitan suburban districts. Thus, it was not surprising that the lower wealth districts decided not to raise relative spending very much, while the higher wealth districts decided just the opposite. To verify these negative conclusions about the efficacy of GTB programs to enhance fiscal equity, pure forms of GTB programs were simulated for these three states by setting the GTB at the 95th percentile of property wealth per pupil and providing GTB aid for all levels of spending. All of the equity statistics worsenedCspending disparities widened and the relationships between spending and property wealth strengthened. More generous GTB programs are not what these states need to improve fiscal equity. The New School Finance
Of course, improving fiscal equity might not be a salient issue in such states. In fact, delineating what the school finance Aproblem@ is for these three states has created a major debate. Some argue that the continued existence of spending disparities and their relationship to local property wealth, whatever the causes, remain a problem. But if the Aold@ problem was the unequal ability to raise revenues to support public schools, and that problem is resolved
by a high level GTB or another school finance reform, others say that the remaining spending differences are a matter of local taxpayer choice and reflect neither an inherent inequity nor a school funding problem. Another group argues that since education is a state function, spending differences (as a proxy for education quality) are a problem regardless of whether they are caused by the unequal distribution of the property tax base or by local taxpayer
CPRE Occasional Paper Series, OP-04 13

IMPROVING STATE SCHOOL FINANCE SYSTEMS Odden choice. Still others focus on the spending of the Abottom half@ of districts, arguing it should be increased. The problem with all three of these arguments, however, is that they deal simply with money and largely on whether base funding is equal or not. They are not related to any other substantive education goal such as education quality or student achievement. Making this connection is the school finance challenge of today. As CPRE research in finance, policy, and school reform has shown quite clearly, the driving education issue today is raising the levels of student achievement, i.e., setting high and rigorous standards and teaching students to those standards (Smith & O=Day, 1991; Fuhrman, 1993; Massell, Hoppe, & Kirst, 1997). Research from cognitive science suggests that we know how to produce a much higher level of learning, or at least make substantial progress toward this goal (Bruer, 1993; Siegler, 1998). Given this knowledge, Linda Darling Hammond (1997) argues that learning to high standards should be considered a right for all children. Moreover, school finance litigation in many states has begun to stress adequacy issues over equity issues (Enrich, 1995; Heise, 1995). Reflecting this student achievement goal, the education policy and program issues revolve around which curriculum, instruction, incentive, capacity development, organ-ization, and management strategies are required to produce this ambitiously higher level of student performance. Also, what level of funding is required for these
programmatic strategies? Though CPRE researchers Odden and Busch (1998) begin to address these broader finance issues in a new book, Financing Schools for High Performance, they focus mainly on district-to-school formula budgeting or ways to provide lump sum budgets to school buildings and the possibilities for school re-allocation of funds to higher performance programmatic strategies. The book alludes to the overall state school finance structure that would provide funding to districts but falls short of assessing and proposing new systems. That is the purpose of section two of this paper. As both Odden and Clune (1998) and Imazeki and Reschovsky (1998) argue, the prime school finance Aproblem@ today is linking school finance to the strategies needed to accomplish the goal of teaching students to higher standards. In new school finance parlance, the challenge is to determine an Aadequate@ level of spending. The task is to identify for each district/ school the level of base spending needed to teach the average student to state standards and then to identify how much extra money each district/school requires to teach students with special needsCthe learning disabled, those from poverty-level households and thus educationally deficient backgrounds, and those without English proficiencyCto the same high and rigorous achievement standards. As Clune (1994a, 1994b) argues, this requires a shift in school finance thinking from Aequity@ to Aadequacy.@
Interestingly, in each of the three sample states discussed earlier, educators and
policymakers recently have begun to raise the issue of school finance adequacy in
CPRE Occasional Paper Series, OP-04 14

IMPROVING STATE SCHOOL FINANCE SYSTEMS Odden many ways. Some question whether the spending levels of the bottom half of all districts, i.e., those districts with just average or mostly below-average tax rates, are a problem. They question whether the tax rates are too low or whether those spending levels, even though they are below average, are Aadequate@ to teach their students to acceptable standards. Others attempt to calculate a state-supported spending level that can be linked to a specified level of student performance. For example, it will cost X dollars for 90 percent of students to meet or exceed state proficiency standards in core subjects. In a sense, this is a Aback to the future@ school finance objective because many foundation programs have sought to make this linkage throughout the century. Still, others have explored the degree to which any Aadequate@ spending level should be supplemented by additional money to provide extra resources to teach special needs students to high standards. Determining an Adequate Spending Level There are three major ways policymakers and policy analysts have attempted and are attempting to determine an adequate spending level: 1) identify a set of inputs and cost them out; 2) link a spending amount per pupil to a level of student outcomes; and 3) build a number from the bottom up by identifying the cost of school-
wide programs that produce desired outcomes. The input approach began nearly two decades ago when the Washington State school finance system was declared unconstitutional, and the top court required the state to identify and fund a Ageneral and uniform@ education program. In response, the state essentially identified the average staffing (teachers, professional support staff, administration, etc.) in a typical district and, using statewide average costs, determined a spending level. To a substantial degree, Washington State still uses this approach. A more sophisticated input approach was the Resource Cost Model (RCM), created by Jay Chambers and Thomas Parrish (1994). Using groups of professional educator experts, the RCM first identified base staffing levels for the regular education program and then identified effective program practices and their staffing and resource needs for compensatory, special, and bilingual education. All ingredients were costed out using average price figures, but in determining the foundation base dollar amount for each district, the totals were adjusted by an education price index. This method was used to propose a foundation spending level for both Illinois and Alaska, but the proposals were never implemented.
Most recently, Guthrie et al. (1997) made a further advance on the professional input approach as part of a response to a Wyoming Supreme Court=s finding that its state=s finance system was unconstitutional. Guthrie and colleagues also used a panel of
pro-fessional education experts. In identifying the base staffing level for typical elementary, middle, and high schools, however, they relied on the findings of the Tennessee STAR class size reduction study results to set a class size of 15 students in
CPRE Occasional Paper Series, OP-04 15

IMPROVING STATE SCHOOL FINANCE SYSTEMS Odden elementary schools (Finn & Achilles, 1990; Finn, 1998) and then used the panel to determine add-itional resources for compensatory, special, and bilingual education. They too adjusted the dollar figures by a constructed price factor. The advantage of all of these input approaches is that they identify a set of ingredients that an amount of dollars would be able to purchase in each school district, including additional resources for three categories of special needs students, all adjusted by a price factor. The disadvantage is that the resource levels are connected to student achievement results only indirectly or inferentially through professional judgment and not directly to actual measures of student performance. The second approach to determining an adequate spending level attempts to remedy this key deficiency of the input approach by seeking to link a spending level directly to a specified level of student performance. Two procedures have been used. The first procedure determines a desired level of performance using state tests of student performance, then it identifies districts that produce that level of performance. From that group it selects those districts with com-parable state average characteristics and calculates their average spending per pupil. Such studies have been conducted in Illinois (Hinrichs & Laine, 1996) and Ohio (Alexander, Augenblick, Driscoll, Guthrie, and Levin, 1995; Augenblick, 1997).
Interestingly, in all three studies, the level of spending identified was approximately the median spending per pupil in the state. The second procedure uses the economic Acost function@ approach. This approach seeks to identify a spending-per-pupil level that is sufficient to produce a given level of performance, adjusting for the character-istics of students and other socioeconomic status characteristics of districts; this method, as discussed below, also can be used to calculate how much more is required to produce the specified level of perform-ance by factors such as special needs of students, scale economies or diseconomies, input prices, and even efficiency. In CPRE research using Wisconsin data, Imazeki & Reschovsky (1998) identified an expenditure level that also was close to the median of spending per pupil. Similar cost function research has been conducted by others (e.g., Duncombe, Yinger, & Ruggiero, 1996). To be sure, these studies used different meth-odologies and had different definitions of Aadequate@ performance levelsCin Wisconsin it was the average performance level, and in the other two states it was teaching at least 70 percent of students to state proficiency standards. But all studies sought to identify a spending level that was associated with a desired, substantive education result: student achievement to a specified standard. In general, that spending level was close to the respective state=s median spending level.
The third approach to adequacy has been to identify the costs of a Ahigh performance@ school modelCa school-wide design crafted specifically to produce desired levels of student academic achievementCand to
determine a level of spending that would be sufficient to fund such a model. A current example of such new school finance think-ing is the situation in New Jersey. For nearly a quarter of a century, the driving issue in
CPRE Occasional Paper Series, OP-04 16

IMPROVING STATE SCHOOL FINANCE SYSTEMS Odden the New Jersey school finance court cases was about money and whether all districts, now just the 28 special needs urban districts, would have the same level of dollar re-sources as the high-wealth, high-spending suburban districts plus some additional money for the special needs of their urban students. For 1997-98, the Supreme Court ordered the state to provide that level of spending equality, which ensured $8,664 per pupil for every child. The Supreme Court also asked a remand court to work with the state and plaintiffs to identify supplemental programs for the extra needs of low-income urban students and to identify the costs of those programs. When the state proposed that the education problem of the students from special needs districts could be resolved by using the $8,664 to fund a proven effective school-wide program that included supplemental programsCspecific-ally, the Success for All/Roots and Wings programCrather than provide more money, they were accused of trying to provide education reform Aon the cheap.@ That level of money more than covered the require-ments of that school design, which was specifically created for low-income minority students in urban school systems. In fact, the state not only picked one of the most expensive whole-school models (Odden, 1997; King, 1994), but because of the high level of funding, they also expanded every element of that model. Although New Jersey is providing a base spending level that is above the median, its
approach to re-engineering school finance to some adequate level is to start with a proven effective school-wide program. There are several other school-wide models being developed across the country, all with costs about equal to or less than Success for All/Roots and Wings (Odden & Busch, 1998). Early results suggest that they show promise for accomplishing the goal of teaching students to higher standards (Edison Project, 1997; Slavin & Fashola, 1998; Stringfield, Ross, & Smith, 1996). To determine a spending level more reasonable than the high level in New Jersey, Odden and Busch (1998) analyzed the costs of two such modelsCthe Modern Red Schoolhouse and Success for All/Roots and Wings. Both had similar overall costs and required the national median expenditure per pupil to finance them.
Additional work is needed to identify Aadequate@ expenditure levels. Each approach discussed above has strengths and weaknesses, and none has been perfected. Any state would need to select one of the above approaches to determine what their level of adequacy would be. But at their core, these new approaches to school finance seek to link spending with student achievement results. Simulating the Results of Providing an Adequate Fiscal Base
The adequacy approach to education finance suggests that a foundation program is the most salient of the school finance systems. Given the findings of several of the above approaches to adequacy, particularly the
connection between adequate performance and median spending, a school finance system that requires all districts to spend at least at the median of state spending per pupil (i.e., a foundation program with the
CPRE Occasional Paper Series, OP-04 17
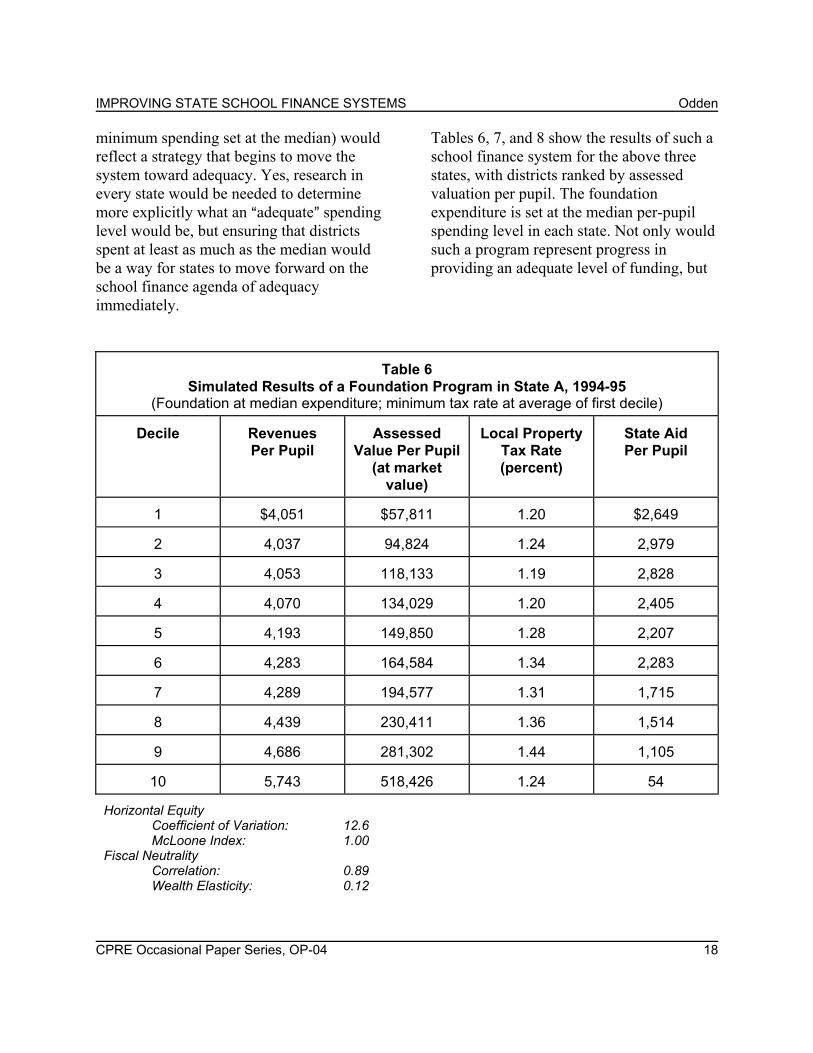
IMPROVING STATE SCHOOL FINANCE SYSTEMS Odden minimum spending set at the median) would reflect a strategy that begins to move the system toward adequacy. Yes, research in every state would be needed to determine more explicitly what an Aadequate@ spending level would be, but ensuring that districts spent at least as much as the median would be a way for states to move forward on the school finance agenda of adequacy immediately.
Tables 6, 7, and 8 show the results of such a school finance system for the above three states, with districts ranked by assessed valuation per pupil. The foundation expenditure is set at the median per-pupil spending level in each state. Not only would such a program represent progress in providing an adequate level of funding, but
Table 6
Simulated Results of a Foundation Program in State A, 1994-95 (Foundation at median expenditure; minimum tax rate at average of first decile)
Decile
Revenues Per Pupil
Assessed
Value Per Pupil (at market
value)
Local Property
Tax Rate (percent)
State Aid Per Pupil
1
$4,051
$57,811
1.20
$2,649
2
4,037
94,824
1.24
2,979
3
4,053
118,133
1.19
2,828
4
4,070
134,029
1.20
2,405
5
4,193
149,850
1.28
2,207
6
4,283
164,584
1.34
2,283
7
4,289
194,577
1.31
1,715
8
4,439
230,411
1.36
1,514
9
4,686
281,302
1.44
1,105
10
5,743
518,426
1.24
54
Horizontal Equity
Coefficient of Variation: 12.6 McLoone Index: 1.00
Fiscal Neutrality Correlation: 0.89 Wealth Elasticity: 0.12
CPRE Occasional Paper Series, OP-04 18
IMPROVING STATE SCHOOL FINANCE SYSTEMS Odden
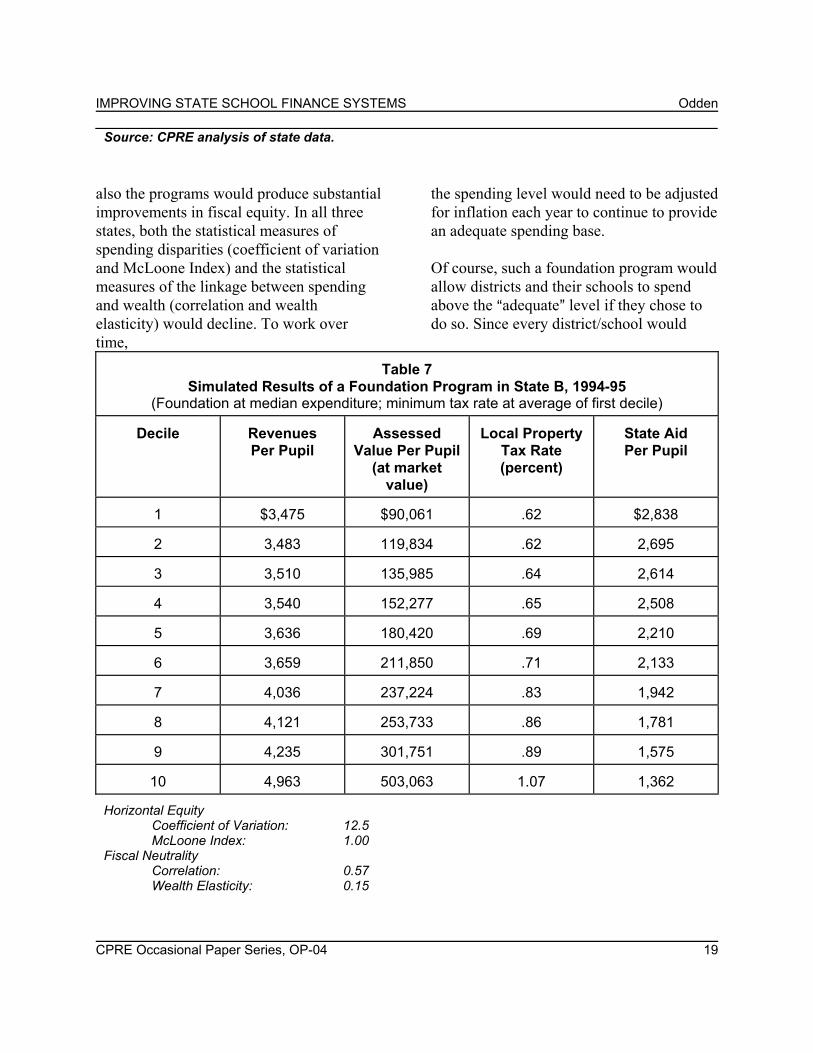
Source: CPRE analysis of state data. also the programs would produce substantial improvements in fiscal equity. In all three states, both the statistical measures of spending disparities (coefficient of variation and McLoone Index) and the statistical measures of the linkage between spending and wealth (correlation and wealth elasticity) would decline. To work over time,
the spending level would need to be adjusted for inflation each year to continue to provide an adequate spending base. Of course, such a foundation program would allow districts and their schools to spend above the Aadequate@ level if they chose to do so. Since every district/school would
Table 7
Simulated Results of a Foundation Program in State B, 1994-95 (Foundation at median expenditure; minimum tax rate at average of first decile)
Decile
Revenues Per Pupil
Assessed
Value Per Pupil (at market
value)
Local Property
Tax Rate (percent)
State Aid Per Pupil
1
$3,475
$90,061
.62
$2,838
2
3,483
119,834
.62
2,695
3
3,510
135,985
.64
2,614
4
3,540
152,277
.65
2,508
5
3,636
180,420
.69
2,210
6
3,659
211,850
.71
2,133
7
4,036
237,224
.83
1,942
8
4,121
253,733
.86
1,781
9
4,235
301,751
.89
1,575
10
4,963
503,063
1.07
1,362
Horizontal Equity
Coefficient of Variation: 12.5 McLoone Index: 1.00
Fiscal Neutrality Correlation: 0.57 Wealth Elasticity: 0.15
CPRE Occasional Paper Series, OP-04 19

IMPROVING STATE SCHOOL FINANCE SYSTEMS Odden
Source: CPRE analysis of state data. have sufficient base revenues to provide an adequate education programCa program that would teach its average students to prescribed state proficiency standardsCthe next issue, then, is whether an additional fiscal equalization formula would be needed.
Those focusing on fiscal equity might argue that if the system allows districts to spend above the adequate level, then the state should provide a GTB program to make the spending ability of districts more fair across all districts, rich or poor. Tables 9, 10, and 11 show the results of adding a second tier,
Table 8
Simulated Results of a Foundation Program in State C, 1994-95 (Foundation at median expenditure; minimum tax rate at average of first decile)
Decile
Revenues Per Pupil
Assessed
Value Per Pupil (at market
value)
Local Property
Tax Rate (percent)
State Aid Per Pupil
1
$5,562
$106,905
1.38
$3,291
2
5,686
138,199
1.45
3,089
3
5,705
143,418
1.48
3,519
4
5,768
155,152
1.50
3,068
5
5,813
175,978
1.53
3,182
6
5,901
188,919
1.56
2,859
7
5,943
199,218
1.59
2,856
8
6,251
221,108
1.73
2,850
9
6,556
270,838
1.84
2,500
10
6,869
396,528
1.74
1,161
Horizontal Equity
Coefficient of Variation: 7.40 McLoone Index: 1.00
Fiscal Neutrality Correlation: 0.61 Wealth Elasticity: 0.12
Source: CPRE analysis of state data.
CPRE Occasional Paper Series, OP-04 20

IMPROVING STATE SCHOOL FINANCE SYSTEMS Odden
90/90 GTB to this foundation program. The GTB was set at the 90th percentile of district wealth and provided aid to districts spending up to the 90th percentile of expenditures per pupil. The tables show two results from this
addition. First, nearly all of the equity statistics worsen. Second, the extra state cost is considerable. Because these states represent the newer version of fiscal disparities (higher spending associated with
Table 9
Simulated Results of a Foundation Program with a 90/90 Second Tier GTB in State A, 1994-95
(Foundation at median expenditure; minimum tax rate at average of first decile, GTB at 90th percentile wealth provided for spending up to the 90th percentile)
Decile
Revenues Per Pupil
Assessed
Value Per Pupil (at market
value)
Local Property
Tax Rate (percent)
State Aid Per Pupil
1
$4,183
$57,811
1.19
$2,787
2
4,251
94,824
1.24
3,193
3
4,136
118,133
1.19
2,912
4
4,156
134,029
1.20
2,491
5
4,368
149,850
1.28
2,381
6
4,521
164,584
1.34
2,522
7
4,608
194,577
1.31
2,035
8
4,891
230,411
1.36
1,967
9
5,053
281,302
1.44
1,471
10
5,743
518,426
1.24
55
Extra state cost over the foundation program: $164.5 million Horizontal Equity
Coefficient of Variation: 15.6 McLoone Index: 1.00
Fiscal Neutrality Correlation: 0.65 Wealth Elasticity: 0.09
CPRE Occasional Paper Series, OP-04 21

IMPROVING STATE SCHOOL FINANCE SYSTEMS Odden
Source: CPRE analysis of state data. higher tax rates, both attributes associated with higher wealth), the equity results are not surprising. For these states, the results show again that GTB programs, even on top of adequate
foundation spending levels, simply worsen fiscal equity. The results suggest that GTB school finance elements simply should not be a primary part of state school finance systems. Nevertheless, many school finance experts, including this author (Odden &
Table 10
Simulated Results of a Foundation Program with a 90/90 Second Tier GTB in State B, 1994-95
(Foundation at median expenditure; minimum tax rate at average of first decile, GTB at 90th percentile wealth provided for spending up to the 90th percentile)
Decile
Revenues Per Pupil
Assessed
Value Per Pupil (at market
value)
Local Property
Tax Rate (percent)
State Aid Per Pupil
1
$3,506
$90,061
.62
$2,869
2
3,517
119,834
.62
2,729
3
3,576
135,985
.64
2,679
4
3,616
152,277
.65
2,585
5
3,785
180,420
.70
2,305
6
3,842
211,850
.72
2,285
7
4,196
237,224
.84
2,091
8
4,347
253,733
.87
1,941
9
4,584
301,751
.92
1,761
10
5,250
503,063
1.10
1,528
Extra state cost over the foundation program: $88.6 million Horizontal Equity
Coefficient of Variation: 14.10 McLoone Index: 1.00
Fiscal Neutrality Correlation: 0.62 Wealth Elasticity: 0.19
Source: CPRE analysis of state data.
CPRE Occasional Paper Series, OP-04 22
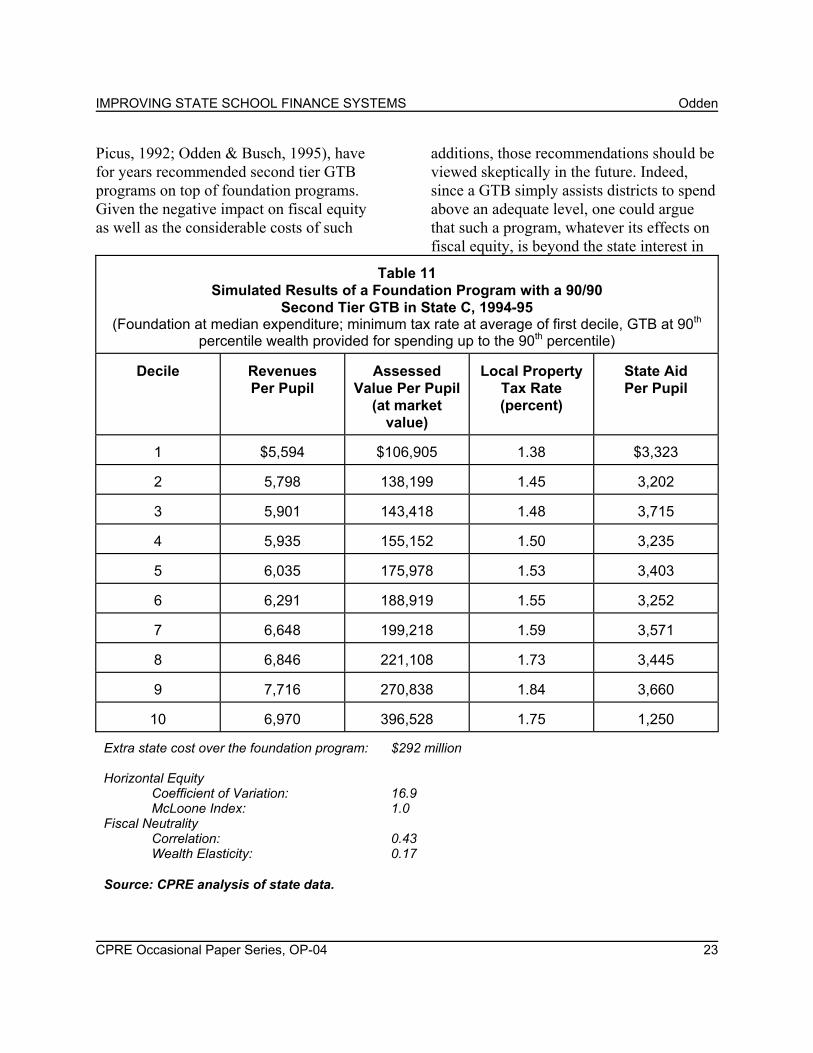
IMPROVING STATE SCHOOL FINANCE SYSTEMS Odden Picus, 1992; Odden & Busch, 1995), have for years recommended second tier GTB programs on top of foundation programs. Given the negative impact on fiscal equity as well as the considerable costs of such
additions, those recommendations should be viewed skeptically in the future. Indeed, since a GTB simply assists districts to spend above an adequate level, one could argue that such a program, whatever its effects on fiscal equity, is beyond the state interest in
Table 11
Simulated Results of a Foundation Program with a 90/90 Second Tier GTB in State C, 1994-95
(Foundation at median expenditure; minimum tax rate at average of first decile, GTB at 90th percentile wealth provided for spending up to the 90th percentile)
Decile
Revenues Per Pupil
Assessed
Value Per Pupil (at market
value)
Local Property
Tax Rate (percent)
State Aid Per Pupil
1
$5,594
$106,905
1.38
$3,323
2
5,798
138,199
1.45
3,202
3
5,901
143,418
1.48
3,715
4
5,935
155,152
1.50
3,235
5
6,035
175,978
1.53
3,403
6
6,291
188,919
1.55
3,252
7
6,648
199,218
1.59
3,571
8
6,846
221,108
1.73
3,445
9
7,716
270,838
1.84
3,660
10
6,970
396,528
1.75
1,250
Extra state cost over the foundation program: $292 million Horizontal Equity
Coefficient of Variation: 16.9 McLoone Index: 1.0
Fiscal Neutrality Correlation: 0.43 Wealth Elasticity: 0.17
Source: CPRE analysis of state data.
CPRE Occasional Paper Series, OP-04 23

IMPROVING STATE SCHOOL FINANCE SYSTEMS Odden school finance, which is largely fulfilled by the adequate spending base. Adjustments for Special Needs If a second tier GTB is not recommended or justified, should the adequate foundation base be augmented by any additional finance elements? Yes. The foundation spending level is targeted to the Aaverage@ student, but some students will need extra help and thus more resources to achieve to high standards. So the foundation base should be augmented by additional elements related to the extra programmatic and financial needs of at least three categories of studentsCthe disabled, those from lower-income households and thus educationally disadvantaged back-grounds, and those who need to learn English to a higher level of proficiency. This paper will address only an adjustment for low-income students and will briefly discuss an adjustment for disabled students. Though some additional aid for the extra educational needs of low-achieving students from low-income backgrounds is provided by the federal Title I program, about two-thirds of the states also provide extra funding for low-income students (Gold, Smith, & Lawton, 1995). For both federal and state efforts, the long standing question is how much money per pupil needs to be provided by those programs. The answer requires specifying the level of achievement desired, the additional programmatic strategies needed to produce this achievement, and the costs of those programmatic strategies.
A program for which this type of analysis can be approximated is the Success for All/Roots and Wings program. It is one of the most successful school-wide strategies developed, and it includes a core curriculum designed to teach students to proficiency standards in reading, writing, mathematics, science, and social studies. There is considerable evidence of the effectiveness of this program, and it has been shown to be replicable across a wide range of schools and education systems (Slavin & Fashola, 1998). Its curriculum also can be aligned with most extant state/district content and performance standards. For purposes of discussion, let us assume that this program provides the types of extra services and strategies students from low-income backgrounds need to achieve at levels that meet rigorous proficiency standards. Fortunately, the extra costs of this program have been identified. The minimum extra elements of this program for an elementary school of 500 students with nearly all the students from poverty backgrounds are: $ A school-wide instructional facilitator; $ Four reading tutors; $ A family liaison professional; $ About $30,000 for materials; and $ About $30,000 for professional
development provided by the national network associated with this particular school design.
CPRE Occasional Paper Series, OP-04 24

IMPROVING STATE SCHOOL FINANCE SYSTEMS Odden The ingredients include six extra professional staff positions and $60,000 for training and materials. Using national average prices, this would require the school to have an additional $360,000 (6 positions times $50,000 in salary and benefits for each, plus $60,000). This would be above core staffing of one principal, one teacher for every 25 students, appropriate additional teachers for preparation time, and art, music, and physical education. The costs would be increased if the district provided only a half day of kindergarten; in fact, the program strongly recommends a full-day kindergarten program, which would require two addition-al teacher positions raising the costs to $450,000. Roots and Wings/Success for All also strongly suggests that each student receive a preschool program, which could further increase the costs. Finally, some schools find that an additional tutor or two enhances the ability of the program to teach all students to high proficiency standards. For illustrative purposes, assume that a program slightly above the minimum requirements is needed and that the
additional costs of that version of the Roots and Wings/Success for All program is about $500,000. That would amount to $1,000 for every student in the school, which in this case would be every low-income student in the school. This would mean that in addition to the Aadequate@ foundation program, the state would need to provide an additional $1,000 for every low-income student, assuming that those extra dollars would be used to finance a strategy or set of strategies to teach all average students and all students from low-income backgrounds to state-set proficiency standards. Districts should be able to pool funds from both Title I and state compensatory education programs to provide this level of extra funding to each school. Table 12 compares the cost of this enhancement to the foundation program, which provides an extra $1,000 for each student from a low-income background, to the costs of the 90/90 GTB program simulated above. The number of students eligible for free or reduced-price lunch is used to estimate the number of students
Table 12
Costs Above an AAdequate@ Foundation Expenditure Base of a 90/90 GTB Versus an Extra $1,000 for Each Free/Reduced Price Lunch Student
State
Extra Costs of a 90/90 GTB
Extra Costs of Providing
$1,000 for Each Free/ Reduced-Price Lunch
Student Illinois
$165 million
$165 million
Missouri
$88 million
$211 million
Wisconsin
$292 million
$281 million
from a poverty background. The data show that the cost of the extra $1,000 for each CPRE Occasional Paper Series, OP-04 25

IMPROVING STATE SCHOOL FINANCE SYSTEMS Odden low-income student is substantial, but that in two states, it is just about equal to the cost of the second tier GTB. The numbers show that states could consider these additions to the foundation base as trade-offs. If a state has only $200-300 million more to spend above the foundation level, the question is whether it would be wiser to spend it on strategies to teach students from low-income back-grounds to high standards or strategies that let some districts spend above an adequate level for the average student. The former would seem to be the preferred choice.
A similar type of analysis would be needed for disabled students and students learning the English language. Research generally shows that disabled students on average, across all categories of disability, require an additional 130 percent of resources (Chaikind, Danielson, & Braven, 1993; Odden & Picus, 1992). Thus states could provide an extra 130 percent for each identified disabled student. An alternative emerging strategy is for the state to provide Acensus@ funding for disabled students (Chambers, Parrish, & Hakido, 1996; Parrish, 1996); under this approach, the state determines the percentage of the student population that on average is disabled and provides an extra sum (say, 130 percent) for the number of such students in each school district. Ideally, all dollar figures for such a new school finance structureCthe base spending level and the adjustment for each of the three categories of studentsCalso should be adjusted by an education price index to
ensure that the dollar figures provide equal education purchasing power to districts and schools across the wide range of geographic regions and labor markets in a state. It turns out that the purchasing power of the education dollarCdue to labor market and other community characteristics outside of the control of school officialsCcan vary by up to 40 percent between the lowest and highest price areas. Adjusting nominal dollar amounts by such a price index would ensure that each district/school received the same level of Areal@ dollar resources. Fortunately, the National Center of Education Statistics (NCES) has developed different versions of such education price adjustments (Chambers, 1995; McMahon, 1994); any state could use these externally developed price adjustments. Although states have been reluctant to add education price adjustments to their school aid formulas, in part because developing them requires some complex econometric analyses and manipulations and in part because price adjustments Amove@ substantial money around, the existence of the NCES price indices would allow states to use a price adjustment factor that has been developed by the best experts in the country under the auspices of a neutral governmental body. Thus, a new type of school finance formula, one providing an adequate fiscal base so schools can deploy an education program designed to teach students to high achieve-ment standards, would consist of five elements:
$ A base spending level that would be considered Aadequate@ for the average
child, which in the short-term could be approximated by the median expenditure
CPRE Occasional Paper Series, OP-04 26
IMPROVING STATE SCHOOL FINANCE SYSTEMS Odden
level; $ An extra amount of money for each
child from a low-income background; $ An extra amount for each disabled
student; $ An extra amount for each student who
needs to learn English; and $ A price adjustment for all dollar figures
to ensure comparable spending power. With such a school finance system, a state could reasonably say it financed the state=s core interests in education. And if states were allowed to pool federal and state money for the above student categories, such a school finance system could also finance a large portion of the federal government=s interests in education as well. An Econometric Approach Without going into details, Imazeki and Reschovsky (1998), and other economists (e.g., Downes & Pogue, 1994; Duncombe, Ruggiero, & Yinger, 1996; Ladd & Yinger, 1994; Ruggiero, 1996) have been pursuing a similar approach to re-engineering school finance systems, but one which would result in a somewhat simpler school finance structure. Technically, these economists are trying to construct a Acost function@ for a state=s education system. Simply put, a cost function would identify the level of funding needed to produce a certain level of output, such as student achievement, given different
characteristics of schools and their students. In the CPRE work being conducted with Wisconsin data, Reschovsky has attempted to determine how much money a district with average demographic characteristics must spend to teach students to state average performance levels. In his analysis, he could have set the performance target at a higher levelCsay the 70th percentileCbut so far his analysis has focused on average achievement levels. This amount of money reflects the Aadequate@ foundation base. From the results of the cost function, he then constructed an overall cost adjustment that accounts for: $ Different characteristics of students,
specifically the percent of students from a low-income background (as measured by eligibility for free and reduced-price lunch), the percentage disabled, and the percentage with limited English proficiency;
$ Different prices across school districts
and labor market regions; and $ Economies and diseconomies of scale as
measured by the number of students. Put briefly, his research is attempting to construct an overall cost index that adjusts for differences in student need, price differences, and scale economies/dis-economies. Related work by others also attempts to adjust for efficiency differences (see for example, Duncombe, Ruggiero, & Yinger, 1996).
Although the research is state of the art and uses complex econometric statistical analyses and thus may seem complex to the
non-economist, the Abeauty@ of the research is that two primary numbers are produced: the expenditure level needed in the
CPRE Occasional Paper Series, OP-04 27

IMPROVING STATE SCHOOL FINANCE SYSTEMS Odden Aaverage@ or Atypical@ district/school and a cost adjustment that accounts for all other factorsCstudent need, price, scale, and at some point, efficiency. Thus, the school finance formula would be a Acost adjusted@ foundation program. The program would provide a base spending level, which for the Wisconsin data was $6,333 using 1996-97 data. The amount of money guaranteed to each district would be the foundation amount ($6,333) times the cost factor. In Wisconsin, the cost factor varied widely, from a low of 59 percent to a high of 200 percent. This means that given the above characteristics of schools, students, and districts, the average district required $6,333 to teach its students to average achievement levels, while the least needy districts/schools required only 59 percent of that, or $3,736 (lower than any district actually spends), and the most needy district required $12,666 (higher than the neediest district actually spends). And these amounts would be sufficient to produce the average achievement level. If Reschovsky had set the desired achievement level above the current average, the foundation dollar figure would have been higher. Though more research of this type is needed, the point here is that its goal is very similar to the above proposed new type of school finance structureCidentifying an adequate base foundation level of spending, which is then adjusted at least by student need and price factors and perhaps scale and efficiency factors as well. When research can be more definitive, school finance systems can then become more tightly
linked to education goalsCthe state would know how much money is needed in each school to teach students to set state achievement standards. Summary This approach to re-engineering school finance would also be appropriate to districts that reflect the traditional school finance spending, wealth, and tax rate differences and relationships discussed in section one, or any other school finance reality (see Appendices A and B). Virtually all 50 states are pursuing a standards- and school-based education reform agenda with the goal of educating students to new and high achievement levels. School finance systems that just focus on the distribution of dollars make little sense in such an environment. A system such as the one suggested above, which over time can increasingly tighten the connections between funding and strategies to produce that achievement particularly at the school site level, is the type of funding system that most states want to pursue. Such an approach represents the cutting edge of re-engineering school finance to the purposes of standards- and school-based education reform, the objective of which is teaching all students, including low-income students, to high standards.
Additional Elements to Spur High Performance2
In addition to the basic new structure for state-to-district education financing, states also would be wise to consider adding
several elements to their system to spur higher performance. Three are prominent: more school-based financing, changing
CPRE Occasional Paper Series, OP-04 28

IMPROVING STATE SCHOOL FINANCE SYSTEMS Odden teacher compensation to provide incentives to continually improve professional expertise, and implementing performance incentives. Move to More School-Based Financing As Odden and Clune (1998) suggest, both the movement toward school-based management and other education policies that entail school site funding, such as choice and charters, require states to face the issue of school-based financing. The focus on the school, moreover, is not just a new element of education policy but also can be rationalized on the grounds of designing a high performance education system. Schools are the Aunit of production@ in the education system; schools are where teaching and learning occur. Thus, the increasing focus on the school site makes sense for a system trying to dramatically improve performance. And research on effective site-based management shows that when several elements are combined, school-based management can work to improve the instructional program and then student achievement as well (Joyce & Calhoun, 1996; Newmann, 1996; Odden & Busch, 1998, Chapter 2; Odden, Wohlstetter, & Odden, 1995; Robertson, Wohlstetter, & Mohrman, 1995; Smylie, Lazarus, & Brownlee-Conyers, 1996; Wohlstetter, Smyer, & Mohrman, 1994; Wohlstetter, Mohrman, & Robertson, 1996). The school focus has two major fiscal implications. First, dollars need to be budgeted to the school site. A lack of budget control inhibits
schools from successful restructuring (Bodilly, 1998). For this and other reasons, several countries have moved school-based formula funding to their education finance policy agendas (Ross & Levacic, 1998, forthcoming), and their ex-periences can be used to design effective approaches in U.S. states. England impl-emented such a policy in 1988 by requiring each of its local education agencies within a statewide fiscal framework to devise a specific, pupil-driven school-based financing formula. Drawing upon the English policy as well as the school-based financing system in Victoria, Australia, Odden and Busch (1998) show how such a strategy could be impl-emented by any state in the United States. As in England, Odden and Busch strongly suggest that each state create a framework that would guide districts in the macro aspects of how to create their specific school-based financing formulas. They also emphasize that a critical aspect of such a system is first deciding the key functions for the central office, providing a budget for those retained tasks, and then budgeting the remainder to schools via some type of pupil-weighted formula, particularly if the adequate level of funding is built up from the costs of an effective, school-wide program. Then states and districts need a mechanism to ensure that school sites receive that level of dollars so the schools can use the money for the unique needs of their designs. Odden (1998, forthcoming) shows how five districts in North America currently provide lump sum budgets to schools via quite sophisticated, pupil-weighted funding formulas.
Second, school-based financing would require adapting state and district fiscal and
account-ing systems to the site level. Conceptually, this simply would require
CPRE Occasional Paper Series, OP-04 29

IMPROVING STATE SCHOOL FINANCE SYSTEMS Odden gathering and reporting revenues and expenditures on a school-by-school basis (see Odden & Busch, 1997; Speakman, Cooper, Holsomback, Hunt, Sampieri, & Maloney, 1997). Such a strategy also would entail creating a fiscal information system that could be accessed by each school site through an online, interactive computer system. The approach by Seattle, Washington is a good example of such a computer system (Odden, 1998; Seattle Website: http://sps.gspa. washington.edu/sps/). Victoria, Australia created such a structure in the first six months of its policy of school-based financing (Odden & Odden, 1996). The system Australia created also included an electronic invoicing and purchase order capability. Reinvent Teacher Compensation Teacher compensation also could change to further stimulate the education system toward higher performance. School organization, incentives, and teacher compensation can be more closely linked. However structured, compensation is the major formal extrinsic reward incentive in any organization including schools. The incentives imbedded in a compensation system, however, function best when they are aligned with the broader goals of the organization and when they directly reinforce those goals. Kelley (1997) and Odden (1996) argue that since mid-century, and particularly in the current era of education reform, school organization and education goals have been changing in ways that could have been fortified substantially by changes in teacher
compensation. Teacher compensation could have changed from the single salary schedule invented in the early part of this century, which provided salary increments based on the objective measures of years of experience and education units, to a single salary schedule that provided salary increments based on direct, sophisticated, and professional measures of teacher knowledge and skills (Odden & Kelley, 1997), particularly those skills needed to implement standards- and school-based education reform. The specific design and focus of new approaches to compensation could vary dramatically (Odden & Conley, 1992; Conley & Odden, 1995; Mohrman, Mohrman, & Odden, 1996). The point is that teacher compensation comprises 50 percent of each education dollar that is spent, and there are new, substantive ways to alter teacher compensation to align it more closely with the norms and goals of current, standards-based education reform. A serious restructuring of school finance to enhance greater education system performance would add compensation reform to the agenda. Such changes would require written descriptions of what accomplished teaching entails and rigorous assessments of individual teacher practice. Great progress has been made during the past ten years in developing these tools, including standards and assessments for beginning teachers (Dwyer, 1998; Moss, Schutz & Collins, 1998), and standards and assessments for more accomplished, experienced teachers (Bond, 1998; Jaeger, 1998). Considerable thought has been given to how such
CPRE Occasional Paper Series, OP-04 30

IMPROVING STATE SCHOOL FINANCE SYSTEMS Odden advances could be included in a restructured teacher compensation structure (Heneman & Ledford, 1998; Klein, 1998; Odden & Kelley, 1997; Milanowski, Odden, & Youngs, 1998; see also the Consortium for
Policy Research in Education=s website on teacher compensationChttp://www.wcer. wisc.edu/cpre/).
Changes in compensation outside of education have helped to improve the performance of the organization in which they have been tried, have improved the individual salaries of the individuals on the teams in those organ-izations, and have improved working cond-itions (Heneman & Ledford, 1998; Jenkins, Ledford, Gupta, & Doty, 1992; Lawler, 1990; Murray & Gerhart, 1998). Early analyses suggests that such compensation changes could work similarly in education (Odden & Kelley, 1997). Provide School-Based Performance Incentives School-based performance incentives would also be part of a revised finance system. Such programs are controversial in education largely because they have been designed poorly in the past, providing individual rather than group awards and being eliminated by states after a year or two (Cornett & Gaines, 1992; Murnane & Cohen, 1986). But school-based performance awards could be formal, extrinsic elements that function as incentives for boosting increases in school-wide student achievement (Mohrman & Lawler, 1996; Rowan, 1996). In an organization like schools, however, as well as in most organizations in the private and public sectors today, perform-ance awards are most appropriately provided to groups or all individuals within an organ-ization (Lawler, 1990; Richards, Fishbein, & Melville,
1993). If a new school finance system is designed explicitly to provide a base level of funds that has been determined to be Aadequate@ for teaching the average student to high standards, and if the system also provides the extra funds needed to teach special needs to that level, then it would seem reasonable, over time, to hold schools accountable for producing that level of results. At a minimum, it would seem appropriate to provide incentives to schools to continually show progress toward that goal. School-based performance awards are one strategy for implementing that objective. The design of performance awards would need to be carefully considered, and much work is needed to identify alternative designs that work. Student achievement undoubtedly would be a core element of a performance measure, and states or districts would need a good test to serve as the basis for such an award. How to measure improved perform-ance to ensure that the incentives function to encourage schools to boost the performance of all students, and to do so each year, are other thorny issues that need to be addressed. The standardCthe amount of improved perform-anceCthat would qualify a school or team of teachers for the award is another issue; setting the standard as some type of rolling, historical average so that each school is measured against past performance is probably the most feasible. Designing the specifics is
CPRE Occasional Paper Series, OP-04 31

IMPROVING STATE SCHOOL FINANCE SYSTEMS Odden complicated and will require careful attention to numerous technical issues (Odden, Heneman, Wakelyn, & Protsik,
1996).
Finally, a stable funding pool for an effective performance award is another aspect that is critical to such an element of compensation. The tendency in the past has been to eliminate funding when dollars were scarceCa practice that erodes trust in the system and undercuts the incentive force of such a program. Current programs require about 1 to 2 percent of the operating budget; states or districts could set aside 1 to 2 percent of the total education budget in a performance award trust fund to create a stable funding pool for such a program. Once built into the base, it could be replenished each year. For the new types of school-based perform-ance awards in education, research so far shows that they can work (Heneman, forthcoming; Kelley, forthcoming; Clotfelter & Ladd, 1996; Ladd, forthcoming). The programs help motivate teachers and principals to focus on how to improve student achievement: teachers and principals view the system=s practice of setting performance improvement targets as a legitimate management prerogative, and given appro-priate assistance and additional training, most teachers believe they can produce the improved student performance. Though more research is needed, these early results suggest that such initiatives, as part of a comprehensive, multi-faceted strategy to improve education, should be viewed in education as viable performance-enhancing
initiatives like they are now viewed outside of education. Re-Conceptualize School Finance Adequacy as a National Issue Redesigning school finance to meet the needs of the national education reform goal of teaching students to high standards also will require a new look at finance issues from a national perspective, across state boundaries. Nearly all analyses of either school finance equity or school finance adequacy have been conducted using within-state data. But this within-state approach is deficient in addressing either the issue of fiscal disparity or the issue of fiscal adequacy. Both Murray, Evans, and Schwab (forthcoming) and Odden and Busch (1998) show that the vast majorityCtwo-thirdsCof fiscal differences across school districts in the United States, after adjusting for differences in education price and student need, are caused by cross-state rather than within-state variations. Even if all within-state fiscal disparities were remedied, two-thirds of expenditure differences across school districts in the United States would still exist. Thus, the traditional focus on within-state disparities only is short-sighted if the goal of more fiscal equality is to be attained.
Regarding the issue of fiscal adequacy, Odden and Busch (1998) show that in several states, few if any districts would have adequate revenues to finance a school-
wide, proven effective strategy if the state raised spending to the state median or even to the highest spending district. Odden and Busch analyzed the level of spending that
CPRE Occasional Paper Series, OP-04 32

IMPROVING STATE SCHOOL FINANCE SYSTEMS Odden would be required at the district level in all school districts in the country to provide school sites with a level of revenue that would allow them to finance an effective school-wide design that cost $350,000 above the core; such a level of expenditure would fund either the Success for All/Roots and Wings or the Modern Red Schoolhouse program (Odden, 1997). Their analysis assumed districts would spend 85 percent of district operating revenues at each school site. The school design costs were minimal, providing the core of one principal and 20 teachers for every group of 500 students, an additional $350,000 for the school design, and only a modest amount of teacher preparation time. In many schools across the country, substantially more resources than this minimum is typically provided (see also Odden & Busch, 1998, Chapter 7). Nevertheless, even at this low estimate of an adequate spending base, Odden and Busch (1998) found that most districts would need more revenues in many Southern and Western states, and that vast numbers of districts in other states would need additional funding. They found that the level of district expenditure required to support such an effective school design was very close to the national median, which was well above median spending levels in numerous states. Because of this finding, their analysis showed that there are many states in the country that would not be providing an adequate revenue base to schools even if they raised the spending of all districts up to the state median or even to the spending of the highest spending districts. They suggested that this implied a new federal fiscal role in educationCproviding funds to raise spending in all districts at least up to
the national median or some minimal nationally adequate level. Put differently, Odden and Busch showed that the issue of spending levels across states is a major problem from an adequacy perspective and that the recommendation in section two of this paper for raising district spending within a state to the state median might be adequate in Midwestern and Northeastern states where the research on adequate spending levels has been conducted, but that such a within-state strategy would not be adequate in several other states. They also argued that the only resolution to these cross-state fiscal inadequacies is some type of federal initiative, whereby the federal government would support, stimulate, or require states to provide an adequate fiscal base (roughly at the national median), combined with an adequate education tax effort (which would have to be carefully defined), and focused on teaching students to some nationally Acomparable@ high achievement standards (which would be facilitated by a national test or equivalent state tests).
CPRE Occasional Paper Series, OP-04 33
IMPROVING STATE SCHOOL FINANCE SYSTEMS Odden
References
Alexander, Kern, Augenblick, John, Driscoll, William, Guthrie, James M., & Levin, R. (1995). Proposals for the elimination of wealth-based disparities in public education. Columbus, OH: Department of Public Instruction.
Augenblick, John. (1997). Recommend-
ations for a base figure and pupil-weighted adjustments to the base figure for use in a new school finance system in Ohio. Columbus, OH: Ohio Department of Education.
Bodilly, Sue. (1998). Lessons from New
American Schools= Scale-up Phase: Prospects for bringing designs to multiple sites. Santa Monica, CA: RAND.
Bond, Lloyd. (1998). Disparate impact and
teacher certification. Journal for Personnel Evaluation in Education, 12(2), 211-220.
Bruer, John. (1993). Schools for thought.
Cambridge, MA: MIT Press. Chaikind, Steve, Danielson, Louis C., &
Braven, Marsha L. (1993). What do we know about the costs of special education? A selected review. Journal of Special Education, 26, 344-370.
Chambers, Jay G. (1995). Public school
teacher cost differences across the united states: Introduction to a teacher cost index (TCI). In Developments in School Finance [Online]. Available:
http://www.ed.gov/NCES/pubs/96344cha.html
Chambers, Jay G., & Parrish, Thomas.
(1994). State-level education finance. In H. J. Walberg (Series Ed.) & W. S. Barnett (Vol. Ed.), Advances in Educational Productivity: Volume 4. Cost Analyses for Education Decisions (pp. 45-74). Greenwich, CT: JAI Press.
Chambers, Jay G., Parrish, Thomas, &
Hikido, Christine. (1996). Special education expenditures and revenues in a census-based funding system: Case study in the commonwealth of Massachusetts. Journal of Education Finance, 21, 527-554.
Clotfelter, Charles, & Ladd, Helen. (1996).
Recognizing and rewarding successful schools. In H. F. Ladd (Ed.), Holding schools accountable: Performance-based reform in education. Washington, DC: Brookings Institution.
Clune, William. (1994a). The shift from
equity to adequacy in school finance. Educational Policy, 8, 376-394.
Clune, William. (1994b). The cost and
management of program adequacy: An emerging issue in education policy and finance. Educational Policy, 8(4), 365-375.
Conley, Sharon, & Odden, Allan. (1995). Linking teacher compensation to teacher CPRE Occasional Paper Series, OP-04 34
IMPROVING STATE SCHOOL FINANCE SYSTEMS Odden
career development: A strategic examination. Educational Evaluation & Policy Analysis, 17, 253-269.
Coons, John E., Clune, William, &
Sugarman, Steven D. (1970). Private wealth and public education. Cambridge, MA: Harvard University Press, Belknap Press.
Cornett, Lynn, & Gaines, Garnett F. (1992).
Focusing on student outcomes: Roles for incentive programs. The 1991 national survey of incentive programs and teacher career ladders. Atlanta, GA: Southern Regional Education Board.
Darling-Hammond, Linda. (1997). The right
to learn. San Francisco, CA: Jossey- Bass.
Downes, Thomas, & Pogue, Thomas.
(1994). Adjusting school aid formulas for the higher cost of educating disadvantaged students. National Tax Journal, 47(1), 89-110.
Duncombe, William, Ruggiero, John, &
Yinger, John. (1996). Alternative approaches to measuring the cost of education. In H. F. Ladd (Ed.), Holding schools accountable: Performance-based reform in education (pp. 327-356). Washington, DC: Brookings Institution.
Dwyer, Carol Anne. (1998). Psychometrics
of Praxis III: Classroom performance assessments. Journal for Personnel Evaluation in Education, 12(2), 163-187.
Edison Project. (1997). Annual report on
school performance. New York: Edison Project.
Enrich, Peter. (1995). Leaving equality
behind: New directions in school finance reform. Vanderbilt Law Review, 48, 101.
Evans, William, Murray, Sheila, & Schwab,
Robert. (1997). State education finance policy after court mandated reform: The legacy of Serrano. 1996 Proceedings of the Eighty Ninth Annual Conference on Taxation. Washington, DC: National Tax Association-Tax Institute of America.
Fastrup, Jerry. (1997). Taxpayer and pupil
equity: Linking policy tools with policy goals. Journal of Education Finance, 23(1), 69-100.
Feldstein, Martin. (1975). Wealth neutrality
and local choice in public education. American Economic Review, 64, 75-89.
Finn, Jeremy. (1998). Class Size and
students at risk: What is known? What next? (Commissioned paper). Washington, DC: U.S. Department of Education, Office of Educational Research and Improvement, National Institute on the Education of At-Risk Students.
Finn, Jeremy, & Achilles, Charles. (1990).
Answers and questions about class size: A statewide experiment. American Educational Research Journal, 27, 557-577.
CPRE Occasional Paper Series, OP-04 35

IMPROVING STATE SCHOOL FINANCE SYSTEMS Odden Fuhrman, Susan H. (Ed.). (1993). Designing
coherent education policy: Improving the system. San Francisco, CA: Jossey-Bass.
Gold, Steven D., Smith, David M., &
Lawton, Stephen B. (1995). Public school finance programs of the United States and Canada: 1993-94. New York, NY: American Education Finance Association, Center for the Study of the States; Nelson A. Rockefeller Institute of Government.
Guthrie, James M., Garms, Walter, &
Pierce, Lawrence. (1988). School finance and education policy. Englewood Cliffs, NJ: Prentice Hall.
Guthrie, James M., Hayward, Gerald E.,
Smith, James, Rothstein, Richard, Bennett, Ronald, Koppich, Julia E., Bowman, Ellis, DeLapp, Lynn, Brandes, Barbara, & Clark, Sandra. (1997). A proposed cost-based block grant model for Wyoming school finance. Sacramento, CA: Management Analyst & Planning Associates.
Heise, Michael. (1995). State constitutions,
school finance litigation and the AThird Wave:@ From equity to adequacy. Temple Law Review, 68, 1151, 1162, 1166.
Heneman, Herbert G., III. (in press).
Assessment of the motivational reactions of teachers to a school-based performance award program. Journal of Personnel Evaluation in Education.
CPRE Occasional Paper Series, OP-04 36

IMPROVING STATE SCHOOL FINANCE SYSTEMS Odden Heneman, Robert L., & Ledford, Gerald E.,
Jr. (1998). Competency pay for professionals and managers in business: A review and implications for teachers certification. Journal for Personnel Evaluation in Education, 12(2), 103-121.
Hinrichs, William L., & Laine, Richard D.
(1996). Adequacy: Building quality and efficiency into the cost of education. Springfield, IL: Illinois Board of Education.
Imazeki, Jennifer, & Reschovsky, Andrew.
(1998). The development of school finance formulas to guarantee the provision of adequate education to low-income students. In W. J. Fowler (Ed.), Developments in school finance (pp. 121-148). Washington, DC: National Center for Education Statistics.
Jaeger, Richard M. (1998). Evaluating the psychometric qualities of the national board for professional teaching standards= assessments: A methodological accounting. Journal for Personnel Evaluation in Education, 12(2), 189-210.
Jenkins, G. Douglas, Ledford, Gerald,
Gupta, Nina & Doty, D. Harold. (1992). Skill-based pay: Practices, payoffs, pitfalls and prescriptions. Scottsdale, AZ: American Compensation Association.
Joyce, Bruce, & Calhoun, Emily (Eds.).
(1996). Learning experiences in school renewal: An exploration of five successful programs. Eugene, OR: ERIC Clearinghouse on Educational Management. (Eric No. ED401600)
Kelley, Carolyn. (1997). Teacher compensation and organization. Educational Evaluation & Policy Analysis, 19(1), 15-28
Kelley, Carolyn. (in press). The Kentucky
school-based performance award program: School-level effects. Educational Policy.
King, Jennifer. (1994). Meeting the
educational needs of at-risk students: A cost analysis of three models. Educational Evaluation & Policy Analysis, 16(1), 1-19.
Klein, Stephen P. (1998). Standards for
teacher tests certification. Journal for Personnel Evaluation in Education,
12(2), 123-138. Ladd, Helen F. (1975). Local education
expenditures, fiscal capacity and the composition of the property tax base. National Tax Journal, 28(2), 145-158.
Ladd, Helen F. (in press). The Dallas school
accountability and incentive program: An evaluation of its impacts on student outcomes. Economics of Education Review.
Ladd, Helen F., & Yinger, John. (1994). The
case for equalizing aid. National Tax Journal, 47(1), 211-224.
Lawler, Edward E., III. (1990). Strategic
pay. San Francisco, CA: Jossey-Bass.
CPRE Occasional Paper Series, OP-04 37

IMPROVING STATE SCHOOL FINANCE SYSTEMS Odden
Massell, Diane, Hoppe, Margaret R., & Kirst, Michael W. (1997). Persistence and Change: Standards-Based Reform in Nine States. Philadelphia, PA: University of Pennsylvania, Consortium for Policy Research in Education.
McMahon, Walter W. (1994). Intrastate
cost adjustment. In W. J. Fowler (ed.), Selected papers in school finance [On-line]. Available: http://www.ed.gov/ NCES/pubs/96068ica.html
Milanowski, Anthony, Odden, Allan, &
Youngs, Peter. (1998). Teacher knowledge and skill assessments and teacher compensation: An overview of measurement and linkage issues. Journal for Personnel Evaluation in Education, 12(2), 83-101.
Mohrman, Allan, Mohrman, Susan A., &
Odden, Allan. (1996). Aligning teacher compensation with systemic school reform: Skill-based pay and group-based performance rewards. Educational Evaluation & Policy Analysis, 18(1), 51-71.
Mohrman, Susan A., & Lawler, Edward E.,
III. (1996). Motivation for school reform. In S. H. Fuhrman & J. O=Day (Eds.), Rewards and reform: Creating educational incentives that work (pp. 115-143). San Francisco, CA: Jossey-Bass.
CPRE Occasional Paper Series, OP-04 38

IMPROVING STATE SCHOOL FINANCE SYSTEMS Odden Moss, Pamela A., Schutz, Aaron M., &
Collins, Kathleen M. (1998). An integrative approach to portfolio evaluation for teacher licensure. Journal for Personnel Evaluation in Education, 12(2), 139-161.
Murnane, Richard, & Cohen, David K.
(1986). Merit pay and the evaluation problem: Why some merit pay plans fail and a few survive. Harvard Educational Review, 56(1), 1-17.
Murray, Brian, & Gerhart, Barry. (1998). An
empirical analysis of a skill-based pay program and plant performance outcomes. Academy of Management Journal, 41(1), 68-78.
Murray, Sheila, Evans, William, & Schwab,
Robert. (in press). Education finance reform and the distribution of education resources. American Economic Review.
National Center for Education Statistics.
(1998). Digest of education statistics, 1997. Washington, DC: Author.
Newmann, Fred (Ed.). (1996). Authentic
achievement: Restructuring schools for intellectual quality. San Francisco, CA: Jossey-Bass.
Odden, Allan. (1996). Incentives, school
organization and teacher compensation. In S. H. Fuhrman & J. O=Day, (Eds.), Rewards and reform: Creating educational incentives that work (pp. 226-256). San Francisco, CA: Jossey-Bass.
CPRE Occasional Paper Series, OP-04 39
IMPROVING STATE SCHOOL FINANCE SYSTEMS Odden Odden, Allan. (1997). How to rethink school
budgets to support school transformation. In Getting Better by Design, Volume 3. Arlington, VA: New American Schools.
Odden, Allan. (in press). Case study 3:
North America (USA and Canada). In K. Ross & R. Levacic (Eds.), Needs-based resource allocation in education via formula funding of schools. Paris: UNESCO, International Institute for Educational Planning.
Odden, Allan, Berne, Robert, & Stiefel,
Leanna. (1979). Equity in school finance. Denver, CO: Education Commission of the States.
Odden, Allan, & Busch, Carolyn. (1995).
Costs and impacts of alternative plans for reforming Wisconsin school finance
and providing property tax relief. In C. Edlefson (Ed.), School finance policy issues in the states and provinces (pp. 192-203). Columbus, OH: The Ohio State University, Policy Research for Ohio-Based Education; American Educational Research Association.
Odden, Allan, & Busch, Carolyn (Eds.).
(1997). Collection of school-level finance data [Special issue]. Journal of Education Finance, 22(3).
Odden, Allan, & Busch, Carolyn. (1998).
Financing schools for high performance: Strategies for improving the use of educational resources. San Francisco, CA: Jossey-Bass.
Odden, Allan, & Clune, William. (1998). School finance systems: Aging structures in need of repair. Educational Evaluation & Policy Analysis, 20(3), 157-177.
Odden, Allan, & Conley, Sharon. (1992).
Restructuring teacher compensation systems. In A. Odden (Ed.), Rethinking school finance: An agenda for the 1990s, San Francisco, CA: Jossey-Bass.
Odden, Allan, Heneman, Herbert G., III.,
Wakelyn, David, & Protsik, Jean. (1996). School-based performance award case. Madison, WI: University of Wisconsin, Wisconsin Center for Education Research, Consortium for Policy Research in Education.
Odden, Allan, & Kelley, Carolyn. (1997). Paying teachers for what they know and do: New and smarter compensation strategies to improve schools. Thousand Oaks, CA: Corwin Press.
Odden, Allan, & Odden, Eleanor. (1996).
Applying the high involvement management framework to local management of schools in Victoria, Australia. Educational Research & Evaluation, 2(2), 150-184.
Odden, Allan, & Picus, Lawrence O.
(1992). School finance: A policy perspective. New York, NY: McGraw Hill.
Odden, Allan, Wohlstetter, Priscilla, &
Odden, Eleanor. (1995). Key issues in
CPRE Occasional Paper Series, OP-04 40

IMPROVING STATE SCHOOL FINANCE SYSTEMS Odden
effective school-based management. School Business Affairs, 61(5), 4-16.
Parrish, Thomas. (1996). Special education
finance: Past, present and future. Journal of Education Finance, 21(4), 451-476.
Reschovsky, Andrew. (1994). Fiscal
equalization and school finance. National Tax Journal, 47(1), 185-197.
Reschovsky, Andrew. (1997, January).
Measuring the costs of public education. Paper presented at the annual meeting of the Allied Social Sciences Association, New Orleans, LA.
Richards, Craig, Fishbein, Daniel, &
Melville, Paula. (1993). Cooperative performance incentives in education. In S. L. Jacobson and R. Berne (Eds.), Reforming education: The emerging systemic approach (pp. 28-47).
Thousand Oaks, CA: Corwin Press. Robertson, Peter J., Wohlstetter, Priscilla, &
Mohrman, Susan A. (1995). Generating curriculum and instructional changes through school-based management. Educational Administration Quarterly, 31, 375-404.
Ross, Ken, & Levacic, Rosalind (Eds.). (in
press). Needs-based resource allocation in education via formula funding of schools. Paris: UNESCO, International Institute for Educational Planning.
Rowan, Brian. (1996). Standards as
incentives for instructional reform. In S. H. Fuhrman & J. O=Day (Eds.), Rewards and reform: Creating educational incentives that work (pp. 195-225). San Francisco, CA: Jossey-Bass.
Ruggiero, John. (1996). Efficiency of educational production: An analysis of New York school districts. Review of Economics and Statistics, 78, 499-509.
Siegler, Robert. (1998). Children=s thinking.
Upper Saddle River, NJ: Prentice Hall. Slavin, Robert, & Fashola, Olatokunbo.
(1998). Show me the evidence! Proven and promising programs for America=s schools. Thousand Oaks, CA: Corwin Press.
Smith, Marshall S., & O=Day, Jennifer.
(1991). Systemic reform. In S. H. Fuhrman & B. Malen (Eds.), The politics of curriculum and testing (pp. 233-267).
Philadelphia, PA: Falmer Press. Smylie, Mark A., Lazarus, Virginia, &
Brownlee-Conyers, Jean. (1996). Instructional outcomes of school-based participative decision-making. Educational Evaluation & Policy Analysis, 18, 181-198.
Speakman, Sheree, Cooper, Bruce,
Holsomback, Hunt, May, Jay, Sampieri, Robert, & Maloney, Larry. (1997). The three Rs of education finance reform: Re-thinking, re-tooling and re-evaluating school-site information. Journal of Education Finance, 22, 337-367.
CPRE Occasional Paper Series, OP-04 41
IMPROVING STATE SCHOOL FINANCE SYSTEMS Odden Stringfield, Samuel, Ross, Steven, & Smith,
Lana. (1996). Bold plans for school restructuring: The New American School designs. Mahwah, NJ: Lawrence Erlbaum.
Swanson, Austin, & King, Richard. (1997).
School finance: Its economics and politics. New York, NY: Longman.
Underwood, Julie. (1995). School finance
litigation: Legal theories, judicial activism, and social neglect. Journal of Education Finance, 20, 143-162.
Wise, Arthur. (1968). Rich schoolsBpoor
schools: A study of equal educational opportunity. Chicago: University of Chicago Press.
Wohlstetter, Priscilla, Mohrman, Susan A.
& Robertson, Peter. (1996). Successful school-based management: Lessons for restructuring urban schools. In D. Ravitch & J. Viteritti (Eds.), New schools for a new century: The redesign of urban education. New Haven: Yale University Press.
Wohlstetter, Priscilla, Smyer, Roxanne, &
Mohrman, Susan A. (1994). New boundaries for school-based management: The high involvement model. Educational Evaluation & Policy Analysis, 16, 268-286.
CPRE Occasional Paper Series, OP-04 42

IMPROVING STATE SCHOOL FINANCE SYSTEMS Odden
CPRE Occasional Paper Series, OP-04 43

IMPROVING STATE SCHOOL FINANCE SYSTEMS Odden
Appendix A Status of School Finance in a Western State, 1996-97
Decile
Revenues Per Pupil
Assessed
Value Per Pupil (at market
value)
Local Property
Tax Rate (percent)
State Aid Per Pupil
1
$4,421
$41,142
3.57
$2,771
2
4,443
41,246
3.58
2,844
3
4,504
45,947
3.54
2,716
4
4,534
33,599
3.55
3,209
5
4,601
63,663
3.58
2,086
6
4,622
52,542
3.72
2,545
7
4,685
59,984
3.70
2,264
8
4,723
50,259
3.52
2,936
9
5,029
85,370
3.59
1,958
10
6,106
100,938
3.32
3,719
Source: CPRE analysis of state data.
CPRE Occasional Paper Series, OP-04 44
IMPROVING STATE SCHOOL FINANCE SYSTEMS Odden
CPRE Occasional Paper Series, OP-04 45

IMPROVING STATE SCHOOL FINANCE SYSTEMS Odden
Appendix B Status of School Finance in a Midwestern State, 1996-97
Decile
Revenues Per Pupil
Assessed
Value Per Pupil (at market
value)
Local Property
Tax Rate (percent)
State Aid Per Pupil
1
$4,021
$62,853
2.51
$2,274
2
4,768
68,896
2.69
2,329
3
4,980
71,519
2.81
2,356
4
5,175
69,848
2.84
2,434
5
5,390
74,078
2.95
2,421
6
5,641
83,396
3.03
2,267
7
5,952
79,791
3.19
2,562
8
6,382
107,355
3.21
2,097
9
6,733
84,979
2.97
3,363
10
7,876
148,068
3.26
1,998
Source: CPRE analysis of state data.
CPRE Occasional Paper Series, OP-04 46

IMPROVING STATE SCHOOL FINANCE SYSTEMS Odden
CPRE Occasional Paper Series, OP-04 47

IMPROVING STATE SCHOOL FINANCE SYSTEMS Odden
End Notes
1. The data only show local property tax revenues and state equalization aid for these states and exclude other sources of revenue that in state B can average $800 per student. The data also are only for K-12 districts in the three states. The tables are intended to show the final results of school finance reforms implemented over several years. The school finance structure has not changed substantively in any of the states since 1995, though in state C, substantial state revenue has replaced local revenues, but because of spending controls, spending differences have not been altered much.
2. This section draws heavily from Odden & Clune (1998).
CPRE Occasional Paper Series, OP-04 48