improving supply chain performance through lean …534813/fulltext01.pdfschool of innovation, design...
TRANSCRIPT
School of Innovation, Design and Engineering
Improving Supply Chain Performance
through Lean and Green – A study at
Volvo Group India and Sweden
KPP 231 Master Thesis Work, Innovative Production
30 credits, D-level
Product and Process Development
Master Thesis Programme in Production and Logistics
Authors
Hariram Vedapatti Ranganathan
Harishkumar Rajuvadan Premkumar
Report code:
Commissioned by: Mälardalen University
Tutor (university): Mats Jackson, Mälardalen University
Examiner: Sabah Audo, Mälardalen University

2
Abstract
In today’s world Lean and Green are becoming essential components of the supply chain.
The thesis tries to contribute to a further understanding of the supply chain management,
lean, green and their integration. The basic concepts and the research contributions of
various authors are briefed in the theoretical framework made for a better understanding
to the readers. Having gained the relevant theoretical knowledge, the interview questions
are framed and case companies are analyzed for their lean and green activities in their
supply chain. The empirical data collected from the case companies through interviews
and surveys are projected. With the empirical results and the relevant theoretical results,
an analysis & discussion is made which explicitly gives the implications of lean and
green over the supply chain and their associated practical scenarios. The outcome and
the findings are used to construct a model which depicts the relationship between lean,
green and their influence over the supply chain. Influence on the supply chain by lean
and green are projected independently in the lean supply chain model and green supply
chain. The Integrated lean and green model illustrates the relationship and influence
between lean, green and supply chain factors. This model also serves as a prototype for
the industries to make their own indigenous integrated model. Further, outcome that how
lean and green improves the supply chain and the lean and green integrated model are
summarized in the conclusion. In a bird’s eye view, this research thesis work is a
contribution to lean, green and their integration which explicitly shows the ways that
lean, green improves the supply chain performance and provides a framework /
prototype model for lean and green integration for the industries.
(Keywords: Lean, Green, Supply Chain, Integration)

3
Acknowledgements
Our thesis could not be written without our supervisor, Professor Mats
Jackson. We would like to thank him for all his support to our master thesis. His
knowledge deeply impresses us and guided us in the right direction always.
We would like to thank all the industries participated in the survey and interview.
Especially we are very grateful to Mr. Niklas Nilroth (Volvo Construction
Equipments, Braås – SWE), Mr. Hallin Christian (Volvo Construction Equipments,
Eskilstuna – SWE), Mr. Dharmendra Pandey (Volvo Construction Equipments,
Bangalore – IND), Mr. Devaraj (Volvo Buses, Bangalore – IND), Mr. Mohan Iyengar
(VECV, Pithampur –IND) for their immense support in making this thesis successful.
We would like thank our Program Co-ordinator and Examiner Mr. Sabah Audo,
Master Program in Product and Process Development – Production and Logistics for
giving us an opportunity to gain knowledge and for his extended help & support for
completing the thesis on-time. We would like to thank Jessica Bruch, Post Doc., for
reviewing our report and giving us valuable suggestions to improve the report.
In addition, we are grateful to the people in Mälardalen University, who were a part
of our memories in the wonderful days in Sweden. We gain more than what we can
give. We have learnt knowledge here. We learnt how to build ourselves to be better
persons to contribute societies.
Completed this thesis in June’2012, we come to the end of our student life. We are
about to leave. But we promise we won’t stop learning. Our memories of here will be
kept.
Last but not least, we are very grateful to our parents and friends, without them we
wouldn’t have been here.
“Thanks, Mälardalen University. Thank you, Sweden”

4
TABLE OF CONTENTS Table of Contents ....................................................................................................................... 4
List of Figures ............................................................................................................................ 6
List of Tables ............................................................................................................................. 7
1 INTRODUCTION .............................................................................................................. 8
1.1 Background ..................................................................................................................8
1.2 Thesis Objective ...........................................................................................................9
1.3 Research Questions ......................................................................................................9
1.4 Delimitations ..............................................................................................................10
2 RESEARCH METHODOLOGY ..................................................................................... 12
2.1 Research Methods ......................................................................................................12
2.2 Research design ..........................................................................................................14
2.3 Literature review ........................................................................................................14
2.4 Interview Preparations................................................................................................15
2.5 Preparing the questionnaire ........................................................................................15
2.6 Participants .................................................................................................................15
2.7 Conducting the interviews ..........................................................................................16
2.8 Validity and Reliability ..............................................................................................16
3 THEORETICAL FRAMEWORK .................................................................................... 18
3.1 Logistics .....................................................................................................................18
3.2 Supply Chain Management ........................................................................................19
3.2.1 The Objective of a Supply Chain ....................................................................... 20
3.2.2 Drivers of the Supply Chain Management......................................................... 20
3.2.3 Cyclic View of Supply Chain Cycles ................................................................ 22
3.3 Lean Supply Chain Management – Overview ...........................................................28
3.3.1 Lean Waste......................................................................................................... 29
3.3.2 Lean Tools and Methods .................................................................................... 30
3.3.3 Lean Benefits ..................................................................................................... 38
3.3.4 Lean System Model ........................................................................................... 39
3.4 Green Supply Chain Management [GrSCM] – Overview .........................................40
3.4.1 Defining GrSCM ................................................................................................ 42
3.4.2 Motives for Green Supply Chain Management ................................................. 42
3.4.3 Environmental and Economic Benefits of Green Supply Chain Management .. 44
3.4.4 Activities in Green Supply Chain Management ................................................ 45
3.4.5 Waste Management (Green Recycling) – the 4R’s ............................................ 50
3.4.6 Life Cycle Assessment (LCA) ........................................................................... 51
3.4.7 A Four Step Approach to Green Implementation .............................................. 52
3.4.8 Advance Green System Model .......................................................................... 53
3.5 Lean and Green Supply Chain ...................................................................................54
3.5.1 Lean and Green Paradigms ................................................................................ 54
3.5.2 Interface of Lean and Green Supply chain strategy ........................................... 56
3.5.3 Implementing Green and Lean supply chain strategies ..................................... 57
3.5.4 Drivers & Barriers of Lean Supply Chain Management ................................... 58
3.5.5 Driver & Barriers of Green Supply Chain Management ................................... 61
3.5.6 Environmental Impacts of Lean Wastes ............................................................ 63

5
4 EMPRICAL RESULT ...................................................................................................... 65
4.1 Case Company Results: Lean Supply Chain Management ........................................65
4.2 Case Company Results: Green Supply Chain Management ......................................71
5 ANALYSIS & DISCUSSION .......................................................................................... 82
5.1 Improving supply chain through lean.........................................................................82
5.2 Improving supply chain through green ......................................................................84
6 LEAN & GREEN SUPPLY CHAIN MODEL ................................................................ 88
7 CONCLUSION & FURTHER STUDY ........................................................................... 98
8 REFERENCE ................................................................................................................. 100
9 APPENDIX .................................................................................................................... 109
9.1 Appendix 1 ...............................................................................................................109
9.2 Appendix 2 ...............................................................................................................111
9.3 Appendix 3 ...............................................................................................................115
9.4 Appendix 4 ...............................................................................................................119

6
List of Figures
Figure 1 An outline of the main steps of the qualitative research (Bryman & Bell, 2003) ..... 13
Figure 2 Research design ......................................................................................................... 14
Figure 3 The major supply chain drivers (Hugos, 2006) ......................................................... 21
Figure 4 Cyclic view of Supply (Chopra, et al., 2001) ............................................................ 22
Figure 5 A General Procurement Process (Jonsson, 2008) ...................................................... 23
Figure 6 5S (Matt Wrye, 2011) ................................................................................................ 30
Figure 7 Andon system (Versacall Technologies Inc., 2007) .................................................. 34
Figure 8 Advance lean system model (Bergmiller and McCright, 2009) ................................ 40
Figure 9 Content in green supply chain (Ninlawana C., 2010) ............................................... 41
Figure 10 A Four Step Approach to green implementation (Source - EPA) ........................... 52
Figure 11 Advance Green System Model (Bergmiller & McCright 2009) ............................. 53
Figure 12 Main motive for implementing a green supply chain .............................................. 77
Figure 13 Benefits of green supply chain ................................................................................ 78
Figure 14 Main decision criteria in the green design initiative ............................................... 79
Figure 15 Main obstacles in adopting a green sourcing approach ........................................... 79
Figure 16 Environmental factors taken into consideration when strategic decision making .. 80
Figure 17 Main business drivers behind importance of environmental issues ........................ 81
Figure 18 Lean Supply Chain Model ....................................................................................... 89
Figure 19 Green supply chain model ....................................................................................... 92
Figure 20 Lean & Green Supply Chain Model ........................................................................ 95
Figure 21 Volvo Group – Core Values .................................................................................. 111
Figure 22 Volvo Group – Business Area ............................................................................... 112

7
List of Tables
Table 1 Motivations for GRSCM (NEFEFT - The National Environmental Education &
Training Foundation, 2001) ..................................................................................................... 45
Table 2 Activities in Green Supply Chain ............................................................................. 45
Table 3 Reverse Logistics ...................................................................................................... 50
Table 4 Comparison of lean and green paradigms: the distinguishing attributes .................. 55
Table 5 Summary of lean and green supply chain interface (Mollenkopf, et al., 2010) ........ 57
Table 6 Drivers of Lean Supply Chain Management (Mollenkopf, et al., 2010) .................. 58
Table 7 Barriers of Lean Supply Chain Management (Mollenkopf, et al., 2010) ................. 60
Table 8 Drivers of GrSCM (Mollenkopf, et al., 2010) .......................................................... 61
Table 9 Barriers of GrSCM (Mollenkopf, et al., 2010) ......................................................... 62
Table 10 Environmental Impacts of Lean wastes .................................................................... 63
Table 11 Lean Implementation status of Case Companies. ..................................................... 71
8
1 INTRODUCTION
The first chapter of the thesis starts with introducing the background of the thesis project.
Following this the objective and research questions in the thesis work are presented and the
delimitations are discussed at the end of the chapter.
1.1 Background
In today’s world, with heavily growing demand in the automotive industry, there is an
urge for materials as well as increasing competition. Also, the Global Warming has forced the
manufacturers to rethink what and how they should produce products. Lean is an effective
way to address the above and has become a common concept in industry. Responsible
manufacturing attitudes within the industries have made various process improvements
reducing time and cost. Lean which basically is about producing more and more with less and
less resources helps to give the customer what they want in the least possible price by using
various tools to identify and eliminate/reduce various wastes in the process (Womack 1990).
But only lean would not be sufficient to meet environmental challenges. So the need for
practicing supply chain concern towards environment or also known as green supply chain
comes in to existence. According to Srivastava (2007) the green supply chain management is
defined as “integrating environmental thinking into supply-chain management, including
product design, material sourcing and selection, manufacturing processes, delivery of the
final product to the customers as well as end of life management of the product after its useful
life”. It is becoming more and more important for industries to combine both Lean and Green
in their supply chain.
The automotive industry has a huge chain of supplies wide spread across the globe covering
the lengths and breaths result in machines that aid moving people and goods round the clock
all over the earth. Expectation and sophistication demands go hand in hand with the
technology advancement. It is thousands of parts manufactured in various geographic
locations brought to the assembly location to make it a one whole piece of a perfect machine
in the right quantity in the right cost within the promised time. During a lean practice, a
number of factors get influenced in the supply chain; it is even more in the industrial scenario
where the specifics are unique to every industry which is the same for green practices. So
integrating lean and green influences many factors in the supply chain and have impacts on
the supply chain performance. The thesis shows detailed analysis of the lean and green
activities in the supply chain and with the theoretical and case companies study; the lean and
green integration is analyzed through a model showing the relationship. The thesis helps to
increases the knowledge around lean and green supply chain and as a way to project lean and
green integration. Also the thesis and the model serve as a prototype to build an industry
relevant model for lean and green integration.

9
In the thesis, Volvo Group industries in Sweden and India are the case companies. Volvo is a
leading market giant in automotive industry which has lean in its production system and
environmental care as one of its core value. The thesis is performed with theoretical and
industrial grounds to know the influence and interrelationships between lean & green and
their result of integrated practice in the supply chain.
1.2 Thesis Objective
The objective of the thesis is to explore and analyze lean and green aspects of importance to
supply chain performance in order to develop a lean and green integrated model showing the
interrelationship.
To describe, the thesis tries to explore and explain lean and green activities that can take place
in the supply chain. Further the thesis will analyze lean and green improvements, their
influence and relationship. The thesis tries to give in-depth view about the supply chain and
how the concepts of lean, green can be applied, their benefits, drivers & barriers. The thesis
has a focus to explore current industrial practices of lean and green in supply chain, thus the
Volvo group industries are explored. Based on the empirical and theoretical outcomes, lean
and green integration is proposed in a visualizing model. It has to be noted that the model is
constructed only with the important factors that are discussed in the literature and from the
inference of the case companies. The purpose of building the model is to explain what kind of
relation does one factor has on the other. Knowing this relation will be helpful for the
industries to have a reference framework model to build their own model representing lean
and green supply chain and their integration.
1.3 Research Questions
In accordance to the thesis objective and to fore see a determined path to fulfill the objective,
several research questions were framed. Also the research questions give a chance to know
about the structure of the research work covered in the thesis.
RQ1] How can lean and green aspects contribute to the improvement in supply chain?
This question aims to seek and explore about lean concept and tools, green activities, in-depth
view of supply chain management and then an analysis about its contribution for improving
the supply chain. Also the supportive augmentation for relevant co-relation through empirical
data from Volvo group companies will be discussed.
Initially the basic concepts of lean and green and how they can be applied in the supply chain
are analyzed theoretically. The theoretical reference also explores the supply chain and its
cycles, activities in each cycle, lean concepts, lean tools individually, green activities &
components and the drivers and barriers for the above. The relevant supporting data from the
case companies are collected and with the theoretical and empirical findings the contribution
towards improvement are addressed.

10
RQ1a] What are the outcomes of Volvo group companies in India/Sweden in practicing
lean and green aspects in their supply chain?
This question provides answer about, lean and green aspects of current work practices and the
potential outcomes in Volvo Group Industries in India and Sweden including their practical
difficulties faced in their supply chain, barriers and drivers. Also, initiatives and projects
within Volvo towards Lean and Green will also be addressed through this question. This
question seeks to know the motives behind their lean and green practices and their views.
RQ2] What are the effects on supply chain caused by lean, green, lean and green supply
chain?
The question seeks to project a model to see the effects caused by various lean and green
parameters based on the empirical and theoretical outcomes. Further the research question is
divided into two (2A, 2B) which can be seen below. The objective of the model is to explain
what kind of relation does one factor has on the other. The factors considered are from the
knowledge gained about the lean, green, their influence in the supply chain, practical
scenarios in the industries, drivers and barriers, etc, to show the relation for lean supply chain,
green supply chain and then the integration of the lean and green supply chain in a model.
2A) What are the effects on supply chain caused by lean, green supply chain?
This question focuses on making the lean supply chain model by various factors and depicts
the relationship between the Lean activities and the supply chain activities / factors. Similarly
the green supply chain model is built illustrating the relationship between the green activities
and supply chain factors. This helps us to have a vision on the individual relationships and
variations between the two models. Also it is helpful to build the integrated lean and green
model.
2B) What are the impacts on supply chain by integrating lean and green?
When the lean and green integrate, the impacts / the relationship with supply chain factors
influenced by lean and green are projected. The model will provide a framework for effects
caused by integrating lean and green in their supply chain. This model also serves as a pre-
study frame work & prototype for the industries which focuses on the integration and can be
done in industry specific contextual scenario of their supply chain.
1.4 Delimitations
The lean and green integration is an emerging area and hence not many research works could
be found which integrates lean and green.
The thesis have broader scope since there are many industries (Sweden- Volvo CE, Braås,
Eskilstuna, India – Volvo CE, Bangalore, Volvo Buses Bangalore, and VE Commercial
Vehicles Pithampur),

11
This is because the project initially started having Volvo CE in Sweden and India (Two Case
Companies) was planned to have an in-depth study in the supply chain in two countries. After
6 weeks of the project began, at the time of company visits, there was a problem in
permission issues. Then a change in the approach was made by the researchers, Volvo Buses
– Bangalore, VECV – Pithampur were added. Since the researchers performed the internship
in summer 2011. It was quite easy to get through the known companies. After 2 weeks later, a
response was received to carry out a short infield study/ interview in Volvo CE, Sweden.
It has to be noted that the intension / objective of the thesis is not to compare the 5 companies
but to analyze the industrial scenario on a global basis. Also due to company restriction
certain sensitive data which they discussed with us during the interview study were not
allowed to use and pictures were not allowed to take. The interviews were carried out with
people in relevant area to the possible extent.
The data on lean and green was tried to collect from the case companies, based on the
objective. But due to practical constraints the supplier end, dealer/customer end and
warehouse was least accessible. Relevant professionals were interviewed in the case
companies to the best possible extent to collect the required data. More information was
obtained in the manufacturing cycle than the others.
The model is built considering the important factors observed during the case companies
study which are connected to the theoretical studies. The model is an initiative to describe the
relationship between lean & green and its influence on supply chain factors. The model is
generic and built up based on the inference from all the case companies study and the
theoretical outcomes which can be used as a prototype to build an industry specific model.

12
2 RESEARCH METHODOLOGY
This chapter is written to present the research methodology that has been used to achieve the
purpose of this thesis. The research design of the thesis, the interview preparation and case
companies’ participation selection are presented in this chapter.
2.1 Research Methods
Research is the systematic investigation of existing or new knowledge. It is used to establish
or confirm facts, reaffirm the results of previous work, solve new or existing problems,
support theorems, or develop new theories. (Sagar, 1999)
Often two different research methods can be used: quantitative and qualitative methods. The
choice of the method depends on the research question and research objective. The overall
objective of research is to define new reliable and valid knowledge.
Quantitative and Qualitative Research
Quantitative Research:
The research is based on empirical data and present numerical results, hence; they possess
high validity and credibility. Quantitative research is able to answer question marks such as
“how many” and “how much”. Therefore, the method is preferred more on natural science.
(Matthew B.Miles, 1984)
Qualitative Research:
The research is more subjective and interpretive. According to Patton (1990), qualitative data
are detailed description of situations, events, people, interactions, observed behaviors, direct
quotations from people about their experiences, attitudes, beliefs & thoughts correspondence
records and case histories.
In this thesis, the data is collected in terms of primary data. In order to collect the primary
data, interview is used as the main research element. So it means that a qualitative method
will be applied to the collection of the primary data. An outline of the main steps of the
qualitative research suggested by Bryman and Bell (2003) is shown in figure 1.
The strategy of the research should reflect on the subject and objective of the thesis. The
strategy can be preceded through different research methods. According to journal of business
logistics there are eight types of research tools for collecting information such as interviews,
surveys, experiments, literature reviews, case studies, content analysis, observation and focus
groups.

13
Figure 1 An outline of the main steps of the qualitative research (Bryman & Bell, 2003)
Initially, the concepts of supply chain management, lean, green and their integration are
briefed and explored in a best way through the literature review. Then, in order to explore
about how these concepts prevail in a real industrial environment, industries were contacted
and interviews with the professionals in relevant areas were made. In this case, it is Volvo
group industries in Sweden and India were contacted to collect data (Interview, Infield study,
Surveys).
The analysis is made on the collected data from the case companies and the literature review,
and the problem/research scope showing the analysis of their drivers and reasons behind their
Seeking relevant site(s) and subjects
General Research Questions
Collection of relevant data
Interpretation of data
Tighter specification of the research
question(s)
Collection of further data
Conceptual and theoretical work
Writing up finding/conclusion

14
work practices etc, which are addressed with solutions and a model. To conclude, a model is
proposed and recommended for the research scope which helps the company to implement
and improve the best practices.
2.2 Research design
Research design explains the way the case study/ research are done. The steps are depicted in
figure 2.
Figure 2 Research design
The thesis was performed under the guidance of the thesis supervisor. All communications
with supervisor were made through e-mail and meetings in person. Protocol deadlines were
prepared and Monthly two protocol meetings were fixed up in Tuesdays. The qualitative
research was followed in the thesis, and the research design, researchers followed is presented
in the fig 2.
2.3 Literature review
A literature review is an analysis of the research work done in a specific domain. According
to Hart (1998) defines literature review as, “the selection of available documents on the topic,
which contains information, ideas, data and evidence. This selection is written from a
particular standpoint to fulfill certain aims or express certain views on the nature of the topic
and how it is to be investigated, and the effective evaluation of these documents in relation to
the research is being proposed”.(Hart 1998)
Purpose - The purpose of literature review is to manifest the scholarly ability to discover the
relevant information for the scope of the work, build a supportive theoretical framework for
the subject, defining the key words, definitions and terminologies, identifying previous
research works and to rationalize the research topic.

15
Writing a review - The writing starts with identifying the research questions followed by
analyzing and locating the needed information. According to Hart (1998) the first step should
be writing a draft considering the expectation and the needs of the readers. Next step is
reworking the draft, considering about clarity and structure of the paper until obtaining a final
draft. Finally, check the grammar and spelling, the literature review is done.
Initially before framing the interview questions a deep study has been performed within the
research area of lean supply chain, green supply chain, lean & green supply chain along with
the connected relevant literature. This study was performed to get a better understanding
about the concept and also to make the discussions more interesting & interactive during the
interview.
2.4 Interview Preparations
The questions forms were designed according to the type of representative to be interviewed.
Three types of questions forms were prepared in context to lean, green, supply chain. The
main objective of the question forms prepared is to know how the industries are working with
the above mentioned areas, and also to bring awareness about the lean & green supply chain.
Before the interview sessions, the proposal of the thesis and questions forms was sent to the
representatives of the industries to understand the objective of the thesis.
2.5 Preparing the questionnaire
The questions for the electronic questionnaire / survey are formulated in accordance to the
objective of the thesis. The main requirement for electronic questionnaire is to reduce the
interview duration and to make the interview sessions easier and with better understanding.
The questions framed would have relevancy with the research questions stated. Some of the
questions are given with multiple choice, some with specific suggestion to answer and the
representative was also provided with an option of answering on their own if any of the
suggested solutions doesn’t accumulates their company profile. The interview and survey
questions are available in Appendix 3 & Appendix 4.
2.6 Participants
Volvo group industries were chosen since the contact establishment was feasible. The Initial
contact was made to Volvo CE, Braås & Eskilstuna through the thesis supervisor Prof. Mats
Jackson. The contact in Volvo CE, Bangalore was established through Niklas Nilroth, Global
Environmental Director - Volvo CE Braås. The researchers established contacts in Volvo
Buses, VE Commercial Vehicles on their own. The list of case company participants is
presented below. About the case companies details is presented in Appendix 2.
List of Participants:
Volvo Construction Equipments - Eskilstuna, Sweden
Volvo Construction Equipments - Braås, Sweden
Volvo Construction Equipments - Bangalore, India

16
Volvo Buses - Bangalore, India
Volvo Eicher Commercial Vehicles - Pithampur, India
The interview dates with the case company professionals are presented in Appendix 1.
2.7 Conducting the interviews
Interview is the most common used method in qualitative research. Bryman (2001) mentioned
many types of interview such as standardized interview, open interview, semi structured
interview and so on. But most common types of interview are structured, semi-structured and
unstructured (Bryman, 2001).
In this thesis study; the researchers used semi-structured interview. Bryman (2001) defined
that “Semi-structured interview is a term that covers a wide range of instances. It typically
refers to a context in which the interview the researchers have a series of questions that are in
the general form of an interview schedule but is able to vary the sequence of questions. The
questions are frequently somewhat more general in their frame of reference from that
typically found in a structured interview schedule. Also, the interviewers usually have some
latitude to ask further questions in response to what are seen as significant replies”.
All case companies are visited to have an infield study and conduct interviews. The answers
for the questions from the respondents were hand written and also recorded with their
permission. For the purpose of conducting interview and infield study, India has been visited
during the month of March 2012. To conduct interviews/infield study in the following
companies Volvo CE - Bangalore, Volvo Buses - Bangalore, Volvo Eicher Commercial
Vehicles – Pithampur.
The appointment with the company representatives were fixed prior to 10 days period. E-mail
was used as a main mode for fixing the appointments with the representatives. The interview
sessions lasted between 1 to 3 hours with each representative. After the interview sessions
follow up was carried out through e-mail for the missing data. Totally the data was collected
from 24 respondents where the details are provided in appendix 1.
2.8 Validity and Reliability
In this research, the results are based on qualitative data. The two most commonly used terms
when judging the quality of research are validity and reliability.
Validity
Validity refers to the extent to which researchers are able to use their method to study what
they had sought to study rather than studying something else (Gummesson, 2000). Validity
can be divided in two types: internal and external (Bryman, 2001). Internal validity refers to
whether the conducted studies really indicate causal relationships in the cases where they
exist. External validity is associated with the width of the results and whether it is probable

17
that the results can be applied in other situations or at other occurrences than the ones actually
studied.
The interviews made are with relevant professionals in the field and with at least 2 persons in
order to collect more valid data. On the whole it was 24 respondents in the data collection for
interview & survey. Hence the work has more validity.
Reliability
Reliability is related with the reproducibility of the research and the extent to which two or
more researchers studying the same phenomenon with similar purposes could reach
approximately the same results (Gummesson, 2000). It is more relying on the researchers’
own interpretations. Careful attention to how data and information is gathered, analyzed and
interpreted can strengthen the reliability aspect (Bryman, 2001).
The data collections made are with relevant professionals and the information delivered by
them are recorded (audio or hand written) with their permission. By this way, details of the
data were not missed. Thus the work done is highly reliable.

18
3 THEORETICAL FRAMEWORK
In this chapter the concepts and theories are presented to enable the readers to get knowledge
about the supply chain management concepts including Lean and Green Supply Chain
Management. All the topics are covered in-depth for the fair understanding of the readers. The
objective of the theoretical framework is to provide basis to the analysis and to support the
findings.
This chapter starts with presenting the concepts about Logistics, Supply chain management,
its cycles and activities within each cycle with a detailed explanation. The cycles in the
supply chain and the activities in every cycle gives the reader a generic knowledge about the
processes that takes place in a supply chain. Under lean supply chain management the lean
wastes then the lean tools, methods and benefits followed by advance lean model are
explored. Similarly the green supply chain gives the readers a detailed view of the need, the
wastes, activities in the green supply chain and benefits. Following this the lean and green
paradigms are compared and the interface between them is analyzed for combining lean and
green with the drivers and barriers.
The mentioned areas are discussed so as to make it easier and understandable for the readers
when explaining about the relationship, impact and influence between lean, green and supply
chain performance. The outcome of this framework, i.e. the implication of the lean and green
tools / activities over the supply chain and the major factors impacting the factors or the
supply chain are analyzed / discussed in chapter 5 and for building the model chapter 6.
3.1 Logistics
According to council of logistics management (1998), “Logistics is the process of planning,
implementing, and controlling the efficient, effective flow and storage of goods, services, and
related information from point of origin to point of consumption for the purpose of
conforming to customer requirements”, which includes inbound, outbound, internal, and
external movements, and return of materials for environmental purposes.
Business Logistics: According to council of supply chain management professionals, CSCMP
(2001), the systematic and coordinated set of activities required to provide the physical
movement and storage of goods (raw materials, parts, finished goods) from vendor/supply
services through company facilities to the customer (market) and the associated activities
packaging, order processing, etc. in an efficient manner necessary to enable the organization
to contribute to the explicit goals of the company.
Internal Logistics: According to Moura (1997) internal logistics is responsible for input of
products, storage of raw materials, internal transportation, storage of partly finished &
finished products, preparation of orders and return of packaging to suppliers. In summary, all

19
the management and movement of materials within industrial units corresponds to internal
logistics.
Logisticians combine a professional knowledge of each of these functions to coordinate
resources in an organization. There are two fundamentally different forms of logistics one
optimizes a steady flow of material through a network of transport links and storage nodes;
the other coordinates a sequence of resources to carry out some project.
Third Party Logistics (3PL)
The 3PL providers are those who designs the processes for one or more parts of its client’s
supply chain (purchasing, transport, warehousing, distribution and even certain elements of
the production process), organizes, manages and controls these operations using physical,
technological and information systems infrastructure in this sense, a 3PLs providers delivers
directly to its clients any added goods and services agreed between the two parties. The range
of services provided can also be limited, like warehousing and transport. Companies may out-
source part(s) of it operations in the supply chain to the 3PL provider for various reasons
including risk reduction / risk transfer, resource issues, capital investments, flexibility for
uncertainties etc,. (Núñez-Carballosa & Guitart-Tarrés, 2011).
3.2 Supply Chain Management
Supply Chain Management (SCM) as defined by the council of supply chain management
professionals (CSCMP) “Supply Chain Management encompasses the planning and
management of all activities involved in sourcing and procurement, conversion, and all
logistics management activities. Importantly, it also includes coordination and collaboration
with channel partners, which can be suppliers, intermediaries, third-party service providers,
and customers. In essence, supply chain management integrates supply and demand
management within and across companies. Supply Chain Management is an integrating
function with primary responsibility for linking major business functions and business
processes within and across companies into a cohesive and high-performing business model.
It includes all of the logistics management activities noted above, as well as manufacturing
operations, and it drives coordination of processes and activities with and across marketing,
sales, product design, and finance and information technology.” (Council of Supply Chain
Management Professionals, 2001)
The Proactive act of improving the efficiency and effectiveness of the flow of goods, services
and knowledge across all stake holders with the goal of reducing total cost and obtaining a
competitive advantage for all parties. (HemamaliniSuresh, 2004)

20
3.2.1 The Objective of a Supply Chain
According to Chopra & Meindl (2004), the primary objective of supply chain management is
to fulfill customer demands through the most efficient use of resources, including distribution
capacity, inventory and labor. The objective of every supply chain is to maximize the overall
value generated. The value of a supply chain generates is the difference between what the
final product is worth to the customer and the effort to the supply chain expends in filling the
customer’s request. For most commercial supply chains, value will be strongly correlated
with supply chain profitability, the difference between the revenue generated from the
customer and the overall cost across the supply chain.
In theory, a supply chain seeks to match demand with supply and do so with the minimal
inventory. Various aspects of optimizing the supply chain include liaising with suppliers to
eliminate bottlenecks; sourcing strategically to strike a balance between lowest material cost
and transportation, implementing JIT (Just In Time) techniques to optimize manufacturing
flow; maintaining the right mix and location of factories and warehouses to serve customer
markets, and using location/allocation, vehicle routing analysis, dynamic programming and,
of course, traditional logistics optimization to maximize the efficiency of the distribution side.
For example, At Wal-Mart, a customer purchasing detergent is the only one providing
positive cash flow for the supply chain. All other cash flows are simply fund exchanges that
occur within the supply chain given that different stages have different owners. When Wal-
Mart pays its supplier, it is taking a portion of the funds the customer provides and passing
that money on to the supplier. All flows of information, product, or funds generate costs
within the supply chain. Thus, the appropriate management of these flows is a key to supply
chain success.
Supply chain management involves the management of flows between and among stages in a
supply chain to maximize total supply chain profitability.
3.2.2 Drivers of the Supply Chain Management
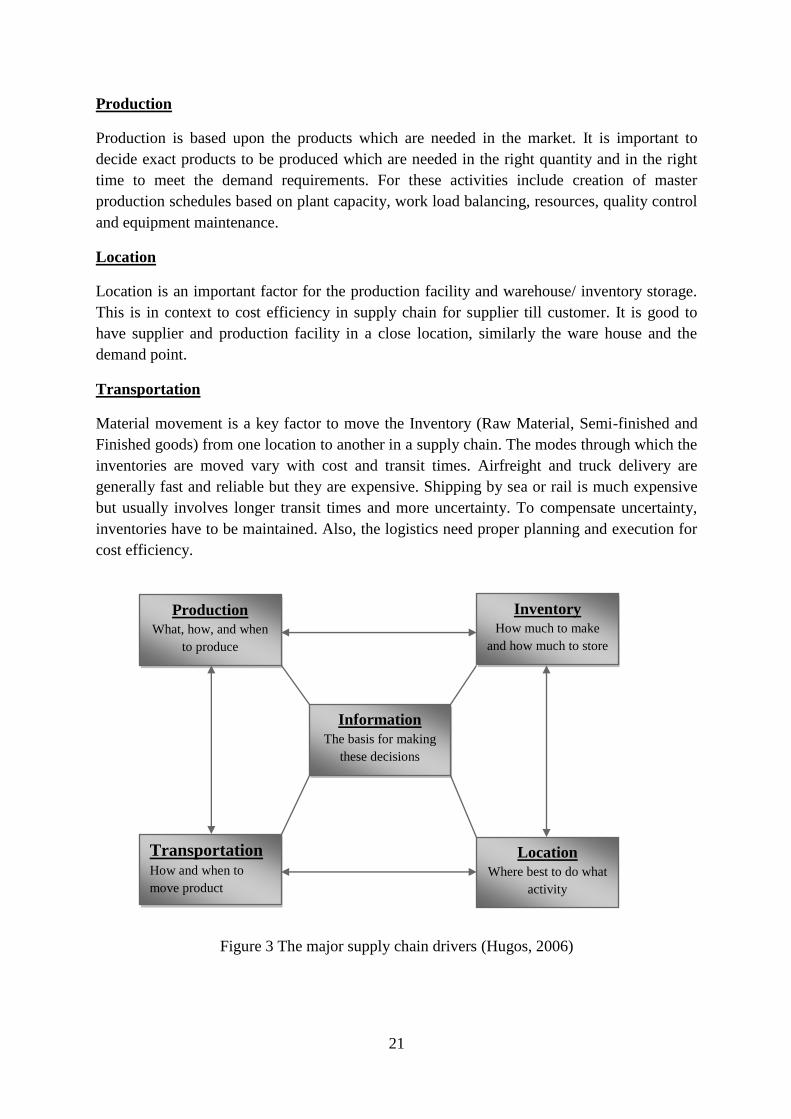
Effective supply chain consists of some drivers. Each driver has the ability to directly affect
the supply chain and enable certain capabilities. Companies in any supply chain must make
decisions individually and collectively regarding their actions in the area of these drivers.
Hugos (2006) has described these drivers in the following way,
Inventory
Inventory is necessary and should be stocked at each stage in a supply chain as raw materials,
semi-finished, or finished goods. The primary purpose of inventory is to act as buffer against
uncertainty in supply chain. Holding inventory can be expensive, however optimal levels of
inventory and reorder points are required for a smooth supply chain operation.
21
Production
Production is based upon the products which are needed in the market. It is important to
decide exact products to be produced which are needed in the right quantity and in the right
time to meet the demand requirements. For these activities include creation of master
production schedules based on plant capacity, work load balancing, resources, quality control
and equipment maintenance.
Location
Location is an important factor for the production facility and warehouse/ inventory storage.
This is in context to cost efficiency in supply chain for supplier till customer. It is good to
have supplier and production facility in a close location, similarly the ware house and the
demand point.
Transportation
Material movement is a key factor to move the Inventory (Raw Material, Semi-finished and
Finished goods) from one location to another in a supply chain. The modes through which the
inventories are moved vary with cost and transit times. Airfreight and truck delivery are
generally fast and reliable but they are expensive. Shipping by sea or rail is much expensive
but usually involves longer transit times and more uncertainty. To compensate uncertainty,
inventories have to be maintained. Also, the logistics need proper planning and execution for
cost efficiency.
Figure 3 The major supply chain drivers (Hugos, 2006)
Location
Where best to do what
activity
Inventory
How much to make
and how much to store
Transportation How and when to
move product
Production
What, how, and when
to produce
Information
The basis for making
these decisions

22
Information
Information is an asset to the value supply chain. With good information, people can make
effective decisions about what to produce and how much, about where to locate inventory and
how best to transport it. Information technology plays an important role in the supply chain
(ERP, SAP etc.)
The sum of these will define the capabilities and effectiveness of a company’s supply chain
3.2.3 Cyclic View of Supply Chain Cycles
For any product, the chain of supplies is evident i.e. the raw material supplied by the supplier
to the manufacture in an industry then moves and stored in the distribution warehouse anf
then it reaches the customer. So a flow of the supply exists for all the products. When
observed closely, a cyclic process takes place between the entities. The Supply Chain when
viewed in a cyclic perspective has 4 cycles and is illustrated in figure 4.
Figure 4 Cyclic view of Supply (Chopra, et al., 2001)
Procurement Cycle
The procurement cycle occurs at the manufacturer/supplier interface
and includes all processes necessary to ensure that materials are available for manufacturing
to occur according to schedule. In the procurement cycle, the manufacturer orders the
components from suppliers to replenish the component inventories. The relationship is quite
similar to that between a distributor and manufacturer with one significant difference.
Whereas retailer/distributor orders are triggered by uncertain customer demand, component
orders can be determined precisely once the manufacturer has decided what the production
schedule will be. Component orders depend on the production schedule. Thus it is important
that suppliers be linked to the manufacturer‘s production schedule. Of course, if a supplier’s
lead times are long, the supplier has to produce to forecast because the manufacturer’s
production schedule may not be fixed that far in advance. In practice, there may be several
tiers of suppliers, each producing a component for the next tier. A similar cycle would then
flow back from one stage to the next. (Chopra, et al., 2001)
There are many processes involved in the procurement which is shown below in the figure 5.

23
Figure 5 A General Procurement Process (Jonsson, 2008)
A general material Procurement process starts with the order triggering to the supplier based
on the forecast for production. A purchase requisition is made after which the purchase order
is done where the supplier will have a request response and order confirmation. Delivery
monitoring is carried out and advance shipment notice is sent to the delivery reception which
is followed up and evaluated which ends up with in-voice issuing.
The procured products may be,
i. Components or semi-finished products.
ii. Raw materials or materials at low refinement levels.
iii. Consumables or Spare Parts and other miscellaneous items.
The key elements which have more influence are the Supplier Relationship. It is preferred to
have a long term relationship with the supplier.
According to Cusumano and Takeishi (1991) there are 3 modes of a supplier,
1. Suppliers who develop parts / products on a self-defined basis as standard products
(supplier-proprietary parts). The product that the supplier sells may be service / material / non
material product.

24
2. Suppliers who perform detailed engineering work for parts / products depending upon the
buyers’ functional specifications.
3. Suppliers who produce the components which are developed by the buyer (Automotive
Manufacturer) to specifications and specific usage.
Supplier- Buyer relationship
Jonsson (2008) stated that the relationship between the buyer and the supplier is really
important that it should be reliable by making supplier contracts. There are different types of
contracts
i. Direct competition
ii. Through contracts in direct competition
iii. Operative contracts
iv. Strategic contracts
In the case of automotive industry, which involves a lot of sub components, the complexity
and the risk is more, the buyer (Automotive manufacturer) tends to make a long term
relationship. So when it comes to the industry (buyer), various considerations in choosing the
supplier. Everything depends on the products where in turn it is based on the supplier to
supply the required goods in time and in quantity as required by the industry. So supplier
evaluation is really important. This involves self-evaluation by the supplier and personnel
visit to the supplier’s place to evaluate them. One for the classification system to rate the
suppliers is the Weighed point evaluation system where in it weights the significance. For
each fulfillment of criteria, the points are awarded and finally summed up and evaluated for
the requirement. Using E-based tools such as ERP / SAP in a collaborative manner could
make ease and transparent the system to reduce the complexities.
Financial Consideration in procurement of materials
The large proposition of the manufactured products cost is due to the procured materials.
Hence for this reason it is important to consider and decrease the total cost effects on
procurement. There are many aspects in this relation. Purchasing larger quantities may gain
quantities and lower the purchase prices but it will increase the Inventory storage cost and
risks of damage. A balance between these two is essential. The purchasing decision will also
affect the Supplier’s cost along with the buyers cost. A long term relation between a supplier
and buyer means cost and risk sharing. Costs usually involve direct procurement cost
(Purchase price, transportation costs, Custom Duties) and indirect cost (administration,
invoicing, material flow costs, quality control, return flows etc.) Cost cutting in all the
possible ways has been the focus for all industries. But most do not trade off Quality for the
costs. (Chopra & Meindl, 2004)
For a buyer there can be many suppliers and vice versa. Hence the suppliers have to be
evaluated.

25
Supplier Evaluations
This is a part of procurement procedure and can be basis of choosing new suppliers either for
one ‘off purchase or a long term future relationship. It may also be the basis for follow up and
development of an existing supplier. The evaluation is set depended on the buyer (company
goals) and it varies according to the Purpose of evaluation. (Chopra & Meindl, 2004)
The common occurring evolution criteria
Significance of the deal for the company
Financial position
Quality and Process Development
Environmental Policy
Technological Status and know-how
Corporate culture, work organization and management
Procurement process
Manufacturing process
Distribution process
Customer service performance
Manufacturing Cycle
The manufacturing cycle typically occurs at the distributor/manufacturer (or
retailer/manufacturer) interfaces and includes all processes involved in replenishing
distributor (or retailer) inventory. The manufacturing cycle is triggered by customer orders (as
is the case with Dell), replenishment orders from a retailer or distributor (Wal-Mart ordering
from P&G), or by the forecast of customer demand and current product availability in the
manufacturer’s finished goods warehouse as per Chopra & Meindl (2004).
Chopra and Meindl (2004) stated that the processes involved in the manufacturing cycle
include the following
• Arrival of order from the finished-goods warehouse, distributor, retailer, or customer
• Production scheduling
• Manufacturing and shipping
• Receiving at the distributor, retailer, or customer
Order Arrival: During this process, a finished-goods warehouse or distributor sets a
replenishment order trigger based on the forecast of future demand and current product
inventories. The resulting order is then conveyed to the manufacturer. In some cases the
customer or retailer may be ordering directly from the manufacturer. In other cases a
manufacturer may be producing to stock a finished-products warehouse. In the latter
situation, the order is triggered based on product availability and a forecast of future demand.
This process is similar to the retail order trigger process in the replenishment cycle.

26
Production Scheduling: This process is similar to the order entry process in the replenishment
cycle where inventory is allocated to an order. During the production scheduling process,
orders (or forecasted orders) are allocated to a production plan. Given the desired production
quantities for each product, the manufacturer must decide on the precise production sequence.
If there are multiple lines, the manufacturer must also decide which products to allocate to
each line. The objective of the production scheduling process is to maximize the proportion of
order filled on time while keeping costs down.
Manufacturing and Shipping: This process is equivalent to the order fulfillment process
described in the replenishment cycle. During the manufacturing phase of the process, the
manufacturer produces according to the production schedule. During the shipping phase of
this process, the product is shipped to the customer, retailer, distributor, or finished-product
warehouse. The objective of the manufacturing and shipping process is to create and ship the
product by the promised due date while meeting quality requirements and keeping costs
down.
Receiving: The product is received by the distributor, finished-goods at the warehouse,
retailer, or customer and inventory records are updated. Other processes related to storage and
fund transfers also take place. (Chopra & Meindl, 2004)
Replenishment Cycle
The replenishment cycle occurs at the retailer/distributor interface and includes all processes
involved in replenishing retailer inventory. It is initiated when a retailer places an order to
replenish inventories to meet future demand. A replenishment cycle may be triggered at a
market that is running out of stock of detergent or at a mail order firm that is low on stock of
a particular shirt (Chopra & Meindl, 2004).
The replenishment cycle is similar to the customer order cycle except that the retailer is now
the customer. The objective of the replenishment cycle is to replenish inventories at the
retailer at minimum cost while providing high product availability. As described by Chopra
and Meindl (2004), the processes involved in the replenishment cycle include
• Retail order trigger
• Retail order entry
• Retail order fulfillment
• Retail order receiving
Retail Order Trigger: As the retailer fills customer demand, inventory is depleted and must
be replenished to meet future demand. A key activity the retailer performs during the
replenishment cycle is to devise replenishment or ordering policy that triggers an order from
the previous stage. The objective when setting replenishment order triggers is to maximize
profitability by ensuring economies of scale and balancing product availability and the cost of

27
holding inventory. The outcome of the retail order trigger process is the generation of a
replenishment order that is ready to be passed on to the distributor or manufacturer.
Retail Order Entry: This process is similar to customer order entry at the retailer. The only
difference is that the retailer is now the customer placing the order that is conveyed to the
distributor. This may be done electronically or by some other medium. Inventory or
production is then allocated to the retail order. The objective of the retail order entry process
is that an order be entered accurately and conveyed quickly to all supply chain processes
affected by the order.
Retail Order Receiving: Once the replenishment order arrives at a retailer, the retailer must
receive it physically and update all inventory records. This process involves product flow
from the distributor to the retailer as well as information updates at the retailer and the flow of
funds from the retailer to the distributor. The objective of the retail order receiving process is
to update inventories and displays quickly and accurately at the lowest possible cost. (Chopra
& Meindl, 2004)
Customer Order Cycle
The customer order cycle occurs at the customer/retailer interface and includes all processes
directly involved in receiving and filling the customer’s order. Typically, the customer
initiates this cycle at a retailer site and the cycle primarily involves filling customer demand.
The retailer’s interaction with the customer starts when the customer arrives or contact is
initiated and ends when the customer receives the order. (Chopra & Meindl, 2004)
The processes involved in the customer order cycle include
• Customer arrival
• Customer order entry
• Customer order fulfillment
• Customer order receiving
Customer Arrival: The term customer arrival refers to the customer’s arrival at the location
where he or she has access to his or her choices and makes a decision regarding a purchase.
The starting point for any supply chain is the arrival of a customer. Customer arrival can
occur when,
• The customer walks into a supermarket to make a purchase
• The customer calls a mail order telemarketing center
• The customer uses the Web or an electronic link to a mail order firm
From the supply chain perspective, the key flow in this process is the customer’s arrival. The
goal is to facilitate the contact between the customer and the appropriate product so that the
customer’s arrival turns into a customer order. The objective of the customer arrival process
is to maximize the conversion of customer arrivals to customer orders.

28
Customer Order Entry: The term customer order entry refers to customers informing the
retailer what products they want to purchase and the retailer allocating products to customers.
At a supermarket, order entry may take the form of customers loading all items that they
intend to purchase onto their carts. At a mail order firm’s telemarketing center or Web site,
order entry may involve customers informing the retailer of the items and quantities they
selected. The objective of the customer order entry process is to ensure that the order entry is
quick, accurate, and communicated to all other supply chain processes that are affected by it.
Customer Order Fulfillment: During the process, the customer’s order is filled and sent to
the customer. At a supermarket, the customer performs this process. At a mail order firm this
process generally includes picking the order from inventory, packaging it, and shipping it to
the customer. All inventories will need to be updated, which may result in the initiation of the
replenishment cycle. In general, customer order fulfillment takes place from retailer
inventory. In a build-to-order scenario, however, order fulfillment takes place directly from
the manufacturer’s production line. The objective of the customer order fulfillment process is
to get the correct orders to customers by the promised due dates at the lowest possible cost.
(Chopra & Meindl, 2004)
Customer Order Receiving: During this process, the customer receives the order and takes
ownership. Records of this receipt may be updated and payment completed. At a
supermarket, receiving occurs at the checkout counter. For a mail order firm, receiving occurs
when the product is delivered to the customer. (Chopra & Meindl, 2004)
3.3 Lean Supply Chain Management – Overview
A lean supply chain is a system which adds value to the entire network by working together
smoothly and by delivering the products and services according to the customer requirements
in a cost effective manner.
According to Duarte (2011), a Lean paradigm connected to SCM is a strategy based on cost
and time reduction to improve the effectiveness; involves in optimizing the process of all
supply chain, searching for simplification, reducing waste and reducing activities that do not
add value.
Lean thinking extended to supply chain comprises of
- Identifying value
- Determining the best sequence for value-creating steps, eliminating wastes
- Performing activities without interruption when a customer request them
- Improving process continually
Shah and Ward (2007), developed a list of lean characteristics,
i. Supplier feedback
ii. JIT delivery by suppliers
iii. Supplier development

29
iv. Customer involvement
v. Pull system
vi. Continuous flow
vii. Set up time reduction
viii. Total preventive maintenance
ix. Employee involvement
Adopters of lean strategy may implement practices such as JIT, long term supplier
relationship etc., to eliminate waste and achieve a lower cost.
3.3.1 Lean Waste
Waste elimination is one of the important ways of improving profitability of any business
organizations.
The major change of lean implementation results in waste reduction. Waste reduction through
lean creates benefits of reduced manufacturing cycle time, improved product quality; reduce
inventory and quicker response to customer. By this overall cycle time in entire supply chain
is improved. Toyota’s Chief engineer Taiichi Ohno (Liker, 2004) identified seven non-value
added waste they are overproduction, waiting, unnecessary transport, over processing, excess
inventory, unnecessary movement, defects. By lean implementation these non-value added
waste are eliminated. The net result is that entire supply chain performance becomes more
efficient and quicker response to customer needs.
The seven non-value added waste (K.Liker, 2004) are,
Overproduction: Producing items when there is no orders generate wastes such as
overstaffing and storage and transportation cost because of excess inventory.
Waiting (time on hand): Waiting occurs when workers are merely serving to watch an
automated machine or having to stand around waiting for the next processing step, tool,
supply, part, etc,. Or being ideal because of stock outs, processing delays, equipment
downtime. The causes of waiting waste are due to unbalanced workload, unplanned
maintenance, long set-up times, etc.
Unnecessary transport or conveyance: Transporting product between processes is a cost
incursion which adds no value to the product. Material handlers must be used to transport the
materials, resulting in another organizational cost that adds no customer value. Carrying work
in process long distances, creating inefficient transport, or moving materials, parts, or finished
goods into or out of storage or between processes. The causes of unnecessary transport are
due to poor understanding of the process flow, widely spaced equipment, etc. (Krueger, 2004)
Over processing or incorrect processing: Taking unnecessary steps to process the parts,
inappropriate processing due to poor tool selection and product design causing unnecessary
motion and producing defects. Waste is generated when providing higher-quality products
than is necessary.

30
Excess Inventory: The waste is concerned with excess raw material, WIP (Work in Process),
or finished goods causing longer lead times, obsolescence, damaged goods, transportation and
storage costs, and delay. The causes of unnecessary inventories waste are large safety stocks,
unbalanced workloads, unreliable supplier shipments, product complexity.
Unnecessary movement: Any movement of employees or machines that doesn’t add value to
the product or service. The causes of unnecessary movement are double handling of goods,
poor layout, inconsistent work methods, poor workplace organization and housekeeping.
Defects: Production of defective parts or correction. The causes of defects are customer needs
not understood, inadequate training to employees, improper maintenance of the machines.
3.3.2 Lean Tools and Methods
5 S’s
5S is a process of work place organization and housekeeping which is carried out gradually
and systematically.
The 5S method is a structured program to implement workplace organization
and standardization. A well-organized workplace motivates people, both on the shop floor as
well as others. 5S improves safety, work efficiency, improves productivity and establishes a
sense of ownership. (Lean manufacturing solutions Inc., 2008)
Figure 6 5S (Matt Wrye, 2011)

31
SEIRI - Remove everything from the workplace that is not needed for production
This is the first stage of 5S is to organize the work area, leaving only the tools and materials
necessary to perform day to day activities. When Sorting is done perfectly, communication
between workers is improved and product quality and productivity are increased.
SEITON - Arrange and label items so they are easily located
This is the second stage of 5S involves the orderly arrangement of needed items so they are
easy to use and accessible for anyone to find. Orderliness eliminates waste in production and
clerical activities.
SEISO - Making sure that everything and all areas are clean and clear
The third stage of 5S is keeping everything clean and swept. This maintains a safer work area
and problem area are quickly identified.
SEIKETSU - How you make Sort, Set, Shine common practice
The fourth stage of 5S involves creating a consistent approach for carrying out tasks and
procedures. Orderliness is the core of standardization and is maintained by visual controls.
SHITSUKE - Making it all regular a common practice by practice by building foundations
and keeping it all together through checking or auditing practices.
The last of stage of 5S is the discipline and commitment of all other stages. Without
sustaining, the work place can easily revert back to being dirty and chaotic. When employees
take pride in their work and workplace it can lead to greater job satisfaction and higher
productivity.
Impact of 5S:
Impact of 5S implementation reduce inventory, efficient on workplace usage, reduce time for
searching spare parts, reduce oil / water / air spilled, cleaning & checking machine condition,
improve working condition, reduce work accident, increase discipline, follow procedure and
better relationship among employees. (Lean manufacturing solutions Inc., 2008)
JIT (Just In Time)
Just in time is a term used to indicate that a process is capable of instant response to demand
without the need for any over stocking, either in expectation of the demand being forth
coming or as a result of inefficiencies in the process (Hutchins, 1999). Waste, any activity
which add cost without increasing the product value, such as unnecessary movement of
materials, accumulation of excess inventory, or the use of faulty production methods that
create products requiring subsequent rework (J.Schonberger, 1984).
JIT also known as lean production or stockless production improve profits and return on
investment by reducing inventory levels, reducing variability, improving product quality,
reducing production and delivery lead times, and reducing other costs.

32
Dennis (2002), listed the key elements of Just In Time
Flexible Work Force
The employees must be trained to operate the number of machines to perform
machine maintenance task and quality inspections. In overall, JIT requires employees
responsible for their own work. In Toyota production system, it tells about the concept of a
“respect for people” maintains good relation between employees and management.
Reduce Lot Size
In order to reduce the lot size in manufacturing and purchase sector, a close
cooperation is necessary with suppliers in order to achieve reduction in order lot size for
purchased items, since this will require frequent deliveries.
Reduce Lead Time
In production department, the lead can be reduced by moving work stations
closer together. This is done by applying group technology and cellular manufacturing
concepts. In delivery department, the lead time can be reduced possibly by locating suppliers
closer to the factory.
Preventive maintenance
It should be carried out during worker and machine ideal time and prevent
break downs.
Level out the workload (heijunka in Japanese):
Heijunka tells about level the production system. It is mainly responsible for
the production control and production management people. Leveling the production schedule
may require some front loading of shipments or postponing of shipments and may have to ask
some customers to wait for the short period of time. Once the production level is more or less
the same or constant for a month, pull system can be applied and balance the assembly line,
but, if a production level varies from day to day, there is no meaning in applying to the
system,because under such circumstance the work task cannot be standardized.
Reduce or eliminate setup time
The main aim for single digit set up times (less than 10 min) or one- touch
setup. It can be carried out by better planning, process re-designs and product re-designs. for
example : improved setup time can be seen in auto racing, where a NASCAR pit crew can
change all the four tires and put gas in the tank under 20 sec. the pit crews efficiency is
achieved by the team members effort and also using specialized equipment and well
coordinate , well – rehearsed process.

33
In station quality (Jidoka in Japanese)
In this program, each and every worker is personally responsible for the
quality of the work they perform and has an authority to stop production when something is
wrong. The various techniques used in Jidoka are Andon lights, Poda yoka, A3 reports and
visual inspection.
Single Lot (Single Unit) Conveyance
They use control system such as Kanban system or other signalling system to
convey parts between work stations in small quantities ideally, one unit at a time. In its
largest sense, just in time is not same thing as Kanban system and Kanban system is not
required to implement just in time.
The benefits of JIT,
1. Lower stock holding means a reduction in storage space which saves rent and
insurances costs.
2. As stock is only obtained when it is needed, less working capital is tied up in stock.
3. Avoids the buildup of unsold finished products that can occur with sudden changes in
demand.
4. Less time is spent on checking and reworking the product of others as the emphasis is
on getting the work right first time.(Dennis, 2002)
Value Stream Mapping
As mentioned by Rowther (1999), value stream mapping is a pencil and paper tool which
helps to visualize and understand the flow of material and information as a product makes its
way through the value stream.
Value stream mapping is a method of creating a “one page picture” of all processes that occur
in a company, from the time a customer places an order for a product, until the customer
received the product in their place. The goal of value stream maps is to document all the
processes used to produce and ship a product, both value-adding and non-value adding
(waste) processes.
The tool helps to visualize more than just a single-process level, the sources of waste in the
each stream is identified. It provides a common language for talking about the manufacturing
process. Once the current state map is created it serves as a baseline for improvement and for
the creation of a future state mapping (Hellström, 2010).
Andon System
Andon is a manufacturing term referring to a system to notify management,
maintenance, and other workers of a quality or process problem. It’s a tool of visual
management. (Petryk, 1999)

34
The alert can be activated manually by a worker using a pull cord or button, or may be
activated automatically by the production equipment itself. The system may include a means
to stop production so the issue can be corrected.
Figure 7 Andon system (Versacall Technologies Inc., 2007)
Benefits
1. The production problems are highlighted immediately they occur reducing lost time and
reducing the risk of late delivery.
2. It increases the output by allowing the staff to understand the progress against target in real
time and also provides the instant feedback to entire team for improving motivation and
morale.
3. Plans and targets are automatically modified based on the current progress. It also controls
the production process.
Kanban
A Kanban System allows a company to use Just-In-Time (J.I.T) Production and Ordering
Systems that allow them to minimize their inventories while still satisfying customer
demands. It is a tool for material flow in the production process.
There are two kinds of Kanban (Dennis, 2002):
Production Kanban; which specifies the kind and quantity of product that the upstream
process (supplier) must produce.
Withdrawal Kanban; which specifies the kind and quantity of product that the downstream
process (customer) may withdraw.

35
Advantages of Kanban
Reduce inventory and product obsolescence
Since component parts are not delivered until just before they are needed, there is a reduced
need for storage space. Should a product or component design be upgraded, that upgrade can
be included in the final product ASAP (As Soon As Possible). There is no inventory of
products or components that become obsolete. This fits well with the kaizen on continual
improvement.
Reduces waste and scrap
With Kanban, products and components are only manufactured when they are needed. This
eliminates overproduction. Raw materials are not delivered until they are needed, reducing
waste and cutting storage costs.
Provides flexibility in production
If there is a sudden drop in demand for a product, Kanban ensures that are not stuck with
excess inventory. This gives the flexibility to rapidly respond to a changing demand. Kanban
also provides flexibility in how the production lines are used. Production areas are not locked
in by their supply chain. They can quickly be switched to different products as demand for
various products changes. Yes, there are still limits imposed by the types of machines and
equipment, and employee skills; however the supply of raw materials and components is
eliminated as a bottleneck.
Increases Output
The flow of Kanban (cards, bins, pallets, etc.) will stop if there is a production problem. This
makes problems visible quickly, allowing them to be corrected.
Kanban reduces wait times by making supplies more accessible and breaking down
administrative barriers. This results in an increase in production using the same resources.
Reduces Total Cost
The Kanban system reduces the total costs by,
Preventing Over Production
Developing Flexible Work Stations
Reducing Waste and Scrap
Minimizing Wait Times and Logistics Costs
Reducing Stock Levels and Overhead Costs
Saving Resources by Streamlining Production
Reducing Inventory Costs

36
Kaizen
Kaizen is a Japanese name for continuous improvement, “Kai” means change or correct to,
“Zen” means good. Kaizen is dedicated to continuous improvement, in small increments, at
all levels, forever. It involves the commitment from top management to shop floor
employees.(Imai,1986)
Kaizen is based on making little changes on a regular basis: always improving productivity,
safety and effectiveness while reducing waste.
Features of Kaizen:
Highly effective and results oriented – Kaizen events will generate quick results, measurable
results, establish the baseline, and measure the change.
Widely applicable – Used in both manufacturing and non-manufacturing firms.
A learning experience – Every member of a Kaizen team will walk away from the event
learning something new. (Imai, 1986)
Total Productive Maintenance (TPM)
Total Productive Maintenance which is one of the key concepts of Lean manufacturing,
changes the view that maintenance is no more than a function that operates in the background
and only appear when needed. It engages all levels and functions in an organization to
maximize the overall effectiveness of production equipment. Whereas maintenance
departments are the traditional centre of preventive maintenance programs, TPM seeks to
involve workers in all levels of department right from plant – floor to senior executive to
ensure effective equipment operation. (EPA-United States Environmental Protection Agency,
1970)
TPM addresses the entire production system life cycle and build a solid plant – floor based
system to prevent accidents. It mainly focuses on preventing breakdowns, mistake-proofing
equipment, mainly to eliminate product defects in order to make maintenance easier
(corrective maintenance), designing and installing equipment that needs little or no
maintenance (no maintenance) and quickly repairing equipment after breakdowns occur
(breakdown maintenance).
According to EPA-United States Environmental Protection Agency (1970), the goal is the
total elimination of all losses, including breakdowns, equipment setup and adjustment losses,
reduced speed, defects and rework, spills and process upset conditions, and startup and yield
losses. The ultimate goal of TPM is zero equipment breakdowns and zero product defects,
which lead to improved utilization of production assets and plant capacity.
One-Piece Flow
One-piece flow or continuous flow processing is a concept means that items are processed
and moved directly from one processing step to the next, one piece at a time. In contrast,

37
“batch and queue” involves mass production of large lots of products or works large number
of transactions at one time – sending them together as a group through each operational step.
(LSS Academy, 2008)
The benefits (LSS Academy, 2008)of one-piece flow,
- Improves safety
When transition is made one piece, the need to lift heavy pallets and containers of
material is limited.
- Builds in Quality
When the item is ‘made one and moved one’ defects are detected immediately
(usually the next work station) forcing immediate corrective action.
- Improves flexibility
One piece is usually faster than batch and queue. This speediness factor allows us
to wait longer to schedule the order (and still deliver on time). And able to respond to the
last minute changes from the customer.
- Reduces Inventory
Work in process (WIP) is reduced. By this it is not necessary to move, store, and
manage piles of inventory.
- Improves productivity
The wastes such as motion, transportation, and waiting are greatly reduced with
one piece flow. The net result the productivity increases.
- Frees up floor space
One piece flow reduces the amount of WIP stored on the floor. For a ideal one
piece flow, the work stations must be connected and not isolated on their own island.
All this frees up floor space for the company to grow their business.
Work Flow Diagram
According to Thornton (2009), a Work flow diagram consists of a sequence of connected
steps. It is a virtual representation of actual work in an organization. The flow being described
refers to a document or product that is being transferred from one step to another, shows the
movement of material, identifying areas of waste. Aids teams to plan future improvements,
such as one piece flow and work cells.
Visually representing the entire workflow allows the employees to better understand not only
their job responsibilities but also other employees’ role which increases accountability.
SMED
As stated by Vorne Industries Inc., (1999) SMED (Single Minute Exchange Die) is a method
for dramatically reducing changeover time at the constraint. As many steps as possible are
converted to external (performed while the process is running) and remaining steps are
streamlined (e.g. bolts and manual adjustments are eliminated).
- Increases usable production time at the constraint.

38
- Enables smaller lot sizes, resulting in improved responsiveness to customer demand.
- Enables smoother start-ups, since a simplified and standardized changeover process
improves quality and consistency.
Poka Yoke
Poka-Yoke (also referred to as “mistake proofing”) designs defect detection and prevention
into equipment with the goal of achieving zero defects. Vorne Industries Inc., (1999)
- Reduces the number of defects (which is also very important post-constraint).
- Enables the operator to spend more time on autonomous maintenance.
3.3.3 Lean Benefits
According to Melton (2005) The Machine that Changed the World by P.Womack, et al.,
(1990) compared and contracted the Mass production system seen in US and Europe, with the
lean production system seen in Japan. The mass producers maintained long production runs,
using standard design which ensured that the customer got a lower cost; they also got only
less variety as they did the workforce seems to be more tedious. In compared to ‘lean’, the
production method required only the half human effort, half manufacturing space, half the
investment and half the engineering hours to develop a new product in half the time.
The implementation of lean manufacturing through trying to make value flow at the pull of
the customer (JIT) prevents and eliminates waste in the process. The seven wastes; inventory,
motion, waiting, transport, over-processing, over production, defects all the waste have
impact on the product cost, which the customer would not be happy to pay for. The
implementation of lean removes all the waste in the process.
Typically Lean will improve (Lean Manufacturing Tools, 2012),
Quality performance, fewer defects and rework (in house and customer)
Fewer Machine and Process Breakdowns.
Lower levels of Inventory.
Greater levels of Stock Turnover.
Less Space Required.
Higher efficiencies, more output per man hour.
Improved delivery performance.
Faster Development.
Greater Customer Satisfaction.
Improved employee morale and involvement.
Improved Supplier Relations.
Increased Business

39
3.3.4 Lean System Model
According to Bergmiller and McCright (2009), Womack and Jones study compared the
practices of Japanese automotive manufactures that pioneered Lean manufacturing system
against American and European manufactures. They also conducted another study in mid
1990’s that took a more global look at lean manufactures, in order to capture their best
practices. The studies identified five core principles of Lean manufacturing. They are i)
specifying value, ii) identifying the value stream, iii) flow, iv) pull and v) perfection.
Value is defined by the customer and is the goods and/ or services the customer purchases.
Anything not directly contributing to the creation of value is considered waste in lean
philosophy. The value stream is the set of all specific actions required to bring products or
services to customer. Mapping the value stream helps companies identify value added steps
versus steps that are wasteful. Once value added steps are identified in the value stream and
wasteful steps are targeted for reduction, the next step is to make product and information
flow freely from value added step to value added step. Pull systems control each stage of
production by only allowing preceding operations to produce when the next operation needs
parts. This ideal Lean system would then achieve perfection when production creates the
products or services required by customers at the very time they are needed without
generating wastes along the way (Jones, 1996).
Liker (2004) revealed the fourteen principles that comprise the Lean manufacturing system
by the detailed study of Toyota Production system for twenty years with full access to Toyota
executives, employees and factories, both in Japan and the United States. The description of
Liker is seemed to be similar to Womack’s, but provided more detail in all aspects of the
manufacturing system. Liker’s fourteen points organized into the 4P model (Liker, 2004) are,
- Philosophy: Long term philosophy
- Process: Continuous flow, Pull systems, Level workload, Emphasis on Quality,
Standardized Tasks and Processes, Visual Controls, Proven technology.
- People: Leaders who live the lean philosophy, Employees who follow the lean
philosophy, Helping partners and suppliers improve.
- Problem solving: Managers who go see problem themselves, consensus decision
making and Rapid Implementation, Building a Learning Organization – Continuously
Improving.
The Shingo Prize for Excellence in Manufacturing is named for Shigeo Shingo, a leading
expert in improving manufacturing processes (Shingo, 2003). The prize promotes awareness
of lean manufacturing concepts and recognizes companies in US, Canada and Mexico
achieving world class status. The Shingo philosophy is that world-class business performance
may be achieved through focused improvements in core manufacturing and business
processes. Criteria used by the Prize Committee are based on leadership, organizational
culture, empowerment, manufacturing strategies, system integration, quality, cost, delivery,
and customer satisfaction (Shingo, 2003). From these sources Bergmiller and McCright
(2009) concluded that, Shingo Prize model is the best representative model for the measure of

40
‘Leanness’. The model shown in figure is the essence of theories of Womack and Jones and
Liker into one coherent model.
Figure 8 Advance lean system model (Bergmiller and McCright, 2009)
3.4 Green Supply Chain Management [GrSCM] – Overview
Mudgal (2009) refer that “greening the supply chains is considered as a process of integration
the environmental values into supply chain”. Greening the supply chains seek to balance
marketing performance with environmental issues. According to (Shang, 2010) green supply
chain management involves finance flow, logistics flow, information flow, integration,
relationships and environmental management, promoting efficiency and synergy between
partners, facilities environmental performance, minimal waste and cost savings.
Necessitated by increasing pressures from different guidelines, regulations and laws
addressing environmental concerns, many companies today have been forced to integrate
green systems into their businesses and manufacturing activities. Green supply chain
management (GrSCM) adds the green component to Supply Chain Management (SCM) to
address the influence and relationships between Supply-Chain Management and the natural
environment. Others have defined it as integrating environmental thinking into supply-chain
management, from product design stage to the recycling stage of the same products.
Specifically, these stages may include product design, materials sourcing and selection,
manufacturing processes, delivery of the final product to the customer as well as the end-of-
life management of the product after its useful life (Srivastava, 2007).
Johansson and Winroth (2009) stated that Green supply chain aims for continuous
improvements of industrial processes and products to reduce or prevent pollution to air, water
and land. They also suggested that by these improvements, there is possibility of minimizing
risks to humans and other species. There are some challenges that has been pointed out by
Lean
Management
Systems
Leadership
Empowerment
Lean Waste
Reduction
Techniques
Vision and
Strategy
Innovation
Partnerships
Operations
Support
Functions
Lean Business
Results
Quality
Cost
Delivery
Customer –
satisfaction
Profitability

41
Richards (1994) in associating with the Green manufacturing which are meeting the customer
demands for environmentally sound products, development of recycling schemes, minimizing
the materials use, and selecting the materials causing low environmental impacts.
The targets of the GrSCM vary widely (NEFEFT - The National Environmental Education &
Training Foundation, 2001), some of the examples are,
Focus on reducing or eliminating materials used in manufacturing processes or
products
Focus on the environmental compliance status and practices of supplier operations
Joint development of new materials, processes or other solutions to environmental
issues.
The methods companies use to work with their suppliers also vary and include:
Requiring suppliers to implement and possibly certify environmental management
systems.
Educating suppliers about materials use, pollution prevention, design for disassembly
or other issues and tools of interest to the customer company.
Enlisting suppliers’ help in developing new materials, parts or processes to address
environmental concerns
Auditing suppliers’ compliance status.
Greening the supply chain is increasingly a concern for many business enterprises and a
challenge for logistics management in the 21st century. Of particular concern is how to raise
Green
Purchasing
Green Packaging &
Transportation
Green
Recycling
GREEN
SUPPLY
CHAIN
Green
Manufacturing
Green
Designing
Green
Marketing
Figure 9 Content in green supply chain (Ninlawana C., 2010)

42
organizational environmental awareness to incorporate environmental management practices
in their logistics activities. (Qinhua, 2008)
3.4.1 Defining GrSCM
According to Srivastava (2007) the green supply chain management is defined as “integrating
environmental thinking into supply-chain management, including product design, material
sourcing and selection, manufacturing processes, delivery of the final product to the
customers as well as end of life management of the product after its useful life”.
According to Sarkis 2010, a comprehensive list included some of the following terms
characterizing the GrSCM concept,
Sustainable supply network management (Matsypura, 2009)
Supply and demand sustainability or corporate social responsibility networks (Kovács,
2004) (Matsypura, 2009)
Supply chain environmental management (Lippman, 2001; Sharfman et al., 2009);
Green purchasing (Min H, 1997)and procurement (Günther, 2006);
Environmental purchasing (Carter C.R, 2000) (Zsidisin G.A, 2001)
Green logistics (Murphy P.R, 2000) and environmental logistics (González-Benito,
2006)
Sustainable supply chains (Linton J.D, 2007)
3.4.2 Motives for Green Supply Chain Management
"A number of companies have worked with suppliers to eliminate unnecessary packaging and
reduce hazardous materials quantities. Some companies are significantly improving both their
environmental profile and profit margins by taking a strategic approach to purchasing." (EPA
- Environmental Protection Agency, 2000)
The green supply chain can be practiced in organization through several internal and external
drivers. New Zealand Business Council for Sustainable Development describes in their report
(NZBCSD, 2003) these three areas as central:
Improving the performance of the business’s own operation
Ensuring that the goods and services provided by suppliers are sustainable and
working with suppliers to increase efficiently and competitiveness.
Working effectively with customers and sales channels to design sustainable products
and services.
The National Environmental Education & Training Foundation (NEETF) is further separating
the internal and external general motivations. The main primary categories from their studies
are concerning risk management, regulatory stance, enhanced brand image, international
purchasing restrictions and costumer pressure (NEFEFT - The National Environmental
Education & Training Foundation, 2001). NZBCSD describes the same main categories with

43
slight differences as adding improved efficiency and emphasizing the cost reduction even
more (NZBCSD, 2003).
Table 1 Motivations for GRSCM (NEFEFT - The National Environmental Education &
Training Foundation, 2001)
Primary Motivations
Internal Motivation and possible effects External Motivation and possible effects
Risk Management Enhanced Brand Image
Supply interruption
Long term risk to human health and the
environment
Competitive disadvantage
Corporate culture of forecasting trends
and moving proactively
Potential for harm to public image due to
environmental concerns
Regulatory stance International purchasing restrictions
Desire to go beyond compliance
Suppliers knowingly or unwittingly
provide materials containing problematic
substances
Supplier non-compliance poses
production risks
Eco-labeling and product take back
gaining momentum
May drive the creation of systems for
collection
Frequently focused on high-profile
brands transport, disassembly or
recycling
Customer Pressure
Often appears in conjunction with a
threat to brand image
Frequently focused on high-profile
brands
Secondary Motivations
Cost reduction
As suppliers apply pollution prevention
Increased Innovation
Can result from supplier participation in
new product development
Enhanced Quality
According to Zhu and Sarkis demonstrated that the quality management has a strong
relationship with Environmental Management Systems (EMS) (Zhu, 2004). A corresponding
study on 16 Chinese automobile manufacturing industries mentioned that they can improve
their EMS practice by learning from their experiences from quality management programs
(Zhu Qinhua, 2008).

44
3.4.3 Environmental and Economic Benefits of Green Supply Chain
Management
The majority of the research exploring the area of GrSCM is considering the initiatives of the
concept, while little research investigates the impact on economic performance to give a
competitive advantage. Zhu & Sarkis indicates that environmental management such as
GrSCM has a positive relationship with an organization’s economic performance. Zhu, et al.,
(2007) suggested that success in addressing environmental issues can provide new
opportunities for competition and new ways to add value to core business programs. Others
claim that the implementation of GrSCM could harm the long-term profitability of an
organization. The economic benefits are not achieved through short term profitability and
sales performance as they pose the concept to endeavor. (Bowen, 2001)
The benefits of GrSCM is classified into two types quantitative and qualitative (Sangwan,
2011). The benefits are derived by several works of Sangwan (2011)
The Qualitative Benefits are as follows,
Improved working condition
Better organization in public
Improved staff morale
Enhanced customer loyalty/satisfaction
Establishing or improving brand value
Lowered regulatory concerns
Increased market opportunities
Improved product performance
Decreased liabilities
The Quantitative benefits are as follows,
Waste related
Reduced waste handling cost
Lowered waste categorization cost
Reduced waste treatment cost
Reduced waste disposal cost
Reduced waste storage cost
Life cycle related
Lowered transportation cost
Decreased packaging cost
Lowered cost of production
Low maintenance cost
Reduced overall cost of organization
The report EPA presents examples of companies who have reduced their costs substantially
with environmental actions in the supply chain (EPA - Environmental Protection Agency,
2000). The study in Dubai (Rettab and Brik, 2008) shows the same idea that GrSCM is

45
beneficial for companies who adopt it. Altogether from previous research that GrSCM is
beneficial for companies who apply it.
3.4.4 Activities in Green Supply Chain Management
Supply Chain when focused from Green context, has many activities. It can be said that the
common activities in the regular supply chain has a greener part right from procurement till
customer end, product life cycle etc., for instance. A Research study was done by (Ninlawana
C., 2010) on electronic industries, where the author proposed the activities of Green Supply
Chain Management in which the major activities are Green Procurement, Green
Manufacturing, Green Distribution and Waste Management as illustrated below in table 2.
Table 2 Activities in Green Supply Chain
Green Supply Chain
Management
Activities in Green Supply Chain
Green Procurement Supplier Selection
4 R’s
Green Manufacturing & Design Hazardous substance control
Energy efficient technology
4R’s and Waste Minimization
Green Distribution Green logistics
Green packaging
Reverse Logistics
Green Marketing Green Brand Image & Promotions
Educating Customers
Interaction & Feedback
Waste Management Final Treatment/ Land fill company
Disassembly/ Recycle plants
Waste collectors
Green Procurement
Green procurement is defined as an environmental purchasing consisting of involvement in
activities that include the reduction, reuse and recycling of materials in the process of
purchasing (Ninlawana C., 2010). Purchasers can improve the environmental performance of
products and services by expressing environmental preferences through so called “green
procurement”. In addition, green procurement is a solution for environmentally concerned
and economically conservative business, and a concept of acquiring a selection of products
and services that minimizes environmental impact (Salam, 2008).

46
Procurement or purchasing decisions will have an impact on the green supply chain through
the purchase of materials that are either recyclable or reusable, or have already been recycled
(Sarkis, 2003). It requires a company or organization to carry out an assessment of the
environmental consequences of a product at all the various stages of its lifecycle. This means
considering the costs of securing raw materials, and manufacturing, transporting, storing,
handling, using and disposing of the product. "Green" products reduce waste, improve energy
efficiency, limit toxic by-products, contain recycled content or are reusable. (Salam, 2008).
There are various important parameters involved in Green Procurement:
Supplier Selection is most important as it tends to influence the materials procured which is
the product itself in the end.
Supplier:
Supplier Selection is most important due to its potentiality with green practices. (Chen &
Wang, 2010) Green purchasing and supply policies can improve companies` environmental
Performance. The criteria from two perspectives: Quantitative criteria and Qualitative criteria.
The quantitative criteria must be expressed in monetary value, i.e. indicating their costs to the
company that selects the suppliers, while the second criteria evaluated qualitatively, including
environmental management competencies, environmental image of suppliers, development of
products with high environmental performance, environmental management system etc,.
Customers:
Customer demands have now become the most important type of external pressure (Doonan,
et al., 2005). They are drivers who demand to obtain more sustainable solutions, also the
products and services apart from being environmental must meet customer requirements
(Zhu. & Sarkis, 2006). Consequently, the influence of the green has a great impact not only
on the organization but also its customers and suppliers (Sarkis, 2003).
Performance Impact:
Performance is a measure for assessing the degree of a corporation’s objective attainment
(Daft, 1995).Corporations adopting GrSCM practices may generate environmental and
business performances (Chien and Shih, 2007; Walton et al., 1998).
A green supply chain, for example, can improve environmental performance (reducing waste
and emissions as well as increasing environmental commitment) and competitiveness
(improving product quality, increasing efficiency, enhancing productivity and cutting cost),
thereby further affecting economic performance (new marketing opportunities and increasing
product price, profit margin, market share and sale volume; (Purba, 2002)
A green supply chain, for example, can improve environmental performance (reducing waste
and emissions as well as increasing environmental commitment) and competitiveness
(improving product quality, increasing efficiency, enhancing productivity and cutting cost),

47
thereby further affecting economic performance (new marketing opportunities and increasing
product price, profit margin, market share and sale volume (Purba, 2002). According to
Walton et al., (1998) and Purba (2002), as well as other experts, organizational performance
is considered to include environmental and financial performance.
Green Manufacturing
Green manufacturing, known as green production or environmentally conscious
manufacturing, takes energy saving and consumption-reducing as the goal; controls the
pollution in the entire production process with the advanced technology and management, in
order to minimize pollution and waste. (Chen & Wang, 2010)
According to Bhateja et al., (2012), green manufacturing is that production process which use
inputs with relatively low environmental impacts, which are highly effective, and which
generate little or no waste or pollution. In manufacturing,
1. Don’t use toxic chemicals or hazardous materials
2. Install water conservation technology
3. Design for re-use
4. Design for recycle
5. Design for minimal packaging requirements
6. Design for scrap and waste minimization
7. Don’t over produce
Green Design
Chen and Wang (2010) stated that green design is also called as Ecological Design, was to
minimize environmentally destructive impacts by integrating itself with living processes.
Green designing focuses on the ecological balance between man and nature, and fully take
environmental effects into account to minimize damage in the whole designing process.
For the automobile designing, green design is the 3R(Reduce, Recycle and Reuse), which
is not only to reduce resource and energy consumption, emissions, and also to make products
and components easily classified, recovery and recycling and reuse.
According to Bhateja, et al., (2012) , Two important design phases process design,
In any industry, the regular process designs has to include the following factors to establish a
green design,
Recycling programs for raw materials
Recycling programs for reusable components parts
Implementing ongoing assessment to measure and ensure Green SCM compliance
Reducing in manufacturing processes
3R Design

48
Using or reusing wastes as ingredients in a process or as an effective substitute for a
commercial product, or returning the waste to the original process which generated it as a
substitute for raw material feedstock is an efficient way to greening the Process and the
product as well.
Product design
Including recycling in new product design
Increasing product robustness in product design
Flexible or Multifunctional product design
Pursuing the green manufacturing of products is very beneficial in the alleviation of
environmental burdens. Green manufacturing is a manufacturing mode designed to minimize
the environmental impact in the manufacturing processes of products and the adoption of
green manufacturing helps to reduce waste and pollution. Environmentally responsible
manufacturing processes, GrSCM practices, and their many related principles have become
important strategies for companies to achieve profit and increase market share objectives by
lowering their environmental impact and enhancing efficiency. (Zhu. & Sarkis, 2006)
Green Distribution
Green distribution consists of Green packaging and Green logistics. The transport
characteristics of the product are influenced by the factors like size, shape and materials
which have an impact on distribution. To overcome this impacts a better packaging along
with rearranged loading patterns can be used to increase the space and reduces the amount of
handling required. (Shalishali, et al., 2009)
Green packaging & Logistics
The sustainable development is majorly influenced by increasing in solid waste, to overcome
this problem the green packaging process is practiced which discusses about the whole
process of packaging life cycle (RanjithKarthik, 2011)
According to Ninlawana (2010) green packaging can be practiced by using a green packaging
materials, promoting recycling and reuse programs and cooperate with vendor to standardize
the packaging.
Green distribution are consists of green packaging and green logistics. Packaging
characteristics such as size, shape, and materials have an impact on distribution because of
their affect on the transport characteristics of the product. Better packaging, along with
rearranged loading patterns, can reduce materials usage, increase space utilization in the
warehouse and in the trailer, and reduce the amount of handling required. According to
Ninlawana (2010) major including activities include:
Green packaging: (1) downsize packaging (2) use “green” packaging materials (3) cooperate
with vendor to standardize packaging (4) minimize material uses and time to unpack

49
(5) encourage and adopt returnable packaging methods (6) promote recycling and reuse
programs
Schafer.A proposed that sustainable transport could make a positive contribution to the
environmental, social and economic sustainability (Schafer.A, 1988). Chen & Wang (2010)
referred that green transport was to achieve the purification of the transport environment
during the goods transportation, to make transportation resources most fully utilized..
According to Ninlawana (2010), green logistics/transportation: (1) deliver directly to user site
(2) use alternative fuel vehicles (3) distribute products together, rather than in smaller batches
(4) change to modal shift.
Reverse Logistics
According to Ninlawana (2010), Reverse logistics is the process of retrieving the product
from the end consumer for the purposes of capturing value or proper disposal. Activities
include collection, combined inspection/selection/sorting, re-processing/direct recovery,
redistribution, and disposal.
According to Srivastava (2007), reverse logistics activities differ from those of traditional
logistics. Reverse logistics networks have some characteristics related to the coordination of
two markets, supply uncertainty, returns disposition decisions, postponement and speculation.
The Reverse Logistics activities are shown in Table 3,
Table 3 Reverse Logistics
Relating to Products Relating to Packaging
REVERSE
LOGISTICS
Return to supplier Reuse
Resell Refurbish
Sell via outlet Reclaim materials
Salvage Recycle
Recondition Salvage
Refurbish
Remanufacture
Reclaim materials
Recycle
Landfill

50
Green Marketing
Environmental marketing was the marketing activities which recognize environmental
stewardship as a business development responsibility and business growth opportunity.
(Bevilacqua, et al., 2011)
Gil Friend said “Green” can be used as a strategic tool to market/promote the business since it
adds value to the product (Friend, 2009). Also Green can be used to promote Brand Image.
(Bhateja, et al., 2012).
According to Chen and Wang (2009), Beattie, K. (2009) proposed that green marketing was a
management process that can identify, anticipate and meet consumers’ social needs, and bring
in profits and sustainable business.
Three keys to successful green marketing:
Projecting potential customers that you follow green business practices and you could reap
more green on your bottom line. Also Green Marketing is a strategy that can help to get more
customers and make more money (Chen & Wang, 2010). But only if everything goes in path.
For green marketing to be effective, three things have to be done; be genuine, educate the
customers, and give them the opportunity to participate.
1) Transparent / Genuine Green Practice promotions.
2) Educating the customers about the importance of Green products
3) Giving the customers an opportunity to participate.
Benefits of Green Marketing
Companies that develop new and improved products and services with environment inputs in
mind give themselves access to new markets, increase their profit sustainability, and enjoy a
competitive advantage over the companies which are not concerned for the environment.
Price
Price is a critical and important factor of green marketing mix. Most consumers will only be
prepared to pay additional value if there is a perception of extra product value. This value
may be improved performance, function, design, visual appeal, or taste. Green marketing
should take all these facts into consideration while charging a premium price.
3.4.5 Waste Management (Green Recycling) – the 4R’s
Waste management is an effective directed approach towards nature because it tries to reduce
the landfills and incineration of the waste materials (Shalishali, et al., 2009). The collection,
transportation, incineration, composting, recycling and disposal combines to form a solid
waste management system model proposed by (Caruso.C, et al., 1993)

51
The 4R’s are Reduce, Reuse, Recycle, Rebuy which contributes to the effective waste
management as mentioned by Davis (2008).
Reduce: Waste prevention, or "source reduction", means consuming and throwing away less.
Source reduction actually prevents the generation of waste in the first place, so it is the most
preferred method of waste management and goes a long way toward protecting the
environment.
Reuse: Reusing items by repairing them, donating them to charity and community groups, or
selling them also reduces waste. Reusing products, when possible, is even better than
recycling because the item does not need to be reprocessed before it can be used again.
Recycle: Recycling transforms materials that would otherwise become waste into valuable
resources. In addition, it generates a host of environmental, financial, and social benefits.
Materials like glass, metal, plastics, and paper are collected, separated and sent to facilities
that can process them into new materials or products.
Rebuy: In order to make recycling economically feasible, recycled products and packaging
must be bought. When recycled products are bought, it creates an economic incentive for
recyclable materials to be collected, manufactured, and marketed as new products.
Remember, you're not recycling unless you're buying recycled products.
Residual waste management
Residual waste management is also known as disposal. This is the long-term storage of solid
wastes in landfills or destruction through incineration. According to (Srivastava, 2007) the
pollution must be prevented at the source rather than managing it after generating. The some
prevention programs are optimizing the distribution network, choosing the best possible
transportation mode for the supply chain, reducing the carton weight and choosing port of
entry analysis.
3.4.6 Life Cycle Assessment (LCA)
Wang et al., referred that Green supply chain is a valuable scope for manufacturers in
managing the environmental strategies (Wang, et al., 2003). To infuse green right from
product life cycle is the basic principle of GrSCM. Also, the supply chain of the product has
to be regulated for green changes in teach and every process. Having green in the Product
Life cycle means that the product and its supply chain become greener which makes it
environmental friendly.
According to Gungor and Gupta (1999) the life cycle assessment is described as a process of
evaluating the environmental, occupational health and the resource-related consequences of a
product through all phases of its life.
According to (IMOA, 1999), LCA is an analytical tool used to systematically measure and
infer the environmental flows to and from the environment. This includes air emissions, water

52
effluents, solid waste, the consumption/depletion of energy and other resources, over the life
cycle of a product or process. LCAs should be performed according to the International
Organization for Standardization (ISO) 14040 series of standards.
According (IMOA, 1999), As per ISO 14040, there are four main parts of an LCA:
1. Goal and Scope definition: specifying the reason for conducting the study, intended use
of study results, intended audience, system boundaries, data requirements, and study
limitations.
2. Life Cycle Inventory (LCI): collecting, validating and aggregating input and output data
to quantify material use, energy use, environmental discharges, and waste associated with
each life cycle stage.
3. Life Cycle Impact Assessment (LCIA): using impact categories, category indicators,
characterization models, equivalency factors, and weighting values to translate an
inventory into potential impact on human health and the environment.
4. Interpretation: assessing whether results are in line with project goals, providing an
unbiased summary of results, defining significant impacts, and recommending methods for
reducing material use and environmental burdens. Examples of life cycle interpretation
include contribution analyses and scenario analyses, both of which are used to help
understand the results of this study.
3.4.7 A Four Step Approach to Green Implementation
The following steps have been provided by the Environmental Protection Agency (EPA) to
make decisions regarding the implementation of Green Supply Chain Management practices
in companies. (EPA - Environmental Protection Agency, 2000)
Figure 10 A Four Step Approach to green implementation (Source - EPA)
Identifying Costs, The first step is to identify the areas within a company where
environmental cost benefits lie. This analysis enables the team to later focus where the
probability for significant improvement is greatest.
Determining Opportunities, Then these potential functional areas and activities are
evaluated in terms of their significant effect the environmental and economic performance of
the company. This step yields a set of possible alternatives with significant potential for
improving costs savings and reducing environmental impacts.
Calculating Benefits, In this step both qualitative and quantitative cost/benefit analyses are
conducted to implement projects. Some of the analytical tools and methods used during this
Identify
Cost
Determine
Opportunities
Calculate
Benefits
Decide,
Implement &
Monitor

53
step are activity-based costing approaches, Net Present Value (NPV) calculations and risk
evaluations. The result is a summary of the merits of the current process and any proposed
alternatives.
Decide, Implement and Monitor, The last step is to decide whether to go with the
implementation or remain as before. After making the decision to pursue environmental
improvements, then the measures are slowly adapted in to such decisions as Material
Resource Planning (MRP) and Enterprise Resource Planning (ERP).The benefits of these
actions are closely monitored. The best practices and implementation guidelines in this step
can enable companies to integrate key concepts into their routine material management
practices.
3.4.8 Advance Green System Model
The green system model proposed below is done by reviewing several author works
Bergmiller and McCright (2009). The model draws from the theories of (EPA -
Environmental Protection Agency, 2000), (Melnyk S A, 2003) (Srivastava, 2007) (Zhu, et al.,
2007) (Zhu, et al., 2007), Bergmiller and McCright (2009) and the ISO standards. The above
mentioned authors suggested ways to develop Green supply chain and green techniques. Each
author suggested different models and technologies for practicing green supply chain on their
own perspective. This model is collective elements of different waste reducing techniques and
green practicing programs suggested by different authors and researchers to achieve desired
business results. The advance green system model proposed here will be the integration of
different leading green models into a one compressive model.
Figure 11 Advance Green System Model (Bergmiller & McCright 2009)
Green
Management
Systems
Environmental
Management
System
ISO14001
Certified
Green Waste
Reduction
Techniques
Process Redesign
Product Redesign
Disassembly
Substitution
Reduce
Recycling
Consume Internally
Returnable
Packaging
Spreading Risks
Creating Markets
Alliances
Waste Segregation
Green Business
Results
Costs
Lead-times
Quality
Market Position
Reputation
Product Design
Process Waste
Equipment
Benefits
International-
Sales

54
3.5 Lean and Green Supply Chain
3.5.1 Lean and Green Paradigms
The Lean supply chain and the green supply chain are two paradigms. Basically, the lean
paradigm focuses on eliminating wastes whereas Green paradigm focuses on environment
friendly production. There are many areas which are common to both the paradigms.
However there are certain areas were Lean and Green cannot go together. The table 4 below
illustrates the Lean and Green Paradigms in context to different attributes.
Table 4 Comparison of lean and green paradigms: the distinguishing attributes
Attributes Lean Paradigm Green Paradigm
General
Purpose
Maximize profits through cost reduction (a)
Reducing environmental risks and impacts
while improving ecological efficiency of
organizations and their partners (b; c; d)
Focus
Focus on cost reduction and increased
flexibility through continuous elimination
of waste or Non Value Added across the
supply chain (e; f)
Focus on sustainable development and the
reduction of ecological impact of industrial
activities through elimination of resource
waste and pollution (a; f)
Customers Economic customer (d)
driven by costs (g)
Profit, People and the Planet (triple bottom
line) (d)
Customer
Satisfaction
Satisfying the customers by reducing
costs and lead times (a)
Satisfying the customers by helping them to
being Green (f; i; j; k)
Supply Chain
Lead Time
Shorten lead time as long as it does not
increase costs (e)
Reduce transportation lead time as long as
it does not increase CO2 emissions (n)
Relationship
with
Suppliers and
Customers
Close, collaborative, reciprocal, trusting
(win-win) long-term relationships with
few selected suppliers (a; e; j; n);
Demand information is spread along the
supply chain (o; p);
Create a network of suppliers to build
common understanding and learning
about waste reduction and operational
efficiency in the delivery of existing
products and services (o)
Inter-organizational collaboration involving
transferring or/and disseminating Green
knowledge to partners (q)
and customer
cooperation (c)
and environmental risk-
sharing (a);
Integration of reverse material
and information (a)
Product
Design
Maximize performance and minimize cost (e)
Eco-design and Life-Cycle Assessment for
evaluating ecological risks and impact (c; r)
Raw Material
Sourcing
Supplier attributes involve low cost and
high quality (e)
Green purchasing
(c; o)
Manufacturi
ng
Maintain high average utilization rate (e)
;
using JIT practices, ‘pulling’ the goods
through the system based on demand (o)
Focus on resource efficiency and waste
reduction for environmental benefit and
developing of remanufacturing capabilities

55
to integrate reusable/remanufactured
components (s)
Inventory
Generates high turnover and minimizes
inventory throughout the chain (e)
in order
to reduce costs and free up assets (t)
Minimize inventory by reducing redundant
materials (u)
to free up space (v)
; Introducing
reusable/remanufactured parts in material
inventory (w)
Transport
Minimize material handling during
manufacturing, encourages frequent small
deliveries of supplies and finished
products (a)
Reduce replenishment frequency in order to
reduce fuel consumption and CO2
emissions (n)
End-of-Life
Consideration stops with sale of product;
No concern for impact of product use or
end-of-life recovery (w)
Considers impact of product use as well as
end-of-life recovery in form of re-use or
recycling (w)
Principal
Tool
Value Stream Mapping: deep
understanding of all the processes
required to bring a product to market (aa)
Life-Cycle Assessment:
Deep understanding of all the processes
required to bring a product to market
considering product design, product use and
end-of-life management (y)
Waste
Reduction
Techniques
Vision and strategy, Innovation,
Partnerships, Operations, Support
functions (l)
; 7 Wastes: Elimination of
waste in all operational processes,
internally and externally, that arise as
from overproduction, transportation,
waiting, over processing, defects and
unnecessary inventory and motion (o)
Product Redesign, Process Redesign,
Substitution, Prolong Use, Disassembly,
Remanufacturing, Reduce, Consume by-
products internally, Returnable Packaging,
Waste Segregation, Recycling, Spreading
Risks, Creating Markets, Alliances (l, z)
Tools/
Practices
VSM (aa)
; Inventory minimization, Higher
resources, utilization rate, Information
spreading through the network, JIT,
Shorter lead times (a)
Sustainable VSM(aa)
; Efficiency of resource
consumption, Reduction of redundant and
unnecessary materials, Waste (energy,
water, raw materials and non-product
output) minimization, Reduction of
transportation lead time,
Reduction of replenishment frequency,
Integration of the reverse material and
information flow in the SC, Environmental
risk sharing (a)
Source: (a) (Carvalho & Cruz-Machado, 2009); (b) (Carvalho & Cruz-Machado, 2009) referring to (Rao & Holt,
2005); (c) (Zhu, et al., 2008); (d) (Society of Manufacturing Engineers (SME), 2008); (e) (Vonderembse, et al.,
2006); (f) (Mollenkopf, et al., 2010); (g) (Christopher & Towill, 2000) referring to (Mason-Jones, et al., 2000);
(h) (Gordon, 2001); (i) (KPMG, 2011); (j) (Hines, et al., 2004); (k) (Yang, et al., 2011); (l) (Bergmiller &
McCright, 2009); (m) (Carvalho & Cruz-Machado, 2009) referring to (Bowen, et al., 2001); (n) (Venkat &
Wakeland, 2006); (o) (Cox, 1999); (p) (Carvalho & Cruz-Machado, 2009) referring to (Melton, 2005); (q)
(Carvalho & Cruz-Machado, 2009) referring to (Cheng, et al., 2008); (r) (Carvalho & Cruz-Machado, 2009)
referring to (Gottberg, et al., 2006); (s) (Sarkis, 2003); (t) (Nicholas.J.M., 1998); (u) (Carvalho & Cruz-
Machado, 2009) referring to (Darnall, et al., 2008); (v) (Franchetti, et al., 2009); (w) (Srivastava, 2007); (x)
(United Nations (UN), 1987); (y)(Kainuma & Tawara, 2006); (z) (Melnyk, et al., 2003); (aa) (Simons & Mason,
2003)

56
3.5.2 Interface of Lean and Green Supply chain strategy
As discussed earlier in chapter 3.3, lean supply chain management literature is well
developed. But, nowadays there is a rising concern about the environmental issues has
increased in the synergy between green and lean business practices. The lean process mainly
focuses on waste elimination but also includes a decline of environmental waste. The
relationship between lean processes and environmental sustainability was been much debated
in the literature (King & Lenox, 2001). Innovative firms are continuously improving
manufacturing process seem to take on environmental innovations (Florida, 1996). But from
the auto industry research (Rothenberg, et al., 2001) indicates that all lean processes and
waste reduction are not positively related to environmental performance or pollution
reduction.
The findings are based on surveys on environmental performance and manufacturing
performance in addition to qualitative interviews at 17 manufacturing plants, the results
shows that the plants with lean processes have higher volatile organic compound emission
than plants where such lean practices have not been implemented. The difference relate to the
paint application process, when spray paints are used as it is cost effective and yield better
quality, but the impact of such paint was more environmentally damaging. This shows that
lean and green practices may not also be compatible (Mollenkopf, et al., 2010).
Lean practices do not necessarily reduce carbon dioxide emissions. Through the pull system
with small batches and JIT delivery, Lean prescribes an increase in the replenishment
frequency whereas Green practices aim at reducing transport time and replenishment
frequencies (Venkat & Wakeland, 2006), (Carvalho & Cruz-Machado, 2009) Transport, as
the major producer of CO2 emissions, plays an important role in pursuing Green practices.
When a supply chain is long and geographically wide-spread, although it may be Lean, it is
not necessarily Green due to increased amounts of CO2 emissions from transport (Venkat &
Wakeland, 2006)
Moreover, efficiency gains in light of Lean practices in the areas of inventory reduction and
small batch size production, for example, may lead to greater production of waste (King &
Lenox, 2001). In small batch size production, more frequent changeovers are required. These
might be carried out very fast, according to the Single Minute Exchange of Dies (SMED)
principle, however, they increase the amount of cleaning (and consequently cleaning
products) required and also enhance disposal of unused process material (King & Lenox,
2001).
The integration of lean supply chain processes and environmental practices is driven by both
internal and external factors. Internal drivers include cost reduction and profitability,
commodity risk management, and the preservation of a corporate culture. External drivers
include government norms, environmental pressures, a similar focus on continuous
innovation and process improvement.
There are several barriers in implementing lean and green supply chain including a lack of
environmental awareness, the most common belief is that environmental practices do not pay

57
and the perception that green initiatives are time consuming and expensive. The table 5 below
summarizes the lean and green supply chain interface.
Table 5 Summary of lean and green supply chain interface (Mollenkopf, et al., 2010)
Concept Definition
Citation
Drivers
Cost reduction In the grocery industry, lean and green
applications are driven by cost (Friedman, 2008)
Commodity risk
management
Lean and green applications both add to a
product’s viability in the market place (Friedman, 2008)
Corporate culture Lean and green initiatives are both driven from
the top down within firms (Friedman, 2008)
Government regulations
and standards
Regulations and ISO standards (9000 and
14000) are becoming integral in a firm’s
reputation and corporate image
(Hansen, et al., 2004)
(Cole, 2008)
(Kleindorfer, et al.,
2005)
Customer and
stakeholder pressure
Firms reported that their visibility to customers
was a driving force
(Hall, 2000) (Cole,
2008)
Profitability
Environmental practices in industry can enhance
profitability by improving customer satisfaction
and loyalty
(Kleindorfer, et al.,
2005)
Focus on innovation
Innovation and Process improvement created by
lean processes expands to environmental
improvements
(Florida, 1996)
Barriers
Unawareness
Firms with lean practices in place do not
strategically seek environmental benefits and
often do not recognize environmental risks
(Rothenberg, et al.,
2001)
Lack of expected profits Common belief that green practices do not pay
and “erode competitiveness”
(Porter & Van der
Linde, 1995)
Cost
Lean processes are often pursued for cost
reductions, but green initiatives are seen as time
consuming and expensive to set up.
(Rothenberg, et al.,
2001)
3.5.3 Implementing Green and Lean supply chain strategies
Lean operations add to competitive advantage through implementing complementary
elements of environmental performance (Hart, 1997). Lean emphasis on rework elimination
requires efficient systems to reduce generation of undesired by-products, thus creating an
environmental benefit (James P.Womack, 1990)(Friedman, 2008). Lean practices can lead to
environmental benefits, inversely environmental practices often lead to improved lean
practices (Kleindorfer, et al., 2005)(Hansen, et al., 2004). In practice, the implementation of
both lean and green supply chain strategies involves organizations that pursue ISO-9000

58
quality standards are likely to adopt ISO-14000 environmental standards (King & Lenox,
2001).
Wal-Mart has recognized that aligning green and lean practices across the supply chain drives
the financial performance of the firm and earns respect from customers (Friedman, 2008).
Firms that are benchmarked by Environmental Protection Agency (EPA) have increased
savings by balancing strict lean principles and environmental efficiency. Organizations such
as General Motors, Andersen corporation, Intel, 3M and Com Ed have saved significantly by
integrating green and lean initiatives. Green and lean supply chain strategies examples can be
seen in the furniture industry. Organizations have identified ways to reuse sawdust and wood
scraps, employ alternative technologies to reduce VOC emissions, eliminate rework through
increased efficiency and utilize recyclable pallets for deliveries (Handfield, et al., 1997).
Lean supply arrangements demand high levels of information sharing, rapid performance
improvements with suppliers and minimal transaction costs (Dyer, 1997) (Lamming &
Hampson, 1996). This type of relationship may provide the incentive firms need to bridge the
lean and environmental supply chain practices of their suppliers. Improvements in
manufacturing systems can lead to direct and indirect benefits for environmental
management, usually in the form of waste reduction (Simpson & Power, 2005).
3.5.4 Drivers & Barriers of Lean Supply Chain Management
Lean Drivers
Lean initiatives are predominantly driven by the desire to cut costs and increase operating
efficiency. Common themes included economic cost reductions, process optimization, and
corporate culture which are listed in table 6. (Mollenkopf, et al., 2010).
Table 6 Drivers of Lean Supply Chain Management (Mollenkopf, et al., 2010)
Driver Description/Example
Process Optimization
Efficiency Maximize efficiency of processes/routing for reduced cost and
throughput speed
Inventory Reduction
Reduction of inventory drives make-to-order production
processes and cost savings
Capacity Increase utilization of capacity
Waste Minimization
Reduce process waste for increased
efficiency and cost savings
Reduce process waste for increased efficiency and cost
savings
Technology Improvement Significant developments in technology facilitate optimization
of route structures and on-time delivery.
Economic
Cost Savings
More efficient processes allow users to complete tasks in less
time, saving money on overhead and labour costs.
Focus on total cost reduction with suppliers creates cost
savings. Attempt to decrease the cost of operations in
comparison to competitors by utilizing lean techniques.

59
Competitive Pressure
Benchmark industry leaders and promote implementation of
lean best practices. Proactive implementation of lean provides
advantage over competitors.
Long-Term
Viability
Efficient processes help position the organization for long-
term competition and viability
Economic Environment
Downsizing of organization is driving the need for more
lean/quality implementation and resource reduction (survival
lean)
Continuous Improvement Cost savings from successful lean implementation spurs the
desire for continuous improvement
Corporate Culture
Strategy Strong corporate culture drives lean initiatives throughout
each facility and functional area and across the supply chain
Employee Buy-In Key managers work to get lean thinking into mindset of
employees at all levels.
Senior Leadership Top management and corporate leadership embrace lean
initiatives and the lean mentality
Employee Awareness
Educated and engaged employees facilitate implementation of
lean initiatives. Employees contribute ideas for continuous
improvement and research and development projects.
Continuous Improvement
Training programs are stressing continuous improvement in
leadership and processes, driving the lean initiatives and
quality management focus to be a part of the firm’s
philosophy.
Business Norms Lean principles become the standard way of doing business.
Outsourcing Considering outsourcing as a method to improve process and
product efficiencies while focusing on core competencies.
Performance Metrics
Performance metrics tied to organizational lean objectives,
expectations and continuous improvement goals drive
employee behavior.
Measurement
Inventory Measurement Reports
Inventory is measured through overstock reports, open
purchase order reports, and service reports to measure
customer needs and decrease inventory in the system as a
whole.
Supplier Collaboration Suppliers facilitate cost savings initiatives.
Technology
Supplier System Access Established systems for suppliers’ access to inventory
information for better planning of production and schedules.
External Environment
Inventory Optimization
Balance purchases against run size – focus on total cost
versus price. On-time deliveries and process management
allow for key inventory reductions, great inventory control,
tying up less cash in inventory.
Logistics
Warehouse Optimization
Improvements in the organization of warehouse facilities
allow for reduced process time and increased inventory
control.

60
Lean Barriers
For a company to change and adopt to Lean, from their conventional practices, more changes,
plans and effort is required and also there are many barriers. The most common barriers
included economic factors, corporate culture, and functional silos which are presented in the
table 7. (Mollenkopf, et al., 2010)
Table 7 Barriers of Lean Supply Chain Management (Mollenkopf, et al., 2010)
Barriers Description/Example
Economic Factors
Total Cost of
Ownership
An understanding of long-term, total cost perspective is necessary for
implementing lean initiatives because initial process changes may be more costly in
the short-term or require extensive up-front investment
Current
Economic
Situation
Reduced order volume causes a backlog of shipments from suppliers and increased
inventory levels.
Supplier
Trouble
Suppliers are starting to go out of business forcing buyers to choose between lean
and risk management.
Corporate Culture
Senior
Leadership
Lack of participation and understanding from senior leadership can hinder shift to
lean thinking; lean is about learning, which requires listening.
Employee
Mentality
Employees are not accustomed to voicing their opinion about changes to make
processes more efficient.
Resistance to
Change
Employees may be resistant to changes in traditional processes because they may
not realize potential benefits of lean programs.
Strategy &
Objectives No overarching lean strategy, metrics and measures; lean is functionally oriented.
Internal Structure
Lack of
Resources
Resources are not available to visit suppliers and drive lean initiatives throughout
supply chain.
Resistance to
Change Employees often resistant to change from traditional processes.

61
3.5.5 Driver & Barriers of Green Supply Chain Management
Introducing or following Green in a firm supply chain is influenced by various factors. What
makes a firm to move towards / achieve Green in the supply Chain? The Drive factors and the
Sources are tabulated as below in table 8.
Table 8 Drivers of GrSCM (Mollenkopf, et al., 2010)
Drive Factor Sources
1. Environmental collaboration with suppliers
(Vachon.S, 2007), (Zhu.Q, et al., 2007)
(Zhu.Q, et al., 2007) (Zhu.Q, et al., 2007)
(Zhu.Q, et al., 2007) (Zhu Q, 2008a) Zhu et al
(2007 a,b,2008 a,b,c) and Paulraj (2009)
2.
Collaboration between product designers and
supplier to reduce waste and eliminate product
environmental impact
Lippman, 2001), Zhu et al., (2005),Holt and
Ghobadian (2009)
3. Supplier relationship closeness Tan et al (1998)
4. Satisfy customer needs Dreyer and Gronhaug (2004)
5. The product conformance quality Chase et al (2001)
6. Flexibility of supplier Chase et al (2001)
7. Internal service quality Farmer (1997), Harland et al.(1999),
Stanley and Wisner (2001)
8. Green design Sarkis (1998), Zhu and Sarkis (2006)
9. Green purchasing Zhu and Geng (2001)
10. ISO 14000 Sarkis (1998)
11. Internal green production plan Farmer (1997), Harland et al.(1999),Stanley
and Wisner (2001)
12. Cleanser production Farmer (1997), Harland et al.(1999), Stanley
and Wisner (2001)
13. The needs of their suppliers Carr and Smeltzer (1999)
14. The number of patents Damanpour and Wischnevsky (2006)
15. Degree of innovativeness of R&D green
products Damanpour and Wischnevsky (2006)
Green Barriers
In spite of various benefits and driving forces towards Greener supply chain, there are several
factors which create resistance. Some of the more common Barriers for Green Supply chain
are presented in table 9.

62
Table 9 Barriers of GrSCM (Mollenkopf, et al., 2010)
Barrier to
GSCM Description Researcher’s
1.
Resistance to
Technology
Advancement
Adoption
Resistance to Technology advancement
adoption is not doing advancements in
machinery and equipments to improve the
products.
Hosseini (2007); Cooper
(1994); Hsu et al. (2008);
Digalwar et al. (2004); Gant
(1996); TSai et al. (1999);
AlKhidir et al. (2009).
2.
Lack of
Organization
Encouragement
Lack of Organization Encouragement is not
motivating the employees towards GSCM.
Yu Lin (2007); Yu Lin et al.
(2008); Hsu et al. (2008);
Chien et al. (2007); Ravi et
al. (2005).
3.
Lack of Quality
of Human
Resources
Lack of Quality of human resources means not
recruiting well qualified and professionals.
Yu Lin (2007); Yu Lin et al.
(2008); Hsu et al. (2008);
Chien et al. (2007).
4.
Market
Competition and
Uncertainty
Market Competition and Uncertainty is very
high due to global competitiveness, and
varying customer’s requirements
Hosseini (2007); Yu Lin
(2007); Mudgal et al. (2010).
5.
Lack of
Government
Support
systems
Lack of Government support systems means
Government not making industry friendly
policies toward GSCM and not giving special
benefits to those organizations implementing
GSCM.
Hosseini (2007); Yu Lin et
al. (2008); Hsu et al. (2008);
Mudgal et al. (2009); Mudgal
et al. (2010); Scupola (2003);
Srivastva (2007).
6.
Lack of
Implementing
Green
Practices
Lack of Innovative Green Practices means not
taking consideration of practices like
hazardous solid waste disposal, energy
conservation, reusing and recycling materials
etc.
Yu Lin et al. (2008); Hsu et
al. (2008); Mudgal et al.
(2009); Ravi et al. (2005).
7.
Lack of Top
Management
Commitment
Lack of Top Management Commitment means
that top management not showing interests in
green practices.
Digalwar et al. (2004);
Hamel et al. (1989); Sarkis
(2009); Mudgal et al. (2009);
Mudgal et al. (2010); Ravi V.
et al. (2005); Zhu (2007).
8. Cost
Implications
The high investment requirement by green
Methodologies such as green design, green
manufacturing, green labeling of packing etc.
Hosseini (2007); Mudgal et
al. (2009); Ravi et al. (2005);
AlKhidir et al. (2009).
9.
Supplier
Reluctance to
change
towards
GSCM
Supplier reluctance to change towards GSCM
means not involvement of the suppliers in
design process and technology, which affects
overall performance of whole chain.
Hsu et al. (2008); Kannan et
al. (2008); Lettice et al.
(2010); Ravi et al. (2005);
Srivastva (2007); Sarkar et
al. (2006).
10. Unawareness
of customers
Unawareness of Customers means that
customers do not know about green products
and their benefits.
Lamming et al. (1996);
Mudgal et al. (2009); Ravi et
al. (2005); Zhu et al. (2004);
Zhu et al. (2007); Zhu et al.
(2008).

63
3.5.6 Environmental Impacts of Lean Wastes
Even without openly targeting environmental outcomes, lean practices can yield substantial
environmental benefits. Lean methods focus on improving resource productivity and
production efficiency, leading organizations to continually reduce the materials, energy,
water, space, and equipment needed per unit of production.
There are seven common types of waste that lean works to eliminate and the environmental
impacts often associated with each of them. Reducing these manufacturing wastes through
lean implementation correspondingly decreases the environmental "footprint" of an
organization's operations. For instance, reducing defects eliminates the environmental impacts
associated with the materials and processing used to create the defective product, as well as
the waste and emissions stemming from reworking or disposing of the defective products.
This is listed clearly in table 10.
Table 10 Environmental Impacts of Lean wastes
Waste Type Environmental Impacts
Defects
Raw materials consumed in making defective products
Defective components require recycling or disposal
More space required for rework and repair, increasing energy use for
heating, cooling, and lighting
Waiting Potential material spoilage or component damage causing waste
Wasted energy from heating, cooling, and lighting during production
downtime
Overproduction More raw materials consumed in making the unneeded products
Extra products may spoil or become obsolete requiring disposal
Movement
More energy use for transport
Emissions from transport
More space required for work-in-process (WIP) movement, increasing
lighting, heating, and cooling demand and energy consumption
More packaging required to protect components during movement
Inventory
More packaging to store WIP
Waste from deterioration or damage to stored WIP
More materials needed to replace damaged WIP
More energy used to heat, cool, and light inventory space
Complexity More parts and raw materials consumed per unit of production
Unnecessary processing increases waste, energy use, and emissions
Unused
creativity Fewer suggestions of pollution prevention and waste minimization
opportunities

64
Summary of theoretical framework
To summarize the theoretical framework, the basic conceptual framework of logistics, supply
chain management and its cycles and the activities within them are discussed above. Lean
supply management is explored in detail explaining about lean waste and ways to prevent it
by lean tools & methods and its benefits. The lean system model developed by Shingo is
advancement/improvement in lean practice. Similarly green supply chain management is
explored in detail about explaining motives for GrSCM, its activities and the benefits.
Advanced green system model helps us to understand the green management system which
involves waste reduction techniques to give desired green business results. The perspectives
of lean and green supply chain paradigms are visualized and inferred about their interface,
implementation strategies drivers, barriers and benefits.
With the knowledge gained and with the scope to explore the case companies for relevant
information, questionnaire is prepared and the case companies’ results are projected in
chapter 4. Having described about supply chain, Lean, Green and their Integration, the way
that these have contribute for improving the supply chain are analyzed and discussed in the
chapter 5. Many important factors based on their influence over the supply chain are
considered for building the model which is discussed in chapter 6.
65
4 EMPRICAL RESULT
This chapter is divided into two parts; the first part presents about case company results of lean
supply chain management and second part presents about case company results of green supply
chain management. The results from the case companies serve as a base for building the model.
The data was collected from 5 Volvo Group companies: Volvo Construction Equipments
(Bangalore IND, Eskilstuna SWE, and Braås SWE), Volvo Buses: Bangalore IND, VE
Commercial Vehicles: Pithampur – IND.
Result from Interviews/Survey
The participants were asked in and out of the questionnaire during the interviews and they
had given the best answers depending to their area of knowledge. The survey invitations have
been sent to many participants in each company. Totally 24 participants responded through
interviews and surveys. The result shows collectively, how the companies functioning and
their view towards lean and green aspects. The results are formulated based on the objective
of the thesis. More discussion is carried out in the analysis part.
4.1 CASE COMPANY RESULTS: LEAN SUPPLY CHAIN
MANAGEMENT
Case Company 1 – Volvo Construction Equipments, Bangalore
Current Practices:
The company started implementing lean practices from 2005. The main reason for
implementing lean practices is in order to keep them in existence in the market; and to
increase their production efficiency and in the reduction of waste.
The company has a dedicated team for Lean, having 22 training modules of VPS (Volvo
Production System) with 6 principle leaders. Almost all the employees are involved in lean
practices. There are two organization involved in lean activities, 1) Improvement Support
Organization which is used for planning the lean activities, 2) Improvement Work
Organization which is used for implementing them.
Lean Tools, Methods and Waste elimination
The lean tools such as 5S, JIT, Kanban, Kaizen, SMED, Value stream mapping, TPM are
used. The company is working continuously to improve the usage of the tools with proper
employee trainee programme.

66
The company is using Single piece flow in the production line which means at any time only
one component is moving. For Road Machinery it is 1 line with 7 Stations and 8 Feeders and
for Excavators it is 1 line with 8 stations and 15 feeders.
The company is taking steps in the elimination of non-value added activities. (Over
production, waiting, unnecessary transport, over processing, excess inventory, unnecessary
Movement, defects).
Successful Lean Project
The Company executed a lean project during the year 2008, during which the market was
down due to the crisis. The production capacity at that time was 3 machines a day. Initially to
take up the project, a group of 35 members were selected including blue and white collars.
Then the change management program was taken up during this project. For the
implementation of lean the time study, motion study and video capturing of the entire
production was made so as to identify the defects in building the machines. The company
redefined each and every system in the line. The production line was changed into line
concept and standardization is carried out, earlier it was bay build concept. During the project
phase 3 machines was manufactured in 3 months all the waste areas and the defect on lines
were identified and the change management was successfully finished.
The machines were produced according to lean principles from February 2009, during the
month of February they produced 7 machines. The lean practices and tools were continuously
enhanced and the production capacity was increased month by month. In March, they
produced 21 machines and 40 machines in April. During this program, all the employees
were trained with each and every lean principles and modules. It is done for both the change
management and Lean program. As a result of this project, the company supply chain was
enhanced and productivity increased by 33%.
Case Company 2 – Volvo Construction Equipments, Eskilstuna
Current Practices:
The company follows Lean in order to stay competitive. The company has many competitors
of which CAT, Komatsu and Hitachi are potential. Lean is Implemented and practiced in the
industry but not in depth. The company believes that when their quality increases, their
inventory levels should go down. They are working towards achieving their KPI’s as Target.
SMED is a challenge to the company.
Earlier, the company used consultants for effective VPS implementation, it took 12 weeks
and everything went well. But when the consultants moved, the system paced down, came
back to the previous scenario and the improvements vanished. Then the company decided to
have a responsible person (VPS Navigators) with in their industry. Each person is responsible
for every module. They believe that better foundations can be established when people
67
working in Volvo Learn and Manage the operations having the VPS navigators within their
company.
The responded addressed that the industry believes that leadership is essential along with the
tools needed pre requisite for pull systems. Module owner is responsible for concentrating &
bringing up the module to achieve the yearly goal. The company has Audits for improvement,
5S audit need to get better. Tape marking is done for placing the objects.
Lean wastes, tools & methods:
All wastes (Transport, Inventory, Waiting, Overproduction, Over processing, Defects) are
available & unused employee creativity.
The company is using VSM to identify the wastes, but not frequently. Currently they are
planning to start VSM for the axle flow. SMED is used to identify high batch size and longer
lead times. Corrective measures like having the line in “U” shape are done in order to reduce
the WIP inventory. According to the respondent, the company uses 5S to work easily. They
are establishing Standardized work to do in the shop floor rather than following what is
instructed by the engineer. TPM implementation in the industry helps to make preventive
instead of corrective TPM - Maintenance work. Kanban – Card system is used with marked
levels in the shop floor. If yellow card is received it implies that products are needed and
orange means that the safety stock is being used and products are urgently needed. The
company is having visual control (Andon) electronically and aiming for lights.
Mixed chase and level strategy (i.e combination of chasing the demand as per requirement
and leveling the production for a particular period) is followed but the company is striving
towards for a level strategy. But at times if there is an increase in the demand in the forecast,
then the production capacity is planned according and inventory is stocked. But when the
scenario is balanced and prevented from rise of too much inventory.
Case Company 3 – Volvo Construction Equipments, Braås
Current Practices:
The company started lean principles owing to the reason that Lean is a proven way to achieve
quality and customer satisfaction. The company is trying to integrate lean core values,
improving quality and customer satisfaction.
Lean Tools & Methods:
The company is following almost all the tools. They are arranging Kaizen events and
continuously making improvements. VSM is done continuously to reduce the lead time by
eliminating / reducing the non-value added activities in the process. Poka-Yoke is used in the
design phase where the assembly parts are designed that it cannot be misassembled in a
wrong way which reduces their chances of having defects or rework. The company has an

68
Inventory turnover rate of 17 times and the company is trying to increase it. The industry uses
a Kanban (2-bin system) and in the painting shop, Kanban is employed for body, frame and
components.
The company faces the difficulty in effectively following one piece flow. This is due to the
fact that, there are more bottle necks due to different process times. But they are trying to
bring their process as one piece flow. TPM is followed in the industry; they have standardized
maintenance procedures which are carried out continuously. Boards are used for Visual
Management tools.
The company is trying to balance the workload in the stations. Also they are changing the
production levels twice a year, by January and by august after vacation. This is based on the
forecast.
In Volvo CE Braås, in 2008, the dumpers of the articulated haulers were bought and stored as
inventories to meet the rising demand. Since the supplier base was not near and hence to meet
the demand properly the industry stored inventories. But when crisis hit the ground, the
orders vanished and many confirmed orders too were taken back. There was a huge capital
locked in the inventories. New problems were storing the dumpers until the market recovery,
if new design is developed the requirement for this eventually drops down, it consumes a
whole lot of money to send it back to the supplier for recycling. This is a no go situation for
the industry, but to wait for the orders.
Case Company 4: Volvo Buses, Bangalore
Current Practices:
The company decided to use lean practices mainly to have a control on inventory, optimize
the space requirement, have better control on missing parts, proper control on KPI’s, and
which in turn helps to improve industry performance. The company is not fully implemented
with lean practices. But the tools and the principles are started to use since 2009. At present
the company is taking effective steps for the implementation of VPS standards and lean
principles.
Lean Tools, Methods and Waste elimination
The lean tools followed in the company are 5S, JIT, Kanban, Inventory Turnover rate,
Kaizen, OEE and Visual Management. There is no dedicated team for lean improvements; all
the employees are involved in the improvements where they have their own responsibility.
Since the company is not fully implemented with lean, the organization is improving slowly,
still lots many have to be done for the improvement (40-50%). But so far it is giving good
result from them.

69
For example – the company has made lot of changes in the warehouse. Earlier the product
location is not well identified, which makes more difficult to identify the product (Handling
difficulties). Now it is entirely redefined, each product item is given a SAP material code and
the products are placed in the appropriate locations.
Lots of visuals have been made, and the non-moving items are moved to another location.
The work is ongoing. Everywhere min-max is put up in the warehouse, so that to prevent
going out of stock. When is going below min level, by this it can be alarmed to refill the items
in the appropriate places.
Lean Waste
The lean wastes are prevalent throughout the entire factory where men (unused), machine,
material which are non-value activities. Because of this difficulties are face throughout the
entire supply chain.
The company’s production is based on demand. It is not stabilized, since the company is
customer focused. (Stabilization of production is not followed). But all the work is
standardized. Based on the demand, every four hours induction of bus in the assembly line is
different. Purely it is based on demand. The company, at present is in expansion plan to meet
out the customer demands. At present per day induction capacity are up to five buses, by the
next year end it will go up to 10 buses, based on the expansion and demand.
At the present, the chassis parts are imported from Sweden. Complete chassis assembly is
done by Volvo India truck factory and then it is sent to Volvo buses factory for the complete
bus body building. But in future (after June 2012), plan are proposed to do the assembly in
Volvo buses India factory itself.
The company uses tools for visual control systems like 5S, Kanban, JIT. Proposal has been
proposed for the implementation of Andon systems.
The JIT is not interfaced with supplier, it is difficult. It is predefined how the movement
should take place (about frequency) with supplier. JIT is followed in the shop floor, certain
stations only when there is required/need the materials are moved.
For example: AC, Seat, Glass will be received one day in advance.
At present, the company teaches the VPS to the employees, it teaches all the standards,
principles, etc. (Training about 5S, Standardized work, Kaizen, TPM) all are built in that.
The company faces problems in supply from the vendor. One of the reason and an issue is
lack of proper information communicated to the supplier end. The vendor on his side is
unable to meet the delivery precision as required by the company. In the Internal material
movement, there are delays in supplying the parts to the line even if they are available. The
company has taken measures to address the issues by giving confirmed rolling forecast is
being given to the suppliers on the 1st week of every month with that month’s and next
month’s as confirmed order and the two months moving forecast and hence a constant /

70
rolling forecast. Procurement cycle is the area where the company faces a huge problem. The
company is yet to go for a Supplier Integration.
Case Company 5 – VE Commercial Vehicles, Pithampur
Current Practices:
Some lean tools are used in the industry to certain extent and the industry is in the evolution
phase for Lean development. 2S, Kaizen, Kanban (2-bin) and Work flow diagrams are
practiced in the industry. One piece flow and JIT are practiced in some parts of the supply
chain. Initiatives are taken for proper TPM implementation. Training is given to the
employees in order to reduce the variability. The industry is identifying the non value added
activities by tracking wastes (unproductive, unevenness, overburden). For improving
productivity, the jigs and fixtures are ergonomically created by a dedicated team. A weekly
audit meet is conducted. Now the industry is building a new line where Poka-yoke is planned
to implement.
The industry performs a collaborative forecasting and the suppliers are intimated about the
forecast in advance. Many suppliers are located far from the industry and hence inventory is
maintained in the warehouse for uninterrupted supply and hence JIT is followed only in some
areas. Higher process inventory is a problem faced in the industry also the store’s inventory is
high.
The suppliers cannot flex with the rise in demand and hence the company is supporting the
vendors by investing along with them.
Lean Implementation status of case companies
The lean implementation status of case companies are presented below.
Lean is not only about principles and procedures. But also how it is taken and understood.
When lean philosophy were asked to associate with; most of the respondents; think that “a
tool box of techniques (JIT, Kaizen, 5S etc,) to improve manufacturing and operations”.
Table 11 shows the companies status in lean implementation. This information about status is
responded by relevant officials of the case companies

71
Table 11 Lean Implementation status of Case Companies.
Status Company
Lean Practices Implemented
Volvo Construction Equipments, Eskilstuna - Sweden Volvo Construction Equipments, Braås - Sweden Volvo Construction Equipments, Bangalore - India
Lean not implemented; practices are followed Volvo Buses, Bangalore - India Lean not implemented VE Commercial Vehicles, Pithampur - India
Lean practices are implemented in Volvo CE companies (Eskilstuna, Braås, and Bangalore).
The effectiveness is more in Volvo CE (Eskilstuna and Braås), in spite they are trying to
achieve more by improving their standards by following VPS (Volvo Production System).
Volvo CE, Bangalore is trying to standardize their implementation effectively, by having
principal leaders and with many initiatives. In Volvo Buses, Bangalore facility, lean is not
implemented but the regular work practices include lean practices. In VE Commercial
Vehicles, Pithampur facility, lean is not followed except for a few tools, now the company is
in development phase of its VE production system principles.
4.2 CASE COMPANY RESULTS: GREEN SUPPLY CHAIN
MANAGEMENT
Case Company 1 – Volvo Construction Equipments, Bangalore
Current Practices:
The Volvo Construction Equipment has environmental care has its core principle. The
company is moving towards achieving greener targets by trying to go green in the possible
areas in their supply chain activities. After the lean implementation, the green practice
initiatives were started simultaneously. The company has factored environmental concern into
strategic decision making for the past 3 to 5 years.
Green Team
The company has a dedicated team setup for green activities, which is led by the
environmental manager, who is responsible for the environmental module. There are three to
four people to drive the activities, but in general every activity has a greener part included in
it. The company has environmental health and safety program in order to teach the
employees.

72
For instance, if there are leakages in the processes the countermeasures such as cleaning,
disposal methods, and segregation method in the scrap yard is taken care by the scrap yard
committee. To review the progress in Volvo Production System biweekly meeting takes
place. Weekly 2 hours is spent for reviewing the module (environmental care) progress.
Green Design
The main reason for the green design approach is to improve an existing product. And the
green is applied for the entire product life cycle. Currently they have upgraded from tier 2 to
tier 3 and plans for moving from tier 3 to tier 4 is in process. And there is a research going in
developing hybrid engines. The company has gone for a star rating as main criteria for green
design initiative by opting for energy efficient drives, motor and fixtures.
Green Initiatives
Sludge Recovery:
Solvent based paint is used in the company; also financially it’s costlier to go for water based
paint. Earlier the water is changed every day. But now, Initiative has been taken and the water
is recycled by sludge recovery unit and hence the water has to be changed only once in 9
months.
Effluent Treatment Plant:
There is a huge water requirement for the plant daily. They are dependent on 3 ground water
source structures for their consumption. But the water after use cannot be reused again as
such and hence it is a waste. Also, the company is aiming at having self-sufficient level of
water for it consumption. For this purpose, an Effluent Treatment Plant (ETP) is build and the
water after usage is sent to Effluent Treatment Plant (ETP) where it is treated and reused
again and again which is greener way. To store the water, they have built a huge water tank of
capacity 2 Million liters which are used for washing the machines. In addition, huge rain
water harvesting structures are used to harvest the rain water which make them achieve their
aim of being self-sufficient for the entire water requirements in the plant.
The industry has a target for water usage, 41 Kiloliters of water per machine the target
including washing, utility, etc. and other plant usages.
Green Equipment and Energy Efficient Machines:
The company is having targets for energy use and hence they have taken measure and
initiatives to reduce the energy consumptions. They are using 13% more energy
efficient machines and 30% more energy efficient generators. In spite of the fact that
these machines are costlier by 15 to 20 %, the company invested for going green.
The company has an energy management system and targeting to increase the energy
efficiency by 12 % in the year 2012 considering the base line as 2008.
Electric forklifts and stackers are used which is a way of preventing the emissions and
also contributes to save working environment.

73
Supplier Emphasis:
Currently all the suppliers are not ISO 14000 Certified. Hence to green, the company is
emphasizing its suppliers to go for ISO 14000 Certification and then in the future they are
planning to go for ISO 18000. They are working towards the target of having 45% ISO 14000
certified suppliers by the end of 2012.
Case Company 2 – VOLVO CE, Eskilstuna
Current Practices:
The company has factored environmental concern into strategic decision making for more than 5
years. Environmental concern is core value of the company and is one of the base pillars.
Environmental regulations, Improve corporate image and Competitors actions are considered
as the most important business drivers behind importance of environmental issues. The
industry gives major consideration for the Employee health, Water (treatment, purification),
Gas emissions while making a strategic decision making.
The company has a department dedicated to environmental issues. And they think
environmental regulation as an opportunity to innovate. The main motive for implementing a
green supply chain is that they have it as a core value and also improve corporate image. The
company believes that having a green supply chain helps them differentiate from their
competitors.
According to the respondent, green design approach has been applied in order to comply with
legislation and the green design is applied Right from Product Design (For Entire product
Life cycle) “Especially Engines”.
As a green design initiative, the following measures have been taken,
Change suppliers (Assessment for suppliers, whether they fulfill the demands)
Change of raw materials
Use new and clean technologies
Implementation of Environmental Management System [EMS]
Modifying the process
Reprocessing of waste
Main obstacles to adopting a green sourcing approach are no return on investment and the
complexity to implement. On the other hand the main initiative measures taken to towards
green implementation are purchase less polluting materials/products, implementing
environmental management system with their suppliers. The main drivers for green logistics
optimize logistics flow; reduce logistics costs (It may increase also, accepted only for a
small/feasible rise in cost).

74
Current state of environmental improvement work includes, EVSM which is currently started
and followed and improvement is taking place in step by step process. For them, the
implementation of Lean resulted in environmental benefit (better in finding Environment
Waste) within their organization. On the other hand the implementation of Lean resulted in
complex situation too. Where it is not economic and no green to move a half filled bins / half
loaded trucks. There are certain rules and regulations. For example: There are norms that
Trucks should be loaded more than 60%. And the bins in the production should not be half
empty.
In general, biggest environmental concerns are, air quality (emissions from transport, power
stations), global warming, transportation methods (air, sea and land) and water quality.
According to company, implementing green can raise cost in many cases. But it is not a
reason for not going green until the increase in cost is feasible. The cost adds up to the
product cost, and the customers can afford to buy the greener products depending on the
feasibility and also the product quality should meet the customer expectations. Big companies
can afford the greener products but it is hard for smaller customer. The Top management
participation is important and they set environmental / green goals. On the company’s part
they have certain norms for minimum loading capacity in trucks.
Case Company 3 – Volvo Construction Equipments, Braås
Current Practices & Initiatives:
Green supply chain is an important area for the company, since Volvo’s core principles
include environmental care since 1970’s. According to the respondent, the important issue is
CO2 emission in the present scenario and a lot of different activities are addressed towards the
reduction of CO2 emissions.
In a life cycle analysis of their business products, more than 97% of the CO2 is generated in
their business products and also when they are put on the market. The rest 3 to 5 % comes in
logistics. Main initiatives are taken towards developing greater fuel efficient products,
developing alternate fuels & new hybrid engines. The company is striving to bring CO2
neutral. Also the firm tries to reduce CO2 emission up to 95%. Investments for this summer
2012 are planned and it is to upgrade the paint shop.
The company is taking lots of projects and initiatives regarding green. During the strategic
period 2010-2011, in winter of 2009, a plan is established. 1) Fuel efficiency addressing
environmental concern and operating cost for consumers 2) Establish environmental
declaration of Volvo CE products. 3) Set targets establish action and follow up in and out
bound logistic and its environmental impact.

75
The firm has internal partner Volvo logistics within the Volvo Group and is in a close
cooperation for the improvement in logistics schemes. ELU {Environmental Loading Unit}
study is proposed and is ongoing in European sites regarding logistics improvements.
When sourcing the product, the CO2 is not considered much. But it should be considered and
also should be started to map with ELU. Emission and green considerations should be
considered in the procurement process.
Green design is applied in order to respond to market demand (when an LCA is done for
articulated hauler, the main consideration is given for fuel consumption and CO2 emissions),
Improve existing product (cost efficient and less polluting vehicle).
Comply with legislation (This is one of the main drivers, main reason for producing F-
generation vehicles in 12 years 3 generation of vehicles produced based on legislation). Also
all the suppliers are to be environmentally certified and it is taken care by their purchasing
team. At present about 90% suppliers are certified to ISO 14000.
A dedicated green team is present and the green activity is involved in many routine works
where the responsible employee works on it as a part of his work. Currently, the challenges
faced by the green team regarding environmental improvement work are CO2 emissions, fuel
efficiency, improving energy efficient per product - less energy produced.
The company is trying to use recyclable products in their vehicles. In Articulated Haulers, 95
% of the parts are recyclable if measured by weight, the rest 5% of non-recyclable parts
include electronic components. The respondent mentioned the company should drive towards
using/buying recyclable materials.
The industry is having different solid wastes and they are having Improvement Program to
handle and reduce them. Water is not a big issue and ample water source is available.
However the water after use is treated as per regulations. Hazardous liquids are stored outside
at a distance from the factory as per the regulations.
Europe has tougher regulations. Emissions into air are under certain level for which
certification is obtained from the local authorities.
Case Company 4 – VOLVO Buses, Bangalore
Current Practices:
Green means elimination of the usage of plastics, paper waste etc. The company is certified to
ISO 14000. Now, the vendors are directed to use the parts which are environmentally
certified according to the norms.

76
All the local suppliers are not certified to ISO 14000; it is between 20 – 25 %. Almost 80%
parts are localized in India. Remaining 20% of the products are imported from china and from
Sweden.
There is no separate green team setup in the organization. But there is separate Industry
regulations department dedicated to ISO 9000 and ISO 14000. The department looks for ISO
activities and improvement initiatives. They look after the corrective actions/ preventive
actions in the entire plant facility.
Initiatives:
Recently, ‘City buses’ are launched with euro 4 norms. There is good support from top
management regarding environmental improvement work initiatives. This year objective has
been taken as 5 % reduction in solid waste (Steel, Aluminum, and Copper), 5 % reduction in
energy usage.
As an environmental initiative, right from sourcing the material, the preference is given to
more to environmental friendly materials. Slowly initiatives have been taken to change all the
products as environment friendly.
Case Company 5 – VE Commercial Vehicles, Pithampur
Current Practices:
The industry has avoided using wooden pallets and starting to use pallets and bins made of
recyclable materials. Sheet metal scrap and mould parts are recycled in suitable ways and the
hazardous wastes such as coolant and oils are properly treated before disposal. To reduce the
emissions, the industry decided to move from asbestos brake linings to non-asbestos and also
battery/electric vehicles are used for internal material movement. The industry is striving
towards increasing the number of ISO 14000 certified suppliers by emphasizing and
motivating them.
The competitors are one of the drivers for green initiatives in the case of having fuel efficient
engines. But in many cases government legislations has been the driving factor for green
advancement. The industry has fixed goals to achieve zero paper work/waste and also to
move towards green packaging.
Initiatives:
Fuel Conservation Training Programme
Currently more than 45000 vehicles are manufactured every year and they are targeting to
manufacture 60000 vehicles in the year of 2012. So the vehicles are replenished in the dealer
location around the country by manual driving through road. And proper driving is also an
important factor for lesser fuel consumption.

77
VECV is the only CV Manufacturer in India to have extensively conducted fuel conservation
training Programme along with the Petroleum Conservation Research association. This
Programme known as EFFECT-(Eicher Fuel Efficiency Enhancement Training) educates the
learner on steps to conserve fuel and reduce atmospheric pollution. A user on an average has
been able to save around 15% in fuel post the training Programme. For a commercial vehicle
this works out to be INR 120,0001 of saving per vehicle per year. Around 10,000 drivers have
been trained under this Programme during last four years and the endeavor is to conduct more
of such training programmes across different cities of India in the near future, hence paving a
way to reduce the emissions.
Case companies view of green supply chain In order to get a general idea about green supply chain, certain questions are asked to the
respondents are presented below,
What is the main motive of implementing green supply chain?
This question gives us an opportunity to have the views of respondents over “why they
implement green”. According to them Environmental Regulation is the main reason.
Improving corporate image and exploiting new market opportunities stand as the next motive
factors. Figure 12 depicts the magnitude of the various motives for implementing a green
supply chain.
Figure 12 Main motive for implementing a green supply chain
1 http://www.vecv.in/about-csr.aspx
33%
27%
0% 0%
0%
27%
13%
Main motive for implementing a green supply chain
Environmental Regulations
Improve Corporate Image
Competitiors Action
Cost Reduction
Executive leadership
New Market Opportunities
Innovation (Process/Product)

78
In general, what are the benefits of green supply chain?
In order to understand the benefits of a green supply chain, the respondents were asked to list
them out according to their experience. The figure 13 depicts the benefits of green supply
chain.
The list summarizes the benefits of a green supply chain as given by the respondents,
- Improve brand image
- Establish competitive advantage
- Expand to new market opportunities
Figure 13 Benefits of green supply chain
35%
5%
15%
0% 0%
10%
10%
25%
Benefits of green supply chain
Improve brand image
Reduce Logistics Cost
Expand to new markets
Optimize Manufacturing
Optimize Logistics flow
Satisfy cutomer requirements
Differentiate from competitors
Establish a Competitive advantage

79
Which are the Main decision criteria in the green design initiative?
The main decision criteria in the green design initiate according to the respondents are to
improve company image followed by ‘Achieve regulatory compliance, Differentiate from
Competitors and a few other which can be inferred from the figure 14.
Figure 14 Main decision criteria in the green design initiative
What are the main obstacles in adopting green sourcing approach?
High costs involved in adopting green sourcing approach is the major obstacle and then lack
of information too which hinders the green sourcing. Complex implementation and no return
on investment are minor reasons but stand as obstacles.
Figure 15 Main obstacles in adopting a green sourcing approach
27%
9% 6% 6% 6%
9%
21%
15%
0%
5%
10%
15%
20%
25%
30%
Main decision criteria in the green design initiative
50%
25%
8%
17%
Main obstacles in adopting a green sourcing approach
High costs
Lack of information
No return on investment
Too complex to implement

80
What are the main environmental factors taken into consideration when strategic decision
making?
The question helps to get a picture of the list of environmental factors taken into
consideration when strategic decision making and their importance which is illustrated in the
figure 16.
Employee health is more important followed by energy consumption from factories and gas
emissions which given top most considerations.
Figure 16 Environmental factors taken into consideration when strategic decision making
12.1%
18.2%
12.1%
9.1%
12.1%
3.0%
21.2%
15.2%
Environmental factors taken into consideration when strategic decision making

81
What are the main business drivers behind the importance of environmental issues?
The main business drivers behind the importance of environmental issues include,
Environmental regulations, improving corporate regulations, competitors’ actions and then
customers innovation and cost reduction in the order of importance, which is shown in figure
17.
Figure 17 Main business drivers behind importance of environmental issues
Environmental regulations
Improve corporate regulations
Cost reduction
Innovation
Customers
Competitors actions
0 10 20 30 40 50 60 70 80
Environmental regulations
Improve corporate
regulations
Cost reduction
Innovation Customers Competitors
actions
Series1 70 63 7 21 35 49
Main business drivers behind importance of environmental issues

82
5 ANALYSIS & DISCUSSION
In this chapter the theory is analyzed and discussed in relation to the gathered results
from case companies about the contribution of lean and green for improving the supply
chain. Also varies practical scenarios are discussed and analyzed which is aimed to
make a better understanding to the readers about the industrial scenario.
5.1 Improving supply chain through lean
Lean paradigm connected to SCM is a strategy based on cost and time reduction to improve
the effectiveness which involves optimizing the supply chain processes, searching for
simplification, reducing waste and reducing activities that do not add value as stated by
(Susana Duarte, 2011).
In an Industrial / practical scenario, the industries are realizing the potentiality that lean brings
out from their supply chain is vast and are trying to improve towards effective lean practices.
The table 11 shows that the Volvo group industries in Sweden have implemented lean
practices and which effectively followed comparing to Volvo group industries in India. The
reason is that, awareness about effective lean practices has just started to penetrate the Indian
Industries. Also changing their traditional practice to lean needs a lot of changes where the
industry has to sustain in their new process and meet the market demand. Currently this is a
main challenge in the industry for which effective change management is required by the
company. Proper lean implementation is required, for which the attitude & belief of the
employees is very important (as per a respondent) and hence management should take proper
steps for effective lean implementation by change management and training to the employees
for sustainable practice of lean in the supply chain.
Lean philosophy mainly aims to reduce the cost by eliminating the wastes in the process. In a
supply chain, various factors and process takes place. Each of these events/ process is
strongly associated with some other factor. Hence to have an optimized chain of supplies, the
processes and factors should be balanced with one another. So when it comes to lean, it
focuses on reducing the waste through lean tools. So lean has impacts on the supply chain
factors in context to optimization.
In India, the case company: Volvo CE, Bangalore has effective lean practices than the other
two case companies. It is an old facility and the industry is improving in lean practices for
more than 6 years. While Volvo Buses plant is a new facility which is established a few years
ago, the demand is increasingly high and the lean practices are followed and they are striving
towards effective lean Implementation. VE Commercial Vehicles is now developing its own
production system with lean principles and green focus. This is a step forward to move
towards lean from the traditional practice.

83
Lean tools have an optimizing effect on the supply chain factors to produce desired business
result by reducing the cost & total lead time, promised quality etc. Every lean tool contributes
to the above by unique way to solve its purpose. Elaborated specifics of the lean tools are
explicated in the chapter 3.3.2.
From the case companies it is evident that, the main need for implementing lean is to improve
their productivity and reduce the waste and lead time which as a result improves the supply
chain performance.
In a theoretical and industrial scenario, 5S helps to reduce unnecessary waste (in time) for
searching for tools/ equipments the process lead time. JIT move towards reducing the
inventory and in turn, the cost. VSM helps to identify the non-value added activities and
hence paves a way to eliminate or reduce them.
Supplier location is a major factor in the procurement since it affects the JIT and inventory.
So for effective implementation of JIT and to manage inventories due to distant suppliers, one
of the case companies went for 3rd
party warehousing. So the uncertainty reduces which helps
to practice JIT properly resulting in minimal inventory in the factory. Hence risk sharing is
one of the ways to remove the barrier of distant supplier uncertainty and inventories.
Andon Systems, otherwise called as notify management signals the abnormalities and
highlight the production problems immediately hence reducing the risk of late deliveries.
Volvo CE in Eskilstuna and Bangalore are making steps forward to have effective andon in
the factory. Kanban - 2 bin systems helps to maintain a streamlined uninterrupted flow of the
production process while maintaining less inventories also preventing out of stock. Volvo
Buses, Bangalore by implementing 2- bin system reduced the material out of stock ratio in the
assembly line, thereby reducing the lead time. Kaizen which is continuous improvement adds
safety and effectiveness while reducing the waste.
TPM aims and helps to achieve zero equipment breakdowns and zero product defects
improving the quality standards of the products while One-piece flow helps to identify the
problems if any. SMED reduces the changeover time thus reducing the process lead time.
Poke-yoke which helps avoid product mismatches and ensures process safety. VE
Commercial Vehicles has reduced the change over time with SMEDs and also with the help
of a team which uses ergonomics to design / move fixtures for ease. All these practices
impacts on various parts on the supply chain and helps to improve the supply chain in some
aspects of reducing the lead time, reducing the cost, increasing the productivity etc.
When Lean is implemented it results in fruitful implication over the supply chain. The lean
supply chain principles are being used by the case companies and achieved a good result in
improvement and the projects they took stay as justification / evidence. Volvo CE, Bangalore
executed a lean project 2008. After the project is finished the company’s supply chain is
enhanced and the productivity is increased up to 33%. Similarly Volvo Buses, Bangalore used
Value stream mapping to identify the bottlenecks in the production line. After the successful
completion of the project the company’s bus production time reduced from 23 to 18 days.

84
According to Bergmiller & McCright (2009) the practical implications and the difficulties
are the industry tries to have effective JIT but due to supplier location, order quantities and
uncertainties inventories has to be maintained in excess, especially in the case of having
international suppliers. Similarly during the situation where increase in demand is forecasted,
for several months after, the industry starts increasing its production capacity accordingly and
stores as finished goods inventory, since it not possible to rise the production capacity to meet
higher demand at the point of to time. Inventory is a waste and it consumes resources
increasing the cost but it is required in this scenario to meet the demand and sustain the
supply chain even during market variations.
Lean expressed as in the theoretical way of working differs much from the industrial scenario
due to the practical issues and uncertainties which is observed during the infield study.
However the potential benefits remain unaltered, all the industries has challenges in this
aspect which can be overcome through various means. Advance lean model is one of them.
As discussed in advance lean model in section 3.3.4, Shinzo prize model is the best
representative model for leanness. It is evident from the model that the lean business results
include quality, cost, delivery and customer satisfaction. The companies should consider
evolving to advance lean model based on the feasibility.
5.2 Improving supply chain through green
Environment is becoming a major concern due to depletion of resources, to reduce the
emissions and to have environmental products. In order to have a responsible manufacturing
towards environment, and to abide regulatory compliances, industry has to have green in their
supply chain. When it is practiced effectively, fruitful outcomes which includes supply chain
enhancement can be expected. Primary motives for the industries to practice GrSCM are to
improve performance, ensuring sustainable and environmental friendly products, processes
with social responsibility. It results in goodwill uplift, improved product quality, less wastage,
improved work condition, reduced cost related to waste and life cycle etc, as discussed briefly
in the section 3.4.2.
The case companies were contacted to know about their motives, initiatives and practices
towards green supply chain. The charts are projected in the chapter 4 / figure 12 to 17. It can
be inferred that government regulation and improving the corporate image has been the major
motive and business drives for implementing green in the supply chain which is illustrated in
figure 12 and figure 17. If the industry takes a green design initiative the criteria or the reason
behind is to improve the corporate image, to meet the regulations and to differentiate
themselves from their competitors. Similarly when a strategic decision is made, energy
consumption, employee health and gas emissions are major environmental factors considered.
Choice of environmental mode is given less importance. The industries by having green in
their supply chain have the benefits of improved brand image, competitive advantage,
expanding to new market areas etc. But high cost and lack of information is a hindrance
towards adopting green sourcing approach.

85
The green activities results in improving the process activities. Green procurement activities
result in purchasing eco-friendly materials and having environmentally certified suppliers and
improved customer and supplier awareness towards the greener products. The case
companies, as a green initiative towards having environmentally certified suppliers, suppliers
are emphasized to go for an ISO14000 certification. Big suppliers can afford to make radical
changes to go for certification, but it is hard for the small suppliers. However having good
relationship with the supplier, the industry has to support the supplier for certification.
Green manufacturing results in reducing the material and energy consumption in the
processes also reduces the waste resulting in reducing the cost. Volvo CE Bangalore facility
is using energy efficient generators and motors in spite of their high investment cost. This
reduces the energy consumption and results in long-term benefits.
Green design of the process and products results in effective green supply chain which is cost
effective. Thus green activities contribute to positively impact the supply chain factors. But
the supply chain which is for the product, hence the product and company has to hold some
responsibility towards environment. Hence it is not totally about its perfection to work or low
cost but also having a lesser impact on the environment. One of green design initiatives are
for the development of hybrid engines which is in progress to make it cost effective.
Green branding and marketing improves the awareness towards green products and also
increases the brand image. Volvo products are eco – friendly than any other competitor
products. Green Packaging, distribution and Logistics reduces the wastage and emissions.
Though green increases product cost in many aspects, it is viewed as quality enhancement.
Nevertheless the higher cost difference is a hindrance for purchasing greener products.
However companies view green as a value enhancement to the supply chain.
Green activities such as 4R’s, waste minimization, reducing redundant materials etc, will
reduce cost as stated in chapter 3.4.5. As a green initiative to reduce the emissions which is
major concern for global warming, the case companies have many green initiatives towards
Waste Management and effective resource utilization as briefly explained in chapter 4.2.
Volvo CE, Braås, has implemented Environmental Loading Units (ELU) where they are
trying to measure the CO2 emissions in the inbound and outbound logistics through which the
potential areas are identified to reduce the emissions. Also the company is striving for fuel
efficient products and to achieve CO2 Neutral. The Articulated Hauler is 95 % recyclable in
terms of its weight. These activities help to deliver the same products but reduce the
environmental implications thus improving the supply chain.
Water is a scarce resource in India and the Volvo CE, Bangalore facility needs more than 41
kilolitres of water per machine. The water from the paint shop was earlier changed every day,
but now the company has sludge recovery unit where it is recycled and used continuously for
until 9 months. Effluent Treatment Plant, water harvesting structures, sludge recovery unit,
ground water sources make them self-sufficient for their water consumptions. Energy
Management System, energy efficient machines, electric forklifts and stackers, recyclable
pallets and emphasis on supplier environmental certification includes their green initiatives

86
and activities. In Volvo CE Bangalore, Green initiatives are taken to harvest and to recycle
water are not based on need, but in the future it will be a need. Hence this contributes to keep
the supply chain running effectively. Volvo Buses, Bangalore is striving towards reducing the
solid waste and energy usage by 5% this year. Also by preferring environmental friendly
materials, the company shows responsibility towards the environment.
VE Commercial Vehicles, as a green activity has started Fuel Conservation Training
Programme for more than 10,000 drivers focusing on reducing emissions and to prevent
excess fuel consumption. This resulted in 15% lesser fuel consumption. The industry
manufactures more than 4000 vehicles produced every month and are sold all over India.
When the vehicle is manufactured, it has to be sent to the dealers in various parts of the
country. Each and every vehicle is driven on the road to deliver to the dealer. This mode is
complex, risky, not economical and non-green too. Now they are seeking possibility of
alternate modes through rail cargos which is green aspect. But a barrier is poor delivery safety
in rail cargos that the vehicles get damaged during transit because of open cargos. This is
practical barrier towards going green.
On the other hand, green activities such as reducing the replenishment frequency (transport)
will increase the inventory levels, making greener products but increases the inventory
holdings cost. Using/procuring greener products, eco-friendly design and proper disposal will
increase the cost. However the all these imply of doing a responsible and quality business. So
green has to be viewed as a value enhancement to the product / part of the quality.
The advanced green system model proposed by Bergmiller (2009) which evidently shows
having EMS and ISO 14001 enhances waste reduction techniques by Process and product
redesign, reduce, recycle etc. and results in positive green business results such Costs, Lead
times, market position etc. which are elaborately discussed in chapter 3.5.8. Thus GrSCM
improves the value of the supply chain.
Inference
Analyzing the case company data and the theoretical framework, it can be inferred that lean
and green practices are becoming essentials practices / activities in the supply chain to sustain
the market by responding to demand, meeting the regulations etc.
Lean and green complement each other in many aspects i.e. the lean activities produces green
and economic benefits which are elaborated in chapter 3.4.3. But there are converse too. One
of the important conflicts is that lean tries to reduce the inventories by increasing
replenishment frequency; green tries to reduce replenishment frequency to reduce the
emissions in addition to this, the supplier location and the quantity of the materials supplied
play a role. In such an industrial scenario, the industry has to trade-off between these factors
to get along. But it results in improvement.

87
The industry facility has certain capacity, when it is forecasted for a higher demand, for a
particular month, it is not feasible to produce with higher capacity in a particular time. But to
increase step by step before a few months which will result in having finished goods
inventory. It is Lean waste but it is required but they can be made optimal.
There are many drivers for lean as discussed 3.5.4 in table 6 while on the other hand there are
barriers too which are stated in table 7 by various researchers. Green too has drivers and
barriers which are projected in table 8 and 9 respectively. The drivers and barriers change
from one country to another due to cultural & market difference. In our case, it is India and
Sweden. In Sweden, the work culture is in a way that they stick very effectively to the
principles and procedures. But it is not so in India, Customers are given the prime
importance, owing to the fact that the competition is more. Since the competitors are more,
cost is a major driver. Customer’s are more focused towards the cost and then comes the
quality; however, due to the globalization the scenario is changing. So cost is a major factor
and high cost is a barrier towards green, however awareness through green branding &
marketing is a driver towards green. Supplier reluctance to change is one of the barriers for
the green. Also, many are not aware of “green” but it is entirely different scenarios in
Sweden. Various barriers including difficulties to change the traditional / existing practices to
lean, supplier location etc. hinders lean practices from being efficiently followed.
It is evident from the figure 12, 14, 17 that the green activities and supply chain are mainly
initiated and driven due to environmental regulations. Hence on a bi-national level
government regulation is the prime driving factors for green accomplishments. Government
support & regulations is more effective in Sweden compared to India. For instance the usage
of materials and disposal methods are more strict norms in Sweden and also subsidies
provided by the government is a factor which encourages buying greener products.
According to the respondents, most customers are ready to buy greener products with a
smaller marginal rise in cost. So the cost is the prime factor for the customers in decision
making to go for greener products. So the lean activities together with the green activities in
the supply chain, makes it more sustainable. Lean which tries to give satisfy the customer and
the green which makes it environmental responsible. As a bottom line, integrated lean and
green practices make a better chain of supplies and flows with responsibility and with least
possible cost, high quality & shortest time.

88
6 Lean & Green Supply Chain Model
This chapter proposes about the model, which is constructed based on the findings from
theoretical framework, empirical results and analysis. For building the model properly, the
relationship between lean factors and supply factors are illustrated initially and then similarly
green with the supply chain factors. Finally relationship between lean and green with the supply
chain factors are depicted.
Model
From the theoretical and empirical results, it can be inferred that there are many factors linked
to the other and they have different relationships. So the relationship demonstrates if a factor
positively / negatively influences the other. As mentioned before, the objective is to give a
brief understanding about the relationships and the influences between the factors. In
addition, the integration model also serves as a pre-study frame work & prototype model for
the industries which focuses on the integration and can be done in industry specific contextual
scenario of their supply chain. The work of Carvalho et al., (2011) is an inspiration for the
model.
Model representation Understanding
For example consider the lean supply chain model, consider transit lead time and inventory.
Both have direct relationship (directly proportional) i.e. when transit lead time increases the
inventory will also increase because when it takes more time to replenish an item, sufficient
inventory stock has to be maintained for interrupted flow in the process. Hence more the
transit lead time more the inventory required for uninterrupted process. So in the model it is
represented as ‘+’
Consider Replenishment frequency and Inventory in the lean supply chain model; they have
inverse relation between them, i.e. when the replenishment frequency increases, the inventory
levels can be reduced, because small quantities of buffer inventory can be maintained for
seamless process flow in the supply chain. So in the model it is represented as ‘-‘
LEAN SUPPLY CHAIN MODEL
Supplier:
Supplier Quality: The quality of the goods supplied by the supplier is a prime factor in the
supply chain. When the goods are of poor quality either production quality goes down or it is
sent back to the supplier (Reverse Logistics). Hence more the quality products, lesser is the
reverse logistics.

89
Figure 18 Lean Supply Chain Model
Supplier Location: The locality of the supplier is more linked with the Replenishment
Frequency. When the Supplier is near to the industry, the replenishment frequency can be
more while the Transit Lead time reduces and the converse with far supplier location which,
in addition has negative effect in meeting uncertainty of having higher demand.
Supplier Relation enhances supplier integration and both enhances proper forecast. Since
more the transparency and information provided to the supplier, the more they plan.
Just In Time: There are various factors influenced by JIT and vice versa. JIT aims at minimal
inventory, more the effectiveness of JIT, lesser the inventory which implies lesser problems
and cost involved. So when JIT is effective, inventory including Work in Process Inventory
reduces, which implies the replenishment frequency increases. Hence if replenishment
frequency increases, the replenishment quantity reduces. Standardized work force has a
positive influence over JIT and helps to achieve quality. When quality goes up then reverse
logistics (customer - industry) reduces. JIT also focuses on reducing the lot size which tends
to achieve one piece flow which increases the probability out of stock ratio.

90
Out of stock is a critical scenario and it adversely halts the production. Hence it is factor to
minimize to improve the performance. Inventory is a lean waste, but it reduces the out of
stock ratio. Similarly forecast, a proper forecast helps to plan the stocks which implies out of
ratio declines. But Supplier / ware house location are prime factors for on-time
replenishment. Kanban a visual tool practiced by having cards help to replenish the products
as they are consumed and hence prevents the stocks from becoming nil.
Flexible work force means that the employees are equipped to work with various machines, in
a way multi skilled hence it can contribute to face uncertainties. Also managing product
variants becomes easier with flexible work force.
5S has a potentiality to reduce the process lead time by eliminating many non-value added
activities, reducing invisible costs.
Cost: cost is the major business result. As the Process lead time increases it implies that cost
also increases. Supplier and Dealer location matters and add up to the product cost.
Inventories, safety stock and WIP Inventory is lean wastes and ends up as cost, but, are
required to act as buffers. Proper implementation of lean tools helps to optimize the levels.
Having a number of product variants, end up in having inventories, increased non-value
added activity through change over and hence the cost goes up. However customer
satisfaction goes up and brand image also improves.
SMED result in reducing the Non Value added activities and also reduces the lead times,
especially in the case of having many product variants. Cost may increases when product
variants increase, but the cost involved in manufacturing process is reduced considerably by
using lean tools.
Reduce Risk / Risk Sharing: Total Productive Maintenance helps to ensure seamless operation
as planned and proper working of the machines & equipments. Thus TPM ensures quality and
reduces the risk of production halt due to machine break down and increases Mean Time
Failures.
Poka – Yoke results in reducing the risk and helps in achieving quality and the 6th
S – Safety.
Poka – Yoke which is error proofing helps to reduce the defects and helps ensure the process
to be done in a right way. Also it is a way where the systems can be transformed to avoid
mishaps ensuring safe operations and work atmosphere.
Risk sharing through 3PL service provider: Production logistics / Internal Logistics which are
critical for seamless production process to take place. The required goods have to be
replenished in the right quantity in right time and in right place. But the quantities vary based
on the demand and hence the required resource including manpower varies. Hence many
industries go for external 3PL service provider to avoid risk. Synchronization of the lean
practices of 3PL and the industry improves the performance. This is achieved by transparency
and integration.

91
Customer Satisfaction is the most prime factor needed to establish the business. Product
Variants, Quality, Service level, Delivery performance are the key factors for customer
satisfaction.
Above are the major critical supply chain factors which influence the business results which
are positively influenced by effective implementation of Lean practices. However, there are
practical difficulties and requirements making difficult to implement/follow lean but an
optimal effective lean has to be in track. Thus to draw the bottom line, Effective Lean mends
the supply chain.
Hybridization in lean tools ensures proper implementation and follow.
GREEN SUPPLY CHAIN MODEL
Doing green activities in the supply chain makes the system to go Eco-friendly. Green factors
& activities may have positive or negative impact on the conventional practices.
Environmentally Certified Suppliers:
Environmental certification is a major factor which contributes to green supply chain. It all
starts with the supplier and having a supplier whose processes are certified to be within the
environmental standards. This implies that the quality of the product improves since products
/ the raw materials are of more quality.
Supplier reluctance to change to Green negatively affects the Integration, however
Government regulation standards for the environment is a counter measure. Also in getting a
certification, more emphasis has to be made along with support to the small suppliers.
Supplier Integration has a positive effect towards the green supply chain.
Green focuses on reducing the environmental impact caused in the production and hence the
effective transportation is a prime factor. So reducing the transportation frequency, reduces
the CO2 emissions, hence reducing the replenishment quantity has a positive impact on the
Green activities. On the other hand, relatively high inventory levels have to be maintained.
Also supplier location is a factor. The closer the suppliers are, lesser is the transportation and
the emissions are also lesser.
Transit mode is makes a huge difference in the emission levels. Air mode has the highest
emission level and the cost as well. Down the line is land transport followed by Rail and Sea
transport. Hence sea and rail modes have reduced impact on the environment. But on the
other hand the Sea and Rail transport has many uncertainties in delivery and quality
performance. Increases the lead time which implies the industry has to hold inventories or the
order to supplier before to cover the extra transit time. Road transport is flexible and easy but
delivery & quality performance and cost will make the working efficiently having a lesser
emission levels.

92
Figure 19 Green supply chain model

93
Cost: Efficiency of resource consumption is a green activity which tries to optimize the usage
of resources which in turn reduces the cost. The Process Design if designed to optimize the
resource consumption has a positive impact on the green supply chain as well as the cost.
Having surplus capacity is good for providing good service level but not for efficiency of
resource consumption. Usage of Eco-friendly materials increases the cost but it has a much
positive impact on the environment. Also by doing green procurement by insisting supplier to
go for green / recyclable and less harmful products / raw materials it has a positive impact
towards environment. Government is a driver of green when it provides subsidies to the green
initiatives which compensate the incurring costs.
4R’s: Reduce, Reuse, Recycle, Rebuy is a prime factor to contribute to environment
responsible manufacturing. Reduction in the usage of materials, reusing possible products,
recycling the scrap, buying recycled products / materials, all these have a positive influence
on the green supply chain and the first 3R’s reduce the cost as well. This also results in Waste
minimization. Proper disposal methods which could be planned in the design phase as of
how to handle the wastes effectively could reduce the environmental impacts.
Reverse Logistics is an important part where the defective parts are sent back to the supplier
or from the customer to the industry. This activity provides a chance to see the quality error,
re manufacture it, and provides a chance to re-use it again meeting quality standards.
Re-manufacture is a part of the green activity and this enhances the product value and extends
its usable life. This also improves the brand image of the product. E.g. Volvo remanufactures.
Green Packaging adds up to the cost but it is a part of the green supply chain, however it
improves the brand image of the product and the sales as well.
Top Management is more important and is a main driver / barrier for green thinking. Top
management could possible influence the Design initiatives, and the cost for going for
greener and energy efficient machines, products, equipments etc.
Customer satisfaction is the base of the company, but customers are not aware of the potential
importance of the Green and environmentally responsible supply chain. It is the duty of the
industry to educate the customers about the importance and need for green. So the customer
will know what they pay for and this leads to customer satisfaction and good will of the
company builds up.
To put it in a nut shell, many green activities may influence cost but to have a positive impact
on the environment. Hence the supply chain and the manufacturing will be with responsibility
and also improves the supply chain quality.

94
LEAN AND GREEN SUPPLY CHAIN MODEL
The purpose of the model is to integrate Lean and Green in the supply chain and to see the
effects caused by them over the activities. Lean is a methodology which aims at making
more and more with less and less resources and at least possible cost by reducing the non-
value added activity and wastes in the process whereas Green focuses on reducing the
environmental impacts in the processes. Since both are important the emphasis has to be
given to both of them but due to the reason that in several factors the activities that take place
to achieve lean may contradict with that of green and vice versa. But it is essential to balance
between the two to achieve sustainability. The industries have to make the choice in a trade-
off situation based on their locality, capacity, resources, mission, drivers and barriers which
are unique for every industry.
There are various influential parameters considered in building the model. The factors which
are influenced during a lean process and the factors influenced by the green when put together
have interfering areas. The influential factors considered in a lean and green supply chain are,
Supplier quality, Supplier Integration, Supplier Location, Supplier Reluctance to change,
Replenishment Frequency, Replenishment quantity, Transit lead time, Inventory, Transit
Mode, Government support and Regulations, Emissions, Forecast, Out of stock
ratio/Material Shortage, Product variants, Cost, Process Lead Time, Quality, Efficiency of
Resource consumption, Usage of environmental friendly materials, Surplus quantity, Meeting
uncertainty (especially higher demand), Delivery & quality Performance, Service level,
Reverse Logistics, Proper disposal, LCA/Green design, 4R’s, Re-Manufacturing, Waste
Minimization, Top management support, Green Packaging, Risk reduction and sharing, 3PL,
Dealer Location, Customer satisfaction, Customer awareness & education, Brand image &
sales, Lean tools such as JIT, 5S, Standardized work, Poka-yoke, SMED, Kanban, TPM and
their sub elements such as flexible work force, Reducing non-value added activities, reducing
lot size. These factors when put together have implications on one another.
According to the model, both lean and green complement each other in many areas thus on
the whole contributing to supply chain enhancement. Having a lean practice, contributes to
achieve green in many areas. The hypothesis can be approved on the following grounds. Lean
aims to eliminate waste and hence is the purpose of its activities. Reducing defects, waiting,
over production, movement, inventory, complexity and unused creativity implies reduction in
environmental impacts. Detailed impacts are projected in table no 10. This results in
improving the Supply chain by preventing the undesired incurring cost.
Standardized work helps in reducing the process lead time and also reduces defects and
enhances quality. So the need for re-processing or scraping is eliminated thus having a green
benefit of using lesser resources.
Efficiency of resource consumption is a green activity, when accomplishes the aim of lean -
less and less resources. Waste minimization is a green activity when is also the focus of Lean
and together helps to reduce cost.

95
Figure 20 Lean & Green Supply Chain Model

96
Lean and green prefers to have closer suppliers on the grounds that, it supports JIT
implementation by having frequent and smaller replenishment quantities so inventories can be
reduced. On the hand with green, closer suppliers mean that lesser transport and hence the
emissions are lesser. Also transit lead time reduces, reducing the total lead time. However,
JIT in tries to eliminate unnecessary inventories which means that replenishment frequency
increases making the emissions more which is undesirable in a green context.
Transit mode is a key element to reduce emissions; however inventories, replenishment
frequency and cost vary in relevance to the mode.
The Lean and Green Integrated model has the benefits and process improvement achieved
through Lean and Green which are explained before in Lean model and Green model. In spite
of this, Leadership and Empowerment are needed for effective implantation and continuous
improvement.
Reducing the cost, improving the product quality, producing a greener product, reduction of
environmental impacts, increasing customer satisfaction, increasing brand image and sales,
shorter lead times higher delivery and quality performance, increasing the capability of the
industry manages more product variants as required by customer. Despite of minor tradeoff
areas, all the above makes the supply chain better. To put it in a nut shell, supply chain
improves by lean and green integration since having the outcomes of the both lean and green.

97
Summary of the lean and green supply chain model:
In the context of discussion about the lean practices and green practices, their implementation
etc, there is a vast difference between theory and in the practical scenario. This even
aggravates with cultural differences. Lean prefers to have closer supplier location for the fact
that, when JIT could be effectively followed to reduce inventories. But the practical difficulty
is, suppliers are reluctant to move their base closer to the company. So having farer suppliers
eventually make the industry to store inventory. Also if the supply quantity is less, a batch is
sent for economies of cost. If the industry has international suppliers, then the due to the
higher transit lead times, the industry has to forecast, order accordingly and store inventories
to meet the demands properly. So when viewed with Lean eyes, these inventories are wastes,
but they are required because of the practical difficulty. However it also has the adverse
scenarios.
The model discusses about all these factors and how they influence other factors which give a
fair idea about their relationship when viewed in Lean context and Green context. In the Lean
and green model, the relationship between the factors may conflict in Green and Lean
context. Also there are various areas where the industry has to trade-off between these factors
to improve their supply chain. This trade-off decision is based on their drivers, barriers,
vision/mission and capacity.
To be precise Lean and Green improves the supply chain and when they are integrated, the
supply chain factors get influenced a lot which ends in improving supply chain by reducing
the optimizing cost, reducing lead time, increasing the quality, having an environmental
friendly supply chain for the products. This integration also gives the industry, a decision
making or trade off area to choose upon. This model as aimed gives the industry a fair idea /
framework about considering their important / influential factors in the supply chain to their
specifics and build a model for their integration.

98
7 CONCLUSION & FURTHER STUDY
This chapter is divided in to two parts where the first part discusses about the outcome
of the research and the next part is about Further Study.
CONCLUSION
The main objective of the thesis has been to contribute to a further understanding of lean and
green activities that take place in the supply chain, how lean and green contributes to improve
the supply chain, the impact of lean and green factors over the supply chain and about their
integration. A theoretical frame work is made so as to have a good understanding about the
concepts and research work in the relevant area. The empirical study at the industries has
been done to examine their work practices with lean and green in their supply chain and the
projects & initiatives. The empirical study also focuses on integrating lean & green, the
practical difficulties faced by the industries and respective drivers and barriers.
The results from the thesis are the following,
From the literature, an in depth study about Supply chain, lean, green is made and the
relevant research works helped to gain knowledge about various perspectives. The literature
is a strong base for the thesis, and knowledge gained was helpful for a better research work.
The research questions are framed for accomplish the objective. The research questions and
justification are presented below.
RQ1] How can lean and green aspects contribute to the improvement in supply chain?
From the literature and empirical study it could be evidently inferred that multifarious
improvements by the lean via its tools on the supply chain performance by reducing the
wastes & non-value added activities and green in terms of responsible business i.e., reducing
the emissions and other environmental impacts which ultimately increases the corporate
image of the companies. The supply chain improvement varies based on the lean and green
drives and barriers. Also the industrial case example shows potential industrial proofs for
supply chain improvement through various lean and green activities and the practice
initiatives.
RQ1a] What are the outcomes of Volvo group companies in India/Sweden in practicing
lean and green aspects in their supply chain?
It is discernible from empirical studies (Interview/survey) carried out in the Volvo Group case
companies the current practices of the company in context to lean and green in their supply
chain, the projects and initiatives they took were understood and the practical difficulties
faced by them in their supply chain are projected in the results part. It could be inferred that

99
the companies practicing lean effectively have increased their productivity and profitability
by taking corrective measures. The main need for Green initiatives and implementation is due
to environmental regulations and to improve corporate image could be inferred.
RQ2] What are the effects on supply chain caused by lean, green, lean and green supply
chain?
With the knowledge gained from the literature and empirical studies at case companies a
model projecting the relationship between the Lean, Green and supply chain factors is
developed which shows the relationship between them. The model shows the Lean and Green
relationship in the supply chain when it is integrated. The model also serves as a pre-study
frame work & prototype model for the industries which focuses on the integration and can be
done in industry specific contextual scenario of their supply chain.
On the whole, from the thesis, lean and green activities are explored with drivers and barriers
theoretically & in the industrial scenario. The deduction can be made that lean and green
activities/practices in the supply chain results in improving the performance and the
integration of lean and green as depicted in the model is unique for each company, due to its
own supply chain specifics, drivers, barriers & practical difficulties. Thus by integrating lean
and green and having a dedicated industry specific model can help the industries to practice
lean and green effectively with a balance. This thesis is a contribution towards further
understanding about lean, green supply chain, lean and green supply chain integration and
their relationship. This thesis serves as a contribution for the case companies to build an
integrated lean & green model and also an eye opening for other industries globally.
FURTHER STUDY
Further proceeding with this project work could test the model to a specific case company and
develop an industrial Integration model for Lean and Green based on company specific
scenarios, potentials, drivers, barriers etc., Such a further study could encourage the
companies to consider and concentrate on both Lean and Green to establish a sustainable and
responsible development. Further study in a specific case company / group may lead to
development or modifying their production system processes by integrating lean and green.

100
8 REFERENCE
Bergmiller, G. G. & McCright, P. R., 2009. Parallel Models for Lean and Green Operations.
Industrial Engineering Research Conference.
Bevilacqua, A., Ciarapica, F. E. & Giacchetta, G., 2011. Design for Environment As a Tool
for the Development of a Sustainable Supply Chain. London: Springer.
Bhateja, A., Babbar, R., Singh, S. & Sachdeva, A., 2012. Study of the Critical factor
Finding’s regarding evaluation of Green supply chain Performance of Indian Scenario for
Manufacturing Sector. IJCEM International Journal of Computational Engineering &
Management,, 15(1).
Bowen, F., Cousine, P., Lamming, R. & Faruk, A., 2001. Horse for courses:explaining the
gap between the theory and practice of green supply. Greener Management, Issue 35, pp. 41-
59.
Bryman, A., 2001. Social Research Methods. 2 ed.:Oxford University Press.
C., Ninlawana; P., Seksan; K., Tossapol; W., Pilada., 2010. The Implementation of Green
Supply Chain Management Practices in Electronic Industry. Hongkong, International
MultiConference of Engineers and Computer Scientists.
Carter, C., Kale, R. & Grimm, C., 2000. Environmental purchasing and firm performance: An
empricial investigation. Transportation Research Part E: Logistics and Transportation
Review, 3(36), pp. 219 - 228.
Caruso.C, Colorni.A. & Paruccini.M, 1993. The regional urban solid Waste Management
System: A modeling approach. European Journal of Operational Research, 1(70), pp. 16-30.
Carvalho, H. & Cruz-Machado, V., 2009. Integrating lean, agile, resilience and green
paradigms in supply chain management (LARG_SCM), Third International Conference on
Management Science and Engineering Management.
Cheng, J., Yeh, C. & Tu, C., 2008. Trust and knowledge sharing in green supply chains.
International Journal of Supply Chain Management, 4(13), pp. 283 - 295.
Chen, H. & Wang, W., 2010. Green supply Chain Management For a Chinese auto
manufacturer, Gavle
Chien, M. K. & Shih, L. H., 2007. An empirical study of the implementation of green supply
chain management practices in the electrical and electronic industry and theirrelation to
organizational performances. International Journal of Environment. Sci. Tech., , , 4(3), pp.
383-394.
Chopra, S. & Meindl, P., 2004. Supply Chain Management.. 2 ed. Upper Saddle River:
Pearson.

101
Chopra, S., Meindl, P. & D.V.Kalra, 2001. Supply Chain Process Cycles. In: Supply Chain
Management. Upper Saddle River, NewJersy: Prentice Hall, p. 12.
Christopher, M. & Towill, D., 2000. Supply chain migration from lean and functional to agile
and customised.. International Journal of Supply Chain Management, 4(5), pp. 206-213.
Cole, L., 2008. Road Transport. [Online]
Available at: www.roadtransport.com/Articles/2008/05/22/130767/keen-to-be-green.htm
[Accessed 15 April 2012].
Council of Supply Chain Management Professionals, 2001. CSCMP’s Definition of Supply
Chain Management. [Online]
Available at: http://cscmp.org/aboutcscmp/definitions.asp
[Accessed 19 January 2012].
Cox, A., 1999. Power, value and supply chain management. International Journal of Supply
Chain Management, 4(4), p. 167 - 175.
Cusumano, M. A. & Takeishi, A., 1991. Supplier Relations and Management: A Survey of
Japanese, Japanese- Transplant, and U.S.. Strategic Management Journal, 12(8), pp. 563-588.
Daft, R., 1995. Organization Theory and Design. NewYork, West Publishing Company.
Darnall, N., Jolley, G. & Handfield, R., 2008. Environmental management systems and green
supply chain management: complements for sustainability. Business Strategy and the
Environment, 1(18), pp. 30-45.
Davis, U., 2008. The 4 R's of Waste Reduction. [Online]
Available at: http://66.147.244.243/~templec3/ecoChai/Documents/4Rs.pdf
[Accessed 24 February 2012].
Dennis, P., 2002. Kanban. In: Lean Production Simplified. Second edition ed. , pp. 74-78.
Doonan, J., Lanoie, P. & Laplante, B., 2005. Analysis determinants of environmental
performance in the canadian pulp and paper industry: an assessment from inside the industry.
Ecol. Econ.,, Volume 55, pp. 73-84.
Dües, et al., 2011. Green as the new Lean: how to use Lean practices as a catalyst to greening
your. Journal of Cleaner Production, pp. 1 - 8.
Dyer, J., 1997. Effective interim collaboration: how firms minimize transaction costs and
maximize transaction value. Strategic Management Journal, 18(7), pp. 535 - 556.
E-Notes, 2012. Logistics. [Online]
Available at: http://www.enotes.com/topic/Logistics
[Accessed 10 February 2012].

102
EPA - Environmental Protection Agency, 2000. The Lean and Green Supply Chain: A
practical guide for materials managers and supply chain managers to reduce cost and
improve environmental performance, Washington DC
EPA - United Stated Environmental Protection Agency, 1970. TPM. [Online] Available at:
http://www.epa.gov/lean/environment/methods/tpm.htm [Accessed April 2012].
Florida, R., 1996. Lean and green: the move to environmentally conscious manufacturing.
California Management Review, 39(1), pp. 80 - 105.
Franchetti, M., Bedal, K., Ulloa, J. & Grodek, S., 2009. Lean and Green:industrial
engineering methods are natural stepping stones to green engineering. Journal of Industrial
Engineer: IE, 9(41), pp. 24-29.
Friedman, P., 2008. Leaning toward green: green your supply chain with lean practices.
[Online]
Available at: http://outsourced-logistics.com/operations_strategy/leaning_toward_green
[Accessed 17 April 2012].
Friend, G., 2009. The Truth about Green Business: "You don't have to choose between
making money and making sense". 2nd ed. Upper Saddle River, New Jersey: FT Press.
Genex Logistics, 2012. History of Logistics and Supply Chain Management. [Online]
Available at: http://genexlogistics.in/blog/2012/03/history-of-logistics-and-supply-chain-
management/
[Accessed 07 April 2012].
González-Benito, J. G.-B., 2006. The role of stakeholder pressure and managerial values in
the implementation of environmental logistics practices. Internal Journal of Production
Research, 7(44), pp. 1353 - 1373.
Gordon, P., 2001. Lean and Green e Profit for Your Workplace and the Environment. San
Francisco: Berrett-Koehler Publishers Inc.,.
Gottberg, A., Morris, J. P. S., Mark-Herbert, C. & Cook, M., 2006. Producer responsibility,
waste minimisation and the WEEE Directive: case studies in eco design from the European
lighting sector. Journal of Science of the Total Environment, 1(359), pp. 38-56.
Gummesson, E., 2000. Qualitative method in management research. Thousand Oaks: SAGE
Publications Inc.,.
Gungor, A. & Gupta, S., 1999. Issues in Environmentally Conscious Manufacturing and
Product Recovery. A survey.. Computers & Industrial Engineering, Issue 36, pp. 811-853.
Günther, E. & Scheibe, L., 2006. The hurdle analysis. A self-evaluation tool for
municipalities to identify, analyse and overcome hurdles to green procurement. Corporate
Social Responsibility and Environmental Management, 13(2), pp. 61 - 77.

103
Hall, J., 2000. Environmental supply chain dynamics. Journal of cleaner production, 8(6), pp.
455 - 471.
Handfield, R., Walton, S., Seegers, L. & Melnyk, S., 1997. Green value chain practices in
furniture industry. Journal of Operations Management, 15(4), pp. 293 - 315.
Hansen, J., Melnyk, S. & Calantone, R., 2004. Core values and environemntal management: a
strong interference approach. Journal of operations management, Volume 46, pp. 29 - 40.
Hart.C, 1998. Doing a literature review: Releasing the social science research imagination.
London , UK: SAGE Publications.
Hart, S., 1997. Beyond greening: strategies for a sustainable world. Harvard Business
Review, pp. 66 - 77.
HELLSTRÖM, A., 2010. Value stream mapping and other methods within lean production.
Eskilstuna: Mälardalen University.
HemamaliniSuresh, 2004. e- Enabled Supply Chain Management. [Online]
Available at: http://hosteddocs.ittoolbox.com/HS032604.pdf
[Accessed 13 February 2012].
Hines, P., Holweg, M. & Rich, N., 2004. Learning to evolve e a review of contemporary lean
thinking. International Journal of Operations & Production Management, 10(24), pp. 994-
1011.
Hugos, M., 2006. Essentials of supply chain management. John Wiley & Sons, Inc.
Hutchins, D., 1999. Just In Time. 2nd Edition ed. s.l.:Gower Publishing Limited.
Imai, M., 1986. Kaizen: The Key to Japan's Competitive sucess. 1st edition ed. McGraw-Hill.
IMOA, 1999. Definition of LCA. [Online]
Available at: http://www.imoa.info/HSE/LCI/definition_of_LCA.php
[Accessed 27 February 2012].
J.Schonberger, R., 1984. Just-in-time Production Systems: Replacing complexity with
simplicity in manufacturing management. Industrial Engineering, 16(10), pp. 52-63.
Jones, W. P. & Jones, D. T., 1996. Lean Thinking. New York, NY: Simon and Schuster.
Jonsson, P., 2008. Logistics And Supply Chain Management. 2 ed. UK.: McGraw-Hill
education.
K.Liker, J., 2004. The Toyoya Way - 14 Management Priniciples. 2 ed. Tata McGraw-Hill
Edition.
Kainuma, Y. & Tawara, N., 2006. A multiple attribute utility theory approach to lean and
green supply chain management. International Journal of Production Economies, Issue 101,
pp. 99-108.

104
King, A. & Lenox, M., 2001. Lean and Green? An empricial examination of the relationship
between lean production and environmental performance. Production and Operations
Management, 10(3), pp. 244 - 256.
Kleindorfer, P., Singhal, K. & Van Wassenhove, L., 2005. Sustainable operations
management. Production and Operations Management, Volume 14, pp. 482 - 492.
Kovács, 2004. Framing a demand network for sustainability. Progress in Industrial Ecology:
an International Journal, 1(4), pp. 397 - 410.
KPMG, 2011. Corporate Sustainability: A Progress Report - KPMG - GLOBAL. [Online]
Available at:
http://www.kpmg.com/Global/en/IssuesAndInsights/ArticlesPublications/Documents/corpora
te-sustainability-v2.pdf
[Accessed February 2012].
Krueger, K., 2004. The eight wastes of lean. [Online]
Available at: http://www.wisc-online.com/objects/ViewObject.aspx?ID=eng10603
[Accessed 16 January 2012].
Lamming, R. & Hampson, J., 1996. The environment as a supply chain management issue.
British Journal of Management, 7(1), pp. S45 - S62.
Lean Manufacturing Tools, 2012. Lean Manufacturing Tools - Benefits of Lean
Manufacturing. [Online]
Available at: http://leanmanufacturingtools.org/63/benefits-of-lean-manufacturing/
[Accessed 7 April 2012].
Lean Manufacturing Soluctions Inc., 2008. 5S Visual. [Online] Available at:
http://www.lmsi.ca/5s.htm [Accessed 16 January 2012].
LSS Academy, 2008. Benefits of One piece flow. [Online]
Available at: http://lssacademy.com/2008/03/27/10-benefits-of-one-piece-flow/
[Accessed 05 April 2012].
Mann & William, D., 2005. Creating a Lean Culture: Tools to sustain Lean Conversions. 2nd
ed. Productivity Press.
Mason-Jones, R., Naylor, J. & Towill, D., 2000. Engineering the leagile supply chain..
International Journal of Agile Management Systems, 2(1), pp. 54-61.
Matsypura, C. a., 2009. Supply chain networks with corporate social responsibility.
International Journal of Production Research, 3(47), pp. 621 - 648.
Matthew B.Miles, A. M. H., 1984. Qualitative Data Analysis: A Source book of New
Methods. s.l.:Sage Publications, Inc.

105
Melnyk, S., Sroufe, R. & Calantone, R., 2003. Assessing the impact of environmental
environmental management systems on corporate and environmental performance.. Journal
of Operations Management, Issue 21, pp. 329-351.
Melton, T., 2005. The benefits of leanmanufacturingwhat lean thinking has to offer the
process industries.. Journal of Chemical Engineering Research and Design, 6(83), pp. 662-
673.
Min H, G., 1997. Green Purchasing Strategies: Trends and Implications. International
Journal of Supply Chain Management, 3(33), pp. 10 - 17.
Moura, R. A. Armazenagem: do recebimento à expedição. São Paulo: IMAM, 1997. 373p.
Mollenkopf, D. A., Tate, W. L., Ueltschy, M. L. & Stolze, H. J., 2010. Green, Lean and
Global Supply chain stragies, University of Tennessee.
Mollenkopf, D., stolze, h., Tate, W. L. & Ueltschy, M., 2010. Green, Lean, and global suplly
chains. International Journal of Physical Distribution and Logistics Management, 40(1), pp.
14 - 41.
Mudgal RK, Shankar R, Talib P, Raj T., 2009. Greening the supply chain practices: an Indian
perspective of enablers relationship. International Journal of Advanced Operations
Management, 1(2/3), pp. 151 - 176.
NEFEFT - The National Environmental Education & Training Foundation, 2001. Going
Green... Upstream 'The Promise of Supplier Environmental Management', NEFEFT.
Nicholas.J.M., 1998. Competitive Manufacturing Management: Continuous Improvement,
Lean Production, Customer-focused Quality. Irwin/McGraw-Hill..
Núñez-Carballosa, A. & Guitart-Tarrés, L., 2011. Third-party logistics providers in Spain.
Industrial Management & Data Systems, 111(8), pp. 1156 - 1172.
NZBCSD, 2003. Business Guide to a Sustainable Supply Chain - A Practical Guide, s.l.: New
Zealand Business Council for Sustainable Development.
P.R, M. & R.F, P., 2000. Green Logistics Strategies: An analysis of usage patterns.
Transporation Journal, 2(40), pp. 5 - 16.
P.Womack, J., T.Jones, D. & Roos, D., 1990. The Machine that Changed the World. 2nd ed.
s.l.:Harper Perennial.
Patton, M., 1990. Qualitative Evaluation and Research Methods. 2 ed. Newbury Park, CA:
Sage Publications.
Petryk, 1999. ANDON. [Online] Available at: http://www.andon.pl/ [Accessed 14 Febraury
2012].

106
Porter, M. & Van der Linde, C., 1995. Green and Competitive: ending the stalemate. Harvard
Business Review, Volume 73, pp. 120 - 134.
Purba, R., 2002. Greening the supply chain: A new initiative in South East Asia. Int. J. per.
Prod. Manage.,, 22(6), pp. 632-655.
RanjithKarthik, 2011. A Study on the Implementation of Green Supply Chain- A Comparative
Analysis between Small Scale Industries in India and Developed Nations, Eskilstuna:
Mälardalen University.
Rao, P. & Holt, D., 2005. Do green supply chains lead to competitiveness and economic
performance?. International Journal of Operations & Production Management, 9(25), pp.
898-916.
Rettab, B.; Ben Brik, A., 2008. Green Supply Chain in Dubai. Dubai Chamber.
Rothenberg, S., Pil, F. & Maxwell, J., 2001. Lean and green and the quest for the
environmental performance. Production and Operations Management, 10(3), pp. 228 - 243.
Rother, M. & Shook, J., 1999. Value Stream Mapping. [Online] (1.2) Available at:
http://www4.hcmut.edu.vn/~ntdung_ise/Material/Lean%20Manufacturing/Lecture4.pdf
[Accessed 16 January 2012].
R, Shah. & T, Ward. P., 2007. Defining and developing measures of lean production. Journal
of Operations Management, Issue 25, pp. 785 - 805.
Sagar, 1999. dietsagar. [Online]
Available at: http://www.dietsagar.nic.in/Research.html
[Accessed February 2012].
Salam, M. A., 2008. Green Procurement Adoption in Manufacturing. BANGKOK, s.n.
Sangwan, 2011. Quantitative and Qualitative benefits of Green Manufacturing: An Empricial
Study of Indian Small and Large Scale Enterprises.
Sarkis, J., 2003. A strategic decision making framework for green supply chain management.
Journal of Cleaner Production, 4(11), pp. 397-409.
Sarkis, J., Zhu, Q. & Lai, K.-h., 2010. An Organizational Theoretic Review of Green Supply
Chain Management Literature, Georgev Perkins Marsh Institute.
Schafer.A, 1988. The global demand for motorized mobility. Transportation Research, 6(32),
pp. 455-477.
Shalishali, M., Ho, J., Tseng, T. & Ang, D., 2009. Opportunities in green supply chain
management. The Costal business Journal, 8(1), pp. 18-31.
Shingo, 2003. Shingo Prize for Excellence in Manufacturing: Application Guidelines 2003 -
2004. Logan, Utah: College of Business, Utah State University.

107
Simons, D. & Mason, R., 2003. Lean and green: doing more with less.. ECR Journal , 3(1).
Simpson, D. & Power, D., 2005. use the supply relationship to develop lean and green
suppliers. Supply chain management: An International Journal, 10(1), pp. 60- 68.
Society of Manufacturing Engineers (SME), 2008. Lean to green: a path to sustaining your
profits, people & planet?.
Srivastava, S., 2007. Green Supply Chain Management:A state of art literature review..
International Journal of Management Reviews, 1(9), pp. 53-80.
Srivastava, S.K. Srivastava. R.K, 2006. Managing product returns for reverse logistics.
International Journal of Physical Distribution and Logistics Management, Issue 36, pp. 524 -
546.
Susana Duarte, Rosario Cabrita, V. Cuz Machado., 2011. Exploring Lean and green supply
Chain Performance Using Balanced Scorecard Perspective. Kuala Lumpur, Malaysia, s.n.,
pp. 520-525.
T.Melton, 2005. The Benefits of Lean Manufacturing. Institution of Chemical Engineering,
pp. 662 - 673.
Thornton, S., 2009. What is workflow diagram? [Online] Available at:
http://www.ehow.com/about_5455875_workflow-diagram.html [Accessed 20 Febraury
2012].
Tibben-Lembke, R., 2002. Life atter death: Reverse logistics and product life cycle.
International Journal of Physical Distribution & Logistics Management, Issue 32, pp. 223 -
244.
United Nations (UN), 1987. World Commission on environment and development (WCED)
Report.
Vachon.S, 2007. Green supply chain practices and the selection of environmental
technologies.. International Journal of production Research, Volume 45, pp. 18-19.
Venkat, k. & Wakeland, W., 2006. Is lean necessarily green? Proceedings of the 50th Annual
Meeting of the ISSS.
Vonderembse, M., Uppal, M., Huang, S. & Dismukes, J., 2006. Designing supply chains:
towards theory development. International Journal of Production Economics , 2(100), pp.
223-238.
Vorne Industries, Inc., 1999. SMED. [Online] Available at:
http://www.leanproduction.com/smed.html [Accessed 6 April 2012].
Vorne Industries, Inc., 1999. Poka Yoke. [Online] Available at:
http://www.leanproduction.com/theory-of-constraints.html [Accessed 6 April 2012].

108
Walton, S., Handfield, R. & Melnyk, S., 1998. The green supply chain suppliers into
environment management processes. International Journel of Purchasing and Materials
Management, Issue 34, pp. 2-11.
Wang, Y., N.Wang & Sun, L., 2003. The Basic Principles of Green Supply Chain
Management.. Engineering Science, 5(11), pp. 82-87.
Wright, C., 2007. OEE. [Online]
Available at: http://www.reliableplant.com/Read/11785/overall-equipment-effectiveness
[Accessed 06 April 2012].
Wu, H. D. S., 1995. Environmentally responsible logistics system. International Journal of
Physical Distribution & Logistics, Issue 25, pp. 20 - 39.
Yang, M., Hong, P. & Modi, S., 2011. Impact of lean manufacturing and environmental
management on business performance: an empirical study of. International Journal of
Production Economics, Issue 129, pp. 251-261.
Zhu.Q, Sarkis.J & Lai. K.H.,., 2008. Firm-level correlates of emergent green supply chain
management practices in the Chinese context. International Journal of Management, 36(4),
pp. 577 - 591.
Zhu Q, Sarkis J, Lai KH., 2008a. Green supply chain management implications for closing
the loop. Transportation Research, 1(44), pp. 1-18.
Zhu.Q, Sarkis.J &.Lai K.H, 2007. Initiatives and outcomes of green supply chain
management in China.. Journal of Environmental Management, 1(85), p. 179 – 189.
Zhu.Q, Sarkis.J & Lai.KH, 2007. Green supply chain management: pressures, practices and
performance within the Chinese automobile industry. Journal of Cleaner Production, 15(11),
p. 1041–1052.
Zhu., Q. & Sarkis, J., 2006. An inter-sectoral comparison of green supply chain management
in China: Drivers and practices. J. Clean. Prod., 14, , Issue 14, pp. 472-486.
Zhu, Q. S., 2004. Quality Management and Environment Practices: An Analysis of different
Size Organizations in China. Journal of Environmental Quality Management, 13(3), pp. 53 -
64.
Zhu, Q., Sarkis, J. & Kee hung, L., 2007. Initiatives and outcomes of green supply chain
management implementation bu Chinese Manufactures. Journal of Environmental
Management, Issue 85, pp. 179 - 189.
Zhu, Q., Sarkis, J. & Lai, K., 2008. Confirmation of a measurement model for green.
International Journal ofProduction Economics , 2(111), pp. 261-273.
Zsidisin G.A, Siferd S.P., 2001. Environmental purchasing: A framework for theory
development. European Journal of Purchasing & Supply Management, 7(1), pp. 61 - 73.

109
9 APPENDIX
9.1 Appendix 1
Interview dates and Personnel Interviewed
VOLVO CONSTRUCTION EQUIPMENTS, ESKILSTUNA, SWEDEN
Interview dates: February 11th
, 2012 & February 14th
, 2012
Christian Hallin Logistic Developer
Lina Stalberg VPS Navigator
VOLVO CONSTRUCTION EQUIPMENTS, BRAÅS, SWEDEN
Interview date: April 11th
, 2012
Niklas Nilroth Director Environmental Care & Safety
Rickard Alm Environmental Care & Security Manager
Lars Klinthäll Quality, Environment and Safety Directors
Operation Europe
VOLVO CONSTRUCTION EQUIPMENTS, BANGALORE, INDIA
Interview dates: March 5th
, 6th
, 7th
, 2012
Dharmendra Pandey Senior Manager (QES), VPS, Plant Maintenance
& Statutory compliances
G Sundara Murthy Manager-Material Management
Somashekar S V Manager - Business Control & Process
Improvement (Purchase & Supply Management)
Appa Rao Karunakara VPS coordinator
ChandraShekhar G Assistant Manager (ECN – Coordinator)

110
VOLVO BUSES, BANGALORE, INDIA
Interview dates: March 8th
, 9th
, 12th
, 13th
, 2012
Devaraj K Assistant General Manager - Logistics
Suresh H Associate Manager – Procurement
Munishamachari Assistant Manager – Warehouse
Chandy PA Internal Officer
Nandhagopal SAP Engineer
VOLVO EICHER COMMERCIAL VEHICLES, PITHAMPUR, INDIA
Interview dates: March 15th
, 16th
2012
Vivek Dange Head – Sales Planning & Logistics
Prasoon Singh Manager – After Market (Spares)
PrabhuramR Deputy Manager - Marketing
Lokesh Sharma Deputy Manager – Materials
Prakash Yadav Assistant Manager, Materials
Shailendra Sisodia Assistant Manager, Materials
Neeraj Saad Assistant Manager, Production
Rajiv Grover Assistant Manager, After Market - Parts

111
9.2 Appendix 2
About the Case Companies
VOLVO GROUP
Volvo as a company was originally founded by two visionary gentlemen, Assar Gabrielsson
and Gustaf Larsson. The Volvo group dates its origin back to 1927 when the first Volvo car
left the production line in Gothenburg. Starting from the date of foundation, the company set
its view on safety and quality to a higher bar. The founders expressed this view as “Since
vehicles are driven by people, safety is – and must always be – the basic principle in all
design work” (Volvo group broacher 2010). This view has extended in the company till today
as the core values (figure 23) of the company: Quality, Safety and Environment.
Figure 21 Volvo Group – Core Values
Volvo Group’s core values over the years, the Volvo Group developed from a local industrial
company to one of the world’s largest manufacturer of trucks, buses, construction equipment,
marine engines and engine components for the aircraft and aerospace industries. The group
has grown to the stage it is today both organically and through acquisition of other reputed
brands. With the acquisition of Renault Trucks and Mack in 2001, the position in the truck
market was further strengthened, and the Group’s roots branched out to France and the US.
During 2006 and 2007, the Volvo Group acquired the Japanese truck manufacturer UD
Trucks, the US company Ingersoll Rand’s division for road machinery and majority of the
shares in Lingong, one of China’s largest manufacturers of wheel loaders. In May 2008, an
agreement was signed regarding the manufacture of trucks and buses with the Indian
company Eicher Motors (Volvo group brochure 2010). Today, Volvo group is one of the
world’s leading suppliers of transport solutions for commercial use and also financial
solutions and services (Volvo Group presentation 2011). As most successful companies,
Volvo Group is derived by a strong mission and vision.
The Group’s mission is stated as “By creating value for our customers we create value for
our shareholders. We use our expertise to create transport-related hard and soft products of
superior quality, safety and environmental care for demanding customers in selected
segments. We work with energy, passion and respect for the individual” and the Group’s
vision is “to be valued as the world’s leading supplier of commercial transport solutions”
(Volvo Group presentation 2011).

112
The Volvo Group is divided into different business area and business unit segments as seen in
figure 24. Moreover, it has about 100, 000 employees, production facilities in 19 countries
and operations in more than 180 countries in the world (www.Volvogroup.com ). The
Group’s business segments and areas are illustrated in the following figure 24.
Figure 22 Volvo Group – Business Area
The major business areas for the Volvo Group are trucks, busses, construction equipment,
marine engines (Volvo Penta), aircraft components (Volvo Aero) and financial services.
These business areas are supported by the business units Volvo 3P, Volvo Power train, Volvo
parts, Volvo logistics, Volvo Business Services, Volvo Information Technology, Volvo
Group Real Estate and Volvo Technology as indicted figure 24. This master thesis is dealing
with Volvo Construction Equipment (Braås-SWE, Eskilstuna - SWE & Bangalore - IND),
Volvo Buses – Bangalore (IND), VE Commercial Vehicles – Pithampur (IND). For this
reason, a brief company description of case companies is given in the following sections.
Volvo construction equipment
As a member of the Volvo Group, Volvo Construction Equipment (VCE) is built on the three
corporate values safety, quality and environment. Volvo Construction Equipment
manufactures equipments for the construction and related industries. It is one of the world’s
largest manufacturers of articulated haulers, wheel loaders, excavation equipments, road
construction machines and compact construction equipment. Construction Equipment is the
second largest business area next to trucks with in the Volvo Group as far as net sales is
concerned and it employs over 16,000 people (Volvo CE corporate brochure, 2008).
Over the past years, Volvo CE grew both organically and by acquiring other brands. Some of
the other brands acquired by Volvo CE are Ingersoll-Rand in 2007, lingong in 2006, Skat trak
2003, Samsung in 1998,Champion in 1997, Åkerman in 1991, and Zettelmeyer 1990 (Volvo

113
CE corporate brochure). This helped Volvo CE‟s product range to expand to the limit it has
reached today. Some of the products included in Volvo CEs product range are wheel loaders,
compact wheel loaders, Backhoe loaders, Excavators, Compact Excavators, Wheeled
Excavators, Crawler Excavators, Articulated Haulers, Motor Graders, Milling Equipment,
Pavers, Asphalt Compactors, Soil Compactors, Tracked Forestry Carriers and Pipe layers.
Volvo Construction Equipment provides customers around the globe in different industry
segments. These major industry segments Volvo Construction Equipment provides
equipments and services are; heavy infrastructure, road construction, quarries and aggregates,
mining, agricultural and landscaping, building, Industrial material handling, recycling,
forestry, oil and gas and demolition. The first four industry segments make up about 76 % of
Volvo CE’s offer according to Volvo CE’s global website.
Plant Products
Braås Articulated Haulers
Eskilstuna Axles & Transmissions
Bangalore Road Roller & Machineries & Excavators
Volvo Buses, Bangalore – INDIA
The factory was started to build up in the year 2007; construction time is about 11 month’s
duration. The factory was constructed with a capacity to produce 1000 buses/year. Their first
bus came out of the factory at 31st Jan 2008. The company’s corporate value is Quality,
Safety and Environmental Care.
At present the company produces two types of buses namely CITY and
INTERCITY buses. Also they enter into CNG buses their future scope in CNG buses is to
have 85 Cities market in next three years.
The company has a factory expansion plan in order to cater the market
demands. Their operative vision in 2015 is to produce 5000 buses with lesser throughput
time, Produced in reduced cycle time, with bench mark in quality, by setting standards in
productivity and nurturing the culture, focussed on people development.
Products
Volvo 9400 Multi-Axle Intercity Coach
Volvo 9400 Intercity Coach
Volvo 8400 Low floor city bus

114
VE Commercial Vehicles – Pithampur (India)
Eicher Group is a conglomerate of the firms Eicher Goodearth Ltd., Eicher Ltd., Eicher
Motors Ltd., Eicher International Ltd., and ECS Ltd., based in New Delhi, India. As of 1 July
2009, the company was renamed VE Commercial Vehicles Limited (VECV). It is a 50:50
joint venture with Volvo Group. The VECV has around 2500 employees located in four
manufacturing facilities and 49 marketing and area offices around India. The group has
around 600 suppliers of components and sub-assemblies. The group’s products are supplied
by a network of around 381 dealers distributed across India. Eicher is present in over 40 other
countries.
Eicher Motors is a commercial vehicle manufacturer in India. The company's origins date
back to 1948, when Good earth Company was established for the distribution and service of
imported tractors. In 1959 the Eicher Tractor Corporation of India Private Ltd. was
established, jointly with the Eicher tractor company, a German tractor manufacturer. In 1960
the first tractor produced in India was put on the market. Since 1965 Eicher in India has been
completely owned by Indian shareholders. The German Eicher tractor was partly owned by
Massey-Ferguson from 1970, when they bought 30 per cent. Massey-Ferguson bought out the
German company in 1973.In 2005 Eicher Motors Ltd. sold their tractors and engines business
to TAFE Tractors (Tractors And Farm Equipment Ltd) of Chennai, the Indian licence of
Massey Ferguson tractors.
The Eicher Group has diversified business interests in design and development,
manufacturing, and local and international marketing of trucks, buses, motorcycles,
automotive gears, and components. Eicher has invested in the potential growth areas of
management consultancy services, customized engineering solutions, and maps and travel
guides.
Products
Tipper Trucks
Haulage Trucks
Articulated Tractors
Buses [City Buses, Staff Bus, etc,]

115
9.3 Appendix 3
Interview Questions
LEAN
1. When did your organization start efforts to introduce Lean principles?
2. What do you associate with lean philosophy? (Options)
o A method to reduce head count
o A tool box of techniques (JIT, Kaizen, 5s etc.) to improve manufacturing and
operations.
o The use of team work and continuous improvement.
o The consequent elimination of non-value adding tasks in order to reduce lead
time.
o A system for organizing and managing product development, operations,
suppliers and customer relations
o A system to make products with fewer defects in order to strive for perfection.
o The philosophy that absolutely focuses on customer value (Customer-first
force)
o Other, please describe
3. Why did your company decide using lean practices?
4. What are the lean tools used in your organization?
[5 S, JIT, Error Proofing, Inventory Turnover Rate, JIT, Kaizen, Kanban, One-piece Flow,
Overall Equipment Effectiveness, Quick Changeover, Standard Rate or Work, TPM, Value
Stream Mapping, Visual Management, Workflow Diagram]
I. How do you work with these tools and methods?
II. What is the implication of these tools and methods to your company?
III. How many percent of people are involved in lean improvements?
IV. How much time does production development spend on this approach per week or
per month?
V. How are the tools or methods for identifying non-value-added work in the process
used? (Partially Used or all over the supply chain)?
- What are difficulties faced in using / trying to use the tools?
VI. Are there any approaches for enabling the value-added flow fast and flexible? (one
piece flow or continuous flow)
VII. Are there any tools or methods that are used for stabilizing and standardizing
production processes? (5S, TPM, standardized work, jidoka, heijunka, kanban)
(Partially Used or all over the supply chain)?
- What are difficulties faced in using / trying to use the tools?

116
VIII. Are there any tools or methods used in visual control systems?
(5S,Kanban,Andon)
IX. How effectively 5S [] is being followed? How is being approached to organize?
- Are there any specific areas which are difficult to implement 5S? Why?
X. How effectively TPM [] is being followed? How is being approached to organize?
- Are there any specific areas which are difficult to implement TPM?
Why?
XI. Is Just-in-time used? Is JIT interfaced with the supplier? What are the specific
areas uncovered with JIT? Why?
XII. Are there any approaches for balancing and leveling production volume and
production time in order to keep rate of production constant irrespective of the
fluctuation in demand? (Production leveling)
XIII. Are there any tools or methods for problem solving? For example, how do they
identify errors or defects occur during the process? (JIDOKA>POKA-YOKE,
Andon, 5s,)? How is the problem solving methodology and improvements
handled?
XIV. Are there any tools or methods used for enhancing employee involvement?
(Kaizen, standardized work, 5s, TPM)
GREEN
5. What is your view about green (Supply chain)?
6. Is there a green team set up in your organization?
7. How many percent of the employees are involved in green team/activities?
8. How much time does green team spend time on development per week or per month?
9. How frequent is the audit meetings held up for green perspective improvements?
10. Can you explain the current state of environmental improvement work?
11. What are the present challenges faced by the green team connected to environmental
improvement work?
12. How far the support is provided for the environmental improvement works?
13. What are the priority/ consideration/plan for the green development in the yearly plan
(Mission)?
14. Is it feasible to use green parts/products in the manufacturing vehicles?
15. How is green viewed/planned in the product life cycle?
16. How are 4 R’s (Reduce, Reuse, Recycle, Recover) are handled and where?
17. How solid, liquid waste and emissions into air are handled and how are they treated?
Lean and Green: Conflicts & Trade-Offs:
18. Does the cost for implementing green will add up to the product cost? (Euro 6)
- Is this a reason for not implementing Green?

117
19. Whether top management plays an important role in Green implementation?
20. Whether the green implementation conflicting with the strategic plan?
21. Are the customers ready to afford green?
22. What is the customer focus/view on green?
23. What are the implications to environmental impact reduction and environmental
performance improvement when lean “muda” wastes eliminated?
24. When JIT is followed, there is short interval delivery of materials and goods, but in a
green aspect can it longer enough (rise in inventory) to reduce the Carbon-foot print
without chaos in production schedule/replenishment?
25. How your logistics is viewed in terms of lean and green?
26. How is the Reverse logistics handled? How are the materials disposed off? Is reverse
logistics used effectively?
Supply Chain Management
1. What are the Problems faced in each cycle (Holistic)
Procurement Cycle
Manufacturing Cycle
Replenishment cycle
Customer order cycle
1.1. And what are the problems you solved before and how? (major problems in cycles)
2. In what cycle is the lean approach difficult to handle? Why?
3. In general, where do you think the occurrence of problem is more
(Rate from 1 to 4, 1-high, 4 least)? Why / How?
In Procurement Cycle (Supplier and Manufacturer)
In Manufacturing Cycle (Manufacturer and Dealer)
In Replenishment Cycle (Distributor and Dealer)(Warehouse)
Customer order Cycle (Dealer and Customer)
4. Is your supply chain integrated with your supplier? Do you perform a collaborative
Forecasting?
Yes/No
5. What type of Forecast are you performing?
Seasonal Forecast
Demand Forecast

118
Both (Depends on the Product)
Other _____________________
6. What percentage of the products contributes for Reverse Logistics? (Approx)?
Reverse Logistics - (Defective products sent back to the Plant and products sent back
after usable life for recycling)
7. Where is the warehouse / Distribution center located between? Tick all that apply.
Supplier and Industry
Industry and the Dealer

119
9.4 Appendix 4
Survey
Thesis Title : Improving Supply Chain Performance through Lean and Green: A Study at
Volvo Group In India and Sweden.
Thesis Supervisor: Professor Mats Jackson, Mälardalen University, Eskilstuna - Sweden
E-mail : [email protected]
University Web page: http://www.mdh.se/
Master Thesis by,
Hariram Vedapatti Ranganathan : [email protected]
Harishkumar Rajuvadan Premkumar : [email protected]
* Name of the Company :
* Country :
Sweden
India
Other
Please Specify
* Name of the respondent :
Position in the company :

120
* E-mail address:
Questions about LEAN
1. When did your organization start efforts to introduce Lean principles?
2. What do you associate with lean philosophy?
A method to reduce head count
A tool box of techniques (JIT, Kaizen, 5s etc.) to improve manufacturing and operations
The use of team work and continuous improvement
The consequent elimination of non-value adding tasks in order to reduce lead time
A system for organizing and managing product development, operations, suppliers and
customer relations
A system to make products with fewer defects in order to strive for perfection
The philosophy that absolutely focuses on customer value (Customer-first force)
Others, Please describe
3. What are the lean tools used in your organization?
5S
Kaizen
Kanban
Error Proofing
One-piece Flow

121
Workflow Diagram
Quick Changeover
Visual Management
JIT(Just In Time)
Standard Rate or Work
Inventory Turnover Rate
VSM (Value Stream Mapping)
OEE (Overall Equipment Effectiveness)
TPM (Total Productive Maintenance)
Other, Please Specify
4. How long has your company factored environmental concern into strategic decision
making?
Less than 1 year
1 to 3 years
3 to 5 years
More than 5 years
Not Applicable
Question about Green
5. Is there a dedicated Green team setup in your organization?

122
Yes
No
Any comments
6. Which are the main business drivers behind importance of environmental issues? (Please
drag the answer choices from left to right according to priority)
1 2 3 4 5 6 7 8
Environmental regulations
Improve corporate image
Cost reduction
Innovation
Customers
Competitors actions
Executive leadership
New markets opportunities
Other, Please Specify
7. Which of the following environmental factors does your firm take into consideration when
taking strategic decision?
Packaging (treatment, recycling...)
Commodities consumption (paper...)
Energy consumption from factories

123
Choice of raw materials/products
Waste (treatment, reprocessing)
Water (treatment, purification)
Choice of transportation mode
Employee health
Gas emissions
Other, Please Specify
8. Do you think of environmental regulation as…
An opportunity to innovate
Critical to your business
A constraint
I don't know
9. What is the main motive for implementing a green supply chain
Environmental regulations
Improve corporate image
Competitors action
Cost reduction
Executive leadership
New market opportunities

124
Innovation (process/product)
10. Benefits of the green supply chain
Improve brand image
Reduce logistics cost
Expand to new markets
Optimize manufacturing
Optimize logistics flow
Satisfy customer requirements
Differentiate from competitors
Establish a competitive advantage
11. Which are your main decision criteria in the green design initiative? (Tick all that are
applicable)
Improve company image
Facilitate recycling
Meet market demand
Reduce logistics costs
Reduce manufacturing costs
Increase customer confidence
Achieve regulatory compliance
Differentiate from competitors
Other, Please Specify

125
12. Main measures involved in green design - Which types of actions have been undertaken?
Modify process
Change suppliers
Reprocessing of waste
Change of raw materials
Use new and clean technologies
Implementation of Environmental Management System [EMS]
Other, Please Specify
13. The main obstacles to adopting a green sourcing approach - What is your main reason?
(Please tick all that apply)
High costs
Lack of information
No return on investment
Too complex to implement
Other, Please Specify
14. Main actions taken to implement green sourcing - Which types of actions have been
undertaken?
Implement environmental management system in your suppliers

126
Purchase less polluting materials/products
On your suppliers
Other, Please Specify
15. Supplier involvement and monitoring - Are suppliers involved in your “green sourcing”
approach?
Yes
No
15 a. How are they involved in your “green sourcing approach”?
New product design
Environmental charter signature
Mutual development environment projects
Other, Please Specify
15 b. Do you evaluate their environmental compliance performance?
Yes
No
I don’t know
15 c. How do you evaluate their performance?
Auditing

127
Key performance indicator
Other, Please Specify
16. What are your main drivers for green logistics? (Please drag the answer choices from left
to right according to priority)
1 2 3 4 5 6
Optimize logistics flow
Improve corporate image
Reduce logistics costs
Satisfy customer requirements
Differentiate from competitors
Develop alternative networks
17. Which types of environmental actions have been undertaken? (Please tick all that apply)
Revising the logistics schemes
Using the nearest supply sources
Bringing production sites closer to consumers
Adopting the least polluting transportation means (train, waterways)
Other, Please Specify
18. Has the implementation of Lean resulted in any environmental benefits within your
organization?

128
Yes
No
19. Has the implementation of Lean resulted in any environmental problems within your
organization?
Yes
No
20. Have you heard of environmental or green versions of lean?
Yes
No
Comments if any, Please Specify
21.Do you consider a combined approach of Environmental Management with Lean value to
your organization?
Yes
No
Not considered this before
22. Do you think Lean enhances current environmental management practices?
Yes
No
Not considered this before
23. Are you concerned about the impact of increasing environmental legislation and targets
on your organization?

129
Yes
No
Not considered this before
24. In general, what are your biggest environmental concerns, please answer all that applies?
[1- highest concern; 9- Relatively Less concern]
1 2 3 4 5 6 7 8 9
Air quality (emissions from transport, power
stations)
General health of people, plants and wildlife
Packaging (production, recycling and disposal)
Transportation methods (air, sea and land)
Energy production (conventional methods)
General waste (landfill, sea)
Food contamination
Global warming
Water quality
Other, Please Specify
25. Do Lean teams work together with Environmental employees or functions in your
organization on business improvement projects?
Yes
No
Not considered this before

130
Thank you very much for spending your valuable time in filling the survey.
Best Regards
Hariram VR
Harishkumar RP,
MSc- Product and Process Development - Production & Logistics,
Mälardalen University,
Eskilstuna, Sweden