improving teaching effectiveness - rand.org€¦ · kaitlin fronberg, gabriel weinberger, gerald...
TRANSCRIPT

Prepared for the Bill and Melinda Gates Foundation
Impro v i n g Te ach i n g E f f e c t i v e n ess
BR IAN M. STECHER , DEBORAH J . HOLTZMAN , M ICHAEL S . GARET, LAURA S . HAMILTON ,
JOHN ENGBERG , E L I ZABETH D . STE INER , ABBY ROBYN , MATTHEW D . BA IRD ,
I TALO A . GUT I ERREZ , EVAN D . PEET, I L I ANA BRODZ IAK DE LOS REYES ,
KA ITL IN FRONBERG , GABR I E L WE INBERGER , GERALD PAUL HUNTER , JAY CHAMBERS
f i n a l r e p o r t a p p e n d i x e s
The INTENSIVE PARTNERSHIPS for EFFECTIVE TEACHING Through 2015–2016
C O R P O R A T I O N

This work is licensed under a Creative Commons Attribution 4.0 International License. All users of the publication are permitted to copy and redistribute the material in any medium or format and transform and build upon the material, including for any purpose (including commercial) without further permission or fees being required. For additional information, please visit http://creativecommons.org/licenses/by/4.0/.
The RAND Corporation is a research organization that develops solutions to public policy challenges to help make communities throughout the world safer and more secure, healthier and more prosperous. RAND is nonprofit, nonpartisan, and committed to the public interest.
RAND’s publications do not necessarily reflect the opinions of its research clients and sponsors.
Support RANDMake a tax-deductible charitable contribution at
www.rand.org/giving/contribute
www.rand.org
For more information on this publication, visit www.rand.org/t/RR2242
Published by the RAND Corporation, Santa Monica, Calif.
© Copyright 2018 RAND Corporation
R® is a registered trademark.
iii
Contents
Figures ..................................................................................................................................... vii Tables ........................................................................................................................................ ix Appendix A. Survey, Interview, and Archival Academic Data Collection and Analysis .............. 1
Survey Methods .................................................................................................................................. 1 Survey Content and Constructs ....................................................................................................... 1 Survey Sampling ............................................................................................................................. 3 Survey Administration .................................................................................................................... 4 Survey Data Analysis ...................................................................................................................... 7
Interview Methods ............................................................................................................................ 10 Interview Data Collection ............................................................................................................. 10 Interview Analysis ........................................................................................................................ 13
Archival Academic Data Methods ..................................................................................................... 13 Data Acquisition ........................................................................................................................... 13 Estimation of Teacher Value Added .............................................................................................. 14
Appendix B. Site TE Measures: Supplementary Material for Chapter Three ............................. 17 Districts ............................................................................................................................................ 17
HCPS............................................................................................................................................ 17 PPS ............................................................................................................................................... 19 SCS .............................................................................................................................................. 23
CMOs: Common Elements of the TE Measures................................................................................. 26 Composite Measure ...................................................................................................................... 26 Classroom Practice Measure ......................................................................................................... 27 Student Achievement Measure ...................................................................................................... 28 Student Feedback Measure ............................................................................................................ 28 Family Feedback Measure ............................................................................................................. 28 Peer Feedback Measure ................................................................................................................. 28
CMO-Specific Aspects of the TE Measures ....................................................................................... 29 Alliance ........................................................................................................................................ 29 Aspire ........................................................................................................................................... 30 Green Dot ..................................................................................................................................... 32 PUC .............................................................................................................................................. 35
Appendix C. Additional Exhibits for Chapter Three .................................................................. 39 Appendix D. Site Recruitment, Hiring, Placement, and Transfer Policies: Supplementary
Material for Chapter Four ................................................................................................... 45 District Recruitment, Hiring, Placement, and Transfer Policies .......................................................... 45
HCPS............................................................................................................................................ 45 PPS ............................................................................................................................................... 47

iv
SCS .............................................................................................................................................. 49 CMO Recruitment, Hiring, Placement, and Transfer Policies............................................................. 52
Alliance ........................................................................................................................................ 53 Aspire ........................................................................................................................................... 54 Green Dot ..................................................................................................................................... 56 PUC .............................................................................................................................................. 58
Appendix E. Site Tenure and Dismissal Policies: Supplementary Material for Chapter Five ..... 59 District Tenure and Dismissal Policies .............................................................................................. 59
HCPS............................................................................................................................................ 59 PPS ............................................................................................................................................... 59 SCS .............................................................................................................................................. 60
CMO Tenure and Dismissal Policies ................................................................................................. 61 Appendix F. Site PD Policies: Supplementary Material for Chapter Six .................................... 63
District PD Policies ........................................................................................................................... 63 HCPS............................................................................................................................................ 63 PPS ............................................................................................................................................... 64 SCS .............................................................................................................................................. 66
CMO PD Policies.............................................................................................................................. 68 Alliance ........................................................................................................................................ 69 Aspire ........................................................................................................................................... 71 Green Dot ..................................................................................................................................... 72 PUC .............................................................................................................................................. 73
Appendix G. Additional Exhibits for Chapter Six ..................................................................... 75 Appendix H. Site Compensation Policies: Supplementary Material for Chapter Seven.............. 79
District Compensation Policies .......................................................................................................... 79 HCPS............................................................................................................................................ 79 PPS ............................................................................................................................................... 80 SCS .............................................................................................................................................. 82
CMO Compensation Policies ............................................................................................................ 83 Supplementary Effectiveness-Based Payments .............................................................................. 83 Effectiveness-Based Salary Schedule ............................................................................................ 84
Appendix I. Analyzing the Relationships Between Teacher Compensation, Assignment to LIM Populations, and TE: Analytic Methods for Chapter Seven ................................................. 87
Appendix J. Site CL Policies: Supplementary Material for Chapter Eight ................................. 89 District CL Policies ........................................................................................................................... 89
HCPS............................................................................................................................................ 89 PPS ............................................................................................................................................... 89 SCS .............................................................................................................................................. 92
CMO CL Policies.............................................................................................................................. 93 Alliance ........................................................................................................................................ 93 Aspire ........................................................................................................................................... 93 Green Dot ..................................................................................................................................... 94

v
PUC .............................................................................................................................................. 96 Appendix K. Additional Exhibits for Chapter Eight .................................................................. 99 Appendix L. Resources Invested in the IP Initiative: Analytic Methods for Chapter Nine ....... 103
Site Expenditure Data and Analysis ................................................................................................. 103 Data Sources ............................................................................................................................... 103 Data Analysis .............................................................................................................................. 105
Time Allocation Data and Analysis ................................................................................................. 106 Description of the Survey Section ............................................................................................... 106 Data Cleaning and Processing ..................................................................................................... 107 Requirements for Inclusion in Analysis ....................................................................................... 108 Analytic Samples ........................................................................................................................ 108
Estimation of the Value of Teacher and SL Time Spent on Evaluation Activities ............................. 110 Data ............................................................................................................................................ 110 Data Analysis .............................................................................................................................. 110
Appendix M. Additional Exhibits for Chapter Nine ................................................................ 113 Appendix N. Additional Exhibits for Chapter Ten .................................................................. 119
HCPS.............................................................................................................................................. 119 PPS ................................................................................................................................................. 120 SCS ................................................................................................................................................ 121 Alliance .......................................................................................................................................... 123 Aspire ............................................................................................................................................. 124 Green Dot ....................................................................................................................................... 125
Appendix O. Estimating the Relationship Between TE and Retention: Analytic Methods for Chapter Eleven ................................................................................................................. 127
Modeling Teacher Retention as a Function of Effectiveness ............................................................ 127 Appendix P. Additional Exhibits for Chapter Eleven .............................................................. 131
Annual Trends in Retention Rates ................................................................................................... 131 HCPS.......................................................................................................................................... 131 PPS ............................................................................................................................................. 132 SCS ............................................................................................................................................ 134 Alliance ...................................................................................................................................... 135 Aspire ......................................................................................................................................... 136 Green Dot ................................................................................................................................... 137
Sensitivity Check: Teacher Retention After Two Consecutive Years ............................................... 137 HCPS.......................................................................................................................................... 138 PPS ............................................................................................................................................. 139 SCS ............................................................................................................................................ 140
Appendix Q. Additional Exhibits for Chapter Twelve ............................................................. 143 Appendix R. The Initiative’s Effects on TE and LIM Students’ Access to Effective Teaching:
Analytic Methods for Chapter Twelve .............................................................................. 145 Relationship Between Percentage of Students Who Are LIM Students and Teacher Value Added ... 145
vi
Change in Access Coefficient: Interrupted Time-Series Methodology ............................................. 147 Analysis of Mechanisms Used to Change Access ............................................................................ 148
Appendix S. Additional Exhibits for Chapter Thirteen ............................................................ 151 Appendix T. Estimating the Initiative’s Impact on Student Outcomes: Data and Analytic
Methods for Chapter Thirteen ........................................................................................... 153 Data and Outcomes ......................................................................................................................... 153 School-Level Difference-in-Differences Methodology .................................................................... 156 Estimation Models .......................................................................................................................... 159
Appendix U. Additional Impact Estimates for Chapter Thirteen ............................................. 163

vii
Figures
Figure C.1. Teachers Reporting That Evaluation Components Were Valid Measures of Their Effectiveness to a Large or Moderate Extent, Springs 2013–2016 ............................ 39
Figure C.2. Teachers’ Agreement with Statements About Observations, Springs 2013–2016 .... 40 Figure C.3. Teachers’ Agreement with Statements About the Use of Student Achievement
in Teachers’ Evaluations, Springs 2013–2016 ................................................................... 41 Figure C.4. Teachers’ Agreement with Statements About the Use of Student Feedback in
Teachers’ Evaluations, Springs 2013–2016 ....................................................................... 41 Figure C.5. Teachers’ Agreement with Statements About Evaluation, Springs 2013–2016 ........ 42 Figure C.6. Teachers’ Agreement with Statements About the Usefulness of Feedback from
Evaluation Components, Springs 2013–2016 .................................................................... 43 Figure G.1. Teachers’ Responses About Uses of Evaluation Results, Springs 2013–2016 ......... 75 Figure G.2. Teachers’ Responses to the Survey Question, “To What Extent Did Each of the
Following Influence What Professional Development You Participated in This Year?” Springs 2011–2016 ........................................................................................................... 76
Figure G.3. Teachers’ Agreement That Their PD During the Past Year Was Aligned with Various Sources, Springs 2013–2016 ................................................................................ 76
Figure G.4. Teachers’ Agreement with Statements About Support for PD, Springs 2011–2016 ........................................................................................................... 77
Figure G.5. Percentage of Teachers Reporting Enhanced Skills and Knowledge, in Various Areas, Due to PD, Springs 2011–2016 ............................................................. 78
Figure G.6. Teachers’ Perceptions of the Usefulness of Various Forms of PD, Springs 2013–2016 ........................................................................................................... 78
Figure K.1. SLs Reporting That Their Site Had or Was Phasing in a CL or Specialized Instructional Positions, Springs 2013–2016 ..................................................................... 100
Figure K.2. SLs Reporting That There Were Teachers at Their School Who Held Higher-Level CL or Specialized Instructional Positions, Springs 2013–2016 .................. 101
Figure K.3. Teachers’ Agreement with Statements About CLs, Selected Sites and Years ........ 101 Figure N.1. HCPS Middle-Experience Effectiveness,
by VAM Score and Composite TE Level ........................................................................ 119 Figure N.2. HCPS High-Experience Effectiveness, by VAM Score and Composite TE Level . 120 Figure N.3. PPS Middle-Experience Effectiveness, by VAM Score and Composite TE Level . 121 Figure N.4. PPS High-Experience Effectiveness, by VAM Score and Composite TE Level .... 121 Figure N.5. SCS Middle-Experience Effectiveness, by VAM Score and Composite TE Level 122 Figure N.6. SCS High-Experience Effectiveness, by VAM Score and Composite TE Level .... 122 Figure N.7. Alliance Middle-Experience Effectiveness, by Composite TE Level .................... 123

viii
Figure N.8. Alliance High-Experience Effectiveness, by Composite TE Level ........................ 123 Figure N.9. Aspire Middle-Experience Effectiveness, by VAM Score and Composite TE Level
....................................................................................................................................... 124 Figure N.10. Aspire High-Experience Effectiveness, by VAM Score and Composite TE Level
....................................................................................................................................... 125 Figure N.11. Green Dot Middle-Experience Effectiveness, by Composite TE Level ............... 125 Figure N.12. Green Dot High-Experience Effectiveness, by Composite TE Level ................... 126 Figure P.1. Adjusted Percentage of Teachers Remaining in HCPS,
by Year, Composite TE Level, and VAM Score .............................................................. 132 Figure P.2. Adjusted Percentage of Teachers Remaining in PPS,
by Year, Composite TE Level, and VAM Score .............................................................. 133 Figure P.3. Adjusted Percentage of Teachers Remaining in SCS,
by Year, Composite TE Level, and VAM Score .............................................................. 134 Figure P.4. Adjusted Percentage of Teachers Remaining in Alliance,
by Year and Composite TE Level ................................................................................... 135 Figure P.5. Adjusted Percentage of Teachers Remaining in Aspire,
by Year, Composite TE Level, and VAM Score .............................................................. 136 Figure P.6. Adjusted Percentage of Teachers Remaining in Green Dot from One Year to
the Next, by Composite TE Level ................................................................................... 137 Figure P.7. Adjusted Percentage of Teachers Remaining in HCPS Based on Two
Consecutive Years of Ratings for TE and Teacher Value Added, by Effectiveness Level .................................................................................................... 139
Figure P.8. Adjusted Percentage of Teachers Remaining in PPS Based on Two Consecutive Years of Ratings for TE and Teacher Value Added, by Effectiveness Level .................................................................................................... 140
Figure P.9. Adjusted Percentage of Teachers Remaining in SCS Based on Two Consecutive Years of Ratings for TE and Teacher Value Added, by Effectiveness Level .................................................................................................... 141
Figure Q.1. SLs Agreement with Statements About Teacher Assignments, Springs 2014–2016 ......................................................................................................... 143
Figure S.1. SLs’ Perceptions of “How Many Teachers in Your School” Possessed Various Skills, Springs 2013–2016............................................................................................... 151
Figure T.1. Graphical Depiction of Methodology for Computing Forecasts of Postinitiative Trends ....................................................................................................... 158

ix
Tables
Table A.1. Numbers of Schools Surveyed ................................................................................... 3 Table A.2. Numbers of Teachers and SLs Surveyed .................................................................... 4 Table A.3. District Teacher Response Rates, Surveys Completed, and Teachers Sampled ........... 5 Table A.4. CMO Teacher Response Rates, Surveys Completed, and Teachers Sampled ............. 5 Table A.5. District SL Response Rates, Surveys Completed, and Leaders Sampled .................... 6 Table A.6. CMO SL Response Rates, Surveys Completed, and Leaders Sampled ....................... 6 Table A.7. Collapsing of Site TE Categories for Survey Item Disaggregations, by TE Rating ..... 9 Table A.8. Number of Central-Office Administrators and Stakeholders Interviewed Each
Fall ................................................................................................................................... 11 Table A.9. Number of School-Level Staff Interviewed ............................................................. 12 Table D.1. Participants in the Aspire Residency Program ......................................................... 55 Table K.1. Teacher Survey Questions About Awareness of CLs and Specialized Positions ....... 99 Table L.1. IP Sites’ Financial Reports ..................................................................................... 103 Table L.2. Strategies, by Site .................................................................................................. 105 Table L.3. Detailed Description of SL and Teacher Survey Sample Exclusions for the
Time Allocation Analysis................................................................................................ 109 Table L.4. Final Sample Sizes, by Site .................................................................................... 109 Table L.5. Value of Teacher Time Spent on Evaluation Activities .......................................... 111 Table L.6. Value of SL Time Spent on Evaluation Activities .................................................. 111 Table M.1. Teacher Time Allocation Mean Percentages, by Site............................................. 113 Table M.2. SL Time Allocation Mean Percentages, by Site .................................................... 114 Table M.3. Principal and AP Time Allocation Mean Percentages, by Site ............................... 116 Table O.1. Estimated Teacher-Retention Percentages, by TE Level, Period, and Site,
for All Teachers with Composite TE Levels .................................................................... 128 Table O.2. Estimated Teacher-Retention Percentages,
by Level of Value Added, Period, and Site, for All Teachers with VAM Scores .............. 129 Table O.3. Estimated Teacher-Retention Percentages, by TE Level, Period, and Site,
for All Teachers with Both Composite TE Levels and VAM Scores ................................ 130 Table O.4. Estimated Teacher-Retention Percentages, by Level of Value Added, Period,
and Site, for All Teachers with Both Composite TE Levels and VAM Scores ................. 130 Table Q.1. Average and Standard Deviations of Teacher Value Added ................................... 143 Table T.1. Summary of Data Elements ................................................................................... 155 Table T.2. Average Demographics in the IP Sites and in the Rest of Their States,
as Proportions ................................................................................................................. 157 Table U.1. HCPS Impact Estimates, by Grade, Subgroup, and Year........................................ 164
x
Table U.2. PPS Impact Estimates, by Grade, Subgroup, and Year ........................................... 169 Table U.3. SCS Impact Estimates, by Grade, Subgroup, and Year .......................................... 173 Table U.4. CMOs’ Combined Impact Estimates, by Grade, Subgroup, and Year ..................... 175 Table U.5. Aspire Impact Estimates, by Grade, Subgroup, and Year ....................................... 180 Table U.6. Green Dot Impact Estimates, by Grade, Subgroup, and Year ................................. 184

1
Appendix A. Survey, Interview, and Archival Academic Data Collection and Analysis
Many parts of this evaluation relied on three types of data collected from the initiative sites: (1) surveys of teachers and SLs designed and administered by the evaluation team; (2) interviews conducted by the evaluation team with central-office administrators and with SLs and teachers in a small sample of schools; and (3) archival academic data related to students and teachers. This appendix describes the survey, interview, and archival data we acquired from the sites. We also describe the methods we used to analyze the data in those cases in which the analyses were common to many parts of the evaluation (and were reported in many chapters of this report). In those instances in which data or methods are pertinent to only individual chapters of the report, we present those methods in chapter-specific appendixes that follow.
Survey Methods Throughout this report, we present results of surveys administered to teachers and SLs in the
seven IP sites. This appendix provides details about the content and constructs, sampling, administration, and analysis of those surveys. The analysis section discusses, among other things, how we selected the survey items for which we present results in this report.
For the purposes of this report, teachers were surveyed five times: the springs of 2011, 2013, 2014, 2015, and 2016. SLs were surveyed six times: the springs of 2011, 2012, 2013, 2014, 2015, and 2016.1
Survey Content and Constructs
The teacher and SL surveys used in the IP evaluation were developed for the evaluation, although they were informed by a variety of existing surveys. The surveys asked about respondents’ experiences with and perceptions of a variety of initiative components (i.e., the levers), as well as other issues related to TE.
Topics on the teacher survey included PD, collaboration, the current teacher-evaluation system and its components (e.g., classroom observations, student achievement, student input), career paths and opportunities for advancement, compensation and other HR policies, and perceived influences on student learning. We asked SLs about similar topics, as well as staffing, teacher termination, and assignment of students and teachers to classes. We asked both groups a
1 The teacher and SL surveys are continuing (in all of the sites except Alliance) in 2017 and 2018, but this report contains results only through 2016.

2
few background questions. In selected years, the teacher and SL surveys also included detailed questions about respondents’ time allocation; in Appendix L, we describe the use of these data.
In this report, we present teacher and SL perceptions, based largely on the surveys, of each IP lever along the following dimensions:
• awareness: Did teachers and SLs in each site know about and understand that site’s policies related to each lever? Although a policy could have its intended effects without teacher and SL awareness of it, awareness of a policy, particularly by those it directly affects, is generally a necessary precondition for successful implementation and effectiveness.
• endorsement: Did teachers and SLs in each site approve of that site’s policies related to each lever? Policies are more likely to be implemented and to be effective if the affected stakeholders—in this case, teachers and SLs—buy into and support the policies.
• fairness: Did teachers and SLs in each site think that that site’s policies related to each lever were fair? Again, policies are more likely to be implemented and to be effective if the affected stakeholders perceive them as being fair.
• perceived effects: What types of effects did teachers and SLs report that policies related to each lever had had? For instance, did teachers find the policies useful for improving their teaching, and did SLs think that the policies had helped improve the quality of teaching at their school? Although self-report of policy effectiveness is not a substitute for objective analysis, it is nevertheless instructive to gauge self-perceptions related to effectiveness because they can be a leading indicator of effectiveness measured by other means. In addition, stakeholders might have a broader definition of usefulness or effectiveness that goes beyond what can be easily measured (for example, by student test scores). And, like with endorsement and fairness, policies might be more likely to be implemented successfully and to be sustained over time if the implementers perceive them to be useful.
We designed the surveys with these constructs in mind, although not every lever had survey questions pertaining to all four constructs for both teachers and SLs.
We designed both the teacher survey and the SL survey to take 45 to 60 minutes to complete, except for the teacher survey administered in 2014 and 2016, which was a short version designed to take 20 to 30 minutes to complete. With that exception, the content of the surveys changed relatively little from year to year, although some modifications were made each year, including some items being dropped and others being added. (In rare cases, we revised the wording on individual items, but we tried to keep such changes to a minimum to ensure comparability over time of results on a given item.)

3
Survey Sampling
In each IP site, the survey sampling frame included all regular, public schools serving students in grades K through 12.2 Table A.1 presents the number of surveyed schools in each site in each year.
Table A.1. Numbers of Schools Surveyed
Year HCPS PPS SCS Alliance Aspire Green Dot PUC 2011 239 62 191 18 30 16 12
2012a 228 60 188 20 34 18 13
2013 240 54 178 21 34 18 13
2014 240 54 186 20 37 16 13
2015 235 54 172 26 38 19 15
2016 236 54 163 27 38 21 15 a In 2012, we surveyed only SLs. In HCPS, some small alternative schools lacked SLs, so the 2012 number of schools is slightly smaller than that for the other years. Other year-to-year changes reflect growth or decline in the actual number of schools in each site.
We surveyed all SLs and a sample of teachers from every school within each site. We used a
stratified random sampling design to select the teachers, taking into account the subject area taught and years of teaching experience;3 the number of teachers selected in each school varied by site and school level. SLs included principals, APs, and all other staff holding equivalent titles (e.g., director, instructional leader, dean). We did not follow teachers longitudinally over the years of the survey; we drew a new sample of teachers each year. Table A.2 shows the total number of teachers and SLs invited to participate in the survey during each administration.
2 We excluded charter schools in the three districts, based on an understanding (from district central-office staff) that charter schools were not part of the IP initiative. In 2014, we excluded schools in SCS that were with the district only temporarily (i.e., legacy SCS schools that were departing to municipalities following the 2013–2014 year). 3 Specifically, we stratified based on core and noncore subject areas, in order to ensure adequate representation from teachers of all types. We defined core teachers as general-education teachers of reading and ELA, mathematics, science, social studies, and (at MS and HS levels) foreign languages. We defined noncore teachers as teachers of other subject areas and special-education teachers. Our samples typically consisted of approximately 80 percent core teachers and 20 percent noncore teachers. In addition, we oversampled novice teachers in the districts (which have high proportions of experienced teachers) and experienced teachers in the CMOs (which have high proportions of novice teachers) to ensure adequate representation from each group.

4
Table A.2. Numbers of Teachers and SLs Surveyed
Year Teachers SLs 2011 4,311 1,174
2012a N/A 1,209
2013 4,697 1,172
2014 4,838 1,287
2015 4,946 1,310
2016 5,055 1,319 a In 2012, we surveyed only SLs.
Survey Administration
Surveys were web-based and administered in the late spring of each year. We contacted survey recipients at the email addresses that the sites provided to the RAND team that collected site administrative data. We provided each recipient with a unique link to access the survey; this link included an embedded identification code by which we could track responses and merge them with administrative data, such as each teacher’s grade level taught and effectiveness rating, and school demographic characteristics (see “Archival Academic Data Methods”). We contacted nonrespondents about once per week throughout the data-collection period, initially by email and later by phone.4 Every person who completed the survey received a gift card;5 there were also occasional drawings for $50 gift cards and, at the end of each year, a final drawing for $500 school prizes from among schools with high response rates.
We calculated the survey response rate as the number of responding teachers (or SLs) divided by the number of sampled teachers (or SLs).6 Tables A.3 through A.6 show the response rates for teachers and SLs, respectively, in each district and each CMO in each year.
4 The administration of the 2016 surveys in Alliance followed a different procedure, in which site staff (not the evaluation team) emailed all teachers and leaders a generic survey link; completion of the survey was anonymous, and there were no individualized follow-up efforts. 5 The amount and disbursement of the gift card differed across years and surveys. In 2011, 2013, and 2015, each teacher received a $25 iCard for completing the survey. In 2014, each teacher received a $10 iCard for completing the survey, which was shorter that year. In 2016 (another short-survey year), each teacher invited to complete the survey received a $10 Amazon gift card, and each teacher who completed the survey received an additional $10 Amazon gift. Each SL, meanwhile, received a $25 iCard for completing the survey in each year from 2011 through 2015. In 2016, each SL invited to complete the survey received a $10 Amazon gift card, and each SL who completed the survey received an additional $15 Amazon gift card. 6 To be included in the response-rate calculation, as well as in the analysis, a survey had to have at least one question answered in more than half of the major survey sections.

5
Table A.3. District Teacher Response Rates, Surveys Completed, and Teachers Sampled
Year
HCPS PPS SCS
Rate (%) Completed Sampled Rate (%) Completed Sampled Rate (%) Completed Sampled 2011 84 1,168 1,393 78 657 838 82 1,052 1,282
2013 75 1,040 1,393 75 586 783 83 1,038 1,244
2014 79 1,109 1,397 70 548 780 84 1,087 1,298
2015 73 1,026 1,407 76 578 758 80 987 1,234
2016 81 1,168 1,442 74 562 762 75 862 1,157
Table A.4. CMO Teacher Response Rates, Surveys Completed, and Teachers Sampled
Year
Alliance Aspire Green Dot PUC
Rate (%) Completed Sampled Rate (%) Completed Sampled Rate (%) Completed Sampled Rate (%) Completed Sampled 2011 77 140 182 86 261 303 65 132 203 82 90 110
2013 77 313 407 79 285 359 61 206 335 76 134 176
2014 79 344 435 80 300 375 68 231 341 75 159 212
2015 70 363 518 68 276 403 64 239 376 62 156 250
2016 16a 97 598 77 316 408 69 286 416 68 185 272 a In the spring 2016 survey, the leadership at Alliance severely restricted our access to teachers, resulting in a lower response rate.

6
Table A.5. District SL Response Rates, Surveys Completed, and Leaders Sampled
Year
HCPS PPS SCS
Rate (%) Completed Sampled Rate (%) Completed Sampled Rate (%) Completed Sampled 2011 77 465 607 83 85 102 76 259 339
2012 81 493 610 80 78 97 82 277 337
2013 77 459 597 74 64 86 65 207 317
2014 68 433 637 71 58 82 66 254 386
2015 66 426 646 69 61 88 63 225 360
2016 56 366 651 61 54 89 54 188 349
Table A.6. CMO SL Response Rates, Surveys Completed, and Leaders Sampled
Year
Alliance Aspire Green Dot PUC
Rate (%) Completed Sampled Rate (%) Completed Sampled Rate (%) Completed Sampled Rate (%) Completed Sampled 2011 59 23 39 81 30 37 56 18 32 72 13 18
2012 67 33 49 72 38 53 66 25 38 76 19 25
2013 65 31 48 69 33 48 65 33 51 72 18 25
2014 78 43 55 62 32 52 71 37 52 70 16 23
2015 61 44 72 53 31 58 58 33 57 55 16 29
2016 15a 13 84 63 38 60 41 24 58 46 13 28 a In the spring 2016 survey, the leadership at Alliance severely restricted our access to school leaders, resulting in a lower response rate.

7
Survey Data Analysis
Weighting
We calculated sampling weights for each teacher based on the sampling design. (SLs had an implicit sampling weight of 1 because all SLs were surveyed.) Following data collection, for both teachers and SLs, we conducted nonresponse analyses to adjust the weights. We used a two-level hierarchical generalized linear model (individuals nested within schools) predicting the probability of response based on person-level characteristics, such as gender and years of experience, as well as school-level characteristics, such as percentage of students who were LIM and school level (elementary school, MS, or HS).7 Accordingly, the reported survey percentages represent the full population of teachers or SLs in each site in each year.
Analysis Strategy
We conducted survey analyses in Stata, using Stata’s survey estimation procedures (e.g., svy: proportion). For both teachers and SLs, we specified a two-stage design, with schools as the first stage and individuals as the second stage. At the first stage, we treated each site as a stratum, and we included a finite population correction for the number of schools in each site. At the second stage for teachers, we treated core and noncore teachers within each school as strata, with a finite population correction for the number of teachers (within school) in each stratum. At the second stage for SLs, we specified principals and APs within each school as strata, with a finite population correction for the number of leaders in each stratum. Analyses, which we conducted separately for each survey year, used Stata’s over option to provide separate results for each IP site.8
Survey results presented in this report are based primarily on descriptive analyses (i.e., survey-weighted proportions or percentages). We always present results separately for each site and for each year. Except where we present subgroup disaggregations (described later in this section), figures depicting teacher survey responses have green bars, and figures depicting SL survey responses have blue bars.
Selection of Survey Findings for This Report
Space did not permit reporting of results on every item in the teacher and SL surveys. In each report chapter focusing on an IP lever (Chapters Three through Eight), we selected items that were most salient to that lever along each of the four dimensions described earlier (awareness, endorsement, fairness, and perceived effects). In some cases, there were multiple relevant survey
7 The exact model used for the nonresponse analysis varied by site and by year. We included only predictors that were statistically significant (p < 0.05), prioritizing parsimony in model selection. 8 We did, however, create a file of responses across all years, which we used to test for the significance of differences between years (within each site).
8
items, and we used our judgment to select which ones to present in the main report. For some chapters, we also present results for additional related survey items in the appendixes.
That said, we report results for a relatively high proportion of survey items, particularly on the teacher survey. Using the 2015 teacher survey as an example (a “long-form” year) and excluding the questions related to time allocation, the survey had 309 individual items (including individual rows in table-type questions and individual checkboxes in checkbox questions). Of the 309 items, 21 were respondent background or teaching-situation items, 21 were checkbox or yes/no questions used primarily for routing to later questions, and 73 (constituting just nine question blocks) were on topics that turned out to be insufficiently relevant to the topics discussed in the report9 or, because of survey routing or skip patterns, were not answered by a large proportion of respondents. Of the remaining 194 items, we report results for 131 (68 percent) of them in the report or the appendixes.10
Subgroup Disaggregations
Starting in 2013, we disaggregated many of the survey results—especially those from survey items with Likert scale and yes-no response options—by a variety of respondent and school characteristics so that we could examine differences between subgroups. For Likert scale items, we typically collapsed the response options into two dichotomous categories, such as agree (combining “agree strongly” and “agree somewhat”) and disagree (combining “disagree strongly” and “disagree somewhat”), and looked at subgroup differences for only one of the two combined categories (e.g., “agree”).11 Disaggregations were done separately within site and within year.
For teachers, we disaggregated items by the following teacher and school characteristics:
• teacher experience: novice teachers versus experienced teachers • TE rating from the previous year: low versus middle versus high effectiveness category,
with the categories defined from sites’ own rating categories as shown in Table A.7 • teachers of core versus noncore subject areas (definitions provided earlier, but based on
self-report on the survey rather than on the extant data used for the sampling) • teachers of tested versus nontested subject areas and grade levels (based on self-report) • school level: elementary schools versus MSs versus HSs (or, in some cases, elementary
versus MS and HS combined or elementary and MS combined versus HS)12
9 For instance, 26 items (in three question blocks) pertained to perceptions of collaboration and leadership within the respondent’s site and school. 10 We do not present all the results graphically; some we report only in narrative form. Moreover, not all have results presented for every year of data available, particularly in the report itself, although, in many cases, we provide results for additional years in an appendix. 11 For items that had a “don’t know” or “not applicable” option, we coded responses of that option as missing prior to collapsing categories. 12 Each teacher in a school with a grade span crossing the traditional elementary/MS/HS boundaries was assigned a school level based on his or her grade most taught.
9
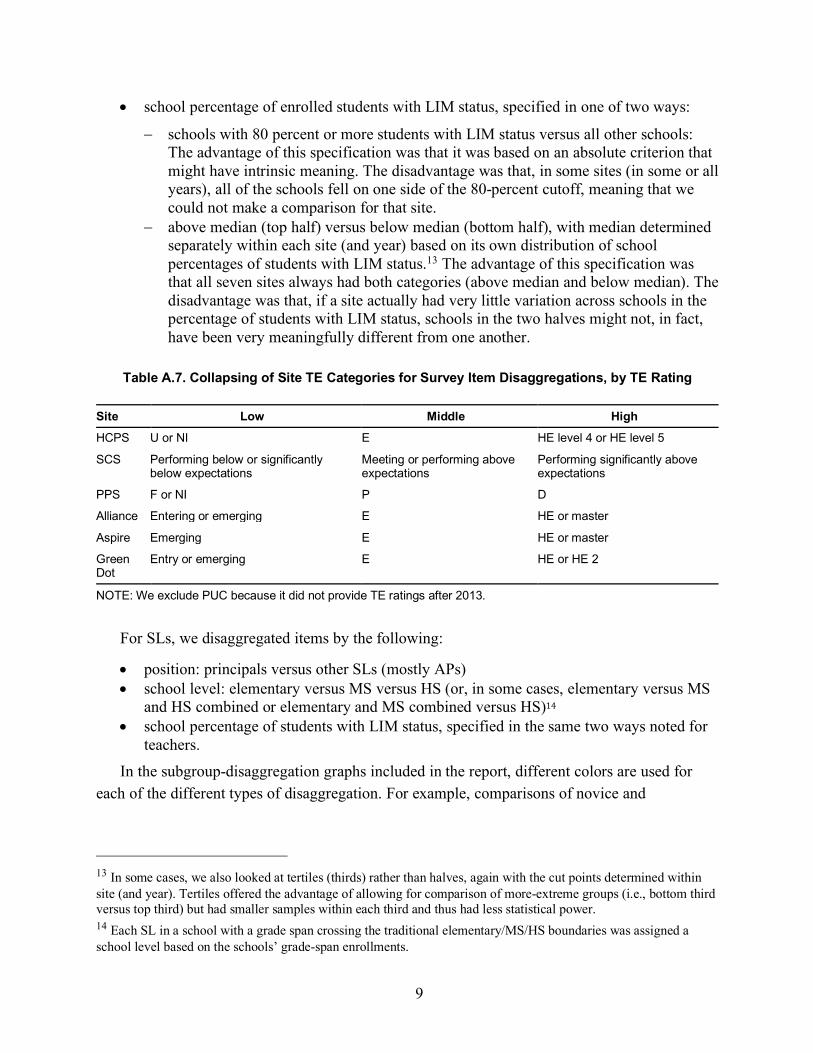
• school percentage of enrolled students with LIM status, specified in one of two ways:
- schools with 80 percent or more students with LIM status versus all other schools: The advantage of this specification was that it was based on an absolute criterion that might have intrinsic meaning. The disadvantage was that, in some sites (in some or all years), all of the schools fell on one side of the 80-percent cutoff, meaning that we could not make a comparison for that site.
- above median (top half) versus below median (bottom half), with median determined separately within each site (and year) based on its own distribution of school percentages of students with LIM status.13 The advantage of this specification was that all seven sites always had both categories (above median and below median). The disadvantage was that, if a site actually had very little variation across schools in the percentage of students with LIM status, schools in the two halves might not, in fact, have been very meaningfully different from one another.
Table A.7. Collapsing of Site TE Categories for Survey Item Disaggregations, by TE Rating
Site Low Middle High HCPS U or NI E HE level 4 or HE level 5
SCS Performing below or significantly below expectations
Meeting or performing above expectations
Performing significantly above expectations
PPS F or NI P D
Alliance Entering or emerging E HE or master
Aspire Emerging E HE or master
Green Dot
Entry or emerging E HE or HE 2
NOTE: We exclude PUC because it did not provide TE ratings after 2013.
For SLs, we disaggregated items by the following:
• position: principals versus other SLs (mostly APs) • school level: elementary versus MS versus HS (or, in some cases, elementary versus MS
and HS combined or elementary and MS combined versus HS)14 • school percentage of students with LIM status, specified in the same two ways noted for
teachers.
In the subgroup-disaggregation graphs included in the report, different colors are used for each of the different types of disaggregation. For example, comparisons of novice and
13 In some cases, we also looked at tertiles (thirds) rather than halves, again with the cut points determined within site (and year). Tertiles offered the advantage of allowing for comparison of more-extreme groups (i.e., bottom third versus top third) but had smaller samples within each third and thus had less statistical power. 14 Each SL in a school with a grade span crossing the traditional elementary/MS/HS boundaries was assigned a school level based on the schools’ grade-span enrollments.

10
experienced teachers have orange bars, while comparisons based on the TE rating have purple bars.
We present disaggregated results in the report only for items for which there was a clear theoretical rationale for comparing particular subgroups (i.e., a theory-based reason that results for one subgroup might differ from results for another subgroup).15 Exploration of subgroup differences across all survey items presented in the report, for all the subgroup classifications, all the sites, and all the years, was prohibitive.
Where we include subgroup comparisons, we indicate whether the difference between the subgroups (within each site) is statistically significant, using superscripts on the site names. Where we compare only two subgroups (e.g., novice and experienced teachers), we provide an indication of significance level between the two groups;16 each of these figures also includes a bar showing each site’s overall percentage. Where we compare three subgroups, we indicate whether the difference between each pair of subgroups is significant (p < 0.05), such as low-rated versus middle-rated teachers, low-rated versus high-rated teachers, and middle-rated versus high-rated teachers. These figures show bars for only the three subgroups, excluding the overall percentages.
Interview Methods
Interview Data Collection
Each fall, we conducted in-person interviews with the key central-office administrators in each IP site (see Table A.8) who were involved in developing, implementing, or reviewing the IP levers, as well as two or three selected local stakeholders (e.g., teachers’ union officials, school board members). The interviews focused on the development and implementation of the IP reforms and policies, such as the use of TE ratings, development and implementation of targeted PD, challenges, implementation successes, local contextual factors, and interactions with the foundation and with other districts.
15 In a few cases, we added subgroup comparisons that reviewers requested. 16 * denotes that the difference is significant at p < 0.05. ** denotes that the difference is significant at p < 0.01. *** denotes that the difference is significant at p < 0.001.

11
Table A.8. Number of Central-Office Administrators and Stakeholders Interviewed Each Fall
Year HCPS SCS PPS Alliance Aspire Green Dot PUC 2010 21 12 19 1 1 2 2
2011 21 10 28 3 3 4 3
2012 11 12 18 9 8 8 5
2013 14 15 18 9 5 7 5
2014 12 13 17 13 7 10 8
2015 11 13 17 7 7 9 7
2016 8 3 9 4 3 3 3
NOTE: We also interviewed TCRP leaders who coordinated activities among the CMOs: five leaders in 2010, two in 2011, one in 2012, and one in 2014. The numbers of interviewees changed over time because of site input into which staff should be included. For example, in HCPS, during the initial years, we interviewed several staff who worked in finance or IT, and we dropped several of these staff from the sample in later years.
Each spring, we conducted in-person and telephone interviews with school staff at seven
schools in each district and one to two schools in each of the four CMOs. Table A.9 shows the number of teachers and SLs we interviewed in each site each year. We purposefully sampled the schools with feedback from staff in each site to ensure representation across grade-level configurations, geography, and achievement levels. We also considered site-specific implementation factors, such as piloting or implementation of policies or programs of interest in certain schools. In the first year of the project (2010–2011), we conducted in-person visits at all seven schools in each site and all seven schools in the CMOs.17 During these visits, we conducted individual interviews with three SLs (including the principal) and three teachers, as well as a focus group of six to eight teachers. In the second year of the study (2011–2012), to minimize burden on the schools, we conducted in-person visits at half of the schools in each site, conducting interviews with SLs and teachers as described, and telephone interviews with the principals in the remaining schools. We randomly selected schools for each group and switched them in subsequent years (e.g., schools that received in-person visits in the spring of 2012 received telephone interviews in the spring of 2013).
17 One school dropped out after the 2011 interview. In the spring of 2012, we added one Aspire school. In the spring of 2013, we added one PUC school. From 2013 on, the sample contained two schools at each CMO.

12
Table A.9. Number of School-Level Staff Interviewed
Interview HCPS SCS PPS Alliance Aspire Green Dot PUC Spring 2011 school visit
SLs interviewed 18 20 21 4 1 4 2
Teachers interviewed (individual and focus group) 52 65 63 19 9 15 3
Spring 2012 school visit
SLs interviewed 11 13 13 3 3 4 3
Teachers interviewed (individual and focus group) 31 34 42 12 9 9 9
Spring 2013 school visit
SLs interviewed 12 8 8 3 2 2 2
Teachers interviewed (individual and focus group) 47 48 37 15 15 4 4
Spring 2014 school visit
SLs interviewed 8 8 9 3 3 2 3
Teachers interviewed (individual and focus group) 33 40 45 11 9 2 13
Spring 2015 school visit
SLs interviewed 15 8 8 3 2 4 3
Teachers interviewed (individual and focus group) 14 27 35 16 12 19 12
Spring 2016 school visit
SLs interviewed 7 6 7 2 2 2 2
Teachers interviewed (individual and focus group) 18 10 14 4 4 4 4
In the third year of the study (2012–2013), we adjusted our participant sample with the goal
of increasing the number of teachers interviewed. In the schools that received in-person visits, we reduced the number of SLs sampled from three to two (i.e., the principal and another SL), and we increased the number of teachers sampled for individual interviews from three to four. The teacher focus group was unchanged. In the schools that received telephone interviews, we sampled two teachers for telephone interviews in addition to interviewing the principals. In the fourth year of the study (2013–2014), we further refined our participant sample; in the schools that received telephone interviews, we reduced the number of teachers sampled from two to one to reduce the burden on the school. Sampling for the schools that received in-person visits was unchanged. We repeated these sampling and interviewing procedures in the spring of 2015. In the spring of 2016, we conducted in-person visits at all seven site-visit schools and interviewed the principal and two teachers at each school. In the three districts, any teacher who participated in a focus group scheduled after school hours received a $25 gift card as thanks for his or her time.
A member of the research team conducted each interview using a semistructured protocol to guide the questioning. We also used probe questions as needed to follow up, and we audio-recorded all interviews and focus groups. We informed all participants that their interview responses would be confidential and that any reporting would be done in the aggregate. We also
13
informed participants that no responses or quotations would be reported in a way that would allow them to be identified. School-based in-person and telephone individual interviews lasted approximately 45 minutes, and the in-person focus group lasted approximately one hour. We randomly sampled teachers for the individual interviews and focus groups to ensure variability across grades and subjects (tested and not tested), years of teaching experience, and levels of involvement or holding special roles in the school (e.g., coaching or CL roles). We requested the staff rosters used for sampling directly from the district central office or from the principals of the CMO schools, and we requested supplemental information (e.g., teachers serving in coaching or CL roles) from the principals. An interview with central-office staff lasted one hour.
Interview Analysis
The analysis of the interview data each year proceeded in several steps. First, we compared interview notes with the audio recording and cleaned them to serve as a near-transcript of the conversations. We then loaded the cleaned interview notes into the qualitative analysis software package NVivo 10 and autocoded them by interview question (i.e., so responses to specific interview questions were easily accessible). We also coded them using a thematic codebook that we developed. (For example, we included such codes as “teacher evaluation system,” “teacher PD, coaching, mentoring,” “communication strategies,” and “challenges.”) Once we finished the thematic coding, we conducted a second round of coding, analyzing the data according to research questions of interest (e.g., how do principals’ opinions about the teacher-evaluation measures differ from teachers’ opinions?). At this stage, we used an inductive coding process (i.e., we derived codes from the data rather than from a structured codebook) to develop responses to the question of interest. The codebook remained largely unchanged from the beginning of the study, with some minor revisions to eliminate redundancies or to capture new themes as they emerged. The consistency of the codebook and coding methodology over time allowed us to examine changes over time, as well as look at each year’s interviews individually.
Archival Academic Data Methods
Data Acquisition
Each of the three districts and four CMOs provided us with administrative data on students and staff. They provided the data for school years 2007–2008 through 2015–2016. Student-level data included enrollment by date and school, demographics, FRPL status, ELL status, gifted status, and state assessment scaled scores. Staff-level data included demographics, highest degree attained, NBPTS certification status, years of experience in the site, job title, and other fields used for survey sampling and administration (see the “Survey Methods” section of this appendix). We also obtained site-generated composite TE levels for each teacher during the years we computed these scores. We linked students with their teachers and classmates by using

14
administrative records on courses and class sections for each student and teacher. We used these data sets for survey sampling and administration, for outcome analyses contained in this report and in interim reports to the foundation and the sites, and for the creation of administrative dashboards provided annually to the sites and the foundation.
Estimation of Teacher Value Added
We used the student and staff data that the sites provided to calculate teacher VAM scores, which, in turn, we used to analyze the relationship of value added to various aspects of the initiative. Here, we describe our methodology for estimating VAM scores. In later appendixes, corresponding to Chapter Seven and Chapters Ten through Thirteen, we describe how we used the VAM scores to analyze the initiative’s effects on various outcomes.
Our methodology estimates teacher VAM scores by performing a two-stage least-squares regression of student achievement (standardized to z-scores) on lagged student achievement (instrumented by achievement in the other subject), student and classroom covariates, and a full set of teacher indicator variables, which capture each teacher’s VAM score. Including classroom covariates is important to control for peer effects and the different learning environments in which LIM students often study, independently of the teachers (see Goldhaber, Quince, and Theobald, 2016).
We estimate VAM scores and the estimates’ sorting parameters in separate stages, employing a generalized least-squares hierarchical fixed-effects approach that Borjas and Sueyoshi, 1994, describes and Aaronson, Barrow, and Sander, 2007, applies to teacher VAM scores. In the first-stage model,
(A.1)
Aicjt is student achievement for student i assigned to teacher j in year t and classroom section c. We first scaled it to a state-level z-score using the state/year/grade standard deviations and means and, from there, scaled to the national level using NAEP.18 Achievement is a function of lagged achievement (Ait – 1), which is an estimate of the combination of innate ability and prior learning; observed student-level covariates (Xit), including gender, race and ethnicity, socioeconomic status, being overage for one’s grade, gifted status, and status as an ELL; and classroom-level covariates (Zct), which include lagged student test scores and the other covariates, each aggregated to the classroom level, as well as class size. µjt is the teacher VAM score in year t, and εicjt is the random noise (unexplained variation in student test scores).
18 We want estimates of VAM scores to be in units that allow us to compare across sites and over time, which scaling to the external NAEP allows us to do. A sample of students in grades 4 and 8 takes the exam every two years in each state. We use the means and standard deviations for each state and nationally to rescale scores to the national norm. We use linear regression to interpolate means and standard deviations for grades in between grades 4 and 8 (so grades 5 through 7) and for untested years.
Aicjt =α0 +α1Ait−1 + Xitα X + Zctα Z + µ jt + ε icjt .

15
Student-level and classroom-level covariates (i.e., measures except for lagged test scores) are centered at their site-specific (i.e., district- or CMO-specific) means.
The inclusion of classroom-level covariates allows us to separate teachers’ contributions to student learning and the aggregate effects of the classroom composition. We identified the effects of the classroom-level covariates within teacher, taking advantage of the fact that many teachers across grades and sites teach more than one class section in a given content area each year.
Equation A.1 could alternatively be estimated in two stages: one that regresses student test scores on student covariates and classroom dummy variables and a second that regresses the estimated classroom fixed effects on classroom-level covariates and teacher dummy variables. However, in sensitivity analyses, we found very little difference in VAM estimates or in associations between estimates of VAM scores and students’ LIM status when we collapsed the first two stages, as shown in Equation A.1. This suggests that the classroom-level covariates capture the important sources of variation for teachers’ classroom-level deviations from their overall VAM scores.
Our models account for the fact that test scores (and thus lagged test scores) are measured with error. Like Briggs and Domingue, 2011, in accounting for this measurement error, we use two-stage least squares and instrument lagged test scores using the lagged test scores from the other subject (e.g., lagged mathematics score is instrumented by lagged reading score).19
To estimate Equation A.1, we use weighted least squares (WLS), with weights given by the proportion of the year in which a given teacher taught students in the tested subject. In other words, following the Hock and Isenberg, 2012, full-roster method, a student’s test score might appear as multiple observations in the data, with one record for each course in which the student was taught the tested subject. Weights reflect the proportion of the school year that the student spent in a particular course and are constrained not to exceed 1. This constraint means that we anticipate 0 marginal return to supplemental doses of mathematics or reading instruction beyond the first course. Weights are calculated as
19 We experimented with various instruments, such as double lags in the same subject and in the other subject, and found little difference in the estimates of VAM scores or in the teacher sorting coefficients. Likewise, we tested the inclusion of lagged other test score as a control variable instead of as an instrument and found similar results. We settled on the specification used here to be consistent with the literature that accounts for measurement error and to retain as many observations as possible (hence, not using double lags). We note that Lockwood and McCaffrey, 2014, investigates a variety of methods for correcting for measurement error and uses simulation methods to show that a well-identified instrumental variable method performs just as well as a more burdensome method based on conditional standard errors of measurement. It does not, however, investigate whether using an additional score as an instrument, like we do, is preferable or using it as an additional covariate is.
pk,

16
where p is the proportion of the school year the student spent in a given school (using modal enrollment days at that school as a denominator) and k is the number of unique mathematics or reading class sections in that school to which the student is linked in a given year.20
20 In sensitivity tests, we gave each record a weight of p rather than
thereby allowing the sum of a student’s weights to exceed 1. Our results were not sensitive to the use of this alternative weighting approach.
pk,

17
Appendix B. Site TE Measures: Supplementary Material for Chapter Three
The following descriptions supplement the information on TE measures presented in Chapter Three. We first describe the districts, followed by the CMOs.
Districts
HCPS
Composite Measure
The final composite rating (0–100) consists of up to 40 points based on VAM scores and up to 60 points from the classroom observations. When the TE measure was first implemented in 2011–2012, 30 points of the observation score derived from the school administrator observations and 30 points derived from the peer evaluator or swap mentor observations. Starting in the 2012–2013 school year, HCPS revised the composition so that 35.1 points derived from the school administrator observations and 24.9 points derived from the peer evaluator or swap mentor observations. This change was intended to reflect that school administrators evaluated teachers on more components of domain 4 (professional responsibilities) than peer evaluators and swap mentors. The composite rating is broken into five performance levels, determined in 2012–2013 and used through the rest of the time of the grant:21
• level 5 (HE): 70–100 • level 4 (HE): 63–69.9999 • level 3 (E): 46–62.9999 • level 2 (NI): 42–45.9999 • level 1 (U): 0–41.9999.
Classroom Practice Measure
Before the grant was awarded, HCPS had already started developing a new classroom practice evaluation rubric, based on the 22 components of professional practice from the FFT. Development began in 2009, and the new rubric was implemented for observations and evaluation in the 2010–2011 school year. The teacher’s union, HCTA, was involved in developing the new evaluation system and bought into the process from the beginning, accepting the contract that included the new rubric with 96 percent of the voting membership in the 2010–2011 school year.
21 Level 5 and level 4 are both referred to as HE.

18
The observation component included both formal and informal peer observations, as well as formal and informal observations by the principal or AP. Observations were scored using a four-point scale on a 22-item rubric, based on the FFT and aligned to the FEAP. We divided the 22 items into four weighted domains: planning and preparation (20 percent), the classroom environment (20 percent), instruction (40 percent), and professional responsibilities (20 percent). The final scores included findings from both formal and informal observations. For their first two years in the district, new teachers were observed six times: one formal and two informal observations by a school administrator and three formal observations by the teacher’s swap mentor, a mentor assigned to the new teacher specifically for observation purposes. The number of observations for other teachers depended on their combined observation score from the prior year. Through 2015–2016, all teachers received a minimum of one formal observation each from a school administrator and a peer evaluator. A teacher with a combined observation score of 22.99 or less received an additional formal peer observation. A teacher with a combined observation score of 45.00 or higher received one informal administrator observation and could choose to have one informal peer observation. A teacher with a score between 35.00 and 44.99 received two informal observations (one administrator, one peer). A teacher with a score between 23.00 and 34.99 receive two informal observations (two from administrators, two from peers), and a teacher with a score lower than 23.00 received five (two administrator, three peer). Any teacher in the Deferred Retirement Option Program (i.e., had declared his or her intent to retire within three years) and with an overall rating of E or HE received two formal observations (one peer, one administrator).22 This change represents a sharp increase in the number of both formal and informal classroom observations—prior to 2011–2012, most experienced teachers received formal observations less than once per year.
Student Achievement Measure
Before the grant and in its first year, HCPS used Florida’s MAP scores to measure student achievement with a value table calculation. To develop a robust student growth measure to replace MAP, HCPS partnered with VARC. VARC produced its first calculations of VAM scores for HCPS in the fall of 2011 for the 2010–2011 school year; HCPS used the same method all subsequent years of the grant. At the beginning of the grant, the Florida state test was the FCAT. In the spring of 2015, Florida switched to the FSAs. Although the method of calculating the VAM score did not change, the changeover caused considerable delay.
Students take standardized tests in all subjects in HCPS. Local standardized tests have been developed for those subjects that the state does not test. Therefore, HCPS can calculate a VAM score for each classroom teacher based on a standardized test score. Weights of state and local test scores vary depending on subject. Student performance is calculated for up to three prior years of data, depending on how many years are available for a given teacher. Scores from all
22 In 2016–2017, HCPS discontinued the peer evaluations for all teachers and simplified the observation schedule.

19
three years are reported to the teacher. To combine the VAM scores with the classroom-observation data on a 100-point scale at the proper percentages, we rescaled the data from a total of 60 points (centered on an average score of 38) to a 40-point scale (centered on an average score of 25).
PPS
Composite Measure
Before the IP initiative, principals rated PPS teachers as either S or U. The composite teacher-evaluation measure that was developed as part of the IP initiative consisted of three components (observation of practice, student achievement growth, and student feedback) and has a maximum score of 300 points and four performance levels:
• D: 210–300 • P: 150–209 • NI: 140–149 • F: 0–139.
U ratings result from an F or from two NI ratings in the same certification area in a ten-year period; all other ratings are considered satisfactory. PPS first provided teachers with a preview of their composite score data in the spring of 2013, based on 2012–2013 data. Principals were also provided these preview data for their teachers, but teachers received their scores a few days before principals. PPS implemented the measure as its teacher-evaluation system, with stakes attached, in the fall of 2013. In the spring of 2014, teacher performance information was provided to principals, as well as teachers. Thereafter, teachers received reports summarizing their evaluation data in the spring of each year, shortly before the end of the school year. These reports were delivered to teachers via email; teachers could also access their performance information via the district’s online portal.
In the PPS measure, observations of practice are weighted at 50 percent, a measure of individual student achievement growth is weighted at 30 percent, student feedback is weighted at 15 percent, and school student achievement growth is at 5 percent. PPS used its composite measure for compensation decisions for some teachers, for determining eligibility for differentiated career roles and for performance improvement plans. The composite measure and its components were developed collaboratively with the union, PFT. The composite measure was used for a majority of teachers in all subjects—specifically, the measures of classroom practice did not include subject-specific measures. The combined measure was not used for pretenure teachers in their first three semesters of service; teachers in PPS’ special schools, which serve students with exceptionalities; and other unique teacher groups, such as early childhood.
The composite measure was calculated by multiplying the scores for each component by the weight of that component and then adding them. The measures of student outcomes and student feedback, which were calculated on a normal curve–equivalent (NCE) scale, were multiplied by

20
3.03 before weighting. PPS makes this precise adjustment to translate the NCE scale, which is 1 to 99, to the 300-point scale used for the other measures.
Classroom Practice Measure
RISE, an observation rubric, was based on the FFT and developed in 2008–2009. RISE was piloted in about one-third of the district’s schools in 2009–2010, before the award of the IP grant, and implemented district-wide in 2010–2011. From 2010–2011 through 2012–2013, the district used RISE scores as its teacher-evaluation measure while other measures were being piloted. The RISE rubric was revised over time, always by a committee of teachers, union officials, and district staff, to simplify the language and include examples of what each level of practice should look like, with the goal of helping observers rate practices more consistently.
From 2010–2011 through 2013–2014, RISE ratings were based on scores on 12 “power components” out of 24 total components across four domains. Teachers, union officials, and district staff considered the 12 power components to be those most important and indicative of good instruction and described them as providing a “common language for what effective teaching looks like in the district.” Principals were the primary observers and scored the power components in one of four categories (i.e., U, basic [B], P, D). The principal determined the final RISE score based on a “preponderance of evidence,” which was a qualitative judgment the principal made after considering the teacher’s RISE scores throughout the year, along with other evidence, such as receptiveness to feedback, improvement of practice, and the teacher’s self-evaluation. In the first year of RISE implementation (2010–2011), all teachers were observed; in 2011–2012 and 2012–2013, tenured teachers with satisfactory performance were observed every two or three years, depending on principal preference. In the nonobservation years, each tenured teacher was expected to complete an independent project (called a supported growth project), which focused on one RISE component, with the result that about one-third to one-half of tenured teachers would be observed in a given year. A teacher working on a supported growth project would be scored on the single RISE component related to his or her project; ratings for the other RISE components were carried over from the previous year. In 2014–2015, the district replaced supported growth projects with the Independent Growth Year (IGY). A teacher on IGY was not observed and did not complete a project. IGY teachers’ RISE ratings were carried over from the previous year; other measures that were part of the composite score (e.g., VAM, Tripod) were assessed in the IGY.
A pretenured teacher was observed each year until he or she achieved tenure. In the years in which a tenured teacher was observed, he or she received at least one formal observation and multiple informal observations (at the principal’s discretion) per year; a pretenure teacher received at least one formal observation and multiple informal observations (at the principal’s discretion) per semester. In 2012–2013, PPS developed guidelines for adjusting the number of observations based on teachers’ needs; these guidelines were developed as part of the release of the preview composite score in the spring of 2013. Starting in the fall of 2013, any teacher with a

21
performance rating of NI or F received up to 15 “touch points” per year (out of which two were formal observations). A tenured teacher with a preponderance of P in RISE domains 2 and 3 received one formal observation and four to six informal observations per year. Formal observations could be either announced or unannounced. An announced formal observation followed a protocol that consisted of four steps: preconference, observation, teacher self-score, and postconference; an unannounced formal observation did not include a preconference.
Teachers received training on the RISE observation process throughout implementation, and PPS had a formal process for training and calibrating observers in the early years of the initiative. From 2011–2012 through 2014–2015, as part of this process, PPS principals were expected to rate videos of teacher practice using RISE, discuss their scores and resolve any discrepancies, complete a training course, and train the other observers in their buildings (i.e., other building administrators and, in some schools, teachers in CL roles). Most principals passed the calibration process; those who did not were provided with extra training and support from their supervisors but were not barred from observing teachers. In the fall of 2012, a new district-level role, instructional leadership specialist, was implemented to conduct co-observations with principals, with the goal of helping increase the accuracy of their ratings. As of 2015–2016, the process for calibrating observers was less formal; principals were expected to participate in periodic calibration conversations with their supervisors and with grade-level peers in their school support networks.
As of 2013–2014, the year the composite measure was implemented, each of the four RISE performance categories was assigned a point value (D = 300, P = 200, B = 100, U = 0), and 15 power components across the four performance categories were rated on this 0–300 scale. The final rating for each component was weighted and averaged to arrive at the final observation score. In the fall of 2015, PPS discontinued the practice of rating teachers on RISE components during informal observations; however, observers were still expected to collect evidence and share that evidence with teachers in a feedback conversation. PPS made this change in an effort to focus informal observations on conversations about growth and feedback, as well as to reduce the burden on observers. However, the evidence collected during informal observations could still be used to inform teachers’ summative RISE ratings at the end of the year.
Student Achievement Measures
In 2009–2010 and 2010–2011, PPS contracted with Mathematica Policy Research to develop customized, individual teacher VAM scores (where data were available) and school-level VAM scores. PPS solicited teacher input during development of the VAM scores, with the intention of ensuring that the measures reflected the things that the district thought were important (e.g., treatment of student characteristics). Individual VAM scores were first shared with teachers in the spring of 2012 but were not part of the TE measure and were not shared broadly with principals. VAM scores were first used for teacher evaluation in 2012–2013 and shared with teachers and principals in the spring of 2013.

22
The individual VAM score is based on three years of data but does not include the current school year. For example, the VAM score that each teacher received in August 2013 was based on data from the 2009–2010, 2010–2011, and 2011–2012 school years. PPS chose this approach for two reasons: The first was to enable a more stable estimate, and the second was to be able to include a VAM score in the composite measure when that measure was provided to teachers at the end of the school year. Similarly, the school-level VAM score was based on two years of data and did not include the current school year. Individual VAM scores were calculated only for teachers with the requisite data, which are typically state tests, so typically very few teachers received VAM scores. PPS worked with Mathematica to create a value-added model that would include as many teachers as possible and, as a result, included some district-developed tests—CBAs—in the models. Although the district made an effort to maximize the number of teachers with VAM scores using available tests, PPS committed to not developing additional tests solely for the purpose of teacher evaluation. Over time, teachers not only expressed concerns about the quality of the CBAs but also found the practice of using locally developed tests for high-stakes purposes problematic, and they were removed from the VAM calculations in the fall of 2015. School and individual scores are given on an NCE (a distribution of 1 to 99, with 50 as the median), and then number of points was determined by multiplying the NCE score by 3.03 to get the score on the 0–300 scale, which was then input into the composite measure. VAM scores are scaled to SLO scores (the means and standard deviations are set as equal) so as not to disadvantage teachers with VAM scores.
PPS teachers without individual VAM scores measured student growth using component 3f on the RISE rubric for two school years (2012–2013 and 2013–2014) and, in 2014–2015, switched to using SLOs, a procedure required by the state. Principals rated component 3f, which PPS developed in its adaptation of the FFT, on the four-point RISE scale, and it was weighted at 30 percent in the composite measure. SLOs, which were piloted in 2013–2014 and adopted in the fall of 2014 to conform to state requirements, were written centrally for each grade and subject, and teachers worked with principals to set their own targets (e.g., 100 percent of students will accomplish x). At the end of the year, principals scored the SLO using the same four categories as those used for performance levels (i.e., D, P, NI, or F). The performance level was determined based on the percentage of students who met the stated target. Once a categorical rating was assigned, it was then translated into a numeric score on the district’s 300-point scale, in much the same way as RISE ratings, for incorporation into the combined measure.
Student Feedback Measure
PPS used the Tripod survey, developed by Ron Ferguson, as its measure of student feedback. It was administered twice per year to one class of students per teacher. The Tripod survey was piloted in a few schools in 2010–2011 and was administered district-wide for formative purposes in 2011–2012 and 2012–2013. Results from the 2011–2012 pilot were shared with teachers but not with principals; results from the 2012–2013 pilot were shared with teachers, principals, and

23
central-office staff. Tripod scores are compared within grade bands (e.g., K through 2, 3 through 5) and then scaled to NCE scores, which are on a 1–99 scale. PPS chose to compare Tripod results within grade band, rather than district-wide, in an effort to avoid disadvantaging teachers of higher grades; as their rationale for this decision, central-office staff mentioned evidence from national studies suggesting that students in upper grades tend to respond more negatively than students in lower grades. The NCE score was then multiplied by 3.03 to calculate the number of points for the composite measure. Multiple years of data were used where available.
SCS
Composite Measure
Before the IP initiative, principals rated SCS teachers annually on a multidimensional rubric, the Tennessee, which was based on the FFT. The state calculated a measure of value added, TVAAS, for teachers in tested grades and subjects. TVAAS scores were shared with teachers but were not used for evaluation. This system was in use until July 2011, when SCS (then MCS) adopted TEM. In 2010, shortly after SCS was awarded the IP grant, the state of Tennessee was awarded a federal RTT grant, one of the requirements of which was that the state implement a teacher-evaluation system using multiple measures. From 2010 through 2011, SCS worked closely with the state to inform the design of the state TE system and adopted the state’s implementation timeline.
In the SCS measure, as of 2015–2016, TVAAS was weighted at 35 percent, and a measure of student achievement was weighted at 15 percent (classroom practice was weighted at 40 percent, student feedback at 5 percent, and other measures at 5 percent) for teachers in tested grades and subjects and teachers with portfolios, which are a measure of student growth for teachers of world languages, fine arts, health, and physical activity and carry the 35-percent weight. Measures of classroom practice were given greater weight (65 percent) for teachers without test or portfolio scores; for such teachers, data on state-level student achievement were weighted at 10 percent, and the other weights remained the same. From July 2011 to July 2013, the other measures (5 percent of the total) consisted of a measure of teacher content knowledge. In July 2013, this was changed to a measure of professionalism as a result of the merger between legacy MCS and legacy SCS.
TEM has five performance levels:
• significantly above expectations (TEM 5): 425–500 • above expectations (TEM 4): 450–424.99 • meeting expectations (TEM 3): 275–349.99 • below expectations (TEM 2): 200–274.99 • significantly below expectations (TEM 1): 100–199.99 points.

24
The maximum score is 500 points. Each TEM component is given a score between 1 and 5; these scores are weighted by multiplying by the weight, and the weighted scores are summed to produce the final score.
In 2015–2016, there were problems administering the state tests on which the student achievement measures are based; the tests were administered only in the applicable HS grades and subjects. As a result, student growth measures could not be calculated for teachers in grades K through 8. Teachers’ prior-year observation scores were substituted for the student achievement portion of the measure.
Classroom Practice Measure
In 2009, when SCS was awarded the IP grant, the district piloted three observation rubrics as measures of classroom practice and, in 2011, selected the Washington, D.C., IMPACT rubric as its measure (locally called the TEM rubric). The TEM rubric had four domains, two of which (teach and classroom learning environment) the observer rated. The TEM rubric included grade-level and subject-specific addenda (e.g., special education, early grades, HS grades and subjects), which were intended to clarify what teaching practice at each level should look like in specific grades and subjects. Use of these addenda was optional until 2015–2016, when they became required. A tenured teacher received a minimum of four observations per year (at least two unannounced) for a combined total of 60 minutes, and a pretenure teacher received a minimum of six per year (at least three unannounced) for a total of 90 minutes. Principals were expected to conduct the first and last evaluations each year, but the other observations could be conducted by other school or district administrators. Observers were trained in a district-wide process and participated in monthly “norming” training, generally using videos, intended to maintain interrater reliability. To be considered certified, observers had to score within one point of a master rater, a process SCS calls calibration. Raters who did not meet the calibration threshold were required to participate in an additional training session focused on intensive review of the rubric indicators. Most principals passed the certification test, but those who did not were given extra support; they were not barred from observing teachers. After the first year of implementation, principals were responsible for training the raters (e.g., APs) in their schools.
After the merger, the number of observations teachers received depended on their observation scores, and teachers were placed in “tracks” (i.e., groups) that specified the number of announced and unannounced observations. Lower-rated teachers received more unannounced observations. As of the spring of 2016, there were three observation tracks: (1) teachers in the first year of service; (2) teachers with prior-year TEM score of 1 or 2; and (3) teachers with prior-year TEM scores of 3, 4, or 5. A teacher in track 1 received one announced and three unannounced observations. A teacher in track 2 received one announced and two unannounced observations for the year and began the year with an initial coaching conversation about prior-year performance. A teacher in track 3 received one announced and one unannounced observation. An observation was added for any teacher, in any track, who received a score of 2

25
or less on two or more rubric indicators during the year. In addition, principals could add observations at their discretion. In the fall of 2014, the district decided not to score the classroom learning environment domain and further reduced the number of observations for tenured teachers at the highest performance levels in large part to reduce the workload for principals. In addition, the district revised the rubric yearly to clarify language and guidance for observers and to align with the Tennessee Academic Standards. Each teacher received a report that contained his or her evaluation data for the practice, student feedback and other measures at the end of the school year, and his or her student achievement measures that fall.
Student Achievement Measures
Each teacher in a tested subject received a measure of student growth in the form of TVAAS, the state’s system for assessing value added; the measure included all years of available data for that teacher and subject. In 2012, SCS adopted portfolios as a measure of student growth for teachers in some nontested subjects (e.g., world languages, fine arts, health and physical education). Portfolios were intended to show improvement in student work toward specific goals over time and were scored by peer raters (e.g., retired educators) with expertise in the subject matter. TEM also included a measure of student achievement per state requirements. Teachers could choose from a list of state-approved measures (e.g., state test scores) in consultation with their principals. Most teachers did not receive TVAAS scores for the 2015–2016 school year because there were statewide logistical issues administering TCAP, the state test, after a transition to a version aligned with Tennessee standards. Teachers in nontested subjects did not have individual measures of student growth, but 10 percent of their composite measures consisted of school-level TVAAS scores, which use one year of data.
Student Feedback Measure
SCS uses the Tripod survey as a measure of student feedback and piloted the measure in 2009–2010 and 2010–2011. Special-education teachers do not receive Tripod scores, and the weight of their practice measures are increased accordingly. From 2011–2012 through 2014–2015, Tripod was administered twice per year and the scores combined for inclusion in the composite TEM. In the fall of 2015, only the highest of the two scores was included in TEM, to mitigate the problem of missing Tripod scores for teachers who were hired late or who change teaching assignments midyear. In the fall of 2015, the district also switched to using the shorter, 30-question version of Tripod, rather than the longer, 80-question version, to combat survey fatigue. Tripod scores were scaled to NCE scores, which are on a 0–99 scale. The NCE distribution is divided into quintiles and scores of 1 to 5 assigned for weighting for the composite TEM.
26
Other Measures
From July 2011 to July 2013, the other measures (5 percent of the total) consisted of a measure of teacher content knowledge. Teachers could choose from a menu of options that included teachers’ Praxis (licensure test) scores, completion of content-specific PD, observation by a content-area specialist, or a portfolio. In July 2013, after the merger, SCS stopped using measures of teacher content knowledge and replaced them with a measure of professionalism, which was in use in legacy SCS. The professionalism rubric had four components: professional growth and learning, use of data, school and community involvement, and leadership. Teachers and school administrators were expected to collect evidence of a teacher’s professionalism in these domains and meet at the end of the year to determine a final score.
CMOs: Common Elements of the TE Measures Because TCRP began as a consortium of CMOs, in accordance with their Gates Foundation
grant, the CMOs developed common student growth and teacher practice measures and common evaluation component weights. Working jointly, they also developed a common observation rubric and observation process and used common stakeholder feedback measures. Each of the CMOs communicated its vision of TE through extensive teacher and SL participation in the development and review of measures, through members of an advisory council composed of teacher representatives from each school who were intended to act as two-way conduits of information, and through PD sessions examining each indicator on the College-Ready Teaching Framework and each evaluation measure. In this section, we describe the common initial elements of the TCRP evaluation system and, in the subsequent site-focused sections, describe the ongoing development and modifications made by each of the CMOs.
Composite Measure
All of the CMOs began with the same weights for the components of the evaluation—40 percent teacher practice, 40 percent student achievement, and 20 percent stakeholder feedback. Teachers received results on their observations within a few days and survey results within a few weeks. Student achievement results were not available until the following fall. Typically, results were available online, and SLs reviewed them with teachers. Some of the CMOs, prepared written reports to teachers showing their results and comparing them with the results of other teachers. Composite scores were calculated in the fall of the following school year, when the student assessment results became available. For the calculation of the composite score, each evaluation measure was converted to a four- or five-point scale and then the teacher’s score was multiplied by the weight of the measure. Each CMO set the cut points on the scale for each individual measure and set the cut points for the composite measure. Once the special-education rubrics were implemented, most of the CMOs developed a separate set of weights for special-education teachers. With the loss of state test scores in 2013–2015 and the consequent

27
inability to calculate SGPs, the CMOs each began to adjust the weight of the components, increasing the weight of teacher practice and decreasing the weight of student achievement.
Classroom Practice Measure
The CMOs reviewed existing teacher-evaluation frameworks and selected the FFT as a base. Working with administrators and teachers and using an iterative process, Teaching Learning Solutions created a draft rubric that was submitted to administrators and teachers for feedback, and, after more modification, the resulting framework was called the College-Ready Teaching Framework. For the observation process, CMOs agreed on a minimum for teachers of one preobservation conference, one classroom observation, and a postobservation conference plus one other event (e.g., a shorter observation, peer observation, portfolio). In the spring of 2012, Teaching Learning Solutions trained SL observers, who then piloted the rubric and the process in a minimum of six schools in each CMO. The rubric was revised, a process that continued annually, and the teacher practice measure was implemented with all teachers in 2012–2013. Concurrently, the CMOs worked with several vendors to provide platforms for entering the observation data. By 2012–2013, all the CMOs were using the BloomBoard platform to enter teacher-observation scripts, ratings, and recommendations.
All of the CMOs began with formal observations of about 45 minutes (or the length of a classroom period) and several informal observations of about 20 minutes. Teachers were rated on a rubric based on the FFT, with 39 indicators. Ratings were on a scale of 1 to 4, with very specific explanations of the requirement for each rating level. From 2014 on, the CMOs began experimenting with shorter, more-frequent observations and shorter rubrics. See the individual site descriptions of the classroom practice measure in the next section for details. The formal observations consisted of three parts: a preobservation conference, observation, and a postobservation conference. At the preobservation, the teacher and evaluator discussed the lesson that would be observed, and the teacher presented supplemental materials (e.g., examples of student work). During the observation, the evaluator took detailed notes (called scripting), which were then assigned to specific indicators on the observation rubric as evidence for the rating. The scripting and ratings were entered onto an online platform, BloomBoard, and were available to the teacher. At the postobservation, the teacher reviewed what had occurred in the observation and discussed his or her ratings of the lesson and the observer’s rating. Typically, after the informal observations, teachers received either emailed or in-person feedback. The extent to which indicators were scored during the informal observations varied by CMO. At all of the CMOs, evaluators had to be certified or conditionally certified to be observers. The certification was annual and was conducted for all the CMOs against the same true-scored video. If an evaluator did not pass all the certification areas, he or she could be conditionally certified but needed to be accompanied by a certified observer for evaluation purposes. If the evaluator did not pass any areas, he or she was not certified and could not conduct observations for evaluation purposes. Observers who had difficulty passing the certification test received one-to-one
28
coaching and continued to be tested until they were certified. It is rare for an SL not to be certified. Central-office representatives from all of the CMOs calibrate annually with each other against a true-scored video.
Student Achievement Measure
The CMOs selected SGPs as their student achievement growth measure. They were chosen instead of a measure of value added because they were perceived as easier than VAM to explain to teachers. Scores were based on the CSTs using the Los Angeles Unified School District scores as a comparison group. In 2013–2014, California began to transition to a new state assessment, Smarter Balanced, which was more closely aligned with the Common Core State Standards. No CSTs were administered in 2013–2014; instead, the state piloted the new assessment, but scores were not reported. The first scores on the new assessments reported to schools were for 2014–2015. Because a minimum of two years of scores is necessary to calculate an SGP, it was not until the 2015–2016 scores were available that an SGP could once again be calculated from state assessment data. Each of the CMOs made its own adjustments to its evaluation calculations. Even in 2016, when the CMOs could use state scores, they were hesitant to calculate growth scores using the state assessment results, wanting to wait until they felt that they were valid and reliable measures. See the site descriptions in the next section for details on the changes that each CMO made to its assessments and their weights in its composite evaluation measure.
Student Feedback Measure
The CMOs piloted the Tripod student survey in 2010–2011. Feedback from teachers and administrators indicated that the Tripod survey took too long and that there were research questions (e.g., “How many people live in the household?”) that were unnecessary. The survey was refined in 2011–2012 and substantially shortened. From 2012–2013 on, each of the CMOs created its own version of the survey, generally bringing the questions into closer alignment with the teacher rubric.
Family Feedback Measure
All of the CMOs piloted the Tripod family survey in 2010–2011 and subsequently conducted family surveys based on their own modified versions of the Tripod survey. The family survey typically contains parent satisfaction–type questions.
Peer Feedback Measure
For several years, Aspire, Green Dot, and PUC conducted annual peer surveys and found that the ratings all tended to be very high. However, because they typically contributed only 5 percent of the composite TE rating, they had little impact.

29
CMO-Specific Aspects of the TE Measures
Alliance
Composite Measure
Alliance created the following weights for its teacher-evaluation composite measure:
• 55 percent observation • 25 percent student achievement • 10 percent family survey • 10 percent student survey.
These weights remained the same during the entire study period; special-education teachers used the same weights.
Classroom Practice Measure
Of the two formal observations per year and the informal observations, only the score on the second formal observation counted toward the evaluation rating. Alliance added measures focusing on compliance issues to the rubric for special-education teachers in 2013–2014. In 2015–2016, it conducted several pilots in which teachers could choose to participate, including shorter baseline observations for new teachers; shorter lesson plans; shorter, more-frequent observations; multiple observers; a revised student survey for special-education teachers; and a rubric shortened from 39 indicators across four domains to about 15 indicators covering domains 1 through 3: (1) classroom learning environment, (2) instruction, and (3) professional responsibilities.
Student Achievement Measure
To accommodate the lack of an SGP measure, from 2013 onward, Alliance has adopted a Lexile growth metric for all teachers. The measure is based on a preassessment, midyear assessment and postassessment of reading ability. Achieve 3000 is the program delivering the online instruction on which the Lexile score is calculated. Each teacher uses the percentage of his or her students meeting their expected growth targets to calculate his or her student achievement rating.
Student Feedback Measure
In 2011–2012, Alliance began conducting an online student survey based on the Tripod student survey but shortened and with more-specific questions. In 2012–2013, Alliance began using its own student survey, which was more aligned with the teacher-observation rubric. The CMO administered the student survey each spring to a sample of the teacher’s students and reported scores at the teacher level.

30
Family Feedback Measure
From 2011–2012 onward, Alliance has conducted a modified and shortened version of the Tripod family survey. Alliance conducts the family survey annually and reports results at the school level.
Aspire
Composite Measure
Aspire’s initial composite evaluation measure in 2011–2012 contained the following weights for teachers in tested subjects and grade levels:
• 40 percent observation • 30 percent individual student achievement • 10 percent school-level student achievement • 10 percent student survey • 5 percent parent survey • 5 percent peer survey.
For teachers in nontested subjects or grade levels, all of the student achievement percentage (40 percent) was school-wide student achievement. All other components remained the same.
To offset the loss of state test scores in 2013–2015, Aspire initially administered the previous year’s state test and used it to calculate an SGP, then used a combination of measures (see “Student Achievement Measure”).
In 2014–2015, Aspire developed a set of weights for special-education teachers:
• 60 percent practice (40 percent observation on the special-education rubric and 20 percent observation of individualized education program [IEP] facilitation and individualized education)
• 20 percent student achievement (school level) • 10 percent student feedback • 5 percent family feedback • 5 percent peer feedback.
From 2015–2016 onward, Aspire has used an increased weight for the teacher practice measure and decreased weight for student achievement. As before, nontested teachers used school-wide student achievement scores:
• 50 percent observation • 20 percent individual student achievement • 10 percent school student achievement • 10 percent student survey • 5 percent family survey • 5 percent peer survey.
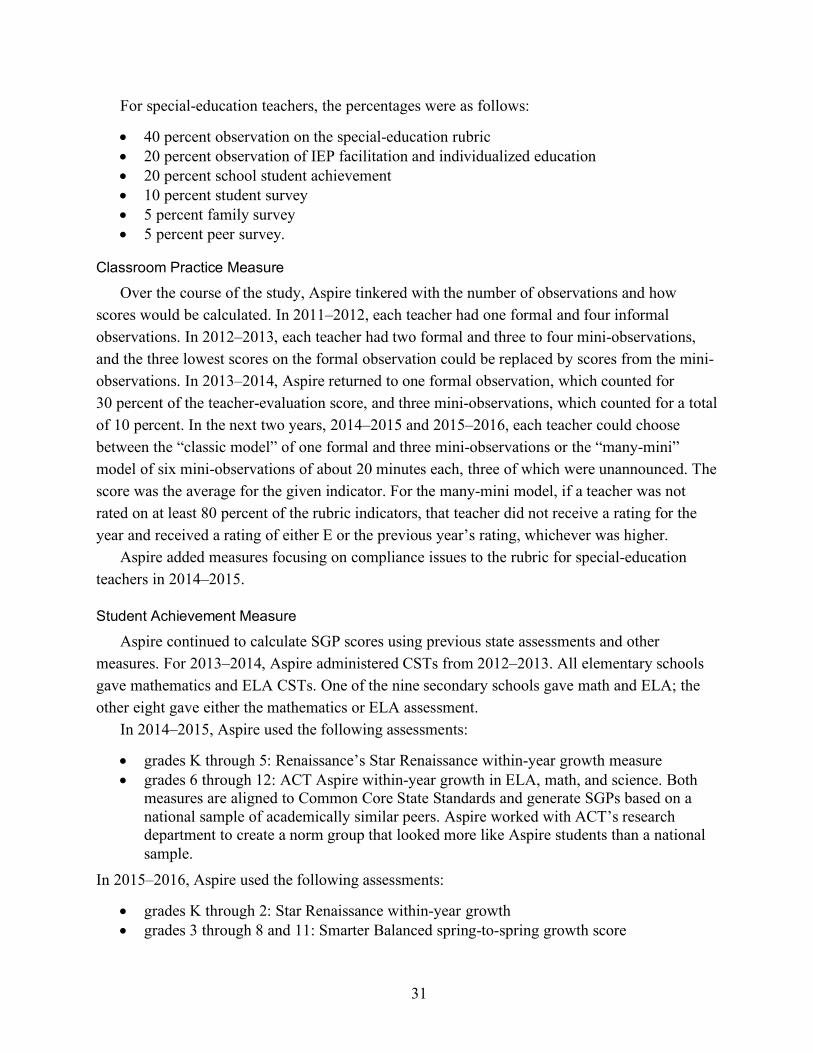
31
For special-education teachers, the percentages were as follows:
• 40 percent observation on the special-education rubric • 20 percent observation of IEP facilitation and individualized education • 20 percent school student achievement • 10 percent student survey • 5 percent family survey • 5 percent peer survey.
Classroom Practice Measure
Over the course of the study, Aspire tinkered with the number of observations and how scores would be calculated. In 2011–2012, each teacher had one formal and four informal observations. In 2012–2013, each teacher had two formal and three to four mini-observations, and the three lowest scores on the formal observation could be replaced by scores from the mini-observations. In 2013–2014, Aspire returned to one formal observation, which counted for 30 percent of the teacher-evaluation score, and three mini-observations, which counted for a total of 10 percent. In the next two years, 2014–2015 and 2015–2016, each teacher could choose between the “classic model” of one formal and three mini-observations or the “many-mini” model of six mini-observations of about 20 minutes each, three of which were unannounced. The score was the average for the given indicator. For the many-mini model, if a teacher was not rated on at least 80 percent of the rubric indicators, that teacher did not receive a rating for the year and received a rating of either E or the previous year’s rating, whichever was higher.
Aspire added measures focusing on compliance issues to the rubric for special-education teachers in 2014–2015.
Student Achievement Measure
Aspire continued to calculate SGP scores using previous state assessments and other measures. For 2013–2014, Aspire administered CSTs from 2012–2013. All elementary schools gave mathematics and ELA CSTs. One of the nine secondary schools gave math and ELA; the other eight gave either the mathematics or ELA assessment.
In 2014–2015, Aspire used the following assessments:
• grades K through 5: Renaissance’s Star Renaissance within-year growth measure • grades 6 through 12: ACT Aspire within-year growth in ELA, math, and science. Both
measures are aligned to Common Core State Standards and generate SGPs based on a national sample of academically similar peers. Aspire worked with ACT’s research department to create a norm group that looked more like Aspire students than a national sample.
In 2015–2016, Aspire used the following assessments:
• grades K through 2: Star Renaissance within-year growth • grades 3 through 8 and 11: Smarter Balanced spring-to-spring growth score

32
• grades 9 and 10: ACT Aspire spring-to-spring growth • grade 11: ACT Aspire using the previous year’s ACT Aspire score for the growth
measure.
Even though the students in grades 3 and 11 took the Smarter Balanced Assessment Consortium assessment, Aspire could not generate a growth measure for them because there were no prior grade assessments. Instead, teachers of grades K through 3 used Star results, teachers of grades 4 through 8 used Smarter Balanced results, and teachers of grades 9 through 11 used ACT Aspire results.
Student Feedback Measure
In 2011–2012, Aspire shortened the annual student survey from the original Tripod version. The CMO revised it again from 2012–2013 onward to use language aligned to the observation rubric. For elementary students, it reports results at the classroom level. For secondary students, each student responds for two randomly selected teachers, and scores are reported at the teacher level. There is a survey for grades 1 and 2 and a survey for grades 3 through 5, and results are reported at the classroom level. At the secondary level, a panel of students for each teacher takes the survey for that teacher, and the survey is reported at the teacher level.
Family Feedback Measure
All of the CMOs piloted the Tripod family survey in 2010–2011 and have subsequently conducted annual family surveys based on their own modified versions of the Tripod survey. In 2014–2015, Aspire developed its own family survey. A family survey typically contains parent satisfaction–type questions, and results are typically reported at the school level, but Aspire reports them at the teacher level for grades K through 5.
Peer Feedback Measure
From 2011–2012 through 2015–2016, Aspire administered an annual peer survey. The central office provided principals with the names of peers to anonymously rate their colleagues. Aspire implemented a new version of the peer survey in 2012–2013, more aligned with the observation rubric. In 2014–2015, it revised the peer survey to align more closely with the Aspire core values of quality, collaboration, ownership, and purposefulness.
Green Dot
Composite Measure
The original Green Dot composite measure from 2011–2013 consisted of the following weights:
• for teachers in tested subjects and grades
- 40 percent observation

33
- 30 percent individual student achievement - 10 percent school student achievement - 10 percent student survey - 5 percent family survey - 5 percent peer survey.
• for teachers in other subjects and grades
- 55 percent observation - 25 percent school student achievement - 10 percent student survey - 5 percent family survey - 5 percent peer survey.
In 2012–2013, Green Dot developed a set of weights for special-education teachers: - 35 percent observation - 25 percent compliance - 20 percent school student achievement - 10 percent student survey - 5 percent family survey - 5 percent peer survey.
In 2013–2014, when state assessment scores were no longer available for calculating an SGP measure, Green Dot temporarily eliminated student achievement as an evaluation component and increased the weight of other measures to compensate. The weights continued through 2015–2016:
• 65 percent observation • 15 percent peer survey • 15 percent student survey • 5 percent family survey
Weights for special-education teachers were as follows:
• 65 percent practice (50 percent observation on the special-education rubric and 15 percent compliance)
• 15 percent peer feedback • 15 percent student feedback • 5 percent family feedback.
Classroom Practice Measure
From its inception in 2011 through 2014–2015, Green Dot maintained a model of two informal and one formal observation each semester. At the second formal observation, teachers could choose to keep any 3s and 4s from the first observation and not be observed and rated on those indicators again in the spring.
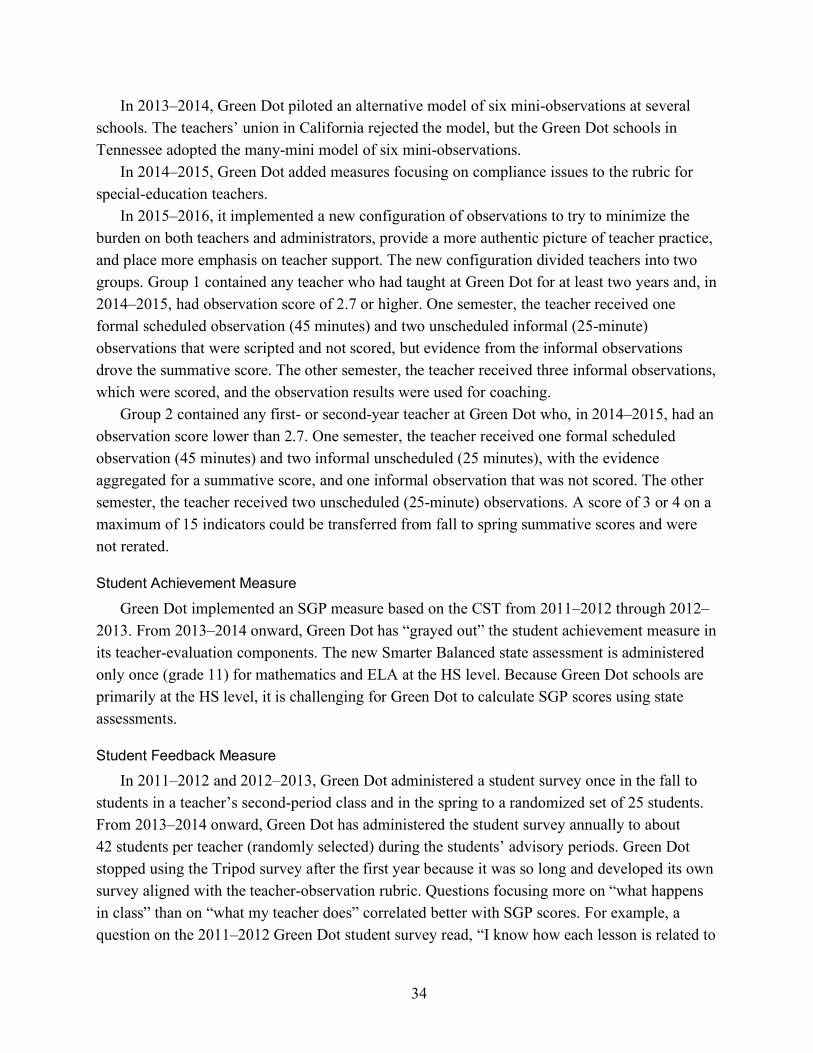
34
In 2013–2014, Green Dot piloted an alternative model of six mini-observations at several schools. The teachers’ union in California rejected the model, but the Green Dot schools in Tennessee adopted the many-mini model of six mini-observations.
In 2014–2015, Green Dot added measures focusing on compliance issues to the rubric for special-education teachers.
In 2015–2016, it implemented a new configuration of observations to try to minimize the burden on both teachers and administrators, provide a more authentic picture of teacher practice, and place more emphasis on teacher support. The new configuration divided teachers into two groups. Group 1 contained any teacher who had taught at Green Dot for at least two years and, in 2014–2015, had observation score of 2.7 or higher. One semester, the teacher received one formal scheduled observation (45 minutes) and two unscheduled informal (25-minute) observations that were scripted and not scored, but evidence from the informal observations drove the summative score. The other semester, the teacher received three informal observations, which were scored, and the observation results were used for coaching.
Group 2 contained any first- or second-year teacher at Green Dot who, in 2014–2015, had an observation score lower than 2.7. One semester, the teacher received one formal scheduled observation (45 minutes) and two informal unscheduled (25 minutes), with the evidence aggregated for a summative score, and one informal observation that was not scored. The other semester, the teacher received two unscheduled (25-minute) observations. A score of 3 or 4 on a maximum of 15 indicators could be transferred from fall to spring summative scores and were not rerated.
Student Achievement Measure
Green Dot implemented an SGP measure based on the CST from 2011–2012 through 2012–2013. From 2013–2014 onward, Green Dot has “grayed out” the student achievement measure in its teacher-evaluation components. The new Smarter Balanced state assessment is administered only once (grade 11) for mathematics and ELA at the HS level. Because Green Dot schools are primarily at the HS level, it is challenging for Green Dot to calculate SGP scores using state assessments.
Student Feedback Measure
In 2011–2012 and 2012–2013, Green Dot administered a student survey once in the fall to students in a teacher’s second-period class and in the spring to a randomized set of 25 students. From 2013–2014 onward, Green Dot has administered the student survey annually to about 42 students per teacher (randomly selected) during the students’ advisory periods. Green Dot stopped using the Tripod survey after the first year because it was so long and developed its own survey aligned with the teacher-observation rubric. Questions focusing more on “what happens in class” than on “what my teacher does” correlated better with SGP scores. For example, a question on the 2011–2012 Green Dot student survey read, “I know how each lesson is related to

35
other lessons,” whereas the question on the 2016 student survey read, “My teacher explains how today’s lesson connects to what we learned before and what we will learn in the future.” The former item correlated with SGP scores better than the latter did.
Family Feedback Measure
From 2011–2012 onward, Green Dot has conducted a family survey annually based on its revised and shortened version of the Tripod survey.
Peer Feedback Measure
Green Dot has annually administered a 360 peer survey from 2012–2013 onward. In 2012–2013, each teacher was rated by three peers. From 2013–2014 onward, each teacher has been rated by five peers: two from the teacher’s department, two from the teacher’s grade level, and the fifth from either the department or the grade level. One administrator, who does the evaluation for the formal observation, also fills out a survey. Each teacher receives a copy of his or her self-rating, the aggregated peer rating (involving five surveys), and the administrator rating.
PUC
Composite Measure
From 2011–2012 through 2012–2013, the PUC composite measure consisted of the following items and weights:
• for teachers of tested subjects and grade levels
- 44 percent observation - 30 percent individual student achievement - 10 percent school-level student achievement - 10 percent student survey - 3 percent parent survey - 3 percent peer survey.
• for teachers of other subjects and grade levels
- 44 percent observation - 40 percent school-wide student achievement - 10 percent student survey - 3 percent parent survey - 3 percent peer survey.

36
In 2013–2014, the student achievement measure was school-level Lexile scores for all teachers. That same year, PUC developed a composite measure for special-education teachers consisting of the following:
• 55 percent teacher practice (15 percent compliance review, 15 percent IEP meetings, 10 percent growth goals, and 15 percent the collaboration meeting)
• 25 percent student growth and achievement (15 percent individual student and 10 percent school level)
• 10 percent professional contributions (peer and family surveys and collaborative rating) • 10 percent student survey.
In 2014–2015, PUC stopped calculating a composite score because of pushback from teachers who resented being reduced to one number. At his or her summative conference, a PUC teacher can receive the scores for each individual component: the student survey data, the parent survey data, the Lexile score, observation notes, and the narrative that describes his or her strengths and areas of growth related to his or her growth goals. At the teacher’s summative conference, the SL reviews with the teacher his or her student survey results, his or her performance on growth goals, professional contributions as measured by domain 4 on the rubric and the family survey, and student Lexile growth. PUC uses these elements to determine whether the teacher met his or her growth goals.
Classroom Practice Measure
From 2014–2015 onward, each PUC teacher has two classic observations per year and a minimum of two open (i.e., shorter and more informal) observations per semester. The observations focus on three to five growth goals drawn from the rubric indicators: one organization goal (e.g., parent involvement), one school goal, and one to three teacher goals. Observers script and enter data into BloomBoard, but there is no scoring along the way. All evidence feeds into a final determination of whether the teacher has met his or her growth goals. An observer is always looking at all the indicators but providing feedback and development primarily on the teacher’s specific growth goals.
PUC added measures focusing on compliance issues to the rubric for special-education teachers in 2013–2014.
Student Achievement Measure
From 2013–2014 onward, because state assessment scores are no longer available to calculate SGPs, PUC has to use school-level Lexile scores to provide fall-to-spring student growth scores. This score is part of the data reviewed with the teacher at the summative conference to consider progress on his or her growth goals.

37
Student Feedback Measure
In 2011–2012, PUC began annually administering a student survey. It was a slightly modified version of the Tripod student survey. The site randomly selected cohorts of students and randomly assigned each to a teacher to rate. From 2014–2015 onward, the survey has been shortened and divided into four sections. PUC changed the sample of students so that every student completes a survey for each of his or her teachers but only one of the four sections of the survey.
Family Feedback Measure
PUC began annually administering a modified version of the Tripod family survey in 2011–2012.
From 2014–2015 onward, PUC has split the questions on the family survey into two versions. Results of the survey are reported at the school level.
Peer Feedback Measure
PUC administered a peer feedback survey once a year from 2011 through 2013. The survey development team looked at work done by Achievement First and the 360 model. Peers at the MS level were rated by grade-level team members and at the HS level by department team members; at both levels, a random selection of raters by the central office was also included after vetting by the principal. The site discontinued the peer survey after 2013 because of teacher dissatisfaction with the measure.


39
Appendix C. Additional Exhibits for Chapter Three
Figure C.1. Teachers Reporting That Evaluation Components Were Valid Measures of Their Effectiveness to a Large or Moderate Extent, Springs 2013–2016
NOTE: Significant (p < 0.05) differences between the 2016 percentage and other years’ percentages: For the component in row 1, SCS declined from 2013, PPS declined from 2015, Alliance increased from 2014, and Green Dot increased from 2015. For the component in row 2, SCS declined from 2013, Alliance increased from 2014 and 2015, and Aspire declined from 2013 and 2014. For the component in row 3, SCS declined from 2013, and PUC increased from 2013. For the component in row 4, HCPS increased from 2013 and 2015;; PPS increased from 2014;; Alliance increased from 2013, 2014, and 2015;; Aspire declined from 2014;; Green Dot increased from 2015;; and PUC increased from 2013, 2014, and 2015. HCPS’s TE measure did not include student input, and, after 2014, Green Dot’s measure did not include student achievement.
Percentage of teachers reporting the component is valid to a large or moderate extent:
HCPS SCS PPS Alliance Aspire Green Dot PUC
Observations of your teaching
Student achievement or growth on state, local, or other standardized tests
Student input or feedback (for example, survey responses)
All evaluation components combined
93
62
48
74
89
61
36
72
87
58
38
68
88
55
36
72
2013 2014
2015 2016
94
54
35
66
89
48
33
66
95
48
32
67
88
45
36
72
2013 2014
2015 2016
91
73
68
80
89
64
71
79
93
57
68
78
96
77
72
87
2013 2014
2015 2016
91
76
60
82
95
78
64
90
94
67
61
86
94
65
63
84
2013 2014
2015 2016
90
62
65
73
90
57
68
74
85
64
69
91
66
77
2013 2014
2015 2016
95
76
79
86
91
60
82
83
96
81
82
93
86
91
2013 2014
2015 2016
76
56
63
77
60
71
76
52
62
78
56
69
2013 2014
2015 2016

40
Figure C.2. Teachers’ Agreement with Statements About Observations, Springs 2013–2016
NOTE: Statements in rows with bars missing for some years were not included in the survey administered in those years.
Percentage of teachers agreeing with each statement (somewhat or strongly)
HCPS SCS PPS Alliance Aspire Green Dot PUC
I have a clear understanding of the rubric that observers are using to evaluate my teaching.The observation rubric is well-‐suited for measuring many different forms or styles of good teaching.
The observation rubric is well-‐suited for measuring instruction in my subject area(s).
The observation rubric is well-‐suited for measuring instruction with the types of students I teach.
The people who observe my teaching are well qualified to evaluate it.
The observations are long enough to provide an accurate view of my teaching.
There are enough observations to provide an accurate view of my teaching.
I do extra preparation or planning for lessons that are going to be formally observed.The way I teach during formal observations is the same as the way I teach when I'm not being observed.
85
51
63
72
64
84
84
48
64
73
65
78
42
58
71
63
87
85
48
54
46
63
71
63
88
87
2013 2014
2015 2016
92
69
86
86
90
79
89
59
81
90
88
90
55
83
89
87
81
90
61
62
54
84
89
84
78
94
2013 2014
2015 2016
85
68
77
78
73
65
83
59
76
71
70
85
67
80
84
75
67
88
66
66
55
82
81
70
72
96
2013 2014
2015 2016
84
65
80
71
62
91
90
64
82
76
67
85
56
85
72
59
95
87
69
70
67
86
80
63
97
88
2013 2014
2015 2016
86
74
89
69
61
90
90
75
89
80
64
87
69
91
75
80
93
92
67
75
69
89
69
79
92
88
2013 2014
2015 2016
87
54
81
71
54
96
82
55
80
78
58
76
44
82
65
54
95
82
58
61
54
86
68
62
94
86
2013 2014
2015 2016
86
75
85
71
60
93
86
63
84
70
52
84
78
91
74
70
65
90
80
77
80
91
83
76
65
98
2013 2014
2015 2016

41
Figure C.3. Teachers’ Agreement with Statements About the Use of Student Achievement in Teachers’ Evaluations, Springs 2013–2016
NOTE: Statements in rows with bars missing for some years were not included in the survey administered in those years.
Figure C.4. Teachers’ Agreement with Statements About the Use of Student Feedback in Teachers’ Evaluations, Springs 2013–2016
NOTE: Significant (p < 0.05) differences between the 2016 percentage and other years’ percentages: For the statement in row 1, from 2013 to 2015, we saw a decline in Alliance and increases in Aspire and PUC. For the statement in row 2, PPS declined from 2013, Aspire increased from 2013, Green Dot declined from 2013 and 2014, and PUC increased from 2013 and 2015. For the statement in row 3, SCS declined from 2013, 2014, and 2015;; PPS declined from 2013 and 2015;; Alliance increased from 2014 and 2015;; Aspire increased from 2013 and 2014;; and PUC increased from 2013, 2014, and 2015. For the statement in row 4, Aspire declined from 2013 and 2015;; Green Dot declined from 2015;; and PUC declined from 2013 and 2014.
Percentage of teachers agreeing with each statement (somewhat or strongly)
HCPS SCS PPS Alliance Aspire Green Dot PUC
I have a clear understanding of how student test scores are used to evaluate my performance.
The student tests used in my evaluation measure important skills and knowledge.
The student tests used in my evaluation are well aligned with my curriculum.
Scores on the student tests used in my evaluation are a good measure of how well students have learned what I've taught during the year.
The ways that student test scores are used to evaluate my performance appropriately adjust for student factors not under my control.
The student tests used in my evaluation have room at the top for even the district's/CMO's highest-‐achieving students to grow.
If I am an effective teacher, my students will show progress on standardized test scores in my subject area(s) during the time I am their teacher.
50
59
64
50
31
62
68
63
69
69
56
37
65
50
55
58
43
30
59
63
55
59
59
46
30
61
2013 20142015 2016
75
72
83
56
46
71
79
77
72
82
60
42
72
72
71
78
51
43
67
73
68
65
67
50
39
66
2013 20142015 2016
58
58
45
42
40
60
60
59
61
50
45
34
64
62
61
50
37
35
58
63
65
61
59
45
36
72
2013 20142015 2016
70
58
75
64
40
69
81
78
65
68
61
52
66
58
60
55
36
37
64
71
77
72
65
58
47
65
2013 20142015 2016
73
70
83
68
50
69
78
84
68
73
70
53
74
62
59
41
47
44
72
74
62
70
46
48
44
72
2013 20142015 2016
65
55
80
58
41
65
75
69
58
67
46
44
60
65
55
73
57
40
65
65
52
65
76
69
46
74
2013 20142015 2016
71
57
75
57
41
66
78
75
59
54
54
41
64
57
61
51
51
44
71
65
59
72
64
57
60
87
2013 2014
2015 2016
Percentage of teachers agreeing with each statement (somewhat or strongly)
SCS PPS Alliance Aspire Green Dot PUC
Getting input from students is important to assessing teacher effectiveness. [not asked in 2014 or 2016]
Students are good judges of how effective a teacher's instruction is.
I trust my students to provide honest, accurate feedback about my teaching.
I worry that many students do not really understand the questions they are asked about their teacher or class.
58
40
57
88
38
48
89
58
43
55
86
38
40
88
2013 2014
2015 2016
53
41
47
89
39
44
90
54
40
51
92
33
39
90
2013 2014
2015 2016
87
69
76
84
64
67
74
83
61
70
86
68
80
80
2013 2014
2015 2016
73
53
62
86
56
59
79
82
56
67
84
63
71
73
2013 2014
2015 2016
86
74
72
76
69
70
74
84
59
67
82
61
69
75
2013 2014
2015 2016
89
69
85
68
77
85
68
94
64
86
64
80
93
60
2013 2014
2015 2016
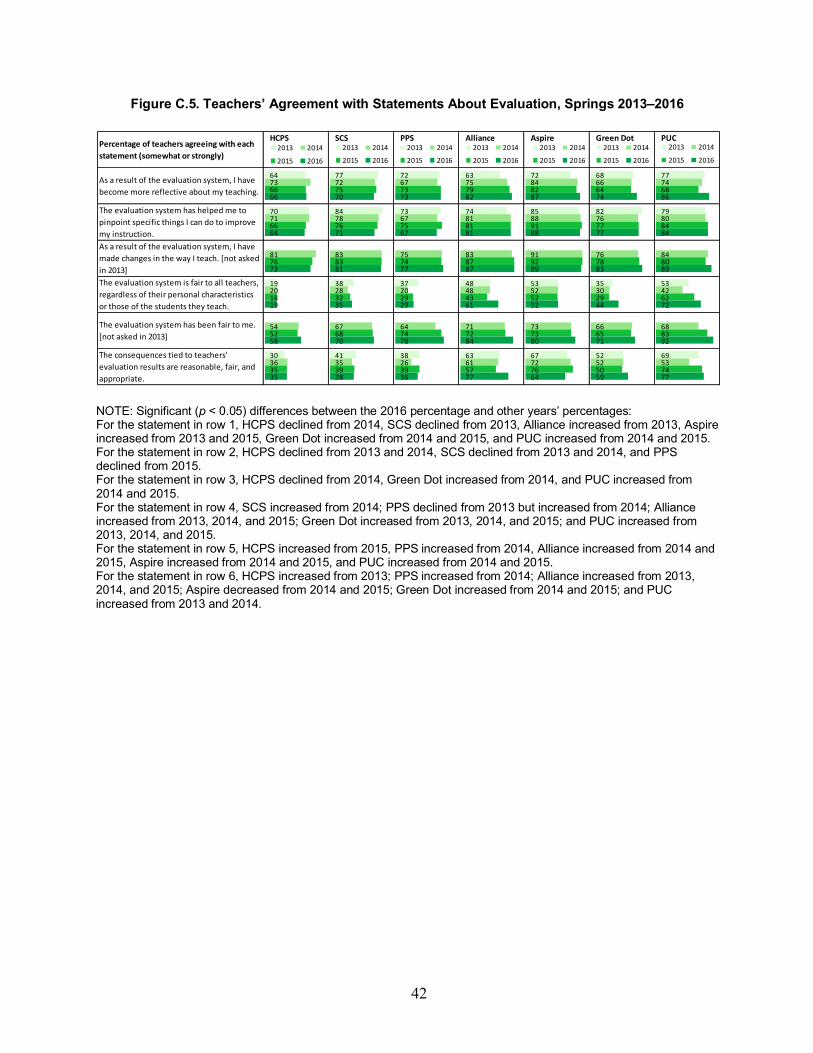
42
Figure C.5. Teachers’ Agreement with Statements About Evaluation, Springs 2013–2016
NOTE: Significant (p < 0.05) differences between the 2016 percentage and other years’ percentages: For the statement in row 1, HCPS declined from 2014, SCS declined from 2013, Alliance increased from 2013, Aspire increased from 2013 and 2015, Green Dot increased from 2014 and 2015, and PUC increased from 2014 and 2015. For the statement in row 2, HCPS declined from 2013 and 2014, SCS declined from 2013 and 2014, and PPS declined from 2015. For the statement in row 3, HCPS declined from 2014, Green Dot increased from 2014, and PUC increased from 2014 and 2015. For the statement in row 4, SCS increased from 2014;; PPS declined from 2013 but increased from 2014;; Alliance increased from 2013, 2014, and 2015;; Green Dot increased from 2013, 2014, and 2015;; and PUC increased from 2013, 2014, and 2015. For the statement in row 5, HCPS increased from 2015, PPS increased from 2014, Alliance increased from 2014 and 2015, Aspire increased from 2014 and 2015, and PUC increased from 2014 and 2015. For the statement in row 6, HCPS increased from 2013;; PPS increased from 2014;; Alliance increased from 2013, 2014, and 2015;; Aspire decreased from 2014 and 2015;; Green Dot increased from 2014 and 2015;; and PUC increased from 2013 and 2014.
Percentage of teachers agreeing with each statement (somewhat or strongly)
HCPS SCS PPS Alliance Aspire Green Dot PUC
As a result of the evaluation system, I have become more reflective about my teaching.
The evaluation system has helped me to pinpoint specific things I can do to improve my instruction.As a result of the evaluation system, I have made changes in the way I teach. [not asked in 2013]The evaluation system is fair to all teachers, regardless of their personal characteristics or those of the students they teach.
The evaluation system has been fair to me. [not asked in 2013]
The consequences tied to teachers' evaluation results are reasonable, fair, and appropriate.
64
70
19
30
73
71
81
20
54
36
66
66
76
18
52
35
66
64
73
19
58
35
2013 2014
2015 2016
77
84
38
41
72
78
83
28
67
35
75
76
83
32
68
39
70
71
81
35
70
38
2013 2014
2015 2016
72
73
37
38
67
67
75
20
64
26
73
75
74
29
74
39
73
67
77
29
78
36
2013 2014
2015 2016
63
74
48
63
75
81
83
48
71
61
79
81
87
43
72
57
82
81
87
61
84
77
2013 2014
2015 2016
72
85
53
67
84
88
91
52
73
72
82
91
92
52
73
76
87
88
89
52
80
64
2013 2014
2015 2016
68
82
35
52
66
76
76
30
66
52
64
77
78
29
65
50
74
77
83
44
71
59
2013 2014
2015 2016
77
79
53
69
74
80
84
42
68
53
68
84
80
62
83
74
86
84
89
72
92
77
2013 2014
2015 2016
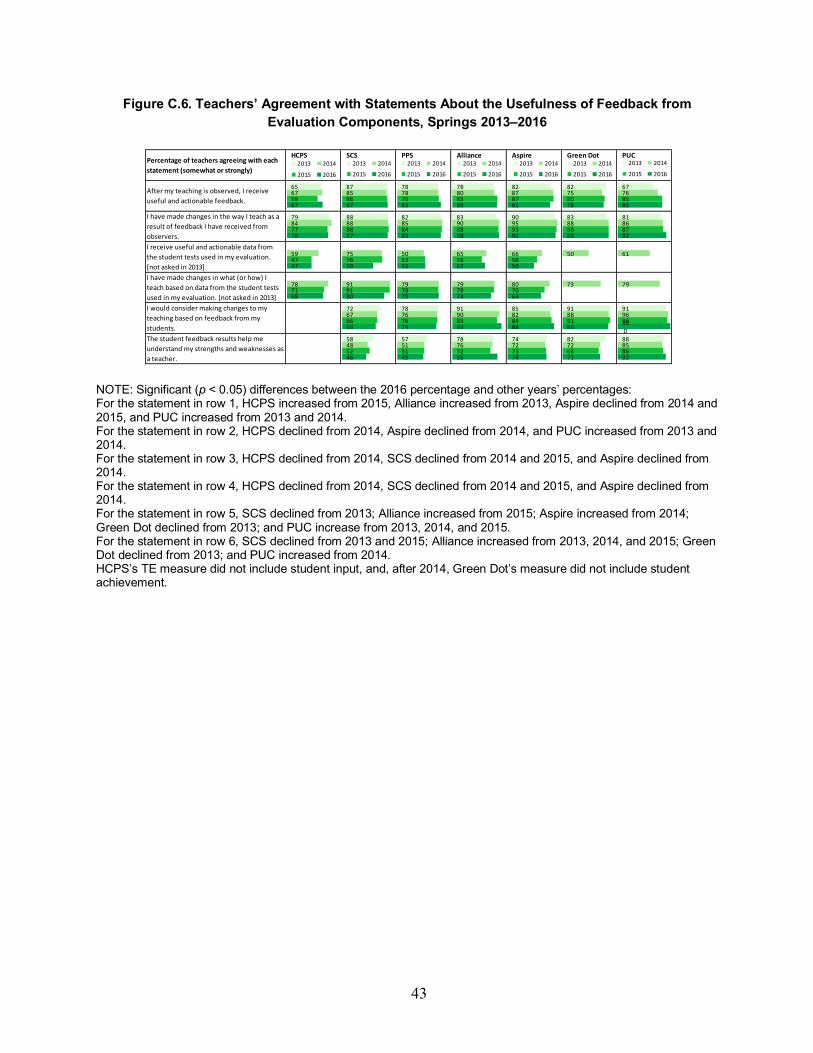
43
Figure C.6. Teachers’ Agreement with Statements About the Usefulness of Feedback from Evaluation Components, Springs 2013–2016
NOTE: Significant (p < 0.05) differences between the 2016 percentage and other years’ percentages: For the statement in row 1, HCPS increased from 2015, Alliance increased from 2013, Aspire declined from 2014 and 2015, and PUC increased from 2013 and 2014. For the statement in row 2, HCPS declined from 2014, Aspire declined from 2014, and PUC increased from 2013 and 2014. For the statement in row 3, HCPS declined from 2014, SCS declined from 2014 and 2015, and Aspire declined from 2014. For the statement in row 4, HCPS declined from 2014, SCS declined from 2014 and 2015, and Aspire declined from 2014. For the statement in row 5, SCS declined from 2013;; Alliance increased from 2015;; Aspire increased from 2014;; Green Dot declined from 2013;; and PUC increase from 2013, 2014, and 2015. For the statement in row 6, SCS declined from 2013 and 2015;; Alliance increased from 2013, 2014, and 2015;; Green Dot declined from 2013;; and PUC increased from 2014. HCPS’s TE measure did not include student input, and, after 2014, Green Dot’s measure did not include student achievement.
Percentage of teachers agreeing with each statement (somewhat or strongly)
HCPS SCS PPS Alliance Aspire Green Dot PUC
After my teaching is observed, I receive useful and actionable feedback.
I have made changes in the way I teach as a result of feedback I have received from observers.I receive useful and actionable data from the student tests used in my evaluation. [not asked in 2013]I have made changes in what (or how) I teach based on data from the student tests used in my evaluation. [not asked in 2013]I would consider making changes to my teaching based on feedback from my students.The student feedback results help me understand my strengths and weaknesses as a teacher.
65
79
67
84
59
78
58
77
47
71
67
78
47
68
2013 2014
2015 2016
87
88
72
58
85
88
75
91
67
48
86
88
76
91
66
52
87
87
59
80
63
46
2013 2014
2015 2016
78
82
78
57
78
85
50
79
76
51
79
84
53
78
76
51
83
83
53
79
74
49
2013 2014
2015 2016
78
83
91
78
80
90
65
79
90
76
85
88
56
79
85
72
85
88
62
74
93
86
2013 2014
2015 2016
82
90
85
74
87
95
66
80
82
72
87
93
56
70
84
73
81
92
50
64
88
74
2013 2014
2015 2016
82
83
91
82
75
88
50
73
88
72
80
88
91
68
78
88
86
71
2013 2014
2015 2016
67
81
91
88
76
86
61
79
96
85
85
87
94
86
85
92
100
92
2013 2014
2015 2016


45
Appendix D. Site Recruitment, Hiring, Placement, and Transfer Policies: Supplementary Material for Chapter Four
The descriptions in this appendix supplement the information presented in Chapter Four on recruitment, hiring, placement, and transfer policies. In HCPS, we describe placement in the section on transfer because the district does not place teachers involuntarily. In PPS and SCS, we describe both transfer and placement policies in the section on hiring because they are part of the hiring process. The CMOs have no centralized transfer and placement policies, and we note this in the descriptions. We describe the districts first, then the CMOs.
District Recruitment, Hiring, Placement, and Transfer Policies
HCPS
HCPS is a growing school district, and, as such, improving recruitment and hiring processes is a high priority. The district made two major changes during the initiative: beginning to hire earlier in the year and launching a new online application tool called AppliTrack.
Recruitment
HCPS recruits new teachers by a variety of means, including hiring fairs and social media campaigns throughout the state of Florida. The district holds hiring fairs specifically targeting difficult-to-staff schools and, during the initiative, began conducting outreach in Puerto Rico. To track the effectiveness of its recruiting efforts, HCPS entered into a partnership with TNTP, an organization that assists in collecting and analyzing recruitment data.
Screening
At the start of the initiative, HCPS used the Haberman tool to evaluate and screen teacher applications, and HR sent teacher applications to individual principals by paper mail, email, and fax. Starting in 2013–2014, the district began to design, then pilot, AppliTrack, a comprehensive hiring and recruitment platform that teacher candidates would use to upload resumes and portfolios. HCPS launched AppliTrack to all schools for new hires in 2015–2016. One key aspect of AppliTrack is the Teacher Fit tool, a survey based on HCPS’s TE rubric that all applicants complete. HCPS drops from consideration any applicant who scores in the first or second stanine. Applicants scoring in the third stanine are evaluated by HR for potential interviews, while applicants scoring in the fourth stanine or above are automatically deemed eligible for interviews and added to the hiring pool. School principals then use AppliTrack to review the eligible pool of candidates, schedule interviews, and track open positions.
46
Hiring
HCPS began moving up its hiring timeline in 2013–2014 to give SLs more time to plan and to better compete with other area districts that started hiring earlier in the year. As of 2015–2016, the hiring process began six weeks earlier than it had before the IP grant, in April rather than in June.
Hiring for Hard-to-Staff Schools
To recruit teachers to lower-performing schools, HCPS offers special bonuses and other incentives for teachers who are willing to transfer or apply to these schools. There are two different incentive programs. One, which is funded through Title I, serves the Renaissance schools. Renaissance schools are the 50 schools in the district with the highest numbers of students who qualify for FRPL (at least 90 percent for elementary school, 85 percent for MS, and 75 percent for HS). Before 2014–2015, any teacher who worked at a Renaissance school received a bonus of 5 percent of base pay (2 percent of base pay for first-year teachers). Since 2014–2015, a teacher with one year or less of experience receives an annual bonus of $1,000; a teacher with two to ten years of experience receives $2,300 annually; and a teacher with 11 years or more of experience receives $3,600 annually. An NBPTS-certified teacher is eligible for an additional $4,500 annually. The second type of incentive applies to POWER3 schools, which a TIF grant funded starting in 2012–2013. HCPS offers each teacher at one of the 30 high-need schools a $1,000 hiring bonus and a $2,000 annual retention bonus. Only teachers with a TE rating of HE (4 or 5) were eligible for POWER3 bonuses. A new teacher with experience in another district is also eligible for the bonus if he or she can show a rating equivalent to HE that includes a student growth measure.
Transfer
Teachers are free to request a voluntary transfer within HCPS, and such requests receive priority over new hires, except at Renaissance schools. HCPS requires principals to check TE scores of prospective new hires and can factor theses scores into their hiring decisions. Seniority within HCPS is not considered as a factor. Transfer candidates apply directly to the schools where they want to work, and the schools make the final hiring decisions. The district does not place teachers involuntarily, except when enrollment declines cause positions to be eliminated. In those cases, HCPS gives the teacher the choice to stay at his or her current school (if enough positions remain) or transfer to an open position for which he or she qualifies, and those teachers are assigned in order of seniority. Beginning in 2014–2015, if two or more teachers have the same level of seniority, HCPS ranks them in order of TE scores to determine the order of placement.

47
PPS
PPS could not place much emphasis on changing the composition of the teacher workforce through recruitment, hiring, or placement in part because, as administrators explained, student enrollment in the district was declining throughout the period of the initiative, so the district hired very few teachers early in the initiative. In fact, because of budget shortfalls, PPS furloughed teachers at the end of the 2011–2012 school year. In addition, state laws and the collective bargaining agreement with teachers made it difficult to change many of these policies. Since the start of the IP initiative, PPS has not partnered with any alternative teacher certification programs (e.g., TFA, TNTP).
Recruitment
A teacher can enter the candidate pool in two ways: as an external candidate or as an internal candidate. Applicants who do not currently teach in PPS are external candidates; current teachers seeking new positions are internal candidates. When recruiting external candidates, Pennsylvania law requires PPS to consider only the top 10 percent of candidates in any certification area; teachers in the top 10 percent of applicants constitute the “eligible list” from which PPS can hire teachers. PPS sets its own requirements for determining which teachers fall into this top 10 percent, and it has defined a 20-point application model.
As part of its IP proposal, PPS planned to implement “teacher academies” in two of its highest-need schools. The district intended the teacher academies to attract highly qualified candidates and provide them with on-the-job training, their teaching certificates, and positions teaching in the district once they completed the two-year residency program. Placing the academies in two of the district’s highest-need schools was intended to attract high-quality teachers to those schools. However, the district never implemented the teacher academies because it faced a budget shortfall and was going to have to furlough teachers. Academy resident teachers, as the least senior teachers in the district, would have been the first to be furloughed.
Although recruitment was not a focus of the initiative at first (the district downsized its workforce because of financial constraints), it has become more of a focus in recent years, and PPS has been trying to improve the racial and ethnic diversity of the teaching workforce by recruiting a more diverse applicant pool. Specifically, central-office staff reported that the district is working to recruit teacher candidates outside of Pennsylvania, including at historically black colleges and universities by visiting their campuses and attending job fairs.
Screening
An applicant who applies to PPS must fill out an application; provide a resume; complete three short essays (developed with TNTP’s help) to screen for grit, desire to work in an urban setting, and high expectations for all students; and complete the Gallup TeacherInsight survey. A teacher is awarded up to ten points for leadership and teaching experience, both overall and as a substitute in the district; up to five points for his or her three essays; and up to five points for his

48
or her score on the Gallup TeacherInsight survey. The district has a cadre of teachers trained to screen applications based on score; the “eligible list” consists of teachers who are in the top 10 percent of applicants. The district does not use TE data in the recruiting, application, or screening process.
A teacher who is currently employed in the district and who received an S rating on the composite TE measure may enter the candidate pool as an internal candidate. A current teacher can opt to change schools voluntarily, or he or she can be displaced from a school involuntarily if his or her position is cut (e.g., for budget reasons), if the position was funded through supplemental funds that have expired, or if his or her date of hire was after August 1. When a school has to let teachers go—or displace them—involuntarily, the least senior teachers are displaced first.
Hiring
As part of its collective bargaining agreement, PPS must find jobs for its internal candidates before matching external candidates to open positions. The district considers internal candidates for positions between approximately March and June. Principals in all schools, including staffing-support schools must interview internal candidates, and internal candidates must be matched with positions, before HR hires and assigns any external candidates.
The hiring process begins with the district HR office sharing the list of qualified candidates with principals, who then interview the candidates with their site-based selection teams, which usually include the principal and several teachers. After conducting interviews, principals submit their hiring preferences to the HR office, which extends offers to the internal candidates whom the principal prefers. HR does its best to use a “mutual-match” process and take principal and teacher preferences when making offers to candidates. When displaced teachers remain, HR assigns them to remaining positions by considering principal and teacher preferences and reviewing TE information. According to district policy, internal teacher candidates are placed in order of seniority (i.e., the most-senior teachers are placed first), but, in practice, the district also takes other factors, such as teacher and principal preferences, into account. The district must place all internal candidates before offering any external candidate a position. It is the district HR office’s responsibility to assign to available positions any internal teacher candidates who do not apply, are not selected, or decline offers of open positions.
Any remaining vacant positions that internal candidates do not fill are open to external applicants, and the external hiring process follows a similar order (minus seniority considerations), from about June through August. When hiring for the 2016–2017 school year, PPS offered an early hiring option to the most-qualified external candidates. It offered selected external candidates “tryouts,” in which each taught a 30-minute lesson to a panel of educators and students. The district made hiring commitments to those judged to be the more effective even though there was not yet an actual position available. The tryout process enabled the district to secure the most-qualified external candidates early in the year. The central office also shares

49
TE information for internal candidates with the principals of staffing-support schools to help those principals recruit or interview specific teachers if they wish. Principals of non–staffing-support schools do not receive TE information from the central office about the applications they receive, but teachers can opt to share the information on their own.
Hiring for Hard-to-Staff Schools
PPS provides a range of support services to hard-to-staff schools to enable them to hire and retain more-effective teachers. PPS identifies these schools based on low achievement and low scores on the district’s teaching and learning condition survey—the staffing-support schools. There were about 14 staffing-support schools in PPS in 2015–2016. To help staffing-support schools hire more-effective teachers, PPS employs several strategies:
• It offers teachers incentives—placement at a higher step on the salary scale than the typical new hire if they are hired into staffing-support schools.
• The central office provides TE data, if available, for all teachers planning to transfer internally, so principals can be strategic about which teachers they recruit to apply. TE information is provided only to staffing-support schools.
• Teachers with TE ratings of NI or F are not placed in staffing-support schools. • Any teacher who applies for a voluntary transfer must visit a staffing-support school and
meet with the principal and site-based selection team. • Principals of staffing-support schools may interview external candidates if they do not
receive any internal applicants. • Hiring for the 2016–2017 school year for staffing-support schools began in January 2016,
well before hiring for the rest of the district. In addition, to improve retention of effective new teachers in staffing-support schools, such
teachers can be exempted from the district’s August 1 rule. This rule, which is part of the collective bargaining agreement, requires that teachers hired after August 1 be automatically displaced at the end of the school year. In staffing-support schools, a teacher hired after August 1 can stay if the teacher and principal agree.
SCS
Before the IP initiative, some of SCS’s teacher staffing policies were not in alignment with the goals of the IP initiative. For example, placement of furloughed teachers was based on seniority, and the district had to place any furloughed teacher in a position before considering external candidates. SCS had limited ability to change staffing requirements that were subject to state law. During the initiative, SCS placed a great deal of emphasis on staffing (i.e., recruitment, hiring, and placement) strategies through its partnership with TNTP, which predates the IP initiative by several years. SCS’s partnership with TNTP began in about 2004, and, from 2004 through 2007, TNTP helped the district build an online recruitment and application system, establish systems to track vacant positions, and manage a teacher residency program. In 2010, after the start of the IP initiative, TNTP’s role expanded. From about 2012 through 2015, TNTP
50
was responsible for filling teacher vacancies; thus, it managed much of the district’s recruitment, screening, hiring, and placement efforts. During this period, the district HR department handled compliance matters (e.g., checking licensure requirements, handling grievances). In 2015, hiring responsibilities were transitioned back to the district. According to district staff, TNTP staff resumed these duties again in 2016, at the request of district leadership.
Recruitment
In addition to its regular recruitment practices, such as attending teacher-hiring fairs and recruiting candidates from local teacher-preparation programs, SCS partnered with alternative certification programs (e.g., TFA, TNTP) prior to the initiative to recruit and prepare new-teacher candidates, and many of those partnerships continue. In 2010, when the district expanded its partnership with TNTP, TNTP focused on expanding the pool of teacher applicants by recruiting earlier in the year and expanding the reach of recruitment to out-of-region candidates. We did not ask specifically about diversity, and concerns about the racial and ethnic diversity of the teaching workforce did not come up in interviews with central-office staff.
Screening
SCS had a rolling application deadline (i.e., there was no cutoff date for applying; the district accepted applications year-round), and that process continued during the IP initiative. In the fall of 2010, right after the IP grant was awarded, the district asked each external applicant to complete a paper application and a phone interview. In 2011, TNTP moved the application process online. In the fall of 2013, TNTP implemented a new screening process for applicants new to the district that was linked to the TEM rubric. The process consisted of a phone interview in which the candidate was asked to review data and describe how those data would inform their teaching, while the interviewer rated the candidate’s responses on a rubric. TNTP staff referred the candidates with the highest scores on these interviews to principals first. In the fall of 2015, the process was refined further, so that teacher applicants from other districts who had TEM scores of 3, 4, or 5 bypassed the screening process so that their applications went directly to principals for consideration.
Hiring
The process for filling vacant teaching positions usually follows these steps once a principal or teacher notifies HR or TNTP that a vacancy exists:
1. The district posts the available position on a rolling basis. 2. HR or TNTP provides the principal with a list of screened applicants. 3. The principal interviews applicants. 4. The principal submits the hiring choice to HR or TNTP.
Teachers can transfer within the district voluntarily (i.e., opt to move to a different school) or involuntarily (i.e., the district does not offer them positions for the next year at their current
51
schools). According to central-office staff, the vast majority of transfers are voluntary. The rolling transfer period starts in February. The district posts and fills available positions, which are generally determined by the school budget or by a teacher request to leave (e.g., voluntary transfer, resignation, retirement), on a rolling basis.
Before the initiative, the district matched tenured teachers with open positions by seniority within their areas of certification. In practice, this meant that the lists of candidates that HR sent to a principal for consideration consisted of the most-senior teachers in that certification area. This process usually occurred in March and April. If there were no internal candidates for a position, the principal could consider external candidates.
The process changed with the passage of the RTT legislation in 2009. The state of Tennessee issued guidelines for placing teachers in open positions. The guidelines stated that districts should (1) use evaluations and student achievement data to place teachers, (2) base both reductions in force (RIFs) and recalling teachers from furlough on effectiveness of teachers, (3) avoid seniority as a determining factor in personnel decisions, and (4) strive for placements that have principal and teacher buy-in (mutual consent). As a result, starting in the fall of 2011, SCS no longer placed internal candidates in positions according to seniority. The district allowed, and TNTP facilitated, mutual-content hiring, in which the principal and teacher had to agree the position was a good fit. However, at this time, internal candidates who did not “match” with positions were assigned to one (i.e., forced into a placement).
This change in policy was intended to improve the match between teachers and schools and thus reduce teacher turnover. In the mutual-consent process, a principal could consider external candidates before all internal candidates had been placed if he or she could not find a “match” among internal candidates. In 2012, TNTP began projecting the number of vacancies anticipated in each grade and subject, along with the number of anticipated internal candidates. In grades and subjects that had more vacancies than there were internal candidates, a principal could hire his or her candidate of choice, without regard to internal status or seniority, until the number of vacancies approached the number of expected internal candidates. According to TNTP staff, during this period, predicting the number of vacancies was difficult. To help predict the number of vacancies, TNTP began surveying teachers about their plans for the subsequent year, specifically asking each teacher whether he or she planned to transfer or leave the district (e.g., retire or resign). Principals did not have complete flexibility in their choices of hire because the district had an obligation to provide positions to all internal candidates.
As of the fall of 2013, the hiring and placement preferences were relaxed further, becoming what one central-office interviewee described as “a free market.” A principal could select his or her preferred candidate without regard for internal status or seniority. Principals were no longer obligated to interview internal candidates before interviewing external candidates. The mutual-consent process was still in place, and the teacher and principal had to agree to the placement. Principals were expected to look at effectiveness data when making hiring decisions, internal candidates were no longer entitled to positions, and principals were no longer required to take

52
teachers who did not match into positions. At this time, TNTP started conducting hiring fairs for internal candidates to help them network and find positions, a practice that continues as of the writing of this report. TNTP encouraged internal candidates to bring their effectiveness data to discuss with principals during interviews.
Hiring for High-Need Schools
Before the fall of 2012, the district’s high-need schools (Striving Schools or iZone schools) were subject to the same hiring policies as other schools. Starting in the fall of 2012, principals of these high-need schools were permitted to make staffing decisions based on TE data. iZone teachers with TEM scores of 3 to 5 were automatically retained in their positions because of their effectiveness scores, and, when hiring for open positions, a principal could select the candidate of his or her choice, without regard to internal status, from a pool of high-performing teachers. To be eligible to transfer to an iZone school, an internal candidate had to have received a TEM score of 4 or 5. If the candidate had a lower score, he or she needed to secure permission from HR. Also starting in the fall of 2012, the district offered any teacher hired into a high-need school either a signing bonus of $1,000 (payable at the beginning of the year) or a retention bonus of $1,000 (disbursed in two payments, one in December and one in May). High-need schools were also exempt from seniority-based layoffs and “surplussing.” As of the spring of 2013, the hiring period for high-need schools began one week earlier than it did for other schools. As of the spring of 2014, iZone schools had complete autonomy in hiring, could use performance data to make hiring decisions, and benefited from an earlier hiring timeline.
Hiring for High-Need Positions
Starting in the spring of 2012, the district offered what it called open contracts for some high-need positions for which there were typically more vacancies than internal candidates (e.g., special education, English as a second language, MS science and math). The district would make a hiring commitment to a candidate before a specific vacancy was identified. The candidate would then be matched to a position when it became available.
CMO Recruitment, Hiring, Placement, and Transfer Policies All the CMOs had some of the recommended recruitment and hiring policies in place prior to
the introduction of the IP initiative. At all the CMOs, teachers apply online and receive a preliminary screening for credentials and security by the central office. Further screening at the central office or the school site varies by CMO. Principals can also recruit candidates directly (e.g., by getting recommendations from existing staff). Hiring authority rests with the principal, and teachers serve “at will”—that is, there is no tenure. Teachers wishing to change schools must apply along with any other applicants. Although there is no tenure, teachers expect, as do administrators, that they will continue their employment. For example, each CMO asks each teacher each March to file a notice of nonintent to return if he or she does not plan to continue

53
teaching the following year. Generally, recruiting begins in March after the schools receive these notifications and know the number of positions they will need to fill. At the outset of the initiative in 2009–2010, when the California economy was depressed, there were large numbers of applicants. In the past few years, as the economy has improved, there has been severe competition from other schools and districts for good candidates. In response, the CMOs have instituted more-extensive recruiting strategies, including more social media outreach, partnerships with local colleges, and residency programs.
In addition, Green Dot reorganized its personnel department as part of the initiative. Before TCRP, the Green Dot HR department was responsible for all personnel functions, including posting positions online, conducting background checks, reviewing credentials, maintaining employee records, and processing payroll. To support the TCRP initiative, in the spring of 2011, Green Dot elevated the importance of staff improvement by creating an HC department within the education section of the organization; three staff members were assigned to work there, and a vice president was given supervisory responsibility. The HR department continued to focus on employee records, payroll, background checks, and similar functions, while the HC department focused on recruitment, retention, PD, transitions, and performance management.
In the following sections, we present details of each CMO’s recruitment, screening, hiring, transfer, and placement policies.
Alliance
Recruitment
Before the initiative, Alliance did very little centralized recruitment. Principals managed their own recruitment and selection processes and made all hiring decisions. After the initiative started, the Alliance central office began to recruit more extensively, including holding job fairs at universities and using LinkedIn for mathematics and science positions. In 2013–2014, the HR team grew, and, for the first time, the department hosted a career fair for teacher applicants to Alliance schools. TFA was another major source of recruits (e.g., Alliance hired about 35 TFA residents for 2012–2013 and 26 for 2013–2014). Starting in 2011–2012, Alliance established a residency program with Loyola Marymount University in mathematics and science as a recruitment source. The program had eight to ten residents in 2011–2012 and three residents in 2012–2013. The program was discontinued because of an insufficient number of available mentors. In 2014–2015, Alliance began an expanded residency program in conjunction with the University of the Pacific, and ten residents participated. The program proved to be too expensive and was discontinued for 2015–2016.
Screening
At the beginning of the initiative, the Alliance central office screened candidates for credentials and security only, and principals were responsible for any subsequent screening.

54
However, in 2012–2013, HR began recruiting and screening teachers to identify a pool of qualified applicants on which all schools could draw. The HR office reviewed teacher certifications, conducted phone interviews, and conducted interviews with a central-office committee. It placed candidates whom it deemed to be qualified into a pool of candidates that was available to school administrators. About 35 percent of principals made use of the service; the others continued to do their own screening.
Hiring
For most of its history, job postings for positions at Alliance were for individual schools, with the principal as the key contact person. Principals were responsible for scheduling, interviewing, and making hiring decisions. Principals also devised their own selection processes; there was no standardized hiring process across the CMO.
After Alliance selected a new CEO in 2015, the central office was restructured, and a new talent management division was created. The talent management division also includes offices responsible for educator effectiveness and new-teacher support, reflecting the organization’s increased concern about teacher selection and support. Alliance hired TNTP to review the organization’s HR functions, and TNTP suggested creating standard procedures for recruiting, selecting, onboarding, dismissal, and similar activities; the development of such procedures began in 2015–2016.
Despite these efforts to standardize the process, some of the responsibility remains decentralized. For example, principals are encouraged to offer stipends or signing bonuses for teachers in shortage fields, but the funds must come out of the school’s budget. Bonuses are not frequently offered. Similarly, HR does not provide any interviewer training for principals.
Transfer and Placement
There are no transfers of teachers per se in Alliance. Each school does its own hiring, and any teacher wanting to change schools has to apply to the new school and go through the hiring process for that school. Similarly, there is no centralized placement of teachers in schools at any of the CMOs.
Aspire
Recruitment
Aspire’s central office engages in a variety of recruitment efforts, including participating in job fairs, doing outreach to colleges, posting on employment websites, and holding open houses and interview days. It also posts jobs on EDJOIN. A central-office administrator noted, “It’s a high priority to have teachers who share the same background and experiences as our kids.” That priority is seen in Aspire’s residency program, which became a strong source of candidates. Because Aspire eventually hires most residents, the program is a strong source of teachers as well. When the residency program began in 2010–2011, 35 percent of the participants were

55
nonwhite; because of efforts to diversify, by 2015–2016, the residency program was 70 percent nonwhite, much closer to the racial and ethnic breakdown of the students Aspire serves. A student who is accepted into the residency program works with a mentor teacher for four days per week and attends classes one day per week. Each resident receives a $13,500 stipend while in training. The mentor teacher receives a $3,000 bonus, plus $500 to spend on personal PD. The residency program began in 2010–2011 and continues. Table D.1 shows the number of participants in the residency program, by year, since its inception. A large percentage of the students who are accepted into the program complete it and are hired by Aspire.
Table D.1. Participants in the Aspire Residency Program
Status Cohort 1
(2010–2011) Cohort 2
(2011–2012) Cohort 3
(2012–2013) Cohort 4
(2013–2014) Cohort 5
(2014–2015) Cohort 6
(2015–2016) Accepted 20 18 34 29 38 54
Completed 18 17 28 27 33
Hired 18 17 23 25 33
Screening
All candidates apply online. The hiring process consists of a phone screening by an HR recruiter for “mission fit” and eligibility; then, HR refers eligible candidates to interested principals, who conduct additional phone screening before deciding whom they will invite for in-person interviews.
Hiring
Before a school does any interviewing, the HR department trains any school staff who will be involved in the process. A new principal also receives one day of training on good interviewing practices and HR tools that are available for interviewing.
The invited candidate participates in an interview at the school site with a panel that includes teachers, parents, and community members. The candidate delivers a sample lesson attended by the other teachers in his or her subject area, the principal or AP, and the regional superintendent. The principal has the final hiring authority.
Hiring for Hard-to-Fill Positions
Occasionally, a school might offer a stipend of up to $2,500 to attract a teacher to a hard-to-fill position. This most often happens when there is an urgent need to fill an interim position, such as to replace a teacher going on maternity leave. Beginning in 2013–2014, Aspire offered a $10,000 incentive for any HE or master teacher to move to a focus (low-achieving) school, but very few teachers took up the offer.

56
Transfer and Placement
The central office does not place teachers in schools at any of the CMOs. Each school does its own hiring. A teacher wanting to change schools must formally apply to another school and go through the same interview process as any other applicant. For example, when a charter lapsed at one Aspire school, Aspire did not guarantee teachers positions at a newly opening school. They had to apply and go through the interview process, and their TE ratings were taken into consideration in hiring.
Green Dot
Recruitment
Recruits apply online through TalentEd recruiting and hiring programs. The California economy was doing poorly at the start of the initiative. Relatively high unemployment meant that recruitment was not a challenge. For example, in 2011–2012, Green Dot had 3,000 applicants for 180 teaching positions. However, as the economy began to improve and the environment became more competitive, the ratio of applicants to positions decreased; in 2015–2016, Green Dot had only 892 applicants for 180 positions. Green Dot began to put substantial effort into upgrading its recruitment efforts to improve the quality of available candidates. In 2014–2015, it began a partnership with CSUDH to increase the preparation of teachers who might work in Green Dot schools. As part of the partnership, Green Dot staff members sit on the CSUDH panel reviewing candidates for the university teaching credential program, Green Dot offers PD to students preparing for teaching jobs (e.g., tips and workshops on successful interviewing techniques), and Green Dot staff participated in mixers to meet all of the CSUDH candidates. The CMO also began increasing the number of student teachers who were allowed to work in its schools, and the partnership organization took steps to ensure that student teachers were paired with HE teachers. To further advertise for Green Dot, the organization hired student ambassadors at targeted colleges to help with recruitment. To target its outreach to colleges that provided the best candidates, the CMO started collecting data from new teachers’ initial evaluations and linking them back to the colleges from which they were recruited. In 2015–2016, Green Dot increased its use of social media as a recruitment device, particularly to reach younger teachers. Despite all these recruitment efforts, Green Dot leaders believe that the candidates who are best suited to Green Dot are those whom other Green Dot teachers refer. To this end, Green Dot offers its teachers a $250 referral incentive if they refer a candidate who teaches in a Green Dot school for three months. In 2011–2012, the CMO began a residency program with Loyola Marymount University but discontinued it because of lack of funding.
Screening
Before the initiative, a principal would identify a potential candidate and then ask HR to review the candidate’s qualifications. After the reorganization in the spring of 2011, the HC

57
department assumed responsibility for screening applicants and then made the information available to the principals. All applicants apply online, and HC identifies the eligible candidates through phone interviews aligned to the observation rubric. Until 2011–2012, Green Dot also used the Haberman assessment but eliminated it in 2011–2012. Eligible candidates submit lesson plans, receive feedback, and participate in home office groups. Qualified candidates are placed into a pool from which principals can select appropriate candidates to interview for their schools. In 2015–2016, Green Dot explored ways to streamline the process for highly qualified candidates (e.g., TFA alumni who were known to the organization and tended to do well). The CMO skipped the phone screen for such an applicant, who either did a mini demo lesson for the home office, received feedback, participated in a Socratic discussion, and went on to do a school demo, or went directly to the school demo lesson.
Hiring
The school site typically asks each candidate to conduct a demonstration lesson and respond orally to teaching scenarios. The school’s hiring panel scores candidate’s responses, and the final hiring decision belongs to the principal. In 2015–2016, Green Dot explored ways to streamline the process for highly qualified candidates (e.g., TFA alumni). Candidates who had been through the TFA training tended to do well as Green Dot hires, so the CMO skipped the phone screen for such an applicant and either referred the applicant directly to the school to conduct a demonstration lesson or asked the applicant to conduct a mini–demonstration lesson for the HC department, receive feedback, and participate in a Socratic discussion; those who performed satisfactorily were referred to schools.
Transfer and Placement
There are no mandatory transfers of teachers in Green Dot. Each school does its own hiring, and any teacher wanting to change schools must apply to the new school and go through the hiring process for that school.
All the CMOs are expanding, and RIFs are rare. At Green Dot, the union contract describes the criteria to be followed in identifying teachers who would be let go should a RIF become necessary and the principal and affected department members cannot agree on a determination regarding who will be laid off. The CMO must rank the teachers in the affected department according to four criteria, with the following weights:
• 40 percent status of credential • 30 percent average score of all evaluations • 15 percent educational attainment • 15 percent years of experience.
Green Dot places any teacher selected for layoff on a reemployment list for 12 months and offers that teacher any vacant position that meets his or her qualifications. If the teacher declines the offer, Green Dot removes him or her from the list.

58
PUC
Recruitment
PUC recruits at university job fairs, at job fairs hosted by PUC, at “meet and greets” at local universities, and through partnerships with UC Los Angeles (UCLA) Extension and the Claremont Colleges.
PUC started a mathematics and science residency program with Loyola Marymount University in 2010–2011 but had difficulties with the quality of the residents and the time commitment necessary for the teacher mentors; it discontinued the program.
In 2014–2015, PUC began a “grow-your-own” residency program with Loyola Marymount University for graduates of PUC HSs and people who had worked for the schools in such roles as teacher aides. It started with two residents in 2014–2015 and had seven residents complete the program in 2015–2016; all but one accepted positions at PUC. Although we never asked PUC staff directly about diversity issues, having a residency program utilizing graduates of PUC’s own schools allows the CMO to hire teachers who match their students in terms of ethnicity and socioeconomic background.
Screening
Before the IP initiative, candidates applied online through EDJOIN or at job fairs. In 2013, PUC implemented its own online platform, which includes a tracking system called ClearCompany that allows SLs to track where a candidate is in the process. HR screens candidates to make sure they have the appropriate credentials and experience then uploads applications for principals to review.
Hiring
Hiring is coordinated centrally, but individual principals make the final decisions. HR holds two interview days per week interviewing panels of candidates. Principals attend if they are interested in the set of candidates being interviewed. This approach allows principals to see, at one time, all the candidates qualified for a particular position (e.g., science teacher). Principals, APs, and teachers can attend the interviews. The next day, the candidate returns and does a demonstration lesson for 30 minutes, and the students who are taught rate the lesson. In 2015–2016, PUC changed the hiring process so that it could make offers more quickly. It could interview a candidate and host the candidate’s sample lesson all in one day.
Transfer and Placement
All movement between schools is voluntary. Teachers who want to change schools must apply for any openings. There are no monetary incentives to move to high-need schools, but, if a high-need school needs veteran teachers, a teacher might get a leadership opportunity, such as serving as department chair. This has occurred very rarely.

59
Appendix E. Site Tenure and Dismissal Policies: Supplementary Material for Chapter Five
The descriptions in this appendix supplement the information on tenure and dismissal policies presented in Chapter Five. We first describe the districts, then the CMOs.
District Tenure and Dismissal Policies
HCPS
HCPS offered tenure until July 1, 2011, when the Florida state legislature passed a law abolishing tenure for newly hired teachers. (Under the new law, teachers who had already earned tenure retained tenured status.) From 2011–2012 until 2015–2016, HCPS offered any newly hired teacher nonprobationary status after three years of satisfactory performance as a probationary teacher and a fourth-year appointment to a teaching position. HCPS granted nonprobationary teachers protections similar to those provided under tenure in the past. HCPS is considering changes in its approach to defining probationary and nonprobationary status beginning in the 2016–2017 school year.
After a rating of U or NI, a teacher is required to participate in an assistance plan aligned with the teacher-evaluation rubric that includes target dates for showing improvement. In general, teachers who are placed on assistance plans and do not show marked improvement are not renominated for teaching positions (i.e., not offered teaching contracts for the subsequent year). In most cases, these teachers are counseled into nonteaching positions, such as assistant teachers, rather than dismissed from the district outright.
Of the 152 teachers not in probationary status and eligible for assistance plans in 2015–2016,
• 135 stayed in teaching positions and went on the assistance plan. Of these, eight were in Deferred Retirement Option Program status, which means that they planned to retire within the subsequent five years.
• 12 were terminated or retired. • five were demoted to assistant teaching positions.
PPS
A PPS teacher must complete six semesters (three years) of satisfactory performance to earn tenure. Teachers are pretenure during this three-year period. This policy predates the IP reforms, but the definition of satisfactory performance changed with the IP reforms. From 2010–2011, the year PPS implemented the RISE teacher-evaluation rubric and observation process, through 2012–2013, satisfactory performance consisted of RISE ratings of B, P, or D. When PPS

60
implemented the combined TE measure in 2012–2013, satisfactory performance consisted of a TE rating of D, P, or NI, if it was the first NI rating. U performance consisted of a TE rating of F or two NI ratings in the same certification area in ten years; two NI ratings equals one F rating. Even though PPS based the definition of U performance on ratings on the combined measure, teachers who are eligible for tenure typically do not have all the TE measures. They are generally missing the measures of school and individual value added because those measures are based on multiple years of data. Therefore, the combined measure rating used for tenure decisions generally consists of observation and Tripod scores. At the end of the 2014–2015 school year, 52 teachers (out of a cohort of 109) were eligible for tenure, and all 27 received tenure; about half left the district prior to the tenure decision year.
Before 2011–2012, a principal could place a teacher on an improvement plan at his or her discretion, based on an observation. During the 2011–2012 and 2012–2013 school years, PPS provided additional support for low-performing teachers through the employee improvement plan (EIP) process. Teachers who did not perform well on the RISE process in 2010–2011 were required to participate in the EIP process starting in the fall of 2011. Although there were no clear criteria for placing teachers on EIPs, teachers who were low performers (U or low B) were asked to participate. When the combined TE measure was implemented in 2012–2013, PPS required any PPS teacher who received a rating of NI or F in the previous year to participate in an intensive support plan, which replaced the EIP process. PPS first used 2012–2013 ratings to identify teachers for intensive support in the fall of 2013. In 2015–2016, 55 teachers participated in intensive support (23 pretenured and 32 tenured).
Tenured teachers who receive U TE ratings for two consecutive years are eligible for dismissal based on poor performance. Of the 55 teachers who participated in intensive support during 2015–2016,
• five did not receive ratings because they were on long-term leaves of absence • three retired • six resigned • 11 teachers received second U ratings for which they could have been dismissed; ten of
these were reassigned, and one is in the dismissal process • 27 improved • three received second negative ratings but were not dismissed because these were not
their second consecutive U ratings; they all participated in intensive support the next year.
SCS
Before July 2011, completion of six semesters (three years) of satisfactory performance was required to earn tenure. Since then, SCS has required teachers to meet all of the following conditions:
• Hold a bachelor’s degree from an approved college or a two-year degree with equivalent training.

61
• Possess a teacher’s license that is valid in Tennessee. • Complete a probationary period of five school years, or not less than 45 months, with the
last two years employed in a regular (rather than interim, such as substitute) teaching position.
• Receive scores of 4 or 5 on the combined TEM in the last two years of the probationary period.
• Receive an offer of employment at the conclusion of the probationary period.
A teacher who earned tenure on or after July 1, 2011, can return to probationary status based on poor performance if he or she receives TE ratings of 1 or 2 on the combined measure for two consecutive years. Therefore, to maintain tenure, a teacher must earn a rating of 3, 4, or 5 on the combined measure. (Teachers who earned tenure earlier could not return to probationary status.)
Ratings for 2011–2012 were first used in 2012–2013 to identify teachers for improvement plans, called professional learning plans (PLPs). Any teacher who received a rating of 2 or lower on two or more of the seven observation indicators or who had an overall TEM score of 1 or 2 was recommended for a PLP, in which the principal and teacher are supposed to plan a course of PD and feedback to help the teacher improve during the course of the year. If the teacher does not improve during the year, he or she is generally counseled out at the end of the year. In addition, teachers with low scores on the observation measure are recommended for initial coaching conversations at the beginning of the subsequent school year and encouraged to develop PLPs with their principals to help them improve, but, for such teachers, PLPs are not required.
Principals are responsible for recommending teachers for nonrenewal (dismissal), and HR must uphold the recommendation. In SCS, nontenured teachers are on year-to-year contracts and can simply be “not renewed” at the end of the year. If a teacher is not renewed at a specific school, he or she can search for employment at another school, but the district does not guarantee a position in the district. A teacher who received tenure before July 1, 2011, cannot be dismissed for poor performance; he or she can be dismissed only for cause (e.g., insubordination).
CMO Tenure and Dismissal Policies None of the CMOs offers tenure. Teachers are hired by the principals at the schools where
they will be teaching. Their employment is at will, and they are retained or dismissed at the discretion of their principal. Teacher-evaluation results do not automatically trigger dismissal or review. However, both evaluative data and the input of CMO central staff are taken into consideration. The principal has final authority to retain or dismiss. Very few teachers are dismissed midyear; typically, they are just not rehired for the subsequent year.
Generally, CMO SLs visit teachers’ classrooms frequently, particularly new teachers, and they identify poor teacher performance using these “pop-in” visits, the formal and informal observations that are part of the evaluation cycle, and data on student performance. Typically, when a teacher is seriously struggling to perform acceptably, the principal will consult with his
62
or her area superintendent and the HR department and will document evidence of the teacher’s deficiencies and the measures taken to assist the teacher to improve, such as placement on an improvement plan. Depending on the CMO, teachers are usually given 30 to 45 days to show improvement, then possibly an additional 30 to 45 days if necessary. Teachers on improvement plans typically are observed more often (although not as part of the observation evaluation score), given more feedback, and given more coaching that can include coteaching or coplanning with them. Teacher-evaluation results do not automatically trigger placement on an improvement plan. A principal can choose a less formal approach to assisting a teacher (e.g., recommending that the teacher observe another teacher) because improvement plans require more of a principal’s time. The principal considers observation results, student assessments, and stakeholder survey results when deciding how to support a teacher.
Because Green Dot has a teachers’ union, the process for placement on an improvement or development plan and termination is defined in the union contract. The contract states that a teacher with less than two years of service can be placed on a development plan (the first phase of an improvement plan) after two informal observations and debriefs showing two or more indicators with ratings of 1.0. A teacher with two years or more of service who averages less than 2.0 after any formal observation can be placed on a development plan. In 2015–2016, Green Dot piloted a change for veteran teachers to possible placement on a development plan if the teacher’s summative observation score was less than 2.0 or, in the past two consecutive years, the teacher received a fall semester observation average score between 2.0 and 2.3.
The development plan requires all of the following:
• areas of growth in which specific improvement is needed, along with supporting evidence • specific expected outcomes for improvement • supports and resources to be utilized to assist with the improvement • the means by which improvement will be measured.
If, after 45 days, the teacher does not make sufficient improvement, Green Dot can place him or her on an improvement plan for another 45 days. If the teacher still does not show sufficient improvement, Green Dot can terminate or not rehire him or her for the following year.

63
Appendix F. Site PD Policies: Supplementary Material for Chapter Six
The descriptions in this appendix supplement the information presented in Chapter Six on PD policies. We first describe the districts, then the CMOs.
District PD Policies
HCPS
HCPS has long prided itself on offering a robust menu of PD options to its teachers, including both school-wide and individualized training. Although HCPS offered a wide range of PD opportunities, before the IP initiative, they were not explicitly linked to teacher evaluation. The primary change in the provision of PD at HCPS during the initiative was to link the content of PD programs to the components of the newly developed classroom-observation rubric. It accomplished this connection in three ways: by offering training on the rubric itself, by updating the online web platform to match PD offerings with rubric components, and by providing mentoring for new teachers.
In 2011–2012, HCPS created a seven-hour training program to educate teachers on the components of the new TE measure, particularly the classroom-observation rubric. It provided this program via multiple routes: a two-evening workshop, a daylong Saturday workshop, a school-wide in-service, and video. The site offered the seven-hour training to teachers throughout the initiative.
During the initiative, most teachers at HCPS accessed PD through an online web platform launched in April 2012 that lists PD options by observation rubric component. A teacher could choose PD based on the areas in which he or she needed the most development according to his or her scores, and peer evaluators, mentors, and principals and APs recommended specific PD programs based on the teacher’s classroom evaluation scores in a postevaluation conference held after each formal observation. Teachers on improvement plans also had access to coaches, who could recommend specific PD as well. The district created what it referred to as “look-for” lists, to help teachers use their evaluation scores to guide them toward the PD offerings providing the most benefit. The district also looked at general trends across teacher-evaluation rubric scores across the district to decide which PD programs to offer and highlight through the website. The website included options for online-only, face-to-face, and hybrid PD programs. Moodle was the primary platform for online-only PD both before and during the initiative.
Starting in 2010–2011, HCPS assigned each new teacher (a teacher in the first two years at HCPS, with less than six months’ prior teaching experience) a mentor, as described in Chapter

64
Two. Mentors met with new teachers weekly for coaching and debriefing, and they kept records of their mentees’ PD. PD for new teachers was aligned with the state’s new-teacher development program (the FEAP), and, in 2011–2012, the site developed specific courses linked to the TE rubric as part of TIP, HCPS’s two-year PD course for all new teachers with no previous teaching experience.
During 2015–2016, the district began a shift toward offering more in-school PD, with the goal of leveraging in-house expertise on the TE system and best practices to deliver PD to teachers and to craft PD programs that would address the needs of the teachers at each individual school. Principals attended training on looking at teacher-observation data and using the data to create these types of specialized PD programs for their schools. A few schools began offering this type of PD in 2015–2016, and HCPS planned to expand such offerings to all its schools during the 2016–2017 school year.
During the initiative, HCPS encouraged PD for all teachers, but, for veteran teachers, it was not required (except for a minimum amount for state recertification every five years), even for teachers on development plans. Section 4 of the classroom-observation rubric contains a part in which the principal can note a teacher’s PD, but principals were not required to monitor teacher participation in PD, apart from completing the rubric (although some did).
PPS
Before the initiative, in general, PPS did not use TE data to inform PD options or recommendations for teachers. This changed in 2010, when it implemented the RISE observation process, which included postobservation feedback. From 2010 through 2013, PPS used RISE data to place low-performing teachers on EIPs, which were structured plans for professional growth approved by the teacher and the principal. It used EIPs until 2013. Starting in June 2013, when PPS implemented the composite TE measure, teachers received general suggestions for PD they could pursue as part of the package of information they received along with their TE scores. Teachers who scored at the P or D level were expected to take it upon themselves to identify specific PD opportunities and pursue them independently. The TE data were supposed to inform teachers’ PD planning, but the district did not monitor this in any systematic way. Teachers who scored at the F or NI level were put on structured PD plans (called intensive support) that were approved and supervised by the principal. Informal feedback and coaching through the regular observation and feedback process (the district called this the RISE process) continued as well.
Throughout the initiative, PPS teachers had access to several types of support:
Coaching
PPS expected principals and other observers (e.g., ITL2s) to coach and give feedback to teachers as part of the RISE process. According to our interviews with principals, teachers, and central-office staff, this feedback covered everything from specific instructional strategies (e.g.,

65
questioning techniques) to more-general topics, such as classroom layout. In addition, LESs provided coaching to teachers struggling with classroom management.
Induction and Ongoing Support for New Teachers
Pennsylvania requires completion of a new-teacher induction program for level II certification, and PPS had made completing such a program a prerequisite for the tenure milestone, so it is something the district has always provided. Most of the teachers who have participated in PPS’s induction program are in their first or second years of teaching. Before the initiative, this orientation lasted two to three days; after the initiative, it was expanded to about two weeks, before the beginning of the school year. PPS implemented this two-week induction program from 2010–2011 through 2013–2014. In addition, during the initiative, PPS planned to provide ongoing mentoring and support for new teachers, but it did not implement these programs systematically. In 2014, PPS hired a full-time coordinator and coach for the district’s new-teacher support efforts. The new coordinator adjusted the timing of the induction courses so they occurred throughout the school year rather than before the start of school. According to central-office staff, PPS made this change to accommodate teachers who were hired after the start of the school year. As of 2014–2015, the content of the induction course included a series of face-to-face seminars that focused on the RISE rubric, teachers’ specific content areas, and networking with more-experienced colleagues; online courses that included fostering a positive classroom climate and culturally responsive pedagogy; and Beyond Diversity training on raising awareness of race-based inequity. The new coordinator also provided periodic coaching (differentiated according to need) to every teacher in his or her first year, connected new teachers with more-experienced teachers for peer-to-peer coaching, and coordinated the induction program.
District-Provided Large-Group Sessions
PPS provided large-group PD sessions for teachers before the initiative and continued to do so throughout the initiative. These daylong sessions occurred about four times per year and, according to teachers, typically covered grade-level curriculum content and district administrative matters.
PD Provided at School Sites
Each principal provided large- and small-group PD sessions for his or her teachers at the school site before the initiative and continued to do so throughout the initiative. According to principals and teachers we interviewed, for the first several years of the initiative, many of these sessions were training sessions devoted to the RISE rubric. For example, each school sent representatives (called RISE teams) to receive training on RISE from the district; these RISE teams would then train the teachers in their schools. As the initiative progressed, principals we

66
interviewed told us, some of these sessions addressed components of the RISE rubric for which principals’ observations indicated support was needed.
Resources for Individual Use
At the beginning of the initiative, PPS planned to provide resources—generally online—which teachers could opt to access and use for their individual development; such resources were not available before the initiative. In the fall of 2011, PPS implemented an online platform it called the Learning Bridge, which used an online interface to organize and present a variety of articles, videos, a catalog of resources linked to the Tripod survey, and other resources teachers could choose to access and that were designed to help teachers improve their instruction. According to the central-office staff we interviewed, PPS struggled to develop or vet appropriate, high-quality content, and teacher use of the Learning Bridge was low. In 2013, PPS switched platforms and implemented BloomBoard, an online platform that enabled PPS staff to organize resources by RISE component and that came with a built-in library of resources. Low levels of teachers’ use of BloomBoard remained a challenge in 2016, according to central-office staff. This is consistent with what we heard in teacher interviews; few teachers reported using it.
SCS
Before the initiative, PD for legacy MCS teachers was entirely online; teachers completed their required numbers of hours of PD individually by completing online courses. According to interviews with the central-office staff, using TE data to inform PD recommendations for teachers was not something the district did before 2011. SCS began using observation data to identify teacher development needs in 2011–2012, the same year it adopted its effectiveness measure. Teachers who were performing at acceptable levels (i.e., 3, 4, or 5 out of 5) were provided with periodic observer feedback and encouraged to seek additional development opportunities on their own. Teachers who received low scores (i.e., 1 or 2 out of 5) on two or more rubric components were encouraged to seek PD designed to help them improve in those areas.
After the MCS–SCS merger, in July 2013, the district’s emphasis for PD shifted to one-on-one coaching. As of the fall of 2013, central-office staff told us that there were four “tiers” to the SCS teacher support model: (1) large-group coaching from PIT crew and PD staff on issues or topics concerning large groups of teachers (e.g., Common Core or new-teacher induction); (2) in-school team-based learning through PLCs, organized by the principal and led by the PLC coach; (3) support for struggling and new teachers in the form of job-embedded coaching support from HE educators (i.e., learning coaches, master teachers, PAR CTs, and PIT crew); (4) self-directed independent study opportunities available to all teachers through the video library (in PD 360, the district’s PD repository before My Learning Plan; videos are aligned with rubric standards) and through the Teachscape video-capture and reflective practice process, in which the teacher video-records lessons and discusses the videos with a coach. In interviews, SCS’s central-office

67
staff described this as a shift in approach to PD from a centralized “sit-and-get” model to one in which teachers received differentiated support through the coaching model or through individual, self-directed study; SCS expected each teacher to be responsible for his or her own professional learning.
SCS teachers had access to a variety of PD opportunities throughout the initiative:
Coaching
In 2013–2014—the year after the merger—SCS adopted legacy SCS’s coaching model (called tiered coaching) as a means of ensuring that struggling teachers received some coaching support. SCS required any teacher who received a score of 1 or 2 on more than two rubric indicators in a given observation to work with a coach for about six weeks, after which the teacher would be observed again. Teachers who did not show improvement with this approach were referred to increasingly intensive coaching with more expert teacher coaches in their schools and then to full-time coaches who served larger regions. This system was in place until the end of the 2014–2015 school year. PAR CTs supported struggling veteran teachers in some schools starting in 2013 and continuing as of the writing of this report. PLC coaches (2013 and ongoing) provided additional school-based coaching support in their buildings. SCS shifted its coaching strategy in 2015, according to interviews with central-office staff, away from using TEM data to identify the lowest-performing teachers for coaching to using TEM data to help identify teachers who would potentially grow the most from coaching support (i.e., teachers who were likely to grow the most and who were most receptive to coaching). In 2015, the district also implemented subject-specific coaching in mathematics and literacy. From 2011 through 2013, SCS also offered real-time coaching in a few schools to teachers who were willing to participate. The participating teacher would wear an earpiece and receive real-time coaching advice from an observer standing in the back of the classroom.
New-Teacher Mentors
As of the fall of 2012, SCS paired any teacher new to the district and to teaching with a veteran teacher mentor for the new teacher’s first year. The mentor worked with the mentee face-to-face every month for coaching and support and discussed the mentee’s progress with the principal. As of the fall of 2015, coaching was no longer part of the mentor teacher’s role; instead, the mentor’s support was more about how to navigate the PD system and where to access instructional resources. As far as we know, the new-teacher mentor program was ongoing as of the writing of this report.
District-Provided Large-Group Sessions
SCS offered district learning days, large-group sessions all district teachers were invited to attend, about three times per year before and during the initiative. As of the summer of 2016, the
68
district began offering TEM “deep-dive” sessions, which teachers could choose to attend over the summer.
PD Provided at School Sites
As of the fall of 2013, SCS expected principals to offer PLC PD sessions in their schools. In most schools, the principal developed the session and a PLC coach led it. According to our interviews with central-office staff, these PLC sessions were supposed to offer teachers the opportunity for team-based learning in their schools. Principals were also responsible for organizing PD sessions to orient teachers to the evaluation system.
Resources for Individual Use
SCS teachers had access to numerous resources for individual use throughout the initiative. One of the first, developed in 2011, was a handbook called Resource Book (Whitney et al., undated), an online and printed listing of PD resources (e.g., videos, articles, lesson plans, in-person PD sessions) and a crosswalk so that teachers could easily identify which resources were relevant to which rubric components. This handbook was in use until the merger in 2013.
Starting in the fall of 2012, SCS began to build a video library in the Teachscape platform, which provided PD opportunities in two different ways. First, teachers could access exemplar videos of SCS teachers. Second, for the teachers whose teaching was featured in the videos, the creation of the videos offered an opportunity to review and reflect on their practice.
After the 2013 merger, teachers could access some independent study resources online via the Learning Loop (later called My Learning Plan), an online resource available to teachers; principals recommended resources (e.g., videos, readings, example materials) based on observation scores. Principals could also use these resources as a starting point for discussion during postobservation conferences.
These opportunities were generally available to all teachers; in addition, the district’s most-struggling schools (known as iZone schools) had their own, supplemental PD resources not available to other schools.
CMO PD Policies The amount of PD that the CMOs offered changed very little from before the initiative: a few
days of CMO-wide sessions, weekly school sessions, and some content-focused half-days. A main driver of PD has always been and continues to be student assessment results, but, for the first three years of implementation of the IP initiative in the CMOs (school years 2010–2011 through 2013–2014), the CMOs spent a good deal of time on the instructional strategies embodied in the observation rubric. With the advent of the Common Core State Standards in 2012–2013, the focus shifted to implementing curricula to meet those standards.
All of the CMOs offered several CMO-wide PD days each year; these typically included sessions with a subject-matter focus and sessions targeted at rubric indicators. In addition,

69
schools conducted weekly PD sessions for one to two hours. The agenda and format for the school sessions varied by CMO. At Alliance, they were usually directed by the principal; at Aspire and PUC, school instructional teams planned the sessions; and, at Green Dot, the central office set the subject for a few of the sessions and the school team planned the rest.
Except for Aspire, the CMOs did not have central-office coaching staff before the initiative, but they all developed coaching staffs during the initiative. All of the CMOs separated coaching from evaluation and focused coaching on teacher development; consequently, coaches did not have access to observation results. Typically, the principal and teacher set a series of goals based on observation results, and coaching included those goals. However, in most of the CMOs, much of the coaching was subject matter–based. Because the CMOs are relatively new organizations and attract many young teachers, these new teachers had to meet state requirements to participate in induction programs to “clear” their preliminary credentials. Teachers could select from a variety of induction programs. Those who enrolled in BTSA also received one-to-one coaching, on average, for one hour each week from their BTSA coaches. Two of the CMOs—Aspire and PUC—had their own BTSA coaches.
With the launch of the observation process in 2011–2012, PD focused on acquainting teachers with the rubric and the CMOs provided PD sessions on specific indicators. In 2012–2013, the Common Core standards replaced the California Instructional Standards, and, the next year, the CMOs began planning for the transition to a new state assessment aligned with the Common Core. The PD emphasis shifted to the Common Core, although with attempts to highlight links to the observation rubric indicators. As one Alliance administrator said in the fall of 2014, rubric-linked instructional strategies “are part of trainings, but we don’t take the matrix and say ‘this training is focused on this module of the TCRP.’” Several CMOs created crosswalks detailing the links between Common Core standards and the CMOs’ observation frameworks (e.g., Aspire updated its Aspire Instructional Rubric guides for each of the observation rubric indicators to show the link with the Common Core.
Alliance
Before the initiative, Alliance held several days of Alliance-wide PD sessions every year. Each school held its own weekly PD session, with the agenda at the principal’s discretion. The central office did not provide coaching. In this section, we describe Alliance’s PD practices during the initiative.
Use of TE to Drive PD
The instructional branch of Alliance, which designs most of the Alliance-wide PD, used student performance data and teacher input to design PD sessions for the Alliance-wide PD days. Common Core standards and assessments played a major role. According to central-office staff, only about 10 percent of PD focused directly on the rubric indicators, reflecting the instructional

70
staff’s focus on assessment results. Observers also used observation results to provide feedback to teachers.
Content
School-based PD sessions were at the principal’s discretion through 2015–2016. In 2011–2012, Aspire asked principals for the first time to submit PD action plans to the central office, but few principals complied. Alliance-wide PD sessions occurred every ten weeks and targeted schools reviewing their benchmark test data, content-area group meetings, and choice sessions related to the observation rubric or other topics (e.g., blended learning). Besides the Alliance-wide sessions, there were regional sessions focused on content areas.
Coaching
Alliance hired coaches for the first time in 2013–2014: four ELA coaches, four mathematics coaches, and two other coaches. In 2015–2016, there were 15 content-area central-office coaches. Each coach had a caseload of up to six schools, which they visited every one to two weeks to assist teachers. Most coaching was subject matter–based. Alliance also instituted ALLI coaches. These were teachers who coached several periods per day and taught during the other periods. Each school had one or two ALLI coaches trained to coach new teachers. Ideally, they coached each new teacher 90 minutes per week. New teachers enrolled in BTSA received about one hour each week of additional coaching through that program. The central-office coaches were discontinued in 2016–2017, and the ALLI coaches took on more of an induction role starting in 2015–2016.
For New Teachers
PD for new teachers consisted of a two-day induction at the beginning of the year; the duration was increased to four days in 2013–2014. In addition to HR information, the induction included an introduction to TCRP, ELL instructional strategies, and orientation to the instructional guides. New teachers also had the option of enrolling in BTSA, but doing so was not a requirement, and TFA teachers (a strong source of new teachers for Alliance) did not enroll in BTSA.
Resources
In 2012–2013, Alliance had a few webinars and some videos on its internal website that aligned with the observation rubric. Other resources were scattered across several websites, and teachers did not access them frequently. The CMO switched to the BloomBoard platform in 2012–2013 and began to populate it with resources, but the resources remained limited compared with those available in the other CMOs.

71
Aspire
Before the initiative, Aspire provided summer training sessions for teachers new to Aspire, as well as a new-teacher support group, instructional coaches, classroom observations and formal performance feedback from the principal, and weekly school-based PD sessions. In this section, we describe PD that Aspire provided during the initiative.
Use of TE to Drive PD
The CMO looked at areas in which ratings were low and used trends to drive workshops. Principals also used TE data to select their schools’ focus indicators and to inform their individual work with teachers or the decision to bring in coaches. As of 2016–2017, TE data continued to influence PD.
Content
Aspire offered several days of retreats for school principals and department chairs, quarterly assessment data days for teachers, two half-days per month for planning meeting and lesson study with a teacher’s grade and content cohort, and weekly school sessions lasting 90 minutes to three hours. PD centered on gaps in teacher practices identified through the observation data and student assessment results. At the school level, each principal identified a few indicators as the quarter- or semester-long focus for PD at that school.
In 2014–2015, Aspire held a summer Common Core institute for all teachers and an optional additional one-week Common Core summer training. PD focused mainly on instructional strategies aligned with the Common Core standards.
Coaching
Aspire assigned central-office instructional coaches by region, subject, and grade level. In most instances, a principal or teacher initiated the request for coaching support. Aspire is a BTSA provider, and about half of a coach’s clients were new teachers completing the state-required induction program, which includes one-to-one coaching for, on average, one hour per week. Aspire restructured its operations in 2016–2017 and eliminated the central-office coaches in three of its four regions. Most were assigned to specific schools as deans of instruction and continued to have a strong coaching role for new teachers.
For New Teachers
Each new teacher attended a one-week summer training session and monthly follow-up sessions during his or her first semester. If the teacher enrolled in BTSA, he or she also received the general guidance of an induction coach and about an hour of coaching each week.
72
Resources
Aspire directed much of its PD resources to the development of online products linked to the observation rubric indicators. Observation ratings and feedback were entered into an online platform, BloomBoard, along with materials tagged to rubric indicators and performance level. In 2011–2012, it launched the Purple Planet, a website with PD aligned with the rubric. In 2013–2014, it expanded online resources with the addition of Doug Lemov videos and Relay teacher-training courses. Aspire also created short videos of instruction linked to specific indicators, featuring Aspire teachers at various performance levels. By 2014–2015, Aspire had an online library of more than 200 film clips.
Green Dot
Before the initiative, Green Dot conducted two Green Dot–wide collaboration days, for teachers to “learn, collaborate, create common assessments, and share best practices with discipline specific peers across the organization” (Green Dot, undated [c]), and benchmark collaboration days for reviewing benchmark test results. In addition, schools conducted weekly 90-minute PD sessions. In this section, we describe PD delivered at Green Dot during the initiative.
Use of TE to Drive PD
By 2013–2014, Green Dot identified four observation rubric indicators, which correlated with academic performance and were well aligned with Common Core strategies (cognitive engagement, group structures, academic discourse, and questioning), and linked all PD to those indicators. Principals also used teachers’ observation results to direct coaching and to supply topics for some school PD sessions.
Content
Green Dot offered several CMO-wide PD days, which focused primarily on content areas, and schools provided 90 minutes of PD once a week, which increased to two days a week in 2014–2015. Each spring, Green Dot provided a PD focus for the coming year (e.g., focusing on cognitive engagement, which is on the observation rubric and in the Common Core standards). Principals and their cluster superintendents developed the PD school focus based on teacher and student data and usually paralleling the Green Dot–wide sessions. One school session per quarter focused on an observation rubric indicator developed by the central office. According to central-office staff, about 60 percent of school PD aligned with both the rubric indicators and to Common Core standards. In the summer of 2014, Green Dot held a four-day Common Core boot camp for administrators, PD central-office staff, and teacher instructional leaders. Starting in 2014–2015, the content of CMO-wide PD days focused on Common Core State Standards, but they were explicitly linked to rubric indicators. As one central-office staff person explained,

73
“The framework is our common language. We’ll put it on a slide at the beginning and say what we’re focusing on, but it’s not the meat of what we’re focusing on. It’s how we view practice.”
Coaching
Before the initiative, Green Dot did not have any central-office coaches. By 2015–2016, 15 coaches were available: three science, two mathematics, three history, four ELA, one special education, and two teacher effectiveness support specialists. Green Dot assigned coaches to teachers at the CMO level. An administrator could also request a coach for a teacher or school PD session. Green Dot offered coaching to all first- and second-year teachers. In 2013–2014, Green Dot organized its coaching practices into a three-tiered coaching system based on observation results: Basic coaching consisted of observation or lesson planning once a month, limited coaching was twice a month, and targeted coaching was a weekly observation and debrief.
For New Teachers
Each new teacher received five additional days of PD in the summer before the start of school. A new teacher also received targeted coaching in the second quarter consisting of a weekly observation and debrief.
Resources
In 2013–2014, Green Dot began modifying the PUC instructional growth guides (see the section on PUC), which are linked to specific observation rubric indicators, and making them available online. These guides were also linked to Common Core standards. They also developed videos of best practices with examples of several teachers effectively implementing the observation rubric indicators.
PUC
Before the initiative, PD at PUC included weekly workshops and at the school level. Principals developed growth goals and targets in specific areas. In this section, we provide more-specific details of the PD provided during the initiative.
Use of TE to Drive PD
Principals focused their school PD sessions in part on teachers’ growth goals linked to the rubric indicators that were common among their faculty.
Content
During the initiative, PUC continued having several CMO-wide PD days and weekly PD sessions at each school. At the school level, PD in 2011–2012 and 2012–2013 focused on the observation rubric and student achievement. The CMO encouraged principals to form PLCs for teachers with growth goals for similar indicators. These small groups met together during PUC-

74
wide PD days. Also, once a year, teachers presented sessions at the PUC-wide days focused on the rubric indicators and designed their own PD, which might include observing a teacher at another school or doing research on the internet for a specific topic. In 2012–2013, PUC began the transition to the Common Core standards with a weeklong Common Core institute for teachers, and half of the time at the PUC-wide PD days focused on the Common Core standards. After the introduction of the Common Core, PD focused more heavily on content and results of the state assessments. In 2015–2016, for example, the PUC-wide PD days focused on addressing literacy problems for ELL and special-education students, an issue identified by the state assessment. After low mathematics results on the state assessment, a mathematics specialist was hired to provide PD for mathematics teachers.
Coaching
In 2011–2012, PUC began hiring coaches and brought in TNTP to develop the CMO’s coaching capacity. The CMO assigned each coach two schools, and and the coach would spent one day a week at each school. Coaches’ first priority was new teachers. All coaches were also BTSA induction coaches.
For New Teachers
New teachers received one week of summer training sessions and follow-up sessions with central-office staff. Each teacher in induction had two hours a week with a coach and three pull-out days for workshops and observing other teachers.
Resources
PUC produced videos of effective teaching strategies, instructional guides with criteria for each level of the observation rubric indicators, and troubleshooting information for implementing the strategies. Teachers could access all resources via the internet. The instructional guides were developed in 2012–2013 and served as models for Aspire and Green Dot, which produced modified versions of the PUC guides.

75
Appendix G. Additional Exhibits for Chapter Six
The exhibits in this appendix supplement the information presented in Chapter Six on staff responses to survey items related to PD.
Figure G.1. Teachers’ Responses About Uses of Evaluation Results, Springs 2013–2016
Percentage of teachers reporting that resul ts from the evaluation of their teaching in the current school year wi l l be used to a moderate or large extent for each of the fol lowing purposes :
HCPS SCS PPS Alliance Aspire Green Dot PUC
To provide you with feedback that you can use to improve your instruction
To identify areas in which you need professional development
To determine whether you need additional support (for example, from an instructional coach)
To decide whether you receive (or keep) tenure [not asked in 2014]
To determine whether you receive a monetary bonus on top of your salary
To determine how much of a salary increase you receive for next year
To determine where you are placed on a career ladder, or whether you are promoted to a higher levelTo determine whether you should move from your current school to a different school
To determine what classes or students within your school you will teach next year
To provide information to parents and/or the general public about the quality of your teachingTo determine whether you enter into some type of probationary status (employee improvement plan, etc.)
To determine whether you are qualified to continue teaching
74
67
52
20
60
37
28
18
25
23
34
43
79
73
60
72
52
42
22
29
35
44
48
72
65
53
25
74
42
30
19
27
29
41
48
74
68
57
28
69
40
31
24
29
32
42
48
2013 20142015 2016
86
81
67
37
34
20
21
27
25
30
32
55
83
80
72
31
23
26
29
33
32
44
57
87
82
76
46
66
56
31
33
37
39
49
62
82
79
73
39
37
32
24
30
34
31
45
56
2013 20142015 2016
80
67
60
27
19
9
15
11
11
15
52
47
82
66
59
22
15
20
12
13
19
57
55
78
63
64
31
22
17
26
12
15
16
51
49
82
65
62
34
29
30
35
16
16
20
52
52
2013 20142015 2016
80
67
60
34
80
43
45
23
24
27
40
57
82
69
66
90
47
46
26
26
31
45
62
81
69
65
28
89
93
65
23
24
30
48
65
83
74
75
35
69
83
58
33
33
37
58
67
2013 20142015 2016
86
75
67
12
75
48
41
10
13
14
20
27
91
75
72
85
84
72
21
20
22
26
30
88
66
61
20
65
89
69
15
16
19
27
38
87
72
67
21
60
85
61
20
22
22
27
39
2013 20142015 2016
88
65
62
12
56
26
30
17
16
17
45
43
80
62
64
64
22
27
18
17
15
59
52
80
61
62
13
28
14
23
17
19
13
59
50
84
66
69
18
17
16
24
22
18
17
54
45
2013 20142015 2016
86
77
76
26
85
36
45
27
18
22
37
52
85
75
79
78
24
33
17
13
21
47
53
85
81
73
25
17
13
28
15
15
17
41
53
89
81
79
28
18
18
27
18
28
23
35
48
2013 20142015 2016

76
Figure G.2. Teachers’ Responses to the Survey Question, “To What Extent Did Each of the Following Influence What Professional Development You Participated in This Year?” Springs
2011–2016
Figure G.3. Teachers’ Agreement That Their PD During the Past Year Was Aligned with Various Sources, Springs 2013–2016
Percentage of teachers saying that each of the following influenced what PD they participated in to a moderate or large extent:
HCPS SCS PPS Alliance Aspire Green Dot PUC
Needs identified as part of a formal evaluation of your teaching
Needs identified from informal feedback you have received on your teaching
Needs and interests you identified yourself
Priorities set by your school or district/CMO for multiple teachers (not asked in 2011 or 2013)
44
40
90
41
34
85
48
42
85
78
43
38
86
74
42
41
87
72
2011 20132014 20152016
43
39
82
62
52
83
68
61
82
78
62
59
85
81
64
57
83
85
2011 20132014 20152016
32
29
56
29
25
54
39
34
61
85
29
27
60
84
33
34
60
84
2011 20132014 20152016
22
23
51
41
37
71
48
50
77
77
47
48
79
77
59
62
81
81
2011 20132014 20152016
24
28
61
37
40
56
52
50
73
83
46
44
68
85
51
54
77
84
2011 20132014 20152016
23
27
64
41
37
59
49
48
58
83
42
46
56
78
46
46
64
79
2011 20132014 20152016
40
41
63
59
55
83
56
56
73
81
56
64
77
79
59
66
78
85
2011 20132014 20152016
Percentage of teachers agreeing (somewhat or strongly) that their PD experiences in the current year had been:
HCPS SCS PPS Alliance Aspire Green Dot PUC
Well aligned with the Common Core State Standards and/or curriculum based on these standards
Well aligned with other standards and/or curriculum
Aligned with or focused on specific elements of my district/CMO teacher observation rubric
85
86
72
91
88
75
87
83
70
88
86
74
2013 2014
2015 2016
91
86
85
86
83
85
85
87
86
89
84
80
2013 20142015 2016
82
76
74
77
69
70
82
77
69
78
78
70
2013 20142015 2016
62
67
71
79
70
72
83
76
69
91
79
78
2013 2014
2015 2016
47
75
78
85
77
76
88
80
66
82
72
70
2013 20142015 2016
54
69
81
84
65
74
82
69
70
83
75
76
2013 20142015 2016
74
71
79
91
77
79
94
84
84
87
82
84
2013 20142015 2016

77
Figure G.4. Teachers’ Agreement with Statements About Support for PD, Springs 2011–2016
NOTE: Significant (p < 0.05) differences between the 2016 percentage and other years’ percentages: For the statement in row 1, HCPS increased from 2013;; SCS decreased from 2015;; Alliance increased from 2011, 2013, and 2014;; Aspire increased from 2011;; Green Dot increased from 2011 and 2014;; and PUC increased from 2011, 2013, and 2014. For the statement in row 2, HCPS decreased from 2011 and increased from 2013;; SCS decreased from 2011;; PPS decreased from 2011 and 2015;; Alliance increased from all prior years;; Aspire increased from 2011, 2013, and 2014;; Green Dot increased from 2013 and 2015;; and PUC increased from 2011, 2013, and 2014 and decreased from 2015. For the statement in row 3, HCPS decreased from 2011 and 2014;; PPS decreased from 2011;; Alliance increased from all prior years;; Aspire increased from 2011, 2013, and 2014;; Green Dot increased from all prior years;; and PUC increased from 2011 and 2013.
Percentage of teachers agreeing with each statement (somewhat or strongly)
HCPS SCS PPS Alliance Aspire Green Dot PUC
School and local administrators have encouraged and supported my participation in professional development.
I have had sufficient flexibility in my schedule to pursue professional development opportunities of interest to me.Sufficient resources (for example, substitute coverage, funding to cover expenses, stipends) have been available to allow me to participate in the professional development I need to teach effectively.
89
75
53
87
52
45
91
59
52
90
56
44
91
59
47
2011 20132014 20152016
90
73
59
91
63
59
91
63
56
93
65
59
89
65
60
2011 20132014 20152016
87
61
55
86
48
50
85
49
46
85
52
46
85
47
46
2011 20132014 20152016
79
50
42
83
53
47
84
56
59
90
63
66
93
74
75
2011 20132014 20152016
82
53
46
88
42
42
88
56
61
92
62
67
90
64
71
2011 20132014 20152016
75
47
42
85
38
52
80
44
55
85
38
47
88
50
63
2011 20132014 20152016
85
49
44
82
55
60
86
58
65
93
70
68
93
64
68
2011 20132014 20152016

78
Figure G.5. Percentage of Teachers Reporting Enhanced Skills and Knowledge, in Various Areas, Due to PD, Springs 2011–2016
Figure G.6. Teachers’ Perceptions of the Usefulness of Various Forms of PD, Springs 2013–2016
Percentage of teachers saying that as a result of PD they had participated in during the current year, their knowledge and skills had been enhanced to a moderate or large extent in each of the following areas:
HCPS SCS PPS Alliance Aspire Green Dot PUC
Your familiarity with effective instructional strategies in subject area(s) that you teach
Your content knowledge in subject area(s) that you teach
Your understanding of difficulties students commonly face, or misconceptions they commonly have, in subject area(s) that you teach
How to differentiate instruction for students in classes with a wide range of ability levels or needs
How to promote student engagement or motivation [not asked in 2014 and 2016]
How to analyze data on student performance
How to manage your classroom and student behavior [not asked in 2014 and 2016]
How to work with or involve students' families [not asked in 2014 and 2016]
82
68
59
62
69
55
46
31
76
64
54
58
66
57
42
27
78
68
58
61
57
73
65
60
62
66
53
46
29
73
63
62
65
56
2011 20132014 20152016
73
63
59
65
68
68
53
41
76
66
57
64
66
64
48
37
73
62
62
64
67
77
65
64
69
71
76
50
46
74
67
62
66
64
2011 20132014 20152016
55
45
39
42
51
52
28
19
51
40
42
39
46
49
27
25
55
46
48
41
48
57
51
51
42
46
52
32
27
52
48
48
34
41
2011 20132014 20152016
42
34
44
35
40
57
29
24
56
38
49
50
48
49
34
30
68
47
55
63
61
72
53
56
63
55
63
40
33
77
55
68
72
68
2011 20132014 20152016
64
43
46
46
62
68
55
21
69
41
45
48
56
66
50
23
77
50
53
50
63
77
58
59
56
64
54
44
36
77
57
61
53
64
2011 20132014 20152016
50
34
43
42
49
52
38
20
59
31
42
36
44
49
37
13
61
32
44
44
48
63
38
46
49
48
62
36
16
65
36
45
52
46
2011 20132014 20152016
62
31
44
43
60
70
35
23
71
42
48
56
62
64
44
36
71
48
51
57
59
80
60
66
69
71
69
58
46
79
62
71
73
71
2011 20132014 20152016
Percentage of teachers reporting that each of the fol lowing types of PD had been moderately or very useful for helping them improve their effectiveness
HCPS SCS PPS Alliance Aspire Green Dot PUC
Workshops or inservices for teachers at your school only (typically on-‐site)
Workshops, inservices, institutes, or conferences organized by your district/CMO for teachers from multiple schoolsWorkshops, institutes, or conferences put on by external providers (professional associations, universities, etc.) [not asked in 2013]
Online professional development offered by or through your district/CMO
Receiving instructional coaching (provided by school-‐based coaches or district/CMO coaches)School-‐based teacher collaboration (grade-‐level or subject-‐area teams, professional learning communities, study groups, etc.)
Videos of sample lessons
57
69
47
52
62
42
62
71
66
53
59
70
49
61
69
64
49
56
70
51
62
68
64
52
57
72
49
2013 20142015 2016
63
60
48
56
70
47
64
63
66
53
65
78
52
69
60
67
49
65
78
55
71
63
70
54
64
78
56
2013 20142015 2016
45
41
29
37
65
42
55
41
54
29
46
71
33
54
45
54
26
47
67
36
53
45
55
33
46
63
34
2013 2014
2015 2016
39
31
31
49
61
33
46
46
57
38
61
69
38
59
48
69
46
65
75
46
66
62
74
74
78
82
60
2013 20142015 2016
59
42
30
76
78
49
66
41
51
42
70
77
55
60
58
62
33
69
80
51
63
52
73
45
75
80
57
2013 20142015 2016
48
40
22
50
62
31
50
37
60
33
63
66
37
53
39
70
37
68
68
33
55
49
65
43
64
67
45
2013 20142015 2016
44
64
39
65
69
39
54
64
71
50
72
80
44
66
67
72
40
75
80
43
64
61
73
53
76
79
58
2013 2014
2015 2016

79
Appendix H. Site Compensation Policies: Supplementary Material for Chapter Seven
The descriptions in this appendix supplement the information presented in Chapter Seven on compensation policies. We first describe the districts, then the CMOs.
District Compensation Policies
HCPS
Performance-Based Salary Adjustments
Two Florida state laws—Florida statute 1012.01(2)(a)–(d) (definitions of classroom teachers, student personnel services, librarians/media specialists, and other instructional staff), passed in 2005–2006, and Senate Bill 736, passed in 2011—mandated merit pay for public school teachers in Florida. In response to these laws, HCPS adopted a MAP, beginning in 2006–2007, which offered bonus pay to teachers in the top quartile of effectiveness. In 2010–2011, HCPS shifted to using the new composite TE measure developed as part of the IP initiative. The district began awarding merit pay to teachers in the top quartile under this new measure starting in 2011–2012.
In 2013–2014, HCPS announced new a performance-based salary adjustment for any teachers who received a 4 or 5 TE rating in the new composite.23 Because the VAM measure of the composite is based on three years of data, it took until 2013–2014 to have enough data to properly calculate the new TE ratings and create the cut scores used for scoring. To be eligible for this salary adjustment, HCPS required that the teacher be in at least the fourth year of teaching and have a VAM score and three consecutive years of observations. A teacher who earns a salary adjustment based on performance in a particular year receives the award as a modification to his or her regular paycheck throughout the subsequent year. (Only staff who remained teaching received this performance-based salary adjustment. HCPS did not award it to staff who retired or left the district during the year when they would have expected to receive the salary adjustment.) The CMO also required that, to remain eligible for the salary adjustment, the teacher remain on the same rubric during this time. If a teacher changed positions in the district, such as moving into a coaching position, he or she would have to wait another five years for a potential performance-based salary adjustment.
23 HCPS concluded that, by awarding IP bonuses to teachers with TE scores of either 4 or 5, it would be in conformance with the aforementioned laws.
80
Between 2014 and 2016, every teacher received a predetermined salary adjustment based on his or her rating. HCPS provided an award of $2,000 for any teacher with a level 4 rating and $3,000 for a teacher with a level 5 rating in 2014–2015. In 2015–2016, a teacher with a TE rating of 4 received $1,900, and one with a TE rating of 5 received $2,900. For the 2016–2017 school year, which is based on the 2015–2016 ratings, HCPS set aside $12.4 million for teachers with level 4 and 5 TE ratings, which was eventually broken out into $1,399.99 for every teacher with a level 4 TE rating and $2,101.84 for every teacher with a level 5 TE rating. About 50 percent of teachers reached performance-based salary adjustments in 2014–2015 based on their TE ratings, and about 55 percent of teachers reached pay-for-performance salary adjustments in 2015–2016 based on their TE ratings.
In addition, HCPS had three bonus programs based on federal TIF grants during this period: POWER1 from 2007–2008 through 2011–2012, POWER2 from 2010–2011 through 2014–2015, and POWER3 from 2012–2013 through 2016–2017. POWER1 covered 116 high-need schools, while POWER2 and POWER3 covered 35 and 30 schools, respectively. Each grant provided HE teachers (defined as top quartile in POWER1 and POWER2 and with a TE rating of 4 or 5 in POWER3) with a lump-sum bonus. The bonus amount for POWER1 and POWER2 was defined as 5 percent of base salary, or an average of $2,000, while the POWER3 bonus was $3,800. Because the TIF grants provided bonuses, not salary adjustments, awarded teachers received this money regardless of whether they were still at the POWER schools.
Effectiveness-Based Salary Schedule
HCPS did not make any changes to its salary schedule to link base compensation to TE.
PPS
Supplementary Effectiveness-Based Payments
PPS adopted the PRC Cohort Award as part of the 2010 collective bargaining agreement. The PRC consists of teachers of grades 9 and 10 who work in teams and “loop” with their students over two years—that is, the same group of teachers teach the same group of students in grades 9 and 10. Before 2015–2016, each of three PPS schools had multiple PRC teams. The PRC program was expanded to three additional schools in the fall of 2015. PRC Cohort Awards are based on the PRC teams’ contributions to growth of their students over the two-year loop and are thus awarded every two years. PPS selected teachers for the PRC based on years of teaching experience and an application process that included consideration of TE scores (i.e., teachers rated F or NI are not eligible to hold CL roles). Teachers who are not part of the PRC but whose students are at least 60 percent grade 9 or 10 (non-PRC teachers) are also eligible for a version of the PRC Cohort Award. About 8 percent of the total PPS workforce was eligible for some form of this award in 2015–2016. PRC teachers can earn up to $20,000 each two-year loop; the exact amount is based on a VAM score of at least 51 (out of 99), and amounts increase as the VAM

81
score increases. A non-PRC teacher’s award is based on the maximum awards in his or her school and then reduced by half and prorated based on the number of teams in the school and the proportion of students in grades 9 and 10 whom he or she teaches. Awards for PRC and non-PRC teachers are also prorated based on attendance. In 2015–2016, six of the nine PRC teams had VAM scores that made them eligible for PRC Cohort Awards. In 2015–2016, 80 percent of eligible PRC teachers earned awards based on 2013–2014 and 2014–2015 results, and approximately 26 percent of non-PRC teachers met criteria to earn prorated awards. Awards for non-PRC teachers ranged from $64 to $1,500. From 2010 to the end of the 2014–2015 school year, the PRC VAM score was based 50 percent on assessments and 50 percent on other measures intended to measure student growth in nonacademic areas, such as attendance. In the fall of 2015, in alignment with the district’s decision to eliminate the CBAs from teacher and school-level VAM scores, PPS adjusted the PRC VAM scores, based on feedback from PRC members, to 40 percent assessments and 60 percent nonassessments. The 2015 PRC VAM scores also omitted the district’s homegrown CBAs and replaced them with the state’s Keystone exams.
The STAR Award is a school-level award that was also adopted with the 2010 collective bargaining agreement but first awarded in the fall of 2012. Eligibility for traditional schools is based on a two-year VAM score that compares the performance of PPS schools with that of other schools in the state, with awards going to up to eight PPS schools in the top 15 percent of schools in the state. If fewer than eight PPS schools are in the top 15 percent, up to eight schools will still receive awards, provided that the schools are within the top 25 percent of schools in the state. A staff member represented by PFT who works in a school that meets either the 15-percent requirement or the 25-percent requirement receives a bonus of up to $6,000. PFT-represented staff at the district’s special schools are eligible for STAR Awards. (There is a separate formula for determining eligibility for PPS schools for students with special needs.) Additional individual eligibility criteria for awards are (1) satisfactory performance, according to the TE composite measure, for the year in which the STAR Award is earned, and (2) assignment to the school for at least 91 days of the school year. PPS award amounts are prorated to account for leaves and absences, as well as the number of days per week worked at the school. If a school earns STAR status, 100 percent of teachers at all of the district’s traditional schools and four of its special schools are eligible for STAR Awards. In 2015–2016, four of the district’s traditional schools and three of its special schools earned STAR status based on 2013–2014 and 2014–2015 outcomes. Although eligibility for STAR awards is determined at the school level, a teacher in one of those schools must demonstrate satisfactory performance on the composite TE measure to receive an award.
The AYP Award is a one-time bonus paid to PFT members (i.e., all teachers but also other staff, such as nurses and librarians) at the top step of the salary scale in years the district achieves AYP, a performance metric for improvement in student achievement under the federal NCLB legislation. Absences would cause the bonus amount of $1,000 to be prorated. PPS achieved

82
AYP only once while NCLB was still in force—during the 2010–2011 school year. AYP bonuses were paid to eligible staff in the fall of 2011.
Effectiveness-Based Salary Schedule
PPS adopted this policy when PPS teachers ratified the collective bargaining agreement in July 2010. Under this policy, teachers hired after July 2010 could receive salary increases in either of two ways: (1) accrue years of service, known as advancing up the ladder, or (2) demonstrate high levels of performance, known as advancing across levels. Thus, the portion of the policy that awards salary increases based on performance is known as a level decision. A teacher rated D at least once in the three years since the previous level decision moves across levels to receive the performance-based salary increase. However, the first year of service in the district does not count for pretenure teachers; thus, their first level decisions occur after four years. In future years, a teacher could earn an additional amount of up to about $30,000, depending on his or her step placement at the time of the level decision. In 2014–2015, the first year PPS gave these increases, 63 percent of teachers (ten out of 16) received increases; the following year, 98 percent of eligible teachers (43 out of 44) received increases.
SCS
Supplementary Effectiveness-Based Payments
In the fall of 2012, SCS awarded effectiveness bonuses based on data from the 2011–2012 school year. This bonus was intended to reward three groups of the district’s highest-performing teachers:
• “5 × 5” teachers: A teacher with a score of 5 on each component of the TEM would receive a $2,000 award.
• “irreplaceables”: A teacher with a TEM score in the top 10 percent of the legacy-MCS workforce would receive a $1,000 award.
• “TEM 5 professionals”: A teacher with a TEM score of 5 (between 425 and 453) would receive a $500 award.
Approximately 1,525 teachers (25 5 × 5 teachers, 600 irreplaceables, and 900 TEM 5 professionals) were awarded bonuses in the fall of 2012; this is approximately 25 percent of the district’s teacher workforce.
The bonus for TVAAS gains used TIF and RTT funding to reward teachers for gains in their TVAAS (state VAM) scores. Legacy MCS awarded these bonuses in the fall of 2012 based on data from the 2011–2012 school year. Schools that received bonuses out of TIF funds were classified as high-priority schools two years out of three, starting with the 2009–2010 school year, and one of those schools was identified for awards if the school-level TVAAS score for 2011–2012 showed positive gains in all tested content areas. Schools that received bonuses out of RTT funds were ranked by their school-level scores; schools that met the threshold for “sufficient gains,” as determined by legacy-MCS administration, were awarded bonuses. In

83
addition to teachers, principals, APs, and support staff received awards. This bonus program did not directly award teachers based on their individual effectiveness scores. Instead, schools were deemed eligible for the program based on school-wide achievement, and all teachers within eligible schools received payments.
The bonus for achievement on state tests used TIF funds for these bonuses in the fall of 2014 based on data from the 2013–2014 school year. Schools that met or exceeded achievement goals on state tests during the 2013–2014 school year received awards; in 2014, this was 14 schools. In addition to teachers, principals, APs, and support staff received awards. Like the bonus for TVAAS gains, this bonus for achievement on state tests did not directly reward teachers based on their individual effectiveness scores. Instead, schools were deemed eligible for the program based on school-wide achievement, and all teachers within eligible schools received payments.
The reward status bonus used SIG funds starting in the fall of 2013, based on data from the 2012–2013 school year. Any iZone school that is among the top 5 percent of schools in the state in terms of achievement growth or proficiency on state tests receives awards. Every teacher who teaches in one of those schools during the year the gains occur receives a $3,000 bonus. Like the bonus for TVAAS gains and the bonus for achievement on state tests, this reward status bonus does not directly reward teachers based on their individual effectiveness scores. This program is ongoing as of the writing of this report.
Effectiveness-Based Salary Schedule
SCS did not make any changes to its salary schedule to link base compensation to TE.
CMO Compensation Policies
Supplementary Effectiveness-Based Payments
Initially, the CMOs implemented bonus systems rather than pay-for-performance salary structures because, given California’s uncertain financial situation at the time, they were not sure they could maintain increasing salary commitments. The bonuses were small, typically between $500 and $5,000. By 2014–2015, all of the CMOs had discontinued bonuses that were based on effectiveness ratings.
As a result of the financial crises in California, wages in the CMOs were frozen for three years, from 2008–2009 through 2010–2011. Evaluation data became available as the economy began to recover. Although, originally, the CMOs considered 2011–2012 a pilot year, in the fall of 2013, all of the CMOs distributed bonuses based on overall effectiveness scores using teachers’ 2011–2013 results. Typically, they awarded bonuses to every teacher in the top three of five effectiveness categories. They awarded no bonuses to teachers rated as entry level.
84
Alliance
From 2012–2013 through 2014–2015, Alliance awarded bonuses to teachers at each TE level. The bonuses were $5,500 for a master teacher; $4,000 for HE; $2,250 for E; and $750 for achieving. Alliance awarded no bonuses to entering teachers.
The CMO switched to a pay-for-performance salary schedule in 2014–2015. It had awarded bonuses to teachers in all TE categories except entry level. The 2016–2017 Alliance salary schedule is based on years of service and two years of performance at a given TE level.
Aspire
Aspire awarded bonuses linked to effectiveness ratings in 2012–2013 and 2013–2014 for teachers at each TE level except entering teacher. Bonuses were $500 for an emerging teacher; $1,000 for E; $2,000 for HE; and $3,000 for a master teacher.
Green Dot
Green Dot awarded bonuses in 2012–2013 and 2013–2014 to teachers in the top three of five TE categories. Bonuses were $500 for E teachers; $1,000 for HE teachers; and $2,000 for HE II teachers.
PUC
In January 2014, PUC awarded bonuses linked to the 2012–2013 TE ratings. It awarded them to teachers in the top three of five effectiveness categories: $1,500 for the progressing level; $3,000 for HE level; and $5,000 for exemplary level. For 2013–2014, instead of a bonus linked to 2013–2014 ratings, every teacher received $500 for being part of the research and development of the evaluation system. PUC subsequently discontinued bonuses. The CMO changed its emphasis from evaluation to teacher development and stopped calculating a TE score. PUC continues to implement a traditional step-and-column pay structure.
Effectiveness-Based Salary Schedule
Alliance
Alliance instituted a salary schedule linked to TE level in 2014–2015 based on data from the previous two years and on years of service. A teacher needs two consecutive years at a new TE level to move up the salary scale. Alliance places every new teacher with one to two years of experience at entry level and any teacher with more than two years’ experience at achieving level. Teachers cannot be moved lower on the salary schedule even if they earn lower effectiveness scores.
Aspire
Aspire instituted a salary schedule linked to TE level in 2014–2015 based on the prior year’s TE score and on years of service. Teachers cannot be moved down on the salary scale.

85
Green Dot and PUC
Green Dot and PUC continue to use traditional step-and-column pay structures based on years of service and education credits.


87
Appendix I. Analyzing the Relationships Between Teacher Compensation, Assignment to LIM Populations, and TE: Analytic Methods for Chapter Seven
The estimates presented in Chapter Seven (specifically, Figures 7.8 and 7.9) result from modeling teacher compensation as a function of TE (measured in terms of the site’s composite TE level or the study-calculated VAM score), controlling for the teacher’s age, teaching experience, educational attainment, gender, and race. This modeling conceptualizes teacher compensation as responsive to effectiveness. Consequently, the estimates show the effect that composite TE levels and VAM scores measured in one year have on compensation in the subsequent year. Specifically, the dependent variable in our specification is the natural log of total compensation (base compensation plus all other compensation) for teacher i in year t + 1, ln(P)it + 1. We regressed the dependent variable on indicators of effectiveness from year t (E1it, E2it, and E3it). We grouped effectiveness measures (composite TE levels and VAM scores) into three categories: E1it = 1 if the teacher received a low composite TE or VAM rating, E2it = 1 if the teacher received a middle composite TE or VAM rating, and E3it = 1 if the teacher received a high composite TE or VAM rating. Additionally, we included a vector of control variables, Xit, including age, gender, race, educational attainment, and teaching experience. Furthermore, we centered each control variable by its annual mean and excluded the constant so that the coefficients of E1it, E2it, and E3it give the expected log compensation for an average teacher of each effectiveness level. The following equation shows this specification:
We ran the models separately for each site and for each year. To obtain expected
compensation for teachers of each effectiveness level, we converted the estimates using the smearing method for nonparametric retransformation developed by Duan, 1983.
ln P( )it+1 = Xitγ + β1E1it + β2E 2it + β3E3it + ε it .

89
Appendix J. Site CL Policies: Supplementary Material for Chapter Eight
The descriptions in this appendix supplement the information presented in Chapter Eight on CL policies. We first describe the districts, then the CMOs.
District CL Policies
HCPS
In its proposal, HCPS aimed to implement a six-step CL, which it did not adopt. However, the mentors who evaluated novice teachers played an important mentoring role, so mentor could be considered a CL position, according to our definition. HCPS launched the mentor position in 2010–2011.24 Mentors provided advice and support to new teachers and evaluated new teachers who were not their mentees. (In this capacity, they were called swap mentors.) In 2013–2014, the district created a new position, teacher leader, as part of HCPS’s TIF POWER3 grant; HCPS implemented this pilot program in 15 high-need schools and expanded it to 30 high-need schools in 2014–2015. Teacher leaders provided individualized coaching to teachers.
The rules governing the two positions differed somewhat. Mentors were originally appointed for two-year terms; however, HCPS repeatedly extended the appointments for all interested mentors to cover the full length of the IP grant. Mentors served in these roles full time and had no other teaching responsibilities. Teacher leaders were appointed through the end of the POWER3 grant, 2016–2017. Unlike mentors, they served half the time as teacher leaders and half the time as classroom teachers.
PPS
Before the IP initiative, PPS did not have any teacher leadership roles that were based explicitly on teachers’ effectiveness. As part of the IP initiative, PPS proposed five CL roles, each of which offered additional compensation in the form of bonuses or salary increments or both: CRI, PRC, LES, ITL2,25 and turnaround teacher. The program had two goals: improve the overall quality of PPS’s teacher workforce through peer support and coaching and attract some of the district’s best teachers to the neediest schools. PPS implemented the CL positions in 2011–2012 and 2012–2013, and most of the positions were in the lowest-performing schools. All the
24 Simultaneously, HCPS created the related peer evaluator position, which we discuss in detail in Chapter Two. 25 There had previously been a position called instructional teacher leader, and this new position was called ITL2 to distinguish the two positions.

90
CL positions were term limited—that is, each teacher selected served a two- or three-year term, although these teachers could serve multiple terms. In addition, CL teachers were evaluated on domain 5, an additional RISE domain that PPS developed specifically to evaluate CL positions. Domain 5 focuses on skills critical to the CL role, such as coaching and instructional leadership. PPS selected teachers for CL roles based on a rigorous interview process, which included teaching a sample lesson, participating in group discussions, and responding to writing prompts. The selection process also included a review of available effectiveness data. Each CL teacher had to maintain a performance level of P or D on the TE composite measure, and a CL teacher could receive no more than one rating of U in a domain 5 component in the first year and no U ratings in domain 5 components in the second year. In 2015–2016, CL teachers could accrue building seniority while they served in CL roles. PPS intended this change to incentivize teachers to transfer into high-need schools.
The district implemented the ITL2 position in the fall of 2012 in several of the district’s highest-need schools; the position carried a three-year term. A teacher needed to have three years of teaching experience with at least one of those in PPS and a composite TE rating of P or D to be eligible for the role. The $11,300 stipend included $5,000 for taking on a school-leadership role based on effectiveness. The remaining amount covered the extended work hours incurred by having an extended working year. From the program’s inception through 2014–2015, the term was three years then reduced to two years in 2015–2016.
Each ITL2 received a stipend and taught a reduced course load (three or four periods, depending on the school). Initially, ITL2s served as coaches and mentors of their peers, often first-year teachers, by doing informal observations and providing formative feedback. ITL2s were matched with mentee teachers in their subject areas to the extent possible and were expected to provide subject-specific feedback and coaching. In the second year of the program, ITL2s conducted formal observations (i.e., with stakes attached) in addition to the informal observations, feedback, and coaching. In 2015–2016, the program was expanded to include more positions in most of the district’s schools and a new role, ITL2 leads, who were supposed to support and coach three or four first-year ITL2s. As of 2015–2016, there were 70 ITL2s in about 40 schools. Central-office staff told us that the position would be discontinued at the end of the 2016–2017 school year because of the new district leaders’ desire to invest in content-specific coaching in roles that did not also include responsibility for evaluation.
In the fall of 2011, PPS implemented the role of the CRI, which had a three-year term and offered a stipend for coaching responsibilities in addition to teaching, in two of the district’s lowest-performing schools. In the original conception, the CRI role was to train and mentor first-year teachers and provide peer support to experienced teachers as part of the teacher academies; however, PPS did not implement the academies, and the CRI role changed several times after its implementation. At first, PPS asked CRIs to serve as nonevaluative peer mentors to struggling teachers in their schools, as well as teach limited course loads. CRIs were given training in classroom observation, providing feedback, and peer leadership and were expected to assist

91
principals in implementing schools’ improvement plans. In later years, PPS expanded the CRI’s role to include reviewing existing PD activities and materials and developing materials as part of the district’s effort to create an online repository of PD offerings linked to RISE rubric components. At the end of the 2013–2014 school year, PPS discontinued the CRI role in one school and, at the end of the 2014–2015 school year, in the second school.
The goal of the PRC program, which was piloted in the fall of 2010–2011, fully implemented in the fall of 2011–2012, and still in place as of the writing of this report, was to form an elite cadre of teachers to help students transition to HS and provide intensive academic support to help as many students as possible be “Promise-Ready,” or eligible for the Pittsburgh Promise scholarship program. To be eligible, a teacher must have at least one year of teaching experience, which does not have to be in PPS, as well as a composite TE rating of P or D. The PRC consists of teachers of grades 9 and 10 who loop or teach consecutive grades to the same group of students. PRC teachers meet daily to plan support for students and teach in multisubject teams. Until 2015–2016, every PRC teacher received an annual stipend to compensate him or her for the additional duties. The $9,300 stipend included $5,000 for taking on a school-leadership role based on effectiveness. The remaining amount covered the extended work hours incurred by having an extended working year. Members of PRC teams that produced above-average student achievement gains also receive performance-based bonuses (a lump-sum payment every two years), described in more detail in Chapter Seven. In the 2015–2016 school year, the district changed the structure of the program and introduced PRC lead roles. PRC leads were responsible for leading the PRC teams and were considered to have CL roles; teachers who joined a PRC team starting in 2015–2016 were not considered to be in CL roles and thus were not eligible for the stipend. But existing PRC teachers were grandfathered in and are still considered to have CL roles, thereby remaining eligible for the stipend. As of 2015–2016, there were 76 PRC or PRC lead teachers.
In the fall of 2011–2012, PPS implemented the LES position in seven of the district’s lowest-performing schools. The position carried a three-year term from the inception of the program through 2014–2015; beginning in 2015–2016, PPS reduced the term to two years. To be eligible, a teacher must have three years of teaching experience with at least one of those in PPS and a composite TE rating of P or D. The $9,300 stipend includes $5,000 for taking on a school-leadership role based on effectiveness. The remaining amount covers the extended work hours entailed by an eight-hour workday and an extended working year. The goal of the LES positions was to provide coaching and mentoring in classroom management to teachers who struggle with that skill. An LES teacher also worked with the principal and staff in his or her school to implement the district’s equity program, which encouraged teachers to provide equitable instruction to all groups of students. The LES did not teach classes and received a stipend for the increased responsibilities. In the fall of 2012–2013, because of school closures, PPS reduced the number of LES positions to five. In 2015–2016, it added district-level positions, resulting in
92
three district-based LESs, each responsible for several schools, and school-based LESs in three schools. As of 2015–2016, there were six LESs.
The turnaround-teacher position, which was envisioned as a team of HE teachers who would be deployed to the district’s highest-need schools, was scheduled to be implemented in the fall of 2012–2013, along with the ITL2 position, but PPS never implemented the position.
SCS
Legacy MCS proposed new CL roles that were closely integrated with the district’s plans for reforming teacher compensation, but, as of the writing of this report, SCS has not implemented these plans, largely because of the lack of staffing at the district level, challenges working with consultants, and the merger. Instead, the district implemented several coaching roles in ways that fit our definition of teacher leadership roles, so we include them here. We do not have any information on what CL roles, if any, existed before the initiative.
In the 2012–2013 school year, legacy MCS piloted the PAR program, which used effective veteran teachers, PAR CTs, to coach struggling veteran teachers. In 2013–2014, SCS fully implemented the PAR program, which continues as of the writing of this report. To be eligible for the PAR CT role, a teacher must have “demonstrated effectiveness” through a TEM score of 4 or 5, with a minimum TE score of 3. A PAR CT receives a yearly stipend of $3,000.
After the merger in 2013, SCS implemented several coaching roles that could be filled by effective teachers. Taken together, the roles of learning coach, master teacher, and PIT crew were referred to as the tiered coaching model and were intended to provide increasingly intensive coaching to struggling teachers, ranging from coaches who were teachers at their local schools to more-expert coaches who served larger regions. The PLC coach was another coaching role for effective teachers, but it was not considered part of the tiered coaching model.
A learning coach or master teacher received a yearly stipend and taught a full course load, along with coaching his or her building peers. PIT crew members and PLC coaches were full-time coaches and did not teach. Learning coaches provided formative coaching, with no stakes attached, to new and struggling teachers; they taught full course loads, but SCS provided each a stipend for the extra work coaching. Master teachers supported the learning coaches in their buildings, provided extra support to struggling or new teachers, and could conduct formal observations and implement school-wide PD. SCS called on PIT crew coaches to provide more-intensive coaching when a teacher struggled to improve and conducted formal evaluations. PLC coaches provided coaching to teachers in their buildings and could conduct formal evaluations. To be eligible for these roles, a teacher needed to have a score of 4 or 5 on the observation rubric and a minimum composite TEM score of 3; he or she also had to demonstrate competency in coaching. Initially, district staff identified teachers for these roles based on the prior year’s evaluation scores; however, central-office staff told us that principals had discretion in selecting learning coaches in their buildings and that some principals might have ignored the set requirements. The roles of learning coach, master teacher, and PIT Crew were in place for two
93
years, from 2013–2014 and 2014–2015; the role of PLC coach continues as of the writing of this report.
CMO CL Policies
Alliance
Before the start of the IP initiative, Alliance selected its most-effective mathematics teachers to work as transformational leaders. Each transformational leader received a stipend of $6,000; continued to teach in his or her own school, and served as a trainer for other schools. These same teachers later became mentors when Alliance began a teacher-residency training program.
Alliance created another specialized teacher role in 2012–2013, the ALLI coach, and fully implemented it the following year. These teachers coached first- and second-year teachers for one, two, or three periods out of the teaching day. To be eligible to be an ALLI coach, a teacher must have scored at the top two effectiveness levels (out of 5 levels). Each school could have up to two ALLI coaches, and the principal determined, based on the school’s resources, the number of periods they coached.
Alliance created several other career positions in 2013–2014. These positions included data fellow (to help administrators and teachers navigate data, such as student test results), demonstration teacher (to conduct lessons that other teachers could observe), and instructional PD teacher (to work with the school’s instructional team to help implement the Common Core standards). Although the Alliance central office developed these positions and provided training, each SL decided whether to implement the position at his or her school and find funding to support it. The Alliance central office believed that these positions would contribute to improved student achievement, but, aside from the ALLI coaches, few teachers applied. One central-office administrator explained the low application rate:
We offered a handful of positions and advertised them to teachers; to my knowledge, I don’t think there was a lot of energy and interest in that because folks were just worried about their evaluation and how to perform in a classroom.
Aspire
Before the IP initiative, Aspire’s school organization included lead teachers, expert teachers in their subjects whom principals selected to lead department meetings and serve on the school instructional teams that set the PD agendas for the schools. These positions continue to be implemented.
In 2012–2013, Aspire began creating an array of teacher leadership roles available to teachers at all levels of effectiveness. In 2013–2014, Aspire fully implemented this set of positions, the Aspire Teacher Leadership and Career Path. According to central-office staff, the

94
motivation for these roles was to keep HE teachers in the classroom. One central-office administrator explained the rationale in these words:
Don’t become a [central-office] coach; don’t become a dean; don’t become a principal. $2000 bonus or salary may not incent them, but if we say they can also be the peer observer or be the instructional driver and get extra PD, [they will think,] “I love and live for instruction. That will incent me to stay in the classroom.”
Among the 20 new positions created were induction coach, Common Core driver, data driver, mentor teacher, model teacher, video teacher, and both virtual and in-person PLC leaders in various topics. Stipends for the Aspire roles typically ranged from $1,000 to $2,500. Aspire used its TIF grant, received in 2012–2013, to pay for these teacher leader roles. Over time, new roles evolved, and Aspire retired roles that it no longer needed (e.g., Common Core driver). According to central-office staff, one of the primary reasons teachers sought the roles was to receive the extra PD provided to them to prepare them for the positions. However, in 2016, we were told that the number of applicants had declined following the adoption of the Common Core standards. According to central-office staff, “a lot [of] teachers realized that they needed to refocus on their own classrooms, and really buckle down on their own practice, rather than serving in these regional or cross-regional roles.”
In 2015–2016, Aspire teachers held 21 teacher leadership positions. The most-popular positions, their minimum effectiveness requirements, and their stipends were as follows:
• data driver (E, HE, or master): $1,000 • ELA instructional driver (E, HE, or master): $1,500 • equity driver (any effectiveness level): $1000 • math instructional driver (E, HE, or master): $1,500 • peer observer (HE or master): $1,500 • site-based induction coach (HE or master): $1,500.
Green Dot
Green Dot offered two teacher leadership positions before the IP initiative: ILT member, which was similar to department chair, and new-teacher mentor. These positions were both selected at the school level in compliance with the negotiated union contract and continue to be implemented.
Green Dot began offering three additional teacher leader positions in 2012–2013: teacher leader facilitators, who designed and led PD at CMO-wide PD days; the Green Dot ILT, which consisted of 96 teachers, about five from each school and one from each department, who received training on being effective department leaders; and demonstration classroom teachers, four teachers who conducted classes that other teachers could observe. The number of positions was expanded in 2013–2014 to include PD leaders, who provided PD sessions, and data fellows, who assisted teachers in navigating and interpreting data.

95
In 2014–2015, Green Dot discontinued the teacher leader facilitator and data fellow positions but created several new teacher leader positions. In some of these positions, the central office chose teachers who could serve across the CMO or only in their own schools, while, for other positions, teachers were selected and served only at the school level. The school-level positions were not standardized, in that the exact role and the stipend could differ by school. One advantage of the school-defined positions, which could make them more appealing to teachers, was that teachers did not have to travel to other locations; the teachers might have been more committed to their schools than to the CMO as a whole.
The career positions that were operating in 2015–2016 were as follows:
• school-level positions
- English learner lead (one per school) - Green Dot ILT (six department chairs per school) - new-teacher mentor (one per school).
• central-office positions
- special-education new-teacher support advisers (one MS, one HS) - National Expansion Leadership Collaborative, to assist in Memphis (four) - teacher PD advisers (six; none filled in 2015–2016) - demo class teacher (one ELA, one math, and two science, history, or electives) - PD leader (11, by subject and level) - TIP coaches (one per participating induction teacher) - special-education coteaching advisers (two special education, one general-education
teacher; none filled in 2015–2016) - core curriculum review team (28) - sheltered ELA revision committee (seven) - special-education academic success working team (four) - special-education curriculum and assessment adviser (two) - technology pathways review team (one MS, one HS) - site liaison (one per school).
There are minimum qualifications for all the instructional leadership positions—demo class teacher, PD leader, TIP coach, special-education coteaching advisers, ILT, new-teacher mentor, and English learner lead. First, for leadership roles, the organization hires only people whom central-office staff have observed and who have performed well in the observations. Second, all roles require recommendations from the school site administrator. Other requirements depend on the position. For example, for the instructional leadership positions, teachers should have at least HE on the TE measure. However, a teacher does not need to have an HE rating to qualify for a technology pathway review team position. A central-office staff member said,
We look at the total score and take it with [a] grain of salt. Somebody could have 3.3 on observation but we know they’re not as strong as at a school with rigorous evaluators. We don’t look at anybody as just a number. [We are a] small enough organization that we have observed all these people.

96
Green Dot has two main goals for the leadership roles: to keep teachers in the classroom who want to remain in the classroom and to provide leadership opportunities for teachers who want to move into administration:
We want to keep everyone in the classroom who wants to stay in the classroom. The demo classroom teacher is our highest-paid leadership position. It incentivizes teachers to stay in the classroom and lead by doing what they do well. We also need administrators, so if people are interested in exploring leadership, we support that.
Despite the variety of new CL roles (which reflected the organization’s needs) and despite the stipends provided, many teachers were reluctant to take on the extra duties. Thus, the roles did not encourage retention of effective teachers. A TCRP study (Abshere, 2016) identified the same reluctance on the part of teachers: “Our [TCRP] teachers talked about really not liking the teacher leadership roles, not seeing them in a way they were intended. Not really a retention driver. It worked for a subset of people” (personal communication; Abshere, 2016). Some teachers said that teacher leadership roles led to a path out of the classroom, which they did not want, and some teachers placed more value on their relationships at their schools and with their principals than on a career path.
The central office decided not to adopt a hierarchical CL after feedback from teachers who indicated that they felt that being in a position at the bottom of the ladder was not representative of the teacher’s importance or value to the organization. However, even though the current CL positions are not organized in the form of a ladder, administrators used them as signals of readiness when considering teachers’ qualifications for administrative positions. One administrator explained how he factored CL experience into the equation when deciding which teachers to admit to the formal administrator residence program:
When recruiting for administrator residency, I would look for someone who participated in two site-level positions, one of which would be the instructional leadership team, which are the most-effective teachers in each content area. I’d look for somebody with experience in one Green Dot–wide leadership position.
PUC
PUC had two teacher leadership positions before the IP initiative that are still ongoing. One role is induction support providers, who assist new teachers in meeting state requirements to move from a preliminary to a “clear” credential, and the second role, learning lab demo teacher, occurs during the summer institute for new teachers, in which actual classrooms are set up and new teachers can observe the instruction conducted by the learning lab demo teachers.
In 2013–2014, PUC implemented the Common Core Pioneer position to train teachers in Common Core teaching strategies that they could then model for other teachers at their schools. In 2014–2015, PUC eliminated the position and replaced it with content coordinator and assistant content coordinator positions. The content coordinators prepared descriptions of their best activities and made them available online for other teachers and students. Five CL positions were

97
in place in 2015–2016: advisory panel member, content coordinator, assistant content coordinator, Alumni Teach Project mentor, and learning lab demo teacher. The minimum qualifications for every one of these positions in 2015–2016 was that the teacher had to be in good standing with respect to his or her evaluation and had to be recommended by his or her principal. The central office reviewed the qualifications and interviewed the candidates. (PUC stopped calculating composite TE scores after 2012–2013, so these were not available to use for selection.) Some positions also required that the teacher have at least two years of experience.
PUC central-office administrators described the purpose of the teacher leader roles as giving teachers more responsibilities and stipends based on their expertise, both so that teachers who wanted to stay in the classroom could do so and so that teachers could gain experience to move into leadership. Additionally, for people in the positions with stipends, those stipends would serve in place of effectiveness bonuses. One administrator added, “We believe [that] the career path for which teachers have to qualify . . . is, in essence, going to be rewarding them for effectiveness.”
Despite these intentions, central-office staff acknowledged that PUC has been slow to implement CL positions and that those that it has implemented are not attracting large numbers of teachers. One central-office staff person commented,
I don’t have a good explanation for why we haven’t moved on this. It’s definitely the area we haven’t moved in, especially compared to the other CMOs. It’s apparently a priority for this year [2015–2016]. We’re still in at the level of identifying the teacher leader positions, and we haven’t got up to the point of identifying what the career path is and we haven’t restructured our salary schedule.
Principals were supposed to publicize the positions and identify appropriate teachers to fill them, but, apparently, this has not always occurred. Another staff person suggested that SLs might not have been prepared for this task: “Almost all of our school leaders know about the roles, but not all are using them or feel capable of naming a teacher [who] can do X, Y, or Z for us.”


99
Appendix K. Additional Exhibits for Chapter Eight
Table K.1. Teacher Survey Questions About Awareness of CLs and Specialized Positions
Question Who Responded Response Options This year, does your district/CMO have in place a “career ladder” for teachers, or specialized instructional positions that teachers may take on if they are considered qualified?
All survey respondents • Yes • Partially implemented or being
phased in (for example, some positions are currently available while others are still being developed)
• No • Don’t know
This year, are there teachers who hold higher-level career ladder or specialized instructional positions at your school?
Only respondents who answered “yes” or “partially implemented or being phased in” to the first question
• Yes, me (non-exclusive) • Yes, teacher(s) other than me
(non-exclusive) • No (exclusive) • Don’t know (exclusive)
Please fill in the title of the career ladder or specialized position you currently hold.
Only respondents who answered “Yes, me” to the second question
• (write-in response)

100
Figure K.1. SLs Reporting That Their Site Had or Was Phasing in a CL or Specialized Instructional Positions, Springs 2013–2016
NOTE: Omitted response categories are “no” and “don’t know.” We did not ask the question in 2011. Because of rounding, some percentages do not sum precisely.
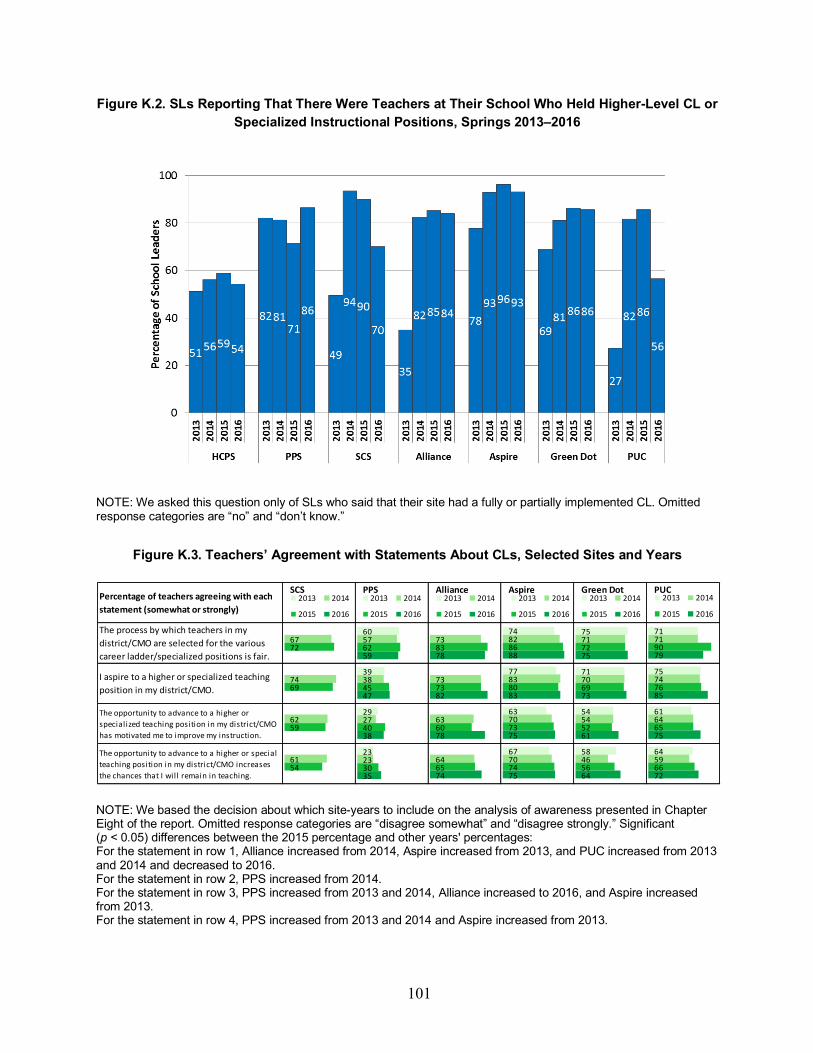
101
Figure K.2. SLs Reporting That There Were Teachers at Their School Who Held Higher-Level CL or Specialized Instructional Positions, Springs 2013–2016
NOTE: We asked this question only of SLs who said that their site had a fully or partially implemented CL. Omitted response categories are “no” and “don’t know.”
Figure K.3. Teachers’ Agreement with Statements About CLs, Selected Sites and Years
NOTE: We based the decision about which site-years to include on the analysis of awareness presented in Chapter Eight of the report. Omitted response categories are “disagree somewhat” and “disagree strongly.” Significant (p < 0.05) differences between the 2015 percentage and other years' percentages: For the statement in row 1, Alliance increased from 2014, Aspire increased from 2013, and PUC increased from 2013 and 2014 and decreased to 2016. For the statement in row 2, PPS increased from 2014. For the statement in row 3, PPS increased from 2013 and 2014, Alliance increased to 2016, and Aspire increased from 2013. For the statement in row 4, PPS increased from 2013 and 2014 and Aspire increased from 2013.
Percentage of teachers agreeing with each statement (somewhat or strongly)
SCS PPS Alliance Aspire Green Dot PUC
The process by which teachers in my district/CMO are selected for the various career ladder/specialized positions is fair.
I aspire to a higher or specialized teaching position in my district/CMO.
The opportunity to advance to a higher or specialized teaching position in my district/CMO has motivated me to improve my instruction.
The opportunity to advance to a higher or special teaching position in my district/CMO increases the chances that I will remain in teaching.
67
74
62
61
72
69
59
54
2013 2014
2015 2016
60
39
29
23
57
38
27
23
62
45
40
30
59
47
38
35
2013 2014
2015 2016
73
73
63
64
83
73
60
65
78
82
78
74
2013 2014
2015 2016
74
77
63
67
82
83
70
70
86
80
73
74
88
83
75
75
2013 2014
2015 2016
75
71
54
58
71
70
54
46
72
69
52
56
75
73
61
64
2013 2014
2015 2016
71
75
61
64
71
74
64
59
90
76
65
66
79
85
75
72
2013 2014
2015 2016


103
Appendix L. Resources Invested in the IP Initiative: Analytic Methods for Chapter Nine
Site Expenditure Data and Analysis
Data Sources
We based our analysis of sites’ IP expenditures mainly on the financial reports that each site submitted to the Gates Foundation. For most of the sites, we obtained copies of the financial report files submitted for 2013, 2014, 2015, and 2016. We also looked at the stocktake narratives and other supporting documentation that accompanied the financial reports. Table L.1 shows the expenditure files that we reviewed for each site.
Table L.1. IP Sites’ Financial Reports
Site Information Provided
File Name
HCPS Expenditure reporting to the foundation
• HCPS IPS Financial Report - October 19 2012.xls • HCPS IPS Financial Report - Fall 2013.xls • Hillsborough IPS Financial Report - Spring 2014 final sent.xls • Hillsborough IPS Financial Report - Fall 2015 8-24-15.xls • HCPS Final GATES Stocktake Fall 2016.xls
HCPS Stocktake submissions to the foundation
• Stocktake Narrative_Fall2015 Final.pdf
PPS Expenditure reporting to the foundation
• Pittsburgh IPS Financial Report - Fall 2014.xls • Pittsburgh IPS Financial Report - Spring 2015.xls • OPP1006112_2015_PPS_Financial Report - For the Period of Jan-Dec
2016.xls
PPS Stocktake submissions to the foundation
• PittsburghPublicSchools_Spring2013StocktakeNarrative.pdf • Financial Section - Pittsburgh Public Schools Fall 2014 Sustainability
Progress Plans.pdf
SCS Expenditure reporting to the foundation
• Shelby IPS Financial Report Fall 2014 with Actuals for FY2015.xls • Copy of OPP1006364_2016_Shelby_Budget_FALL 2016 Final 9-12-2016
Final.xls
SCS Stocktake submissions to the foundation
• SCS IPS Progress Report Dec 2014 Submitted.pdf • SCS IPS Progress Report_Fall 2015 FINAL.doc
Alliance Expenditure reporting to the foundation
• Alliance.Stocktake Fall 2013_11-25-2013.xls • Alliance Financial Report - Fall 2014.xls • Alliance Financial Report - Fall 2015.xls • OPP1040958_2016_Alliance_IPS Financial Report - Fall 2016.xls
Aspire Expenditure reporting to the foundation
• Aspire_Stocktake Nov 2013_FINAL.xls • Aspire Financial Report - Fall 2014 10.13.14.xls • 100116 Aspire IPS Financial Report - Fall 2016.xls
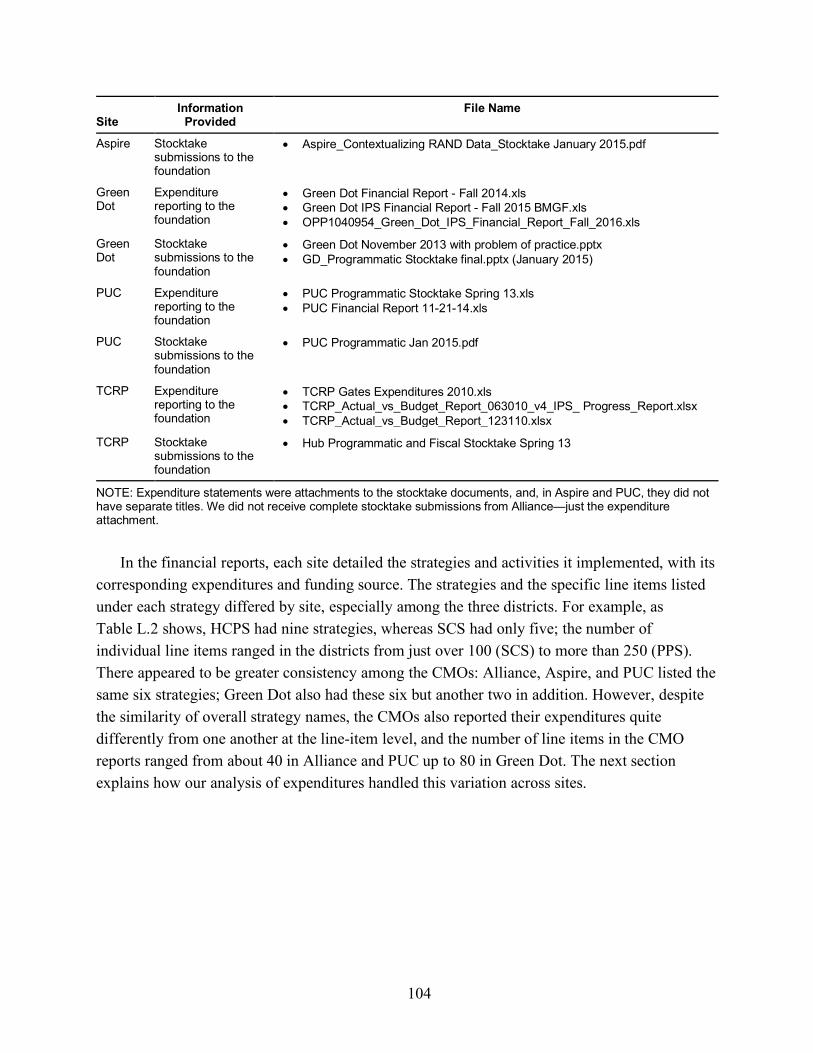
104
Site Information Provided
File Name
Aspire Stocktake submissions to the foundation
• Aspire_Contextualizing RAND Data_Stocktake January 2015.pdf
Green Dot
Expenditure reporting to the foundation
• Green Dot Financial Report - Fall 2014.xls • Green Dot IPS Financial Report - Fall 2015 BMGF.xls • OPP1040954_Green_Dot_IPS_Financial_Report_Fall_2016.xls
Green Dot
Stocktake submissions to the foundation
• Green Dot November 2013 with problem of practice.pptx • GD_Programmatic Stocktake final.pptx (January 2015)
PUC Expenditure reporting to the foundation
• PUC Programmatic Stocktake Spring 13.xls • PUC Financial Report 11-21-14.xls
PUC Stocktake submissions to the foundation
• PUC Programmatic Jan 2015.pdf
TCRP Expenditure reporting to the foundation
• TCRP Gates Expenditures 2010.xls • TCRP_Actual_vs_Budget_Report_063010_v4_IPS_ Progress_Report.xlsx • TCRP_Actual_vs_Budget_Report_123110.xlsx
TCRP Stocktake submissions to the foundation
• Hub Programmatic and Fiscal Stocktake Spring 13
NOTE: Expenditure statements were attachments to the stocktake documents, and, in Aspire and PUC, they did not have separate titles. We did not receive complete stocktake submissions from Alliance—just the expenditure attachment.
In the financial reports, each site detailed the strategies and activities it implemented, with its
corresponding expenditures and funding source. The strategies and the specific line items listed under each strategy differed by site, especially among the three districts. For example, as Table L.2 shows, HCPS had nine strategies, whereas SCS had only five; the number of individual line items ranged in the districts from just over 100 (SCS) to more than 250 (PPS). There appeared to be greater consistency among the CMOs: Alliance, Aspire, and PUC listed the same six strategies; Green Dot also had these six but another two in addition. However, despite the similarity of overall strategy names, the CMOs also reported their expenditures quite differently from one another at the line-item level, and the number of line items in the CMO reports ranged from about 40 in Alliance and PUC up to 80 in Green Dot. The next section explains how our analysis of expenditures handled this variation across sites.

105
Table L.2. Strategies, by Site
Site
Approximate Number of Unique Line Items Reported Strategy
HCPS 120 Measuring Teacher Effectiveness, Generation for Pay, Programs and Incentives for High Needs Students, Apprentice Teacher Acceleration Program, Enhanced Recruitment and Dismissal, Strengthen School Leadership, Performance Management, Integrated Instructional Toolkit, Change Management Communication
PPS 270 PRC, Teacher Practice Evaluation, HR Effectiveness, TLE, Teachers Academy, CL, Aligned IT Systems, Performance Pay/Collective Bargaining, Integrated Communications, Project Management
SCS 110 Define and Measure Effective Teaching;; Make Smarter Decisions About Who Teaches;; Better Support, Utilize, and Compensate Teachers;; Improve the Surrounding Context to Foster Effective Teaching;; Overall Implementation
Alliance 45 Teacher Supports, Principal Leadership, Teacher Residency, Extended Implementation Team, Career Path, Differentiated Compensation
Aspire 60 Teacher Supports, Principal Leadership, Teacher Residency, Extended Implementation Team, Career Path, Differentiated Compensation
Green Dot
80 Teacher Supports, Principal Leadership, Teacher Residency, Extended Implementation Team, Career Path, Differentiated Compensation, Program Expense Reimbursement, Counseling
PUC 40 Teacher Supports, Principal Leadership, Teacher Residency, Extended Implementation Team, Career Path, Differentiated Compensation
SOURCES: IP site financial reports for the fall of 2014 and the springs of 2015 and 2016.
Detailed financial reports were not available for the CMOs for the years before FY 2012. For
FYs 2010 and 2011, when the CMOs were organized collectively as TCRP, we estimated each CMO’s funding by prorating the total TCRP funding in those years by each CMO’s share of the four CMOs’ combined funding in FYs 2012–2014.
Data Analysis
Our analyses of total expenditures and expenditures by funding source were relatively straightforward: We simply summed the reported expenditures across years or across funding sources. We calculated per-pupil expenditures by dividing each expenditure by the number of students enrolled in the site in 2015–2016. We took these enrollment numbers from the sites’ stocktakes, data dashboards, and, for PPS only, the general fund budget. Although we know that student enrollments might have changed over the course of the initiative, particularly in the CMOs, we elected to keep the enrollment number constant so that per-pupil expenditures would be more comparable across years. In addition, for the per-pupil expenditures across the entire grant period, we did not have data allowing us to calculate the number of unique students in each site over the whole grant period. For the sake of simplicity, we elected to use the final-year (2015–2016) enrollment.
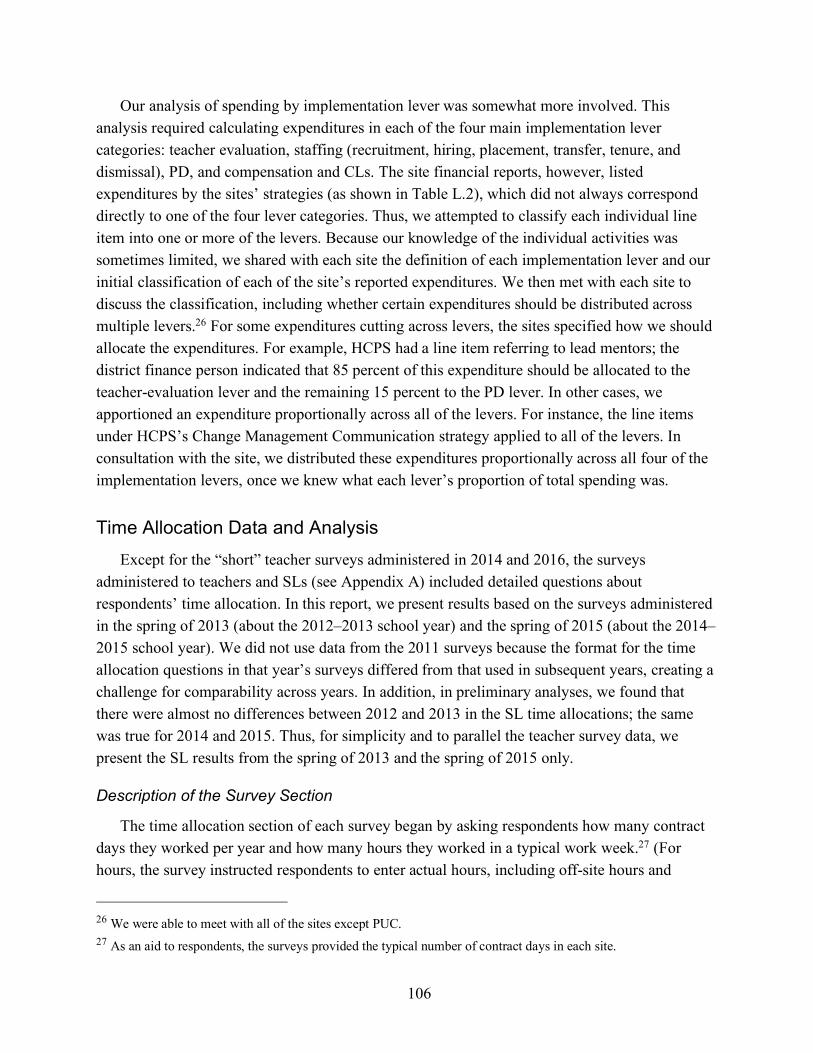
106
Our analysis of spending by implementation lever was somewhat more involved. This analysis required calculating expenditures in each of the four main implementation lever categories: teacher evaluation, staffing (recruitment, hiring, placement, transfer, tenure, and dismissal), PD, and compensation and CLs. The site financial reports, however, listed expenditures by the sites’ strategies (as shown in Table L.2), which did not always correspond directly to one of the four lever categories. Thus, we attempted to classify each individual line item into one or more of the levers. Because our knowledge of the individual activities was sometimes limited, we shared with each site the definition of each implementation lever and our initial classification of each of the site’s reported expenditures. We then met with each site to discuss the classification, including whether certain expenditures should be distributed across multiple levers.26 For some expenditures cutting across levers, the sites specified how we should allocate the expenditures. For example, HCPS had a line item referring to lead mentors; the district finance person indicated that 85 percent of this expenditure should be allocated to the teacher-evaluation lever and the remaining 15 percent to the PD lever. In other cases, we apportioned an expenditure proportionally across all of the levers. For instance, the line items under HCPS’s Change Management Communication strategy applied to all of the levers. In consultation with the site, we distributed these expenditures proportionally across all four of the implementation levers, once we knew what each lever’s proportion of total spending was.
Time Allocation Data and Analysis Except for the “short” teacher surveys administered in 2014 and 2016, the surveys
administered to teachers and SLs (see Appendix A) included detailed questions about respondents’ time allocation. In this report, we present results based on the surveys administered in the spring of 2013 (about the 2012–2013 school year) and the spring of 2015 (about the 2014–2015 school year). We did not use data from the 2011 surveys because the format for the time allocation questions in that year’s surveys differed from that used in subsequent years, creating a challenge for comparability across years. In addition, in preliminary analyses, we found that there were almost no differences between 2012 and 2013 in the SL time allocations; the same was true for 2014 and 2015. Thus, for simplicity and to parallel the teacher survey data, we present the SL results from the spring of 2013 and the spring of 2015 only.
Description of the Survey Section
The time allocation section of each survey began by asking respondents how many contract days they worked per year and how many hours they worked in a typical work week.27 (For hours, the survey instructed respondents to enter actual hours, including off-site hours and
26 We were able to meet with all of the sites except PUC. 27 As an aid to respondents, the surveys provided the typical number of contract days in each site.

107
weekend hours, rather than contract hours.) The survey then presented a detailed list of specific activities and asked respondents to report the hours (either per week or per year, whichever they preferred for each activity) they spent on each activity. The teacher survey asked about 39 specific activities, grouped into the following categories:
• classroom instruction during the regular school year (two activities) • noninstructional contact with students and contact with families (three activities) • PD received (11 activities) • participating in activities related to the respondent’s own performance evaluation (three
activities) • serving as a formal or informal mentor, instructional coach, or PD provider (four
activities) • observing teachers for the purpose of their formal evaluation (five activities, seen only if
the respondent had reported earlier in the survey that he or she evaluated other teachers) • general administrative, nonteaching activities (six activities) • participating in activities related to district reform initiatives (two activities) • planning and preparation for the classes the respondent taught (three activities).
In a separate section, the teacher survey also asked the respondent about the amount of time he or she had spent the previous summer (before the current school year) on activities related to his or her job as a teacher, such as planning and attending training or other PD.
Similarly, the SL survey asked SLs to “provide your best estimate of hours you spend” on each of 30 activities, grouped as follows:
• PD received (six activities) • PD provided for staff (three activities) • observation and evaluation of teachers and other staff (five activities) • administrative duties and activities (nine activities) • recruitment and hiring (three activities) • classroom instruction and related preparation duties (two items, seen only if the
respondent had reported earlier in the survey that he or she had official teaching responsibilities)
• district reform initiative activities (two activities).
Data Cleaning and Processing
Before conducting our analyses, we cleaned and processed the data. First, for teachers only, we checked the total amount of time they reported spending teaching in relation to total hours worked. In particular, we found that some teachers who reported working at least 35 hours during a typical week reported teaching less than seven hours during a regular week.28 We concluded that these teachers likely mistakenly entered daily, instead of weekly, hours for time
28 We restricted this analysis to teachers who filled regular teaching roles—that is, those who indicated that they were “regular education teachers” who either “taught a single group of students all or most of the day in multiple subject areas” or “several classes of different students during the day in a particular subject or two subjects.”

108
spent teaching. We thus multiplied their instructional hours by 5 to create a number of weekly hours.
Second (or first, for SLs), we calculated weekly hours spent on each activity. This was straightforward when a respondent entered the time as a per-week total; when a respondent instead entered time as a per-year total, we used the reported number of contracted workdays to convert, for each activity, the yearly hours into weekly hours. (We also factored in teachers’ summer hours.) We then summed the weekly hours across all activities and checked to see how closely this cross-activity sum matched the total amount of time the respondent reported working in a week. Although the survey instructed respondents to attempt to make the two amounts of time match, we nevertheless found some discrepancies. We assumed that the reported total number of weekly hours worked was likely to be more accurate than the sum of the reported hours worked on each of the individual activities, so we used the reported total weekly hours in our analyses rather than the sum of hours across activities. In particular, we calculated the percentage of weekly hours spent on the various activities and then multiplied the percentage of time for each activity by the total number of reported weekly hours. In other words, we created a revised weekly total of hours per activity that preserved the relative proportions of time spent on each activity but rescaled the hours themselves to sum to the total number of reported weekly hours.
Requirements for Inclusion in Analysis
To be included in the analysis, a respondent had to complete the time allocation section of the survey, particularly the time worked for each regular school day activity. We included in the sample any respondent who did not report the total time worked during the regular school year if he or she reported the time for each activity; for these respondents, we imputed total time per week using the sum of time across activities. In addition, we dropped from the analysis any respondent who had outlying values on the sum of his or her regular school year hours across all activities; we defined outliers as those whose sum fell outside the outer fences (the 25th percentile minus three times the interquartile range and the 75th percentile plus three times the interquartile range). We also dropped any teacher survey on which the respondent reported working less than 11 hours per week and any SL survey on which the respondent reported working less than ten hours per week.
Analytic Samples
Table L.3 provides the number of teachers and SLs we excluded from the analysis and the summary statistics for the final samples. Table L.4 shows the final sample sizes, by site.

109
Table L.3. Detailed Description of SL and Teacher Survey Sample Exclusions for the Time Allocation Analysis
Survey
Number of Surveys
Final Sample Size
Total Weekly Hours
Responding
Missing Time
Allocation Dataa
(Dropped)
Low Hour Outliersb (Dropped)
High Hour Outliersc (Dropped) Mean SD Min Max
Teacher
2012–2013
3,602 140 41 102 3,319 56.0 12.2 11 100
2014–2015
3,625 226 40 82 3,277 56.6 13.3 12 100
School leader
2012–2013
845 41 6 43 755 58.0 13.8 8 220
2014–2015
836 57 10 36 733 59.7 22.2 7 375
SOURCES: Teacher and SL surveys from the springs of 2013 and 2015. NOTE: Numbers and hours are unweighted. a We excluded from the sample any respondent who did not report time worked for each regular school day activity. b We excluded from the sample any respondent who reported weekly hours below the value of the lower fence (the 25th percentile minus three times the interquartile range). In addition, we excluded from the sample any teacher who reported working less than 11 hours per week and any SL who reported working less than ten hours per week. c We excluded from the sample any respondent with weekly hours larger than the value of the outer fence (the 75th percentile plus three times the interquartile range). For teachers, the outer fence was 136 hours in 2012–2013 and 139 hours in 2014–2015. For SLs, the outer fence was 118 hours in 2012–2013 and 128 hours in 2014–2015.
Table L.4. Final Sample Sizes, by Site
Site
Teachers in Sample SLs in Sample
2012–2013 2014–2015 2014–2015 2014–2015 District 2,437 2,337 653 624
HCPS 966 944 423 389
PPS 543 538 53 50
SCS 928 855 177 185
CMO 882 940 102 109 Alliance 294 334 28 39
Aspire 270 255 29 28
Green Dot 194 212 29 28
PUC 124 139 16 14
Total 3,319 3,277 755 733
SOURCES: Teacher and SL surveys from the springs of 2013 and 2015.

110
Estimation of the Value of Teacher and SL Time Spent on Evaluation Activities
Data
The RAND data team collected individual-level 2014–2015 compensation data from the sites and provided them, deidentified, to us for all teachers and SLs in each site. The data contained fields for several different types of compensation, including base salary, benefits, and bonuses; these are all the types of compensation included:29
• base salary • medical and health benefits • retirement systems • sick-pay sources • life insurance benefits • performance, including bonuses • teacher reimbursements and stipends • paid time off, including holiday and vacation • disability benefits • overtime • instruction beyond the normal school day or school year • teaching workshops • adjustments and differentials • summer teaching and activities • substitute-related activities • extracurricular activities, including athletics and clubs • TIF • other.
We calculated each individual’s overall compensation by summing across all the types of compensation.
Data Analysis
We created our teacher analysis sample based on the following criteria: Total compensation had to be between $15,000 and $150,000. We assumed that teachers whose compensation was not in this range were highly atypical and should not be included in our compensation analyses. For SLs, we did not find any substantially low or high values, so we did not exclude any observations.30
29 Compensation data are from FY 2015. 30 SLs’ total compensation ranged from $53,000 to $275,000.
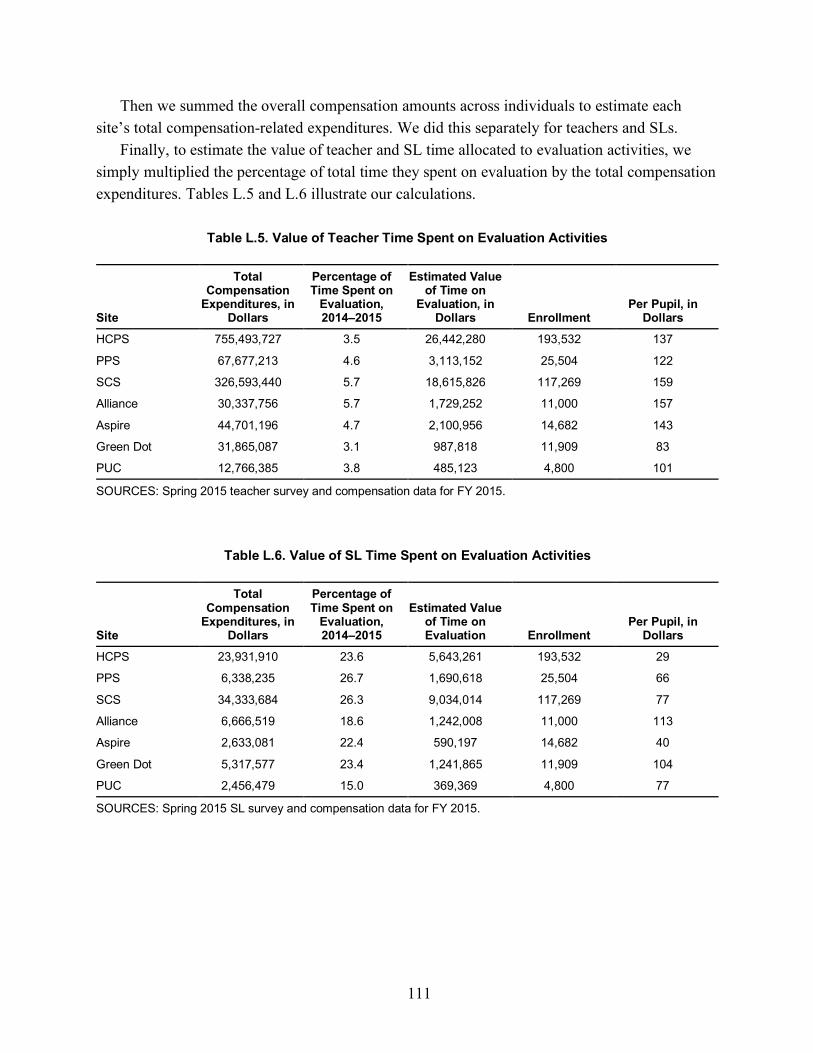
111
Then we summed the overall compensation amounts across individuals to estimate each site’s total compensation-related expenditures. We did this separately for teachers and SLs.
Finally, to estimate the value of teacher and SL time allocated to evaluation activities, we simply multiplied the percentage of total time they spent on evaluation by the total compensation expenditures. Tables L.5 and L.6 illustrate our calculations.
Table L.5. Value of Teacher Time Spent on Evaluation Activities
Site
Total Compensation Expenditures, in
Dollars
Percentage of Time Spent on Evaluation, 2014–2015
Estimated Value of Time on
Evaluation, in Dollars Enrollment
Per Pupil, in Dollars
HCPS 755,493,727 3.5 26,442,280 193,532 137
PPS 67,677,213 4.6 3,113,152 25,504 122
SCS 326,593,440 5.7 18,615,826 117,269 159
Alliance 30,337,756 5.7 1,729,252 11,000 157
Aspire 44,701,196 4.7 2,100,956 14,682 143
Green Dot 31,865,087 3.1 987,818 11,909 83
PUC 12,766,385 3.8 485,123 4,800 101
SOURCES: Spring 2015 teacher survey and compensation data for FY 2015.
Table L.6. Value of SL Time Spent on Evaluation Activities
Site
Total Compensation Expenditures, in
Dollars
Percentage of Time Spent on Evaluation, 2014–2015
Estimated Value of Time on Evaluation Enrollment
Per Pupil, in Dollars
HCPS 23,931,910 23.6 5,643,261 193,532 29
PPS 6,338,235 26.7 1,690,618 25,504 66
SCS 34,333,684 26.3 9,034,014 117,269 77
Alliance 6,666,519 18.6 1,242,008 11,000 113
Aspire 2,633,081 22.4 590,197 14,682 40
Green Dot 5,317,577 23.4 1,241,865 11,909 104
PUC 2,456,479 15.0 369,369 4,800 77
SOURCES: Spring 2015 SL survey and compensation data for FY 2015.

113
Appendix M. Additional Exhibits for Chapter Nine
Table M.1. Teacher Time Allocation Mean Percentages, by Site
Site Construct 2013 2015 Difference HCPS Classroom instruction 51 51 0
Instructional planning 21 21 0 Administration 4 4 0 Contact with students and families 8 8 –1 PD 12 12 0 Mentoring and evaluation 3 4 0 Reform 1 1 0
PPS Classroom instruction 46 46 0 Instructional planning 22 23 1 Administration 5 5 0 Contact with students and families 9 9 0 PD 12 12 0 Mentoring and evaluation 5 5 –1 Reform 1 1 0a
SCS Classroom instruction 51 50 –1 Instructional planning 17 18 1 Administration 4 4 0 Contact with students and families 10 9 –1 PD 13 13 0 Mentoring and evaluation 4 6 1a Reform 1 1 0
Alliance Classroom instruction 51 49 –2a Instructional planning 22 21 –1 Administration 4 4 0 Contact with student and families 6 6 0 PD 13 14 1 Mentoring and evaluation 4 6 2a Reform 0 0 0
Aspire Classroom instruction 46 47 1 Instructional planning 28 22 –6a Administration 5 5 1 Contact with student and families 6 7 1a PD 11 14 3a
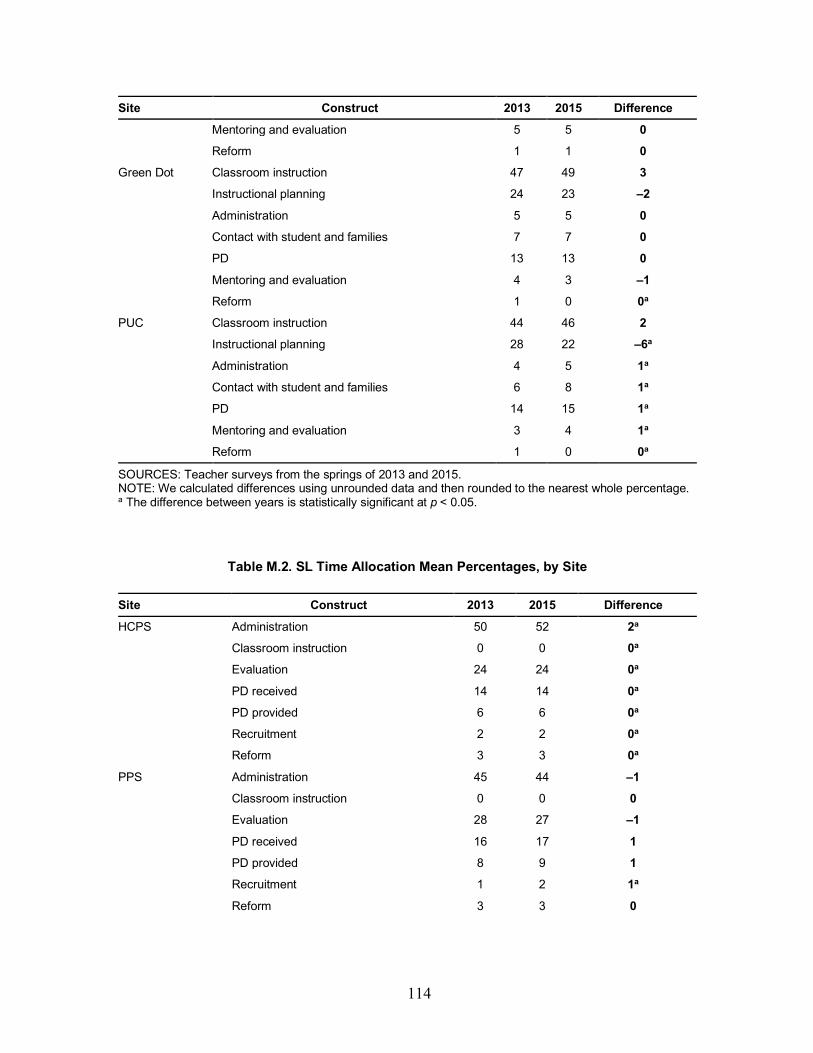
114
Site Construct 2013 2015 Difference Mentoring and evaluation 5 5 0 Reform 1 1 0
Green Dot Classroom instruction 47 49 3 Instructional planning 24 23 –2 Administration 5 5 0 Contact with student and families 7 7 0 PD 13 13 0 Mentoring and evaluation 4 3 –1 Reform 1 0 0a
PUC Classroom instruction 44 46 2 Instructional planning 28 22 –6a Administration 4 5 1a Contact with student and families 6 8 1a PD 14 15 1a Mentoring and evaluation 3 4 1a Reform 1 0 0a
SOURCES: Teacher surveys from the springs of 2013 and 2015. NOTE: We calculated differences using unrounded data and then rounded to the nearest whole percentage. a The difference between years is statistically significant at p < 0.05.
Table M.2. SL Time Allocation Mean Percentages, by Site
Site Construct 2013 2015 Difference HCPS Administration 50 52 2a
Classroom instruction 0 0 0a Evaluation 24 24 0a PD received 14 14 0a PD provided 6 6 0a Recruitment 2 2 0a Reform 3 3 0a
PPS Administration 45 44 –1 Classroom instruction 0 0 0 Evaluation 28 27 –1 PD received 16 17 1 PD provided 8 9 1 Recruitment 1 2 1a Reform 3 3 0
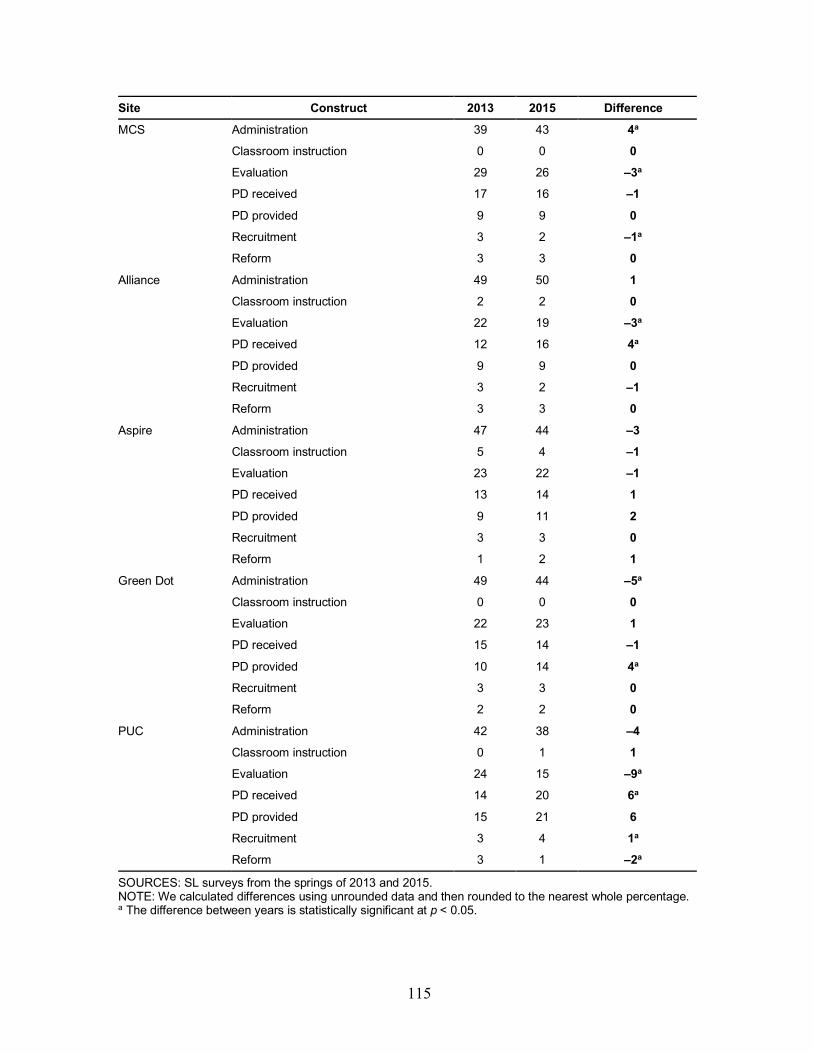
115
Site Construct 2013 2015 Difference MCS Administration 39 43 4a
Classroom instruction 0 0 0 Evaluation 29 26 –3a PD received 17 16 –1 PD provided 9 9 0 Recruitment 3 2 –1a Reform 3 3 0
Alliance Administration 49 50 1 Classroom instruction 2 2 0 Evaluation 22 19 –3a PD received 12 16 4a PD provided 9 9 0 Recruitment 3 2 –1 Reform 3 3 0
Aspire Administration 47 44 –3 Classroom instruction 5 4 –1 Evaluation 23 22 –1 PD received 13 14 1 PD provided 9 11 2 Recruitment 3 3 0 Reform 1 2 1
Green Dot Administration 49 44 –5a Classroom instruction 0 0 0 Evaluation 22 23 1 PD received 15 14 –1 PD provided 10 14 4a Recruitment 3 3 0 Reform 2 2 0
PUC Administration 42 38 –4 Classroom instruction 0 1 1 Evaluation 24 15 –9a PD received 14 20 6a PD provided 15 21 6 Recruitment 3 4 1a Reform 3 1 –2a
SOURCES: SL surveys from the springs of 2013 and 2015. NOTE: We calculated differences using unrounded data and then rounded to the nearest whole percentage. a The difference between years is statistically significant at p < 0.05.
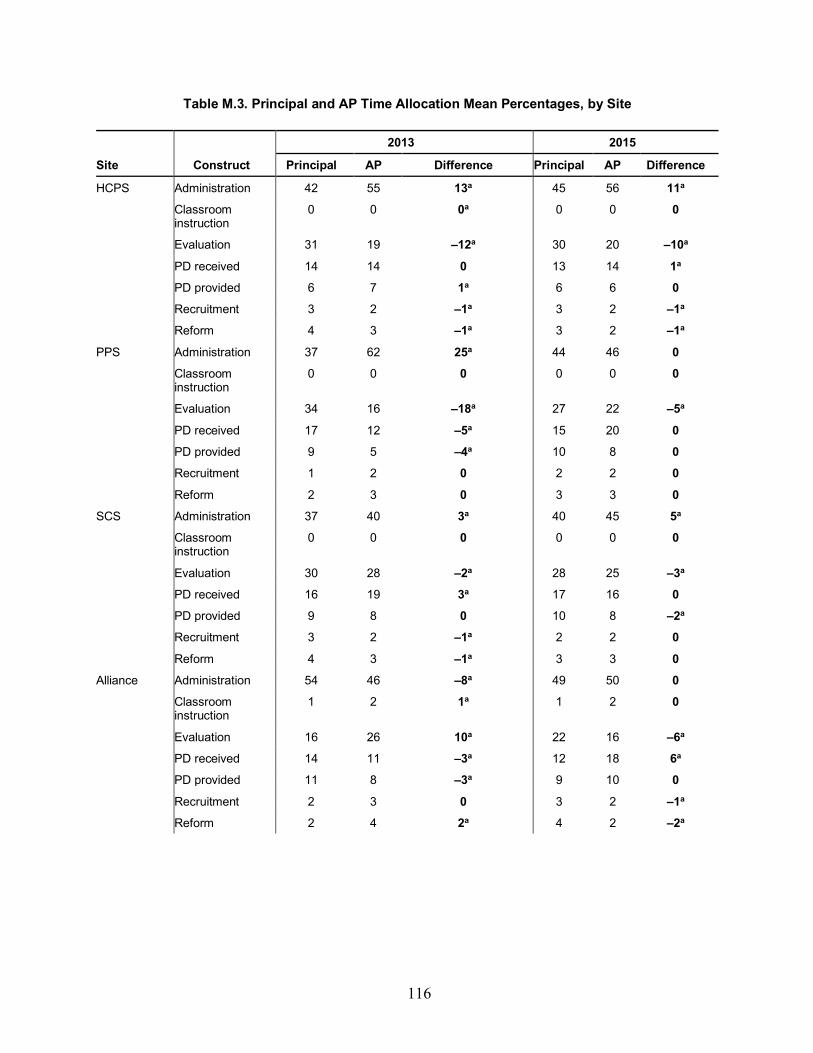
116
Table M.3. Principal and AP Time Allocation Mean Percentages, by Site
Site Construct
2013 2015
Principal AP Difference Principal AP Difference
HCPS Administration 42 55 13a 45 56 11a Classroom instruction
0 0 0a 0 0 0
Evaluation 31 19 –12a 30 20 –10a PD received 14 14 0 13 14 1a PD provided 6 7 1a 6 6 0 Recruitment 3 2 –1a 3 2 –1a Reform 4 3 –1a 3 2 –1a
PPS Administration 37 62 25a 44 46 0 Classroom instruction
0 0 0 0 0 0
Evaluation 34 16 –18a 27 22 –5a PD received 17 12 –5a 15 20 0 PD provided 9 5 –4a 10 8 0 Recruitment 1 2 0 2 2 0 Reform 2 3 0 3 3 0
SCS Administration 37 40 3a 40 45 5a Classroom instruction
0 0 0 0 0 0
Evaluation 30 28 –2a 28 25 –3a PD received 16 19 3a 17 16 0 PD provided 9 8 0 10 8 –2a Recruitment 3 2 –1a 2 2 0 Reform 4 3 –1a 3 3 0
Alliance Administration 54 46 –8a 49 50 0 Classroom instruction
1 2 1a 1 2 0
Evaluation 16 26 10a 22 16 –6a PD received 14 11 –3a 12 18 6a PD provided 11 8 –3a 9 10 0 Recruitment 2 3 0 3 2 –1a Reform 2 4 2a 4 2 –2a
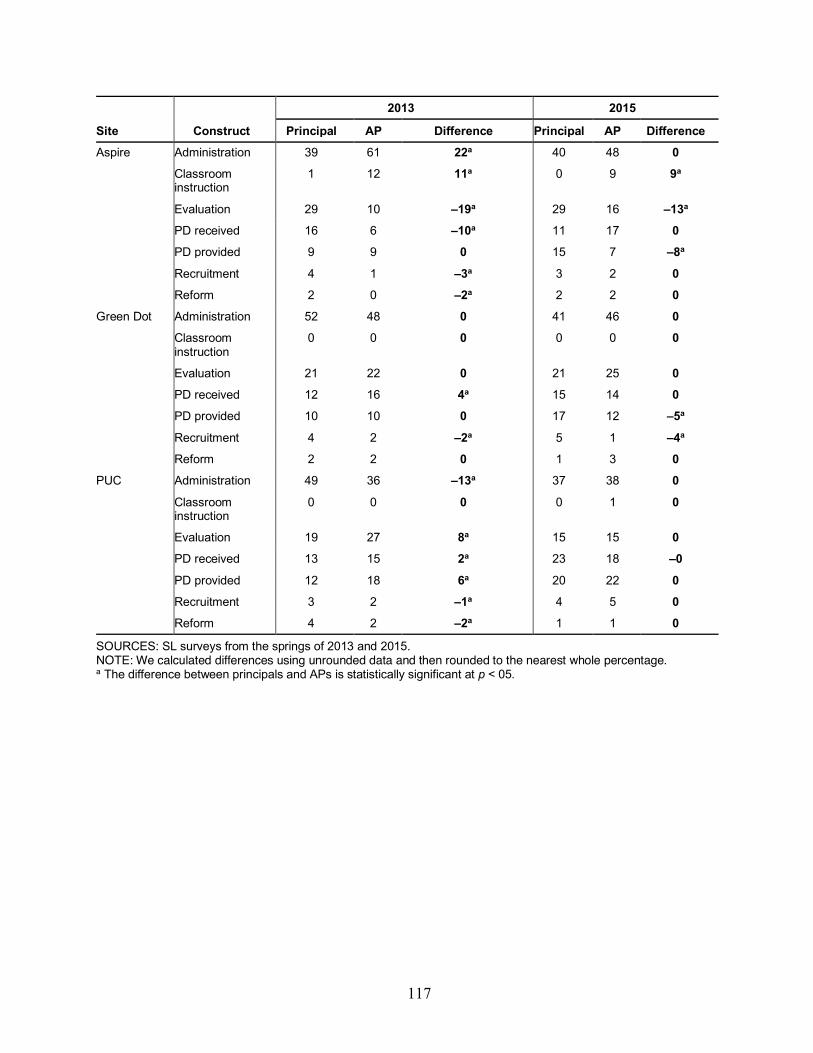
117
Site Construct
2013 2015
Principal AP Difference Principal AP Difference Aspire Administration 39 61 22a 40 48 0
Classroom instruction
1 12 11a 0 9 9a
Evaluation 29 10 –19a 29 16 –13a PD received 16 6 –10a 11 17 0 PD provided 9 9 0 15 7 –8a Recruitment 4 1 –3a 3 2 0 Reform 2 0 –2a 2 2 0
Green Dot Administration 52 48 0 41 46 0 Classroom instruction
0 0 0 0 0 0
Evaluation 21 22 0 21 25 0 PD received 12 16 4a 15 14 0 PD provided 10 10 0 17 12 –5a Recruitment 4 2 –2a 5 1 –4a Reform 2 2 0 1 3 0
PUC Administration 49 36 –13a 37 38 0 Classroom instruction
0 0 0 0 1 0
Evaluation 19 27 8a 15 15 0 PD received 13 15 2a 23 18 –0 PD provided 12 18 6a 20 22 0 Recruitment 3 2 –1a 4 5 0 Reform 4 2 –2a 1 1 0
SOURCES: SL surveys from the springs of 2013 and 2015. NOTE: We calculated differences using unrounded data and then rounded to the nearest whole percentage. a The difference between principals and APs is statistically significant at p < 05.


119
Appendix N. Additional Exhibits for Chapter Ten
This appendix presents additional information about trends in the effectiveness (measured in terms of both VAM score and composite TE level) of experienced teachers for each of the sites, supplementing the analysis presented in Chapter Ten of the effectiveness of newly hired teachers. We examine the trends in the VAM scores and composite TE levels of experienced teachers as a check on potential drift in composite TE measures of new teachers. We adjusted VAM scores based on state NAEP performance trends to make them equivalent across states and over time. If the changes in the composite TE levels of new hires parallel changes of more-experienced teachers, there are two possible explanations: (1) a drift in the composite TE measure that does not reflect true improvement or (2) an increase in composite TE for all existing teachers and an improvement in teacher-preparation programs such that new teachers are also more effective over time. This comparison facilitates the analysis of whether the changes in hiring policies resulted in true improvements in the effectiveness of new hires.
HCPS Figure N.1 shows the trends in the VAM scores and composite TE levels of middle-
experience teachers (those with three to five years of experience) in HCPS. By VAM score, the distributions are generally as expected until 2014–2015, when the percentage of middle-experience teachers in the bottom 20 percent of the VAM distribution increased and the percentage in the middle 60 percent decreased. Alternatively, by composite TE level, we see a general decrease in the proportion of middle-TE teachers and an increase in the proportion of high-TE teachers (those with six or more years of experience) over time.
Figure N.1. HCPS Middle-Experience Effectiveness, by VAM Score and Composite TE Level
020
4060
8010
0Pe
rcen
t
2007-08 2008-09 2009-10 2010-11 2011-12 2012-13 2013-14 2014-15
VAM of Teachers with 3-5 Yrs Experience
Bottom 20% Middle Top 20%
020
4060
8010
0Pe
rcen
t
2010-11 2011-12 2012-13 2013-14 2014-15
TE of Teachers with 3-5 Yrs Experience
Low TE Mid TE High TE

120
Figure N.2 shows the trends in the VAM scores and composite TE levels of high-experience teachers in HCPS. By VAM score, the distributions are as expected throughout the period. Alternatively, by composite TE, we see a general decrease in the proportion of middle-TE teachers and an increase in the proportion of high-TE teachers over time.
Figure N.2. HCPS High-Experience Effectiveness, by VAM Score and Composite TE Level
The stability of VAM scores for middle- and high-experience teachers, combined with the improvement of composite TE for these same two groups, suggests that there is upward drift in the composite TE ratings for these groups. This is similar to the measurement drift observed among new hires in Figure 10.5 in Chapter Ten.
PPS Figure N.3 shows the trends in the VAM scores and composite TE levels of middle-
experience teachers in PPS. By VAM score, the distributions are variable but without a consistent pattern. Alternatively, by composite TE, we see a general decrease in the proportion of low- and middle-TE teachers and an increase in the proportion of high-TE teachers over time.
020
4060
8010
0Pe
rcen
t
2007-08 2008-09 2009-10 2010-11 2011-12 2012-13 2013-14 2014-15
VAM of Teachers with 6+ Yrs Experience
Bottom 20% Middle Top 20%0
2040
6080
100
Perc
ent
2010-11 2011-12 2012-13 2013-14 2014-15
TE of Teachers with 6+ Yrs Experience
Low TE Mid TE High TE

121
Figure N.3. PPS Middle-Experience Effectiveness, by VAM Score and Composite TE Level
Figure N.4 shows the trends in the VAM scores and composite TE levels of high-experience teachers in PPS. By VAM score, the distributions are as expected throughout the period. Alternatively, by composite TE, we see a general decrease in the proportion of middle-TE teachers and an increase in the proportion of high-TE teachers over time.
Figure N.4. PPS High-Experience Effectiveness, by VAM Score and Composite TE Level
VAM score stability for middle- and high-experience teachers, combined with the improvement of composite TE for these same two groups, suggests that there is upward drift in the composite TE ratings for these groups. This is similar to the measurement drift observed among new hires in Figure 10.6 in Chapter Ten.
SCS Figure N.5 shows the trends in the VAM scores and composite TE levels of middle-
experience teachers in SCS. By VAM score, the distributions are consistent and as expected, with an increase in the percentage of middle-experience teachers in the top 20 percent of the
020
4060
8010
0Pe
rcen
t
2007-08 2008-09 2009-10 2010-11 2011-12 2012-13 2013-14 2014-15
VAM of Teachers with 3-5 Yrs Experience
Bottom 20% Middle Top 20%
020
4060
8010
0Pe
rcen
t
2011-12 2012-13 2013-14 2014-15
TE of Teachers with 3-5 Yrs Experience
Low TE Mid TE High TE
020
4060
8010
0Pe
rcen
t
2007-08 2008-09 2009-10 2010-11 2011-12 2012-13 2013-14 2014-15
VAM of Teachers with 6+ Yrs Experience
Bottom 20% Middle Top 20%
020
4060
8010
0Pe
rcen
t
2011-12 2012-13 2013-14 2014-15
TE of Teachers with 6+ Yrs Experience
Low TE Mid TE High TE

122
VAM score distribution in 2014–2015. By composite TE, we see an earlier increase in the proportion of high-TE teachers accompanied by a decrease in the proportion of low- and middle-TE teachers over time.
Figure N.5. SCS Middle-Experience Effectiveness, by VAM Score and Composite TE Level
Figure N.6 shows the trends in the VAM scores and composite TE levels of high-experience teachers in SCS. By VAM score, the distributions are as expected throughout the period. Alternatively, by composite TE, we see a general decrease in the proportion of middle- and low-TE teachers and an increase in the proportion of high-TE teachers over time.
Figure N.6. SCS High-Experience Effectiveness, by VAM Score and Composite TE Level
VAM score stability for middle- and high-experience teachers, combined with the early improvement of composite TE for these same two groups, suggests that there is upward drift in the composite TE ratings for these groups.
020
4060
8010
0Pe
rcen
t
2008-09 2009-10 2010-11 2011-12 2012-13 2013-14 2014-15
VAM of Teachers with 3-5 Yrs Experience
Bottom 20% Middle Top 20%0
2040
6080
100
Perc
ent
2011-12 2012-13 2013-14 2014-15
TE of Teachers with 3-5 Yrs Experience
Low TE Mid TE High TE
020
4060
8010
0Pe
rcen
t
2008-09 2009-10 2010-11 2011-12 2012-13 2013-14 2014-15
VAM of Teachers with 6+ Yrs Experience
Bottom 20% Middle Top 20%
020
4060
8010
0Pe
rcen
t
2011-12 2012-13 2013-14 2014-15
TE of Teachers with 6+ Yrs Experience
Low TE Mid TE High TE

123
Alliance Figure N.7 shows the trends in the composite TE levels of middle-experience teachers in
Alliance. We see a decrease in the proportion of low- and middle-TE teachers accompanied by an increase in the proportion of high-TE teachers over time.
Figure N.7. Alliance Middle-Experience Effectiveness, by Composite TE Level
Figure N.8 shows the trends in the composite TE levels of high-experience teachers in Alliance. None of these teachers was in the low-TE category. Also, we see a decrease in the proportion of middle-TE teachers accompanied by an increase in the proportion of high-TE teachers over time.
Figure N.8. Alliance High-Experience Effectiveness, by Composite TE Level
Without VAM scores, the conclusions that we can draw are limited. However, the level of turnover among middle- and high-experience teachers does not appear to be sufficient to explain
020
4060
8010
0Pe
rcen
t
2011-12 2012-13 2013-14 2014-15
TE of Teachers with 3-5 Yrs Experience
Low TE Mid TE High TE
020
4060
8010
0Pe
rcen
t
2011-12 2012-13 2013-14 2014-15
TE of Teachers with 6+ Yrs Experience
Low TE Mid TE High TE

124
the growth in the composite TE levels. Consequently, these results suggest that there is upward drift in the composite TE levels for these groups similar to the upward drift in the composite TE levels of new hires seen in Figure 10.8.
Aspire Figure N.9 shows the trends in the VAM scores and composite TE levels of middle-
experience teachers in Aspire. By VAM score, the distributions are relatively consistent and as expected (with greater variance than the districts due to sample size). We observe a slight increase in the percentage of middle-experience teachers in the top 20 percent of the VAM score distribution in 2013–2015. By composite TE level, we see an earlier increase in the proportion of high-TE teachers accompanied by a decrease in the proportion of low- and middle-TE teachers over time.
Figure N.9. Aspire Middle-Experience Effectiveness, by VAM Score and Composite TE Level
Figure N.10 shows the trends in the VAM scores and composite TE levels of high-experience teachers in Aspire. By VAM score, the distributions are highly variable, which is expected given the sample sizes. However, we observe a decrease in the percentage of high-experience teachers in the bottom 20 percent of the VAM score distribution over time and an accompanying increase in the percentage of teachers in the top 20 percent of the distribution. as expected throughout the period. We also see a decrease in the proportion of middle-TE teachers and an increase in the proportion of high-TE teachers over time.
020
4060
8010
0Pe
rcen
t
2008-09 2009-10 2010-11 2011-12 2012-13 2013-14
VAM of Teachers with 3-5 Yrs Experience
Bottom 20% Middle Top 20%
020
4060
8010
0Pe
rcen
t
2011-12 2012-13 2013-14 2014-15
TE of Teachers with 3-5 Yrs Experience
Low TE Mid TE High TE

125
Figure N.10. Aspire High-Experience Effectiveness, by VAM Score and Composite TE Level
VAM score stability for middle-experience teachers, combined with the improvement of composite TE, suggests that there is upward drift in the composite TE levels for middle-experience teachers. However, the increase in VAM scores among high-experience teachers between 2008–2009 and 2013–2014 suggests that the increase in composite TE over the same period could reflect actual improvements in the effectiveness of high-experience teachers. This differs from the trend of less effective new hires observed in Figure 10.9 in Chapter Ten.
Green Dot Figure N.11 shows the trends in the composite TE levels of middle-experience teachers in
Green Dot. We see a decrease in the proportion of low- and middle-TE teachers accompanied by an increase in the proportion of high-TE teachers over time.
Figure N.11. Green Dot Middle-Experience Effectiveness, by Composite TE Level
020
4060
8010
0Pe
rcen
t
2008-09 2009-10 2010-11 2011-12 2012-13 2013-14
VAM of Teachers with 6+ Yrs Experience
Bottom 20% Middle Top 20%
020
4060
8010
0Pe
rcen
t
2011-12 2012-13 2013-14 2014-15
TE of Teachers with 6+ Yrs Experience
Low TE Mid TE High TE
020
4060
8010
0Pe
rcen
t
2011-12 2012-13 2013-14 2014-15
TE of Teachers with 3-5 Yrs Experience
Low TE Mid TE High TE

126
Figure N.12 shows the trends in the composite TE levels of high-experience teachers in Green Dot. None of these teachers was in the low-TE category. Also, we see a decrease in the proportion of middle-TE teachers accompanied by an increase in the proportion of high-TE teachers over time.
Figure N.12. Green Dot High-Experience Effectiveness, by Composite TE Level
Without VAM scores, the conclusions that we can draw are limited. However, the level of turnover among middle- and high-experience teachers does not appear to be sufficient to explain the growth in the composite TE levels. Consequently, these results suggest that there is upward drift in the composite TE levels for these groups similar to the drift observed among new hires in Figure 10.10 in Chapter Ten.
020
4060
8010
0Pe
rcen
t
2011-12 2012-13 2013-14 2014-15
TE of Teachers with 6+ Yrs Experience
Low TE Mid TE High TE
127
Appendix O. Estimating the Relationship Between TE and Retention: Analytic Methods for Chapter Eleven
Modeling Teacher Retention as a Function of Effectiveness The estimates presented in Chapter Eleven (specifically, Figures 11.8, 11.9, 11.12, 11.13,
11.16, 11.17, 11.20, 11.23, 11.24, and 11.27) and in Figures P.1 through P.6 in Appendix P result from modeling teacher retention as a function of TE (measured in terms of the site’s composite TE level or the study-calculated VAM score), controlling for the teacher’s age, teaching experience, educational attainment, gender, and race. This modeling conceptualizes teacher retention as responsive to effectiveness. Consequently, the estimates show the effect that composite TE levels and VAM scores measured in one year have on retention in the next year. Specifically, we regressed retention of teacher i in year t + 1, Rit + 1 on indicators of effectiveness from year t (E1it, E2it, and Eeit). We grouped effectiveness measures (composite TE levels and VAM scores) into three categories: E1it = 1 if the teacher received a low composite TE or VAM rating, E2it = 1 if the teacher received a middle composite TE or VAM rating, and E3it = 1 if the teacher received a high composite TE or VAM rating. We allowed the coefficients on E1it, E2it, and E3it to differ for each year. Additionally, we include a vector of control variables, including age, gender, race, educational attainment, and teaching experience, Xit. Furthermore, we centered each control variable in Xit by its annual mean and excluded the constant so that the coefficients β1t, β2t, and β3t give the expected retention likelihood for an average teacher of each effectiveness level and year. The following equation shows this specification:
We ran the models separately for each site. We used a linear probability model that avoids
bias introduced by model misspecification (i.e., arbitrarily assigning a distribution to the error terms). In Figures P.1 through P.6 in Appendix P, we plot the estimates of β1t, β2t, and β3t and their confidence intervals.
To examine and test whether composite TE levels or VAM scores had changed by the end of the study period, we estimated a more parsimonious model in which we grouped the years into three periods (pre-IP up through 2009–2010, early IP between 2010–2011 and 2012–2013, and late IP 2013–2014 onward). The model we estimated is similar to the previous model with the exception that, instead of years, t = 1,…,T, we use periods, p = 1,…,P. Again, we excluded the constant so that the coefficients β1p, β2p, and β3p give the expected retention likelihood for an
Rit+1 = Xitγ + β1t E1itt=1
T
∑ + β2t E 2itt=1
T
∑ + β3t E3itt=1
T
∑ + ε it .
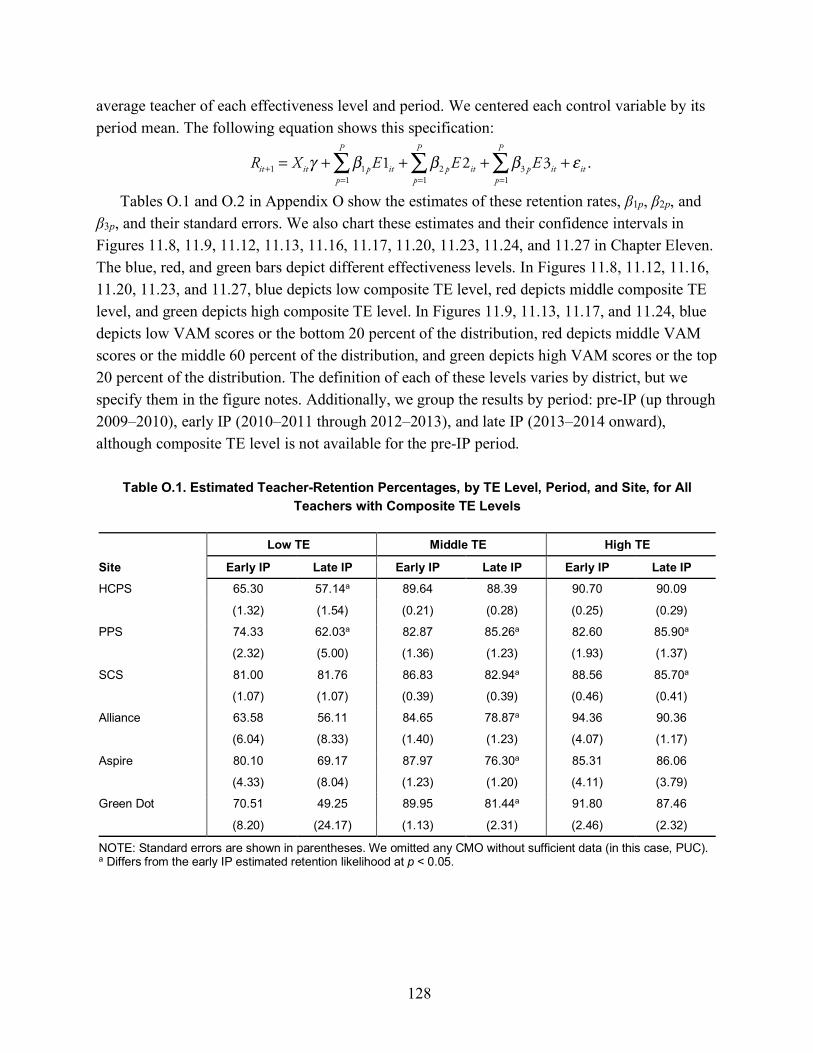
128
average teacher of each effectiveness level and period. We centered each control variable by its period mean. The following equation shows this specification:
Tables O.1 and O.2 in Appendix O show the estimates of these retention rates, β1p, β2p, and
β3p, and their standard errors. We also chart these estimates and their confidence intervals in Figures 11.8, 11.9, 11.12, 11.13, 11.16, 11.17, 11.20, 11.23, 11.24, and 11.27 in Chapter Eleven. The blue, red, and green bars depict different effectiveness levels. In Figures 11.8, 11.12, 11.16, 11.20, 11.23, and 11.27, blue depicts low composite TE level, red depicts middle composite TE level, and green depicts high composite TE level. In Figures 11.9, 11.13, 11.17, and 11.24, blue depicts low VAM scores or the bottom 20 percent of the distribution, red depicts middle VAM scores or the middle 60 percent of the distribution, and green depicts high VAM scores or the top 20 percent of the distribution. The definition of each of these levels varies by district, but we specify them in the figure notes. Additionally, we group the results by period: pre-IP (up through 2009–2010), early IP (2010–2011 through 2012–2013), and late IP (2013–2014 onward), although composite TE level is not available for the pre-IP period.
Table O.1. Estimated Teacher-Retention Percentages, by TE Level, Period, and Site, for All Teachers with Composite TE Levels
Site
Low TE Middle TE High TE
Early IP Late IP Early IP Late IP Early IP Late IP HCPS 65.30 57.14a 89.64 88.39 90.70 90.09
(1.32) (1.54) (0.21) (0.28) (0.25) (0.29)
PPS 74.33 62.03a 82.87 85.26a 82.60 85.90a
(2.32) (5.00) (1.36) (1.23) (1.93) (1.37)
SCS 81.00 81.76 86.83 82.94a 88.56 85.70a
(1.07) (1.07) (0.39) (0.39) (0.46) (0.41)
Alliance 63.58 56.11 84.65 78.87a 94.36 90.36
(6.04) (8.33) (1.40) (1.23) (4.07) (1.17)
Aspire 80.10 69.17 87.97 76.30a 85.31 86.06
(4.33) (8.04) (1.23) (1.20) (4.11) (3.79)
Green Dot 70.51 49.25 89.95 81.44a 91.80 87.46
(8.20) (24.17) (1.13) (2.31) (2.46) (2.32)
NOTE: Standard errors are shown in parentheses. We omitted any CMO without sufficient data (in this case, PUC). a Differs from the early IP estimated retention likelihood at p < 0.05.
Rit+1 = Xitγ + β1pE1itp=1
P
∑ + β2 pE 2itp=1
P
∑ + β3 pE3itp=1
P
∑ + ε it .
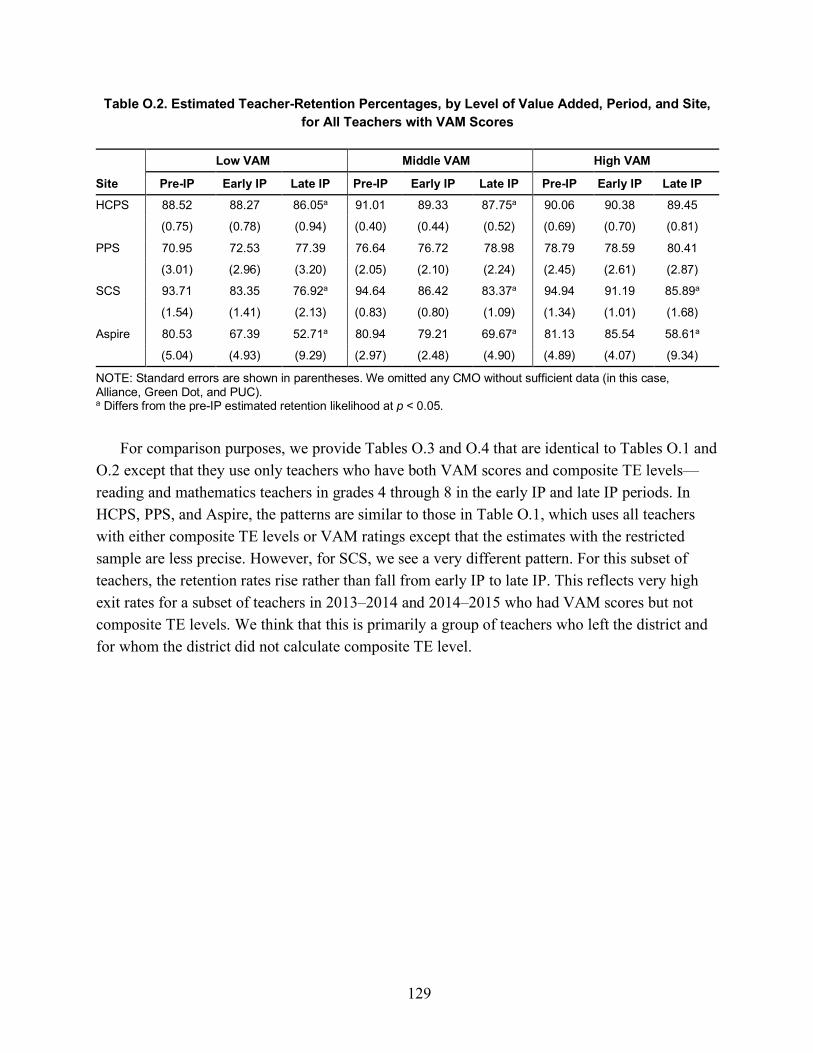
129
Table O.2. Estimated Teacher-Retention Percentages, by Level of Value Added, Period, and Site, for All Teachers with VAM Scores
Site
Low VAM Middle VAM High VAM
Pre-IP Early IP Late IP Pre-IP Early IP Late IP Pre-IP Early IP Late IP HCPS 88.52 88.27 86.05a 91.01 89.33 87.75a 90.06 90.38 89.45
(0.75) (0.78) (0.94) (0.40) (0.44) (0.52) (0.69) (0.70) (0.81)
PPS 70.95 72.53 77.39 76.64 76.72 78.98 78.79 78.59 80.41
(3.01) (2.96) (3.20) (2.05) (2.10) (2.24) (2.45) (2.61) (2.87)
SCS 93.71 83.35 76.92a 94.64 86.42 83.37a 94.94 91.19 85.89a
(1.54) (1.41) (2.13) (0.83) (0.80) (1.09) (1.34) (1.01) (1.68)
Aspire 80.53 67.39 52.71a 80.94 79.21 69.67a 81.13 85.54 58.61a
(5.04) (4.93) (9.29) (2.97) (2.48) (4.90) (4.89) (4.07) (9.34)
NOTE: Standard errors are shown in parentheses. We omitted any CMO without sufficient data (in this case, Alliance, Green Dot, and PUC). a Differs from the pre-IP estimated retention likelihood at p < 0.05.
For comparison purposes, we provide Tables O.3 and O.4 that are identical to Tables O.1 and
O.2 except that they use only teachers who have both VAM scores and composite TE levels—reading and mathematics teachers in grades 4 through 8 in the early IP and late IP periods. In HCPS, PPS, and Aspire, the patterns are similar to those in Table O.1, which uses all teachers with either composite TE levels or VAM ratings except that the estimates with the restricted sample are less precise. However, for SCS, we see a very different pattern. For this subset of teachers, the retention rates rise rather than fall from early IP to late IP. This reflects very high exit rates for a subset of teachers in 2013–2014 and 2014–2015 who had VAM scores but not composite TE levels. We think that this is primarily a group of teachers who left the district and for whom the district did not calculate composite TE level.

130
Table O.3. Estimated Teacher-Retention Percentages, by TE Level, Period, and Site, for All Teachers with Both Composite TE Levels and VAM Scores
Site
Low TE Middle TE High TE
Early IP Late IP Early IP Late IP Early IP Late IP HCPS 67.82 47.23a 89.91 88.62 90.88 89.05a
(3.64) (4.70) (0.47) (0.66) (0.51) (0.61)
PPS 68.03 62.36 84.07 84.60 85.03 85.86
(5.94) (11.08) (3.12) (2.83) (3.71) (3.25)
SCS 80.19 92.22a 87.55 95.64a 90.33 96.82a
(2.57) (2.01) (1.01) (0.73) (1.13) (0.71)
Aspire 89.28 61.56 87.06 69.05a 84.67 76.68
(4.45) (17.50) (2.54) (4.62) (8.28) (10.64)
NOTE: Standard errors are shown in parentheses. We omitted any CMO without sufficient data (in this case, Alliance, Green Dot, and PUC). a Differs from the early IP estimated retention likelihood at p < 0.05.
Table O.4. Estimated Teacher-Retention Percentages, by Level of Value Added, Period, and Site, for All Teachers with Both Composite TE Levels and VAM Scores
Site
Low VAM Middle VAM High VAM
Early IP Late IP Early IP Late IP Early IP Late IP HCPS 88.64 86.57 89.68 87.80a 90.47 88.67
(0.78) (1.04) (0.46) (0.59) (0.71) (0.95)
PPS 79.71 85.16 81.77 83.13 85.16 85.65
(4.14) (3.36) (3.31) (3.07) (3.57) (3.46)
SCS 83.99 93.85a 87.72 96.20a 90.81 95.65a
(1.79) (1.39) (0.98) (0.64) (1.32) (1.06)
Aspire 82.51 71.79 88.32 72.28a 87.22 60.09a
(6.24) (10.71) (2.57) (5.08) (4.51) (9.28)
NOTE: Standard errors are shown in parentheses. We omitted any CMO without sufficient data (in this case, Alliance, Green Dot, or PUC). a Differs from the early IP estimated retention likelihood at p < 0.05.
131
Appendix P. Additional Exhibits for Chapter Eleven
This appendix presents annual trends in teacher retention in the sites and a sensitivity check using two-year retention data.
Annual Trends in Retention Rates
HCPS
The left-hand side of Figure P.1 shows that, from 2010–2011 through 2014–2015, high-TE teachers were more likely than middle- and low-TE teachers to remain and that the likelihood remained relatively stable. The differences between high- and low-rated teachers are statistically significant for each year. On one hand, the retention of high-TE teachers and middle-TE teachers did not increase because of any actions that the district took during this period. On the other hand, the likelihood that low-TE teachers would remain teaching decreased over the period. We discuss dismissal-related policies in Chapter Five, and this decline in retention could have been related to those efforts. The largest year-to-year change occurred between 2010–2011 and 2011–2012, the point at which HCPS implemented a policy enabling effectiveness to be used as a basis for dismissal. The retention rate for low-TE teachers significantly decreased in 2014–2015, the point at which the full composite TE rating, using a three-year average of results, became available for use. Note that the confidence intervals for the low-TE estimates are much larger than those for middle- and high-TE. This is because the sample of low-TE teachers is smaller than for the other categories (see Figures 11.6 and 11.7 in Chapter Eleven).
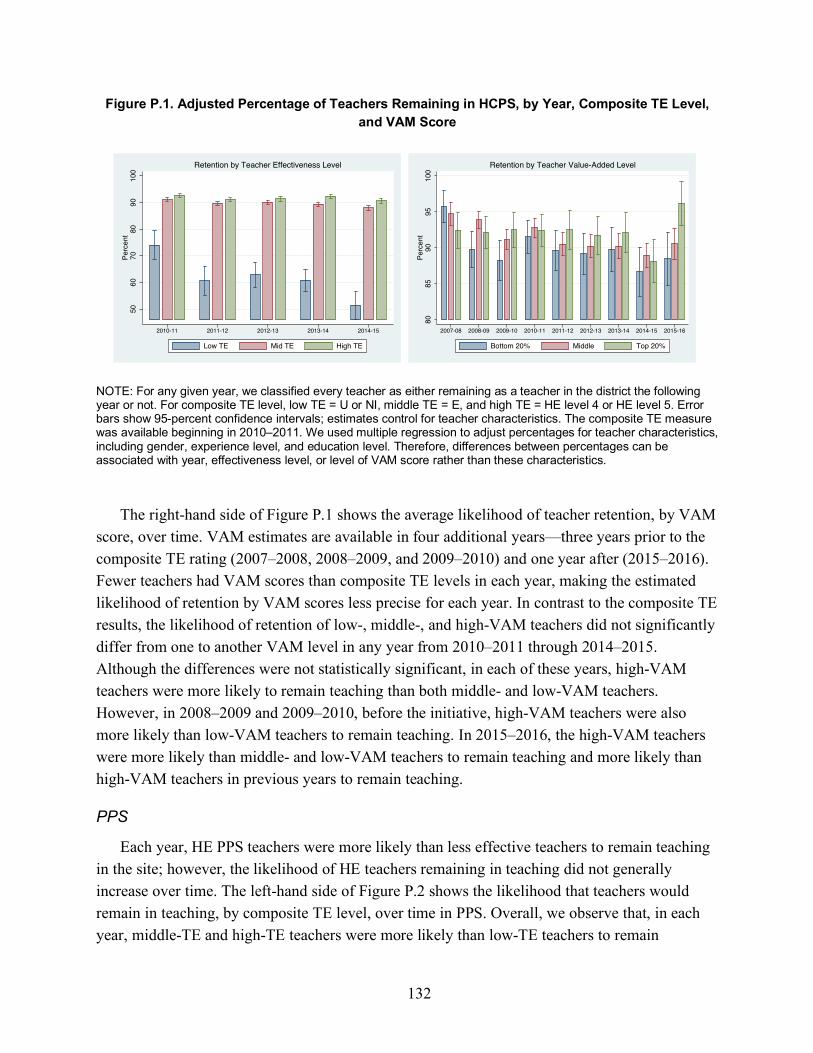
132
Figure P.1. Adjusted Percentage of Teachers Remaining in HCPS, by Year, Composite TE Level, and VAM Score
NOTE: For any given year, we classified every teacher as either remaining as a teacher in the district the following year or not. For composite TE level, low TE = U or NI, middle TE = E, and high TE = HE level 4 or HE level 5. Error bars show 95-percent confidence intervals;; estimates control for teacher characteristics. The composite TE measure was available beginning in 2010–2011. We used multiple regression to adjust percentages for teacher characteristics, including gender, experience level, and education level. Therefore, differences between percentages can be associated with year, effectiveness level, or level of VAM score rather than these characteristics.
The right-hand side of Figure P.1 shows the average likelihood of teacher retention, by VAM
score, over time. VAM estimates are available in four additional years—three years prior to the composite TE rating (2007–2008, 2008–2009, and 2009–2010) and one year after (2015–2016). Fewer teachers had VAM scores than composite TE levels in each year, making the estimated likelihood of retention by VAM scores less precise for each year. In contrast to the composite TE results, the likelihood of retention of low-, middle-, and high-VAM teachers did not significantly differ from one to another VAM level in any year from 2010–2011 through 2014–2015. Although the differences were not statistically significant, in each of these years, high-VAM teachers were more likely to remain teaching than both middle- and low-VAM teachers. However, in 2008–2009 and 2009–2010, before the initiative, high-VAM teachers were also more likely than low-VAM teachers to remain teaching. In 2015–2016, the high-VAM teachers were more likely than middle- and low-VAM teachers to remain teaching and more likely than high-VAM teachers in previous years to remain teaching.
PPS
Each year, HE PPS teachers were more likely than less effective teachers to remain teaching in the site; however, the likelihood of HE teachers remaining in teaching did not generally increase over time. The left-hand side of Figure P.2 shows the likelihood that teachers would remain in teaching, by composite TE level, over time in PPS. Overall, we observe that, in each year, middle-TE and high-TE teachers were more likely than low-TE teachers to remain
5060
7080
9010
0Pe
rcen
t
2010-11 2011-12 2012-13 2013-14 2014-15
Low TE Mid TE High TE
Retention by Teacher Effectiveness Level
8085
9095
100
Perc
ent
2007-08 2008-09 2009-10 2010-11 2011-12 2012-13 2013-14 2014-15 2015-16
Bottom 20% Middle Top 20%
Retention by Teacher Value-Added Level

133
teaching. These differences were statistically significant from 2012–2013 through 2014–2015. The likelihood that high-TE teachers would remain teaching significantly increased in 2012–2013 relative to 2011–2012. Additionally, beginning with 2013–2014, we observe a statistically significant decrease from 2011–2012 and 2012–2013 in the likelihood that low-TE teachers would remain in teaching. This could be driven by the 2013–2014 policy change to place low-TE teachers on improvement plans (see Chapter Five).
Figure P.2. Adjusted Percentage of Teachers Remaining in PPS, by Year, Composite TE Level, and VAM Score
NOTE: For any given year, we have classified every teacher as either remaining as a teacher in the district the following year or not. For composite TE level, low TE = F or NI, middle TE = P, and high TE = D. Error bars show 95-percent confidence intervals;; estimates control for teacher characteristics. We based TE results for 2011–2012 on a pilot version of PPS’s composite measure that was never shared with teachers or SLs;; the composite TE level became fully operational, with stakes attached, beginning in 2013–2014. We used multiple regression to adjust percentages for teacher characteristics, including gender, experience level, and education level. Therefore, differences between percentages can be associated with year, effectiveness level, or level of VAM score rather than these characteristics.
The right-hand side of Figure P.2 shows the likelihood of retention for PPS teachers, by
VAM level and year. The point estimates suggest that, in each year, high-VAM teachers were more likely than lower-VAM teachers to remain teaching in the district. However, because we could calculate VAM scores for only a small fraction of teachers in PPS, the estimates are imprecise, and it is difficult to discern any temporal patterns by year in retention among teachers in terms of VAM score. Retention of each type of teacher increased in later years, but the estimates do not indicate significantly different likelihood of retention. Additionally, we do not observe a decrease in the likelihood that low-VAM teachers remain teaching, in contrast to the decrease observed for low-TE teachers.
5060
7080
9010
0Pe
rcen
t
2011-12 2012-13 2013-14 2014-15
Low TE Mid TE High TE
Retention by Teacher Effectiveness Level
6070
8090
100
Perc
ent
2007-08 2008-09 2009-10 2010-11 2011-12 2012-13 2013-14 2014-15
Bottom 20% Middle Top 20%
Retention by Teacher Value-Added Level

134
SCS
HE teachers were more likely than less effective teachers to remain teaching in SCS in several of the years. The left-hand side of Figure P.3 shows changes in the retention likelihood, by composite TE level, over time in SCS. In each year except 2014–2015, middle- and high-TE teachers were significantly more likely than less effective teachers to remain teaching. The likelihood that low- and middle-TE teachers would remain as teachers in SCS decreased significantly in 2012–2013, increased substantially the next two years, and then plummeted in 2015–2016. This instability probably reflects the merger of legacy SCS and legacy MCS in June and July 2013 and the creation of the ASD. We know that these changes affected teachers’ career decisions to some degree. For example, during the 18-month merger negotiation, many teachers we interviewed reported feeling unsure about their job security following the merger. This perceived lack of security might have motivated many teachers, particularly low- and middle-TE teachers, to leave. We do not have good explanations for the other changes shown in Figure P.3.
Figure P.3. Adjusted Percentage of Teachers Remaining in SCS, by Year, Composite TE Level, and VAM Score
NOTE: For any given year, we have classified every teacher as either remaining as a teacher in the district the following year or not. For composite TE level, low = performing significantly below or below expectations, middle = meeting or performing above expectations, and high = performing significantly above expectations. Error bars show 95-percent confidence intervals;; estimates control for teacher characteristics. We have computed the composite TE level only since 2011–2012. We used multiple regression to adjust percentages for teacher characteristics, including gender, experience level, and education level. Therefore, differences between percentages can be associated with year, effectiveness level, or level of VAM score rather than these characteristics.
The right-hand side of Figure P.3 shows the retention likelihood, by VAM score, beginning
in 2009–2010, two years before the composite TE level was available. The likelihood that all teachers would remain in SCS substantially decreased in 2012–2013 for all levels of VAM scores, a pattern also observed in the composite TE results. This could be related to uncertainty caused by the merger or by schools (and teachers) being assigned to the ASD. Multiple retention
6070
8090
100
Perc
ent
2011-12 2012-13 2013-14 2014-15 2015-16
Low TE Mid TE High TE
Retention by Teacher Effectiveness Level
6070
8090
100
Perc
ent
2009-10 2010-11 2011-12 2012-13 2013-14 2014-15
Bottom 20% Middle Top 20%
Retention by Teacher Value-Added Level
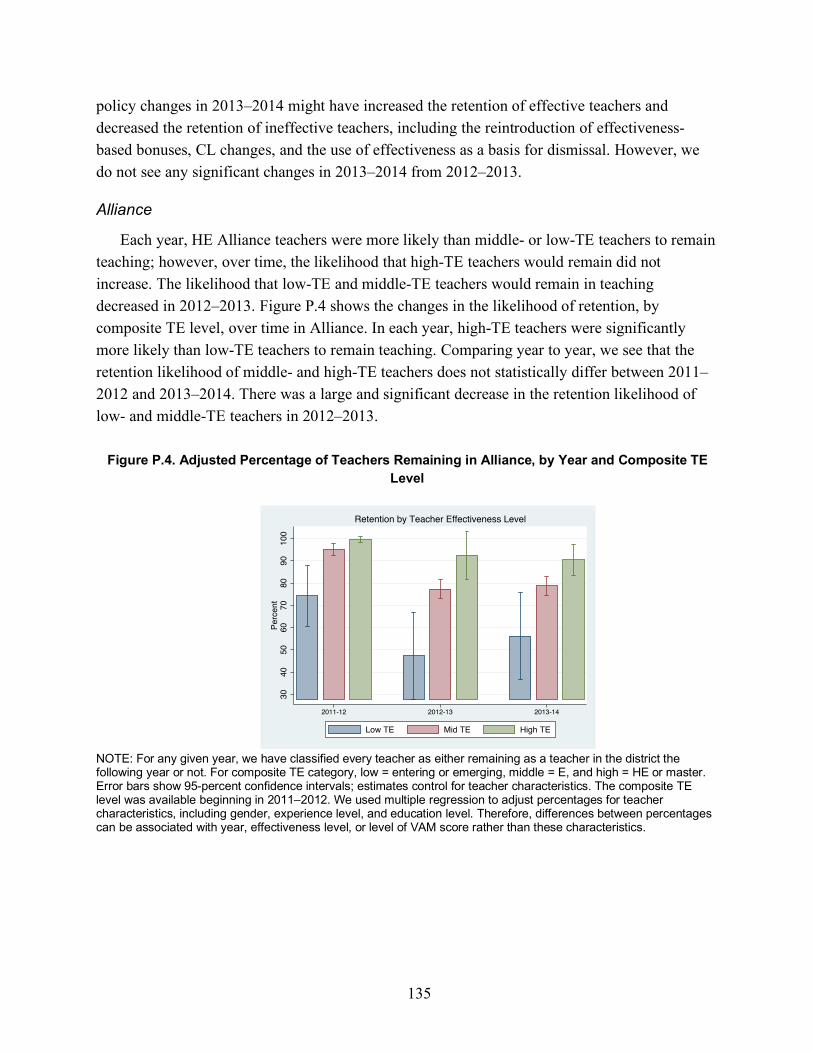
135
policy changes in 2013–2014 might have increased the retention of effective teachers and decreased the retention of ineffective teachers, including the reintroduction of effectiveness-based bonuses, CL changes, and the use of effectiveness as a basis for dismissal. However, we do not see any significant changes in 2013–2014 from 2012–2013.
Alliance
Each year, HE Alliance teachers were more likely than middle- or low-TE teachers to remain teaching; however, over time, the likelihood that high-TE teachers would remain did not increase. The likelihood that low-TE and middle-TE teachers would remain in teaching decreased in 2012–2013. Figure P.4 shows the changes in the likelihood of retention, by composite TE level, over time in Alliance. In each year, high-TE teachers were significantly more likely than low-TE teachers to remain teaching. Comparing year to year, we see that the retention likelihood of middle- and high-TE teachers does not statistically differ between 2011–2012 and 2013–2014. There was a large and significant decrease in the retention likelihood of low- and middle-TE teachers in 2012–2013.
Figure P.4. Adjusted Percentage of Teachers Remaining in Alliance, by Year and Composite TE Level
NOTE: For any given year, we have classified every teacher as either remaining as a teacher in the district the following year or not. For composite TE category, low = entering or emerging, middle = E, and high = HE or master. Error bars show 95-percent confidence intervals;; estimates control for teacher characteristics. The composite TE level was available beginning in 2011–2012. We used multiple regression to adjust percentages for teacher characteristics, including gender, experience level, and education level. Therefore, differences between percentages can be associated with year, effectiveness level, or level of VAM score rather than these characteristics.
3040
5060
7080
9010
0Pe
rcen
t
2011-12 2012-13 2013-14
Low TE Mid TE High TE
Retention by Teacher Effectiveness Level

136
Aspire
More-effective teachers in Aspire were more likely than less effective teachers to remain teaching, although the differences were not statistically significant. There were no statistically significant changes over time in the likelihood that high-TE teachers would remain teaching in Aspire. The left-hand side of Figure P.5 shows the changes in retention rates for Aspire, by composite TE level by year. Generally, low-TE teachers were the least likely to remain teaching; however, because of the smallness of the sample, the differences are not statistically significant. There was no significant change over time in the likelihood that high-TE teachers would remain teaching. The retention likelihood of low-TE teachers significantly decreased in 2012–2013. In 2013–2014, the retention likelihood for middle-TE teachers significantly decreased.
Figure P.5. Adjusted Percentage of Teachers Remaining in Aspire, by Year, Composite TE Level, and VAM Score
NOTE: For any given year, we have classified every teacher as either remaining as a teacher in the district the following year or not. For composite TE level, low TE = emerging, middle TE = E, and high TE = HE or master. Error bars show 95-percent confidence intervals;; estimates control for teacher characteristics. The composite TE level was available beginning in 2011–2012. We used multiple regression to adjust percentages for teacher characteristics, including gender, experience level, and education level. Therefore, differences between percentages can be associated with year, effectiveness level, or level of VAM score rather than these characteristics.
The right-hand side of Figure P.5 shows the retention likelihood, by each VAM level, for
Aspire between 2007–2008 and 2013–2014. Although the small number of teachers with VAM scores produced imprecise estimates for each year, we generally find that high-VAM teachers were more likely than low- and middle-VAM teachers to remain teaching. Overall, there is some discrepancy between the changes observed by composite TE level and by VAM score, and the imprecision of the estimates limits the conclusions we can draw.
6070
8090
100
Perc
ent
2011-12 2012-13 2013-14
Low TE Mid TE High TE
Retention by Teacher Effectiveness Level40
6080
100
Perc
ent
2007-08 2008-09 2009-10 2010-11 2011-12 2012-13 2013-14
Bottom 20% Middle Top 20%
Retention by Teacher Value-Added Level

137
Green Dot
The most-effective Green Dot teachers were the most likely to remain teaching in the site, and there was no statistically significant change over time. The left-hand side of Figure P.6 shows the changes in retention rates for Green Dot, by composite TE level by year. In each year, middle- and high-TE teachers were more likely than low-TE teachers to remain teaching, although, because of sample size, the differences are significant only in 2012–2013. The retention likelihood for each composite TE level decreased each year, and the largest decrease in retention likelihood occurred among low-TE teachers.
Figure P.6. Adjusted Percentage of Teachers Remaining in Green Dot from One Year to the Next, by Composite TE Level
NOTE: For any given year, we have classified every teacher as either remaining as a teacher in the district the following year or not. For composite TE level, low = entry or emerging, middle = E, and top = HE or HE 2. Error bars show 95-percent confidence intervals;; estimates control for teacher characteristics. The composite TE level was available beginning in 2011–2012. We used multiple regression to adjust percentages for teacher characteristics, including gender, experience level, and education level. Therefore, differences between percentages can be associated with year, effectiveness level, or level of VAM score rather than these characteristics.
Sensitivity Check: Teacher Retention After Two Consecutive Years In addition to the estimates presented in Chapter Eleven (specifically, Figures 11.8, 11.9,
11.12, 11.13, 11.16, 11.17, 11.20, 11.23, 11.24, and 11.27, which assess teacher retention by site and period), we assess retention as a function of two consecutive years of effectiveness ratings.
020
4060
8010
0Pe
rcen
t
2011-12 2012-13 2013-14
Low TE Mid TE High TE
Retention by Teacher Effectiveness Level

138
Like we did with the other results, we estimate the following model for each site and for each year:
For this analysis, we classified teachers as low TE in a given year only if he or she received a
low composite TE level in year t and t – 1 (e.g., a teacher would have low TE in 2011–2012 only if he or she had a low composite TE level in 2010–2011 and 2011–2012). Similarly, high-TE teachers were those who received high TE scores two years in a row (e.g., high-TE teachers in 2014–2015 had high composite TE levels in 2013–2014 and 2014–2015). The middle-TE category consisted of teachers who had consecutive middle composite TE levels, had middle TE one year and low TE or high TE the next, had low TE one year and improved the next, or had high TE and then regressed. Similarly, for VAM scores, we denote teachers with two consecutive years in the bottom 20 percent as low VAM score, teachers with two consecutive years in the top 20 percent as high VAM score, and those in the middle 60 percent both years or those who shift from the bottom or top as middle VAM score. Note that, because we base these categories on composite TE levels from consecutive years, we do not report results for the first year that the composite TE level or VAM score was available.
HCPS
The left-hand side of Figure P.7 displays the results of analysis describing the likelihood of retention after two consecutive composite TE evaluations. Generally, these results are similar to those from previous analyses; they show that the most-effective teachers were significantly more likely than the least effective teachers to remain teaching. The retention likelihood for teachers with two years of low TE ratings significantly decreased in 2012–2013 and again in 2014–2015. In contrast, there was no change for middle-TE or high-TE teachers between 2010–2011 and 2014–2015; their likelihood of remaining in teaching did not increase over time. Additionally, the likelihood that the least effective teachers would remain in teaching gradually decreased over time. The retention likelihood for middle-TE or high-TE teachers was significantly higher than that of low-TE teachers from 2011–2012 through 2014–2015.
Rit+1 = Xitγ + β1t E1itt=1
T
∑ + β2t E 2itt=1
T
∑ + β3t E3itt=1
T
∑ + ε it .

139
Figure P.7. Adjusted Percentage of Teachers Remaining in HCPS Based on Two Consecutive Years of Ratings for TE and Teacher Value Added, by Effectiveness Level
NOTE: For any given year, we have classified every teacher as either remaining as a teacher in the district the following year or not. For composite TE level, low TE = U or NI in two consecutive years, high TE = HE level 4 or HE level 5 in two consecutive years, and middle TE = all others (e.g., those with U and NI in one year and E the next, those with E in one year and HE level 4 in the next). Error bars show 95-percent confidence intervals;; estimates control for teacher characteristics. We used multiple regression to adjust percentages for teacher characteristics, including gender, experience level, and education level. Therefore, differences between percentages can be associated with year, effectiveness level, or level of VAM score rather than these characteristics.
The right-hand side of Figure P.7 displays the results of analysis describing the likelihood of retention after two consecutive VAM score evaluations. Generally, teachers who received consecutive VAM scores in the top 20 percent were more likely than less effective teachers to remain teaching. However, in most years, the differences between the retention likelihood for low-, middle-, and high-VAM teachers were not statistically significant. The retention likelihood for high-VAM teachers significantly increased in 2015–2016, and the retention likelihood for low-VAM teachers significantly decreased in 2014–2015, but these patterns did not persist.
PPS
The left-hand side of Figure P.8 displays the results of analysis describing the likelihood of retention using two consecutive composite TE levels. The retention likelihood for middle- and high-TE teachers remained relatively constant during this period; however, the retention likelihood for low-TE teachers significantly decreased in 2014–2015. The decrease in the retention likelihood for low-TE teachers occurred one year later in this analysis than in the previous analysis using one-year categorization.
020
4060
8010
0Pe
rcen
t
2011-12 2012-13 2013-14 2014-15
Low TE Mid TE High TE
Retention by Teacher Effectiveness Level
8085
9095
100
Perc
ent
2008-09 2009-10 2010-11 2011-12 2012-13 2013-14 2014-15 2015-16
Bottom 20% Middle Top 20%
Retention by Teacher Value-Added Level

140
Figure P.8. Adjusted Percentage of Teachers Remaining in PPS Based on Two Consecutive Years of Ratings for TE and Teacher Value Added, by Effectiveness Level
NOTE: For any given year, we have classified every teacher as either remaining as a teacher in the district the following year or not. For composite TE level, low TE = F or NI in two consecutive years, high TE = D in two consecutive years, and middle TE = all others (e.g., those with F or NI in one year and P the next, those with P in one year and D in the next). Error bars show 95-percent confidence intervals;; estimates control for teacher characteristics. We used multiple regression to adjust percentages for teacher characteristics, including gender, experience level, and education level. Therefore, differences between percentages can be associated with year, effectiveness level, or level of VAM score rather than these characteristics.
The right-hand side of Figure P.8 displays the results of analysis describing the likelihood of
retention using two consecutive VAM evaluations. Because of sample-size restrictions, we do not find any significant differences in terms of low-VAM versus high-VAM retention within year or changes over time within a VAM level.
SCS
The left-hand side of Figure P.9 describes the retention likelihood by consecutive composite TE levels. The results are similar to those presented in Figures 11.16 and 11.17 in Chapter Eleven; the only difference is that the likelihood that teachers who received consecutive low-TE evaluations would remain teaching is slightly lower in each year.
020
4060
8010
0Pe
rcen
t
2012-13 2013-14 2014-15
Low TE Mid TE High TE
Retention by Teacher Effectiveness Level
6070
8090
100
Perc
ent
2008-09 2009-10 2010-11 2011-12 2012-13 2013-14 2014-15
Bottom 20% Middle Top 20%
Retention by Teacher Value-Added Level

141
Figure P.9. Adjusted Percentage of Teachers Remaining in SCS Based on Two Consecutive Years of Ratings for TE and Teacher Value Added, by Effectiveness Level
NOTE: For any given year, we have classified every teacher as either remaining as a teacher in the district the following year or not. For composite TE level, low TE = performing significantly below or below expectations in two consecutive years, high TE = performing above or significantly above expectations in two consecutive years, and middle TE = all others (e.g., those with below expectations in one year and meeting expectations the next, those with meeting expectations in one year and above expectations in the next). Error bars show 95-percent confidence intervals;; estimates control for teacher characteristics. We used multiple regression to adjust percentages for teacher characteristics, including gender, experience level, and education level. Therefore, differences between percentages can be associated with year, effectiveness level, or level of VAM score rather than these characteristics.
The right-hand side of Figure P.9 describes the retention likelihood by consecutive VAM
evaluations. Again, these results are similar to those in Chapter Eleven, the only difference being that the likelihood of separation is lower in each year for teachers who received consecutive low VAM scores.
6070
8090
100
Perc
ent
2012-13 2013-14 2014-15 2015-16
Low TE Mid TE High TE
Retention by Teacher Effectiveness Level
4060
8010
0Pe
rcen
t
2010-11 2011-12 2012-13 2013-14 2014-15
Bottom 20% Middle Top 20%
Retention by Teacher Value-Added Level

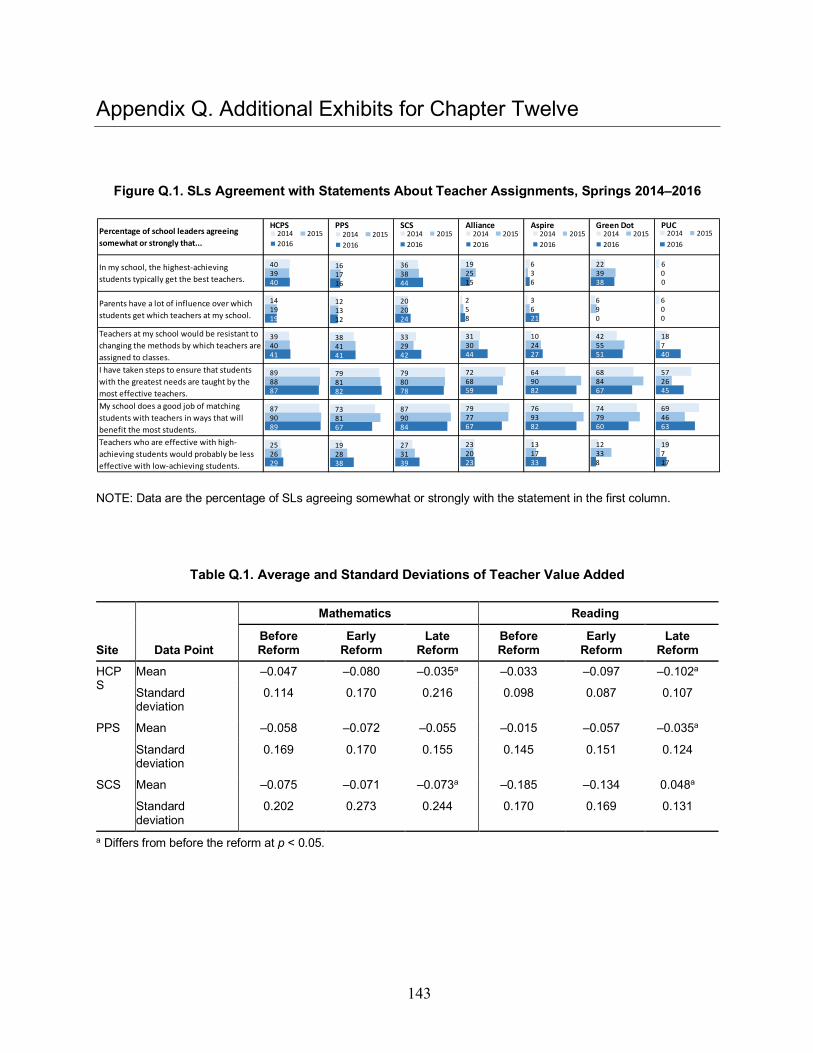
143
Appendix Q. Additional Exhibits for Chapter Twelve
Figure Q.1. SLs Agreement with Statements About Teacher Assignments, Springs 2014–2016
NOTE: Data are the percentage of SLs agreeing somewhat or strongly with the statement in the first column.
Table Q.1. Average and Standard Deviations of Teacher Value Added
Site Data Point
Mathematics Reading
Before Reform
Early Reform
Late Reform
Before Reform
Early Reform
Late Reform
HCPS
Mean –0.047 –0.080 –0.035a –0.033 –0.097 –0.102a
Standard deviation
0.114 0.170 0.216 0.098 0.087 0.107
PPS Mean –0.058 –0.072 –0.055 –0.015 –0.057 –0.035a
Standard deviation
0.169 0.170 0.155 0.145 0.151 0.124
SCS Mean –0.075 –0.071 –0.073a –0.185 –0.134 0.048a
Standard deviation
0.202 0.273 0.244 0.170 0.169 0.131
a Differs from before the reform at p < 0.05.
Percentage of school leaders agreeing somewhat or strongly that...
HCPS PPS SCS Alliance Aspire Green Dot PUC
In my school, the highest-‐achieving students typically get the best teachers.
Parents have a lot of influence over which students get which teachers at my school.
Teachers at my school would be resistant to changing the methods by which teachers are assigned to classes.I have taken steps to ensure that students with the greatest needs are taught by the most effective teachers.My school does a good job of matching students with teachers in ways that will benefit the most students.Teachers who are effective with high-‐achieving students would probably be less effective with low-‐achieving students.
44
24
42
78
84
39
38
20
29
80
90
31
36
20
33
79
87
27
2014 20152016
40
14
39
89
87
25
39
19
40
88
90
26
40
19
41
87
89
29
2014 20152016
19
2
31
72
79
23
25
5
30
68
77
20
15
8
44
59
67
23
2014 20152016
6
3
10
64
76
13
3
6
24
90
93
17
6
21
27
82
82
33
2014 20152016
22
6
42
68
74
12
39
9
55
84
79
33
38
0
51
67
60
8
2014 20152016
6
6
18
57
69
19
0
0
7
26
46
7
0
0
40
45
63
17
2014 20152016
16
12
38
79
73
19
17
13
41
81
81
28
16
12
41
82
67
38
2014 20152016

145
Appendix R. The Initiative’s Effects on TE and LIM Students’ Access to Effective Teaching: Analytic Methods for Chapter Twelve
Chapter Twelve empirically evaluates the extent of access that LIM students have to effective teachers. This appendix describes the methodology used to determine the access parameters, changes in these parameters over time, and decompositions of the access coefficients into different mechanisms.
Relationship Between Percentage of Students Who Are LIM Students and Teacher Value Added There are considerable differences in VAM scores among teachers, suggesting that students
in the same site might be taught by teachers of very different performance levels. Therefore, after estimating teacher effects, we estimated three relationships between student LIM proportions in year t and teacher effects in year t. The first is the overall relationship, representing the extent to which each teacher’s fitted value added, 𝜇$%, is related to the proportion of his or her students who are LIM, regardless of the school in which he or she works. We captured this relationship with a second-stage regression, in which the parameter of interest, β1, represents the difference in 𝜇$%, associated with a unit difference in the share of all of teacher j’s students in year t who are LIM:31
(R.1) To account for the randomness associated with the estimation of 𝜇$% , we estimated these two
stages using generalized least squares—that is, we weighted the second-stage regression by the Cholesky decomposition of the inverse of the variance–covariance matrix associated with the estimation of µjt. Note that this also shrinks noisy estimates of the VAM scores and so is comparable to empirical Bayes shrinkage, a common postestimation strategy for teacher VAM scores (McCaffrey et al., 2004).
We were also interested in decomposing the effect of LIMjt into the within-school and between-school components to see whether sorting is particularly strong in one or both areas. To do so, instead of estimating Equation R.1 as the second stage, we estimated Equation R.2. 𝛳𝛳st is a fixed effect controlling for the school, s, in which the teacher works during year t. Including this fixed effect changes the interpretation of the coefficient on the share of the teacher’s students with LIM status. This coefficient in Equation R.2 now reflects the estimated difference between 31 Note that, because LIMjt is coded from 0 to 1, a unit difference is actually a 100-percentage-point difference.
µ jt = β0 + β1LIM jt +υ jt .

146
teachers within a school, rather than throughout the district (like in Equation R.1), with low and high percentages of students with LIM status:
(R.2) We also estimate a third regression (again, using generalized least squares), replacing the
LIM share of the teacher’s students (LIMjt) with the LIM share of the school’s students:
(R.3) γ1 represents the relationship of TE among schools based on the percentage of their students
who are LIM students. It reflects the sorting of TE between schools. Overall sorting, (β1), is a weighted average of within-school sorting and between-school sorting, with the weights
reflecting the ratio of the variances of between-teacher percentage LIM and between-school percentage LIM (Raudenbush and Bryk, 2002, p. 137).
It is important to note that γ1 also reflects anything about the school that makes all teachers in the school more or less productive, such as leadership effectiveness, special programs, or resources. Although it has been shown that teachers are the most-important school-based factors in students’ achievement growth, the presence of these other factors could bias our estimates of between-school sorting.
In estimating value added, an important consideration is whether to estimate teachers’ VAM scores using just their students in the current year or whether to include the performance of their prior-year students as well. Several studies have demonstrated marked improvement in the reliability of estimates of VAM scores when they incorporate the performance of the students the teachers taught not only in the current year but also in one or more previous years (Goldhaber and Hansen, 2010; Schochet and Chiang, 2010). Presumably for this reason, the PPS and SCS IP sites calculate estimates of teachers’ VAM scores based on estimates of VAM scores that average teachers’ performance across multiple years. Given that the sites’ estimates carry high stakes for teachers, this approach seems appropriate for strengthening the reliability of the estimates.
However, the downside of averaging VAM scores across years is that it likely understates true year-to-year variation in teacher performance. In the case of the IP evaluation, in which we were interested in gauging the initiative’s impact not only on teachers’ assignments to their schools but on changes in individual teachers’ effectiveness relative to other teachers in the same IP site, we estimated VAM scores based on the performance of a teacher’s students in the current year. Our own investigations have revealed this to be the correct choice in our setting across various loss functions. Although this might result in some instability due to the sample of students a teacher is assigned in a given year, it also allowed our estimates to capture true year-to-year changes in teachers’ relative effectiveness.
A related consideration we faced was whether to examine sorting of teacher VAM scores by student LIM composition in terms of teachers’ estimated effectiveness in the current or prior year. In this study, we focused on the sorting of LIM students in terms of teachers’ current-year
µ jt = β0' + β1
'LIM jt +θ st +υ jt .
µ jt = γ 0 + γ 1LIMst +ηst .
(β1' )

147
effectiveness estimates. This approach allows us to examine the extent to which LIM students have access to high-quality teaching in each year of the study, relative to their non-LIM peers in the same site. Changes in sorting patterns from year to year can arise for a variety of reasons. These include not only changes in how administrators assign existing teachers to classrooms or schools (or how teachers are encouraged to take different assignments) but also such factors as how new teachers are assigned and how teachers of LIM students are professionally developed or rewarded for improving their instructional practice. In other words, our approach takes into account all of the factors that can shift the relative quality of teaching that LIM students receive from year to year.
An alternative approach would have been to estimate the relationship between estimates of teachers’ prior-year VAM scores and the LIM statuses of their current students. This approach would capture the extent to which the sites were assigning teachers to classrooms or schools based on what was previously known about their performance. However, because schools typically do not have estimates of VAM scores available for the prior year until shortly before or even after the start of a new school year, we would actually have needed to use teachers’ VAM scores from two years prior to the current year to report on the extent to which sites were deliberately assigning teachers to schools or classrooms based on prior estimates of VAM scores. Moreover, because the systematic use of teachers’ VAM scores in decisionmaking was largely precipitated by the IP initiative, schools would not have been able to base assignments on prior-year VAM scores until the 2012–2013 school year in HCPS and the 2013–2014 school year in the other sites, so we would not have been able to detect these impacts in our current data. For all of these reasons, we focus instead on sorting of current-year VAM scores by teachers’ current-year student LIM composition. From a student’s perspective, this is the most important definition because it captures the relative quality of instruction that LIM students received in a given year.
In general, we pooled all teachers in grades 4 through 8 when we examined sorting. However, the greater variety of course offerings during MS suggests that there might be more sorting of students within schools during these years. The greater departmentalization suggests that within-school sorting might differ more between subjects in MS grades than in elementary school grades. Therefore, we also conducted the same sorting analysis after dividing teachers into elementary grades (grades 4 through 5) and MS grades (6 through 8).
Change in Access Coefficient: Interrupted Time-Series Methodology To evaluate the change in the sorting coefficient, we used an interrupted time-series
regression. Equation R.4 presents this regression.
(R.4) We regressed VAM scores for teacher j in year t on the fraction of his or her students with LIM status, whether it is preinitiative (Post = 0 for academic years 2009–2010 and earlier) or recent (Post = 1 for academic years 2013–2014 and later), and the interaction between the two. To
VAM jt = β0 + β1LIM jt + β2Post jt + β3LIM jt × Post jt + ε jt .

148
emphasize the impact after relatively full implementation of the reforms, we did not include early initiative years in this regression. β3, the coefficient on the interaction, measures how the overall sorting coefficient changed from preinitiative to recent years and was the variable of interest. We weighted the regression using the inverse of the standard error of each measure of VAM score to weight toward measures with greater precision and clustered the standard errors at the school level. The within-school and between-school regressions are similar extensions by adding a posttreatment indicator, as well as an interaction between Post and LIM to the models explained in Baird et al., 2016.
Analysis of Mechanisms Used to Change Access We also examined whether LIM students’ access to high-VAM teaching changed during the
initiative by any of three possible mechanisms: (1) teachers with more LIM students have greater improvements in VAM scores, (2) higher-VAM teachers are reassigned to classes with more LIM students, or (3) exiting teachers of high-LIM classes are replaced with higher-VAM teachers than their counterparts in low-LIM classes. We refer to these three mechanisms as improve, reassign, and replace, respectively. To investigate this possibility, we decomposed the change in overall sorting into four components, as follows:
On the left-hand side of the equation are the estimates of the coefficients, βt and βt – 1, that
indicate LIM students’ level of access to high-VAM teachers in two consecutive years. The top line on the right-hand side of the equation is the difference between the access coefficients for teachers who are new and for the teachers they replace. This is weighted by the proportion of the staff in those two years who fall into those two categories,
which is the proportion of teachers who transition, on average, in those two years. The second element, ∆improve = βV1L0|stay – βV0L0|stay, measures the change in the sorting coefficients caused by changes in VAM scores across the two years. In this expression, βV1L0|stay is the estimated access coefficient on the subsample of teachers who stay between years 0 and 1, using year 1 VAM scores and year 0 LIM assignments, and βV0L0|stay is the access coefficient for the same population and assignments but using year 0 VAM scores. In other words, it measures what the change in the sorting coefficients would have been if each teacher’s fraction of students who were LIM
β1 − β0 =pnew + pexit
2βV 1L1|new − βV 0L0|exit( )
+pstay + pexp
2βV 1L0|stay − βV 0L0|stay + βV 0L1|stay − βV 0L0|stay( )+ R
= 1− p( )Δreplace + p Δimprove + Δreassign( )+ R.
1− p( ) = pnew + pexit( )2
,

149
students did not change across the two years but each teacher’s effectiveness was allowed to change as was observed. This is weighted by
the average fraction of teachers who stay and the fraction who return then (i.e., are experienced) the next year (in the case that the total number of teachers is the same across years, these two measures are identical). The third element is ∆reassign = βV0L1|stay – βV0L0|stay, the portion of the sorting coefficient changed by changes in assignments of teachers and their fractions of LIM students. Similar to before, βV0L1|stay is the estimated access coefficient for the teachers who stay between years 0 and 1, using year 0 VAM scores and year 1 LIM assignments, while βV0L0|stay is the same but uses year 0 LIM assignments. This then measures how the sorting coefficient would have changed if those teachers’ VAM scores had stayed the same but their fractions of LIM students changed as we observed in the data. It is weighted by the same p. The fourth element, R, is the residual difference between the actual difference in sorting coefficients and our decomposition. This is a complicated function of regression coefficients on various samples that largely cancels out. Another difference is that this decomposition does not use the WLS weights that the actual analysis uses. However, the correlation coefficient between the actual (WLS) difference in the sorting coefficients and our decomposition (leaving R out) is above 0.96, and a regression of the former on the latter yields an ordinary-least-squares coefficient of 0.903 (t-statistic of 19.82) with an intercept of –0.006 (t-statistic of –0.36). This demonstrates how close our decomposition is to a complete decomposition (leaving a negligible residual) even without accounting for the WLS (note that we did not perform any inference on these but used the statistics as guidance), and we use this version, which presents interpretable elements that can be examined.
p =pstay + pexp( )
2,


151
Appendix S. Additional Exhibits for Chapter Thirteen
Figure S.1. SLs’ Perceptions of “How Many Teachers in Your School” Possessed Various Skills, Springs 2013–2016
NOTE: Omitted response categories are “about half,” “a few,” and “none or almost none.” We did not ask this question in 2011.
Percentage of school leaders reporting that more than half of the teachers in their school...
HCPS SCS PPS Alliance Aspire Green Dot PUC
Have a good grasp of the subject matter they teach
Are ful ly prepared to teach based on the Common Core State Standards (math and ELA teachers ) or other relevant subject-‐area s tandards (other teachers )
Have the skills needed to foster meaningful student learning
Have the skills needed to help students improve their performance on standardized testsAre able to promote learning among all students, even those who are difficult to teachEngage in regular, productive conversations with one another about how to improve instruction
Really believe every child can learn and be college ready
85
34
72
71
59
52
58
86
60
74
74
59
61
63
86
73
75
74
62
63
65
87
73
76
74
60
60
67
2013 20142015 2016
85
41
75
70
58
62
64
81
47
75
73
60
64
64
85
47
75
71
65
67
65
79
52
69
61
57
63
62
2013 20142015 2016
76
26
54
56
40
52
47
82
34
71
67
50
60
59
81
62
73
70
58
61
60
83
53
64
59
47
50
44
2013 20142015 2016
94
42
81
87
68
71
81
95
61
80
81
75
76
84
95
68
64
58
64
66
77
90
74
84
100
64
67
77
2013 20142015 2016
88
34
85
88
70
79
85
80
44
73
76
67
77
90
82
51
67
50
49
63
87
68
41
46
50
49
65
68
2013 20142015 2016
79
22
59
56
41
50
66
83
25
65
67
43
46
68
76
33
55
48
33
58
67
83
47
53
45
29
68
64
2013 20142015 2016
100
22
83
89
78
78
94
94
56
74
75
63
74
88
100
81
94
81
81
87
94
84
61
78
76
59
67
84
2013 2014
2015 2016


153
Appendix T. Estimating the Initiative’s Impact on Student Outcomes: Data and Analytic Methods for Chapter Thirteen
In this appendix, we describe the data, the student outcomes, and the estimation method that we used in our evaluation of the initiative’s impact.
Data and Outcomes We used school-level data on student achievement and dropout rates from Florida,
Pennsylvania, Tennessee, and California to estimate the impact of the IP initiative.32 We also used data on graduation rates from Tennessee and California. The schools in the initiative sites formed the treatment group, and we used the remainder of schools in the four respective states as the comparison group. All analyses used only publicly available data aggregated to the school by grade by subject level or school by grade by subject by subgroup level. We obtained the data from state department of education websites or by making requests for such data to the state departments of education.33
Changes in SCS’s composition in the 2013–2014 school year and later introduced complications. The most significant change was that legacy MCS merged with legacy SCS just prior to the 2013–2014 school year.34 This means that, in 2013–2014, a single district included both the original schools from legacy MCS that were part of the IP initiative and all the schools that used to be part of legacy SCS, which did not receive the initiative.35 If we were to use all 2013–2014 SCS schools in the analysis, a significant portion of the schools in our treatment group would not actually have received the initiative. Therefore, before conducting the analysis, we removed all schools in the merged SCS that used to be part of legacy SCS rather than legacy MCS; we excluded these schools from the analysis for all years. They were in neither the treatment nor the control group.
Another challenge to the SCS analysis was that some schools from legacy MCS were subsequently transferred into a new state organization, the ASD, which either directly operates the schools or transfers their operation to other groups, including CMOs.36 These schools were
32 We could not obtain college-going rates. 33 We had to request data directly from the state departments of education of Pennsylvania and Tennessee. 34 Further changes to the district boundaries occurred the following year, with many of the suburbs of legacy SCS leaving the newly merged SCS district and creating their own districts. Because our analyses do not include the legacy SCS schools in the analysis, the departing schools’ leaving did not affect our estimates. 35 Schools that were part of legacy SCS did not receive funding from the IP initiative until after the merge. 36 ASD, undated, provides information and a list of schools.

154
subject to the initiative until they were transferred to the ASD but not after. To address the issue of partial exposure to the IP initiative, we excluded ASD schools from the comparison group in all years and included schools that were originally from legacy MCS in the analysis up to the year they transferred to the ASD.37
The main outcome of interest is the school-level average of student scale scores on the state assessments. Because the tests used in HS differ from those used in grades 3–8, we report results separately for grades 3–8 and for HSs, for mathematics and reading (English language arts), where data permit. We also report disaggregated results for each grade and subject. In the analysis, we standardized the scale scores by the within-state student mean and standard deviation (in that subject-grade-year). Therefore, we can interpret the estimates in effect-size units of the student-level test score distributions in each state.38
In addition to average overall scale scores for grades 3 through 8 and HS, we examined the initiative’s impact on exit exams (for the CMOs only) and on nontest outcomes, such as dropout rates, attendance (for legacy MCS only), graduation rates (for legacy MCS and the CMOs only), and University of California (UC) eligible (for the CMOs only).39 We also examined results for demographic subgroups. Specifically, we examined results for Hispanic, black, and economically disadvantaged groups, by grade and subject, when these subgroups made up a sufficient proportion of district population. We report these results in Appendix U. Table T.1 lists the outcomes and subgroups for each site.
37 However, in our analysis, we do include the Memphis Innovation Zone (i-Zone) schools. 38 To understand the effect-size concept, consider a simple example. Suppose that students take a test and that the scale score values for this test range from 100 to 500, with a mean of 300. Without further information, an estimated impact of, say, three points would be uninformative. To make sense of this finding, what is needed is information on how much variation there is in the scale score. The standard deviation of the test scale score is the usual way of measuring this variation. Frequently, test scale scores follow a bell-shaped distribution known as a normal distribution. In this common case, about two-thirds of students score within one standard deviation of the mean (300, in this example), and about 95 percent score within two standard deviations of the mean. The effect size is simply the change in the scale score (for example, three points) translated into standard deviation units. If the standard deviation were 10, the effect size would be 3 ÷ 10 = 0.3, indicating that the program increased test scores by 0.3 standard deviations. This would be a meaningful impact, which not many education interventions attain. In contrast, if the standard deviation were 100 and the difference in scale score were three points, the effect size would be a more modest 0.03. 39 UC eligible describes a student who graduates meeting the UC or California State University entrance requirements.
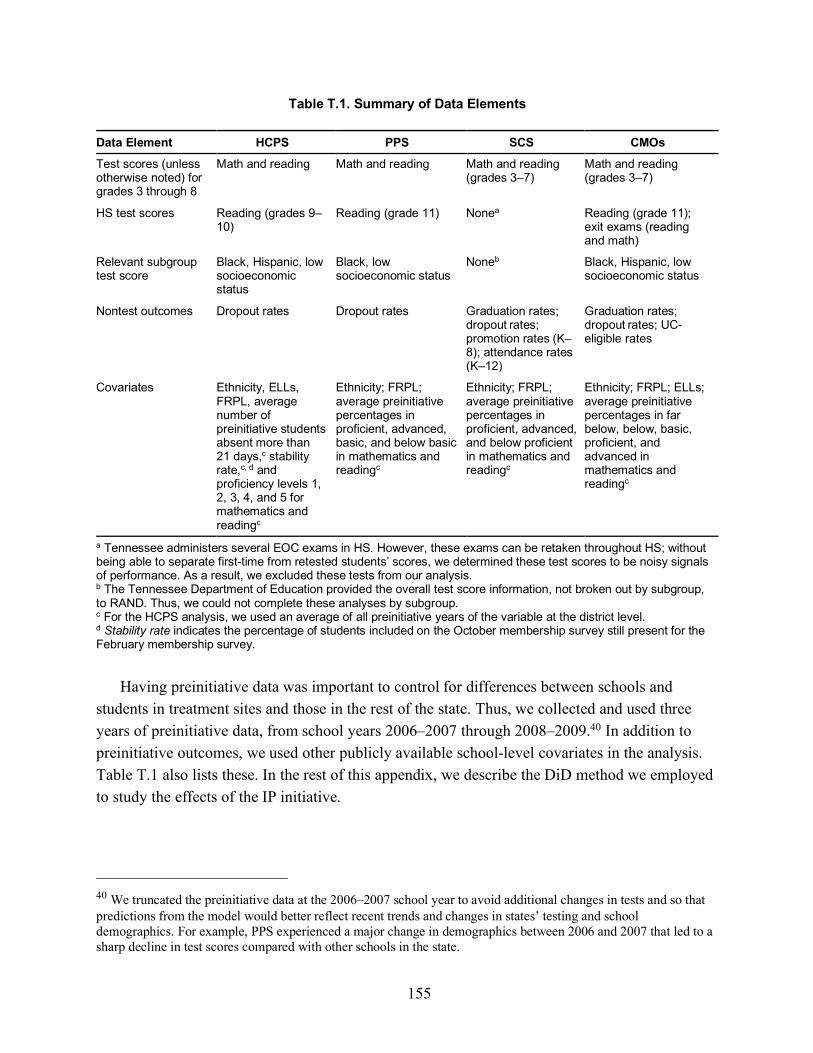
155
Table T.1. Summary of Data Elements
Data Element HCPS PPS SCS CMOs Test scores (unless otherwise noted) for grades 3 through 8
Math and reading Math and reading Math and reading (grades 3–7)
Math and reading (grades 3–7)
HS test scores Reading (grades 9–10)
Reading (grade 11) Nonea Reading (grade 11);; exit exams (reading and math)
Relevant subgroup test score
Black, Hispanic, low socioeconomic status
Black, low socioeconomic status
Noneb Black, Hispanic, low socioeconomic status
Nontest outcomes Dropout rates Dropout rates Graduation rates;; dropout rates;; promotion rates (K–8);; attendance rates (K–12)
Graduation rates;; dropout rates;; UC-eligible rates
Covariates Ethnicity, ELLs, FRPL, average number of preinitiative students absent more than 21 days,c stability rate,c, d and proficiency levels 1, 2, 3, 4, and 5 for mathematics and readingc
Ethnicity;; FRPL;; average preinitiative percentages in proficient, advanced, basic, and below basic in mathematics and readingc
Ethnicity;; FRPL;; average preinitiative percentages in proficient, advanced, and below proficient in mathematics and readingc
Ethnicity;; FRPL;; ELLs;; average preinitiative percentages in far below, below, basic, proficient, and advanced in mathematics and readingc
a Tennessee administers several EOC exams in HS. However, these exams can be retaken throughout HS;; without being able to separate first-time from retested students’ scores, we determined these test scores to be noisy signals of performance. As a result, we excluded these tests from our analysis. b The Tennessee Department of Education provided the overall test score information, not broken out by subgroup, to RAND. Thus, we could not complete these analyses by subgroup. c For the HCPS analysis, we used an average of all preinitiative years of the variable at the district level. d Stability rate indicates the percentage of students included on the October membership survey still present for the February membership survey.
Having preinitiative data was important to control for differences between schools and
students in treatment sites and those in the rest of the state. Thus, we collected and used three years of preinitiative data, from school years 2006–2007 through 2008–2009.40 In addition to preinitiative outcomes, we used other publicly available school-level covariates in the analysis. Table T.1 also lists these. In the rest of this appendix, we describe the DiD method we employed to study the effects of the IP initiative.
40 We truncated the preinitiative data at the 2006–2007 school year to avoid additional changes in tests and so that predictions from the model would better reflect recent trends and changes in states’ testing and school demographics. For example, PPS experienced a major change in demographics between 2006 and 2007 that led to a sharp decline in test scores compared with other schools in the state.

156
School-Level Difference-in-Differences Methodology Estimating the initiative’s impact was difficult because the outcomes in the IP sites could
differ from those in non-IP sites for reasons other than the IP initiative itself, such as students in IP sites being from less affluent families than students in other sites. As shown in Table T.2, there are clear differences between the distributions of characteristics of students served by schools in the IP sites and those of students in other schools in the same state that are not in the IP sites. For example, the IP sites, except for HCPS, had much larger fractions of students from minority ethnicities and in poverty than the other districts in their states. To the extent that these differences drive differences in student outcomes, comparisons between the outcomes of students in schools in the IP sites and those in the non-IP sites will be misleading about the initiative’s impact.

157
Table T.2. Average Demographics in the IP Sites and in the Rest of Their States, as Proportions
Student Characteristic
School Year 2008–2009 School Year 2014–2015
Site Rest of State Site Rest of State HCPS and the rest of Florida
Black 0.22 0.23 0.21 0.23
Hispanic 0.28 0.25 0.35 0.31
Asian 0.03 0.02 0.04 0.03
Receiving FRPL 0.52 0.49 0.64 0.61
ELL 0.15 0.11 0.13 0.09
PPS and the rest of Pennsylvania
Black 0.56 0.14 0.52 0.14
Hispanic 0.01 0.07 0.02 0.09
Asian 0.02 0.03 0.04 0.04
Receiving FRPL 0.69 0.40 0.68 0.44
SCS and rest of Tennessee
Black 0.86 0.18 0.77 0.15
Hispanic 0.06 0.05 0.13 0.09
Asian 0.01 0.02 0.03 0.02
Receiving FRPL 0.79 0.52 0.85 0.56
CMOs and rest of California
Black 0.16 0.08 0.09 0.06
Hispanic 0.78 0.50 0.86 0.55
Asian 0.01 0.09 0.02 0.09
Receiving FRPL 0.84 0.53 0.87 0.59
ELL 0.22 0.21 0.16 0.19
SOURCES: Public data published by the respective states’ departments of education. NOTE: We calculated demographic variables at the school level by dividing the number of students from a certain category by the total number of students in the school and then averaging across schools in the IP site and in the rest of the state based on student enrollment by school.
To disentangle the initiative’s effects from the effects of student characteristics and other
district-specific factors, we employed a DiD approach using school-level data. This approach involved two steps. The first step used data on school-level outcomes and on demographic characteristics (at the school and district levels) in the preinitiative years to forecast what school outcomes were likely to be in the postinitiative years, taking into account any changes in demographic characteristics (at the school and district levels).41 In the second step, we examined
41 In previous interim analyses, we have also tried first trimming the sample of non-IP schools to keep only those schools that are more similar in terms of demographics to the schools in the IP site. After selecting these schools, we followed the two estimation steps described here. The estimation results with the trimmed sample were very similar

158
whether differences between the actual outcomes and the forecasted outcomes systematically differ also between schools in an IP site and those in the same state’s non-IP districts. This DiD can be interpreted as the gap between the performance of schools in IP sites and non-IP schools, net the difference that would be expected given the preinitiative outcome patterns and differences in demographics.
The hypothetical example in Figure T.1 depicts how the first step in this procedure works. Figure T.1 shows the relationship between some school-level outcome (average scale scores, in this example) and time. Data points to the left of the red dashed line are from years prior to the IP initiative, and data points to the right are from years after the IP initiative went into place. In this example, there are very large differences in the preinitiative years between the treated and comparison schools, shown by the difference in the heights of the lines along the vertical axis.
Figure T.1. Graphical Depiction of Methodology for Computing Forecasts of Postinitiative Trends
NOTE: Data points to the left of the red dashed line are from years prior to the IP initiative, and data points to the right are from years after the IP initiative went into place. In this example, there are very large differences in the preinitiative years between the treated and comparison schools, shown by the difference in the heights of the lines along the vertical axis. The deviations from this forecast for the first two years after the initiative equal the vertical distance from the forecasted outcome (i.e., the dashed line) and the actual outcome. For the comparison group, these deviations are dc1 and dc2, respectively;; for the treatment group, they are dt1 and dt2, respectively. In this example, the comparison group does a little better than predicted in one year and a little worse in the other. In contrast, the difference between the actual and predicted treatment-group performance is large and positive in both years.
to the results obtained using the full sample of schools in the state (which we present in this report). This suggests that a linear specification does a relatively good job of controlling for differences in observed characteristics.
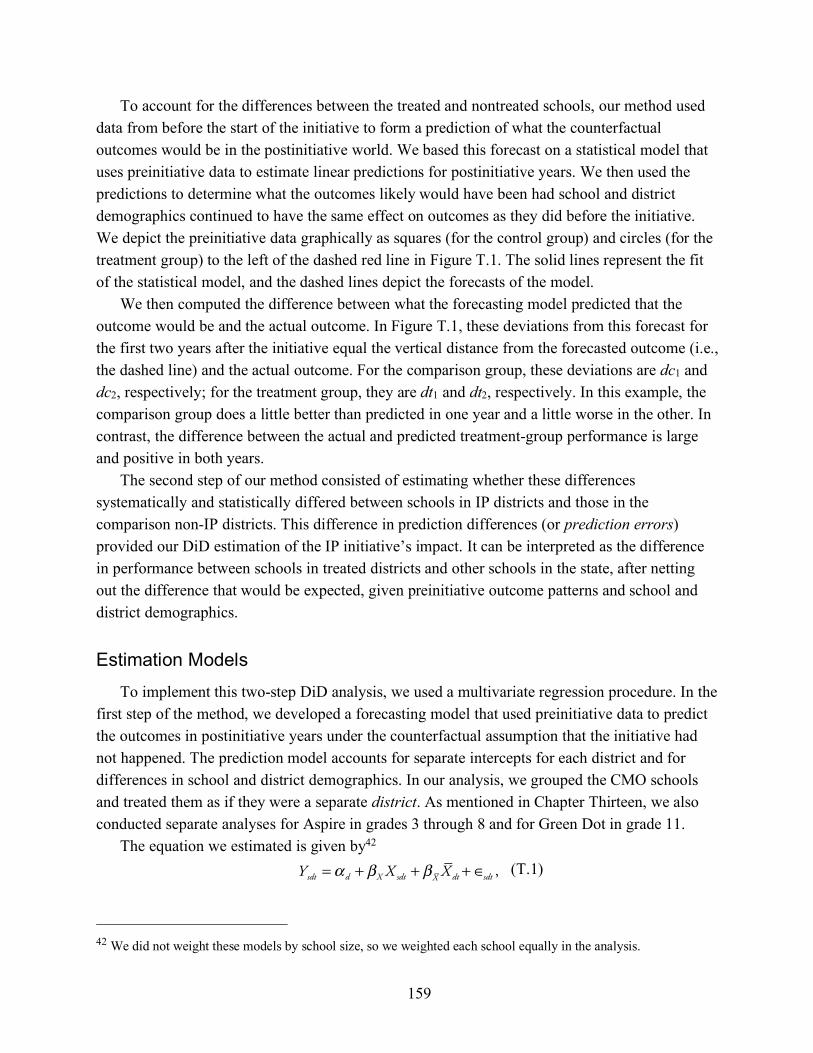
159
To account for the differences between the treated and nontreated schools, our method used data from before the start of the initiative to form a prediction of what the counterfactual outcomes would be in the postinitiative world. We based this forecast on a statistical model that uses preinitiative data to estimate linear predictions for postinitiative years. We then used the predictions to determine what the outcomes likely would have been had school and district demographics continued to have the same effect on outcomes as they did before the initiative. We depict the preinitiative data graphically as squares (for the control group) and circles (for the treatment group) to the left of the dashed red line in Figure T.1. The solid lines represent the fit of the statistical model, and the dashed lines depict the forecasts of the model.
We then computed the difference between what the forecasting model predicted that the outcome would be and the actual outcome. In Figure T.1, these deviations from this forecast for the first two years after the initiative equal the vertical distance from the forecasted outcome (i.e., the dashed line) and the actual outcome. For the comparison group, these deviations are dc1 and dc2, respectively; for the treatment group, they are dt1 and dt2, respectively. In this example, the comparison group does a little better than predicted in one year and a little worse in the other. In contrast, the difference between the actual and predicted treatment-group performance is large and positive in both years.
The second step of our method consisted of estimating whether these differences systematically and statistically differed between schools in IP districts and those in the comparison non-IP districts. This difference in prediction differences (or prediction errors) provided our DiD estimation of the IP initiative’s impact. It can be interpreted as the difference in performance between schools in treated districts and other schools in the state, after netting out the difference that would be expected, given preinitiative outcome patterns and school and district demographics.
Estimation Models To implement this two-step DiD analysis, we used a multivariate regression procedure. In the
first step of the method, we developed a forecasting model that used preinitiative data to predict the outcomes in postinitiative years under the counterfactual assumption that the initiative had not happened. The prediction model accounts for separate intercepts for each district and for differences in school and district demographics. In our analysis, we grouped the CMO schools and treated them as if they were a separate district. As mentioned in Chapter Thirteen, we also conducted separate analyses for Aspire in grades 3 through 8 and for Green Dot in grade 11.
The equation we estimated is given by42
(T.1)
42 We did not weight these models by school size, so we weighted each school equally in the analysis.
Ysdt =α d + βX X sdt + βX X dt + ∈sdt ,

160
where Ysdt is the outcome for school s in district d by year t (the outcomes can pertain to a specific grade or student subgroup); αd denotes district-specific intercepts; Xsdt denotes the school demographic characteristics each year, including ethnicity composition and percentage of students in FRPL plans. It also includes some time-invariant characteristics, such as average preinitiative proficiency levels in mathematics and reading (i.e., in school years 2006–2007 through 2008–2009). For a list of specific covariates, see Table T.1. contains the time-varying variables in Xsdt but aggregated at the district level (we did not include time-constant district-level variables because they were perfectly collinear with the district-specific intercept).
Equation T.1 does not have an overall time trend. This is because the standardized test scores (our main outcome of interests) are standardized by the within-state student mean and standard deviation (the example in Figure T.1 shows raw scale scores instead of standardized scores). Apart from the overall time trend, an extension of our model would be to use linear district-specific time trends to predict postinitiative counterfactual outcomes. However, we found that, as we predict several years into the future, maintaining the trends from before the initiative leads to large prediction errors and imprecise estimates of the initiative’s impact. Thus, in this report, we do not include linear district-specific trends in our model.43
We estimated the model in Equation T.1 using only information from school years 2006–2007 through 2008–2009. We used the estimated model to form a forecast of the outcome for each school in the postinitiative period. We then computed the difference between each school’s forecast and actual value. This difference reflects how the school’s outcome differed from what was expected, based on the school’s and district’s characteristics. This approach implies that we included in our analysis only schools that were open by 2008–2009. In this analysis, we did not include schools that opened after this period. The only exception is our analysis of HSs in PPS, as explained in Chapter Thirteen.44 We also kept in our analyses schools that closed after 2008–2009 until the year of closure.
43 We examined the error of the predicted outcomes for schools in the comparison group. We used the comparison group; because it was not exposed to the initiative, we expected that past trends at the district level would be a good predictor of future outcomes. This can be tested in the data. We found that the model without trends delivered smaller prediction errors, as measured by the root-mean-squared error. 44 For the analysis of the initiative impact on HS (grade 11) reading in PPS, we also included HSs that opened after 2008–2009 (or that merged with other schools, which we treated as new schools in the data). We believe that this better captures the initiative’s district-wide effects because of the high rate of closures or mergers of HSs in PPS, a phenomenon that we do not see in the other IP sites. To include schools that opened or merged after 2008–2009 in our analysis, we had to exclude the average preinitiative (i.e., 2006–2007 to 2008–2009) proficiency levels in mathematics and reading from the list of controls in Xsdt (and in in Equation T.1 because these values are undefined for schools that opened after 2008–2009.
Xdt
Xdt )

161
The second step in the analysis examined whether the differences between the forecast and actual values were systematically different in the IP districts and the comparison districts. We estimated the following regression:
(T.2) The variable difsdt denotes the difference between the forecast and actual values of the
outcome. The vectors Xsdt and are the same vectors of school-level and district-level
demographics as in Equation T.1 (excluding time-invariant variables). The variable treatmentd is an indicator variable that equals 1 if the schools were in the initiative district.
The coefficient of interest is which captures the difference in the prediction error (the
DiD) between schools in the initiative and comparison districts in year t. We allowed to vary
with time because it is plausible that the IP initiative will take time to generate effects because the reforms it entails require several years to implement. In practice, we estimated Equation T.2 separately for every year in the data (before and after the initiative).
Also, we control for demographic factors both in Equation T.1, the forecasting model, and in Equation T.2, the model that explains the difference between the forecast and actual values. The reasoning for following this approach is that, in Equation T.1, we assumed the effects of demographic factors to be constant over time. In other words, we assumed that the influence that different factors (such as the ethnicity composition) have on the achievement outcome did not vary over time. In reality, however, this might not be true, and it adds to the prediction error. We acknowledged this by adding demographic factors to Equation T.2 and letting them have differential impacts in every year (because we estimated separate regressions for Equation T.2 for each time period). The key assumption behind this approach was that changes in demographics and in their impacts on outcomes are independent or unrelated to the IP initiative.
A significant empirical challenge was to determine whether the usual variability in outcomes that occurred across districts could explain the initiative’s estimated impacts. The district-by-time–level random-effect component included in the analysis addresses this problem. We
assumed that the common shocks to schools’ performances in a district in a given year, which would occur regardless of the IP initiative, followed a normal distribution (i.e.,
Adding this district–year random-effect component to the model allowed us to measure the natural variability in outcomes across districts. This allowed us to judge whether the initiative’s estimated impacts were large enough in comparison to the expected variation in the absence of any initiative.
dif sdt = γ +ηttreatmentd +θt ,X X sdt +θt ,X X dt + µdt + vsdt .
Xdt
ηt ,
ηt
(µdt )
µdt ∼ N 0,\σ 2⎡⎣ ⎤⎦).


163
Appendix U. Additional Impact Estimates for Chapter Thirteen
This appendix contains the results for additional outcomes, including test scores for student subgroups (specifically, by demographic characteristic and grade) and indicators of HS persistence (dropout and graduation rates). For each outcome, we report the estimated impact effect for a given postinitiative year in the first row and its p-value in the second row in brackets.
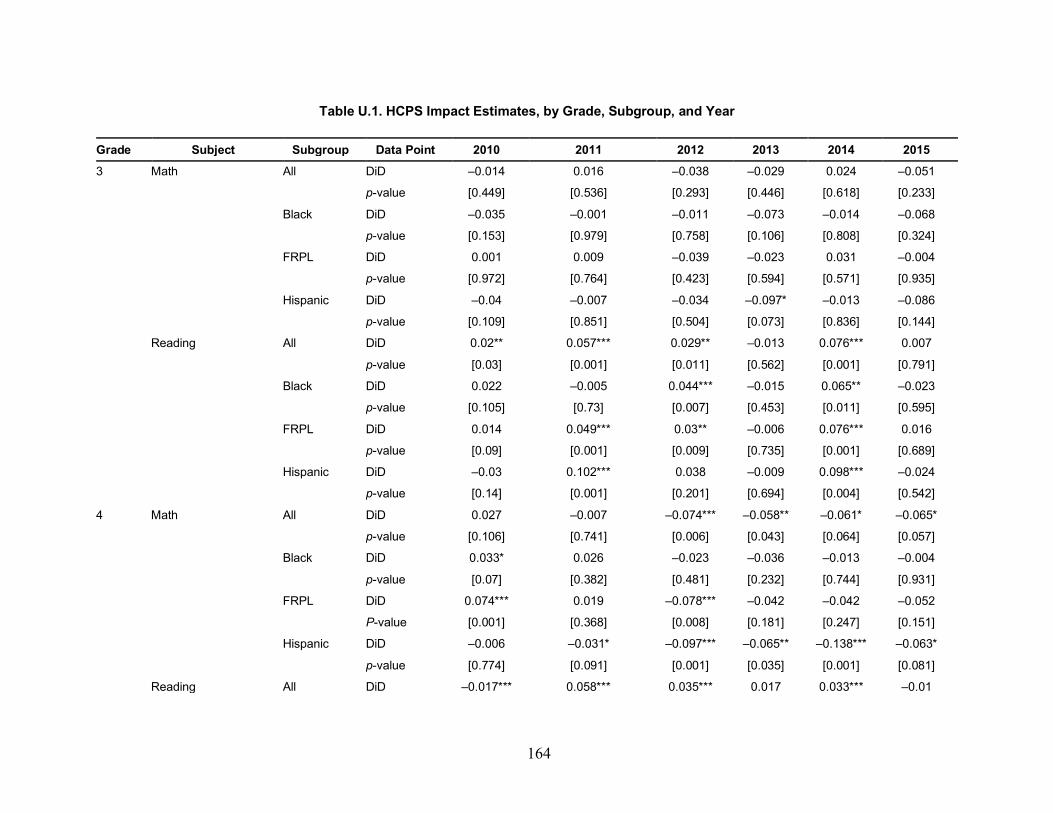
164
Table U.1. HCPS Impact Estimates, by Grade, Subgroup, and Year
Grade Subject Subgroup Data Point 2010 2011 2012 2013 2014 2015 3 Math All DiD –0.014 0.016 –0.038 –0.029 0.024 –0.051
p-value [0.449] [0.536] [0.293] [0.446] [0.618] [0.233]
Black DiD –0.035 –0.001 –0.011 –0.073 –0.014 –0.068
p-value [0.153] [0.979] [0.758] [0.106] [0.808] [0.324]
FRPL DiD 0.001 0.009 –0.039 –0.023 0.031 –0.004
p-value [0.972] [0.764] [0.423] [0.594] [0.571] [0.935]
Hispanic DiD –0.04 –0.007 –0.034 –0.097* –0.013 –0.086
p-value [0.109] [0.851] [0.504] [0.073] [0.836] [0.144]
Reading All DiD 0.02** 0.057*** 0.029** –0.013 0.076*** 0.007
p-value [0.03] [0.001] [0.011] [0.562] [0.001] [0.791]
Black DiD 0.022 –0.005 0.044*** –0.015 0.065** –0.023
p-value [0.105] [0.73] [0.007] [0.453] [0.011] [0.595]
FRPL DiD 0.014 0.049*** 0.03** –0.006 0.076*** 0.016
p-value [0.09] [0.001] [0.009] [0.735] [0.001] [0.689]
Hispanic DiD –0.03 0.102*** 0.038 –0.009 0.098*** –0.024
p-value [0.14] [0.001] [0.201] [0.694] [0.004] [0.542]
4 Math All DiD 0.027 –0.007 –0.074*** –0.058** –0.061* –0.065*
p-value [0.106] [0.741] [0.006] [0.043] [0.064] [0.057]
Black DiD 0.033* 0.026 –0.023 –0.036 –0.013 –0.004
p-value [0.07] [0.382] [0.481] [0.232] [0.744] [0.931]
FRPL DiD 0.074*** 0.019 –0.078*** –0.042 –0.042 –0.052
P-value [0.001] [0.368] [0.008] [0.181] [0.247] [0.151]
Hispanic DiD –0.006 –0.031* –0.097*** –0.065** –0.138*** –0.063*
p-value [0.774] [0.091] [0.001] [0.035] [0.001] [0.081]
Reading All DiD –0.017*** 0.058*** 0.035*** 0.017 0.033*** –0.01

165
Grade Subject Subgroup Data Point 2010 2011 2012 2013 2014 2015 p-value [0.001] [0.001] [0.001] [0.281] [0.006] [0.698]
Black DiD 0.002 0.067*** 0.048 0.011 0.103*** –0.005
p-value [0.934] [0.001] [0.099] [0.569] [0.001] [0.878]
FRPL DiD 0.011 0.065*** 0.025* 0.023 0.061*** 0.001
p-value [0.088] [0.001] [0.068] [0.17] [0.001] [0.975]
Hispanic DiD –0.063*** 0.027* 0.045*** 0.008 –0.007 –0.012
p-value [0.005] [0.056] [0.001] [0.701] [0.651] [0.756]
5 Math All DiD –0.003 –0.012 –0.046** –0.005 –0.035 –0.052*
p-value [0.722] [0.63] [0.019] [0.856] [0.311] [0.064]
Black DiD –0.008 0.068* –0.02 0.065* 0.015 –0.004
p-value [0.45] [0.085] [0.474] [0.052] [0.721] [0.889]
FRPL DiD –0.029*** 0.007 –0.043** –0.01 –0.023 –0.025
p-value [0.001] [0.75] [0.024] [0.722] [0.514] [0.367]
Hispanic DiD 0.003 –0.009 –0.056** –0.033 –0.058 –0.087*
p-value [0.845] [0.755] [0.015] [0.224] [0.139] [0.049]
Reading All DiD 0.01 0.008 –0.012 0.002 0.06*** 0.024
p-value [0.191] [0.468] [0.31] [0.89] [0.002] [0.222]
Black DiD –0.019 0.029 0.009 0.007 0.065** 0.033
p-value [0.104] [0.268] [0.504] [0.809] [0.021] [0.244]
FRPL DiD –0.003 0.02 –0.004 –0.019 0.092*** 0.038*
p-value [0.698] [0.101] [0.75] [0.174] [0.001] [0.065]
Hispanic DiD –0.019 0.001 –0.026 –0.031 0.042 –0.004
p-value [0.248] [0.983] [0.24] [0.495] [0.186] [0.943]
6 Math All DiD –0.028*** 0.02 –0.104*** –0.073*** –0.073*** –0.075*
p-value [0.001] [0.288] [0.001] [0.001] [0.002] [0.084]
Black DiD –0.012 0.01 –0.099*** –0.079** –0.074 –0.035
p-value [0.309] [0.588] [0.004] [0.035] [0.125] [0.429]
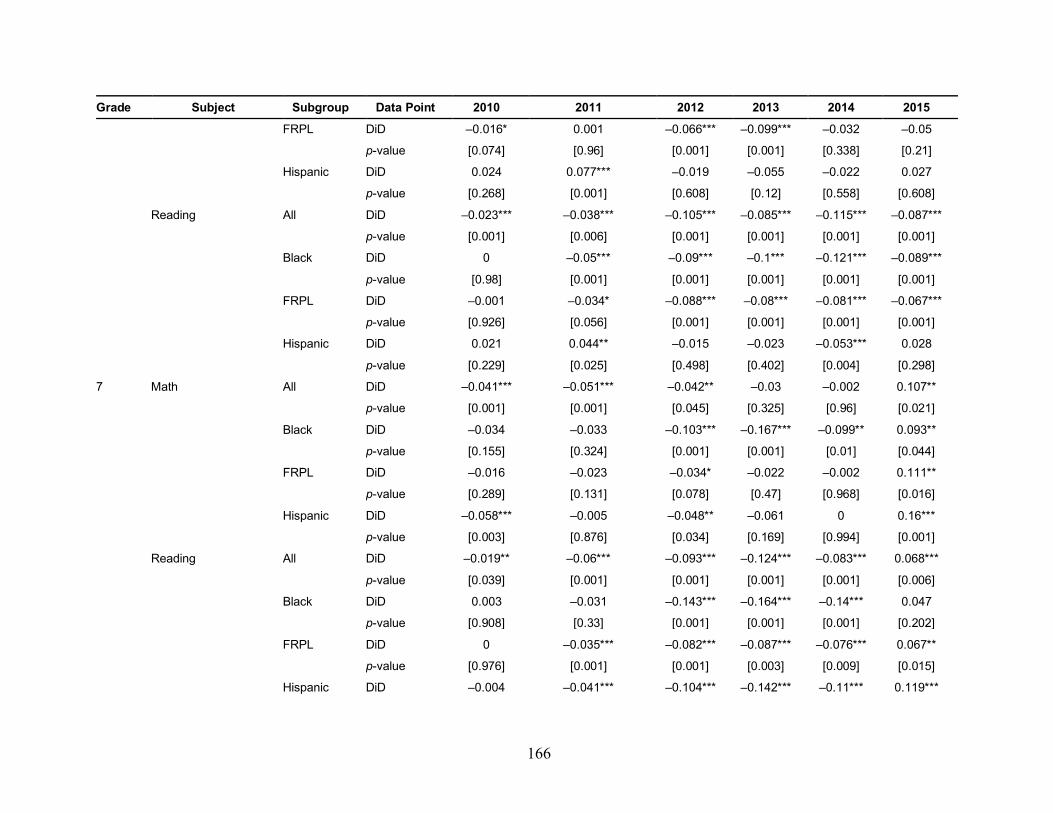
166
Grade Subject Subgroup Data Point 2010 2011 2012 2013 2014 2015 FRPL DiD –0.016* 0.001 –0.066*** –0.099*** –0.032 –0.05
p-value [0.074] [0.96] [0.001] [0.001] [0.338] [0.21]
Hispanic DiD 0.024 0.077*** –0.019 –0.055 –0.022 0.027
p-value [0.268] [0.001] [0.608] [0.12] [0.558] [0.608]
Reading All DiD –0.023*** –0.038*** –0.105*** –0.085*** –0.115*** –0.087***
p-value [0.001] [0.006] [0.001] [0.001] [0.001] [0.001]
Black DiD 0 –0.05*** –0.09*** –0.1*** –0.121*** –0.089***
p-value [0.98] [0.001] [0.001] [0.001] [0.001] [0.001]
FRPL DiD –0.001 –0.034* –0.088*** –0.08*** –0.081*** –0.067***
p-value [0.926] [0.056] [0.001] [0.001] [0.001] [0.001]
Hispanic DiD 0.021 0.044** –0.015 –0.023 –0.053*** 0.028
p-value [0.229] [0.025] [0.498] [0.402] [0.004] [0.298]
7 Math All DiD –0.041*** –0.051*** –0.042** –0.03 –0.002 0.107**
p-value [0.001] [0.001] [0.045] [0.325] [0.96] [0.021]
Black DiD –0.034 –0.033 –0.103*** –0.167*** –0.099** 0.093**
p-value [0.155] [0.324] [0.001] [0.001] [0.01] [0.044]
FRPL DiD –0.016 –0.023 –0.034* –0.022 –0.002 0.111**
p-value [0.289] [0.131] [0.078] [0.47] [0.968] [0.016]
Hispanic DiD –0.058*** –0.005 –0.048** –0.061 0 0.16***
p-value [0.003] [0.876] [0.034] [0.169] [0.994] [0.001]
Reading All DiD –0.019** –0.06*** –0.093*** –0.124*** –0.083*** 0.068***
p-value [0.039] [0.001] [0.001] [0.001] [0.001] [0.006]
Black DiD 0.003 –0.031 –0.143*** –0.164*** –0.14*** 0.047
p-value [0.908] [0.33] [0.001] [0.001] [0.001] [0.202]
FRPL DiD 0 –0.035*** –0.082*** –0.087*** –0.076*** 0.067**
p-value [0.976] [0.001] [0.001] [0.003] [0.009] [0.015]
Hispanic DiD –0.004 –0.041*** –0.104*** –0.142*** –0.11*** 0.119***

167
Grade Subject Subgroup Data Point 2010 2011 2012 2013 2014 2015 p-value [0.83] [0.002] [0.001] [0.001] [0.002] [0.001]
8 Math All DiD 0.007 –0.009 –0.034** 0.115* 0.163*** –0.27***
p-value [0.468] [0.259] [0.047] [0.065] [0.002] [0.001]
Black DiD 0.003 –0.061*** –0.042* –0.001 0.055 –0.245***
p-value [0.84] [0.009] [0.086] [0.982] [0.135] [0.001]
FRPL DiD –0.03*** –0.026** –0.069*** 0.043 0.115** –0.233***
p-value [0.004] [0.019] [0.001] [0.392] [0.012] [0.001]
Hispanic DiD –0.016 –0.008 –0.014 0.1 0.183** –0.288***
p-value [0.206] [0.83] [0.691] [0.139] [0.018] [0.001]
Reading All DiD 0.018** –0.072*** –0.099*** –0.083*** –0.086*** –0.067
p-value [0.032] [0.001] [0.001] [0.001] [0.001] [0.19]
Black DiD –0.005 –0.064 –0.088*** –0.087*** –0.018 –0.133**
p-value [0.756] [0.13] [0.001] [0.005] [0.522] [0.037]
FRPL DiD –0.009 –0.096*** –0.119*** –0.119*** –0.094*** –0.139***
p-value [0.459] [0.001] [0.001] [0.001] [0.001] [0.001]
Hispanic DiD 0 –0.045 –0.095*** –0.107** –0.068 –0.107*
p-value [0.985] [0.332] [0.002] [0.03] [0.11] [0.075]
3–8 Math All DiD –0.002 –0.004 –0.052** –0.017 0.002 –0.046
p-value [0.84] [0.841] [0.03] [0.58] [0.962] [0.146]
Black DiD 0 0.003 –0.056** –0.018 0.02 –0.031
p-value [0.989] [0.876] [0.019] [0.475] [0.588] [0.191]
FRPL DiD 0.004 –0.005 –0.058** –0.024 0.004 –0.026
p-value [0.597] [0.787] [0.02] [0.418] [0.912] [0.447]
Hispanic DiD –0.021 –0.01 –0.044* –0.047 –0.018 –0.061*
p-value [0.101] [0.6] [0.081] [0.126] [0.642] [0.074]
Reading All DiD 0.003 0.013 –0.012 –0.025 0.026 0.001
p-value [0.477] [0.161] [0.255] [0.106] [0.102] [0.948]

168
Grade Subject Subgroup Data Point 2010 2011 2012 2013 2014 2015 Black DiD 0.022* –0.001 –0.028*** –0.014 0.037** –0.016
p-value [0.066] [0.948] [0.001] [0.305] [0.032] [0.451]
FRPL DiD 0.006 0.009 –0.011 –0.019 0.042* 0.011
p-value [0.107] [0.376] [0.394] [0.268] [0.054] [0.642]
Hispanic DiD –0.015 0.048** 0.013 –0.018 0.036 –0.004
p-value [0.194] [0.025] [0.534] [0.502] [0.161] [0.877]
9 Reading All DiD –0.027** –0.004 –0.106*** –0.127*** –0.132*** 0.027
p-value [0.031] [0.7] [0.001] [0.001] [0.001] [0.278]
Black DiD 0.001 –0.054*** –0.093** –0.087** –0.211*** –0.106
p-value [0.974] [0.002] [0.01] [0.044] [0.001] [0.162]
FRPL DiD –0.003 –0.011 –0.07*** –0.122*** –0.151*** –0.083
p-value [0.812] [0.499] [0.007] [0.001] [0.001] [0.132]
Hispanic DiD –0.031 –0.006 –0.087*** –0.096*** –0.14*** –0.031
p-value [0.124] [0.794] [0.001] [0.001] [0.001] [0.488]
10 Reading All DiD –0.077*** –0.173*** –0.124*** –0.163*** –0.104*** –0.071**
p-value [0.001] [0.001] [0.001] [0.001] [0.001] [0.011]
Black DiD –0.087*** –0.184*** –0.134*** –0.222*** –0.133*** –0.176***
p-value [0.001] [0.001] [0.001] [0.001] [0.001] [0.005]
FRPL DiD –0.052*** –0.189*** –0.162*** –0.181*** –0.151*** –0.133**
p-value [0.002] [0.001] [0.001] [0.001] [0.001] [0.031]
Hispanic DiD –0.051*** –0.132*** –0.101*** –0.162*** –0.073* –0.127**
p-value [0.002] [0.001] [0.001] [0.001] [0.084] [0.032]
HS Reading All DiD –0.034*** –0.063*** –0.11*** –0.126*** –0.078*** 0
p-value [0.001] [0.001] [0.001] [0.001] [0.004] [0.986]
Black DiD –0.041*** –0.119*** –0.098*** –0.139*** –0.129*** –0.07
p-value [0.001] [0.001] [0.001] [0.001] [0.002] [0.153]
FRPL DiD –0.018 –0.065*** –0.106*** –0.159*** –0.136*** –0.066*

169
Grade Subject Subgroup Data Point 2010 2011 2012 2013 2014 2015 p-value [0.111] [0.001] [0.001] [0.001] [0.001] [0.056]
Hispanic DiD –0.013 –0.032* –0.06*** –0.087*** –0.08*** –0.056
p-value [0.424] [0.058] [0.003] [0.001] [0.001] [0.202]
HS Dropout rate, as a percentage
All DiD 0.03 –2.1 –0.2 1.55*** 0.48 0.12
p-value [0.86] [0.295] [0.576] [0.001] [0.366] [0.798]
NOTE: DiD represents the DiD estimate of the initiative’s effect on each outcome in each year. For more details on the DiD methodology, see Gutierrez, Weinberger, and Engberg, 2016. A difference value of 0.000 indicates a difference of less than 0.0005. HS tests indicates the average for tests taken in grade 9 or 10. For the graduation and dropout rates, we used a logit model to estimate the predicted trends to take into account the bounded range of these estimates. In 2011, Florida started to implement the FCAT 2.0. The FCAT 2.0 does not administer the mathematics exam in grade 9 or 10. *** = significant at p < 0.01. ** = significant at p < 0.05. * = significant at p < 0.10.
Table U.2. PPS Impact Estimates, by Grade, Subgroup, and Year
Grade Subject Subgroup Data Point 2010 2011 2012 2013 2014 2015 3 Math All DiD –0.07*** –0.067* –0.095 0.112*** 0.137*** 0.048
p-value [0.001] [0.096] [0.137] [0.006] [0.001] [0.234]
Black DiD –0.071*** 0.024 –0.078* 0.14*** 0.149*** –0.008
p-value [0.001] [0.692] [0.095] [0.004] [0.001] [0.854]
FRPL DiD –0.043*** –0.032 –0.108** 0.166*** 0.182*** 0.072*
p-value [0.005] [0.478] [0.031] [0.001] [0.001] [0.065]
Reading All DiD –0.066*** –0.115*** –0.092* –0.075** –0.009 –0.021
p-value [0.001] [0.001] [0.063] [0.02] [0.773] [0.605]
Black DiD –0.073*** –0.013 –0.074** 0.005 0.033 –0.078**
p-value [0.001] [0.777] [0.029] [0.87] [0.326] [0.04]
FRPL DiD –0.019 0.013 –0.096** 0.007 0.072** 0.045
p-value [0.132] [0.744] [0.019] [0.84] [0.032] [0.251]
4 Math All DiD –0.072*** –0.031 –0.066* –0.072* 0.114*** 0.029
p-value [0.001] [0.326] [0.086] [0.087] [0.001] [0.335]

170
Grade Subject Subgroup Data Point 2010 2011 2012 2013 2014 2015 Black DiD –0.103*** 0.033 0.028 0.016 0.289*** 0.065
p-value [0.001] [0.423] [0.546] [0.74] [0.001] [0.1]
FRPL DiD –0.046*** –0.019 –0.096** –0.043 0.157*** 0.065*
p-value [0.001] [0.563] [0.029] [0.375] [0.001] [0.096]
Reading All DiD –0.051*** 0.038 0.038 –0.055* 0.04 0.058*
p-value [0.001] [0.111] [0.342] [0.094] [0.194] [0.09]
Black DiD –0.089*** 0.096** 0.174*** 0.004 0.156*** 0.023
p-value [0.001] [0.017] [0.001] [0.915] [0.001] [0.519]
FRPL DiD –0.038*** 0.072*** –0.043 –0.031 0.065 0.083**
p-value [0.001] [0.006] [0.241] [0.39] [0.114] [0.028]
5 Math All DiD –0.003 –0.005 0.011 –0.024 –0.002 –0.051
p-value [0.738] [0.867] [0.828] [0.578] [0.962] [0.214]
Black DiD –0.033* 0.01 0.048 0.035 0.123*** –0.017
p-value [0.059] [0.808] [0.437] [0.423] [0.001] [0.668]
FRPL DiD –0.003 0.024 –0.15*** –0.008 0.01 –0.021
p-value [0.845] [0.457] [0.001] [0.854] [0.72] [0.562]
Reading All DiD 0.035*** 0.106*** 0.146*** –0.055 0.005 –0.035
p-value [0.001] [0.001] [0.005] [0.183] [0.893] [0.326]
Black DiD 0.015 0.117*** 0.215*** –0.007 0.116*** –0.013
p-value [0.465] [0.007] [0.001] [0.853] [0.004] [0.67]
FRPL DiD 0.024** 0.14*** –0.028 –0.015 0.019 0.042
p-value [0.012] [0.001] [0.506] [0.707] [0.643] [0.382]
6 Math All DiD –0.113*** –0.139*** –0.083** –0.158*** –0.032 –0.163***
p-value [0.001] [0.001] [0.044] [0.002] [0.527] [0.001]
Black DiD –0.095*** –0.114*** 0.018 –0.14*** 0.073 –0.099***
p-value [0.001] [0.004] [0.628] [0.001] [0.135] [0.002]
FRPL DiD –0.066*** –0.063** 0.007 –0.086* 0.037 –0.115**

171
Grade Subject Subgroup Data Point 2010 2011 2012 2013 2014 2015 p-value [0.001] [0.021] [0.901] [0.078] [0.41] [0.027]
Reading All DiD –0.049*** 0.034 0.082*** –0.011 –0.075*** –0.055**
p-value [0.001] [0.119] [0.004] [0.715] [0.009] [0.049]
Black DiD –0.054*** 0.046 0.181*** –0.074*** 0.066* –0.009
p-value [0.001] [0.215] [0.001] [0.006] [0.056] [0.782]
FRPL DiD –0.018 0.072*** 0.109*** 0.009 –0.013 –0.014
p-value [0.174] [0.002] [0.001] [0.819] [0.622] [0.676]
7 Math All DiD 0.032** –0.004 –0.11** –0.086*** 0.119*** –0.012
p-value [0.027] [0.822] [0.021] [0.003] [0.002] [0.778]
Black DiD 0.051*** –0.067* –0.072 –0.094** 0.108** 0.055*
p-value [0.002] [0.053] [0.168] [0.015] [0.014] [0.089]
FRPL DiD 0.039** 0.016 0.021 –0.038 0.189*** 0.051
p-value [0.016] [0.412] [0.777] [0.215] [0.001] [0.257]
Reading All DiD 0.026** 0.023 0.081** –0.109*** 0.048* –0.047
p-value [0.041] [0.13] [0.043] [0.001] [0.054] [0.269]
Black DiD –0.002 –0.028 0.152*** –0.071** 0.072* 0.085***
p-value [0.913] [0.264] [0.001] [0.047] [0.051] [0.009]
FRPL DiD 0.014 0.054*** 0.083** –0.045*** 0.141*** 0.043
p-value [0.272] [0.001] [0.014] [0.002] [0.001] [0.253]
8 Math All DiD 0.001 –0.001 0.023 –0.133*** 0.05* 0.029
p-value [0.883] [0.955] [0.385] [0.001] [0.052] [0.442]
Black DiD 0.002 0.005 –0.019 –0.123** 0.082** 0.019
p-value [0.85] [0.888] [0.693] [0.029] [0.035] [0.629]
FRPL DiD –0.001 0.038 –0.042 –0.027 0.149*** 0.063
p-value [0.93] [0.219] [0.584] [0.378] [0.001] [0.104]
Reading All DiD 0.027*** –0.014 0.068*** –0.083*** –0.03 –0.005
p-value [0.003] [0.431] [0.005] [0.001] [0.183] [0.875]

172
Grade Subject Subgroup Data Point 2010 2011 2012 2013 2014 2015 Black DiD 0.004 –0.013 0.012 –0.08 0.005 –0.029
p-value [0.835] [0.709] [0.755] [0.101] [0.897] [0.541]
FRPL DiD –0.006 –0.009 –0.012 –0.017 0.057*** 0.024
p-value [0.661] [0.711] [0.711] [0.262] [0.002] [0.481]
3–8 Math All DiD –0.036*** 0.011 –0.02 –0.009 0.104*** 0.006
p-value [0.001] [0.631] [0.455] [0.774] [0.001] [0.83]
Black DiD –0.06*** –0.022 –0.018 –0.009 0.147*** 0.016
p-value [0.001] [0.454] [0.563] [0.786] [0.001] [0.545]
FRPL DiD –0.017*** 0.022 –0.077* 0.005 0.113*** 0.02
p-value [0.094] [0.319] [0.083] [0.874] [0.001] [0.446]
Reading All DiD –0.025*** 0.035 0.046* –0.04 0.021 –0.011
p-value [0.001] [0.136] [0.084] [0.107] [0.391] [0.654]
Black DiD –0.04*** 0.028 0.065** –0.033 0.076*** 0.007
p-value [0.001] [0.262] [0.018] [0.161] [0.005] [0.755]
FRPL DiD –0.004** 0.055** –0.022 –0.021 0.031 0.005
p-value [0.702] [0.023] [0.542] [0.375] [0.219] [0.853]
11 (previous model)
Reading All DiD –0.029** –0.007 –0.055** –0.092*** –0.076** –0.082**
p-value [0.016] [0.718] [0.039] [0.001] [0.023] [0.017]
Black DiD –0.071*** 0.021 0.075* –0.033 0.152*** 0.089**
p-value [0.002] [0.449] [0.052] [0.557] [0.006] [0.032]
FRPL DiD –0.016 0.006 –0.065* –0.05 0.104** 0.004
p-value [0.277] [0.801] [0.068] [0.204] [0.038] [0.915]
11 (new model) Reading All DiD –0.133*** 0.005 0.072*** 0.097*** 0.059 0.091**
p-value [0.001] [0.881] [0.008] [0.004] [0.223] [0.019]
Black DiD –0.15*** 0.011 0.15*** 0.106** 0.147*** 0.133***
p-value [0.001] [0.776] [0.001] [0.02] [0.003] [0.001]
FRPL DiD –0.095*** 0.009 –0.052* 0.042 0.053 0.098**

173
Grade Subject Subgroup Data Point 2010 2011 2012 2013 2014 2015 p-value [0.001] [0.805] [0.059] [0.355] [0.331] [0.012]
HS Dropout rate, as a percentage
All DiD –1.31*** 0.64 –3.52*** –1.54*** –0.92 –1.68*
p-value [0.008] [0.435] [0.001] [0.008] [0.147] [0.051]
NOTE: DiD represents the DiD estimate of the initiative’s effect on each outcome in each year. For more details on the DiD methodology, see Gutierrez, Weinberger, and Engberg, 2016. A difference value of 0.000 indicates a difference of less than 0.0005. The test scores for grade 11 apply to the Keystone Exam, which is an EOC exam that tests for specific subjects (algebra 1 for math and literature for reading). The Keystone Exam for math is less standardized across schools, so we did not include it in the analysis. For the dropout rates, we used a logit model to estimate the predicted trends to take into account the bounded range of these estimates. *** = significant at p < 0.01. ** = significant at p < 0.05. * = significant at p < 0.10.
Table U.3. SCS Impact Estimates, by Grade, Subgroup, and Year
Grade Subject Subgroup Data Point 2010 2011 2012 2013 2014 2015 3 Math All DiD –0.277*** –0.162 –0.129 –0.121* –0.033 –0.098
p-value [0.002] [0.14] [0.165] [0.068] [0.749] [0.223]
Reading All DiD –0.166** –0.212** –0.145** –0.121** 0.026 –0.004
p-value [0.026] [0.043] [0.04] [0.012] [0.773] [0.934]
4 Math All DiD –0.029 –0.165* –0.083 –0.022 –0.124 –0.091
p-value [0.728] [0.071] [0.517] [0.894] [0.288] [0.363]
Reading All DiD –0.054 –0.103 –0.119 –0.162*** –0.114*** –0.065
p-value [0.208] [0.113] [0.178] [0.005] [0.007] [0.196]
5 Math All DiD –0.166 –0.212** –0.322** –0.256 –0.043 –0.139
p-value [0.103] [0.042] [0.020] [0.110] [0.837] [0.389]
Reading All DiD –0.132*** –0.184*** –0.085 –0.201** 0.037 –0.065
p-value [0.001] [0.004] [0.327] [0.036] [0.777] [0.22]
6 Math All DiD –0.194*** –0.306*** –0.3*** –0.143 –0.299** –0.176
p-value [0.001] [0.001] [0.001] [0.172] [0.034] [0.13]
Reading All DiD –0.089*** –0.192*** –0.192*** –0.105** –0.215*** –0.099
p-value [0.002] [0.001] [0.007] [0.029] [0.003] [0.102]

174
Grade Subject Subgroup Data Point 2010 2011 2012 2013 2014 2015 7 Math All DiD –0.14*** –0.27*** –0.224** –0.097 –0.269** –0.131
p-value [0.004] [0.001] [0.018] [0.353] [0.023] [0.237]
Reading All DiD –0.11** –0.243*** –0.16*** –0.153** –0.028 –0.135**
p-value [0.035] [0.001] [0.006] [0.024] [0.54] [0.036]
8 Math All DiD –0.098 –0.238*** –0.288*** –0.22** –0.224 –0.173
p-value [0.118] [0.001] [0.001] [0.046] [0.109] [0.181]
Reading All DiD –0.012 –0.159*** –0.08 –0.097 –0.078 –0.032
p-value [0.708] [0.001] [0.197] [0.193] [0.182] [0.506]
3–8 Math All DiD –0.146*** –0.173*** –0.204*** –0.155* –0.174* –0.14
p-value [0.002] [0.001] [0.003] [0.05] [0.093] [0.071]
Reading All DiD –0.103*** –0.133*** –0.132*** –0.144*** –0.011 –0.022
p-value [0.001] [0.002] [0.008] [0.001] [0.792] [0.531]
Elementary school
Attendance, as a percentage
All DiD –0.29 –0.81*** –0.73** –1.27** –1.3*** –0.41
p-value [0.188] [0.001] [0.011] [0.02] [0.005] [0.282]
Promotion, as a percentage
All DiD 1.02 –1.72*** –1.8*** 5.42 –1.85 –2.98
p-value [0.123] [0.009] [0.001] [0.448] [0.856] [0.287]
HS Dropout rate, as a percentage
All DiD 0.29 –3.61** 4.48** –0.06 2.35 5.9
p-value [0.88] [0.042] [0.038] [0.966] [0.532] [0.108]
Graduation rate, as a percentage
All DiD –9.27** –0.71 –6.26*** –11.45*** –14.01*** –15.66***
p-value [0.016] [0.781] [0.007] [0.001] [0.001] [0.001]
Attendance, as a percentage
All DiD 1.27 0.66 1.1* 0.49 3.96*** 3.32**
p-value [0.106] [0.381] [0.062] [0.528] [0.001] [0.011]
NOTE: DiD represents the DiD estimate of the initiative’s effect on each outcome in each year. For more details on the DiD methodology, see Gutierrez, Weinberger, and Engberg, 2016. A difference value of 0.000 indicates a difference of less than 0.0005. For the graduation, dropout, attendance, and promotion rates, we used a logit model to estimate the predicted trends to take into account the bounded range of these estimates. We could not calculate the initiative’s impact for black students or for other subgroups (e.g., low-income students) because Tennessee does not provide data on average performance by subgroup in each school, grade, and subject. *** = significant at p < 0.01. ** = significant at p < 0.05. * = significant at p < 0.10.

175
Table U.4. CMOs’ Combined Impact Estimates, by Grade, Subgroup, and Year
Grade Subject Subgroup Data Point 2010 2011 2012 2013 2014 2015 3 Math All DiD –0.003 –0.067*** –0.01 0.059** N/A –0.109***
p-value [0.841] [0.001] [0.623] [0.019] N/A [0.001]
Black DiD 0.006 –0.103*** –0.048 –0.039 N/A –0.221***
p-value [0.82] [0.004] [0.327] [0.47] N/A [0.001]
FRPL DiD 0.002 –0.072*** –0.011 0.01 N/A –0.145***
p-value [0.869] [0.001] [0.632] [0.709] N/A [0.001]
Hispanic DiD –0.065*** –0.061*** –0.089*** 0.017 N/A –0.118***
p-value [0.001] [0.001] [0.001] [0.513] N/A [0.001]
Reading All DiD 0.109*** 0.168*** 0.175*** 0.109*** N/A –0.012
p-value [0.001] [0.001] [0.001] [0.001] N/A [0.406]
Black DiD 0.148*** 0.007 0.213*** 0.093* N/A –0.202***
p-value [0.001] [0.795] [0.001] [0.056] N/A [0.001]
FRPL DiD 0.138*** 0.15*** 0.191*** 0.113*** N/A –0.04**
p-value [0.001] [0.001] [0.001] [0.001] N/A [0.01]
Hispanic DiD 0.06*** 0.19*** 0.099*** 0.146*** N/A –0.011
p-value [0.001] [0.001] [0.001] [0.001] N/A [0.564]
4 Math All DiD 0.027** –0.068*** –0.167*** –0.034* N/A –0.232***
p-value [0.036] [0.001] [0.001] [0.082] N/A [0.001]
Black DiD 0.034** 0.091*** –0.107** 0.09* N/A –0.309***
p-value [0.029] [0.009] [0.032] [0.063] N/A [0.001]
FRPL DiD 0.047*** –0.127*** –0.23*** –0.069*** N/A –0.286***
p-value [0.001] [0.001] [0.001] [0.001] N/A [0.001]
Hispanic DiD 0.027 –0.172*** –0.244*** –0.125*** N/A –0.242***
p-value [0.098] [0.001] [0.001] [0.001] N/A [0.001]
Reading All DiD 0.173*** 0.105*** 0.019 0.119*** N/A –0.209***
p-value [0.001] [0.001] [0.143] [0.001] N/A [0.001]

176
Grade Subject Subgroup Data Point 2010 2011 2012 2013 2014 2015 Black DiD 0.308*** 0.234*** –0.037 0.264*** N/A –0.213***
p-value [0.001] [0.001] [0.217] [0.001] N/A [0.001]
FRPL DiD 0.185*** 0.075*** –0.021 0.085*** N/A –0.233***
p-value [0.001] [0.001] [0.114] [0.001] N/A [0.001]
Hispanic DiD 0.149*** –0.011 –0.043*** –0.005 N/A –0.256***
p-value [0.001] [0.46] [0.003] [0.734] N/A [0.001]
5 Math All DiD 0.047*** 0.06*** –0.16*** –0.166*** N/A –0.228***
p-value [0.001] [0.001] [0.001] [0.001] N/A [0.001]
Black DiD 0.526*** 0.383*** 0.07 –0.295*** N/A –0.345***
p-value [0.001] [0.001] [0.157] [0.001] N/A [0.001]
FRPL DiD 0.024* 0.075*** –0.177*** –0.182*** N/A –0.225***
p-value [0.064] [0.001] [0.001] [0.001] N/A [0.001]
Hispanic DiD 0.004 0.009 –0.23*** –0.208*** N/A –0.244***
p-value [0.846] [0.663] [0.001] [0.001] N/A [0.001]
Reading All DiD 0.104*** 0.092*** –0.02 –0.011 N/A –0.141***
p-value [0.001] [0.001] [0.114] [0.466] N/A [0.001]
Black DiD 0.229*** 0.275*** 0.103** –0.183*** N/A –0.306***
p-value [0.001] [0.001] [0.01] [0.001] N/A [0.001]
FRPL DiD 0.089*** 0.074*** –0.071*** –0.061*** N/A –0.116***
p-value [0.001] [0.001] [0.001] [0.002] N/A [0.001]
Hispanic DiD 0.049*** 0.057*** –0.089*** –0.032* N/A –0.118***
p-value [0.001] [0.001] [0.001] [0.061] N/A [0.001]
6 Math All DiD –0.021 0.021 –0.05 –0.154* N/A –0.293***
p-value [0.114] [0.86] [0.506] [0.089] N/A [0.001]
Black DiD –0.023 0.221*** 0.078 –0.17 N/A –0.011
p-value [0.889] [0.005] [0.801] [0.255] N/A [0.896]
FRPL DiD –0.013 0.034 –0.062 –0.159*** N/A –0.241**

177
Grade Subject Subgroup Data Point 2010 2011 2012 2013 2014 2015 p-value [0.89] [0.68] [0.447] [0.001] N/A [0.024]
Hispanic DiD –0.032 0.038 –0.076 –0.176*** N/A –0.259**
p-value [0.736] [0.638] [0.312] [0.001] N/A [0.024]
Reading All DiD –0.009 0.009 0.009 –0.052 N/A –0.126***
p-value [0.804] [0.856] [0.846] [0.178] N/A [0.001]
Black DiD –0.032 0.193*** 0.114 –0.113 N/A –0.043
p-value [0.766] [0.001] [0.588] [0.346] N/A [0.528]
FRPL DiD –0.022 –0.016 –0.035 –0.101** N/A –0.144**
p-value [0.808] [0.703] [0.598] [0.048] N/A [0.035]
Hispanic DiD –0.012 0.007 –0.049 –0.119** N/A –0.165*
p-value [0.904] [0.912] [0.499] [0.013] N/A [0.081]
7 Math All DiD 0.196*** 0.062 –0.079 0.03 N/A –0.244***
p-value [0.001] [0.662] [0.46] [0.842] N/A [0.001]
Black DiD –0.237* –0.178 –0.062 –0.193 N/A –0.239**
p-value [0.056] [0.523] [0.773] [0.176] N/A [0.018]
FRPL DiD 0.071 –0.054 –0.226*** –0.109 N/A –0.348***
p-value [0.45] [0.644] [0.001] [0.111] N/A [0.001]
Hispanic DiD 0.111 –0.065 –0.21*** –0.109 N/A –0.355***
p-value [0.219] [0.615] [0.004] [0.259] N/A [0.001]
Reading All DiD 0.044 0.019 –0.004 0.007 N/A –0.07
p-value [0.589] [0.79] [0.943] [0.861] N/A [0.381]
Black DiD –0.303* –0.235 –0.08 –0.162 N/A –0.023
p-value [0.1] [0.226] [0.619] [0.296] N/A [0.892]
FRPL DiD –0.014 –0.067 –0.117*** –0.102*** N/A –0.157***
p-value [0.85] [0.238] [0.001] [0.001] N/A [0.006]
Hispanic DiD 0.011 –0.075 –0.087* –0.107*** N/A –0.138*
p-value [0.893] [0.262] [0.077] [0.001] N/A [0.059]
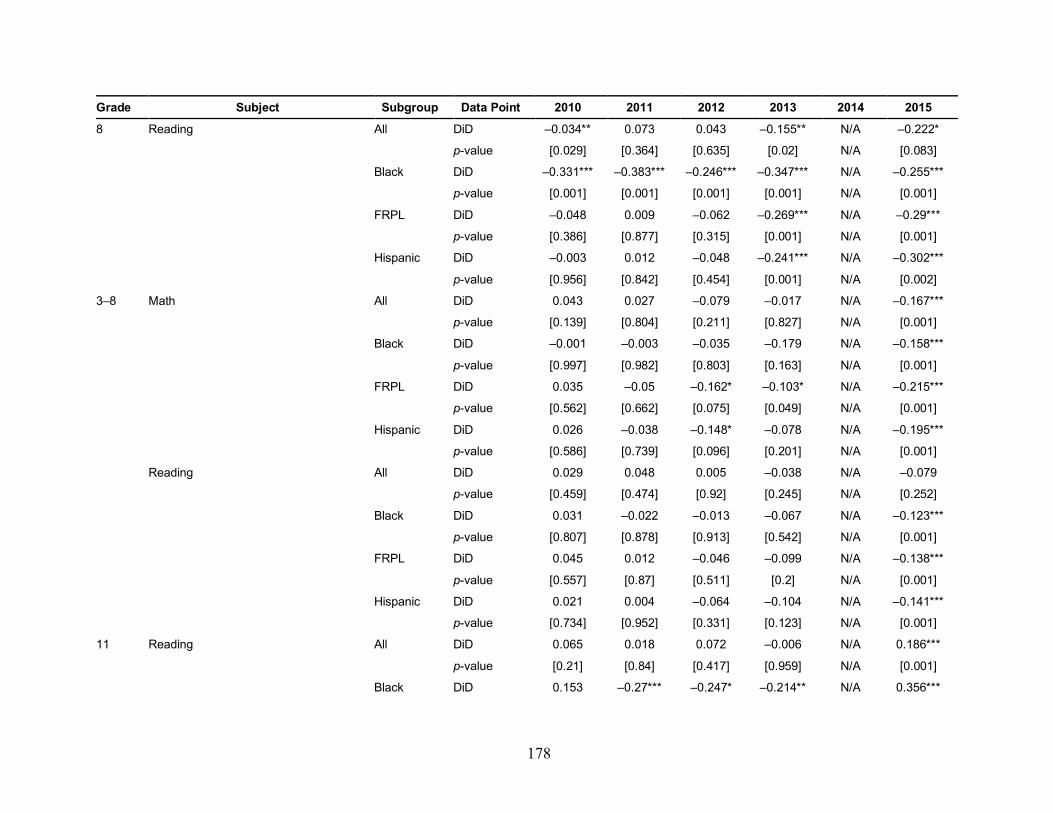
178
Grade Subject Subgroup Data Point 2010 2011 2012 2013 2014 2015 8 Reading All DiD –0.034** 0.073 0.043 –0.155** N/A –0.222*
p-value [0.029] [0.364] [0.635] [0.02] N/A [0.083]
Black DiD –0.331*** –0.383*** –0.246*** –0.347*** N/A –0.255***
p-value [0.001] [0.001] [0.001] [0.001] N/A [0.001]
FRPL DiD –0.048 0.009 –0.062 –0.269*** N/A –0.29***
p-value [0.386] [0.877] [0.315] [0.001] N/A [0.001]
Hispanic DiD –0.003 0.012 –0.048 –0.241*** N/A –0.302***
p-value [0.956] [0.842] [0.454] [0.001] N/A [0.002]
3–8 Math All DiD 0.043 0.027 –0.079 –0.017 N/A –0.167***
p-value [0.139] [0.804] [0.211] [0.827] N/A [0.001]
Black DiD –0.001 –0.003 –0.035 –0.179 N/A –0.158***
p-value [0.997] [0.982] [0.803] [0.163] N/A [0.001]
FRPL DiD 0.035 –0.05 –0.162* –0.103* N/A –0.215***
p-value [0.562] [0.662] [0.075] [0.049] N/A [0.001]
Hispanic DiD 0.026 –0.038 –0.148* –0.078 N/A –0.195***
p-value [0.586] [0.739] [0.096] [0.201] N/A [0.001]
Reading All DiD 0.029 0.048 0.005 –0.038 N/A –0.079
p-value [0.459] [0.474] [0.92] [0.245] N/A [0.252]
Black DiD 0.031 –0.022 –0.013 –0.067 N/A –0.123***
p-value [0.807] [0.878] [0.913] [0.542] N/A [0.001]
FRPL DiD 0.045 0.012 –0.046 –0.099 N/A –0.138***
p-value [0.557] [0.87] [0.511] [0.2] N/A [0.001]
Hispanic DiD 0.021 0.004 –0.064 –0.104 N/A –0.141***
p-value [0.734] [0.952] [0.331] [0.123] N/A [0.001]
11 Reading All DiD 0.065 0.018 0.072 –0.006 N/A 0.186***
p-value [0.21] [0.84] [0.417] [0.959] N/A [0.001]
Black DiD 0.153 –0.27*** –0.247* –0.214** N/A 0.356***

179
Grade Subject Subgroup Data Point 2010 2011 2012 2013 2014 2015 p-value [0.294] [0.001] [0.072] [0.02] N/A [0.001]
FRPL DiD –0.008 –0.147** –0.066 –0.16 N/A 0.104
p-value [0.934] [0.037] [0.429] [0.138] N/A [0.193]
Hispanic DiD –0.044 –0.108 –0.027 –0.135 N/A 0.081
p-value [0.63] [0.251] [0.743] [0.228] N/A [0.331]
HS Dropout rate, as a percentage All DiD 1.22 3.05* 1.4 1.46 0.53 2.63*
p-value [0.283] [0.088] [0.286] [0.383] [0.703] [0.06]
Black DiD 4.26** 5.24** 2.08 2.82 1.96 4.45**
p-value [0.033] [0.039] [0.442] [0.198] [0.454] [0.02]
Hispanic DiD 1.81 3.64** 1.34 0.97 0.79 2.57*
p-value [0.312] [0.044] [0.295] [0.588] [0.524] [0.063]
Graduation rate, as a percentage All DiD –2.35* –0.48 –2.32*** –3.22*** –5.06*** –6.61***
p-value [0.087] [0.723] [0.001] [0.001] [0.001] [0.001]
Black DiD 0.94 –3.12 –3.81 5.45 –0.21 –15.49***
p-value [0.716] [0.371] [0.184] [0.169] [0.955] [0.001]
Hispanic DiD –2.14 1.24 –1.51 –3.15** –5.79*** –6.89***
p-value [0.346] [0.452] [0.185] [0.03] [0.001] [0.002]
UC eligible, as a percentage All DiD 5.36** 7.43*** 7.49*** 1.23 6.43*** 7.26***
p-value [0.035] [0.001] [0.004] [0.826] [0.001] [0.001]
Black DiD 7.35 7.05* 7.02** 7.28 14.58*** –0.92
p-value [0.101] [0.057] [0.034] [0.375] [0.001] [0.87]
Hispanic DiD 6.33** 10.12*** 7.37*** –0.1 5.28*** 6.27***
p-value [0.011] [0.001] [0.003] [0.985] [0.001] [0.005]
CAHSEE math All DiD 0.07 0.05 0.13 0.2* 0.24** 0.21***
p-value [0.628] [0.697] [0.186] [0.072] [0.019] [0.001]
Black DiD –0.1 –0.21 0.15 –0.1 0.32* 0.18***
p-value [0.244] [0.464] [0.195] [0.189] [0.062] [0.005]

180
Grade Subject Subgroup Data Point 2010 2011 2012 2013 2014 2015 FRPL DiD 0.04 0.09 0.16 0.2* 0.23** 0.22***
p-value [0.768] [0.483] [0.104] [0.075] [0.014] [0.001]
Hispanic DiD 0.09 0.03 0.14 0.17 0.17* 0.2***
p-value [0.381] [0.828] [0.159] [0.115] [0.085] [0.001]
CAHSEE reading All DiD –0.11 –0.08 –0.01 –0.04 0.1 –0.05
p-value [0.216] [0.417] [0.925] [0.7] [0.221] [0.503]
Black DiD –0.24*** –0.36 0.02 –0.2 0.22*** 0.03
p-value [0.001] [0.132] [0.846] [0.222] [0.001] [0.504]
FRPL DiD –0.1 –0.06 –0.01 –0.02 0.11 0
p-value [0.361] [0.535] [0.913] [0.845] [0.157] [0.962]
Hispanic DiD –0.12 –0.08 –0.02 –0.02 0.1 0.02
p-value [0.234] [0.441] [0.816] [0.885] [0.181] [0.744]
NOTE: DiD represents the DiD estimate of the initiative’s effect on each outcome in each year. For more details on the DiD methodology, see Gutierrez, Weinberger, and Engberg, 2016. A difference value of 0.000 indicates a difference of less than 0.0005. For the dropout, graduation, and UC-eligible rates, we used a logit model to estimate the predicted trends to take into account the bounded range of these estimates. Standardized testing for math was not administered in grade 8 until 2015, so we did not estimate effects on grade 8 math scores. In 2014, California started to implement a new standardized test and did not publish results for the first year of the test. CAHSEE is an HS exit exam required of all students to graduate that can be taken up to three times, beginning in the second semester of grade 10. *** = significant at p < 0.01. ** = significant at p < 0.05. * = significant at p < 0.10.
Table U.5. Aspire Impact Estimates, by Grade, Subgroup, and Year
Grade Subject Subgroup Data Point 2010 2011 2012 2013 2014 2015 3 Math All DiD –0.003 –0.067*** –0.01 0.059** N/A –0.109***
p-value [0.841] [0.001] [0.623] [0.019] N/A [0.001]
Black DiD 0.006 –0.103*** –0.048 –0.039 N/A –0.221***
p-value [0.82] [0.004] [0.327] [0.47] N/A [0.001]
FRPL DiD 0.002 –0.072*** –0.011 0.01 N/A –0.145***
p-value [0.869] [0.001] [0.632] [0.709] N/A [0.001]
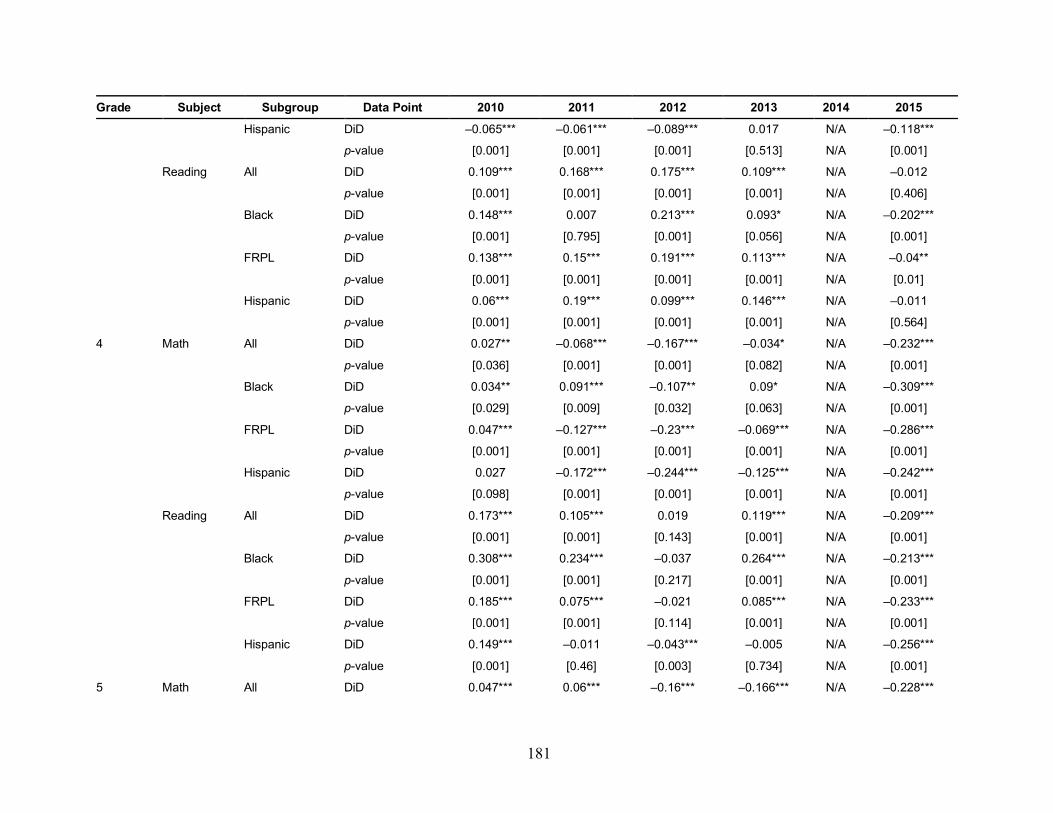
181
Grade Subject Subgroup Data Point 2010 2011 2012 2013 2014 2015 Hispanic DiD –0.065*** –0.061*** –0.089*** 0.017 N/A –0.118***
p-value [0.001] [0.001] [0.001] [0.513] N/A [0.001]
Reading All DiD 0.109*** 0.168*** 0.175*** 0.109*** N/A –0.012
p-value [0.001] [0.001] [0.001] [0.001] N/A [0.406]
Black DiD 0.148*** 0.007 0.213*** 0.093* N/A –0.202***
p-value [0.001] [0.795] [0.001] [0.056] N/A [0.001]
FRPL DiD 0.138*** 0.15*** 0.191*** 0.113*** N/A –0.04**
p-value [0.001] [0.001] [0.001] [0.001] N/A [0.01]
Hispanic DiD 0.06*** 0.19*** 0.099*** 0.146*** N/A –0.011
p-value [0.001] [0.001] [0.001] [0.001] N/A [0.564]
4 Math All DiD 0.027** –0.068*** –0.167*** –0.034* N/A –0.232***
p-value [0.036] [0.001] [0.001] [0.082] N/A [0.001]
Black DiD 0.034** 0.091*** –0.107** 0.09* N/A –0.309***
p-value [0.029] [0.009] [0.032] [0.063] N/A [0.001]
FRPL DiD 0.047*** –0.127*** –0.23*** –0.069*** N/A –0.286***
p-value [0.001] [0.001] [0.001] [0.001] N/A [0.001]
Hispanic DiD 0.027 –0.172*** –0.244*** –0.125*** N/A –0.242***
p-value [0.098] [0.001] [0.001] [0.001] N/A [0.001]
Reading All DiD 0.173*** 0.105*** 0.019 0.119*** N/A –0.209***
p-value [0.001] [0.001] [0.143] [0.001] N/A [0.001]
Black DiD 0.308*** 0.234*** –0.037 0.264*** N/A –0.213***
p-value [0.001] [0.001] [0.217] [0.001] N/A [0.001]
FRPL DiD 0.185*** 0.075*** –0.021 0.085*** N/A –0.233***
p-value [0.001] [0.001] [0.114] [0.001] N/A [0.001]
Hispanic DiD 0.149*** –0.011 –0.043*** –0.005 N/A –0.256***
p-value [0.001] [0.46] [0.003] [0.734] N/A [0.001]
5 Math All DiD 0.047*** 0.06*** –0.16*** –0.166*** N/A –0.228***

182
Grade Subject Subgroup Data Point 2010 2011 2012 2013 2014 2015 p-value [0.001] [0.001] [0.001] [0.001] N/A [0.001]
Black DiD 0.526*** 0.383*** 0.07 –0.295*** N/A –0.345***
p-value [0.001] [0.001] [0.157] [0.001] N/A [0.001]
FRPL DiD 0.024* 0.075*** –0.177*** –0.182*** N/A –0.225***
p-value [0.064] [0.001] [0.001] [0.001] N/A [0.001]
Hispanic DiD 0.004 0.009 –0.23*** –0.208*** N/A –0.244***
p-value [0.846] [0.663] [0.001] [0.001] N/A [0.001]
Reading All DiD 0.104*** 0.092*** –0.02 –0.011 N/A –0.141***
p-value [0.001] [0.001] [0.114] [0.466] N/A [0.001]
Black DiD 0.229*** 0.275*** 0.103** –0.183*** N/A –0.306***
p-value [0.001] [0.001] [0.01] [0.001] N/A [0.001]
FRPL DiD 0.089*** 0.074*** –0.071*** –0.061*** N/A –0.116***
p-value [0.001] [0.001] [0.001] [0.002] N/A [0.001]
Hispanic DiD 0.049*** 0.057*** –0.089*** –0.032* N/A –0.118***
p-value [0.001] [0.001] [0.001] [0.061] N/A [0.001]
6 Math All DiD –0.021 –0.116*** –0.14*** –0.332*** N/A –0.32***
p-value [0.118] [0.001] [0.001] [0.001] N/A [0.001]
Black DiD 0.128*** 0.245*** 0.385*** –0.052 N/A 0.022
p-value [0.001] [0.001] [0.001] [0.204] N/A [0.625]
FRPL DiD 0.053*** –0.067*** –0.103*** –0.273*** N/A –0.199***
p-value [0.001] [0.001] [0.001] [0.001] N/A [0.001]
Hispanic DiD 0.005 –0.101*** –0.16*** –0.342*** N/A –0.244***
p-value [0.728] [0.001] [0.001] [0.001] N/A [0.001]
Reading All DiD 0.034*** 0.007 0.015 –0.112*** N/A –0.171***
p-value [0.001] [0.471] [0.158] [0.001] N/A [0.001]
Black DiD 0.085*** 0.19*** 0.35*** 0.015 N/A 0.009
p-value [0.005] [0.001] [0.001] [0.687] N/A [0.835]

183
Grade Subject Subgroup Data Point 2010 2011 2012 2013 2014 2015 FRPL DiD 0.033** –0.065*** –0.067*** –0.168*** N/A –0.165***
p-value [0.013] [0.001] [0.001] [0.001] N/A [0.001]
Hispanic DiD 0.004 –0.051*** –0.127*** –0.262*** N/A –0.208***
p-value [0.756] [0.001] [0.001] [0.001] N/A [0.001]
7 Math All DiD 0.203*** –0.042** –0.224*** –0.199*** N/A –0.336***
p-value [0.001] [0.04] [0.001] [0.001] N/A [0.001]
Black DiD –0.149*** 0.072** 0.121** –0.081** N/A –0.381***
p-value [0.001] [0.037] [0.044] [0.032] N/A [0.001]
FRPL DiD 0.04* –0.192*** –0.393*** –0.375*** N/A –0.493***
p-value [0.059] [0.001] [0.001] [0.001] N/A [0.001]
Hispanic DiD 0.105*** –0.236*** –0.358*** –0.384*** N/A –0.512***
p-value [0.001] [0.001] [0.001] [0.001] N/A [0.001]
Reading All DiD 0.079*** 0.052*** –0.073*** 0.012 N/A –0.177***
p-value [0.001] [0.001] [0.001] [0.379] N/A [0.001]
Black DiD –0.147*** –0.071** 0.054 –0.033 N/A –0.234***
p-value [0.001] [0.015] [0.311] [0.381] N/A [0.001]
FRPL DiD –0.03 –0.08*** –0.227*** –0.156*** N/A –0.305***
p-value [0.116] [0.001] [0.001] [0.001] N/A [0.001]
Hispanic DiD 0.015 –0.108*** –0.183*** –0.137*** N/A –0.276***
p-value [0.447] [0.001] [0.001] [0.001] N/A [0.001]
8 Reading All DiD –0.02 –0.023* –0.068*** –0.234*** N/A –0.377***
p-value [0.096] [0.083] [0.001] [0.001] N/A [0.001]
Black DiD –0.331*** –0.383*** –0.246*** –0.347*** N/A –0.255***
p-value [0.001] [0.001] [0.001] [0.001] N/A [0.001]
FRPL DiD –0.027* –0.119*** –0.193*** –0.373*** N/A –0.456***
p-value [0.078] [0.001] [0.001] [0.001] N/A [0.001]
Hispanic DiD 0.038** –0.087*** –0.15*** –0.322*** N/A –0.46***

184
Grade Subject Subgroup Data Point 2010 2011 2012 2013 2014 2015 p-value [0.02] [0.001] [0.001] [0.001] N/A [0.001]
3–8 Math All DiD 0.023*** –0.063*** –0.136*** –0.148*** N/A –0.24***
p-value [0.005] [0.001] [0.001] [0.001] N/A [0.001]
Black DiD 0.077*** 0.069*** 0.023 –0.123*** N/A –0.192***
p-value [0.001] [0.001] [0.244] [0.001] N/A [0.001]
FRPL DiD 0.017 –0.095*** –0.166*** –0.182*** N/A –0.256***
p-value [0.213] [0.001] [0.001] [0.001] N/A [0.001]
Hispanic DiD 0.012 –0.103*** –0.172*** –0.183*** N/A –0.241***
p-value [0.392] [0.001] [0.001] [0.001] N/A [0.001]
Reading All DiD 0.086*** 0.078*** 0.009 –0.019* N/A –0.172***
p-value [0.001] [0.001] [0.31] [0.059] N/A [0.001]
Black DiD 0.097*** 0.057*** 0.04 –0.013 N/A –0.147***
p-value [0.001] [0.001] [0.136] [0.532] N/A [0.001]
FRPL DiD 0.09*** 0.024*** –0.026*** –0.053*** N/A –0.23***
p-value [0.001] [0.001] [0.001] [0.001] N/A [0.001]
Hispanic DiD 0.047*** 0.006 –0.059*** –0.081*** N/A –0.237***
p-value [0.001] [0.491] [0.001] [0.001] N/A [0.001]
NOTE: DiD represents the DiD estimate of the initiative’s effect on each outcome in each year. For more details on the DiD methodology, see Gutierrez, Weinberger, and Engberg, 2016. A difference value of 0.000 indicates a difference of less than 0.0005. Aspire did not administer any standardized testing for math for grade 8 until 2015, so we did not estimate effects on grade 8 math scores. In 2014, California started to implement a new standardized test and did not publish results for the first year of the test. *** = significant at p < 0.01. ** = significant at p < 0.05. * = significant at p < 0.10.
Table U.6. Green Dot Impact Estimates, by Grade, Subgroup, and Year
Grade Subject Subgroup Data Point 2010 2011 2012 2013 2014 2015 11 Reading All DiD 0.017 –0.067*** –0.007 –0.074*** N/A 0.192***
p-value [0.205] [0.001] [0.685] [0.001] N/A [0.001]
Black DiD 0.125*** –0.108* –0.266*** –0.243*** N/A 0.419***
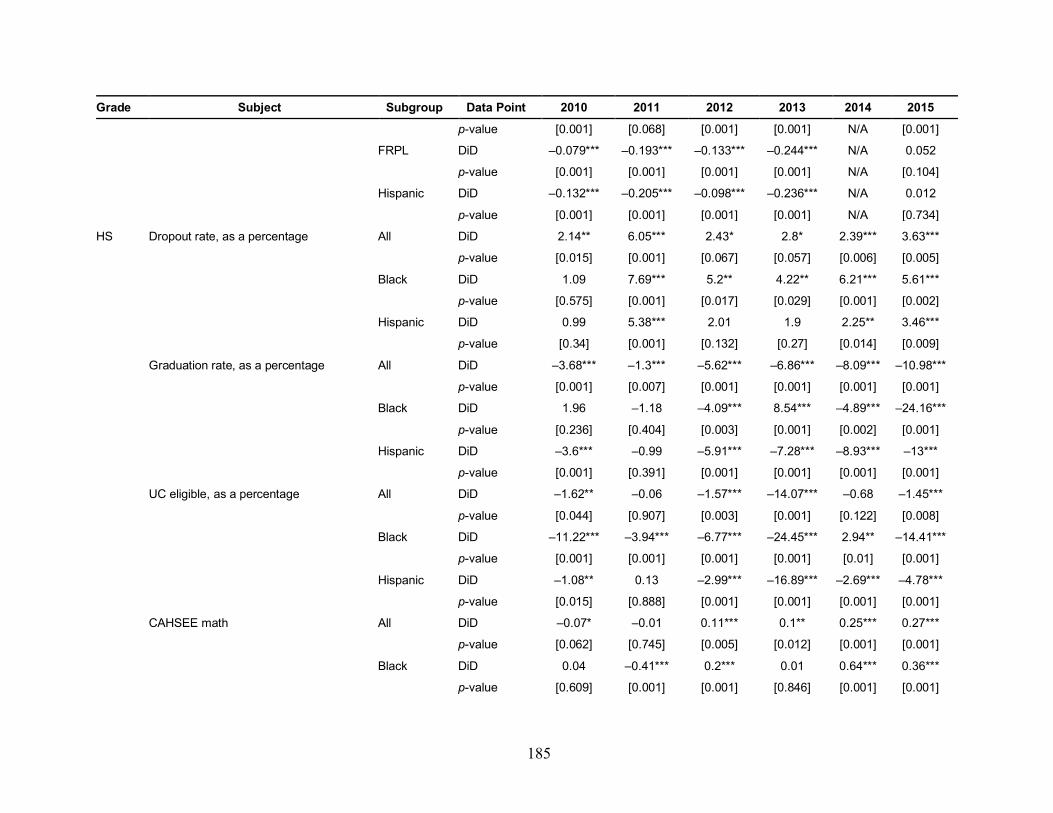
185
Grade Subject Subgroup Data Point 2010 2011 2012 2013 2014 2015 p-value [0.001] [0.068] [0.001] [0.001] N/A [0.001]
FRPL DiD –0.079*** –0.193*** –0.133*** –0.244*** N/A 0.052
p-value [0.001] [0.001] [0.001] [0.001] N/A [0.104]
Hispanic DiD –0.132*** –0.205*** –0.098*** –0.236*** N/A 0.012
p-value [0.001] [0.001] [0.001] [0.001] N/A [0.734]
HS Dropout rate, as a percentage All DiD 2.14** 6.05*** 2.43* 2.8* 2.39*** 3.63***
p-value [0.015] [0.001] [0.067] [0.057] [0.006] [0.005]
Black DiD 1.09 7.69*** 5.2** 4.22** 6.21*** 5.61***
p-value [0.575] [0.001] [0.017] [0.029] [0.001] [0.002]
Hispanic DiD 0.99 5.38*** 2.01 1.9 2.25** 3.46***
p-value [0.34] [0.001] [0.132] [0.27] [0.014] [0.009]
Graduation rate, as a percentage All DiD –3.68*** –1.3*** –5.62*** –6.86*** –8.09*** –10.98***
p-value [0.001] [0.007] [0.001] [0.001] [0.001] [0.001]
Black DiD 1.96 –1.18 –4.09*** 8.54*** –4.89*** –24.16***
p-value [0.236] [0.404] [0.003] [0.001] [0.002] [0.001]
Hispanic DiD –3.6*** –0.99 –5.91*** –7.28*** –8.93*** –13***
p-value [0.001] [0.391] [0.001] [0.001] [0.001] [0.001]
UC eligible, as a percentage All DiD –1.62** –0.06 –1.57*** –14.07*** –0.68 –1.45***
p-value [0.044] [0.907] [0.003] [0.001] [0.122] [0.008]
Black DiD –11.22*** –3.94*** –6.77*** –24.45*** 2.94** –14.41***
p-value [0.001] [0.001] [0.001] [0.001] [0.01] [0.001]
Hispanic DiD –1.08** 0.13 –2.99*** –16.89*** –2.69*** –4.78***
p-value [0.015] [0.888] [0.001] [0.001] [0.001] [0.001]
CAHSEE math All DiD –0.07* –0.01 0.11*** 0.1** 0.25*** 0.27***
p-value [0.062] [0.745] [0.005] [0.012] [0.001] [0.001]
Black DiD 0.04 –0.41*** 0.2*** 0.01 0.64*** 0.36***
p-value [0.609] [0.001] [0.001] [0.846] [0.001] [0.001]

186
Grade Subject Subgroup Data Point 2010 2011 2012 2013 2014 2015 FRPL DiD –0.07** 0 0.14*** 0.07* 0.22*** 0.27***
p-value [0.042] [0.962] [0.001] [0.076] [0.001] [0.001]
Hispanic DiD 0.01 –0.07* 0.09** 0.02 0.16*** 0.26***
p-value [0.838] [0.053] [0.046] [0.648] [0.001] [0.001]
CAHSEE reading All DiD –0.22*** –0.19*** –0.09** –0.21*** –0.02 –0.09**
p-value [0.001] [0.001] [0.03] [0.001] [0.524] [0.044]
Black DiD –0.13** –0.54*** 0.01 –0.23*** 0.35*** 0.14***
p-value [0.026] [0.001] [0.884] [0.001] [0.001] [0.002]
FRPL DiD –0.21*** –0.19*** –0.08** –0.21*** –0.01 –0.04
p-value [0.001] [0.001] [0.036] [0.001] [0.791] [0.292]
Hispanic DiD –0.26*** –0.23*** –0.11*** –0.23*** –0.02 –0.03
p-value [0.001] [0.001] [0.009] [0.001] [0.42] [0.491]
NOTE: DiD represents the DiD estimate of the initiative’s effect on each outcome in each year. For more details on the DiD methodology, see Gutierrez, Weinberger, and Engberg, 2016. A difference value of 0.000 indicates a difference of less than 0.0005. For the dropout, graduation, and UC-eligible rates, we used a logit model to estimate the predicted trends to take into account the bounded range of these estimates. In 2014, California started to implement a new standardized test and did not publish results for the first year of the test. CAHSEE is an HS exit exam required of all students to graduate that can be taken up to three times, beginning in the second semester of grade 10. *** = significant at p < 0.01. ** = significant at p < 0.05. * = significant at p < 0.10.