improving the nutritional quality of street foods to
TRANSCRIPT

i
IMPROVING THE NUTRITIONAL QUALITY OF STREET FOODS TO BETTER MEET THE
MICRONUTRIENT NEEDS OF SCHOOLCHILDREN IN
URBAN AREAS

ii
Food and Agriculture Organization and Sokoine University, 2006 Acknowledgements FAO would like to express appreciation to those who contributed to this report. Joyce Kinabo PhD, Associate Professor of Nutrition, Sokoine University, Tanzania, Cornellio Nyaruhucha PhD, Associate Professor of Nutrition, Sokoine University, Tanzania, Kissa Kulwa, M.Sc. Lecturer Nutrition, Sokoine University, Tanzania, Jeckoniah John, Victor George and Lago Sillo carried out the research and wrote the report. Guy Nantel, Gina Kennedy and Janice Albert of the Nutrition and Consumer Protection Division provided comments on the draft.
The designations employed and the presentation of material in this information product do not imply the expression of any opinion whatsoever on the part of the Food and Agriculture Organization of the United Nations concerning the legal or development status of any country, territory, city or area or of its authorities, or concerning the delimitation of its frontiers or boundaries. The mention of specific companies or products of manufacturers, whether or not these have been patented, does not imply that these have been endorsed or recommended by the Food and Agriculture Organization of the United Nations in preference to others of a similar nature that are not mentioned. The views expressed in this publication are those of the author(s) and do not necessarily reflect the views of the Food and Agriculture Organization of the United Nations. ��������������� ������� �������� � ����������������������������������������� �������� ��������������������������������������������������� ���������������������������������������������������� �������� � �������������������������� �� ������� ������������������������������������� ������������������������������������������������� ���������������������������������������� ������������������������������������ ����� ��� ������������� ���������!���������!�������� �"������#��������������������$��������%�&��'����� �����(����� �������������))*+,�������-���������������������������.���������
/�%�&�01))23�

iii
TABLE OF CONTENTS
TABLE OF CONTENTS............................................................................................................................ iii LIST OF TABLES .......................................................................................................................................v LIST OF ANNEXES ...................................................................................................................................vi BACKGROUND AND JUSTIFICATION....................................................................................................1 OBJECTIVES ..............................................................................................................................................2 Preparation for the study...............................................................................................................................2 METHODOLOGY .......................................................................................................................................2
Description of the study area ................................................................................................................... 2 Sampling procedure ................................................................................................................................. 3 Survey tools ............................................................................................................................................. 4 Interviews ................................................................................................................................................ 4 Anthropometry ......................................................................................................................................... 4 Weight..................................................................................................................................................... 4 Height measurement ................................................................................................................................ 5
Data analysis ................................................................................................................................................5 RESULTS ....................................................................................................................................................6
Characteristics of the surveyed schools .................................................................................................... 6 STREET FOOD VENDORS ........................................................................................................................6
Profile of the vendors and the street foods sold to pupils .......................................................................... 6 Name of food .............................................................................................................................................. 6 Socio-demographic and economic characteristics of the interviewed street food vendors ......................... 9 Socio-demographic characteristics ..........................................................................................................14 Gender....................................................................................................................................................14 Age.........................................................................................................................................................14 Food consumption ..................................................................................................................................14 Purchase of street foods ..........................................................................................................................15 Money for buying street foods ................................................................................................................15 Criteria for choice of vendor ...................................................................................................................16 Types of food consumed during breakfast ...............................................................................................17 Lunch .....................................................................................................................................................20 Afternoon snacks consumed by school children ......................................................................................20 After dinner snacks .................................................................................................................................20 Safety of street foods ..............................................................................................................................21 Lunch .....................................................................................................................................................25 Snacks consumed by school children (24 h recall)...................................................................................27 After lunch snacks ..................................................................................................................................27
NUTRITIONAL STATUS OF SCHOOL CHILDREN...............................................................................29 DISCUSSION ............................................................................................................................................33
Street food vendors .................................................................................................................................33 Infrastructure ..........................................................................................................................................33 Nutritional quality of street foods............................................................................................................33 Hygiene and safety of street foods ..........................................................................................................34 Improving the nutritional quality of street foods......................................................................................35 Primary school education System of Tanzania ........................................................................................35 Purchase of street foods ..........................................................................................................................36 Money for buying street foods ................................................................................................................36

iv
Criteria for choice of vendors..................................................................................................................37 Types of foods consumed by school children ..........................................................................................37 Nutritional status of school children........................................................................................................37 Nutritional status of school children by height-for–age ...........................................................................38 Focus group discussions with vendors.....................................................................................................39 Nutritional quality...................................................................................................................................39 Food safety and food hygiene .................................................................................................................40 Focus group discussions with Parents and Teachers ................................................................................41 Street foods.............................................................................................................................................41 Alternative options to street foods...........................................................................................................41 Food safety .............................................................................................................................................42 Conclusion..............................................................................................................................................42
References..................................................................................................................................................42 STRATEGY TO IMPROVE THE NUTRITIONAL QUALITY OF STREET FOODS SOLD TO SCHOOLCHILDREN ................................................................................................................................43

v
LIST OF TABLES Table 1: A list of schools selected and date of interviews......................................................... 3 Table 2: Inventory of most common foods vended on school grounds of 20 selected schools6 Table 3: Reasons cited by vendors for not registering their businesses ................................... 10 Table 4: Time it takes from vending site to the water source .................................................. 10 Table 5: Source of ingredients used to prepare street foods (multiple answers possible) ......... 11 Table 6: Criteria used by vendors to select ingredients for meal preparation........................... 11 Table 7: Strategies used by vendors to minimize cost of ingredients ...................................... 11 Table 8: Ingredients and methods of preparation for meals/snacks sold to school children ..... 12 Table 9: Use of vegetables and fruits and their potential as food items in school children’ meals12 Table 10: Vendors’ constraints to increased use of vegetables and fruits ................................ 13 Table 11: Age of school children ........................................................................................... 14 Table 12: The proportion of school children that eat breakfast at home before they leave home for school 15 Table 13: The proportion of school children that get less than 100 TZS and more than 100 TZS to purchase
street foods at school ............................................................................................ 16 Table 14: Main Criteria for choice of vendor (multiple responses possible) ........................... 17 Table 15: Types of street food typically purchased for breakfast ............................................ 17 Table 16: Mid-morning snacks consumed by school children................................................. 18 Table 17: Morning snacks consumed by school children in the different schools surveyed..... 19 Table 18: Afternoon snacks consumed by school children ..................................................... 20 Table 19: After dinner snacks consumed by school children .................................................. 21 Table 20: Foods less safe to eat from street vendors............................................................... 21 Table 21: Reasons for the foods to be unsafe ......................................................................... 22 Table 22: Types of foods consumed during breakfast............................................................. 22 Table 23: Types of snacks consumed by school children during mid-morning ....................... 23 Table 24: Types of foods consumed by school children in different schools........................... 24 Table 25: Types of foods consumed by school children for lunch .......................................... 25 Dinner 27 Table 27: Types of food consumed by school children for dinner........................................... 27 Table 28: After lunch snacks consumed by school children.................................................... 28 Table 29: Evening snacks consumed by school children during the period of 24 hours immediately prior to
the day of the survey ............................................................................................ 28 Table 30: After dinner snacks consumed by school children .................................................. 29 Table 31: Nutritional status of school children (sexes combined) according to height for age 29 Table 32: Nutritional status of school children according to age for boys ............................... 30 Table 33: Nutritional status of school children according to age for girls ............................... 30 Table 34: Nutritional status (HAZ) of children according to age and sex................................ 31 Table 35: Summary of nutritional status (BMI-for-age) of children according to schools ....... 32

vi
LIST OF ANNEXES Annex 1: Background characteristics of the schools surveyed................................................ 46 Annex 2: General Observations ............................................................................................. 47 Annex 3: Focus Group Discussions with Vendors.................................................................. 49 Annex 4: Focus Group Discussions with Parents and Teachers .............................................. 53 Annex 5: The Survey Tool Used for Data Collection ............................................................. 57 Annex 6: The Survey Team from Sokoine University of Agriculture and Rome..................... 75
1
BACKGROUND AND JUSTIFICATION Micronutrient malnutrition affects one in every three persons living in sub-Saharan Africa. Women and children are most severely affected by micronutrient malnutrition, particularly deficiencies of iron, iodine and vitamin A. Between 40-80 percent of children in the region are iron deficient and forty percent of children under 6 years of age do not get enough vitamin A. For children micronutrient malnutrition affects their health, growth and ability to concentrate in school. Even small improvements in the nutritional quality of the foods children consume can increase their micronutrient intake and therefore improve their health. Consumption of street foods, or ready prepared foods marketed in public areas of urban neighbourhoods, is an important food security strategy for a large number of urban residents, particularly the urban poor. Working men, primary school children and older students consume the largest amount of street foods. Often school children are given a small amount of money to purchase breakfast on the way to school or a snack during the school break, yet little attention is paid to the nutritional quality of the snacks and meals being consumed. In Ghana, it was noticed that children were using this money to purchase candies and other foods of low nutritional value (Johnson and Yawson, 2000). More attention needs to be drawn to the nutritional quality of the foods sold in the vicinity of the schoolyard and strategies devised to encourage the sale and purchase of the most nutritionally advantageous foods. There has been a substantial amount of research, by FAO and others related to food safety and hygiene of street foods, yet little is known about the nutritional quality of street foods. A study in Nairobi which investigated the nutritional contribution of street foods found that non-home prepared foods contributed to 13-36% of dietary energy; 11-20% of vitamin A intake and 7-20% of iron intake of urban residents (van t’Riet, 2002). Street foods comprise a wide array of products ranging from small snacks to full meals, therefore the assessment of the contribution of street foods to the diet needs to also take into account the niche, which street foods fill, in the individual diet. The broad motivation for this FAO funded study was to gain a better understanding of the importance of street food in the diets of school age children and identify opportunities and constraints to improving the nutritional quality of their diet through interventions with food vendors. This study focused on two groups, primary school children and vendors. The primary focus was on street food vendors and the factors, which influence the food they prepare, with an effort to understand the constraints and opportunities available to improve the nutritional quality of the food they sell. Particular attention was given to under-utilized/wild foods, with high micronutrient content and a potential market in urban areas. Some of the following questions were answered through interviews with street food vendors, schoolteachers and observations of the vending environment at schools. Answers are provided in the results section:
i) What are the most commonly prepared street foods sold to children around schools in urban areas?
ii) What are the primary factors determining the food sold? (price, convenience, consumer preference/demand, relationship to wholesaler, market availability)
iii) How can the foods sold to children be nutritionally improved? iv) What are the main constraints to improving the nutritional quality of the foods sold
around schools? v) What are the opportunities, particularly for greater use of traditional/indigenous foods? vi) What are the most important needs to improve street foods business?
While food safety is not the primary concern of the current study, it may be a significant impediment to capitalizing on the nutritional benefits gained though improving the nutritional quality of food. A brief section on the core food safety constraints was included. Questions related to this area included access to clean water during food preparation and handling, system for cleaning utensils, plates,

2
cookware and cooking surfaces, and food safety constraints related to the sale of perishable products including dairy and fresh fruit. School children were also involved to gain a better understanding of the following questions: Assessment of students eating behaviour and reliance on street food and the types and quantities of street foods typically purchased. OBJECTIVES The overall objective of this study was to assess the potential to improve the nutritional quality, particularly the micronutrient density of street foods. In particular, the study focused on foods sold to children nearby school areas. The specific objectives of the study were to:
i) Identify factors that influence the foods street food vendors purchase and sell to school children (cost, convenience, availability of foods in the market)
ii) Examine vendors constraints and opportunities related to improving the nutritional quality of street foods
iii) Develop strategies to improve the nutritional quality of street foods, particularly those foods sold to school children
iv) Assess the dietary intake patterns and nutritional status of school children Preparation for the study Researchers from Sokoine University of Agriculture, Department of Food Science and Technology carried out the study. Preparation and planning for the study began in April 2005. Three planning meetings were conducted in Dar es Salaam. The first was to meet the officials at the Ministry of Education, explain the purpose of the project and obtain a list of schools in three municipalities of the city namely, Kinondoni, Temeke and Ilala. Out of the three Municipalities in Dar es Salaam, the Municipality of Kinondoni was selected, as it is a large urban/peri-urban area. The schools to be included in the study were selected randomly from the list of all primary schools in Kinondoni. However, the private schools were later eliminated from the sampled schools because they provide school meals, and so pupils do not buy foods from vendors around the schools. Permission to carry out the study was obtained from the Vice-Chancellor of Sokoine University of Agriculture and the permission was sent to Kinondoni Municipality during the second trip. A third trip to Dar es Salaam was conducted after the schools to be included in the survey had been determined. Each school selected was visited and given a copy of the letter of permission from the Vice-Chancellor and that of Kinondoni Municipality, the purpose of the study was explained and a date for the visit to each school was agreed upon and fixed. METHODOLOGY Description of the study area Dar es Salaam city is located along the East African Coast line at latitude 6o48′ and longitude 39o17�. It has an area of 139 Km2 and a population of 2.5 million. Three municipalities namely, Kinondoni, Ilala and Temeke constitute the city of Dar es Salaam. The climate is typically tropical. Temperatures range between 26oC and 40oC. It has two rainy seasons: short rains October to December and long rains between March and May. The main ethnic group is the Zaramo. However, during the 20th century the population became a mix of many tribes. Thus the population is a mixture of people from all parts of Tanzania. This has a significant influence on attitude, behaviour and perception about various issues affecting the community.

3
Kinondoni municipality was selected among the three municipalities to represent the city in the present study. Kinondoni was chosen for the survey due to its mixture of urban and peri-urban areas and large number of public schools. The municipality is bordered by Indian Ocean to the North East, Ilala Municipality to the South, Bagamoyo District to the North, Kibaha District to the West and Kisarawe District to the South West (Map1). The government in 2000 officially established the municipality.
Map 1: Location of the Dar es Salaam city Sampling procedure A list of all public and private schools in Kinondoni municipality was obtained from the Ministry of Education. A sample of 24 schools was randomly selected from the list of all schools in Kinondoni. This included 4 private schools and 20 public schools. After further inquiry it was discovered that private schools have school meal service and therefore the children were not likely to consume street foods and there would be no street food vendors to interview on the premises therefore the four private schools were not included in the study. The sample size for the pupils was calculated on the basis of the average classroom size of 45 pupils, which meant that the sample size would be 900 pupils over and above the estimated sample size of 740 pupils. However, during the survey it was observed that the average class size was about 60 pupils. Therefore it was decided that no replacement for private schools was needed. However, one of the randomly selected schools was replaced due to remote location and replaced with a school in the peri-urban zone of Kinondoni. The total number of schools surveyed was 20. These included schools situated in rural (5), urban (2) as well as in peri-urban (13) areas . The schools that were selected are listed in Table 1. Table 1: A list of schools selected and date of interviews
S No. Name of the school Location Date of interview 1 Bunju A Bunju 15/8/2005 2 Boko Bunju “
3 Mtambani Boko “
4 Kunguru (Meroe) Goba 16/8/2005 5 Sinza Sinza “
6 Reginald Mengi Sinza “ 7 Makongo Kawe 17/8/2005 8 Mbezi Beach Kawe “ 9 Kijitonyama Kijitonyama 18/8/2005 10 Kumbukumbu Kinondoni Biafra 18/8/2005 11 Msisiri Kinondoni Mahakamani 18/8/2005 12 Mzimuni Mzimuni 19/8/2005 13 Hekima Tandale Sokoni “ 14 Kilimani Manzese Uzuri “
15 Muungano Mburahati 22/8/2005 16 Ukombozi Manzese-TipTop “ 17 Barafu (Magomeni) Mburahati “ 19 Mlimani Ubungo “ 20 Makuburi Jeshini Ubungo External “
��������������� ����������
������������� ����

4
Survey tools Questionnaires for students and vendors were prepared in English and translated into Kiswahili. A pre-test was conducted in a school in Morogoro. Based on findings from the pre-test the questionnaires were revised. A template program was written in SPSS to facilitate data entry and analysis. Three different focus group discussion guides were prepared; one for vendors, one for parents and teachers and one for students. The guides were discussed and revised and then translated into Kiswahili. It was decided that there was no need to conduct focus groups discussions with pupils as a large number of them completed the guided, self-administered questionnaires. Interviews Schools pupils: School pupils were interviewed using a semi-structured questionnaire. Random numbers were generated to determine whether to interview students in class five or class six. The decision to interview pupils in classes V and VI was based on the level of perception and comprehension. In every school the number of classes of the grade to be interviewed was obtained and one class chosen at random (in case of more than one class for each grade) by the head teacher or class teacher. All pupils in the chosen class were given a questionnaire and asked to complete it. A trained enumerator from the Sokoine University facilitated the completion of the questionnaire. After the initial two days of survey work, it was decided to continue only with children in grade six as comprehension of the questions was poor for many pupils in grade five and this was compromising the reliability of the survey results.
Vendors: An inventory of all foods and the cost of each item being sold by the vendors at each school were compiled by one of the researchers. Two vendors from each school were then selected randomly among the vendors for an in-depth interview using a semi-structured questionnaire. A total of 40 vendors were interviewed.
Anthropometry All children completing a questionnaire were weighed and height measured to determine their nutritional status. Weight Weight was taken to the nearest 0.1 kilogram using SECA digital bathroom scales (SECA Vogel & Halke Hamburg Model 881 1321009, Germany). One of the scales was not a SECA digital and only measured to the nearest 0.5 Kg. (Analog Personal scale – Precision line (Momert, Hungary) max. 125kg (1kg graduation). Data of children weighed with this scale were analysed separately. Children were asked to remove their shoes

5
and any heavy garments such as jackets or sweaters before stepping on the scale. Height measurement Height was measured to the nearest 0.1 centimetres using a height metre (SECA Bodymeter 208 Design No. 1013522) or stadiometer (Holtain Ltd. UK). The measurement was taken while the subject was standing without shoes, on a horizontal plate attached to the base of the stadiometer with her/his heels together; and stretched upwards to a full extent and the head in the Frankfurt plane. The subject was closely observed to ensure that the heels remained on the ground and that the head was in upright position during the measurement. The headboard was then brought down on the subject’s head and the reading recorded. Assessment of nutritional status Assessment of nutritional status was done using EPIINFO package and the indicators and height for age Z scores and BMI for age were used to classify children according to degree of nutritional status. The following cut-off points were used to define different categories. Cut-off points for the indicator height for age (Z-scores)
�
Z-score Definition -3 and below Severe stunting -2.99 to –2 Moderate stunting -1.99 to –1 Mild stunting -.99 to 1 Normal 1.01 to 2 Tall
�
Cut-off points for BMI for age
BMI Definition Below 5th percentile Underweight 5th – 85th Normal 86th – 95th Overweight Above 95th Obese
Data analysis Non-parametric data were coded, entered and analysed using a Statistical Package for Social Sciences (SPSS for Windows version 11.5) (Norusis, 1993). Parametric (anthropometric) data were entered on to a computer and Z-scores for weight – for- age (W/A); height - for –age (H/A); and weight – for – height (W/H) indicators were calculated using EPIINFO package (version 6.01). Descriptive statistics (mean, SD, frequencies and comparisons) was used to summarise the data. This was done using the SPSS for windows.

6
RESULTS Characteristics of the surveyed schools A total of 20 primary schools were visited. Their background characteristics are summarized in Annex 1. A typical schools’ schedule was as follows: Classes start at 7.30 or 8.00 am; first break is from 10.00 am to 10:30 am; second break is from 12:00am to 12:15pm; and classes end at 2:00 pm. There is an opportunity for pupils to stay on for extra tuition. Tuition classes in many primary schools start at 3.00 and end at 4.30 pm. A total of 1180 pupils in grades (or standard) V and VI were interviewed. Class size ranged from 30 to 78 with an average of 59 pupils per school. No school was found to provide meals for the pupils. The availability of safe and clean water varied among the schools; 9 had access to tap water, 6 had protected water wells, 1 harvests rain water, and 4 had no running water around the school premises. While the majority of the schools (16) allowed vendors to access the school’s water sources during school sessions for vending purposes, 4 did not, due to the fact that these schools had no water sources of their own. All schools except one had toilets for pupils on school premises. The school that had no toilets is part of a new school building where only Standard VI and VII pupils are accommodated. These pupils need to walk about 250 metres to the older school building to access the toilet facilities. Other general observations were made and are found in Annex 2. STREET FOOD VENDORS Profile of the vendors and the street foods sold to pupils There are no official permits required to sell food on school premises. Vendors do not receive any formal training on hygiene, nutrition or other aspects of food preparation and sale and there are no inspections by government authorities. Occasionally the vendors and the vending site may be monitored by a teachers committee, this formality varies from school to school. Vendors usually enter into informal agreement with the school after ensuring that another vendor in the same school does not sell the food they want to sell. However, in most schools more than one vendor was found selling the same types of food. Age of vendors ranged from 15 - 57 years; level of education mainly standard seven (85%). Most vendors were females (82.5%). One hundred and seventy-two vendors were found operating in the schools visited. The number of vendors selling food on each school ground ranged from 0 to 20 with an average of 8.6 vendors per school. Barafu had no vendors operating within the school compound but, they were operating from their homes located near the school. However, from the interviews with school children it was observed that consumption of street food was common among pupils attending Barafu primary school. Vendors sold a wide range of products as shown in Table 2. The food products sold varied from one school to another so were the food prices; for example, the same foods sold in Bunju A school had lower prices than those in Mtambani or Boko schools. Table 2: Inventory of most common foods vended on school grounds of 20 selected
schools Name of food
Price range* TZS
Unit size Number of vendors selling this food
main nutrient component ++++
Snacks made primarily from cereals, roots and tubers and plantains
Fried potatoes chips 50-100 One serving spoon 13 Energy (fat + carbohydrate)
Fried potatoes crisps 50 One bag 2 Energy, fat Fried cassava 10 -20 One piece 26 Energy, (fat + CHO).
However, cassava contains goitrogenic substances, could exacerbate iodine deficiency
Fried cassava crisps 50 One bag 2 Energy, fat Boiled cassava 10 One piece 1 Energy

7
Fried banana 20 One half of a banana
1 Energy, fat
Fried rice “pilau” with tomato, onion and hot pepper sauce
50 One serving spoon 1 Energy, possibly vitamin C and vitamin A
Rice and beans 50 Small bowl of rice and one spoon of beans
2 Energy, protein, iron
Rice 50 Small bowl of rice 8 Energy Samosa – filled with potatoes sometimes served with tomato, onion and pepper sauce
20 -50 One piece 22 Energy, fat – with sauce may contain some Vitamin C
Puffed rice “Cheuro” 20 One packet 7 Energy, some fat Popcorn - One bag 3 Energy& Battered, fried potatoes (Kacholi/Kachori)
10 - 20 One piece 19 Energy, fat
Maize grains and beans “kande”
20 One small bowl 1 Protein, energy (eaten by many of the other vendors), minerals and vitamins.
Fried chapattis 50 One piece 3 Energy, fat, some protein Fried pancake (tomatoes+onion)
20 One piece 1 Energy, fat, some protein & vitamin C
Sweet potatoes (fried) 10 - 20 One piece 3 Energy, fat Bread 50 One slice Energy, fat, protein Cake 20 - 50 One piece 2 Energy, fat, protein Doughnut (wheat) (“andazi”, “kaukau”)
10 -30 One piece 8 Energy, fat, some protein
Fried mix of wheat flour+sugar “visheti”
10 - 20 One piece 3 Energy, fat, some protein
Snacks from fruits Tangerine 20 One piece 1 Vitamin C, fibre Mangoes+pepper+salt 30 - 50 One piece 3 Vitamin A and C, fibre Cucumber 50 One piece 1 Vitamin A, C, minerals Snacks from pulses, legumes & nuts
Peanuts 10 -, 50 One small packet 12 Protein, energy, low fat Fried groundnuts + sugar 10 piece 1 Protein, energy, low fat Fried (ground) cow pea balls (bagia)
10, - 50 piece 20 Protein, fat
Fried simsim seeds+sugar “ufuta”
10 piece 1 Energy, fat
Miscellaneous snacks, sweets and candies
Sweetened & Flavoured water (red, green, or yellow) (baobab or “ukwaju”
50, 20, 10 One medium-sized bag
33 Energy - potentially dangerous artificial flavorings or colorants added Vitamin C
Sweetened and flavoured frozen water (sometimes baobab juice or “ukwaju” is used
50 One small bag 24 Energy – potentially dangerous artificial flavourings or colorants added , vitamin C
Ice cream cone 50 One small size 6 Energy, fat Water 20 One packet 7 Some minerals Candies/sweets 10 – 20 Piece 4 energy Baobab seeds – artificially coloured and flavoured
50, 20 One packet (12-15 pieces)
16 Vitamin C – (potentially dangerous artificial

8
(red, green and yellow) flavourings or colourants added)
Biscuits (industrially packaged)
10 – 150 Packet 12 Energy & fat
Juice (industrially packaged)
50 Bag 4 Energy
Beef soup+some meat 20 One small bowl 1 Some energy, fat, protein * Price listed in Tanzanian Shillings (TZS) (1 USD = 1100 TZS) + based on the description of the food Vendors use colorants and flavourings to colour and flavour foods. For example, baobab fruit seeds were coloured red or green, frozen water was coloured yellow, red or green, while battered, fried potatoes “kacholi or kachori” was coloured orange (colour of carotene).

9
Fresh fruit was sold in only four of the 20 schools visited, one school sold mango, banana, watermelon for 50 TZS per piece. In another school one vendor sold mango pieces for 10 or 20 TZS per piece depending on the size of the piece. At one school a vendor was selling tangerines for 20 TZS per piece and at another school a vendor was selling cucumber at 50 TZS per piece.
Socio-demographic and economic characteristics of the interviewed street food vendors A total of forty vendors were interviewed (two from each school). This included 7 males (17.5%) and 33 females (82.5%). Majority (67.5%) of the vendors were married, 27.5% were single and 5% were widowed. Mean age of the vendors was 32 ± 11.03 years (range: 15-57 years). The majority of the vendors (85%) had completed primary school level education, 10% had completed secondary school level, and 5% had no formal education. Nearly half (47.5%) of the vendors had less than one year in the food vending business, 22.5% had been in business for more than 5 years, 20% were in for 1 – 3 years and 10% were in for 3 – 5 years. Almost all vendors (92.5%) reported that their business provides profit, and that 82.5% had no other sources of income apart from street food vending. Among those vendors with other sources of income (17.5%), each was engaged in one of the following: gardening and selling vegetables, tailoring, selling fish, teaching, money lending, or work as night guards/security (males).
All vendors reported to conduct their businesses in one fixed location. The main reason for selecting their current vending location was convenience (60%), other reasons included profitable location (30%), no other choice (7.5%) and location allocated by the Municipality�(2.5%). More than half of the vendors (65%) reported selling food mostly to school children while 35% sell exclusively to school children. The majority (72.5%) of food vendors interviewed reported to have employed one
10
person in their business, 20% were able to employ two persons, 5% employed three persons, and 2.5% employed four persons.
The majority (92.5%) of the vendors had not received or participated in any training regarding the running of street food business. The three vendors who were trained received training in cleaning the environment, food production and how to operate a business. The training was offered by government (1), private sector (1), and a non-government organization (1). The duration of training ranged from
less than one week to one month. Most (76.3%) vendors� business was not legally registered. Reasons cited for not registering their businesses are presented in Table 3. Only a few cited high registration fees as a reason for not registering their business, the most common answer was because the business was just new and small, there was no need to register.
Table 3: Reasons cited by vendors for not registering their businesses Reason N % High registration fees 2 10 Registration procedures unknown 4 20 School authority recognizes it 5 25 Business was just new and small 7 35 Do not know 2 10 Total 40 100
Water source and garbage disposal The time it takes to walk from the vending site to the nearest water source is shown in Table 4. Some of the vendors (32.5%) reported to have water sources located on school compounds close to their vending sites. Table 4: Time it takes from vending site to the water source
Time N % On site 13 32.5 Less than five minutes 7 17.5
5 � 10 minutes 15 37.5
More than 15 minutes 4 10.0 Do not know 1 2.5 Total 40 100
For cleanliness of cups and plates, vendors reported to rinse plates and cups with cold water (5%), with soap and cold water (15%), with hot water (2.5%) and with soap and hot water (12.5%). Sixty percent of the vendors did not use plates or cups. Commonly, old newspapers and plastic bags were used to wrap up the snacks sold to children.
Information regarding garbage disposal by vendors indicates that the common sites for garbage disposal were trash receptacles (46.2%), open gutters (30.8%) and on the streets (10.3%). Six vendors (12.8%) reported that their businesses do not generate garbage.
Ingredients for meal preparation Sources and places of purchase of ingredients for meal preparation are presented in Table 5. While a higher proportion of vendors purchased food items from the city market, very few of them were directly obtained from producers or own production. Some vendors had more than one place of purchase.

11
Table 5: Source of ingredients used to prepare street foods (multiple answers possible) Location N % City market 15 34.9 Retail local shops 13 30.2 Wholesale local markets 12 27.9 Directly from producer 2 4.7 Own production 1 2.3 Total 43 100
Each vendor had his or her own criteria of choice of ingredients for meal preparation. These are presented in Table 6. Customer preference and cost were the most important criteria. Table 6: Criteria used by vendors to select ingredients for meal preparation Criteria n % Customer preference 16 41.0 Cost 14 35.9 Availability 5 12.8 Knowledge of dish preparation 3 7.7 Durability 1 2.6 Total 39 100
Strategies (Table 7) that were mostly used by vendors to minimize cost of ingredients included purchase from wholesalers (42.1%) and bulk purchase of ingredients (34.2%).
Table 7: Strategies used by vendors to minimize cost of ingredients Strategies N % Purchase from wholesalers 16 42.1 Purchase in bulk 13 34.2 Use own produce when possible 4 10.5 Purchase low quality foods 1 2.6 Do not know 4 10.6 Total 38 100
Some (17.1%) of the vendors did not prepare the meals or snacks they sold, but instead they purchased pre-made snacks or drinks. The types of pre-made snacks or drinks purchased from local shops were sweetened coloured drinks, frozen coloured water, biscuits, and coloured baobab fruit. Most (70%) of the vendors reported to consider nutritional quality of foods they sell and 7.5% did not consider. It was also noted that 22.5% of vendors did not know whether there was a need to consider nutritional quality of the foods they sell. Sale of snacks and drinks was much more common than sale of items which would be considered a meal (or part of a meal) such as rice, beans, chappati or kande (maize and beans). Only 9 vendors were found to prepare and sell food items that could form part of a meal, and the rest were selling snacks and drinks. Food ingredients and methods of food preparation used are presented in Table 8. The majority of vendors (78.8%) sold only one type of snack or drink, 18.2% sold two types and 3% sold three or more types. More than half (67.5%) of the vendors sold foods that were fried, of these, 65% reported to change the cooking oil daily, while 2.5% changed weekly. . The survey did not capture information on the type of cooking oil used for frying, however vendors would most likely tend to purchase the least expensive oil on the market, which is a type of palm oil called Korie.

12
Table 8: Ingredients and methods of preparation for meals/snacks sold to school
children Ingredients Food item
Primary Secondary Methods of preparation
Rice Rice Vegetable oil Fry, boil Samosa Rice, wheat flour*, potatoes Wheat flour#, potatoes#,
beef, onions, garlic, vegetable oil#
Deep fry
Beans Beans Onions, vegetable oil Boil Cassava Cassava Onions, tomatoes, vegetable
oil# Deep fry
Chapatti Wheat flour Vegetable oil Shallow fry Buns Wheat flour Vegetable oil Deep fry Frozen coloured drinks
Baobab* fruit juice, water, sugar
Artificial food colours#, water#, sugar#
Deep freezing
Potato chips Potatoes Vegetable oil# garlic, onions Deep fry Maize grains and beans or “kande”
Maize grains, beans Coconut milk Boil
Porridge Maize Vegetable oil, coconut milk Boil Mangoes Mango Raw/fresh
*Majority of vendors use this as a primary ingredient
#Majority of vendors use this as a secondary ingredient More than half (53.1%) of vendors reported that the foods they sell vary depending on season, while 46.9% vendors reported no seasonal variations in the foods they sell. Food items that were reported to vary with season included rice, potatoes, cassava, and fruits such as mangoes and baobab fruits. It was observed in the present study that most of the snacks/meals sold to schoolchildren are grossly deficient of micronutrient. One way to improve micronutrient intake from street foods is to increase the use of vegetables and fruits in snacks sold by street food vendors. Table 9 presents current and potential use of vegetables and fruits in snacks and meals sold to schoolchildren. Generally, the use of vegetables and fruits was low. There was more willingness on the part of vendors to consider selling fruits, but almost no potential interest in increasing the use of indigenous vegetables. Table 9: Use of vegetables and fruits and their potential as food items in school
children’s meals Current use when available Potential use for future
Yes No Yes No
n % n % n % n % Amaranth leaves 0 0 33 82.5 1 2.5 32 80.0 Pumpkin leaves 0 0 33 82.5 0 0 33 82.5 Okra 1 2.5 32 80.0 0 0 32 80.0 African bitter tomato 0 0 33 82.5 0 0 33 82.5 Sweet potato leaves 1 2.5 32 80.0 0 0 33 82.5 Cowpea leaves 0 0 33 82.5 0 0 33 82.5 Taro leaves 0 0 33 82.5 0 0 33 82.5 Cassava leaves 0 0 33 82.5 0 0 33 82.5 Drum stick 0 0 33 82.5 0 0 33 82.5 Banana 0 0 32 80.0 3 7.5 28 70.5 Mangoes 1 2.5 31 77.5 2 5.0 29 72.5 Oranges 0 0 32 80.0 4 10.0 27 67.5 Papaya 1 2.5 31 77.5 2 5.0 29 72.5 Guava 2 5.0 30 75.0 4 10.0 27 67.5 Jack fruit 3 7.5 29 72.5 5 12.5 26 65.0 African apple 3 7.5 30 75.0 2 5.0 29 72.5 Water melon 1 2.5 31 77.5 3 7.5 28 70.0 Passion fruit 0 0 32 80 1 2.5 30 75.5

13
Vendors cited several constraints (Table 10) to the use of vegetables and fruits as part of meals or snacks sold to schoolchildren. While the majority of vendors cited lack of preference by school children to consume vegetables, high cost of fruits was cited by majority of vendors as a constraint to the use of fruits. Table 10: Vendors’ constraints to increased use of vegetables and fruits
Constraints to increased use Vegetables and fruits School
children don’t prefer
High cost Difficult to prepare
Poor availability
School children do
not know the item
n % n % n % N % n % Amaranth leaves 9 29.0 4 12.9 2 6.5 2 6.5 0 0 Pumpkin leaves 10 32.3 4 12.9 2 6.5 1 3.2 0 0 Okra 11 37.9 2 6.9 3 10.3 0 0 0 0 Eggplant 11 37.9 3 10.3 2 6.9 0 0 0 0 Sweet potato leaves 11 37.9 3 10.3 2 6.9 0 0 0 0 Cowpea leaves 10 37.0 2 7.4 2 7.4 0 0 0 0 Taro leaves 7 25.9 2 7.4 1 3.7 0 0 3 11.1 3.7Cassava leaves 7 25.9 2 7.4 4 14.8 0 0 1 3.7 Dr17.9um stick 5 17.9 2 7.4 1 3.6 0 0 5 17.9 Banana 2 7.4 9 33.3 0 0 3 11.1 0 0 Mango 2 7.4 8 29.6 0 0 4 14.8 0 0 Orange 2 7.4 10 38.5 0 0 2 7.4 0 0 Papaya 3 11.5 10 38.5 0 0 1 3.8 0 0 Guava 1 3.8 10 38.5 0 0 4 15.4 0 0 Jackfruit 2 7.4 9 33.3 0 0 3 11.1 0 0 African apple 0 0 9 33.3 0 0 5 19.2 0 0 Water melon 0 0 11 42.5 0 0 3 11.5 3 11.5 Passion fruit 0 0 7 29.2 0 0 3 11.5 3 11.5

14
SCHOOL CHILDREN Socio-demographic characteristics Gender Of the 1181 school children interviewed, 47.4 percent were boys and 52.6 percent were girls. Age Results of the age of the respondents are presented in Table 11. Most of the school children were in the age bracket of 12 – 14 years (82.6%) and only 17% were between 15 – 18 years, and those who were 11 years and below represented 4.9%. Most of the school children were in class VI (85.2%) and about 14.8% was in class five. Table 11: Age of school children
Food consumption Children were asked to complete two different types of questions regarding food consumption (Annex 5). The first section of questions related to “typical” consumption and focussed mainly on street foods. Questions of this type included; do you normally have breakfast before leaving for school? Do you ever purchase food from street vendors? And to list up to three types of street foods which are normally purchased (type of meal, example, breakfast, morning snack etc). Later in the questionnaire, children were asked to recall all foods consumed in the previous 24 hours and indicate whether the food was consumed at home or purchased from a food vendor. The response for first type of questions is reported in the next section. Results of the 24 hour recall appear later in the report. Consumption of breakfast When children were asked to state whether they “normally” eat breakfast before leaving home, about 61% of them indicated that they eat breakfast before leaving home. Six schools had less than 50% affirmative response to the question and Hekima primary school had the lowest proportion (24%) of school children that usually eat breakfast before leaving home (Table 12). It was also observed that only 14% of the children bring packed lunch to school.
Boys Girls Total Age (yrs) n % n % n % 10 1 0.2 4 0.6 5 0.4 11 18 3.2 35 5.6 53 4.5 12 76 13.6 197 31.7 273 23.1 13 195 34.8 210 33.8 405 34.3 14 137 24.5 108 17.4 247 20.7 15 76 13.6 52 8.4 128 10.8 16 40 7.1 12 1.9 52 4.4 17 12 2.1 3 0.5 15 1.3 18 5 0.9 0 0.0 5 0.4 Total 560 100 621 100 1181 100

15
Table 12: The proportion of school children that eat breakfast at home before they leave home for school
Purchase of street foods Nearly 97% of the school children purchase food from street food vendors. Of the 97 percent who do purchase street foods 67.5% purchase street foods everyday, 17.5% purchase twice to thrice per week, 11.1% purchase only once per week and 3.9% do so less than once per week. On average about 47% of the children in rural schools do purchase street foods everyday compared to more than 80% in schools located in urban and peri urban areas such as Muungano, Kumbukumbu and Mbezi beach.
Money for buying street foods The amount of money that school children get from their parents/guardians/relatives for purchasing street foods ranged from 20.00 to 1,000.00 TZS. Most of the school children (44.1%) get 100.00 TZS,
S/No Name of schools Location n Eat b/fast %
Bring packed lunch
1 Ukombozi Urban 64 57.8 4.7 2 Mzimuni “ 51 43.1 15.7 3 Mlimani Peri urban 64 75.0 12.3 4 Barafu “ 76 65.8 6.6 5 Muungano “ 62 50.0 9.7 6 Hekima “ 78 24.4 6.4 7 Makuburi jeshini “ 50 58.0 20.0 8 Kilimani “ 52 67.3 19.2 9 Sinza ‘ 42 54.8 33.3 10 Reginald Mengi “ 52 46.2 1.9 11 Msisiri “ 76 82.9 17.1 12 Kumbukumbu “ 76 76.3 32.9 13 Makongo “ 70 84.3 15.7 14 Mbezi beach “ 67 73.1 23.9 15 Kijitonyama “ 50 70.0 16.0 16 Idriss Abdul Wakil Rural 30 53.3 13.3 17 Mtambani “ 52 55.8 9.6 18 Boko “ 59 57.6 8.5 19 Bunju “ 64 50.0 10.9 20 Kunguru (Meroe) “ 45 46.7 6.7

16
5.9% get 150.00 TZS, others get 200.00 (17.8%), 50.00 (14.7%). Only a few of them (6.8%) get more than 300.00 TZS. A high proportion of school children in rural areas get less than or 100 TZS for purchasing food at school (Table 13). Table 13: The proportion of school children that get less than 100 TZS and more than
100 TZS to purchase street foods at school Name of schools Location n < 100 TZS.
(< 0.09 USD) %
100 TZS (0.09 USD) %
> 100 TZS (> 0.09 USD) %
Ukombozi Urban 64 17.5 50.8 31.7 Mzimuni “ 51 17.6 45.1 37.3 Mlimani Peri urban 64 4.6 15.4 80.0 Barafu “ 76 22.7 53.3 24.0 Muungano “ 62 21.3 70.5 8.2 Hekima “ 78 15.4 59.0 25.6 Makuburi jeshini “ 50 30.6 32.7 36.7 Kilimani “ 52 23.1 48.1 28.8 Sinza ‘ 42 21.4 31.0 47.6 Reginald Mengi “ 52 4.8 42.9 52.4 Msisiri “ 76 13.2 42.1 44.7 Kumbukumbu “ 76 0 14.7 85.3 Makongo “ 70 10.4 40.3 49.3 Mbezi beach “ 67 9.0 40.3 50.7 Kijitonyama “ 50 8.3 58.3 33.4 Idriss Abdul Wakil
Rural 30 16.7 63.3 20.0
Mtambani “ 52 17.1 43.9 39.0 Boko “ 59 21.1 42.1 36.8 Bunju “ 64 31.1 49.2 19.7 Kunguru (Meroe) “ 45 37.2 51.2 11.6
Criteria for choice of vendor When school children were asked to indicate whether they buy food from the same vendor everyday, only 18% indicated that they buy food from the same vendor everyday; most of them (82%) usually buy food from more than one vendor, Apparently, most children (82.3%) chose the vendor themselves, in only 17.7 % of cases did someone introduce the child to the vendor. It was observed that 14% of the school children was introduced to vendors by a friend, 1.5% by parents, 0.9% by sister/brother and 1.3% by their teachers. For those children who were introduced to vendors by others, the main reasons for introducing them were cleanliness (52%), good taste of the food (18.7%) and good food preparation or well cooked food (22.7%). Portion size (4.0%) and price (2.6%) were not important determinants. For school children that chose the vendors themselves, the most important criterion for the choice of vendor was hygiene (48.7%). Portion size was important for only 2.2% of the school children. Other criteria included type of food (19.7%), price (14.1%) and nice vendor (11.3%) (Table 14).

17
Table 14: Main Criteria for choice of vendor (multiple responses possible)
Criteria N % Hygiene 977 48.7 Type of food 396 19.7 Price 284 14.1 Vendor is nice 226 11.3 Known to the family 81 4.0 Large portion size 44 2.2 Total 2008 100
Types of food consumed during breakfast Chapatti was consumed by 17.6% of the school children, but this food was mainly consumed by children in peri-urban areas (e.g. 43.4% of the Msisiri primary school children reported eating chapatti for breakfast); followed by cassava (8.2%) and bread (7.7%) mainly for Mlimani primary school children (46.2%). Only a few children drink tea (4.1%) or juice (5%) for breakfast. Average price of most of the items listed in Table 15 was 50.00 TZS. Table 15: Types of street food typically purchased for breakfast
Type of food Average Price n % TZS %* Chapatti 201 17.6 50 83.5 Cassava 93 8.2 20 67.8 Bread 88 7.7 250-300 73.1 Juice 57 5.0 50 77.2 Black tea 47 4.1 50 97.9 Milk 18 1.6 100 66.7 Porridge 13 1.1 50 58.3 Tea with milk 5 0.4 50 66.7 Water 1 0.1 20 100 Total 523 45.6
* The column represents percent of children who paid average price TZS for the item, as compared to those who paid more or less Types of snacks consumed by school children during recess (mid-morning) The type of snack that was being consumed by most of the school children was cassava (49.3%), followed by samosa (37.5%). Other snacks that are consumed at varying levels are shown in Table 16 and Table 17. The cost of most snacks is 20.00 TZS (Table 17). Sweet potatoes were being consumed by 66.7% of the school children at Idris Abdul Wakil primary school, more than in any other school. Sweetened coloured drinks and frozen water were consumed by about 35% of the school children. The study showed that generally consumption of micronutrient rich foods was low.

18
Table 16: Mid-morning snacks consumed by school children Yes Average Price Type of food N % TZS %∗∗∗∗
Cassava 563 49.3 20.00 62.7 Samosa 429 37.5 20.00 74.4 Fried round potatoes 167 14.6 20.00 57.8 Buns (wheat) 135 11.8 20.00 72.1 Bagia 128 11.2 20.00 71.9 Chips 97 8.7 50.00 54.1 Chapatti 95 8.3 50.00 75.5 Sweet potatoes 71 6.2 20.00 70.0 Cake 49 4.3 50.00 62.7 Buns (rice) 32 2.8 20.00 69.7 Packed baobab 30 2.6 20.00 66.7 Bread 3 0.3 50.00 100 Drinks Sweetened coloured drink 214 18.7 50.00 91.7 Frozen coloured water 185 16.2 20.00 72.0 Water 95 8.3 20.00 60.3 Fruit juice 1 0.1 20.00 100
* The column represents percent of children who paid average price TZS for the item, as compared to those who paid more or less

19
Tab
le 1
7: M
orni
ng s
nack
s co
nsum
ed b
y sc
hool
chi
ldre
n in
the
dif
fere
nt s
choo
ls s
urve
yed
Nam
e of
sch
ools
L
ocat
ion
n
Sa
mos
a B
aoba
b C
hapa
tti
W/b
uns
B
agia
C
assa
va
S/po
tato
W
ater
I/
pota
toes
C
ake
Ric
e bu
ns
Col
oure
d dr
inks
U
kom
bozi
U
rban
64
49
.2
0 0
4.8
3.2
82.7
19
.0
50.8
1.
6 1.
6 0
11.1
M
zim
uni
“ 51
39
.2
0 11
.8
13.7
0
33.3
2.
0 2.
0 5.
9 0
7.8
19.6
M
liman
i P
eri u
rban
64
40
.0
0 9.
2 13
.8
13.8
18
.5
4.6
0 27
.7
1.5
9.2
44.6
B
araf
u “
76
29.3
0
6.7
8.0
5.3
64.0
9.
3 0
46.7
8.
0 1.
3 25
.3
Muu
ngan
o “
62
4.9
0 6.
6 8.
2 1.
6 67
.2
0 0
9.8
0 1.
6 8.
2 H
ekim
a “
78
33.3
10
.3
2.6
15.4
1.
3 79
.5
3.8
25.6
3.
8 10
.3
0 5.
1 M
akub
uri j
eshi
ni
“ 50
46
.9
0 0
20.4
0
32.7
0
0 16
.3
2.0
0 14
.3
Kili
man
i “
52
40.4
17
.3
17.3
11
.5
9.6
76.9
7.
7 1.
9 9.
6 3.
8 5.
8 19
.2
Sinz
a ‘
42
47.6
4.
8 31
.0
33.3
17
.6
61.9
7.
1 14
.3
2.4
7.1
7.1
21.4
R
egin
ald
Men
gi
“ 52
7.
1 0
7.1
4.8
0 38
.1
0 2.
4 16
.7
4.8
0 21
.4
Msi
siri
“
76
52.6
7.
9 3.
9 6.
6 2.
6 35
.5
0 2.
6 5.
3 3.
9 1.
3 31
.6
Kum
buku
mbu
“
76
30.7
0
14.7
10
.7
29.3
58
.7
4.0
6.7
41.3
1.
3 0
34.7
M
akon
go
“ 70
55
.2
0 6.
0 16
.4
62.7
28
.4
4.5
4.5
17.9
1.
5 0
14.9
M
bezi
bea
ch
“ 67
38
.8
1.5
1.5
16.4
17
.9
35.8
6.
0 6.
0 1.
5 1.
5 3.
0 26
.9
Kiji
tony
ama
“ 50
20
.8
2.1
2.1
2.1
0 58
.3
0 6.
3 4.
2 0
0 16
.7
Id
riss
Abd
ul W
akil
Rur
al
30
60.0
3.
3 10
.0
16.7
6.
7 83
.3
66.7
0
0 0
0 3.
3 M
tam
bani
“
52
41.5
0
0 12
.2
2.4
14.6
0
0 7.
3 2.
4 0
24.4
B
oko
“ 59
43
.9
1.8
0 8.
5 3.
5 35
.1
0 22
.8
8.8
3.5
0 7.
0 B
unju
“
64
24.6
1.
6 39
.3
11.5
23
.0
26.2
11
.5
6.6
26.7
21
.3
18.0
0
Kun
guru
(M
eroe
) “
45
53.5
0
0 7.
0 4.
7 55
.8
2.3
0 14
.0
7.0
0 9.
3

20
Lunch The schools do not provide lunch and very few school children eat lunch at school. Only 52 pupils (0.4%) indicated that they eat lunch at school. This is usually in form of potato chips purchased from vendors at a cost of 100.00 TZS. Afternoon snacks consumed by school children Very few school children consume afternoon snacks. The types of snacks are listed in Table 18. Only about 12% of the school children consumed micronutrient rich foods i.e. fruits and vegetables. The price of the snacks ranged between 10.00 and 50.00 TZS Table 18: Afternoon snacks consumed by school children Type of snack % Orange 9.2 Sweetened frozen coloured water 4.5 Cassava 4.1 Samosa 3.1 Chips 2.8 Mangoes 2.5 Cake 2.4 Groundnuts 2.4 Biscuits 1.5 Cowpea balls (Bagia) 0.8 Buns 0.7 Chapatti 0.7 Watermelon 0.1 Papaw 0.1 Dinner Dinner is usually prepared and consumed at home. Only 2 school children (0.2%) indicated that they purchased potato chips from street food vendors at a cost of 300 – 350 TZS. After dinner snacks Very few school children consumed after dinner snacks. Table 19 indicates the types of after dinner snacks that were consumed by school children.

21
Table 19: After dinner snacks consumed by school children Type of food Average Price n % TZS %∗∗∗∗ Samosa 7 0.6 20.00 85.7 Buns (wheat) 5 0.4 50.00 60.0 Cake 4 0.3 50.00 75.0 Chapatti 1 0.1 50.00 100.0 Cassava 1 0.1 50.00 100 Drinks Milk 9 0.8 100 40 Fruit juice 8 0.7 Sweetened coloured drink 4 0.3 50-100 63.7 Soda 29 2.5 250 85.7 Fruits Oranges 73 6.4 20-30 78.0 Banana 36 3.1 50.00 78.4 Mangoes 16 1.4 50.0 75.0 Water melon 9 0.8 50 55.6 Avocado 2 0.2 50.00 100.0
* The column represents percent of children who paid average price TZS for the item, as compared to those who paid more or less Safety of street foods When school children were asked to indicate whether the foods sold by vendors are safe or not safe to eat, 37.8% indicated that the foods are safe, 59.1% indicated that the foods sold by vendors are not safe to eat and 3.1% indicated that they do not know. For those who responded affirmatively to the question on safety, further indicated that only a few of the foods are safe to eat (59.8%), 15.9% indicated that all food are safe and 6.9% indicated that most foods are safe to eat. However, 17.4% indicated that they do not know as to what extent the foods sold by vendors are safe or not safe to eat. About 50% of the schoolchildren were aware of the types of food that are less safe to eat. However, 33% of the schools children was not aware or did not know the types foods that are less safe to eat. The types of foods that are less safe to eat as identified by school children are listed in Table 20. Rice, samosa (filled with potatoes), battered fried potatoes (kachori), cassava and frozen coloured water were identified as less safe foods to eat from street vendors. Table 20: Foods less safe to eat from street vendors
Types of food N % Rice 240 22.3 Samosa 128 11.9 Kachori 127 11.8 Cassava 109 10.1 Frozen coloured water 87 8.1 Juice 76 7.1 Water 65 6.0 Potatoes 54 5.0 Chapatti 52 4.8 Burns 45 4.2 Bagia 42 3.9 Chips 29 2.7 Fruits 10 0.9 Kababu 9 0.8 Baobab fruit 5 0.5 Total 1078 100
Reasons as to why the foods listed in Table 20 are more likely to be unsafe are given in Table 21.

22
Table 21: Reasons for the foods to be unsafe Reasons N % Prepared under unhygienic conditions 186 34.6 Displayed uncovered 120 22.3 Place of preparation not known 85 15.8 Placed in unsafe plastic bags 45 8.4 Water is not boiled 32 5.9 Prepared from low quality ingredients 28 5.2 Vendor not clean 22 4.1 Uncooked 14 2.6 Not washed properly 3 0.6 Served un-hygienically (bare hands) 2 0.4 Mixed with colours 1 0.2 Total 538 100
The most important reasons included, preparation of foods under unhygienic conditions (34.6%), displayed uncovered (22.3%), preparation place not known (15.8%) and inadequate wrappings (plastic bags) (8.4%). Nearly 74% of the school children indicated that they have heard of people becoming sick after eating street foods. Results of the 24-h recall method for assessing dietary intake Foods consumed for breakfast Only 2.4 percent of children reported consuming any type of solid food (porridge) for breakfast. The remaining 69.7 % of children who reported consuming breakfast had tea, milk or juice and of this percentage, 54.8% reported consuming only black tea (Table 22)., Anything that was consumed in the morning before school was most likely to be consumed at home. However, milk and juice were the most commonly reported breakfast items purchased from food vendors. Table 22: Types of foods consumed during breakfast
Type of food Place of preparation n % Home Street Black tea 646 54.8 99.5 0.5 Tea with milk 146 12.4 98.6 1.4 Porridge 28 2.4 89.3 10.7 Milk 22 1.9 86.4 13.6 Juice 7 0.6 85.7 14.3 Total 849 72.1
Mid-morning snacks The results presented in Table 23 and 24 show that a high proportion (45%) of school children ate cassava as a mid morning snack. Other snacks that were consumed by school children included samosa (27.6%), chapatti (21.3%), and wheat buns (21.9%). The majority of school children purchase mid-morning snacks from a food vendor.

23
Table 23: Types of snacks consumed by school children during mid-morning Type of food Place of preparation
(%) n % Home Street Cassava 531 45.0 3.9 96.1 Samosa 326 27.6 4.0 96.0 Buns (wheat) 259 21.9 22.4 77.6 Chapatti 251 21.3 32.1 67.9 Sweetened coloured drink
166 14.1 2.4 97.6
Frozen sweetened coloured water
133 11.3 0.8 99.2
Bread 117 9.9 13.7 86.3 Cow pea balls Bagia 89 7.5 9.0 91.0 Fried potatoes 82 6.9 6.0 94.0 Rice 63 5.3 84.1 15.9 Chips 55 4.7 1.8 98.2 Sweet potatoes 54 4.6 1.9 98.1 Cake 22 1.9 22.7 77.3 Buns (rice) 6 0.5 0.0 100.0 Eggs 1 0.1 0 100.0

24
Tab
le 2
4: T
ypes
of
food
s co
nsum
ed b
y sc
hool
chi
ldre
n in
dif
fere
nt s
choo
ls
Nam
e of
sc
hool
s L
ocat
ion
n B
reak
fast
M
orni
ng s
nack
s
B
/tea
M/t
ea
Mil
k P
orr.
sa
mos
a C
hapa
tti
W/b
uns
C
assa
va
S/po
tat.
Ric
e C
ake
Bre
ad
C/d
rink
s C
hips
I/
pota
. F/
C/d
rin
k U
kom
bozi
U
rban
64
45
.3
3.1
0 3.
1 37
.5
14.1
12
.5
68.8
6.
3 0
1.6
6.3
3.1
0 6.
3 0
Mzi
mun
i “
51
50
3.9
0 0
15.7
13
.7
17.6
45
.1
0 2.
0 0
11.8
13
.7
11.8
11
.8
21.6
M
lim
ani
Per
i ur
ban
64
72.3
4.
6 4.
6 0
10.8
20
.0
18.5
9.
2 9.
2 9.
2 4.
6 23
.1
18.5
0
0 0
Bar
afu
“ 76
48
.7
22.4
1.
3 1.
3 22
.4
53.9
22
.4
65.2
6.
6 7.
9 0
5.3
10.5
17
.1
17.1
0
Muu
ngan
o “
62
54.8
6.
5 0
0 9.
7 8.
1 27
.4
53.2
9.
7 1.
6 1.
6 3.
2 6.
5 14
.5
14.5
0
Hek
ima
“ 78
41
.0
3.8
1.3
5.1
17.9
16
.7
29.5
64
.1
2.6
0 5.
1 6.
4 3.
8 1.
3 1.
3 0
Mak
ubur
i je
shin
i “
50
46.0
2.
0 0
2.0
34.0
12
.0
16.0
26
.0
8.0
4.0
0 4.
0 8.
0 18
.0
18.0
14
.0
Kil
iman
i “
52
73.1
5.
8 5.
8 1.
9 24
.6
30.8
30
.8
71.2
1.
9 11
.5
0 1.
9 17
.3
19.2
19
.2
13.5
Si
nza
‘ 42
33
.3
21.4
2.
4 2.
4 28
.6
11.9
26
.2
61.9
0
4.8
2.4
11.9
28
.6
2.4
2.4
9.5
Reg
inal
d M
engi
“
52
34.6
11
.5
1.9
3.8
9.6
21.2
9.
6 42
.3
0 0
0 3.
8 13
.5
11.5
11
.5
17.6
Msi
siri
“
76
65.3
25
.0
3.9
3.9
51.3
36
.8
35.5
31
.6
1.3
1.3
3.9
7.9
22.4
0
0 27
.6
Kum
buku
mbu
“
76
75.0
2.
6 0
2.6
23.7
22
.4
19.7
46
.1
14.5
3.
9 1.
3 23
.7
26.3
15
.8
15.8
11
.8
Mak
ongo
“
70
70.0
12
.9
2.9
1.4
35.7
35
.7
17.1
21
.4
2.9
10.0
1.
4 10
.0
18.6
1.
4 1.
4 10
.0
Mbe
zi b
each
“
67
55.2
13
.4
1.5
1.5
29.9
16
.4
23.9
38
.8
3.0
13.4
0
6.0
26.9
0
0 19
.4
Kij
itony
ama
“ 50
38
.0
18.0
0
4.0
30.0
14
.0
8.0
54.0
0
2.0
0 12
.0
26.0
2.
0 2.
0 26
.0
Id
riss
Abd
ul
Wak
il R
ural
30
56
.7
16.7
0
0.0
30.0
30
.0
20.0
70
.0
26.7
20
.0
3.3
13.3
0
0 0
0
Mta
mba
ni
“ 52
57
.7
15.4
7.
7 0
19.2
15
.4
11.5
23
.1
0 7.
7 0
21.2
3.
8 3.
8 3.
8 0
Bok
o “
59
67.2
18
.6
1.7
1.7
50.8
5.
1 30
.5
50.8
0
5.1
5.1
16.9
13
.8
6.8
6.8
42.4
B
unju
“
64
57.8
18
.8
1.6
9.4
12.5
23
.4
26.6
21
.9
1.6
0 4.
7 1.
6 0
0 0
3.1
Kun
guru
(M
eroe
) “
45
33.3
26
.7
0 0
53.3
4.
4 26
.7
51.1
2.
2 11
.1
0 8.
9 15
.6
6.7
6.7
11
.1

25
Lunch Results have shown that 1111 children consumed lunch (after school); out of these 742 school children (62.8%) consumed stiff maize porridge (ugali) and 262 school children (22.1%) consumed rice with various relishes. The types of relishes included beans, sardines, amaranth, peas, meat, mlenda (a slimy sauce made from okra or okra with pumpkin leaves), fish and sweet potato leaves. Only 9% of the school children consumed other foods (Table 25 & 26). Lunch was mainly prepared and consumed at home at around 3.00 or 4.00 pm. Table 25: Types of foods consumed by school children for lunch
Type of food Place of preparation(%) N % Home Street Stiff porridge + beans 228 19.3 100 0 Stiff porridge + fish 181 15.3 100 0 Stiff porridge + meat 134 11.3 100 0 Stiff porridge + amaranth 79 6.7 100 0 Stiff porridge + sardines 47 4.0 97.9 2.1 Stiff porridge + s/potato leaves 30 2.5 96.7 3.3 Stiff porridge + mlenda 22 1.9 100 0 Stiff porridge + peas 21 1.8 100 0 Total 742 62.8 Rice + beans 137 11.6 98.6 1.4 Rice + meat 70 5.9 98.6 1.4 Rice + fish 33 2.8 100 0 Rice + meat + amaranth 12 1.0 100 0 Rice + amaranth 10 0.8 100 0 Total 262 22.1 Chips 66 5.6 28.8 71.2 Banana + meat 20 1.7 95.0 5.0 Tea + bread 10 0.8 90.0 10.0 Potatoes + meat 7 0.6 100 0 Kande (a mixture of beans and maize grains)
4 0.3 100 0
Total 107 9.0

26
Tab
le 2
6: T
ypes
of
food
s co
nsum
ed b
y sc
hool
chi
ldre
n fo
r lu
nch
in d
iffe
rent
sch
ools
N
ame
of
scho
ols
Loc
atio
n N
M
aize
sti
ff p
orri
dge
(Uga
li)
Ric
e
Pot
ato
chip
s K
ande
B
anan
a
Rel
ish
Bea
ns
Sard
in
Am
ara
Pea
s M
eat
Mle
n Fi
sh
S/po
tato
le
aves
M
eat
Mea
t +
Am
aran
th
Bea
ns
Fish
A
mar
anth
M
eat
Uko
mbo
zi
Urb
an
64
6.3
10.9
7.
8 0
6.3
6.3
35.9
3.
1 7.
8 0
3.1
4.7
0 1.
6 1.
6 0
Mzi
mun
i “
51
19.6
2.
0 2.
0 2.
0 7.
8 2.
0 11
.8
3.9
9.8
0 11
.8
7.8
0 5.
9 2.
0 3.
9 M
lim
ani
Per
i ur
ban
64
18.5
0
1.5
0 3.
1 1.
5 9.
2 0
6.2
0 4.
6 1.
5 0
26.2
0
0
Bar
afu
“ 76
34
.2
5.3
11.8
0
7.9
2.6
10.5
0
9.2
0 6.
6 3.
9 0
0 0
2.6
Muu
ngan
o “
62
32.3
0
3.2
0 21
.0
4.8
16.1
6.
5 4.
8 0
6.5
0 0
1.6
0 1.
6 H
ekim
a “
78
15.4
2.
6 3.
8 2.
6 7.
7 5.
1 24
.4
2.6
5.1
0 12
.8
1.3
0 2.
6 0
1.3
Mak
ubur
i je
shin
i “
50
20.0
6.
0 2.
0 6.
0 8.
0 10
.0
20.0
4.
0 2.
0 0
10.0
0
0 2.
0 2.
0 0
Kili
man
i “
52
15.4
3.
8 0
5.8
28.8
1.
9 17
.3
3.8
7.7
0 9.
6 1.
9 0
1.9
0 1.
9 Si
nza
‘ 42
23
.8
7.1
2.4
2.4
19.0
2.
4 4.
8 0
7.1
0 16
.7
0 0
9.5
0 2.
4 R
egin
ald
Men
gi
“ 52
7.
7 1.
9 7.
7 0
15.4
0
5.8
1.9
1.9
0 25
.0
5.8
0 19
.2
0 7.
7
Msi
siri
“
76
15.8
3.
9 11
.8
0 9.
2 0
10.5
0
7.9
6.6
21.1
9.
2 3.
9 1.
3 0
2.6
Kum
buku
mbu
“
76
7.9
1.3
0 0
3.9
0 0
0 6.
6 0
13.2
1.
3 0
22.4
0
1.3
Mak
ongo
“
70
22.9
5.
7 8.
6 1.
4 12
.9
0 14
.3
1.4
4.3
1.4
14.3
2.
9 1.
4 2.
9 1.
4 0
Mbe
zi
beac
h “
67
22.4
4.
5 6.
0 4.
5 19
.4
0 11
.9
3.0
0 1.
5 11
.9
3.0
0 1.
5 0
1.5
Kij
iton
yam
a “
50
28.0
6.
0 6.
0 0
4.0
0 18
.0
4.0
12.0
0
16.0
2.
0 0
2.0
0 2.
0
Idri
ss
Abd
ul
Wak
il
Rur
al
30
20.0
3.
3 16
.7
0 13
.3
0 23
.3
0 0
3.3
10.0
0
0 0
0 6.
7
Mta
mba
ni
“ 52
28
.0
3.8
11.5
1.
9 7.
7 0
17.3
7.
7 7.
7 5.
8 1.
9 0
0 0
0 0
Bok
o “
59
22.0
3.
4 1.
7 3.
4 18
.6
0 18
.6
1.7
10.2
0
18.6
3.
4 0
1.7
0 1.
7 B
unju
“
64
14.1
4.
7 18
.8
0 14
.1
0 17
.2
6.3
1.6
1.6
7.8
0 7.
8 3.
1 0
0 K
ungu
ru
(Mer
oe)
“ 45
13
.3
4.4
13.3
8.
9 4.
4 0
26.7
2.
2 4.
4 0
11.1
4.
4 2.
2 2.
2 0
0

27
Dinner All school children indicated that dinner was prepared and consumed at home (Table 27) except for chips where 71.2% of the children indicated that the food was obtained from street food vendors. The most commonly consumed food for dinner was rice. About 67% of the school children consumed rice for dinner and stiff porridge was consumed by 21.7% of the children with various relishes. The different types of relish that were consumed by school children included peas (3.7%), beans (27.6%), amaranth (4.1%), fish (12.5%), meat (19.2%), cassava leaves (1.5%) and sardines (1.9%). Other foods such as banana, chips, kande (a mixture of maize and beans), potatoes and tea and bread were consumed by 9.6% of the school children. Table 27: Types of food consumed by school children for dinner
Type of food Place of preparation (%) n % Home Street Rice + beans 326 27.6 99.7 0.3 Rice + meat 227 19.2 100 0 Rice + fish 148 12.5 100 0 Rice + amaranth 49 4.1 100 0 Rice + peas 44 3.7 97.7 2.3 Total 794 67.1 Stiff porridge + fish 74 6.3 100 0 Stiff porridge + beans 63 5.3 100 0 Stiff porridge + meat 41 3.5 100 0 Stiff porridge + amaranth 40 3.4 100 0 Stiff porridge + sardines 22 1.9 100 0 Stiff porridge + cassava leaves 15 1.3 100 0 Total 255 21.7 Banana + meat 48 4.1 100 0 Tea + bread 21 1.8 - - Kande ( a mix of bean and maize grains
18 1.5 100 0
Chips 17 1.4 61.1 38.9 Potatoes + meat 10 0.8 100 0 Total 114 9.6 Total 1163 98.4
Snacks consumed by school children (24 h recall) After lunch snacks Only a small proportion of school children consumed after lunch snacks and street vendors prepare most of the snacks. Oranges were consumed by 14.4% of the school children making it the most consumed afternoon or after lunch snack. Other snacks that were consumed are shown in Table 28.

28
Table 28: After lunch snacks consumed by school children Place of preparation (%) Type of snack n % Home Street
Oranges 170 14.4 30.6 68.4 Mangoes 67 5.7 20.9 79.1 Cassava 49 4.1 4.1 95.9 G/nuts 41 3.5 22.0 78.0 Samosa 39 3.3 7.7 92.3 Cake 32 2.7 12.5 87.5 Watermelon 18 1.5 61.1 38.9 Chips 17 1.4 5.9 94.1 Buns 14 1.2 14.3 85.7 Biscuits 12 1.0 8.3 91.7 Chapatti 12 1.0 58.3 41.7 Bagia 10 0.8 20 80 Fruits Total 481 3.4
Evening snacks Only 193 school children consumed evening snacks. Fruits were consumed by 6.3% of the children. The types of foods consumed are shown in Table 29. Table 29: Evening snacks consumed by school children during the period of 24 hours
immediately prior to the day of the survey Place of preparation (%) Type of snack n % Home Street
Samosa 24 2.0 16.7 83.3 Cake 16 1.4 18.8 81.3 Biscuits 13 1.1 7.7 92.3 Cassava 13 1.1 0 100 Buns 8 0.7 50.0 50.0 Bread 4 0.3 0 100 Cashew nuts 3 0.3 0 100 Chapatti 3 0.3 100 0 Eggs 2 0.2 100 0 Fruits Oranges 37 3.1 24.3 75.7 Mangoes 22 1.9 18.2 81.8 Watermelon 14 1.2 57.1 42.9 Avocado 1 0.1 100 0 Drinks Sweetened coloured drink 13 1.1 15.4 84.6 Soft drinks (Soda ) 11 0.9 18.2 81.8 Milk 9 0.8 70.0 30.0 Total 193 16.5
After dinner snacks Thirty one percent of the school children consumed fruits as after dinner snacks. Most of them were obtained from the street vendors. The types of snacks consumed are listed in Table 30.

29
Table 30: After dinner snacks consumed by school children
Place of preparation Type of snack n % Home Street
G/nuts 18 1.5 27.8 72.2 Chapatti 11 0.9 90.9 9.1 Buns 9 0.8 55.6 44.4 Samosa 9 0.8 55.6 44.4 Cake 8 0.7 37.5 62.5 Cassava 6 0.5 0.0 100 Eggs 5 0.4 20.0 80.0 Biscuits 4 0.3 0 100 Bread 3 0.3 33.3 66.7 Fruits Oranges 199 16.9 25.1 74.9 Ripe banana 55 4.7 60.0 40.0 Mangoes 44 3.7 15.6 84.4 Watermelon 24 2.0 75.0 25.0 Papaw 24 2.0 62.5 37.5 Avocado 18 1.5 44.4 55.6 Baobab 6 0.5 16.7 83.3 Jackfruit 1 0.1 100 0 Drinks Soda 43 3.6 23.3 76.7 Juice 39 3.3 48.7 51.3 Total 82 6.9
NUTRITIONAL STATUS OF SCHOOL CHILDREN Physical characteristics The mean weight of school children was 42.1 ± 9.2 which ranged from 24.5 to 90.30 kg, and mean height was 149.3 ± 8.4 cm, ranging from 56 to 175 cm. Table 31 shows the nutritional status of school children by age for both sexes. Generally, mean weight increased with age as did the height. Similarly, height-for-age Z-scores (HAZ) decreased with age, except at the age of 17 years where HAZ increased. Table 31: Nutritional status of school children (sexes combined) according to height for
age Weight (kg) Height
(cm) HAZ Age
(years)
n Mean SD Mean SD Mean SD
10 5 35.6 6.4 138.6 3.6 0.08 0.62 11 53 37.5 9.3 143.3 7.8 -0.14 1.13 12 273 39.4 8.0 146.0 8.6 -0.70 1.09 13 405 41.3 10.1 147.9 7.0 -1.19 0.94 14 245 42.9 7.3 151.3 6.9 -1.36 0.88 15 128 46.2 8.0 153.9 7.0 -1.59 0.94 16 52 50.5 7.9 157.9 7.2 -1.84 0.93 17 15 53.1 6.4 165.0 6.7 -1.31 0.83
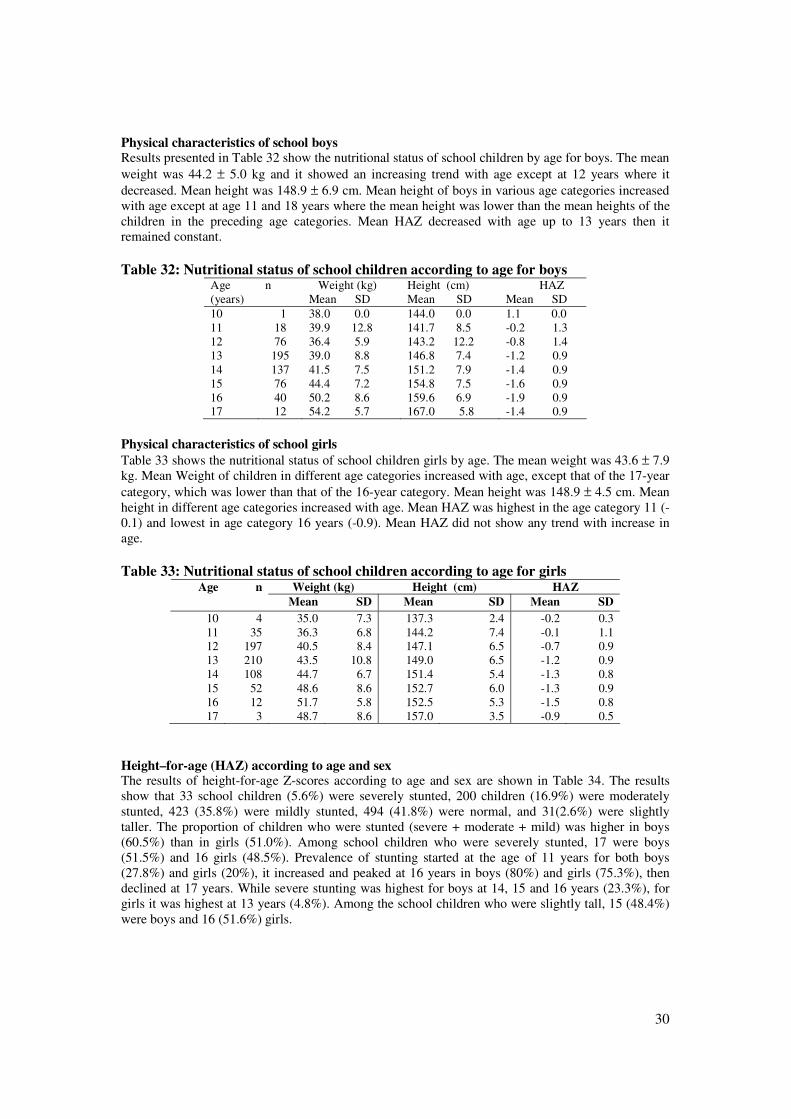
30
Physical characteristics of school boys Results presented in Table 32 show the nutritional status of school children by age for boys. The mean weight was 44.2 ± 5.0 kg and it showed an increasing trend with age except at 12 years where it decreased. Mean height was 148.9 ± 6.9 cm. Mean height of boys in various age categories increased with age except at age 11 and 18 years where the mean height was lower than the mean heights of the children in the preceding age categories. Mean HAZ decreased with age up to 13 years then it remained constant. Table 32: Nutritional status of school children according to age for boys
Age (years)
n Weight (kg) Mean SD
Height (cm) Mean SD
HAZ Mean SD
10 1 38.0 0.0 144.0 0.0 1.1 0.0 11 18 39.9 12.8 141.7 8.5 -0.2 1.3 12 76 36.4 5.9 143.2 12.2 -0.8 1.4 13 195 39.0 8.8 146.8 7.4 -1.2 0.9 14 137 41.5 7.5 151.2 7.9 -1.4 0.9 15 76 44.4 7.2 154.8 7.5 -1.6 0.9 16 40 50.2 8.6 159.6 6.9 -1.9 0.9 17 12 54.2 5.7 167.0 5.8 -1.4 0.9
Physical characteristics of school girls Table 33 shows the nutritional status of school children girls by age. The mean weight was 43.6 ± 7.9 kg. Mean Weight of children in different age categories increased with age, except that of the 17-year category, which was lower than that of the 16-year category. Mean height was 148.9 ± 4.5 cm. Mean height in different age categories increased with age. Mean HAZ was highest in the age category 11 (-0.1) and lowest in age category 16 years (-0.9). Mean HAZ did not show any trend with increase in age. Table 33: Nutritional status of school children according to age for girls
Weight (kg) Height (cm) HAZ Age n Mean SD Mean SD Mean SD
10 4 35.0 7.3 137.3 2.4 -0.2 0.3 11 35 36.3 6.8 144.2 7.4 -0.1 1.1 12 197 40.5 8.4 147.1 6.5 -0.7 0.9 13 210 43.5 10.8 149.0 6.5 -1.2 0.9 14 108 44.7 6.7 151.4 5.4 -1.3 0.8 15 52 48.6 8.6 152.7 6.0 -1.3 0.9 16 12 51.7 5.8 152.5 5.3 -1.5 0.8 17 3 48.7 8.6 157.0 3.5 -0.9 0.5
Height–for-age (HAZ) according to age and sex The results of height-for-age Z-scores according to age and sex are shown in Table 34. The results show that 33 school children (5.6%) were severely stunted, 200 children (16.9%) were moderately stunted, 423 (35.8%) were mildly stunted, 494 (41.8%) were normal, and 31(2.6%) were slightly taller. The proportion of children who were stunted (severe + moderate + mild) was higher in boys (60.5%) than in girls (51.0%). Among school children who were severely stunted, 17 were boys (51.5%) and 16 girls (48.5%). Prevalence of stunting started at the age of 11 years for both boys (27.8%) and girls (20%), it increased and peaked at 16 years in boys (80%) and girls (75.3%), then declined at 17 years. While severe stunting was highest for boys at 14, 15 and 16 years (23.3%), for girls it was highest at 13 years (4.8%). Among the school children who were slightly tall, 15 (48.4%) were boys and 16 (51.6%) girls.

31
Table 34: Nutritional status (HAZ) of children according to age and sex Age Sex HAZ
Severe stunting
Moderate stunting
Mild stunting
Normal Slightly tall Total
n % n % n % n % n % n % Boys 0 0 0 0 0 0 0 0 1 100 1 100 10 Girls 0 0 0 0 0 0 4 100 0 0 4 100 Boys 0 0 0 0 5 27.8 11 61.1 2 11.1 18 100 11 Girls 0 0 2 5.7 5 14.3 22 62.9 6 17.1 35 100 Boys 1 1.3 4 5.3 26 34.2 42 55.3 3 3.9 76 100 12 Girls 0 0 12 6.1 65 33.0 112 56.8 8 4.1 197 100 Boys 1 0.5 33 17.0 83 42.6 75 38.4 3 3.9 195 100 13 Girls 10 4.8 36 17.1 75 35.7 87 41.4 2 1.0 210 100 Boys 4 2.9 36 26.3 53 38.7 43 31.4 1 0.7 137 100 14 Girls 3 2.7 20 18.5 47 43.5 38 35.3 0 0 108 100 Boys 4 5.3 27 35.5 23 30.2 22 29.0 0 0 76 100 15 Girls 2 3.8 12 23.1 17 32.7 21 40.4 0 0 52 100 Boys 6 15 14 35 12 30.0 8 20.0 0 0 40 100 16 Girls 1 8.3 3 25.0 5 42.0 3 25.0 0 0 12 100 Boys 1 8.0 1 8.0 5 42.0 5 42.0 0 0 12 100 17 Girls 0 0 0 0 2 66.7 1 33.3 0 0 3 100 Boys 0 0 0 0 0 0 0 0 5 100 5 100 18 Girls 0 0 0 0 0 0 0 0 0 0 0 0 Boys 17 3.0 115 20.5 207 37.0 206 36.8 15 2.7 560 100 Total Girls 16 2.6 85 13.7 216 34.8 288 46.3 16 2.6 621 100
Nutritional status of school children according to BMI-for-age and sex Age and sex-specific BMI of the school children are shown in Table 35. Eighteen school children who were underweight, and all of them were boys. Overweight and obesity were higher in boys than in girls. Almost (95.9%) all school children were found to have normal nutritional status. A striking feature when using BMI-for-age and sex is that the majority of school children fell in the normal zone, showing that the method is not as sensitive in detecting nutritional status of school children as compared to WAZ and HAZ.

32
Table 35: Summary of nutritional status (BMI-for-age) of children according to schools
Name of School
BMI-for-age
Underweight Normal Overweight Obese Total Boys Girls Boys Girls Boys Girls Boys Girls Boys Girls
n % n % n % n % n % n % n % n % n % n % Urban
Ukombozi 1 2.6 0 0 36 94.7 24 92.3 1 2.6 2 7.7 0 0 0 0 38 100 26 100 Mzimuni 1 3.6 0 0 26 92.9 23 100 0 0 0 0 1 3.6 0 0 28 100 23 100
Peri urban Mlimani 1 3.1 0 0 30 93.8 33 100 1 3.1 0 0 0 0 0 0 32 100 33 100 Barafu 3 8.3 0 0 33 91.7 40 100 0 0 0 0 0 0 0 0 36 100 40 100 Muungano 1 3.4 0 0 28 96.6 32 97 0 0 0 0 0 0 1 3 29 100 33 100 Hekima 1 3.0 0 0 32 97 45 100 0 0 0 0 0 0 0 0 33 100 45 100
Makuburi Jeshini
0 0 0 0 31 100 18 94.7 0 0 1 5.3 0 0 0 0 31 100 19 100
Kilimani 0 0 0 0 26 100 26 100 0 0 0 0 0 0 0 0 26 100 26 100 Sinza 2 8.7 0 0 20 86.9 18 94.7 1 4.3 1 5.3 0 0 0 0 23 100 19 100 Reginald Mengi
1 3.7 0 0 25 92.6 25 100 0 0 0 0 1 3.7 0 0 27 100 25 100
Msisiri 0 0 0 0 29 100 47 100 0 0 0 0 0 0 0 0 29 100 47 100 Kumbukumbu 1 2.6 0 0 36 92.3 35 94.6 0 0 2 5.4 0 0 0 0 39 100 37 100 Makongo 2 6.4 0 0 27 87.1 36 92.3 2 6.4 2 5.1 0 0 1 2.6 31 100 39 100 Mbezi Beach 1 5.3 0 0 16 83.2 47 97.6 1 5.3 1 2.4 1 5.3 0 0 19 100 48 100 Kijitonyama 2 9.1 0 0 18 81.8 27 96.4 1 4.5 0 0 1 4.5 0 0 22 100 28 100
Rural Idris Abdul Wakil
1 6.7 0 0 14 93.3 15 100 0 0 0 0 0 0 0 0 15 100 15 100
Mtambani 0 0 0 0 22 100 30 100 0 0 0 0 0 0 0 0 22 100 30 100 Boko 1 3 0 0 28 84.8 26 100 4 12.1 0 0 0 0 0 0 33 100 26 100 Bunju A 3 9.7 0 0 27 87.1 33 100 1 3.2 0 0 0 0 0 0 31 100 33 100 Kunguru 0 0 0 0 16 100 29 100 0 0 0 0 0 0 0 0 16 100 29 100
Total 18 3.2 0 0 525 92.8 608 97.9 11 2.0 9 1.4 4 0.7 2 0.3 560 100 621 100
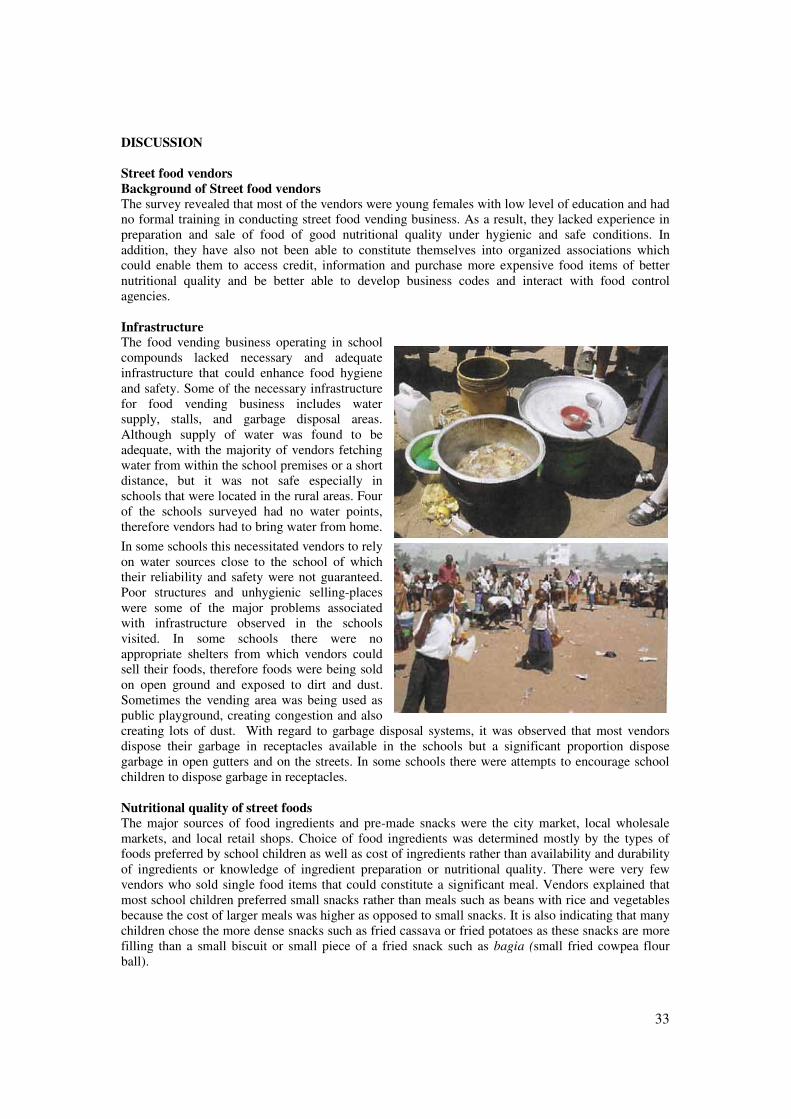
33
DISCUSSION Street food vendors Background of Street food vendors The survey revealed that most of the vendors were young females with low level of education and had no formal training in conducting street food vending business. As a result, they lacked experience in preparation and sale of food of good nutritional quality under hygienic and safe conditions. In addition, they have also not been able to constitute themselves into organized associations which could enable them to access credit, information and purchase more expensive food items of better nutritional quality and be better able to develop business codes and interact with food control agencies. Infrastructure The food vending business operating in school compounds lacked necessary and adequate infrastructure that could enhance food hygiene and safety. Some of the necessary infrastructure for food vending business includes water supply, stalls, and garbage disposal areas. Although supply of water was found to be adequate, with the majority of vendors fetching water from within the school premises or a short distance, but it was not safe especially in schools that were located in the rural areas. Four of the schools surveyed had no water points, therefore vendors had to bring water from home.
In some schools this necessitated vendors to rely on water sources close to the school of which their reliability and safety were not guaranteed. Poor structures and unhygienic selling-places were some of the major problems associated with infrastructure observed in the schools visited. In some schools there were no appropriate shelters from which vendors could sell their foods, therefore foods were being sold on open ground and exposed to dirt and dust. Sometimes the vending area was being used as public playground, creating congestion and also creating lots of dust. With regard to garbage disposal systems, it was observed that most vendors dispose their garbage in receptacles available in the schools but a significant proportion dispose garbage in open gutters and on the streets. In some schools there were attempts to encourage school children to dispose garbage in receptacles. Nutritional quality of street foods The major sources of food ingredients and pre-made snacks were the city market, local wholesale markets, and local retail shops. Choice of food ingredients was determined mostly by the types of foods preferred by school children as well as cost of ingredients rather than availability and durability of ingredients or knowledge of ingredient preparation or nutritional quality. There were very few vendors who sold single food items that could constitute a significant meal. Vendors explained that most school children preferred small snacks rather than meals such as beans with rice and vegetables because the cost of larger meals was higher as opposed to small snacks. It is also indicating that many children chose the more dense snacks such as fried cassava or fried potatoes as these snacks are more filling than a small biscuit or small piece of a fried snack such as bagia (small fried cowpea flour ball).

34
Most of the single food items sold, namely, fried potatoes, cassava, rice, chapatti and bananas were energy-rich foods and low in protein and micronutrients. Food items sold that are energy-rich but contain protein included fried ground cowpea balls (bagia) and beans; however, the portion sizes were very small. This means that it would take many of the small snack portions to fill their stomachs as well as satisfy or meet their nutrient needs. In order to serve more significant meals or provide larger portion sizes children would probably need to spend more than 100 TZS, which is the average amount of spending money given to children for snacks. This makes schoolchildren to shy away from purchasing such types of foods, and instead they tend to buy fried potatoes, cassava, etc. that have a bigger portion size, tend to fill their stomachs quickly and are relatively cheaper than the other food items. In addition, it is easier to prepare cassava snacks than cowpeas balls (bagias) according to food vendors interviewed. A few vendors included tomato or chili sauce with the snacks they sold, but the portion sizes of the relishes are very small. Many of the snack foods sold were salted, as most salt in Tanzania intended for human consumption is iodized, these foods may be a source of iodine for the children. Generally, the vendors did not sell fruits. When sold, they would tend to vary by season. The nutritional quality of pre-made snacks and drinks was adequate as far as energy content was concerned but lacked other nutrients such as protein and micronutrients. In addition, most of the snacks were deep-fried and drinks were sweetened, and artificially and or naturally coloured, and flavoured, reflecting high content of fat and sugar and probably a very small amount of micronutrients from natural flavouring agents e.g. baobab fruit and tamarind. Several methods of food and snack preparation were noted, namely, deep-frying and boiling. Deep-frying was the most common food preparation method used by more than half of the vendors. Most of them reported to using fresh cooking oil daily rather than weekly, because the amount of oil they can afford to buy is usually very small. In addition, absorption of oil by the food items during frying in low heat could contribute to the decrease in amount of oil used, resulting in high fat content in the foods. Thus there is no risk with regard to repeated use of cooking oil. It was also observed that the rate of evaporation was high because the foods are fried while uncovered. Hygiene and safety of street foods In each school one teacher is assigned to oversee the food vending activity. In general, vendors tend to place their foods where there are a lot of human activities, irrespective of the poor conditions of the surroundings. This situation was observed in the surveyed schools whereby, in addition to lack of appropriate shelter to display and sell the foods, general sanitary condition of the surroundings and utensils used were poor. In some of the schools, vendors displayed foods in uncovered, (plastic containers) and placed directly on dusty and unpaved ground. When school children are out for break, they usually rush to the vendors. This is often the peak time for vending activities. Overcrowding is usually accompanied with increased dust around the vending area, of which eventually gets onto the uncovered food and on vendors themselves, who continue with serving the customers using their bare hands. In most of the schools, good personal hygiene was lacking, both for vendors and school children. There was only one

35
school where vendors put on white aprons and head coverings. In very few schools were vendors seen using special serving utensils (spoons, forks, etc). Most commonly, food is picked up by hand and placed in old newspaper wrapping, some vendors allowed children to pick out the food items themselves with their bare hands, a practice which could easily lead to microbial contamination of the food. Extensive sale of artificially coloured baobab fruits; coloured battered and fried potatoes (kachori) and coloured and flavoured frozen water or ice were observed. The artificial colours and flavours were purchased from local shops and applied to foods at home. Although their safety could not be ascertained at the time of the study, their uncontrolled use could pose a great health risk to schoolchildren who consume these drinks and snacks daily. Improving the nutritional quality of street foods It was observed in the study that majority of the vendors knew the different types of vegetables and fruits grown and sold in their areas. However, their current use was low. This was particularly so for all vegetables except for okra and sweet potato leaves, which were rarely sold. Lack of vegetables could have been attributed by lack of meals prepared for sale to schoolchildren. Usually, vegetable relishes are consumed as part of meals, and if meals are not prepared then vegetables will not feature as part of meals or sold alone. Vendors rarely sold fruits. One to three vendors occasionally sold only jackfruits, African apples, guavas, mangoes, papaya and watermelon. Low sale of fruits could have been attributed largely by variations in cost during the different seasons. When fruits are in season they are normally sold cheaply and would thus be affordable for school children, but vendors feel that the sale of seasonal fruits is not very profitable. When fruits are not in season, more profit can be made, but the cost of sale may exceed children’s budget.(in August the fruits in season include, oranges, tangerines, pineapple, and banana). Vendors raised their concern during focus group discussions that they had tried to sell fruits at one time but school children did not purchase them, and that one type of food that school children do not seem to purchase was fruit. Potential use of vegetables as ingredients in preparation of meals was not encouraging. All vendors who were not found to sell vegetables reported that they had never thought of using them as ingredients. One notable exception was found, where only one vendor had thought of preparing amaranth. The main constraints that might hinder the increased use of vegetables were lack of preference by school children, high cost of vegetables, and difficulty in vegetable preparation. The potential to sell more fruit in the future was more encouraging. The main constraints that might hinder the increased use of fruits were high cost of fruits, low availability, and lack of preference by school children. Low capital and school children’s inability to afford high priced foods were cited by vendors during focus group discussions as the most immediate factors that prevented them from improving the nutritional quality of the foods they sell. Since high cost was found to be a common constraint to the future use of vegetables and fruits, then low capital experienced by the vendors will exacerbate the difficulties in increasing the micronutrients intake of school children. Primary school education System of Tanzania The primary school system of education consists of 2 year- pre- primary education and 7 yrs primary education. The primary school system in Dar es Salaam requires children to be at school by 7.00 – 7.15 in the morning and leave at 2.00 p.m. Therefore the total time schoolchildren spend at school is seven hours. These hours are apportioned in such a way that there are two recess sessions at 10.00 to 10.30 a.m. and at 12.00 to 12.15 p.m. During recess children are allowed to play (unattended), eat foods that they bring from home or buy from street food vendors.

36
Most of the public schools in Tanzania do not provide lunch or snacks to schoolchildren. In fact there are no activities that indicate or relate to school feeding at all. The Ministry of Education and Technical Training and the parents have left the task to teachers to decide what to do. Food vending at schools is the idea of teachers and in some schools the teachers themselves prepare the foods being sold. This is part of their income generating activities for the individual teacher and for the school. Vendors are required to pay a certain amount of money to the school as business rent/fee. A major concern raised in this study is the observation that most children leave home without eating breakfast and very few purchase any food until school recess at 10 a.m.. Barriers to eating breakfast at home include long commuting times to get to school by public bus and the early initiation of school, with some students required to report by seven in the morning for chores around the school grounds. A second concern noted was the type of breakfast typically consumed by school children. Of those who reported having anything in the morning, the majority had only tea, sometimes with added milk. Fruits and vegetables were not consumed during breakfast. Only 57 school children indicated that they drink fruit juice. However, it was not clear whether the juice was freshly prepared or bought from shops (processed), some of which contain sugar, colour and flavour only. Purchase of street foods Almost all school children irrespective of age and location (urban, peri or rural) do purchase street foods. This is inevitable in a system where children stay at school for more than 6 hours and there is no lunch provided by the schools. In this regard parents/guardians/relatives have to contribute a small amount of money to their children or relatives to enable them to buy some snacks while at school. The most unfortunate thing is that the food vending system is not part of the Ministry of Education School feeding strategy. Thus, food vendors enter into agreement with the schools to sell food items within the school compound. In return they pay a small fee to the school. Very little attention is paid to the nutritional quality or the hygiene of the foods sold in most of the schools surveyed. Money for buying street foods The small amount of money that children get for buying street foods hinders improvement of street foods. In order for vendors to improve the nutritional quality of the foods they sell to children it would be necessary to increase the price of the food. It is felt that this would be a barrier for most of the children, as currently they receive on average 150 TZS per day. In fact, most street vendors indicated

37
that they cannot include things like vegetables or fruits to their food items simply because, the food will become expensive and children will not be able to buy. More information is needed to understand the potential opportunities for improvement of the situation. Currently, a plate of rice with beans and vegetables is sold at 300 to 600 TZS and that of maize with beans and vegetables is 300 to 400 TZS. To pay for a nutritious meal at school, parents suggested that an amount between TSh.300.00 and TSh.500.00 would be a reasonable amount per child. However, parents were willing to pay TSh.100.00 to TSh.200.00.This is mostly determined by the parents’ financial ability and not the type of food sold. It was noted by teachers that the children themselves determine management and control of money given for food. They have the freedom to choose the foods they like most while at school. Therefore educating schoolchildren on food choice is crucial, because this would help create quality-conscious pupils who would be able to demand for high quality foods. Criteria for choice of vendors The most important criterion for choice of vendor in most school children was food hygiene (48.7%). However, the level of hygiene among vendors was not optimal. Most vendors were seen serving food using their bare hands, displayed foods uncovered and put food containers on the ground. This is due to poor knowledge on food hygiene and lack of proper infrastructure at the school sites. All vendors have not been trained on street food business or proper food handling. There is an urgent need to train vendors on proper hygiene and food handling. Schools should also be encouraged to provide an adequate vending location with vending stalls raised above ground level. Types of foods consumed by school children The most important snack was cassava. This was being consumed by 49.3% of the school children as a mid-morning snack and 8.2% for breakfast. The other most common snack was samosa (37.5%). Cassava is widely consumed in all schools. Due to its bulkiness, school children prefer it to other snacks. Definitely the portion size to price ratio attracts many children to buy it, and it is usually served with a salad of tomatoes, onions and chilli pepper. Fried cassava is energy dense and filling, helping to satisfy children for a longer period of time than many of the other types of snacks sold. This snack could be improved by serving it with beans and vegetables. Vendors were willing to add nutritional value to cassava snack only if the price would also increase accordingly. Snacking after lunch or dinner was not a common practice among school children. It was interesting to note that fruits are consumed as snacks (between meals) and not during meal times. It is a good practice against eating chocolates. 24-hour recall The 24-hour recall method has shown that the types of foods consumed by school children are limited. Most of them consumed stiff porridge with only one type of relish at home (lunch or dinner). Most of the meals lacked variety/or diversification. In general, the foods that are consumed by schoolchildren are of poor quality, and they cannot provide adequate nutrients for them. It is therefore necessary to improve the nutritional quality of street foods. There are several ways that have been proposed by street food vendors and the parents/teachers. The proposals are presented in Annex 3 and 4. Nutritional status of school children Adolescence represents a window of opportunity to prepare for a healthy adult life. During adolescence, nutritional problems originating earlier in life can potentially be corrected, in addition to addressing current ones. As adolescents have a low prevalence of infections compared with younger children, and of chronic disease compared with ageing people, they have generally been given little health and nutrition attention, except for reproductive health concerns. However, there are nutritional issues, which are adolescent-specific. The main issues in adolescent nutrition are micronutrient deficiencies, malnutrition and stunting, obesity and other nutrition-related chronic diseases, adolescents eating patterns and lifestyles, and nutrition in relation to early pregnancy.

38
Nutritional status of school children by height-for–age The height-for-age usually reflects achieved linear growth. In this study stunting (severe + moderate + mild) was higher in boys (60.5%) than in girls (51.0%). Other studies (Drake et al., 2002) reported stunting to range from 48 to 56%. The trend for HAZ was low in children of age 12 to 16 except at age 17, where it was high. Stunting is widely believed to occur mainly in early childhood (mostly by three years of age), and through a cumulative process. Children stunted at school age are likely to have been exposed to poor nutrition since early childhood and that the degree of stunting tends to increase throughout the school-age years. However, children can exhibit catch-up growth if their environment improves (Frongillo, 1999). This suggests that interventions in school-age children can supplement efforts to reduce levels of stunting and related effects on child’s health and education. The low height-for-age observed in the present study reflects chronic inadequate intake of food (energy and other nutrients) among school children. The present study has shown that a good proportion of school children especially in the rural settings do not eat breakfast. In addition, most of them cannot afford to buy street foods everyday. Consequently, they stay for a long time without getting a proper meal. When they get home, in the late afternoon, or in some occasions early in the evening, they are unable to eat a proper meal to satisfy their nutritional requirements for growth and development. Thus the low height for age reflects a prolonged inadequate intake of food, which is usually experienced by children when they enter class III and above. Schoolchildren in these grades are required to be at school for a total duration of 7 or more hours (7.00 a.m to 2.00 p.m). For children of age 12 to 16, this is a critical period of rapid growth and any failure to supply the body with adequate nutrients, results into underweight and stunting.
39
Focus group discussions with vendors Focus group discussions were conducted at two schools, Mbezi beach and Makongo. At Mbezi beach school the focus group was conducted with 8 vendors (5 women and 3 men) and at Makongo School, the focus group included 6 vendors (4 men and 2 women). Their ages ranged from 18 to 24 years. The discussions were based on three themes, nutritional quality, food safety and food hygiene, and opportunities for change. Detailed discussions are found in Annex 3. Nutritional quality Most vendors learned how to prepare the foods they sell from their neighbours while one vendor learned from his former employment (a restaurant franchise). Most of the women vendors indicated that they knew some nutritional concepts, which they learned at school, from attending maternal and child health (MCH) clinics and from the radio. Male vendors indicated they had less knowledge of nutrition. Some of the respondents mentioned macronutrients present in food and others stated protein was important for bodybuilding. In general participants did not feel that they knew a lot about nutrition. A woman vendor commented on the importance of dietary diversity. She indicated that “if you have rice and fish for lunch then for dinner you should try to have something different like ugali (stiff corn porridge), meat, vegetables and probably fruit.” Generally, vendors did not consider the nutritional quality of the food they sold although they were aware of the importance of food in providing energy and many knew those foods that provide protein, carbohydrate and fat. However, they did not mention any micronutrients present in food. Many vendors responded with specific nutritional function of the food they sold, namely,
• Samosa vendor: “Samosas have carbohydrate and fat and provide energy to the children,” • Bagia (gram flour shaped into small balls and fried) vendor: “Bagia contains gram pulse which
helps to build the body,” • Fried cassava vendor: “Fried cassava has carbohydrate which gives energy,” • Fried potatoes or “chips” vendor: “If chips were overcooked, the quality of the starch would be
destroyed, and • Deep-fried chapatti or “Kaukau” vendor: Kaukau provides energy and since it is fried, it
provides fat as well. Vendors mentioned factors that prevented them from improving the nutritional quality of the foods they sell. These included low capital and pupils’ inability to afford high priced foods. They said: “Improving the nutritional quality would involve purchasing higher priced ingredients such as meat, fresh vegetables, or milk. Pupils pay only very small prices for the foods we sell, so we are not certain if pupils would be able to afford nutritious food that we will sell.” Several vendors were also uncertain whether or not pupils would accept new foods or the addition of more nutritious foods into current recipes. Some vendors indicated they had tried to sell fruits, but the pupils did not purchase them. Vendors mentioned specific types of foods that pupils do not seem to purchase such as fruits and rice buns. To improve the nutritional quality of foods sold to pupils, vendors suggested that they could try to sell different types of foods that are more nutritious such as milk and vegetables. Although all vendors agreed to this idea, they emphasized that nutrition education is needed, both for vendors and for pupils. Pupils need to be encouraged to change their attitude and practices towards food choice and purchase more nutritious products. Parents also need to become more involved and realistic about the cost of a nutritious meal. All vendors agreed that there was a possibility of increasing the use of indigenous foods, although the foods were often seasonal and that switching products would not be good for sustainability of their business. They also commented that they lack the knowledge of how to prepare many indigenous foods and that the cost of these foods is prohibitive, for example, yams are more expensive than cassava. If they were to try to make a traditional dish like rice and beans, the served portion would

40
have to be small to match with the pupils’ ability to buy the food. Therefore it is likely that the pupils would not prefer to buy such a small portion. Food safety and food hygiene Although teachers insisted that food safety and hygiene are one of the requirements before they issue a permit for a vendor to operate in the school premises, generally the conditions in all schools were poor. In two schools, vendors operated in the open and put their food containers on the ground and the venue is located near the school toilets. Only 70% of the schools visited had tables for placing food containers. Vendors at Makongo school felt that their working environment needed to be improved. They would like the school or the government to establish a decent place (cemented and roofed shelter) from where they could operate. They were concerned that the current venue was dusty and the dust got on the food and on them. Mbezi Beach School had built a cemented shelter and vendors felt that it was a good environment; however, they did say that it would be better if there were a separate room for cooking and for selling. Some of the things that vendors do to keep the food safe included: Covering food containers to keep off flies and dust. Keeping the utensils on tables (off the ground) and Using paper (old newspaper pieces) instead of their hands to serve portions of food. At Mbezi Beach school vendors seemed to have more regulations, although they did not refer to the things they did as regulations. They kept their hair covered, cleaned their vending site, washed hands before preparing food, used covered containers, and used forks to serve food portions. The following suggestions were also made by vendors to improve the safety and hygiene of the foods sold, namely, to have a separate cooking and selling venue, to have a reliable source of water, construction of better vending sites like those they have in secondary schools, and preparation of fresh food and cooking be done on school premises. Opportunities for Change To pursue any existing opportunities in order to change the way they do their business was a great challenge to vendors. The vendor who sells fried potatoes indicated that for a while he tried to pre-pack the chips before selling, which protects them from dust and flies and streamlines the sales process during peak periods. Pupils felt they were not getting a full portion when the food was pre-packaged and so they did not like this system. As a result, he went back to serving portions at the vending site when each purchase is made. Another vendor indicated that it would be possible to use utensils instead of hands or newspapers to serve food. (Newspaper ink contains lead, which is absorbed into food if served on paper. The absorption is particularly high from greasy foods – the majority of the type of food sold). None of the vendors mentioned this hazard. One vendor was interested in selling a new product (dried spaghetti and peas). All vendors agreed that there was a need to try to improve on the nutritional quality of the foods they sold and they plan to have a discussion meeting amongst themselves so that they can become better organized. They thought that organizing themselves into groups would enable them to buy better ingredients and also vary the types of food sold to ensure better nutritional balance. Specific suggestions made were addition of beef to samosas, addition of eggs to fried potatoes, addition of groundnuts to bagia, preparation of rice with the addition of beans and vegetables, and addition of milk to frozen water. Additionally, they suggested that schools need to lift restrictions on the numbers of vendors allowed so that new vendors, particularly those who propose to sell a nutritious type of food could have access and offer a variety of foods.

41
Focus group discussions with Parents and Teachers Two focus group discussions were conducted with 10 participants per group, five males and five females. Their ages ranged from 34 to 55 years. The focus group discussions were based on three themes, namely, street foods, alternative options to street foods, and food safety. Detailed discussions are found in Annex 4. Street foods Parents were generally not happy with their pupils staying in school for six hours with little food bought and eaten from vendors. They said that the foods sold are poor hygienically, not nutritious and served in very small portions sizes, thus not enough to help meet their children’s nutritional requirements, especially at their adolescence stage. Parents felt that consumption of street foods is the only choice (though not the best choice) for their pupils when at school. They suggested that an amount between TZS 300.00 and TZS500.00 would be reasonable to pay for a nutritious meal. However, due to parents’ financial inability, parents were willing to pay TZS100.00 to TZS200.00 only. Although only few parents were noted to give specific instructions to their children about the foods they should or should not be bought, teachers said that it is the pupils themselves who ultimately manage and control the money given for food. They have the freedom to choose the foods they like most while at school. Some of the restricted foods include frozen coloured drinks, coloured baobab fruits, roasted groundnuts, and foods that are cold and appear to be unclean. Nutritional quality of street foods was perceived as poor by the parents and teachers because vendors do not consider nutritionally balanced meals when preparing and selling their foods. Safety of the foods sold by vendors was also perceived to be poor because of inadequate hygienic conditions of the utensils used to store and serve the foods, uncertainties of safety of raw materials for the preparation and hygienic conditions of the foods that are prepared at home, holding the food under ambient temperature without complete covering during display and sale, poor sanitation on the area where food is sold, and lack of an appropriate shelter where the foods could be sold in an organized way. To improve the quality of street foods sold, they suggested that existing school committees should instruct vendors to adopt proper food hygiene practices, namely, selling of food in covered containers and serving with a fork; personal cleanliness and use of aprons and head covers; and display of foods on tables. In addition, they suggested that appropriate shelter with tables from which the vendors will be located need to be constructed. Each school has a health committee consisting of teachers, which oversee all activities pertaining to the public health issues. It is, therefore, within the mandate of the school to ensure quality of foods sold, and that the school’s health committees will be responsible for ensuring that vendors adhere to proper regulations and that foods are sold within the school premises. Alternative options to street foods In addition to improving the nutritional quality of street foods, other alternatives that parents and teachers proposed that could be developed to provide nutritious food to pupils while at school were provision of school meals in a form of porridge and pupils be taught how to make better food choices. They suggested that one main vendor with adequate staff need to be contracted to prepare the porridge at school and the schools’ health committees would ensure its quality. A proper and efficient distribution system was suggested to be in place at each school in order for this to succeed and close supervision of class teachers during distribution. Teachers and parents foresaw a challenge in the provision of school meals if great care in planning and involvement of all stakeholders are not taken into consideration, as extra resources will be required from the government, parents or both. Teachers and parents agreed that pupils could be taught and instructed on how to make better food choices, and that this needs to go hand in hand with vendors making improvements in the quality of their foods. Bringing foods and snacks from home was, however, not a feasible alternative as it is constrained by lack of a proper place to store the foods in the school premises. In addition, pupils would lack concentration in class because they will only be thinking of their foods. In addition, not all parents would be able to afford to pack foods for their children.

42
Food safety To ensure general safety and nutritional quality of foods sold to pupils, teachers and parents who are members of the school committees agreed that they would introduce new regulations and implement the old ones with a new vigour, and that they will recruit more vendors who will be instructed to prepare and sell varieties of foods such that pupils can be able to buy different foods. It will be the responsibility of teachers to ensure that vendors follow the regulations. All schools had regulations whereby a certain number of vendors are recruited, instructed on business operating rules and shown where to sell, and later they are supposed to pay duty (per day or per month). These regulations are similar in all schools except that they differ in the types of foods restricted by schools. Although no school had a regulation regarding the use of food flavours and frequency of use of cooking oil, only one school was reported to restrict the sale of foods and drinks (for example baobab fruits and frozen drinks) to which food colours were added. The food colours were bought in local shops and were widely used by the vendors who were not aware of their potential risk if used in uncontrolled manner. Health risks of using food additives that are not permitted or were used in uncontrolled manner were explained to teachers and parents and they all agreed to forward this observation to their committees for further action. Conclusion The study has shown that all primary school pupils consume street foods either at school or at home. It therefore contributes significantly to their nutrient intake. However, the types of street foods sold contain mostly energy and fat, and very little micronutrients. Improving the nutritional quality of street foods could help to meet the micronutrient needs of school children.
In general, the survey was successful. In all the schools visited, the team received excellent cooperation from the teachers, vendors and pupils.
References
Drake, L., Maier, C., Jukes, M and Patrikios, A. (2002). School-Age Children: Their Nutrition and Health .Standing Committee on Nutrition. School-age children and their nutrition.
Frongillo, E.A.J. (1999). Causes and etiology of stunting. American Society for Nutritional Sciences Journal of Nutriion 129:529-530.
Norusis MJ. (1993). SPSS for Windows. Advanced Statistics, release 6.0. Chicago. SPSS Inc.

43
STRATEGY TO IMPROVE THE NUTRITIONAL QUALITY OF STREET FOODS SOLD TO SCHOOLCHILDREN
Introduction One of the most important contributions to good nutritional status of school children is the quality of food and frequency of consumption of the food. Results from the present study have shown that school feeding is not institutionalized in the primary school education system in Tanzania. Therefore children stay for the entire period they are at school without assurance of a meal until when they get home in the late afternoon or evening. The ad hoc measure, which to some extent helps to reduce starvation in some of the school children, is street food business. Individual food vendors usually carry out this business. Aspects of nutritional quality or micronutrient content of foods sold are never considered simply because the vendors themselves are not aware of the nutritional benefits of eating well-balanced meals. The main purpose of their business is to generate income and to provide children with something to eat. The most important nutrients that are usually inadequate in most diets (including snacks sold by street food vendors) in developing countries are micronutrients (vitamins and minerals). This is not because they are in short supply but it is due to low consumption (amount) of foods rich in micronutrients. Micronutrient malnutrition is a major public health problem in Tanzania; in particular due to deficiency of vitamin A, iron, and iodine, the B-group vitamins and zinc. Micronutrient malnutrition affects growth, psychomotor coordination, mental function and skeletal health (Sarma, 2006). Nutrition plays a critical role in physical and intellectual development of children. Micronutrient enriched school meals either as breakfast or mid-morning snacks provided to children help to boost children’s energy levels and make schoolchildren concentrate on their lessons and improve their academic performance. It is evident that children suffering from short-term hunger like those who arrive at school after a long walk or commute over a long distance without breakfast as it was observed in the present study, are unable to pay attention, think, learn and memorise the things that are taught in school, some become listless or hyperactive during class. On a full stomach, a child is able to concentrate and learn. Thus one nutritious meal a day for school children improves attendance, nutritional status and ensures high academic achievement. One of the major impediments to academic achievement for primary school children is poor nutritional status due partly to short period starvation. Starvation even of short duration of about 6 hours may lead to poor intellectual development. The impediment to intellectual development is due to overall physiological condition resulting from inadequate food energy and micronutrient deficiencies characteristic of chronic hunger. Goal: To improve food intake, including adequate food diversity, of school children in
urban areas, in order to improve their nutritional status and their learning capacity, and thus result in better academic performance.
Objectives: To identify and to produce high energy and micronutrient dense foods and snacks for
school children. To create awareness among schoolchildren and other stakeholders on the importance
of meeting dietary macro- and micronutrient needs through the consumption of variety of wholesome foods, with particular attention the consumption of micronutrient rich foods for improved academic achievement.
Types of foods/snacks
1. Cassava products It was observed in the present study (conducted in Kinondoni in Dar es Salaam city) that the most commonly consumed snack in schools is cassava. This suggests that the food is easily

44
available and preferred by school children. However, the level of micronutrient and protein in cassava is low, but cassava is a good source of energy. Therefore addition of ingredients such as legumes and spices may improve the nutritional quality as well as the palatability of cassava. Preparation of cassava based “kebab” Raw cassava is pounded and squeezed to remove water. Beans about half the proportion of cassava are boiled to softness and added to the cassava mash, other ingredients such as onions and garlic are added and mixed together. This is then molded into balls or any desirable shapes and deep-fried until cooked. Depending on the size, the price may range from 50 TZS to 100 TZS. This can be commissioned to a group of young entrepreneurs to carry out mass production of the product and package it nicely for distribution to primary schools. It is envisaged that this will stimulate production of cassava as well as beans by farmers because there will be a ready market for the raw ingredients i.e. beans and cassava. In terms of nutritional quality, the product will have more nutrients such as protein, iron, B-group vitamins especially thiamine from beans and other minerals such as zinc from onions and garlic.
Mineral and vitamin fortified cassava biscuits As an alternative or a variation to the product described above, cassava flour can be fortified with minerals (iron, zinc) and vitamins (C, & Bs) and made into biscuits and distributed to primary schools. This can be formulated to provide about one third of micronutrient requirements of school children. A large company, which is manufacturing confectionery products, may be commissioned to make the biscuits and sell them in primary schools.
2. Solar dried fruits
Other snacks that may be considered include solar dried fruits. Tanzania is endowed with a variety of fruits (Mangoes, pineapples, baobab, tamarind, etc). However, processing of fruits is low. Therefore during peak production periods about 50 – 60% of fruits are wasted either destroyed during transportation or rot while waiting to be sold. Sometimes sales are not good due to the low purchasing power of consumers and lack of awareness on the importance of fruits for human health. Therefore to increase utilization of fruits and increase consumption of micronutrient rich foods by school children, fruits that are in season can be solar dried, packaged and distributed and sold in primary schools. The solar driers cost about 100,000 TZS (about 95 USD) to manufacture and can be used for a long period, hence making the unit cost of production of the products very low. Fruits cost about 50 to 100 TZS when are in season. This is farm gate price i.e. if bought directly from farmers. Thus a packet of dried fruits may be sold at 50 to 100 TZS. This is affordable to most children. It is also envisaged that this can create employment for young graduates who want to venture into processing and business.
3. Reconstituted milk: dried milk can be reconstituted and packed in disposable plastic bags
and sold to children at a low price. Young graduates in food science and agribusiness can do this at a small-scale level. It is envisaged that this may improve nutritional status of children and at the same time stimulate production of milk by farmers.
��������������� ������������������������������������������� ������������������������������������������� ������������������������������������������� ��������������������������������������������

45
�������������������� ���� ������������������������������������������������������
�������������� ������ ����������������������������������������� �������������������
���������
Educate children on food choice so that they are able to choose foods that are energy and micronutrient dense and on the importance of eating breakfast every day. In addition encourage families to ensure that children eat breakfast before they leave home for school. It was also revealed during the meeting with teachers that, some parents do not pay attention to what their children eat. It is therefore strongly recommended that parents be sensitized on proper feeding of their school-aged children. This can be done through seminars, mass media and preparation of leaflets/brochures that explain the benefits of food in general and micronutrient in particular for health and intellectual development and distributed in schools. Teachers and parents observed that pupils could be taught and instructed on how to make better food choices, although this needs to go hand in hand with vendors making improvements in the quality of their foods. This would help create quality-conscious pupils who would be able to demand for high quality foods. This will be the responsibility of teachers while the children are at school with the help of parents when children are at home.
It was observed in the present study that under the current school infrastructure and logistics, schools are not in a position to offer meals to schoolchildren during lunchtime. In this regard, the government will be urged to support those who are willing to manufacture snacks for school children either by providing loans or start up capital to install machines for processing and subsidize the cost of production. There must be a deliberate effort by the Government to ensure that children get at least a healthy nutritious snack while they are in school.

46
Annex 1: Background characteristics of the schools surveyed Name of primary school
Number of pupils enrolled in interviewed class
Number of pupils interviewed
Class grade (Standard) interviewed
Whether school provide meals
Number of vendors selling on school grounds
Whether vendors are allowed access to school water points
Number and type of water point
Number of toilets on school premises
Bunju A 76 64 V No 8 Yes 1 Tap 8 Boko 69 59 VI No 9 Yes 1 Well 14 Mtambani 58 52 VI No 6 Yes 1 Well 10 Kunguru Meroe
64 45 VI No 8 Yes None 8
Sinza 48 42 V No 5 Yes None 14 Reginald Mengi
57 52 VI No 8 Yes None 8
Makongo 90 70 VI No 4 Yes 1 Tank & Tap
18
Mbezi Beach 67 67 V No 8 Yes 2 Tap 9 Kijitonyama 59 50 VI No 5 No 1 Tap 20 Kumbukumbu 329 76 VI No 10 Yes 3 Tap 17 Msisiri 82 76 VI No 13 Yes 4 Tap 9 Mzimuni 74 51 VI No 20 No 2 Tap 26 Hekima 180 78 VI No 9 Yes 1 Tap 6 Kilimani 76 52 VI No 8 Yes 2 Wells 18 Muungano 89 62 VI No 8 Yes 1 Well 8 Ukombozi 80 63 VI No 13 Yes 1 Tap 18 Barafu 81 76 VI No 0 No 1 Well None Idris Abdul Wakil
37 30 VI No 7 Yes 2 Well 2
Mlimani 72 65 VI No 11 Yes 2 Tap 18 Makuburi Jeshini
51 50 VI No 12 No None 10

47
Annex 2: General Observations 15-08-05 Bunju A Primary School in Bunju area. The school is in a rural setting. Its grounds and classrooms were clean. Conversation with the Head mistress, Desderia Maita, revealed that she does not prefer children to go home for breakfast at 10 am break, as children often do not return back to school. She would prefer to have more control over the vendors, make them a hut to sell from and keep a closer eye on what they do. She commented that she is not happy with the hygiene and would prefer if they used different containers and serving utensils to serve the children their portion. She did not comment on the nutritional quality of the foods sold, but was concerned about the food hygiene. The vendors sold their goods in the dirt. The area was very dusty. Children were allowed to reach into the plate to choose their portion of food. The range of foods sold was good. A few of the women sold rice and beans, and then the typical samosa, bagia, kacholi and flavoured water. 16-08-2005 Kunguru-Meroe Primary School in Goba area. It is located in a peri-urban area, with many expensive homes in place and being built along the 10 km road leading to the school. The school has one water tap, but it is operational only on Saturdays. Children are sent 2 km away to bring water for use during school days. The vendors operate in the dirt under the shade of a large tree. The hygiene was quite poor. Women used their hands to collect money and pick out portions of snacks for the children. All vendors used some cover for their food. 17-08-05 Makongo Primary School in Kawe area. The school is located in a peri-urban area with some children coming from households of higher socio-economic status. It is the the first school where overweight pupils were noticed. Vendors had a small area off the ground, tables and a bit of corrugated iron roof. These vendors participated in the focus group. 17-08-05 Mbezi Beach Primary School in Kawe area. The school is located in a middle class neighbourhood. The vendors had a cement block, corrugated roof shelter for vending. They also had higher hygiene standards; they covered their hair, used utensils to serve food. They also clean their vending site, although they do not have access to water. These vendors participated in the focus group. 18-08-05 Msisiri Primary School in Kinondoni Mahakamani area. This is a very large school with 1,600 pupils. The school is situated in an urban neighbourhood on a commercial street, but the school is set-back from the road in a compound with many trees. The vending area at this school was in a poor location, near the toilets. There was a small corrugated iron roofing and area for cooking foods, which was occupied by only two of the vendors, one selling chips and the other fried cassava. The remainder of the vendors was situated in a line along the back wall of a classroom. Although there was a garbage bin in place, the area was littered with trash and there were many flies. The vendors sold a large array of items, but most of them were not of high nutritional value.
48
The deputy head mistress of the school mentioned that there were three teachers responsible for the vendors and that everyday one of them went around to the vendors and sampled the food they prepared to ensure that it was fresh and not left over from the previous day. Other than this precaution there was not much care taken to ensure proper hygiene, although all of the vendors covered their food, one vendor only had a rudimentary covering from a piece of newspaper. The mango vendor had a bucket of water next to her and would wash her hands before serving pieces of fruit. The children were also allowed to chose their own pieces and were encourage (at least while an investigator was watching) to wash their hands before choosing fruits. The school deputy also discussed school meals. She said the children in kindergarten were all given porridge and that their parents pay some amount of money for this service. She did not think this system would be feasible on a larger scale because of the logistics of serving such a large number of children and the cost that the school would incur. She also said that many of the children were orphans and would not be able to pay. 18-08-05 Kumbukumbu Primary School in Kinondoni Biafra area. The vendors here sold their food from a very nice establishment with cooking spaces in the back and tables in front. They all wore hats and aprons and were very clean. They have organized themselves with some help from the school. The type of foods sold at this school also seemed to be of a higher nutritional quality (rice with beans, tomatoes and green leaves).
49
Annex 3: Focus Group Discussions with Vendors The focus group discussions were based around 3 themes; Nutritional Quality, Food safety and food hygiene and Opportunities for change. Several questions were posed relating to each theme and probing questions helped to draw out participants’ ideas and feelings. The primary theme was nutritional quality and at least half of the discussion time was dedicated to this topic. The focus group discussions were conducted on Wednesday 17th August 2005; one at Mbezi Beach Primary School, consisting of 8 vendors (5 women and 3 men), and another at Makongo Primary School, which included 6 vendors (4 men and 2 women). The age range of the vendors in Makongo was 18-24 years. Theme I – Nutritional Quality Qn. Where did you learn to prepare the food(s) you sell? Most respondent learned how to prepare the food they sell from a neighbour. One respondent learned from his former employment in a restaurant. Qn. Do you have any knowledge of nutrition and where did you learn about nutritional issues? Most of the women indicated that they knew some nutritional concepts, which they learned at school, from attending maternal and child health clinics and from the radio. Men indicated they had less knowledge of nutrition. Some of the respondents mentioned macronutrients present in food and others stated protein was important for body building. In general participants did not feel that they knew a lot about nutrition. One woman commented on the importance of dietary diversity. She indicated that “if you have rice and fish for lunch then for dinner you should try to have something different like ugali (stiff corn porridge), meat, vegetables and probably fruit” Qn. Do you consider the nutritional quality of the food you sell? Overall the vendors were aware of the importance of food to provide energy and many knew those foods that provide protein, carbohydrate and fat. They did not mention any micronutrients present in food. Many vendors responded with specific nutritional properties of the food they sold;
• Samosa vendor: “Samosas have carbohydrate and fat and provide energy to the children.” • Bagia (gram flour shaped into small balls and fried) vendor: “Bagia contains gram pulse
which helps to build the body.” • Fried cassava vendor: “Fried cassava has carbohydrate which gives energy.” • Fried potatoes or “chips” vendor: “If chips were overcooked, the quality of the starch
would be destroyed. • Deep-fried chapatti or “Kaukau” vendor: Kaukau provides energy and since it is fried, it
provides fat as well.

50
Qn. What prevents you from considering the nutritional quality of the food you sell? Improving the nutritional quality would involve purchasing higher priced ingredients (meat, fresh vegetables, milk) and currently the children pay only very small prices for the foods we sell, so it is not certain if children would be able to afford more nutritious food. Several vendors were also uncertain whether or not children would accept new foods or the addition of more nutritious foods into current recipes. Some vendors indicated they had tried to sell fruits, but the pupils did not purchase them. Qn. What do you think should be done to improve the nutritional quality of food sold to children? Specific comments were again made about the type of foods children like and will purchase and those foods which they do not seem to purchase (fruits, rice buns). A suggestion was made that the vendors could try to sell different types of food that are more nutritious such as milk and vegetables. They all agreed, however, that nutritional education is needed, both for vendors and for pupils. The pupils need to be encouraged to change their practices to purchase more nutritious products. Parents also need to become more involved and realistic about the cost of a nutritious meal. When pupils pay between TSh.50.00 and TSh.200.00 for a school snack, the cost is a main factor to the types of food that can be sold. Qn. Do you think there are any opportunities to increase the nutritional properties of the food you sell by using indigenous foods? All vendors said that there was a possibility, but that indigenous foods were often seasonal and that switching products was not good for sustainability of their business. They also commented that, they lack the knowledge of how to prepare many indigenous foods and that the cost of these foods is prohibitive (yams are more expensive than cassava). If they were to try to make a traditional dish like rice and beans, the served portion would have to be small to match pupils’ money for snack, and that pupils would not prefer such a small portion. Theme II - Food Safety and Hygiene Qn. What are your opinions about the sales venue you operate in? The vendors at Makongo felt their environment needed to be improved. They would like the school or the government to establish a cemented and covered shelter from where they could operate. They were concerned that the current venue was dusty and the dust got on the food and on them. At Mbezi Beach the school had built a cemented shelter and the vendors felt this was a good sales venue. They did say that it would be better if there was a separate hut for cooking and for selling. Qn. What do you do to keep your food safe? All of the vendors indicated they covered their food to keep off flies and dust. Some responded that they also do other things such as keeping the utensils on a table lifted off of the ground and using paper instead of their hands to serve pieces of food.

51
At Mbezi Beach they seemed to have more regulations, although they did not refer to the things they did as regulations. They kept their hair covered, cleaned their vending site, washed hands before preparing food, used covered containers, and used forks to serve food portions. Qn. Is there anything else that can be done to improve the safety and hygiene of the food you sell? The following suggestions were made by vendors to improve the safety and hygiene of the foods sold:
• Have a separate cooking and selling venue. • Have a reliable source of water • Construct better vending sites like those they have in secondary schools
Theme III- Opportunities for Change Qn. What opportunities do you have to change the way you do business? The chips vendor indicated that for awhile they tried to pre-pack the foods before selling them, which protects them from dust and flies and streamlines the sales process during peak periods. It was felt that the children did not like this system, they felt they were not getting a full portion when the food was pre-packaged, so for business he went back to serving portions at the vending site when each purchase is made. Another vendor indicted it would be possible to use utensils instead of hands or newspapers to serve food. (Newspaper ink contains lead, which is absorbed into food if served on paper. The absorption is particularly high from greasy foods – the majority of the type of food sold). None of the vendors mentioned this hazard. One vendor was interested in selling a new product (dried spaghetti and peas), while another suggested preparation of fresh food and cooking be done on school premises. Qn. What strategies could improve the nutritional quality of the food you sell? All of the vendors agreed that there was a need to try to improve on the nutritional quality of the foods they sold and discussed having a meeting amongst themselves to become better organized. The vendors thought that organizing themselves was a good strategy to improve the nutritional quality of the food sold. By organizing into groups they would be able to buy better ingredients and also vary the types of food sold to ensure better nutritional balance. The following were also specific suggestions mentioned for increasing the nutritional value of specific food items;
• Add beef to samosa • Add milk when we make ice cream • Add eggs to fried potato • Add groundnuts to “bagia” • Add beans/vegetables to rice

52
Additionally, it was mentioned that schools regulate the number of vendors allowed to sell on the premises and this limits the different number of foods available for sale. The school could lift restrictions on numbers of vendors and allow new vendors; particularly those who propose to sell a nutritious type of food, such as fruit.

53
Annex 4: Focus Group Discussions with Parents and Teachers The focus group discussions were based around 3 themes; Street foods, Alternative options to street foods and Food safety. Several questions were posed relating to each theme and probing questions helped to draw out participants’ ideas and feelings. The primary theme was street foods. Two focus group discussions involving teachers and parents were conducted on Saturday 20th August 2005, one at Mwalimu Nyerere Primary School and another at Kunduchi Primary School. Each group consisted of 10 participants, five males and five females. Their ages ranged from 34 to 55 years. Theme I – Street foods Qn. Are parents happy with children staying in school for six hours with little food bought from the vendors? All parents were not happy with their children staying in school for six hours with little food bought and eaten from vendors. They said that the foods are not nutritious and very little, thus not enough to help meet their children’s nutritional requirements, especially at their adolescence stage. This contributes to poor concentration during class sessions. In addition, the hygienic conditions of the foods were not known because most of them were prepared at home where it is difficult to ascertain their safety. Qn. Do parents feel that street foods are a good choice for their children? Parents felt that consumption of street foods is the only choice (though not the best choice) for their children when at school. This is for the purpose of reducing hunger while waiting for the main meal at home, and as a motivation to a child so that they can feel loved. Qn. What do the parents think is a reasonable amount of money to pay for a nutritious meal at school and how much are they willing to pay? To pay for a nutritious meal at school, parents suggested that an amount between TSh.300.00 and TSh.500.00 would be a reasonable amount per child. However, parents were willing to pay TSh.100.00 to TSh.200.00.This is mostly determined by the parents’ financial ability and not the type of food sold. It was noted by teachers that the children themselves determine management and control of money given for food. They have the freedom to choose the foods they like most while at school. Qn. What kinds of foods do the parents and teachers think are nutritious for the pupils? Parents and teachers mentioned different types of foods that they thought were nutritious. These included rice, sweet potatoes, cassava, potato chips, stiff porridge or “ugali” beans, cowpeas, peas, meat, tomatoes and oranges. In addition, protein-rich foods and fruits, and a meal that contain foods from the three food-groups were also mentioned as nutritious for the growing children. Although some of the nutritious foods were mentioned and nutritional requirements of these children were known to be high, they noted that not all households could afford to provide nutritious meals at home.
54
Qn. What is the general perception of parents and teachers regarding the nutritional quality, safety and location of street foods sold to the pupils? Nutritional quality of street foods was perceived as poor by the parents and teachers because vendors do not consider nutritionally balanced meals when preparing and selling their foods. They commented that vendors are engaged in the business in order to get profit only and that they go to the extent of adding food colours in order to make their foods more attractive to pupils. For example, frozen coloured drinks that contain water, sugar and food colour provide energy only from the added sugar that is also inadequate for the growing child. Safety of the foods sold by vendors was also perceived to be poor because of inadequate hygienic conditions of the utensils used to store and serve the foods, uncertainties of safety of raw materials for the preparation and hygienic conditions of the foods that are prepared at home, holding the food under ambient temperature without complete covering during display and sale, poor sanitation on the area where food is sold, and lack of an appropriate shelter where the foods could be sold in an organized way. Qn. How can the foods sold by vendors be improved? Parents and teachers admitted that the issue of pupils buying street foods of high quality has not been given high priority by the school committees. This is partly because parents expect that their children would eat main meals after school. In view of this, there is no elaborate system of sale or provision of food at school. They made suggestions on how to improve the quality of foods sold by vendors. These included willingness of the school committees to instruct vendors to adopt proper food hygiene practices, namely, selling of food in covered containers and serving with a fork; personal cleanliness and use of aprons and head covers; and display of foods on erected tables. In addition, construction of appropriate shelter with tables from which the vendors will be located was another proposed suggestion that would be forwarded to the school committees for further consideration. Qn. Do the parents instruct their children to buy certain types of foods and not others? What is the basis of criteria for choice? It was noted that it is only few parents who give specific instructions to their children about which foods should or should not be bought. Some examples of restricted foods included frozen coloured drinks of which parents restrict to avoid coughs and colds. Coloured baobab fruits and grilled groundnuts (packed in small polyethylene bags) are also restricted to avoid transmission of air-borne diseases because the bags are mouth-blown to open them up before packing. Parents also instruct their children to buy foods that are sold while hot and appear to be clean and from vendors who are clean. Theme II – Alternative options to Street foods Qn. In addition to improving the nutritional quality of street foods, are there other alternative options that parents and teachers propose that could be developed to provide nutritious food to pupils while at school? Measures proposed were provision of school meals in a form of porridge, and pupils be taught how to make better food choices. Three schools had a past experience of providing porridge to the pupils for a maximum period of six months. One vendor was contracted to prepare the porridge at school and the schools’ health committees ensured its quality. This did not continue

55
due to poor distribution system during pupils’ break time such that the whole school timetable was disrupted although teachers intervened to assist. In addition, most pupils preferred street foods than the porridge, thus most of the porridge was left unconsumed. A proper and efficient distribution system was suggested to be in place at each school in order for this to succeed, such as recruitment of one main vendor with his/her assistants and supervision of class teachers during distribution. Teachers and parents foresee a challenge in the provision of school meals if great care in planning and involvement of all stakeholders are not taken into consideration, as extra resources will be required from the government, parents or both. Since the implementation of policy on primary education, Mpango wa Maendeleo ya Elimu ya Msingi (MMEM) 2001-2006, the government has been responsible for all direct costs during pupils’ primary education, such that parents make no monetary contributions. In view of this, parents might be reluctant to make monetary contributions toward the provision of school meals, thus making the project unsuccessful. Teachers and parents agreed that pupils could be taught and instructed on how to make better food choices, although this need to go hand in hand with vendors making improvements in the quality of their foods. This would help create quality-conscious pupils who would be able to demand for high quality foods. This will be the responsibility of teachers while at school with the help of parents at home. Bringing foods and snacks from home was not agreed as a possible alternative for providing nutritious food to pupils while at school. This was constrained by lack of a proper place to store the foods in the school premises. Teachers noted that pupils would lack concentration in class because they will only be thinking of their foods. In addition, not all parents would be able to afford to pack foods, as a result conflicts and fights over the foods will emerge between the pupils who bring foods and those who don’t; and those who don’t will feel inferior and will be affected psychologically. Qn. Is it within the mandate of the school to ensure quality of foods sold to the children? Each school had a health committee consisting of teachers, which oversee all activities pertaining to the public health issues. It is within the mandate of the school to ensure quality of foods sold, therefore, the school’s health committees will be responsible for ensuring that vendors adhere to proper regulations and that foods are sold within the school premises. Theme III – Food Safety Qn. What can teachers and parents do to ensure food safety and nutritional quality? To ensure general safety of foods sold to pupils, teachers and parents who are members of the school committees agreed that they could introduce new regulations and implement the old ones with a new vigour. It will be the responsibility of teachers to ensure that vendors follow the regulations. All schools had regulations whereby a certain number of vendors are recruited, instructed on business operating rules and shown where to sell, and later they are supposed to pay duty (per day or per month). These regulations are similar in all schools except that they differ in the types of foods restricted by schools.

56
Although no school had a regulation regarding the use of food flavours and frequency of use of cooking oil, only one school was reported to restrict the sale of foods and drinks (for example baobab fruits and frozen drinks) to which food colours were added. The food colours were bought in local shops and were widely used by the vendors who were not aware of their potential risk if used in uncontrolled manner. Health risks of using food additives that are not permitted or were used in uncontrolled manner were explained to teachers and parents and they all agreed to forward this observation to their committees for further action. To ensure general nutritional quality of foods sold to pupils, teachers and parents agreed that there was a need to recruit more vendors who will be instructed to prepare and sell varieties of foods such that pupils can be able to buy different foods. Qn. Are teachers aware of Tanzania Government or Municipal regulations that govern safety of food? Teachers were aware of a few of the national and municipal regulations that govern food safety. These included sale of imported foods that are fit for human consumption, sale of foods in hygienic conditions while in clean and covered containers, and restriction of fishing using gunpowder. In addition, they were aware of the health officers who inspect foods, food premises, and public health services such as their schools. Whenever improvements are needed, these officers instruct teachers and from these communications school health committees learn more and supervise the required changes.

57
Annex 5: The Survey Tool Used for Data Collection
Questionnaire on street foods for school children
Name of school ________________________ Date ___________
Respondent name/No._______________________________________
Part 1: Street food consumption
1. Gender of respondent 1. Male 2. Female
2. What is your age? 3. What grade are you in? _________
4. Before you leave home, do you get breakfast? 1. Yes 2. No
5. Do you normally bring your own lunch/snack to school? 1. Yes 2. No
6. Do you ever purchase food meals or snacks from street food vendors? 1. Yes 2. No
7. How often do you purchase street food? ___________________
8. Do you always purchase your food from the same vendor? _________________
1. Yes
2. No
9. How much money do you get from your parents ______________
10. Who introduced you to the vendor? ________________
1. A friend
1. Everyday.
2. Two to three times per week
3. Once per week
4. Less than once per week
1. I do not purchase at all

58
2. My parents
3. My sister/brother
4. My teacher
5. No one
Other ( Specify)____________________________
11. Why did he/she introduce you to that vendor?______________________________
12. Which meals and foods do you buy from street food vendors?_____________
1. Breakfast
2. Lunch
3. Dinner
4. Morning snack
5. After school snack
6. After dinner snack
Other (Specify)______________________________________
13. What is the main criterion for your choice of vendor? ______________
1. The type of food they sell
2. The price of the food
3. The hygiene is good
4. The vendor is nice
5. I know the vendor or part of the family
6. The vendor gives larger portions
Other (Specify)______________________________

59
Section – Perceptions of street food quality
14. Do you think that all, most, only a few or none of the foods sold by street food vendors are safe to eat? ___________________, _____________, ______________ (Multiple responses are accepted)
1. All
2. Most
3. Only a few
4. None
8. Don’t know
15. Are there any types of foods in particular that you think are less safe to eat? _______
1. Yes
2. No (Go to question 18)
8. Don’t know (Go to question 18)
16. If yes, which food(s) are less safe to eat from street food vendors?
________________________________________________________________________________________________________________________________________________
17. Why are these foods more likely to be unsafe? ________________________________________________________________________________________________________________________________________________
18. Have you ever heard of anyone becoming ill after eating street foods?____________
1. Yes
2. No
19. Mention the foods you ate yesterday from morning when you wake up till night when you go to

60
Occassion Type of food Preparation place ( Home or Street)
Breakfast
H S
Morning snacks
H S
Lunch
H S
Afternoon snacks
H S
Evening snacks
H S
Dinner
H S
Night snacks
H S

61
Section 3 Types of street food purchased
Using the codes from question 12 record the types of meals/snacks typically purchased by the respondent. And then for each meal or snack typically purchased ask the following questions:
i) What is the most common item you purchase for (name of meal, snack or beverage)
ii) What are your main criteria for this purchase?
iii) How much does this cost

62
Record up to the three most commonly purchased foods for each meal/snack
Code of meal or snack (1-6)
“Which foods do you normally purchase for...(name or meal or snack)
Where do you normal purchase (name of meal/snack)?
Which foods do you normally purchase for...(name or meal or snack)
What is the main criteria for your choice?
How much does this snack or meal cost?
Which foods do you normally purchase for...(name or meal or snack)
What is the main criteria for your choice?
How much does this snack or meal cost?
Which foods do you normally purchase for...(name or meal or snack)
What is the main criteria for your choice?
How much does this snack or meal cost?
Codes for column 1: Breakfast – 1, Lunch – 2, Dinner – 3, Morning snack – 4, Afternoon/school snack – 5, After dinner snack – 6
Codes for Column 2: On the road to/from school – 1, In the school yard – 2, Other – 3
Codes for Column 3: Cost of the snack/meal - 1, Availability-2, Preference -3, Large portion size -4, Taste – 5, Nutritional value -6, Others -7, Don’t know -8
Measurements
1. Weight_____________________ 2. Height_____________________ 3. Mid upper arm circumference____________
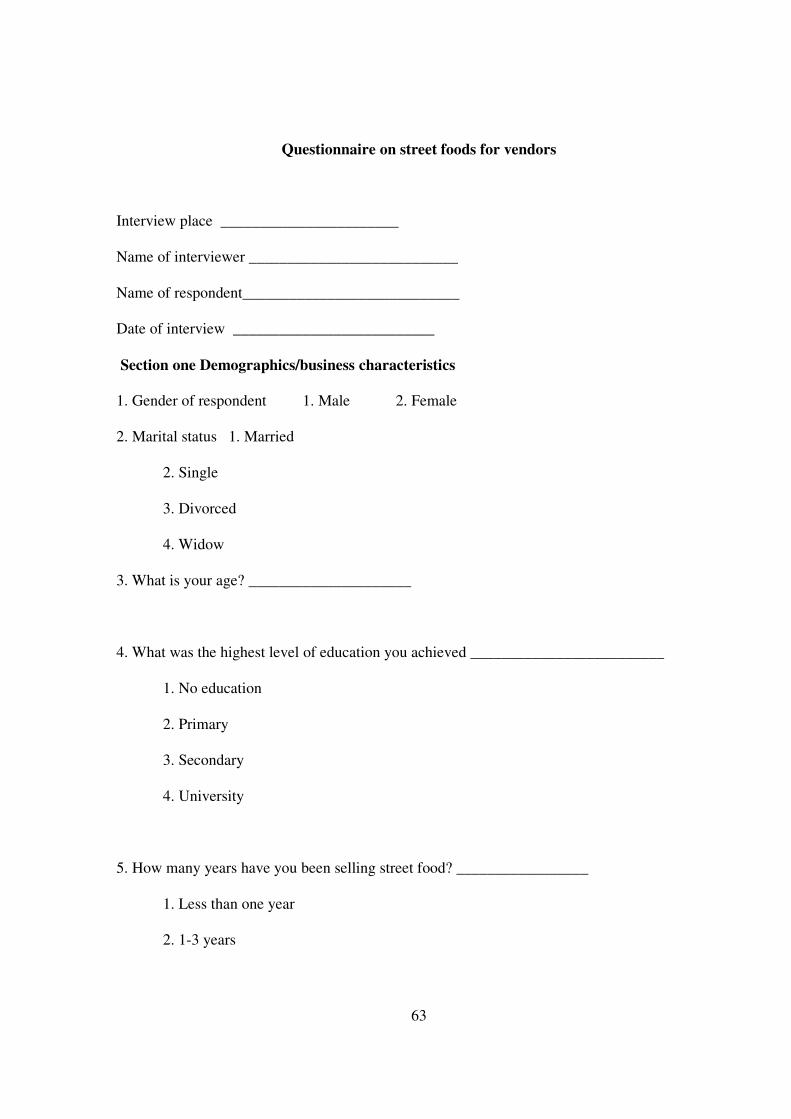
63
Questionnaire on street foods for vendors
Interview place _______________________
Name of interviewer ___________________________
Name of respondent____________________________
Date of interview __________________________
Section one Demographics/business characteristics
1. Gender of respondent 1. Male 2. Female
2. Marital status 1. Married
2. Single
3. Divorced
4. Widow
3. What is your age? _____________________
4. What was the highest level of education you achieved _________________________
1. No education
2. Primary
3. Secondary
4. University
5. How many years have you been selling street food? _________________
1. Less than one year
2. 1-3 years

64
3. 3-5 years
4. More than five years
6. Does your business earn you profit ___________________
1. Yes
2. No
7. Do you have any other sources of income? __________________
1. Yes
2. No
8. What else do you do to earn income? ___________________, _____________, ______________ (Multiple responses are accepted)
1. Selling vegetables
2. Gardening
3. Hair dressing
4. Tailoring
5. Modeling
6. Selling charcoal
7. Making burns
8. Grinding stones
9. How many persons do you employ to help you in the street food business?________
(if no employees write 0)
10. Is your street food business fixed or ambulatory? ___________________
1. Fixed (stationary location)

65
2. Ambulatory (walks neighborhoods, business centers)
11. Why did you select the location you currently sell from? __________________
1. No other choice
2. Profitable location
3. Convenient for me (near home)
4. Allocated by municipal
Others (Specify)________________________________________
12 Do you sell food only or mostly to students? _____________________
1. For students only
2. Mostly for student
3. Mostly for passerby
13. Have you ever received training on an aspect of running a streetfood business? ________
1. Yes 2. No (Go to question number 15)
14. Which type of training did you receive?
Training codes: 1- Sanitary practices and concepts, 2 - Nutrition, 3-City rules, regulations, 4 -Food preparation/cooking, 5 - How to run a business, 6 - Other
15. Is your business registered? ( Give reason for each answer)
1. Yes ______________________________________________________________________
Training code
Organization Duration of training
Govt NGO

66
______________________________________________________
2. No ________________________________________________________________________
______________________________________________________
Section – Hygiene
16. At your vending site, where is the nearest water source? ________________
1. On site
2. Less than five minutes walk
3. 5-15 minutes walk
4. More than 15 minutes walk
9. Don’t know
17 How are dirty plates/cups cleaned? ___________________________
1. Rinsed with cold water
2. Rinsed with soap and cold water
3. Rinsed with hot water
4. Rinsed with soap and hot water
5. No plates or cups used
Other __________________________________________
9. Don’t know
18. How do you dispose of the garbage? _________________
1. Trash receptacle
2. On the street
3. In the gutter
9. Don’t know

67
Other (Mention)____________________________
19 After what time do you normally change the oil used in frying chips, burns or fish ________
1. Daily
4. Never changed
5. After frying ten times
6. After frying more than ten times
9. Don’t know
Section two – Food supply
20. Where do you mainly purchase the ingredients for your business? ___________________, _____________, ______________ (Multiple responses are accepted)
1. Wholesale market
2. Large local market
3. Local shop
4. Producer
5. Own production
Other (specify) ____________________________
21 What is the main criteria for your choice of ingredients? ___________________
1. Cost
2. Availability
2. Weekly
3. Monthly

68
3. Customer preference
4. Shelf life (durability of ingredient)
5. What I know how to prepare
Other _______________________________________
9. Don’t know
22. Do you do anything to minimize the cost of ingredients? ___________________, _____________, ______________ (Multiple responses are accepted)
1. Buying in bulk
2. Buying from wholesaler
3. Buying at the end of the market day
4. Buying food of lesser quality (lower value meat cuts, overly ripe produce)
5. Use own produce when possible
Other (Specify) ____________________________________________________
9. Don’t know
23. Do you purchase pre-made snacks or drinks? ______________
1. Yes
2. No
24. What kind?
25. Where do you get them_______________________
1. Neighbors
2. Super market
3. Wholesale shop
4. Local shop
5. Others (Specify)

69
26. Do you take into consideration the nutritional quality of the food you sell? ___________
1. Yes
2. No
3. Don’t know
27. How many different types street foods do you sell?______________
Meals _______________________________________________
Snacks _____________________________________________
Fruit juices __________________________________________
Other beverages ______________________________________
28. Does the food you sell vary depending on the season? ___________________
1. Yes
2. No
29. Among those food which type depends on the season?
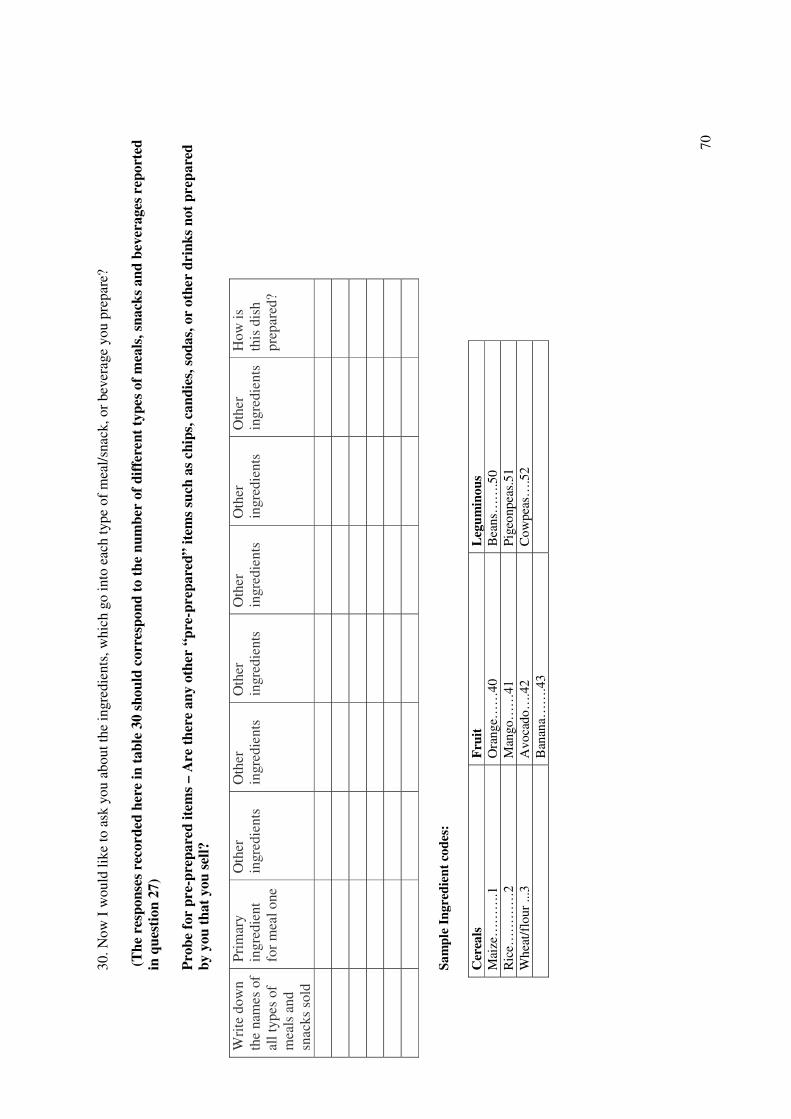
70
30. N
ow I
wou
ld li
ke to
ask
you
abo
ut th
e in
gred
ient
s, w
hich
go
into
eac
h ty
pe o
f m
eal/
snac
k, o
r be
vera
ge y
ou p
repa
re?
(T
he r
espo
nses
rec
orde
d he
re in
tab
le 3
0 sh
ould
cor
resp
ond
to t
he n
umbe
r of
dif
fere
nt t
ypes
of
mea
ls, s
nack
s an
d be
vera
ges
repo
rted
in
que
stio
n 27
)
Pro
be f
or p
re-p
repa
red
item
s –
Are
the
re a
ny o
ther
“pr
e-pr
epar
ed”
item
s su
ch a
s ch
ips,
can
dies
, sod
as, o
r ot
her
drin
ks n
ot p
repa
red
by y
ou t
hat
you
sell?
Wri
te d
own
the
nam
es o
f al
l typ
es o
f m
eals
and
sn
acks
sol
d
Prim
ary
ingr
edie
nt
for
mea
l one
Oth
er
ingr
edie
nts
O
ther
in
gred
ient
s
Oth
er
ingr
edie
nts
O
ther
in
gred
ient
s
Oth
er
ingr
edie
nts
O
ther
in
gred
ient
s
How
is
this
dis
h pr
epar
ed?
Sam
ple
Ingr
edie
nt c
odes
:
Cer
eals
F
ruit
L
egum
inou
s M
aize
……
….1
O
rang
e……
40
B
eans
……
.50
Ric
e……
……
2
Man
go…
…41
Pige
onpe
as.5
1
Whe
at/f
lour
...3
A
voca
do…
.42
C
owpe
as…
.52
Ban
ana…
….4
3
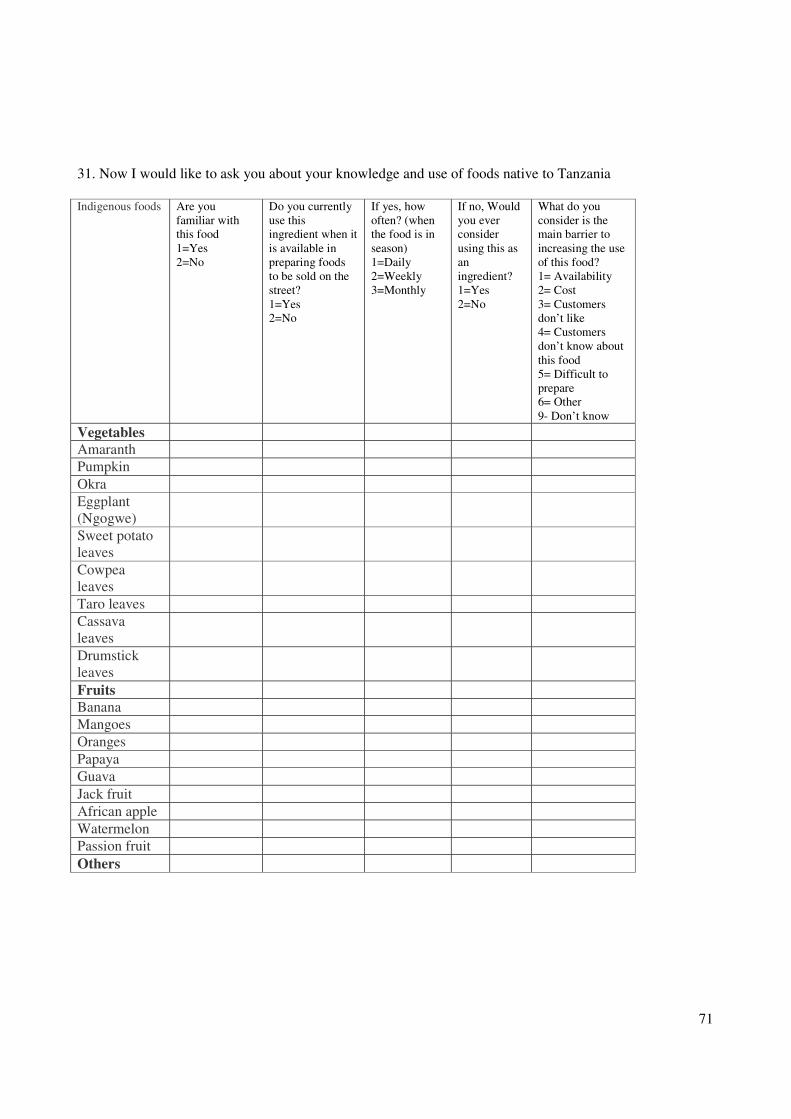
71
31. Now I would like to ask you about your knowledge and use of foods native to Tanzania Indigenous foods Are you
familiar with this food 1=Yes 2=No
Do you currently use this ingredient when it is available in preparing foods to be sold on the street? 1=Yes 2=No
If yes, how often? (when the food is in season) 1=Daily 2=Weekly 3=Monthly
If no, Would you ever consider using this as an ingredient? 1=Yes 2=No
What do you consider is the main barrier to increasing the use of this food? 1= Availability 2= Cost 3= Customers don’t like 4= Customers don’t know about this food 5= Difficult to prepare 6= Other 9- Don’t know
Vegetables Amaranth Pumpkin Okra Eggplant (Ngogwe)
Sweet potato leaves
Cowpea leaves
Taro leaves Cassava leaves
Drumstick leaves
Fruits Banana Mangoes Oranges Papaya Guava Jack fruit African apple Watermelon Passion fruit Others

72
FOCUS GROUP DISCUSSION GUIDE VENDORS
TOPIC DISCUSSION PROBES
How many of you have ever received nutritional education?
Where did you learn about nutritional issues?
What is your opinion about nutrients content in the food?
During purchase and preparation?
Do you consider the nutritional quality of the foods you sell?
Why do you consider the nutritional quality of the foods you sell?
Opinions?
What prevents you from considering the nutritional quality of foods sold to children?
What do you think should be done to improve the nutritional quality of foods sold to children?
Nutritional quality
Do you think there are any opportunities to increase the nutritional properties of the food you sell by using indigenous foods?
What are your opinions about the venues that you operate in?
What do you do to keep your food safe?
Food Safety and Hygiene
Is there any thing else that can be done to improve the safety and hygiene of the food you sell?
What opportunities do you have to change the way you do business?
Selection of foods? Preparation (safe water, cleanliness, nutritional quality) and sale?
Which services do you think are needed to improve your business working environment?
Opportunities for change
What strategies could improve the nutritional quality of the foods you sell?

73
FOCUS GROUP DISCUSSION GUIDE TEACHERS AND PARENTS
TOPIC DISCUSSION PROBES Are parents happy with children staying in school for 6 hours with little food bought from the vendors?
How much are you willing to pay for a nutritious meal for your child while at school (is it what you can afford or is it determined by the type of food sold?) What do you think is a reasonable amount to pay for a nutritious meal at school? What kinds of foods do you think are nutritious?
Do parents feel that street foods are a good choice for their children?
Or are street foods just a coping strategy?
What is the general perception of teachers and parents regarding street foods sold to school children?
Nutritional quality? Safety? Location?
Street food
How can the foods sold by vendors be improved?
What alternatives are parents and teachers willing to support in terms of improving street foods? Will the school be willing to instruct vendors that they adopt food preparation and handling practices to increase nutritional quality and safety of foods they sell?
Do the parents instruct their children to buy certain types of foods and not others?
Basis of criteria for choice?
In addition to improving the nutritional quality of street foods, are there other alternatives that teachers and parents propose that could be developed to provide nutritious food to students while at school?
School meals? - challenges? Bringing food/snacks from home? - Challenges? Children taught to make better choices? Role of parents, teachers/schools, school committees.
Alternative options to street foods
Is it within the mandate of the school to ensure quality of foods sold to the children?
If not, who else is responsible?

74
Food Safety What can teachers and parents do to ensure food safety and quality (nutritional)?
Who is responsible? Existence of school regulations that govern the safety of food (colours, flavours, oil), utensils, and hygiene (personal and environment) Are teachers aware of TDFA, TBS, municipal or MoH regulations that govern safety of food?
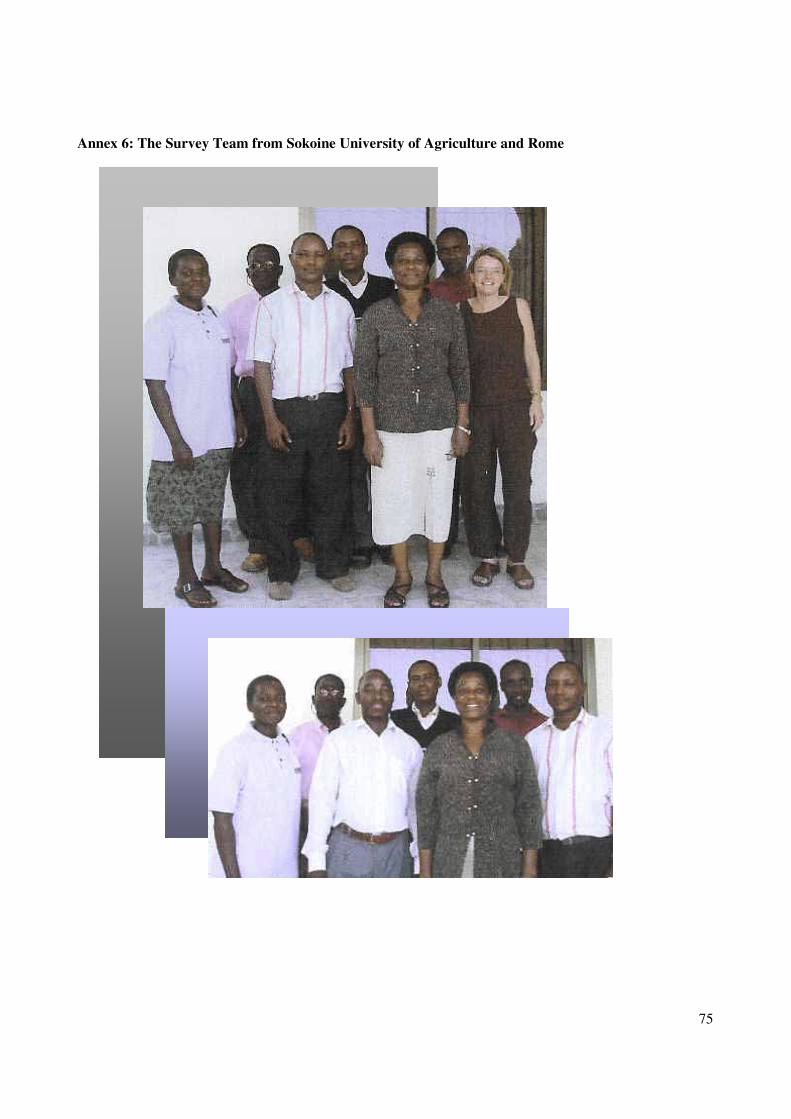
75
Annex 6: The Survey Team from Sokoine University of Agriculture and Rome