improving the static pushover analysis in the italian...
TRANSCRIPT

Keywords: piecewise linear fit, Italian Seismic Code, equivalent SDOF, static pushover, incremental dynamic
analysis
ABSTRACT
An improvement of the Italian Code bilinear fit for static pushover (SPO) curves is put forward aimed at
significantly decreasing the error introduced in the conventional SPO analysis by the piecewise linear fitting of the
capacity curve. While other issues, such as the relationship to pass from the response of multi-degree-of-freedom to
single-degree-of-freedom systems (MDOF – SDOF), have been heavily examined in the last decades and
improvements and changes to the original method have been proposed and introduced in codes and guidelines, the
piecewise linear fit assumed has not yet been systematically investigated. The determination of an optimal
multilinear fit has now become a more pressing issue, since new generation modeling approaches lead to highly
curved pushover shapes with significant stiffness changes, especially when explicitly incorporating the initial
uncracked stiffness of sections. In such cases, even determining the code-standard equivalent elastic stiffness and
yield strength of the simple elastic-plastic approximation can be greatly improved upon.
In the approach proposed herein, the error introduced by the piecewise multilinear fit of the force-deformation
relationship is quantified by studying it at the SDOF level, away from any interference from MDOF effects.
Incremental Dynamic Analysis (IDA) is employed to enable a direct comparison of the actual curved backbones
versus their piecewise linear approximations in terms of the spectral acceleration capacity for a continuum of limit-
states, allowing an accurate interpretation of the results in terms of performance. An optimized elastic-plastic
bilinear fit is the first enhanced solution to decrease systematically the error introduced in the SPO analysis if
compared to the hybrid fit approach provided by the Italian seismic provisions. Moreover this fit allows employing
the same R--T (strength reduction factor-ductility-period) relationship already prescribed by the Italian Code.
1 INTRODUCTION
The Italian building code (CS.LL.PP., 2008)
and its explicative document (CS.LL.PP., 2009)
have been updated recently according to modern
design standards, changing significantly the
specific provisions for design, assessment and
retrofitting in seismic zone. This currently
enforced code is the last step of a process that
began in 2003 after the San Giuliano earthquake
(Mw 5.9), in southern Italy. The enhancements
involved different parts of the code and most of
the improvements followed the recommendations
already provided in Eurocode 8 (CEN, 2004;
CEN 2005). On the other hand, some aspects,
especially those concerning the nonlinear static
procedure, have diverged from the consolidated
version adopted by Eurocode 8 and based on the
original N2 approach (Fajfar and Fischinger,
1988). In fact, some of the provisions of US
guidelines (FEMA 356, 2000; FEMA 440, 2005),
concerning the, so called, coefficient approach in
the nonlinear static procedure, have also been
adopted in the new Italian Code, resulting, in
some cases, in hybrid prescriptions.
In the main framework of a wide investigation
aimed at singling out the best fit approach to be
Improving the static pushover analysis in the Italian seismic code
by proper piecewise-linear fitting of capacity curves
Flavia De Luca, Iunio Iervolino Dipartimento di Ingegneria Strutturale DIST – Università degli Studi di Napoli Federico II. Via Claudio 21,
80125 Napoli, Italy.
Dimitrios Vamvatsikos School of Civil Engineering - National Technical University of Athens 9 Heroon Polytechneiou, 15780
Athens, Greece

adopted for the definition of the equivalent SDOF
in nonlinear static analysis, a focused study has
been carried out to assess the performance of the
fitting rules suggested in the explicative
document (CS. LL. PP., 2009) of the recent
Italian building code. The first part of this
investigation focused on fitting non-negative
(without softening branch) capacity curves as
described by De Luca et al., (2011), where the
methodology that will be presented in the next
section was firstly employed.
The need for a quantitative definition of the
error introduced by the fit of capacity curves in
nonlinear static analysis arose since the nonlinear
static procedure (NSP), based on static pushover
analysis (SPO), is becoming a routine approach
for the assessment of the seismic capacity of
existing buildings. All NSP approaches consist of
the same five basic steps: (a) perform static
pushover analysis of the multi-degree-of-freedom
(MDOF) system to determine the base shear
versus (e.g., roof) displacement response curve;
(b) fit a piecewise linear function (typically
bilinear) to define the period and backbone of an
equivalent single degree of freedom system
(SDOF); (c) use a pre-calibrated R--T (reduction
factor – ductility – period) relationship for the
extracted piecewise linear backbone to obtain
SDOF seismic demand for a given spectrum; (d)
use the static pushover curve to extract MDOF
response demands; (e) compare demands to
capacities; see for example (Fajfar and Fischinger,
1988). NSP is a conventional method without a
rigorous theoretical foundation for application on
MDOF structures (Krawinkler and Seneviratna,
1998), as several approximations are involved in
each of the above steps. On the other hand, its
main strength is providing nonlinear structural
demand and capacity in a simple and
straightforward way. Although several
improvements and enhancements have been
proposed since its introduction, any increase in
the accuracy of the method is worth only if the
corresponding computational effort does not
increase disproportionately. Extensively
investigated issues are the choice of the pattern
considered to progressively load the structure and
the implication of switching from the nonlinear
analysis of a multiple degree of freedom (MDOF)
system to the analysis of the equivalent SDOF
sharing the same (or similar) capacity curve.
Regarding the shape of the force distributions, it
was observed that an adaptive load pattern could
account for the differences between the initial
elastic modal shape and the shape at the collapse
mechanism (e.g. Antoniou and Pinho, 2004).
Contemporarily, other enhanced analysis
methodologies were proposed to account for
higher mode effects and to improve the original
MDOF-to-SDOF approximation (e.g., Chopra
and Goel, 2002). Regarding the demand side,
efforts have been put to provide improved
relationships between strength reduction factor,
ductility, and period (R--T relationships), to
better evaluate the inelastic seismic performance
at the SDOF level (Vidic et al., 1994; Miranda
and Bertero, 1994).
One of the issues that have not yet been
systemically investigated is the approximation
introduced by the imperfect piecewise linear fit of
the capacity curve for the equivalent SDOF. The
necessity to employ a multilinear fit (an inexact,
yet common, expression to describe a piecewise
linear function) arises due to the use of pre-
determined R--T relationships that have been
obtained for idealized systems with those
piecewise linear backbones. This has become
even more important recently, since nonlinear
modeling practice has progressed towards
realistic multi-member models, which often
accurately capture the initial stiffness using
uncracked section properties. The gradual
plasticization of such realistic elements and
models introduces a high curvature into the SPO
curve that cannot be easily represented by one or
two linear segments. It is an important issue
whose true effect is often blurred, being lumped
within the wider implications of using an
equivalent SDOF approximation.
The choice of the piecewise linear fit is
typically restricted by the availability of R--T
relationships that can account for the equivalent
SDOF backbones employed when fitting the
capacity curve. Even if R--T relationships that
can capture far more complex backbones have
recently appeared (e.g. Vamvatsikos and Cornell,
2005), the bilinear approach is by far the most
widely employed in guidelines and literature,
such as Eurocode 8 and Italian code that shares
the same bilinear R--T relationship (Vidic et al.
1994). The study presented herein deals with the
bilinear approximation of the capacity curves,
also addressing a specific comparison with the
approach followed by the Italian guidelines
regarding this issue.
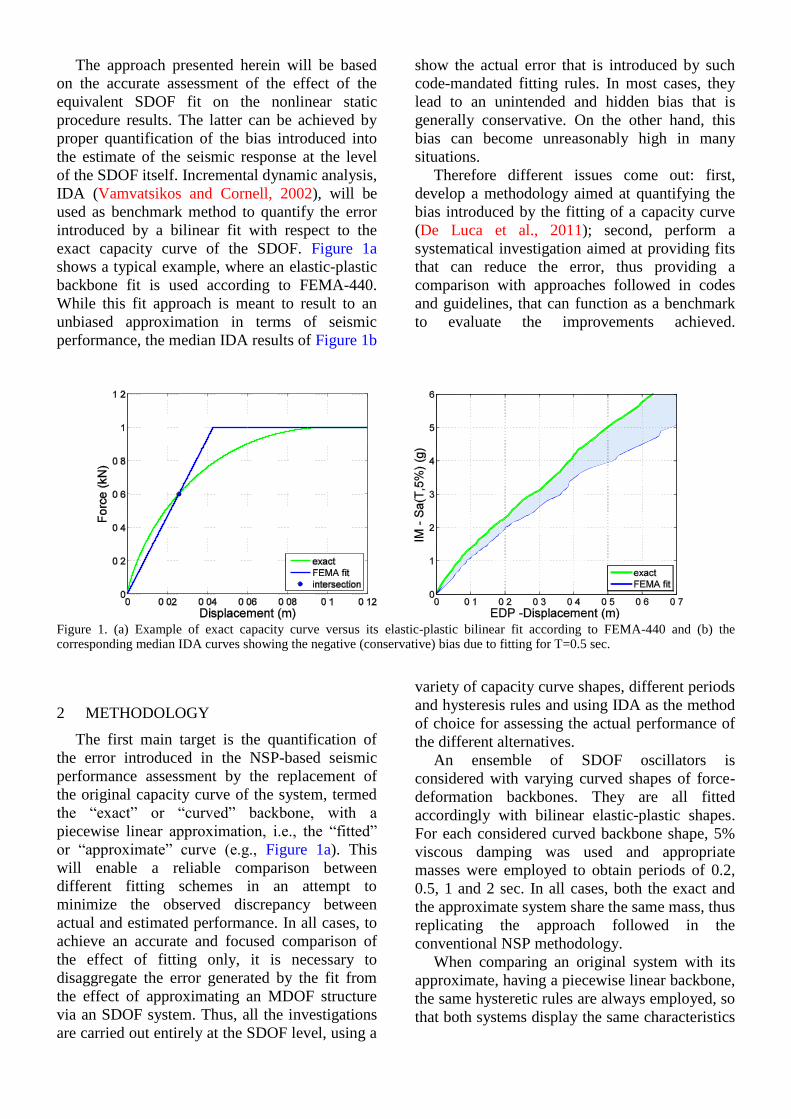
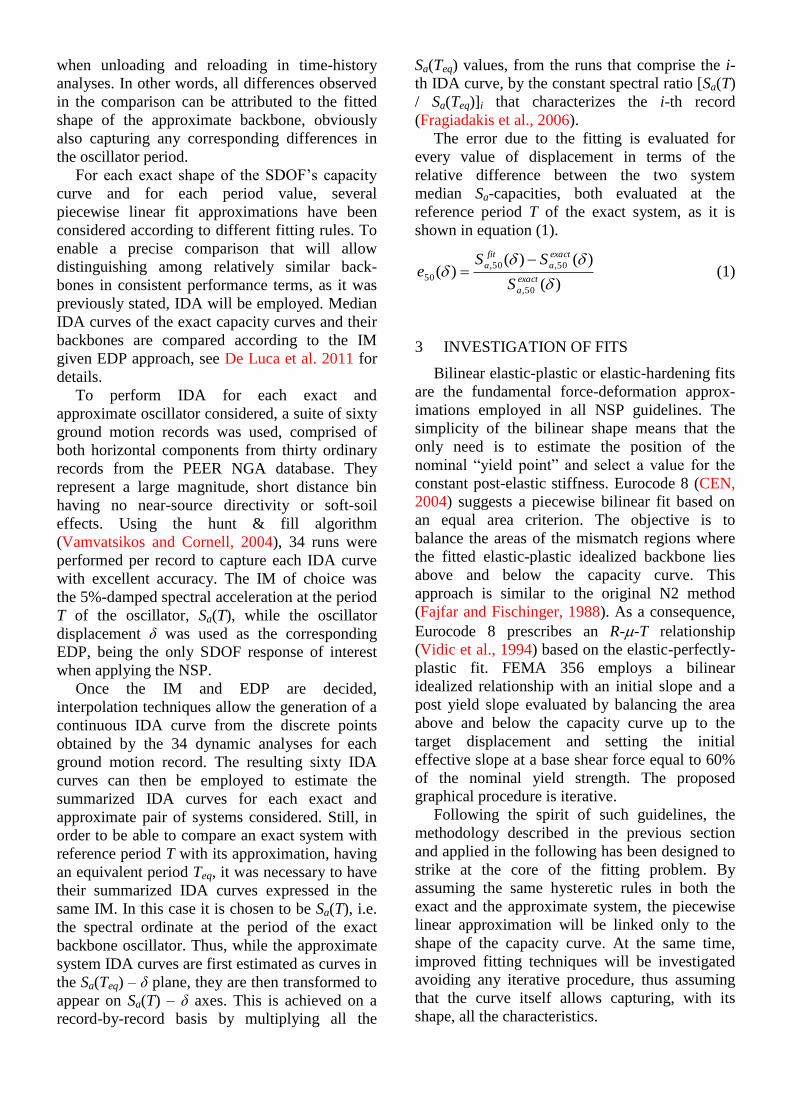
The approach presented herein will be based
on the accurate assessment of the effect of the
equivalent SDOF fit on the nonlinear static
procedure results. The latter can be achieved by
proper quantification of the bias introduced into
the estimate of the seismic response at the level
of the SDOF itself. Incremental dynamic analysis,
IDA (Vamvatsikos and Cornell, 2002), will be
used as benchmark method to quantify the error
introduced by a bilinear fit with respect to the
exact capacity curve of the SDOF. Figure 1a
shows a typical example, where an elastic-plastic
backbone fit is used according to FEMA-440.
While this fit approach is meant to result to an
unbiased approximation in terms of seismic
performance, the median IDA results of Figure 1b
show the actual error that is introduced by such
code-mandated fitting rules. In most cases, they
lead to an unintended and hidden bias that is
generally conservative. On the other hand, this
bias can become unreasonably high in many
situations.
Therefore different issues come out: first,
develop a methodology aimed at quantifying the
bias introduced by the fitting of a capacity curve
(De Luca et al., 2011); second, perform a
systematical investigation aimed at providing fits
that can reduce the error, thus providing a
comparison with approaches followed in codes
and guidelines, that can function as a benchmark
to evaluate the improvements achieved.
Figure 1. (a) Example of exact capacity curve versus its elastic-plastic bilinear fit according to FEMA-440 and (b) the corresponding median IDA curves showing the negative (conservative) bias due to fitting for T=0.5 sec.
2 METHODOLOGY
The first main target is the quantification of
the error introduced in the NSP-based seismic
performance assessment by the replacement of
the original capacity curve of the system, termed
the “exact” or “curved” backbone, with a
piecewise linear approximation, i.e., the “fitted”
or “approximate” curve (e.g., Figure 1a). This
will enable a reliable comparison between
different fitting schemes in an attempt to
minimize the observed discrepancy between
actual and estimated performance. In all cases, to
achieve an accurate and focused comparison of
the effect of fitting only, it is necessary to
disaggregate the error generated by the fit from
the effect of approximating an MDOF structure
via an SDOF system. Thus, all the investigations
are carried out entirely at the SDOF level, using a
variety of capacity curve shapes, different periods
and hysteresis rules and using IDA as the method
of choice for assessing the actual performance of
the different alternatives.
An ensemble of SDOF oscillators is
considered with varying curved shapes of force-
deformation backbones. They are all fitted
accordingly with bilinear elastic-plastic shapes.
For each considered curved backbone shape, 5%
viscous damping was used and appropriate
masses were employed to obtain periods of 0.2,
0.5, 1 and 2 sec. In all cases, both the exact and
the approximate system share the same mass, thus
replicating the approach followed in the
conventional NSP methodology.
When comparing an original system with its
approximate, having a piecewise linear backbone,
the same hysteretic rules are always employed, so
that both systems display the same characteristics
when unloading and reloading in time-history
analyses. In other words, all differences observed
in the comparison can be attributed to the fitted
shape of the approximate backbone, obviously
also capturing any corresponding differences in
the oscillator period.
For each exact shape of the SDOF’s capacity
curve and for each period value, several
piecewise linear fit approximations have been
considered according to different fitting rules. To
enable a precise comparison that will allow
distinguishing among relatively similar back-
bones in consistent performance terms, as it was
previously stated, IDA will be employed. Median
IDA curves of the exact capacity curves and their
backbones are compared according to the IM
given EDP approach, see De Luca et al. 2011 for
details.
To perform IDA for each exact and
approximate oscillator considered, a suite of sixty
ground motion records was used, comprised of
both horizontal components from thirty ordinary
records from the PEER NGA database. They
represent a large magnitude, short distance bin
having no near-source directivity or soft-soil
effects. Using the hunt & fill algorithm
(Vamvatsikos and Cornell, 2004), 34 runs were
performed per record to capture each IDA curve
with excellent accuracy. The IM of choice was
the 5%-damped spectral acceleration at the period
T of the oscillator, Sa(T), while the oscillator
displacement δ was used as the corresponding
EDP, being the only SDOF response of interest
when applying the NSP.
Once the IM and EDP are decided,
interpolation techniques allow the generation of a
continuous IDA curve from the discrete points
obtained by the 34 dynamic analyses for each
ground motion record. The resulting sixty IDA
curves can then be employed to estimate the
summarized IDA curves for each exact and
approximate pair of systems considered. Still, in
order to be able to compare an exact system with
reference period T with its approximation, having
an equivalent period Teq, it was necessary to have
their summarized IDA curves expressed in the
same IM. In this case it is chosen to be Sa(T), i.e.
the spectral ordinate at the period of the exact
backbone oscillator. Thus, while the approximate
system IDA curves are first estimated as curves in
the Sa(Teq) – δ plane, they are then transformed to
appear on Sa(T) – δ axes. This is achieved on a
record-by-record basis by multiplying all the
Sa(Teq) values, from the runs that comprise the i-
th IDA curve, by the constant spectral ratio [Sa(T)
/ Sa(Teq)]i that characterizes the i-th record
(Fragiadakis et al., 2006).
The error due to the fitting is evaluated for
every value of displacement in terms of the
relative difference between the two system
median Sa-capacities, both evaluated at the
reference period T of the exact system, as it is
shown in equation (1).
)(
)()()(
50,
50,50,
50
exact
a
exact
a
fit
a
S
SSe
(1)
3 INVESTIGATION OF FITS
Bilinear elastic-plastic or elastic-hardening fits
are the fundamental force-deformation approx-
imations employed in all NSP guidelines. The
simplicity of the bilinear shape means that the
only need is to estimate the position of the
nominal “yield point” and select a value for the
constant post-elastic stiffness. Eurocode 8 (CEN,
2004) suggests a piecewise bilinear fit based on
an equal area criterion. The objective is to
balance the areas of the mismatch regions where
the fitted elastic-plastic idealized backbone lies
above and below the capacity curve. This
approach is similar to the original N2 method
(Fajfar and Fischinger, 1988). As a consequence,
Eurocode 8 prescribes an R--T relationship
(Vidic et al., 1994) based on the elastic-perfectly-
plastic fit. FEMA 356 employs a bilinear
idealized relationship with an initial slope and a
post yield slope evaluated by balancing the area
above and below the capacity curve up to the
target displacement and setting the initial
effective slope at a base shear force equal to 60%
of the nominal yield strength. The proposed
graphical procedure is iterative.
Following the spirit of such guidelines, the
methodology described in the previous section
and applied in the following has been designed to
strike at the core of the fitting problem. By
assuming the same hysteretic rules in both the
exact and the approximate system, the piecewise
linear approximation will be linked only to the
shape of the capacity curve. At the same time,
improved fitting techniques will be investigated
avoiding any iterative procedure, thus assuming
that the curve itself allows capturing, with its
shape, all the characteristics.

As it has been shown by De Luca et al. (2011),
both the equal area rule, employed in Eurocode 8,
and the 60% rule, employed in all FEMA
documents, can be very conservative. Capturing
the initial stiffness by means of a fit at 10% of the
maximum shear of the exact backbone can
provide a significant improvement. An example
of such a conservative effect is shown in Figure 2
where two backbones with non-softening
behavior are fitted according to Eurocode 8 fit
(equal area), FEMA 60% rule (FEMA) and
finally according to a fit that captures the initial
stiffness (10% fit). Figures 2a and 2b represent a
system with mild and high initial backbone-
curvature, respectively. Figure 3 shows the errors
introduced by the three fits, presented in Figure 2,
for a period equal to 0.5 seconds. These errors
obviously increase significantly in the case of
non-trivial changes in the initial stiffness of the
curved backbone (see Figure 3b), that can be
typical of modeling approaches that account for
uncracked stiffness. A fitting rule that captures
the initial stiffness (10% fit) can lead to errors
that seldom exceeds 20% compared to errors,
even if conservative, that can get to over 50%, if
Eurocode 8 or FEMA fit are applied in the case of
“highly curved” systems.
Figure 2. Comparison of non-softening capacity curves and their corresponding fits having (a) insignificant versus (b) significant changes in initial stiffness.
Figure 3. Median relative error comparison between the 10%, FEMA and equal area fits for T = 0.5 sec, when applied to the capacity curves of Figure 2: (a) insignificant versus (b) significant changes in initial stiffness.
Having assessed that standard bilinear elastic-
plastic and elastic-hardening fitting rules can be
improved, it is important to investigate, as well,
whether improved fits can also be devised to
reduce the error in backbones that also show
some mild negative stiffness, characterized by
softening. The latter represents the general aim of
the fitting approach provided in the Italian
provisions (CS.LL.PP, 2009).
Italian guidelines suggest accounting for
softening behavior up to the point of a 15%
degradation of maximum base shear in the
capacity curve. The fit is based on 60% rule for
the initial stiffness, in analogy with all the FEMA

documents. Then an equal area criterion is
applied to derive the plateau of the bilinear fit;
the latter can be extended until the point where a
15% degradation of the maximum base shear is
reached (Figure 4). The result of such an
approach is that the plateau of the elastic-plastic
fit is always lower than the shear at the maximum
point of the exact backbone. Obviously, if the
structural model used cannot display any negative
stiffness, such fitting criteria simply become
equivalent to the FEMA provisions. The obtained
bilinear fit according to the Italian code
provisions is then accompanied by the classical
Vidic et al (1994) R--T relationship employed in
Eurocode 8.
Figure 4. Italian fit of mildly softening capacity curves according to CS. LL. PP. 2009.
The Italian hybrid fitting rule is worth to be
investigated, especially to check whether
considerations regarding the best approach for
non-softening behaviors (De Luca et al, 2011) are
still reliable to capture early negative response. In
other words, the general principle of getting the
initial stiffness (10% rule) is going to be checked
for a backbone family of softening curves and
consequently compared with the 60% rule.
In addition, the merits of balancing the
mismatch areas above and below the capacity
curve will also be discussed. While the Italian
Code, as most similar guidelines, is concerned
with providing a specialized fit for a given target
point on the capacity curve, following the
methodology described in section 2, herein it will
be sought to provide near-optimal fits for a
continuum of limit states. Thus, it will be
intentionally avoided any dependence on any
specific target point on the backbone, in essence
checking at the same time all possible such points.
This is achieved by employing a simple direct
search approach, where the height of the plastic
plateau for the fit is gradually moved from 80%
to 100% of the peak shear in the exact capacity
curve. Consequentially, while checking for a
broadly optimal fit, all possible fits that could
arise from applying the Italian Code approach to
different target points will be efficiently captured.
Two example backbones from the numerous
tests conducted are shown in Figure 5. They were
chosen to emphasize two different softening
trends, combined with different curvature
changes in the initial part of the backbones:
insignificant (see Figure 5a) versus significant
(see Figure 5b). Four different fits are displayed
out of the large number that has been checked:
the initial stiffness is fixed at 10% or 60% of the
maximum shear combined with two plateau
levels at 80% (L) and 100% (P) of peak shear,
thus obtaining four fitting approaches named
10%L, 10%P, 60%L and 60%P respectively. The
performances of each of the four fits considered
are shown in Figure 6 and Figure 7 for T=0.2, 0.5
sec. Results show how the changes in curvature
in the initial part still play an important role for
fitting performances. The 10% fit improves
results as long as there are significant changes in
the curvature of the exact backbone. Furthermore,
catching the peak point (P versus L fits) seems to
have better performances than a lower plateau
value, regardless of any area-balancing rules. The
latter results are partially confirmed by the fits
suggested in other studies where the maximum
shear value is selected as one of the criteria for
fitting softening backbones (Han et al., 2010). For
low frequencies and significant changes in the
initial stiffness, the 10% fit, in both its versions
showed herein, P and L, can lead to slightly non
conservative results at the beginning of the
backbone. The same effect was observed also in
the case of non-softening backbones, see De Luca
et al. (2011) for details. Still, for conventional
limit states of interest and for most practical
applications for which a static pushover is used,
the target points will not be located in this early
near-elastic part of the backbone.
The fit approaches showed have been tested
for a sample family of exact backbones in which
curvature at the beginning and the slope of the
softening have been varied. The sample family of
backbones considered and their hysteresis loops
are presented in Figure 8. The median error trends
of the 60%L and the 100%P fits are compared in
Figure 9 to Figure 12, respectively for the four
periods considered (0.2, 0.5, 1.0 and 2.0 seconds).
The error is mapped according to the
characteristic points of the exact backbone; the

peak point “p”, where the maximum shear is
attained, and the ultimate point “u”, where the
exact capacity curve attains the residual branch.
Figure 9 to Figure 12 are meant to represent the
median error to be expected when fitting a
generic capacity curve with a specific rule, (in
this case 60%L and 100%P rules respectively).
The 10%P fit is found to be an unbiased fit
approach that can be extended to the mildly
softening part of the backbone at each of the
periods investigated, showing robust
performances for this portion of backbone in a
wide range of frequencies.
Figure 5. Comparison of two capacity curves with softening branch and their corresponding fits having (a) insignificant versus (b) significant changes in initial stiffness.
Figure 6. Median relative error comparison between the 10%L, 10%P, 60%L and 60%P fits for T = 0.2 sec, when applied to the capacity curves of Figure 5: (a) insignificant versus (b) significant changes in initial stiffness and different softening slopes.
Figure 7. Median relative error comparison between the 10%L, 10%P, 60%L and 60%P fits for T = 0.5 sec, when applied to the capacity curves of Figure 5: (a) insignificant versus (b) significant changes in initial stiffness and different softening slopes.

.
Figure 8. Backbones (a) and example hysteretic behavior according to pinching hysteresis rule (b) of the family of capacity curves considered.
Figure 9. The median relative error at T = 0.2 sec if (a) the 60%L and (b) 10%P fits are employed, respectively, for the family of capacity curves in Figure 8 (grey dotted lines).
Figure 10. The median relative error at T = 0.5 sec if (a) the 60%L and (b) 10%P fits are employed, respectively, for the family of capacity curves in Figure 8 (grey dotted lines).

Figure 11. The median relative error at T = 1.0 sec if (a) the 60%L and (b) 10%P fits are employed, respectively, for the family of capacity curves in Figure 8 (grey dotted lines).
Figure 12. The median relative error at T = 2.0 sec if (a) the 60%L and (b) 10%P fits are employed, respectively, for the family of capacity curves in Figure 8 (grey dotted lines).
4 CONCLUSIONS
Structural seismic assessment based on the
nonlinear static procedure is founded on the
general assumption that the behavior of an
MDOF system can be interpreted by the response
of an equivalent SDOF. This necessitates a
number of specific approximations at various
stages of the procedure. An IDA-based
methodology, already employed for the
investigation of non-softening capacity curves,
has been employed in this study in the case of
backbone with softening to assess the reliability
of the fit approach suggested by recent Italian
seismic code.
The Italian Code fit rule that is meant to
extend the FEMA guidelines to also capture
mildly softening behaviors in the capacity curve,
is studied to check if such hybrid approach can
provide improved accuracy in the fit. This fit
conjugates the 60% rule, basic approach of US
guidelines, with the equal area criterion, typical
of European guidelines and, additionally, allows
accounting for softening up to a 15% degradation
of the peak base shear.
The Italian fit rule is found to be conservative
in analogy with all the other code fits (Eurocode
8 and FEMA). It is to be noted that the limit to
the softening branch imposed in the Italian code
(up to 85% of the maximum shear) was found to
be reliable. The investigations of this study, in
fact, showed that the error introduced by any
bilinear fit increases dramatically when softening
branch goes down to values lower than 85% of
the maximum shear and bilinear fits could not
catch at all the final part of the softening behavior,
ending up with a systematical overestimation of
the response; while within code-mandated
softening values (up to 15% degradation of the
maximum base shear) the error can be still
considered acceptable and at least comparable to
the one introduced in the initial part of the
backbone.

Besides the check of the Italian code fit, the
investigation of this family of backbones shows a
systematical result regarding the plastic plateau
fit at the maximum shear value of the exact
capacity curve. This seems to be the better
solution rather than any reduced conservative
value. Such an elastic-plastic fit that captures the
maximum base shear and has an initial stiffness
fitted at 10% of it, termed a 10%P fit, can be
reliably adopted in nonlinear static analysis
procedures to improve the fitting and reduce the
error introduced by it.
Furthermore, the latter result represents a step
towards the definition of a fully optimized fit rule
that can represent a further enhancement to be
considered as an upgrade in current seismic
provisions. While any enhanced three-segment
piecewise linear fit that incorporates a softening
branch would further improve the accuracy in the
equivalent SDOF backbone, it would also require
changes in the R--T relationship. On the other
hand, the improved rules presented herein can fit
seamlessly in current seismic codes without
requiring any further changes.
ACKNOWLEDGEMENTS
The analyses presented in this paper have been
developed within the activities of the Rete dei
Laboratori Universitari di Ingegneria Sismica –
ReLUIS for the research program funded by the
Dipartimento di Protezione Civile 2010-2013.
REFERENCES
Antoniou S., Pinho R., 2004. Advantage and limitations of
adaptive and non-adaptive force-based pushover
procedures. Journal of Earthquake Engineering 8, 497-
522.
Chopra A.K. and Goel R.K., 2002. A modal pushover
analysis procedure for estimating seismic demands for
buildings. Earthquake Engineering and Structural
Dynamics, 31, 561-582.
Comitè Europèen de Normalisation (CEN), 2004. Eurocode
8 – Design of Structures for earthquake resistance – Part
1: General rules, seismic actions and rules for buildings.
EN 1998-1, CEN, Brussels.
Comitè Europèen de Normalisation (CEN), 2005. Eurocode
8: design of structures for earthquake resistance – Part 3:
assessment and retrofitting of buildings, EN 1998-3,
CEN, Brussels.
CS.LL.PP. Circolare 617, 2009. Istruzioni per
l’applicazione delle Norme Tecniche per le Costruzioni,
Gazzetta Ufficiale della Repubblica Italiana 47, 2/2/2009
(in Italian).
CS.LL.PP. DM 14 gennaio, 2008. Norme tecniche per le
costruzioni, Gazzetta Ufficiale della Repubblica Italiana
29, 4/2/2008.
De Luca F., Vamvatsikos D., Iervolino I., 2011. Near-
optimal bilinear fit of capacity curves for equivalent
SDOF analysis. Proceedings of the 3rd
International
Conference on Computational Methods in Structural
Dynamics and Earthquake Engineering (COMPDYN
2011), 25-28 May, Corfu, Greece.
Fajfar P. and Fischinger M., 1988. N2 – A method for non-
linear seismic analysis of regular structures. Proceedings
of the 9th World Conference on Earthquake Engineering,
Tokyo, 111-116.
Federal Emergency Management Agency (FEMA), 2000.
Prestandard and commentary for the seismic
rehabilitation of buildings. Report No. FEMA-356,
Washington, D.C.
Federal Emergency Management Agency (FEMA), 2005.
Improvement of nonlinear static seismic analysis
procedures. Report No. FEMA-440, Washington, D.C.
Fragiadakis M., Vamvatsikos D., Papadrakis. M., 2006.
Evaluation of the influence of vertical irregularities on
the seismic performance of a nine-storey steel frame.
Earthquake Engineering and Structural Dynamics, 35,
1489-1509.
Han W.S., Moon K., Chopra A.K, 2010. Application of
MPA to estimate probability of collapse of structures,
Earthquake Engineering and Structural Dynamics, 39,
1259-1278.
Krawinkler H. and Seneviratna G.P.D.K., 1998. Pros and
cons of a pushover analysis of seismic performance
evaluation. Engineering Structures, 20, 452-464.
Miranda E. and Bertero V.V., 1994. Evaluation of strength
reduction factors for earthquake-resistant design.
Earthquake Spectra, 10(2), 357-379.
Vamvatsikos D. and Cornell C.A., 2004. Applied
Incremental Dynamic Analysis. Earthquake Spectra, 20,
523-553.
Vamvatsikos D. and Cornell C.A., 2005. Direct estimation
of the seismic demand and capacity of oscillators with
multi-linear static pushovers through Incremental
Dynamic Analysis of Single Degree of Freedom
Approximation. ASCE Journal of Structural Engineering,
131(4), 589-599.
Vidic T., Fajfar P., Fischinger M., 1994. Consistent
inelastic design spectra: strength and displacement.
Earthquake Engineering and Structural Dynamics, 23,
507-521.