in any form by any electronic or mechanical means (including photocopying, recording) without...
TRANSCRIPT

FIJI HEALTH ACCOUNTS: NATIONAL HEALTH EXPENDITURE 2011-2014 1
–––––
FIJI HEALTH ACCOUNTS: NATIONAL HEALTH EXPENDITURE 2011-2014 2
Fiji Health Accounts
National Health Expenditure
2011-2014
A publication of the Ministry of Health and Medical Services, Republic of Fiji
Copyright © 2015 Fiji Ministry of Health and Medical Services 88 Amy Street Toorak, Suva, Republic of Fiji

FIJI HEALTH ACCOUNTS: NATIONAL HEALTH EXPENDITURE 2011-2014 3
This publication is under copyright and all rights are reserved. Short excerpts may be reproduced without authorization on condition that the source is indicated and as long as it is for non-commercial purposes. This publication or any substantial portions of it may not be reproduced in any form by any electronic or mechanical means (including photocopying, recording) without permission from the copyright holder. Suggested Citation Fiji Ministry of Health and Medical Services, Fiji Health Accounts 2011-2014, Fiji, 2015.
Enquiries or comments on this report should be directed to: Idrish Khan Coordinator – Fiji Health Accounts 88 Amy Street, Toorak, Suva P O Box 2223, Government Buildings, Suva, Fiji. Email: [email protected]

FIJI HEALTH ACCOUNTS: NATIONAL HEALTH EXPENDITURE 2011-2014 4
Foreword The National Health Accounts (NHA) report provides valuable information that contributes
towards evidence based strategic planning and policy development. Such evidence and
information also provides options to health planners to make key decisions on health for
improvement and efficiency in service delivery. The Ministry of Health and Medical Services
(MoHMS) will be implementing its National Strategic Plan 2016-2020 and priority area 8 of
this plan focuses on sustainable financing. The information provided through this report will
assist in making strategic health financing decisions. These decisions are vital to ensure that
the MoHMS remains committed in providing accessible, equitable and affordable health
services to all Fijians.
The MoHMS has so far produced four (4) rounds of NHA reports since 2010. This is the fifth
(5th) round of NHA report for years 2013-2014 and describes the health care system from
an expenditure perspective and provides evidence-based information that can be used as a
tool to track and provide better insight to policy makers on efficient utilization of health
funds.
This report has been compiled using the System of Health Accounts (SHA) 2011 framework
and thus captures comprehensive information on Fiji’s health expenditure for the years
2011 to 2014. Disease-based costs presented in this report (using the ICD-10AM
classification) cover the public, private sectors, inpatients and outpatients. This is an
improvement from previous years NHA reports.
I take this opportunity to thank the NHA Committee for the collaborative effort in
developing this report. I further acknowledge the contribution from all stakeholders in
supporting MoHMS initiative in building evidence base information required to make
appropriate future health care financing decisions with the overall aim of strengthening
health systems and improving the delivery of health services in Fiji.
The MoHMS looks forward for the same support in the future.
Dr Meciusela Tuicakau Acting Permanent Secretary for Health and Medical Services

FIJI HEALTH ACCOUNTS: NATIONAL HEALTH EXPENDITURE 2011-2014 5
Table of Contents
Foreword .................................................................................................................................... 4
Table of Contents ....................................................................................................................... 5
Acknowledgements .................................................................................................................... 8
List of Tables .............................................................................................................................. 9
List of Figures ........................................................................................................................... 10
Abbreviations ........................................................................................................................... 12
Executive Summary .................................................................................................................. 14
1. Background ...................................................................................................................... 16
1.1. About this Report ..................................................................................................... 16
1.2. Structure of the Health Sector and the Flow of Funds ............................................ 16
1.2.1. Structure of health sector .................................................................................... 16
1.2.2. Flow of funds ........................................................................................................ 17
2. Current Health Expenditure ............................................................................................. 19
2.1. Trends in CHE ........................................................................................................... 19
2.2. Current Health Expenditure in Relation to GDP ...................................................... 20
2.3. Current Health Expenditure per Capita ................................................................... 20
3. Financing of Current Health Expenditure ........................................................................ 22
3.1. Revenues of Financing Schemes .............................................................................. 22
3.2. Financing Schemes ................................................................................................... 23
4. Current Health Expenditure by Providers ........................................................................ 25
4.1 Health care Providers ............................................................................................... 25
4.2 Hospital Expenditure................................................................................................ 26
4.3 Non-Hospital Expenditure........................................................................................ 28
5. Current Health Expenditure by Function ......................................................................... 29
5.1. Curative (Inpatient and Outpatient) Care Services .................................................. 30
5.2. Medical Goods ......................................................................................................... 31
5.3. Preventive Care ........................................................................................................ 32
6. Government Current Health Expenditure ....................................................................... 37
6.1. Government Expenditure on Health ........................................................................ 37
6.2. Government Current Health Expenditure by Sources ............................................. 39
6.3. Government Current Health Expenditure by Providers .......................................... 40
6.4. Government Current Health Expenditure by Geographic Locations ...................... 43
6.5. Government Current Health Expenditure by Functions .......................................... 49

FIJI HEALTH ACCOUNTS: NATIONAL HEALTH EXPENDITURE 2011-2014 6
7. Private Current Health Expenditure ................................................................................ 54
7.1. Private Current Health Expenditure by Sources ...................................................... 54
7.2. Private Current Health Expenditure by Financing Schemes .................................... 55
7.3. Private Current Health Expenditure by Providers ................................................... 56
7.4. Private Current Health Expenditure by Functions ................................................... 57
8. Development Partners (Rest of the World) ..................................................................... 59
8.1. Development Partners funding by Providers .......................................................... 62
8.2. Development Partners funding by Functions .......................................................... 63
8.3. Development Partners spending by Capital Expenditure ........................................ 65
9. Capital Expenditure .......................................................................................................... 66
1.1. Types of Assets in production of health services..................................................... 66
1.2. Capital Expenditure by Sectors ................................................................................ 67
1.3. Government Capital Expenditure ............................................................................ 68
1.4. Private Capital Expenditure ..................................................................................... 69
1.5. Development Partners Capital Expenditure ............................................................ 70
10. Factors of Health Care Provision .................................................................................. 71
10.1. Factors of Provision for CHE .................................................................................... 71
10.2. Factors of Provision by Health Providers, GCHE ...................................................... 72
10.2.1. Factors of Provision by Health Providers, Government ...................................... 72
10.2.2. Human Resources ................................................................................................ 73
10.2.3. Health care services ............................................................................................. 74
10.2.4. Pharmaceuticals ................................................................................................... 74
10.2.5. Other health care goods ...................................................................................... 75
10.3. Factors of Provision by Health Functions, GCHE ..................................................... 76
10.3.1. Factors of Provision by Health Functions, Government ...................................... 76
10.3.2. Human Resource .................................................................................................. 76
11. Disease Based Costs ..................................................................................................... 78
11.1. Expenditure by Disease for Inpatients ..................................................................... 78
11.1.1. Expenditure by Disease for Inpatients ................................................................. 78
11.1.2. Expenditure by Gender ........................................................................................ 81
11.1.3. Expenditure by Ethnicity ...................................................................................... 87
11.1.4. Expenditure by Age Group ................................................................................... 89
11.2. Expenditure by Disease for Outpatients .................................................................. 92
11.2.1. Outpatients Costs by Ethnicity ............................................................................. 93
11.2.2. Outpatients Costs by Gender ............................................................................... 94

FIJI HEALTH ACCOUNTS: NATIONAL HEALTH EXPENDITURE 2011-2014 7
12. Technical Notes ............................................................................................................ 96
12.1. Fiji SHA 2011 Classifications ..................................................................................... 96
12.2. Government data sources ....................................................................................... 96
12.2.1. Financial Data ....................................................................................................... 97
12.2.1.1. Patient utilization data ..................................................................................... 97
12.2.1.2. Disease-based data .......................................................................................... 97
12.2.1.3. Macro level data .............................................................................................. 97
12.2.2. Data estimation techniques ................................................................................. 98
12.2.2.1. Revenues of Financing Schemes (FS) and Financing Schemes (HF) ................. 98
12.2.2.2. Health Providers (HP) ....................................................................................... 98
12.2.2.3. Health Functions (HC) ...................................................................................... 99
12.2.2.4. Capital Expenditure (HK) .................................................................................. 99
12.2.2.5. Disease-based expenditure.............................................................................. 99
12.3. Private Sector data ................................................................................................... 99
12.3.1. Private Sector survey limitations ....................................................................... 101
12.4. Lessons learnt ........................................................................................................ 102
13. Bibliography and References ..................................................................................... 104
14. Glossary ...................................................................................................................... 105
15. Appendix .................................................................................................................... 109
FIJI HEALTH ACCOUNTS: NATIONAL HEALTH EXPENDITURE 2011-2014 8
Acknowledgements The production of Fiji Health Accounts (FJHA) is an on-going activity for the Ministry of Health and Medical Services (MoHMS) since 2010. This is the fifth round and this report is based on the System of Health Accounts (SHA 2011) framework. The development of this edition has been made possible through a collaborative effort between public & private sectors and academic institutions. Our sincere appreciation and gratitude goes to Ministry of Finance for the everlasting support and also recognising the importance of this publication and its use. Officers from the Department of Strategic Planning & National Development (DSPND), Budget division, Financial Management Information Systems (FMIS) unit and Fiji Bureau of Statistics (FBoS) formed part of the National Health Accounts (NHA) Committee and have greatly contributed by providing the statistical information, raw data on a timely basis and also assisted towards the compilation of this publication. It is important to note that this publication would have not been possible without the participation and support of many individuals and organisations in the private sector such as insurance companies, private hospitals, private health clinics, private laboratories, ambulance companies, private providers including doctors and pharmacists, health partners & development partners, non-governmental organisations, banks and other statutory bodies; that have cooperated in providing data through survey questionnaires. We wish to acknowledge the collaboration and support of the Centre for Health Information Policy and Systems Research (CHIPSR) of College of Medicine, Nursing & Health Sciences (CMNHS) at the Fiji National University (FNU) for the outstanding and exceptional effort in data management and analysis work. Interpretation of the results and the drafting of the report were done by the entire NHA team. The NHA Team would also like to recognize the effort and support of all those who had provided assistance in compiling the report. Our sincere gratitude and heartfelt thanks to all NHA Team members from MoHMS for possible assistance and support provided during the duration of the development of this publication. The NHA Team would also like to thank Mr Douglas Glandon, Monitoring and Evaluation Adviser, Fiji Health Sector Support Program for his valuable comments during the reviewing process and editorial annotations which allowed enhancements to this report to be in compliance with SHA 2011 standards. Finally, the efforts, contributions and the enormous support from the senior staff, various divisions, and sections of MoHMS are greatly acknowledged. The NHA Team

FIJI HEALTH ACCOUNTS: NATIONAL HEALTH EXPENDITURE 2011-2014 9
List of Tables Table 2-1 CHE at Current and Constant Prices and Growth Rates........................................................ 20 Table 2-2 CHE, GDP, Annual Growth Rates and Share of Health on GDP ............................................. 20 Table 2-3 Per Capita CHE and GDP........................................................................................................ 21 Table 3-1 Current Health Expenditure by Financing Source ................................................................. 22 Table 3-2 Current Health Expenditure by Financing Schemes (FJ$m) .................................................. 23 Table 4-1 Current Health Expenditure by Providers (FJ$m) ................................................................. 26 Table 4-2 Current Health Expenditure at Hospitals by Financing Source ............................................. 27 Table 5-1 Current Health Expenditure by Function (FJ$m), 2011 to 2014 ........................................... 29 Table 5-2 Share of Curative Expenditure by Function (%), 2011 to 2014 ............................................. 31 Table 5-3 Medical goods Expenditure by Subclasses, 2011 to 2014 .................................................... 32 Table 5-4 Preventive care by categories of service (FJ$m), 2011 to 2014 ........................................... 36 Table 5-5 Preventive care by categories of service (%), 2011 to 2014 ................................................. 36 Table 6-1 Government Health Expenditures (FJ$m) ............................................................................. 37 Table 6-2 Sources of Government Current Health Expenditures (FJ$m) .............................................. 39 Table 6-3 Government Current Health Expenditures by Providers (FJ$m) .......................................... 41 Table 6-4 GCHE on public health facilities (FJ$m)................................................................................. 44 Table 6-5 GCHE on hospitals plus health centres by Province (FJ$m) .................................................. 47 Table 6-6 Per capita GCHE on hospitals plus health centres by Divisions and Province (FJ$) .............. 48 Table 6-7 Government Current Health Expenditures by Functions (FJ$m) .......................................... 49 Table 6-8 Preventive care categories (FJ$m) ........................................................................................ 52 Table 6-9 Government drugs expenditure............................................................................................ 53 Table 7-1 Private Current Health Expenditure by Sources, 2011 to 2014 ............................................ 54 Table 7-2 Private Current Health Expenditure by Schemes, FJ$m 2011 to 2014 ................................. 55 Table 7-3 Private Current Health Expenditure by Providers, 2011 to 2014 ......................................... 56 Table 7-4 Private Current Health Expenditure by Functions, 2011 to 2014 ......................................... 58 Table 8-1 Financing contributions by Development Partners - Direct foreign transfers ...................... 60 Table 8-2 Financing contributions of Development Partners as a share of CHE .................................. 61 Table 8-3 Allocation of Development Partners funding by Providers .................................................. 62 Table 8-4 Allocation of Development Partners funding by Functions .................................................. 63 Table 8-5 Preventive care funding by Development Partners, FJ$m .................................................... 64 Table 9-1 Capital Expenditure by type of asset, FJ$m .......................................................................... 67 Table 9-2 Capital Expenditure by sectors, FJ$m ................................................................................... 68 Table 9-3 Capital Expenditure by Government ..................................................................................... 69 Table 9-4 Capital Expenditure by private sector ................................................................................... 69 Table 9-5 Capital Expenditure by Development Partners..................................................................... 70 Table 10-1 Factors of Provision by GCHE .............................................................................................. 71 Table 10-2 Factors of Provision by Private CHE .................................................................................... 72 Table 11-1 Inpatient Disease-based Cost for 2013 and 2014 ............................................................... 79 Table 11-2 Inpatient Disease Cost per Capita by Ethnicity for 2013 and 2014..................................... 87 Table 11-3 Outpatient Disease Cost per Capita by Ethnicity for 2013 and 2014.................................. 94

FIJI HEALTH ACCOUNTS: NATIONAL HEALTH EXPENDITURE 2011-2014 10
List of Figures Figure 1-1 The Flow of funds in the FIJI Ministry of Health and Medical Services Care System .......... 18 Figure 2-1 Current Health Expenditure (current and constant prices) ................................................. 19 Figure 2-2 Per Capita Current Health Expenditure (CHE) ..................................................................... 21 Figure 3-1 Current Health Expenditure by Financing Source ................................................................ 22 Figure 3-2 Current Health Expenditure by Financing Scheme (%) ........................................................ 24 Figure 4-1 Share of Current Health Expenditures by Providers (%) ...................................................... 25 Figure 4-2 Share of Current Health Expenditures by Providers (%), 2014 ............................................ 26 Figure 4-3 Share of Current Health Expenditure at Hospitals by Financing Source ............................. 27 Figure 5-1 Current Health Expenditure by Functions (%), 2011 to 2014 .............................................. 30 Figure 5-2 Share of Preventive care by Source (%), 2011 to 2014 ....................................................... 33 Figure 5-3 Share of Preventive care by categories of service (%), 2011 to 2014 ................................. 34 Figure 5-4 Share of Preventive care by providers (%), 2014 ................................................................. 35 Figure 6-1 Government Health Expenditure in Real (Constant) and Nominal (Current) value ............ 37 Figure 6-2 Government Health Expenditure as a Percentage of TGE ................................................... 38 Figure 6-3 Government Health Expenditure (GHE) as a percentage of GDP ........................................ 39 Figure 6-4 Share of GCHE by Sources.................................................................................................... 40 Figure 6-5 Share of Government Current Health Expenditure by Provider (%) ................................... 41 Figure 6-6 Share of GCHE by geographic divisions (excluding Specialized services), (%) ..................... 45 Figure 6-7 Share of GCHE on hospitals by geographic divisions ........................................................... 46 Figure 6-8 Share of GCHE on Health Centres by geographic divisions ................................................. 46 Figure 6-9 Per capita GCHE on hospitals plus health centres by Divisions and by Province (FJ$) ........ 49 Figure 6-10 Government Curative Care by Inpatient and Outpatient (%) ............................................ 50 Figure 6-11 Share of Government Current Health Expenditure by Functions (%) ............................... 51 Figure 6-12 Share of Preventive care categories (%) ............................................................................ 52 Figure 7-1 Share of Private Current Health Expenditure by Source, 2011 to 2014 .............................. 55 Figure 7-2 Share of Private Current Health Expenditure by Schemes, 2011 to 2014 ........................... 56 Figure 7-3 Private Current Health Expenditure by Providers, 2011 to 2014 ........................................ 57 Figure 7-4 Share of Private Current Health Expenditure by Function, 2011 to 2014 ........................... 58 Figure 8-1 Share of funding by Development Partners, - Direct foreign transfers (%), 2014 ............... 61 Figure 8-2 Allocation of Development Partners funding by Providers ................................................. 62 Figure 8-3 Share of funding by Function (%), 2011 to 2014 ................................................................. 63 Figure 8-4 Share Preventive care funding by Development Partners (%), 2014 .................................. 64 Figure 9-1 Capital Expenditure by type of asset, (nominal Fiji dollars) ................................................ 66 Figure 9-2 Capital Expenditure by sectors ............................................................................................ 68 Figure 10-1 Factors of Provision costs by health Providers .................................................................. 73 Figure 10-2 Human Resource Expenditure by health Providers ........................................................... 73 Figure 10-3 Healthcare Services Expenditure by health Providers ....................................................... 74 Figure 10-4 Pharmaceutical Expenditure by Health Providers ............................................................. 75 Figure 10-5 Other health care goods expenditure by health Providers ............................................... 75 Figure 10-6 Factors of Provision costs by Health Functions ................................................................. 76 Figure 10-7 Human Resource costs by health functions ...................................................................... 77 Figure 11-1 Inpatient Disease Expenditure by ICD 10AM in 2013 and 2014 as a Percentage.............. 80 Figure 11-2 Inpatient Expenditure by Gender and ICD 10AM in 2013 ................................................. 82 Figure 11-3 Inpatient Expenditure by Gender and ICD 10AM in 2014 ................................................. 84 Figure 11-4 Percentage Change by Gender and ICD 10AM between 2013 and 2014 .......................... 85 Figure 11-5 Disease based expenditure as a % of total expenditure for the given gender: 2013 ........ 86 Figure 11-6 Disease based expenditure as a % of total expenditure for the given gender: 2014 ........ 86 Figure 11-7 Share of inpatient expenditure by ethnicity and ICD 10AM: 2013 & 2014 ....................... 88 Figure 11-8 Inpatient services related distribution of costs by Age Group: 2013 & 2014 ................... 90

FIJI HEALTH ACCOUNTS: NATIONAL HEALTH EXPENDITURE 2011-2014 11
Figure 11-9 Distribution of Cost by Age Group and ICD 10AM Category for 2013 (FJ$m) ................... 91 Figure 11-10 Distribution of Cost by Age Group and ICD 10AM Category for 2014 (FJ$m) ................. 91 Figure 11-11 Outpatient Cost by ICD 10AM: 2013 & 2014 ................................................................... 92 Figure 11-12 Percentage Change between 2013 and 2014 by ICD 10AM ............................................ 93 Figure 11-13 Cost breakdown by Ethnicity comparative 2013 & 2014 ................................................ 94 Figure 11-14 Percentage distribution of OPD Expenditure by Gender and ICD 10AM: 2013-2014 ..... 95
FIJI HEALTH ACCOUNTS: NATIONAL HEALTH EXPENDITURE 2011-2014 12
Abbreviations
CHE Current Health Expenditure CHIPSR Centre for Health Information Policy and Systems Research CMNHS College of Medicine, Nursing & Health Sciences CRA Community Rehabilitation Assistance Program CWMH Colonial War Memorial Hospital DBC Disease Based Costing DFAT Department of Foreign Affairs and Trade DMO Divisional Medical Officers DSHS Deputy Secretary Hospital Services DSPH Deputy Secretary Public Health DSPND Department of Strategic Planning and National Development FBOS Fiji Bureau of Statistics FHSSP Fiji Health Sector Support Program FJ$m Fiji Dollars in Millions FJHA Fiji Health Accounts FMIS Financial Management Information System FNU Fiji National University FP Factors of Provision FPBS Fiji Pharmaceutical and Biomedical Services FPS Fiji Pharmacy Society FRCA Fiji Revenue and Customs Authority FS Revenue of Financing Schemes GCHE Government Current Health Expenditure GDP Gross Domestic Product GF Global Fund GHE Government Health Expenditure (GCHE plus capital spending) GL General Ledger GP General Practitioners HC Health Care Functions HF Health Care Financing Schemes HIES Household Income and Expenditure Survey HiT Health in Transition HK Capital Expenditure HP Health Care Providers HR Human Resource ICD-10AM International Coding of Disease 10 Australian Modification ICHA International Classification of Health Accounts
ICT Information Communications Technology IP Inpatient JICA Japan International Cooperation Agency K Thousand Dollars KOICA Korea International Cooperation Agency MFAT Ministry of Foreign Affairs and Trade MoF Ministry of Finance

FIJI HEALTH ACCOUNTS: NATIONAL HEALTH EXPENDITURE 2011-2014 13
MoHMS Ministry of Health and Medical Services MOU Memorandum of Understanding MS Medical Superintendents NCD Non-communicable Diseases NEC Not Elsewhere Classified NGOs Non-government Organizations NHA National Health Accounts NZAID New Zealand Aid Programme OECD Organisation for Economic Co-operation and Development OOP Out of Pocket Expenditure OP Outpatient PATIS Patient Information System PCHE Private Current Health Expenditure PHC Public Health Centres PHIS Public Health Information System PRC People’s Republic of China PSIP Public Sector Investment Programme SDHs Sub Divisional Hospital SHA System of Health Accounts TB Tuberculosis TGE Total Government Expenditure TGHE Total Government Health Expenditure THE Total Health Expenditure UNAIDS Joint United Nations Programme on HIV/AIDS UNFPA United Nations Population Fund UNICEF United Nations Children’s Fund USD United States Dollar VAT Value Added Tax WHO World Health Organization
FIJI HEALTH ACCOUNTS: NATIONAL HEALTH EXPENDITURE 2011-2014 14
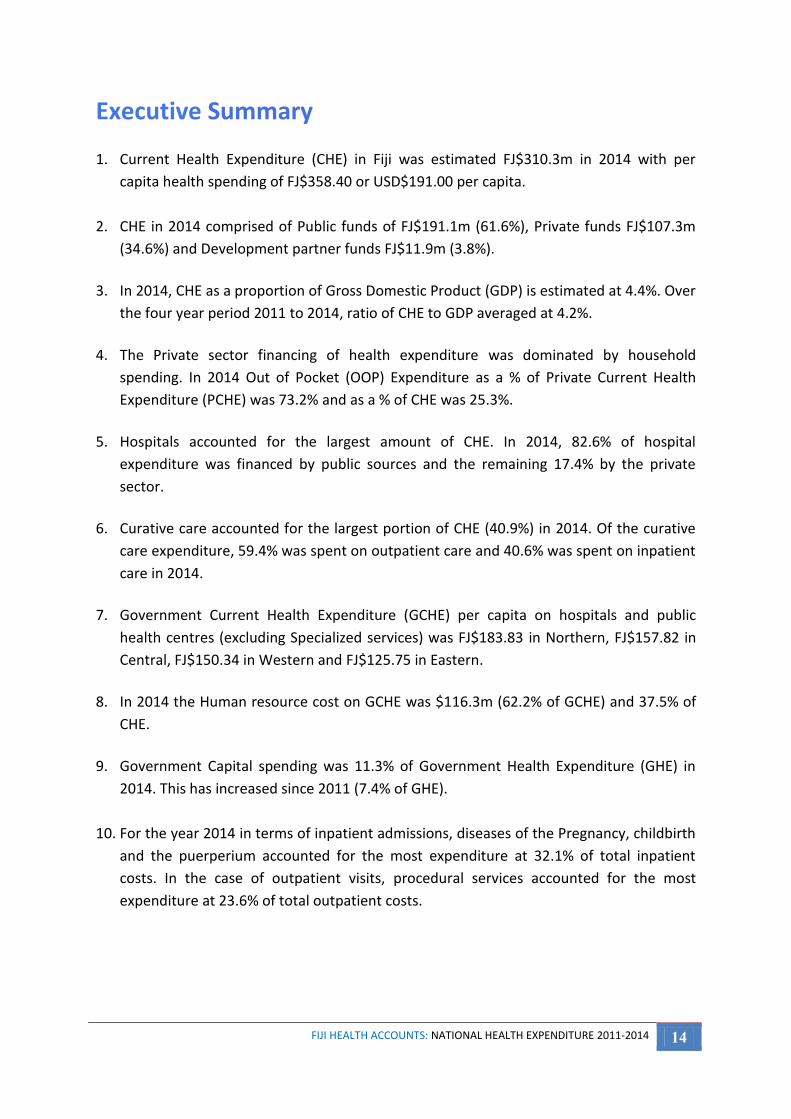
Executive Summary
1. Current Health Expenditure (CHE) in Fiji was estimated FJ$310.3m in 2014 with per
capita health spending of FJ$358.40 or USD$191.00 per capita.
2. CHE in 2014 comprised of Public funds of FJ$191.1m (61.6%), Private funds FJ$107.3m
(34.6%) and Development partner funds FJ$11.9m (3.8%).
3. In 2014, CHE as a proportion of Gross Domestic Product (GDP) is estimated at 4.4%. Over
the four year period 2011 to 2014, ratio of CHE to GDP averaged at 4.2%.
4. The Private sector financing of health expenditure was dominated by household
spending. In 2014 Out of Pocket (OOP) Expenditure as a % of Private Current Health
Expenditure (PCHE) was 73.2% and as a % of CHE was 25.3%.
5. Hospitals accounted for the largest amount of CHE. In 2014, 82.6% of hospital
expenditure was financed by public sources and the remaining 17.4% by the private
sector.
6. Curative care accounted for the largest portion of CHE (40.9%) in 2014. Of the curative
care expenditure, 59.4% was spent on outpatient care and 40.6% was spent on inpatient
care in 2014.
7. Government Current Health Expenditure (GCHE) per capita on hospitals and public
health centres (excluding Specialized services) was FJ$183.83 in Northern, FJ$157.82 in
Central, FJ$150.34 in Western and FJ$125.75 in Eastern.
8. In 2014 the Human resource cost on GCHE was $116.3m (62.2% of GCHE) and 37.5% of
CHE.
9. Government Capital spending was 11.3% of Government Health Expenditure (GHE) in
2014. This has increased since 2011 (7.4% of GHE).
10. For the year 2014 in terms of inpatient admissions, diseases of the Pregnancy, childbirth
and the puerperium accounted for the most expenditure at 32.1% of total inpatient
costs. In the case of outpatient visits, procedural services accounted for the most
expenditure at 23.6% of total outpatient costs.

FIJI HEALTH ACCOUNTS: NATIONAL HEALTH EXPENDITURE 2011-2014 15
Summary of Key Indicators 2011-2014
Indicators 2011 2012 2013 2014
General
Population 853,794 857,849 862,068 865,716
Gross Domestic Product (GDP) at Current Price (Nominal) (FJ$m)
5,738.8 6,010.1 6,440.0 7,129.8
Total Government Expenditure (TGE) (FJ$m)
1,898.3 2,013.7 2,136.3 2,883.3
Current Health Expenditure (CHE) (FJ$m)
230.4 251.5 267.8 310.3
CHE plus capital spending(FJ$m) 245.5 266.2 291.9 342.9
CHE per capita (FJ$) 269.9 293.2 310.6 358.4
Revenues of Schemes
Government Current health expenditure (GCHE) (FJ$m)
138.7 149.1 158.5 191.1
Private health expenditure 80.6 87.2 98.1 107.3
Development partner 11.1 15.2 11.1 11.9
GCHE as a % CHE 60.2% 59.3% 59.2% 61.6%
Private expenditure as a % of CHE 35.0% 34.7% 36.6% 34.6%
Development partner funds as a % CHE
4.8% 6.0% 4.1% 3.8%
CHE as a % of GDP 4.0% 4.2% 4.2% 4.4%
GCHE as a % of TGE 7.3% 7.4% 7.4% 6.6%
GCHE as a % of GDP 2.4% 2.5% 2.5% 2.7%
GCHE per capita (FJ$) 162.5 173.8 183.9 220.7
Private health expenditure as a % of GDP
1.4% 1.5% 1.5% 1.5%
Development partner funds as a % GDP
0.2% 0.3% 0.2% 0.2%
Financing Schemes
Government financing Schemes as a % of CHE
60.2% 59.3% 59.3% 61.8%
Voluntary Health Insurance Schemes as a % of CHE
5.6% 5.7% 8.6% 9.1%
Out of Pocket (OOP) Expenditure as a % of CHE
29.4% 28.9% 27.9% 25.3%
Health Functions Curative care as a % of CHE 42.0% 41.9% 41.5% 40.9%
Inpatient care as a % of Curative care 47.8% 45.7% 40.5% 40.6%
Outpatient care as a % of Curative care
52.2% 54.3% 59.5% 59.4%
Preventive care as a % of CHE 14.2% 16.7% 22.9% 25.0%
Health Providers Hospital spending as a % of CHE 49.5% 46.6% 45.6% 46.3%
Ambulatory health care as a % of CHE 15.8% 17.5% 22.8% 21.5%
Medical goods as a % of CHE 18.3% 17.6% 14.4% 11.7%
Factors of Provision
Expenditure on Government Human Resources as a % of CHE
37.3% 35.3% 34.7% 37.5%
Expenditure on Government Human Resources as a % of GCHE
61.9% 59.6% 59.6% 62.1%
Capital formation
Capital expenditure as a % of CHE plus capital spending
6.2% 5.5% 8.3% 9.5%
Government capital expenditure as a % of GHE
7.4% 5.9% 8.4% 11.3%

FIJI HEALTH ACCOUNTS: NATIONAL HEALTH EXPENDITURE 2011-2014 16
1. Background
1.1. About this Report
This report records health expenditure in Fiji using the System of Health Accounts (SHA)
2011 framework.
There have been some improvements in estimation techniques since the first attempt made
by the National Health Accounts (NHA) Committee in using SHA 2011 methodology (used in
the 2011 & 2012 NHA report). Thus readers will note that expenditure figures reported here
for the years 2011 & 2012 differ from that presented in the last NHA report for the years
2011 & 2012.
The report makes an effort to provide health expenditure in Fiji by understanding and
analyzing the following:
Funding Sources or Revenue of Financing Schemes (FS) – actual source of raising
revenue such as domestic revenue (government revenue), direct bilateral
transfer (development partner funding).
Health Care Financing Schemes (HF) – Modes of financing and providing health
services such as through central Government.
Health Care Providers (HP) – Encompasses organizations and actors that deliver
health care goods and services as their primary activity.
Health Care Functions (HC) – The type of health services performed and types of
goods consumed.
Factors of Production (FP) - Focus on expenditure by inputs into the production
process such as salaries and wages, travel and communication, repairs and
maintenance.
Capital Expenditure (HK) – Investment in infrastructure through construction
and procurement.
Disease Based Costing (DBC) – expenditure based on International Classification
of Disease -10 Australian Modifications (ICD-10AM).
1.2. Structure of the Health Sector and the Flow of Funds
1.2.1. Structure of health sector
The Ministry of Health and Medical Services (MoHMS) is responsible for providing clinical
and preventative healthcare services. Clinical services are mainly provided at the hospitals
and some health centres; whilst the preventative healthcare services are through preventive

FIJI HEALTH ACCOUNTS: NATIONAL HEALTH EXPENDITURE 2011-2014 17
care programs, hospitals, health centres and nursing stations. Healthcare services are
implemented through a decentralized health system that caters for integrated health care at
primary, secondary and tertiary care level. The administration and management of human
resources, finance and drugs & medical supplies, are centralized.
The MoHMS provides health services to all the population of Fiji through hospitals, health
centres and nursing stations. Medical Superintendents (MSs) are responsible for the Clinical
services in the divisional and specialized hospitals while subdivisional hospitals, health
centres and nursing stations are managed by Divisional Medical Officers (DMOs). The DMOs
report directly to the Deputy Secretary Public Health (DSPH) whereas the MSs report to the
Deputy Secretary Hospital Services (DSHS).
Eighteen sub-divisional hospitals also provide primary and secondary level clinical and
preventive health services within a designated medical area that also has health centres and
nursing stations under each of the health facility providing primary health care services.
There are three specialized hospitals providing specialized health services namely, St. Giles
for psychiatry, P.J Twoomey Hospital for Tuberculosis (TB) and Leprosy and the Tamavua
Rehabilitation Centre to restore good health through therapy. Private sector provision of
healthcare services consists mainly of outpatient services through general practitioners,
inpatient services primarily through two private hospitals and the sale of medicines by retail
pharmacies.
1.2.2. Flow of funds
A major change in tracking the flow of funds towards health in SHA 2011 is the identification
of the actual source of how revenue was raised and collected by responsible agencies
(Revenue Source) in addition to the institution that manages and distributes funds
(Financing Agents). SHA 2011 apart from demonstrating that majority of the public health
sector funding in Fiji is financed by Government, also explores in detail how revenue is
generated and collected. Furthermore, SHA 2011 also describes the distribution of
household or business/corporate taxes, Development Partner grants and transfers and
government taxation through various modes of delivery schemes which could also be
through central government schemes, insurance schemes or directly through household out
of pocket expenses. The funds are also tracked to providers of health care and their
functions as per depicted in Figure 1-1.

FIJI HEALTH ACCOUNTS: NATIONAL HEALTH EXPENDITURE 2011-2014 18
Figure 1-1 The Flow of funds in the FIJI Ministry of Health and Medical Services Care System
*Fees and Charges – relates to all types of hospitals fees, fumigation and quarantine charges collected by MoHMS Source: Asia Pacific Observatory on Health Systems and Policies (Section 3: Financing, Fiji Health in Transition (HiT) Report)

FIJI HEALTH ACCOUNTS: NATIONAL HEALTH EXPENDITURE 2011-2014 19
2. Current Health Expenditure
According to System of Health Accounts (SHA) 2011 the aggregate Current Health
Expenditure (CHE) combines in a single figure the monetary value of the final consumption
of all health care goods and services. CHE equals final consumption expenditure on health
care goods and services by residents (individuals or organizations) of a given country during
a given period. CHE excludes capital expenditure on health care.
2.1. Trends in CHE
CHE has increased over the four years (2011 to 2014). In nominal (current) terms CHE has
increased by 34.7% and in constant (real) terms CHE has increased by 53.6% for the same
period (refer to Figure 2-1).
Figure 2-1 Current Health Expenditure (current and constant prices)
Source Table 2-1
230.4
181.8
251.5
188.9
267.8 253.4
310.3
279.3
0
50
100
150
200
250
300
350
Current Constant
FJ$
m
2011 2012 2013 2014

FIJI HEALTH ACCOUNTS: NATIONAL HEALTH EXPENDITURE 2011-2014 20
Table 2-1 CHE at Current and Constant Prices and Growth Rates
Year Amount (FJ$m) Growth Rate over Previous Year (%)
Current Constant(a) Current Constant
2011 230.4 181.8
0.0% 0.0% 2012 251.5 188.9
9.1% 5.7%
2013 267.8 253.4
6.5% 4.1% 2014 310.3 279.3
15.9% 10.2%
(a) Constant prices are calculated using the implicit GDP deflator (2011=100).
2.2. Current Health Expenditure in Relation to GDP
The ratio of Fiji’s CHE to its Gross Domestic Product (GDP) provides an indication on the
proportion of the health sector contributing to the overall economic activity. Over the four
years (2011 to 2014), health spending as a ratio of GDP averaged 4.2% (Table 2-2).
Table 2-2 CHE, GDP, Annual Growth Rates and Share of Health on GDP
Year
Current Health Expenditure
GDP
Ratio of CHE to
GDP (%)
Amount (FJ$m) Nominal Growth Rate
(%)
Amount (FJ$m)
Nominal Growth Rate
(%)
2011 230.4 0.0% 5,738.8 0.0% 4.0% 2012 251.5 9.1% 6,010.1 4.7% 4.2% 2013 267.8 6.5% 6,440.0 7.2% 4.2% 2014 310.3 15.9% 7,129.8 10.7% 4.4%
2.3. Current Health Expenditure per Capita
As the population grows, and demands for improved healthcare also rise, health
expenditure in most countries increase correspondingly. It is useful to examine on average
how much is spent per person on health. Figure 2-2 shows the trend of how much is spent
per person on health. Per capita CHE in real terms recorded a significant increase of 51.6%
over the four years (2011 to 2014). In US dollar terms the per capita health expenditure
increased by 26.6% for the same period.

FIJI HEALTH ACCOUNTS: NATIONAL HEALTH EXPENDITURE 2011-2014 21
Figure 2-2 Per Capita Current Health Expenditure (CHE)
Source: Table 2-3
Table 2-3 Per Capita CHE and GDP
Year
Current Health Expenditure per Capita GDP per Capita
Current (FJ$)
Constant(a) (FJ$)
Current (USD) (b)
& (c)
Real Growth Rate (%)
Current (FJ$m)
Constant (FJ$m)
Current (USD)
2011 269.7 269.7 150.7 0.0% 6,718 6,718 3,753 2012 293.1 283.8 163.4 5.2% 7,004 6,783 3,906 2013 310.6 294.0 169.7 3.6% 7,470 7,071 4,081 2014 358.4 322.6 190.8 9.7% 8,236 7,413 4,383
(a) Constant prices are calculated using the implicit GDP deflator (2011=100). (b) USD Conversion: 2011- USD$1=FJD$1.79 and 2012 - USD$1=FJD$1.79 (c) USD Conversion: 2013- USD$1=FJD$1.83 and 2014 - USD$1=FJD$1.88
269.7 269.7
150.7
293.1 283.8
163.4
310.6 294.0
169.7
358.4
322.6
190.8
0
50
100
150
200
250
300
350
400
Current (FJ$) Constant(a) (FJ$) Current (USD) (b) & (c )
FJ$
m
2011 2012 2013 2014

FIJI HEALTH ACCOUNTS: NATIONAL HEALTH EXPENDITURE 2011-2014 22
3. Financing of Current Health Expenditure
The revenues of health financing schemes (FS) describes i) the contribution mechanisms the
particular financing schemes use to raise their revenues, and ii) the institutional units of the
economy from which the revenues are directly generated.
3.1. Revenues of Financing Schemes
The primary source of revenue over the four years (2011 to 2014) for the health sector
comes from the central Government budget (public). The other sources of funding are the
private sector and development partners. Figure 3-1 provides the share of funding from the
three sources over the four years (2011 to 2014).
Figure 3-1 Current Health Expenditure by Financing Source
Source: Table 3-1
Table 3-1 Current Health Expenditure by Financing Source
Current Health Expenditure
(FJ$m) Share of Current Health
Expenditure (%) Current Health Expenditure as a
Share of GDP (%)
Year Public Private Development
Partners Public Private
Development Partners
Total Public Private Development
Partners Total
2011 138.7 80.6 11.1 60.2% 35.0% 4.8% 100% 2.4% 1.5% 0.2% 4.0%
2012 149.1 87.2 15.2 59.3% 34.7% 6.1% 100% 2.5% 1.5% 0.3% 4.2%
2013 158.5 98.1 11.1 59.2% 36.7% 4.2% 100% 2.5% 1.5% 0.2% 4.2%
2014 191.1 107.3 11.9 61.6% 34.6% 3.8% 100% 2.7% 1.5% 0.2% 4.4%
As per Table 3-1, CHE increased in dollar terms over the four years (2011 to 2014) across all
sources with their proportions as a share of CHE remaining relatively steady.
60.2% 59.3% 59.2% 61.6%
35.0% 34.7% 36.7% 34.6%
4.8% 6.1% 4.2% 3.8%
0%
10%
20%
30%
40%
50%
60%
70%
80%
90%
100%
2011 2012 2013 2014
Pe
rce
nta
ge (
%)
Year
Development Partners
Private
Public

FIJI HEALTH ACCOUNTS: NATIONAL HEALTH EXPENDITURE 2011-2014 23
3.2. Financing Schemes
SHA 2011 defines health care financing schemes as the types of financing arrangements
through which people obtain health services or get access to health care.
Health care financing schemes include direct payments by households for services and
goods and third-party financing arrangements. Third party financing schemes are distinct
bodies of rules that govern the mode of participation in the scheme, the basis for
entitlement to health services and the rules on raising and then pooling the revenues of the
given scheme e.g. health insurance schemes.
Table 3-2 Current Health Expenditure by Financing Schemes (FJ$m)
Table 3-2 shows the funding by financing schemes over the four year period (2011 to 2014).
Category
2011 2012 2013 2014
Amount
(FJ$m)
Amount
(FJ$m)
Amount
(FJ$m)
Amount
(FJ$m)
Government Schemes 138.7 149.1 158.9 191.6 Ministry of Health and Medical Services
138.7 149.1 156.1 187.8
Ministry of Defence* 0.0 0.0 2.8 3.8 Voluntary Health Insurance Schemes 12.8 14.5 23.1 28.3 Employer-based insurance (other than enterprises schemes)
5.3 6.3 13.8 17.1
Other primary coverage schemes 7.5 8.2 9.3 11.3 Household Out-of-pocket (OOP) 67.8 72.7 74.6 78.5 Rest of the World (Development Partners)
11.1 15.2 11.1 11.8
Total 230.4 251.5 267.8 310.3
* Ministry of Defence information was not surveyed for years 2011 and 2012
Figure 3-2 provides the share of financing schemes. Government remains the major scheme
followed by Household Out-of-pocket (OOP), Voluntary Health Insurance and Development
partners (classified as Rest of the World). Except for development partners, expenditure for
the rest of the schemes increased over the four year period (2011 to 2014).

FIJI HEALTH ACCOUNTS: NATIONAL HEALTH EXPENDITURE 2011-2014 24
Figure 3-2 Current Health Expenditure by Financing Scheme (%)
Source: Table 3-2
60.2% 59.3% 59.3% 61.8%
29.4% 28.9% 27.9% 25.3%
5.6% 5.7% 8.6% 9.1% 4.8% 6.1% 4.2% 3.8%
0%
10%
20%
30%
40%
50%
60%
70%
80%
90%
100%
2011 2012 2013 2014
Pe
rce
nta
ge (
%)
Year
Government Schemes Household Out of Pocket
Voluntary Health Insurance Schemes Rest of the World

FIJI HEALTH ACCOUNTS: NATIONAL HEALTH EXPENDITURE 2011-2014 25
4. Current Health Expenditure by Providers
The Health Care Providers (HP) classification encompasses organizations and actors that
deliver health care goods and services as their primary activity, as well as those for which
health care provision is only one among a number of activities (SHA 2011).
4.1 Health care Providers
Hospitals, Retailers and other providers of medical goods, and Providers of ambulatory
health care remain the top three Health Care Providers in Fiji in terms of expenditure over
the period 2011 to 2014.
The largest expenditure in the public sector is from Hospitals and Providers of Ambulatory
health care (health centres & nursing stations) while in the private sector, it is Retailers and
other providers of medical goods and also Providers of Ambulatory health care (private
general practitioners, dentists, and optometrists). Providers of Preventive care are mostly
from the public sector.
Figure 4-1 Share of Current Health Expenditures by Providers (%)
Source: Table 4-1
Expenditure in all health providers increased over the period 2011 to 2014. In 2014, the
largest expenditure was on hospitals and the lowest expenditure was on Residential long-
term care facilities (refer Figure 4-2).
49.5% 46.6% 45.6% 46.3%
18.3% 17.6%
14.4% 11.7%
15.8% 17.5%
22.8% 21.5%
5.8%
8.3% 6.7% 9.5%
2.7%
2.9%
4.0% 4.2% 0%
5%
10%
15%
20%
25%
30%
35%
40%
45%
50%
2011 2012 2013 2014
Pe
rce
nta
ge (
%)
Year
Hospitals
Retailers andotherproviders ofmedical goods
Providers ofambulatoryhealth care
Providers ofPreventivecare
Rest of theworld

FIJI HEALTH ACCOUNTS: NATIONAL HEALTH EXPENDITURE 2011-2014 26
Figure 4-2 Share of Current Health Expenditures by Providers (%), 2014
Source: Table 4-1
Table 4-1 Current Health Expenditure by Providers (FJ$m)
Providers 2011 2012 2013 2014
Hospitals 114.1 117.1 122.1 143.7 Residential long-term care facilities 0.7 0.8 0.8 1.1 Providers of ambulatory health care 36.4 44.0 61.1 66.7 Providers of ancillary services 2.0 2.2 3.3 4.3 Retailers and other providers of medical goods
42.2 44.2 38.6 36.2
Providers of Preventive care 13.3 21.0 18.0 29.6 Providers of health care system administration and financing
12.1 12.9 12.3 14.4
Rest of economy 3.4 1.9 0.9 1.2 Rest of the world 6.1 7.3 10.6 13.2
Total 230.4 251.5 267.8 310.3
4.2 Hospital Expenditure
Majority of the Hospital expenditure is funded by Government sources. At an average
Hospital expenditures are 47.0% of the CHE over the period -2011 to 2014.
Figure 4-3 highlights the share of CHE incurred at hospitals by financing sources. The share
of public expenditure decreased from 89.9% in 2011 to 85.2% in 2014 however in dollar
Hospitals, 46.3%
Providers of ambulatory health
care, 21.5%
Retailers and other providers of medical
goods, 11.7%
Providers of Preventive care, 9.5%
Providers of health care system
administration and financing, 4.6%
Rest of the world, 4.2%
Providers of ancillary services, 1.4% Rest of economy,
0.4%
Residential long-term care facilities, 0.4%

FIJI HEALTH ACCOUNTS: NATIONAL HEALTH EXPENDITURE 2011-2014 27
terms this increased by FJ$19.8m over the same period. Private sector expenditure
increased from 10.0% in 2011 to 14.8% in 2014; in dollar terms this increased by FJ$9.9m
over the same period.
Figure 4-3 Share of Current Health Expenditure at Hospitals by Financing Source
Source: Table 4-2
Table 4-2 Current Health Expenditure at Hospitals by Financing Source
Year Public Private Development
Partners Total
FJ$m FJ$m FJ$m FJ$m
2011 102.6 11.5 0.1 114.1 2012 105.2 11.9 0.0 117.1 2013 105.4 16.6 0.0 122.1 2014 122.3 21.3 0.0 143.7
Share (%) Share (%) Share (%)
2011 89.9% 10.0% 0.1% 100% 2012 89.8% 10.2% 0.0% 100% 2013 86.4% 13.6% 0.0% 100% 2014 85.2% 14.8% 0.0% 100%
89.9% 89.8%
86.4% 85.2%
10.0% 10.2%
13.6% 14.8%
0.1%
75%
80%
85%
90%
95%
100%
2011 2012 2013 2014
Pe
rce
nta
ge (
%)
Year
Development Partners
Private
Public

FIJI HEALTH ACCOUNTS: NATIONAL HEALTH EXPENDITURE 2011-2014 28
4.3 Non-Hospital Expenditure
Non-Hospital expenditures include all other providers (e.g. Ancillary services, Ambulatory
care, Preventive care programmes) except for Hospitals. At average Non-Hospital
expenditures was 53.0% of the CHE over the period 2011 to 2014. Much of Non-hospital
spending was by the Providers of Ambulatory health care, such as private general
practitioners and private dentists. The expenditures by these providers have almost doubled
from FJ$36.4m or 15.8% of CHE in 2011 to FJ$66.7m or 21.5% of CHE in 2014. Retailers and
other providers of medical goods also recorded high expenditure although this has declined
from FJ$42.2m or 18.3% in 2011 to FJ$36.2m or 11.7% in 2014 (refer Table 4-1 and Figure 4-
1).
Providers of Preventive care consist of various health programmes. The expenditure on
Preventive care has doubled from FJ$13.3m or 5.8% of CHE in 2011 to FJ$29.6m or 9.5% of
CHE in 2014 (refer Table 4-1 and Figure 4-1).

FIJI HEALTH ACCOUNTS: NATIONAL HEALTH EXPENDITURE 2011-2014 29
5. Current Health Expenditure by Function
Health expenditure by function simply means "for what services and goods has the health
money been spent". The analysis by function systematically classifies the purposes or
functional uses of health expenditures and is important for any health system – it delivers
information to the policy level. For example on how the relation between inpatient and
outpatient care is, or how much was spent on preventive care and on government
administration. Health expenditure by function provides a platform for policy makers to
move from input based to output based health service delivery.
Table 5-1 shows the distribution of Current Health Expenditure (CHE) by health care
functions from 2011 to 2014. Except for Medical goods which recorded marginal decline in
expenditure, there was rise in expenditure for all other functions over the period 2011 to
2014.
Table 5-1 Current Health Expenditure by Function (FJ$m), 2011 to 2014
Health Care Functions 2011 2012 2013 2014
Inpatient curative care 46.5 48.5 45.1 51.5
Outpatient curative care 50.4 57.2 66.2 75.3
Rehabilitative & Long-term Care 5.9 5.5 4.2 4.7
Ancillary services (a) 25.2 25.1 31.5 39.9
Medical goods 43.0 45.4 42.0 41.3
Preventive care 32.6 42.1 61.3 77.6
Governance, and health system
and financing administration
26.7 28.1 17.5 19.9
Other health care services 0.2 0.0 0.0 0.0
Total 230.4 251.5 267.8 310.3
(a) Ancillary services to health care include laboratory and imaging services
Figure 5-1 shows that expenditure on outpatient curative care is more than inpatient
curative care. The increase in outpatient care expenditure is largely due to the increase in
private health expenditure over the years. The expenditure on preventive care has also
increased by FJ$45.0m in 2014 from 2011 and accounted for 14.5% of CHE (refer Table 5-1).

FIJI HEALTH ACCOUNTS: NATIONAL HEALTH EXPENDITURE 2011-2014 30
Figure 5-1 Current Health Expenditure by Functions (%), 2011 to 2014
Source: Table 5-1
5.1. Curative (Inpatient and Outpatient) Care Services
The largest part of health spending by function is for curative care (inpatient and outpatient
care services) as shown in Table 5-1.
Curative health care expenditure has been increasing over the years in dollars terms (refer
Table 5-1) but declining as a proportion of CHE. Curative health care expenditure was 43.0%
of CHE in 2011, and has marginally decreased to 40.9% in 2014. Curative care expenditure in
2014 was made up of 16.6% inpatient and 24.3% outpatient of CHE (refer Table 5-1). In
2013, 16.8% of the curative care was inpatient care and 24.7% was outpatient care of CHE.
Thus an increase in outpatient care and a marginal decrease in inpatient care as a share of
CHE.
Table 5-2 reflects that curative care is mainly financed by public sector. Inpatient care is
primarily financed by public sector with the share declining over the years. Similarly, the
outpatient care is also largely financed by public sector. Over the years the share of private
21.9% 22.7% 24.7% 24.3%
20.1% 19.2% 16.8% 16.6%
18.6% 18.0% 15.7% 13.3%
14.2% 16.7% 22.9% 25.0%
11.6% 11.2% 6.6% 6.4%
11.0% 10.0% 11.8% 12.9%
2.5% 2.2% 1.6% 1.5%
0%
10%
20%
30%
40%
50%
60%
70%
80%
90%
100%
2011 2012 2013 2014
Pe
rce
nta
ge (
%)
Year
Other health care services Rehabilitative & Longterm Care
Ancillary services Governance, and health system and financing administration
Preventive care Medical goods
Inpatient curative care Outpatient curative care

FIJI HEALTH ACCOUNTS: NATIONAL HEALTH EXPENDITURE 2011-2014 31
sector for curative care has increased even though private spending has decreased slightly
over time as a proportion of overall CHE.
Table 5-2 Share of Curative Expenditure by Function (%), 2011 to 2014
Inpatient Outpatient
Year Public Private Public Private
2011 86.4% 13.6% 57.9% 42.1%
2012 86.5% 13.5% 56.9% 43.1%
2013 80.2% 19.8% 52.0% 48.0%
2014 79.7% 20.3% 50.9% 49.1% Note: Private expenditure also includes Development partners
5.2. Medical Goods
Medical goods include pharmaceutical and therapeutic appliances and comprise the sales of
medicines and other medical goods from private pharmacies and other retailers. Under the
SHA guidelines, public expenditure on pharmaceuticals during an inpatient/outpatient
episode of care is categorized as curative expenditure. Therefore drug consumption under
government facilities are coded to inpatient and outpatient care and not included under this
category. Thus the expenditure on medicines and medical goods included in this category
accounts mainly for retails sales by private pharmacies.
Over the period 2011 to 2014 the expenditure on medical goods as a proportion of CHE
fluctuated between years and has decreased from 18.6% in 2011 to 13.3% in 2014 (refer
Figure 5-1). However, the expenditure in dollar terms has been fairly stable on average was
approximately FJ$43.0m. Fiji spent maximum of FJ$45.4m in 2012 and minimum of
FJ$41.3m in 2014 on medical goods to outpatients (Table 5-3).

FIJI HEALTH ACCOUNTS: NATIONAL HEALTH EXPENDITURE 2011-2014 32
Table 5-3 Medical goods Expenditure by Subclasses, 2011 to 2014
Functions 2011 2012 2013 2014
FJ$m Share (%)
FJ$m Share (%)
FJ$m Share (%)
FJ$m Share (%)
Prescribed medicines 24.6 57.3% 26.0 57.4% 24.2 57.7% 24.3 58.9% Over-the-counter medicines
13.0 30.4% 13.7 30.3% 12.3 29.4% 11.2 27.0%
Other medical non-durable goods
5.1 11.9% 5.4 11.9% 2.7 6.4% 2.6 6.3%
Glasses and other vision products
0.0 0.0% 0.0 0.0% 1.6 3.9% 1.7 4.2%
All other medical durables, including medical technical devices
0.2 0.4% 0.2 0.5% 1.1 2.7% 1.5 3.6%
Total 43.0 100% 45.4 100% 42.0 100% 41.3 100%
Table 5-3 shows expenditure on medical goods by subclasses from 2011 and 2014. It reflects
that expenditure on medical goods spent on prescribed medicines has been fairly stable. In
2014, 58.9% of expenditure on medical goods was spent on prescribed medicines, while
27.0% on over the counter medicines.
5.3. Preventive Care
“Preventive care is any measure that aims to avoid the occurrence or the severity of injuries
and diseases and their complications. Prevention is based on a health promotion strategy
that involves a process to enable people to improve their health through the control over
some of its immediate determinants. This includes a wide range of expected outcomes,
which are covered through a diversity of interventions, organized as primary, secondary and
tertiary prevention level” (SHA 2011). The expenditure mostly includes primary and
secondary prevention programmes.
Preventive care expenditures accounted for FJ$77.6m or 13.3% of CHE in 2014. This signifies
a substantial increase in comparison to 2011 (FJ$32.6m or 18.6%). This increase was due to
an increase in both public and private funding for prevention interventions.
Figure 5-2 shows that preventive care is largely funded by public sector (government) and
has been fairly stable, on average approximately accounted for 78.6%.

FIJI HEALTH ACCOUNTS: NATIONAL HEALTH EXPENDITURE 2011-2014 33
Figure 5-2 Share of Preventive care by Source (%), 2011 to 2014
Source: Table 5-5
The expenditure on preventive care across all the categories had increased over the years in
dollar terms while as a share of CHE it fluctuated (refer Table 5-4). Figure 5-3 illustrates that
approximately on average one third of the preventive care expenditure was spent on
information, education and counseling programmes. However, in dollar terms it has
increased by FJ$11.3m from 2011 to 2014 (refer Table 5-4).
The expenditure on early disease detection programmes and healthy condition monitoring
programmes also increased over the years both as share and in dollar terms (refer Table 5-
4). Furthermore, the expenditure on Epidemiological surveillance and risk and disease
control programmes and preparing for disaster and emergency response programmes has
been fairly stable as a share of CHE and has increased in dollar terms.
80.5% 73.7%
78.8% 81.3%
7.8%
6.7%
9.3% 7.9%
11.7% 19.7%
11.9% 10.7%
0%
10%
20%
30%
40%
50%
60%
70%
80%
90%
100%
2011 2012 2013 2014
Pe
rce
nta
ge (
%)
Year
Public Private Development Partners

FIJI HEALTH ACCOUNTS: NATIONAL HEALTH EXPENDITURE 2011-2014 34
Figure 5-3 Share of Preventive care by categories of service (%), 2011 to 2014
Source: Table 5-5
Figure 5-4 reflects the distribution of preventative care expenditure by health care
providers. It shows that preventative care activities exist across the public spectrum of
health facilities from tertiary care facilities (Divisional hospitals) to small nurse managed
health clinics (Nursing Stations). Health Centres account for the largest proportion of
preventative care spending (40.1%) while Nursing Stations the least (2.7%). Close to 57% of
preventative care expenditure is incurred at hospitals.
35.3% 36.7% 29.6% 29.4%
20.8% 23.9%
18.1% 16.0%
12.3% 10.1%
17.4% 18.5%
10.3% 11.3%
17.9% 18.3%
13.0% 10.7% 9.4% 9.8%
8.3% 7.3% 7.7% 8.1%
0%
10%
20%
30%
40%
50%
60%
70%
80%
90%
100%
2011 2012 2013 2014
Pe
rce
nta
ges
(%)
Year
Preparing for disaster and emergency response programmes
Epidemiological surveillance and risk and disease control programmes
Healthy condition monitoring programmes
Early disease detection programmes
Immunisation programmes
Information, education and counseling programmes

FIJI HEALTH ACCOUNTS: NATIONAL HEALTH EXPENDITURE 2011-2014 35
Figure 5-4 Share of Preventive care by providers (%), 2014
40.1%
28.3%
21.9%
6.9%
2.7%
Health Centres
Sub-divisional Hospital
Divisional Hospitals
Specialised Hospitals
Nursing Stations

FIJI HEALTH ACCOUNTS: NATIONAL HEALTH EXPENDITURE 2011-2014 36
Table 5-4 Preventive care by categories of service (FJ$m), 2011 to 2014
Preventative 2011 2012 2013 2014
Public Private Donor Total Public Private Donor Total Public Private Donor Total Public Private Donor Total
Information, education and counseling programmes
6.8 2.6 2.1 11.5 8.2 2.8 4.4 15.4 10.3 5.7 2.1 18.1 14.5 6.1 2.2 22.8
Immunization programmes 6.2 0.0 0.5 6.8 8.6 0.0 1.5 10.0 8.7 0.0 2.4 11.1 10.3 0.0 2.1 12.4 Early disease detection programmes
3.9 0.0 0.1 4.0 4.0 0.0 0.3 4.3 9.1 0.0 1.5 10.7 12.3 0.0 2.0 14.3
Healthy condition monitoring programmes
3.1 0.0 0.3 3.4 3.5 0.0 1.2 4.7 10.3 0.0 0.6 11.0 13.6 0.0 0.6 14.2
Epidemiological surveillance and risk and disease control programmes
3.6 0.0 0.6 4.3 4.1 0.0 0.4 4.5 5.2 0.0 0.6 5.7 6.9 0.0 0.7 7.6
Preparing for disaster and emergency response programmes
2.6 0.0 0.1 2.7 2.6 0.0 0.4 3.1 4.6 0.0 0.1 4.7 5.6 0.0 0.7 6.3
Total 26.3 2.6 3.8 32.6 31.0 2.8 8.3 42.1 48.3 5.7 7.3 61.3 63.1 6.1 8.33 77.6
Table 5-5 Preventive care by categories of service (%), 2011 to 2014
Preventative 2011 2012 2013 2014
Public Private Donor Total Public Private Donor Total Public Private Donor Total Public Private Donor Total
Information, education and counseling programmes
59% 22% 18% 100% 53% 18% 29% 100% 57% 31% 11% 100% 63% 27% 10% 100%
Immunization programmes 92% 0% 8% 100% 85% 0% 15% 100% 79% 0% 21% 100% 83% 0% 17% 100% Early disease detection programmes
96% 0% 4% 100% 94% 0% 6% 100% 86% 0% 14% 100% 86% 0% 14% 100%
Healthy condition monitoring programmes
92% 0% 8% 100% 74% 0% 26% 100% 94% 0% 6% 100% 96% 0% 4% 100%
Epidemiological surveillance and risk and disease control programmes
86% 0% 14% 100% 91% 0% 9% 100% 90% 0% 10% 100% 91% 0% 9% 100%
Preparing for disaster and emergency response programmes
95% 0% 5% 100% 86% 0% 14% 100% 97% 0% 3% 100% 89% 0% 11% 100%
Total 80% 8% 12% 100% 73% 7% 20% 100% 79% 9% 12% 100% 81% 8% 11% 100%

FIJI HEALTH ACCOUNTS: NATIONAL HEALTH EXPENDITURE 2011-2014 37
6. Government Current Health Expenditure
Government is the largest source of funding for the provision of health services. This
chapter looks at Government Current Health Expenditure (GCHE) and provides details to
show where and how the money was being spent.
6.1. Government Expenditure on Health
An analysis of Government spending (refer Table 6-1) shows that over the twelve (12) year
period, Government Health Expenditure (GHE) which comprises of GCHE plus Capital
spending has increased in both nominal value (current) and real value (constant). In real
terms this means that Government has been spending high and there has been an escalating
trend since 2010. The highest expenditure on health was in 2014 (FJ$194.0m) over the
twelve year period.
Table 6-1 Government Health Expenditures (FJ$m)
Year 2003 2004 2005 2006 2007 2008 2009 2010 2011 2012 2013 2014
Current(Nominal) 111 121 131 154 152 139 156 154 150 158 173 216
Constant(Real) 84 90 131 149 143 126 140 129 150 153 164 194
Note: The TGHE values is the summation of GCHE plus capital spending
Figure 6-1 Government Health Expenditure in Real (Constant) and Nominal (Current) value
Source: Table 6-1
84 90
131
149 143
126 140
129
150 153 164
194
111 121
131
154 152 139
156 154 150 158
173
216
0
50
100
150
200
250
2003 2004 2005 2006 2007 2008 2009 2010 2011 2012 2013 2014
FJ$
m
Years
Constant Current

FIJI HEALTH ACCOUNTS: NATIONAL HEALTH EXPENDITURE 2011-2014 38
The GHE as a percentage of Total Government Expenditure (TGE) averaged around 9.0% and
has remained relatively constant over the period from 2003 to 2014 except in 2011 and
2012 where it dropped to 7.9% (refer Figure 6-2).
Figure 6-2 Government Health Expenditure as a Percentage of TGE
The increase and decrease of the GHE as a percentage of TGE is largely driven by
fluctuations in Government revenues (thus affecting the Government fiscal position) over
those years, but less aligned with the health status of the population and the increasing
(financial) needs for people with chronic diseases. The drop in share for 2011 was a result of
a decrease in GHE and increase in TGE.
As a percentage of Gross Domestic Product (GDP), GHE has averaged 3.0% over the period of
2003 to 2014. The percentage has remained relatively constant without any significant
increase over the last 10 years (refer Figure 6-3). The WHO states that it is difficult for
countries to achieve universal health coverage and equal access to health care if countries
spend less than 4-5% of GDP on health (World Health Report 2010).
8.4%
9.2% 9.4% 9.9% 10.1%
9.8% 9.5%
9.3%
7.9% 7.9% 8.1% 7.9%
7.0%
8.0%
9.0%
10.0%
11.0%
2003 2004 2005 2006 2007 2008 2009 2010 2011 2012 2013 2014
Pe
rce
nta
ge (
%)
Year

FIJI HEALTH ACCOUNTS: NATIONAL HEALTH EXPENDITURE 2011-2014 39
Figure 6-3 Government Health Expenditure (GHE) as a percentage of GDP
6.2. Government Current Health Expenditure by Sources
Government had spent FJ$158.5m in 2013 and FJ$191.1m in 2014, an increase of FJ$32.6m
in the GCHE in 2014 over 2013 (refer Table 6-2). This reflects a huge increase from 2013 to
2014 approximately by 20.6% and also the increase is substantial in comparison of
Government spending from 2007.
Table 6-2 Sources of Government Current Health Expenditures (FJ$m)
Sources 2007 2008 2009 2010 2011 2012 2013 2014
Transfers from Government domestic revenue (allocated to health purposes)
146.6 134.5 133.3 142.5 138.6 147.4 156.0 189.0
Transfers distributed by Government from foreign origin
- - 0.2 0.2 0.1 1.7 2.5 2.1
Total 146.6 134.5 133.5 142.6 138.7 149.1 158.5 191.1
The GCHE also includes expenditures against development partners such as cash grants
which are traditionally channeled through the Government system and reflected in the
annual budget. This arrangement was endorsed by Government from 2009. Over the two
3.0% 3.1% 3.0%
3.4% 3.3%
2.9%
3.2%
2.9%
2.6% 2.6% 2.7%
3.0%
0.0%
0.5%
1.0%
1.5%
2.0%
2.5%
3.0%
3.5%
4.0%
2003 2004 2005 2006 2007 2008 2009 2010 2011 2012 2013 2014
Pe
rce
nta
ge (
%)
Year
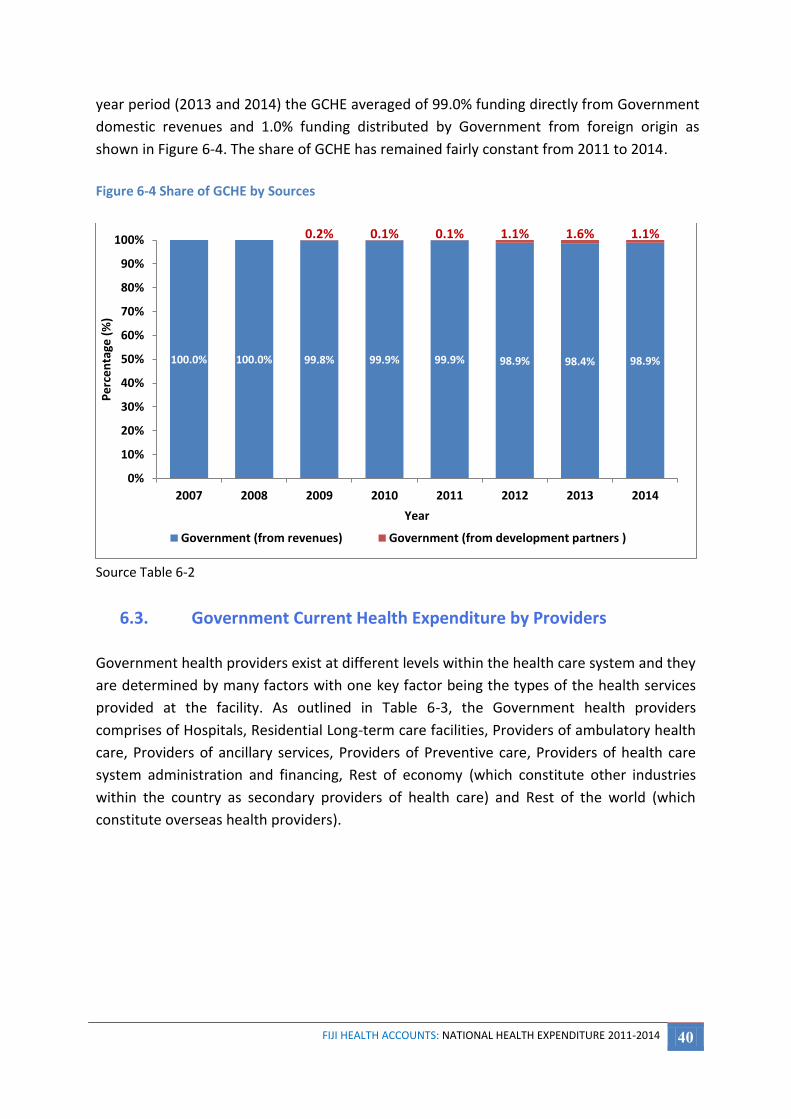
FIJI HEALTH ACCOUNTS: NATIONAL HEALTH EXPENDITURE 2011-2014 40
year period (2013 and 2014) the GCHE averaged of 99.0% funding directly from Government
domestic revenues and 1.0% funding distributed by Government from foreign origin as
shown in Figure 6-4. The share of GCHE has remained fairly constant from 2011 to 2014.
Figure 6-4 Share of GCHE by Sources
Source Table 6-2
6.3. Government Current Health Expenditure by Providers
Government health providers exist at different levels within the health care system and they
are determined by many factors with one key factor being the types of the health services
provided at the facility. As outlined in Table 6-3, the Government health providers
comprises of Hospitals, Residential Long-term care facilities, Providers of ambulatory health
care, Providers of ancillary services, Providers of Preventive care, Providers of health care
system administration and financing, Rest of economy (which constitute other industries
within the country as secondary providers of health care) and Rest of the world (which
constitute overseas health providers).
100.0% 100.0% 99.8% 99.9% 99.9% 98.9% 98.4% 98.9%
0.2% 0.1% 0.1% 1.1% 1.6% 1.1%
0%
10%
20%
30%
40%
50%
60%
70%
80%
90%
100%
2007 2008 2009 2010 2011 2012 2013 2014
Pe
rce
nta
ge (
%)
Year
Government (from revenues) Government (from development partners )

FIJI HEALTH ACCOUNTS: NATIONAL HEALTH EXPENDITURE 2011-2014 41
Table 6-3 Government Current Health Expenditures by Providers (FJ$m)
Providers 2007 2008 2009 2010 2011 2012 2013 2014
Hospitals 100.0 91.1 90.0 95.9 102.6 105.2 105.4 122.3 Residential long-term care facilities
0.8 0.9 0.8 0.7 0.7 0.8 0.8 1.1
Providers of ambulatory health care
16.3 16.6 15.0 16.5 14.3 18.4 27.1 28.1
Providers of ancillary services 1.3 1.0 1.5 1.6 1.6 1.5 2.6 3.3 Retailers and other providers of medical goods
- - - - - - 0.2 0.3
Providers of Preventive care 14.5 13.4 13.3 12.4 7.8 10.9 10.7 21.3 Providers of health care system administration and financing
10.3 8.2 8.3 14.1 10.0 9.6 9.0 11.3
Rest of economy 3.0 2.9 3.8 0.1 0.3 1.0 0.9 1.2 Rest of the world 0.5 0.5 0.9 1.3 1.4 1.6 1.7 2.2
Total 146.6 134.5 133.5 142.6 138.7 149.1 158.5 191.1
Figure 6-5 shows the share of Government current health expenditures amongst the health
providers from 2007 to 2014.
Figure 6-5 Share of Government Current Health Expenditure by Provider (%)
Source: Table 6-3 *Other Providers includes - Rest of economy, Providers of ancillary services, Residential long-term care facilities, Rest of
the world & Retailers and other providers of medical goods
Hospitals which include divisional hospitals, sub-divisional hospitals, mental and specialized
hospitals account for the largest share of Government spending. Figure 6-5 shows for the
last eight years hospitals remain the major recipient of Government health spending.
Hospital expenditure equates to 64.0% of GCHE in 2014. Of this value 62.5% is spent on
68.2% 67.7% 67.4% 67.2% 73.9% 70.6% 66.5% 64.0%
11.1% 12.4% 11.3% 11.6%
10.3% 12.3% 17.1%
14.7%
9.9% 9.9% 9.9% 8.7% 5.6% 7.3% 6.8%
11.1%
7.0% 6.1% 6.2% 9.9% 7.2% 6.5% 5.7% 5.9% 3.8% 3.9% 5.2% 2.6% 2.9% 3.4% 4.0% 4.2%
0%
10%
20%
30%
40%
50%
60%
70%
80%
90%
100%
2007 2008 2009 2010 2011 2012 2013 2014
Pe
rce
nta
ge (
%)
Year
* Other Providers
Providers of healthcare systemadministration andfinancing
Providers ofPreventive care
Providers ofambulatory healthcare
Hospitals
FIJI HEALTH ACCOUNTS: NATIONAL HEALTH EXPENDITURE 2011-2014 42
divisional hospitals, 30.1% in sub divisional hospitals, 7.4% in specialty hospitals and 2.2% in
private hospitals. The private hospital expenditure is from other ministries.
Providers of ambulatory health care refer to expenditures at health centers and nursing
stations. In 2014 the category expanded FJ$28.1m or 14.7% of GCHE an increase of
expenditure by 4.4% from 2011 (refer Figure 6-5). However this value is only 23.0% of what
Government spends on hospitals. The ambulatory care expenditure consisted of both health
centres and nursing stations.
Providers of Preventive care expenditures accounted for FJ$21.3m or 10.1% of GCHE in 2014
(refer Figure 6-5). These expenditures increased by approximately 63.0% in 2014 when
compared to 2013, however, increased by almost 100% in comparison to 2011.
Health care system administration and financing includes activities under the overall
administration of the health care sector, including administration of health financing such as
formulation, coordination, administration and monitoring of overall health policies and
budgets which accounts for Fj$11.3m or 5.9% of GCHE in 2014 (refer Figure 6-5). The share
of health care administration expenditure has gradually decreased however, in dollar value
it has increased in 2014.
The Other providers category as shown in Figure 6-5 is made up of the following
components: “Rest of economy, Providers of ancillary services, Residential long-term care
facilities, Rest of the world & Retailers and other providers of medical goods”. These are
discussed next in detail.
Rest of the economy refers to industries or organizations that offer health care as a
secondary activity. Rest of the economy accounts for FJ$1.2m or 0.6% of GCHE in 2014
(refer Figure 6-5).
Ancillary services refer to expenditures for laboratory services, imaging services and patient
transportation. These services accounted for FJ$3.3m or 1.7% of GCHE in 2014 (refer Figure
6-5). Whilst the increase is very marginal in terms of share, the expenditure has doubled
since 2011.
Residential long-term care facilities refer to expenditures at the three geographical divisions
of Senior Citizens Home (also known as old Peoples home) which accounts for FJ$1.1m or
0.6% of GCHE in 2014 (refer Figure 6-5).
Rest of the world refers to Government funds spent on overseas health providers and this
equates to a value of FJ$2.2m or 1.1% in 2014 of GCHE (refer Figure 6-5). There has been a

FIJI HEALTH ACCOUNTS: NATIONAL HEALTH EXPENDITURE 2011-2014 43
continuous increase in expenditure in this category as previously reported in the National
Health Account reports from 2007-2012.
Retailers and other providers of medical goods refer to sale of drugs and medical supplies to
private pharmacies for retail sales. This accounted for FJ$0.3m or 0.1% in 2014 of GCHE
(refer Figure 6-5).
Expenditure on salary and wages is distributed across all providers and is incorporated into
expenditures of health providers.
6.4. Government Current Health Expenditure by Geographic Locations
GCHE in the geographic divisions were expanded mainly through divisional hospitals,
subdivisional hospitals and public health centres. The distribution of facilities is depicted
below.
Geographic Divisions
Facilities Central Western Northern Eastern
Divisional hospitals 1 1 1
Sub-divisional hospitals 5 5 3 5
Health Centres 21 28 20 15
Nursing Stations 21 25 21 31
Specialized hospitals 2 - - -
Collectively the divisional hospitals incurred the largest expenditure over the period 2007 to
2014. In 2014 the reported expenditure amounted to FJ$76.5m or 40.0% of GCHE (refer
Table 6-4). The divisional hospitals mainly cover CWM, Lautoka and Labasa Hospitals. The
subdivisional Hospitals (SDHs) in the geographical divisions incurred the second largest
expenditure over the period 2007 to 2014. In 2014 the reported expenditure amounted to
FJ$35.3m or 15.8% of GCHE. The Public Health Centres (PHC) in the geographical divisions
incurred an expenditure of FJ$25.4m or 13.3% of the GCHE in 2014. Overall the
expenditures in Central, Western and Northern PHCs had increased in 2013 and 2014 when
compared from 2007 whilst the Eastern PHC decreased.
Note that what is displayed here is spending by location of health facility and may or may
not correspond to spending by residents. Mobility of residents often results in persons
moving between divisions and provinces and using health facilities located in those
geographic regions. Further note that CWM as the national referral hospital also caters for
referred patients across all divisions.

FIJI HEALTH ACCOUNTS: NATIONAL HEALTH EXPENDITURE 2011-2014 44
Table 6-4 GCHE on public health facilities (FJ$m)
Providers by Geographic divisions 2007 2008 2009 2010 2011 2012 2013 2014
Central 45.8 43.1 41.8 45.0 51.0 51.9 54.7 56.2 Divisional hospitals 33.9 31.5 30.9 32.6 39.1 37.0 35.0 35.6 Subdivisional Hospitals (SDHs) 6.4 6.5 5.7 6.4 4.9 5.2 6.3 7.1 Public Health Centres (PHC) 5.4 5.0 5.2 5.9 7.1 9.7 13.4 13.5
Eastern 6.3 6.3 5.5 5.9 4.5 5.5 6.9 5.1 Subdivisional Hospitals (SDHs) 4.8 4.6 4.2 4.7 3.4 4.2 4.3 4.5 Public Health Centres (PHC) 1.5 1.7 1.3 1.2 1.0 1.3 2.6 0.6
Western 35.2 32.0 31.9 33.5 33.9 38.0 40.0 49.9 Divisional hospitals 19.4 17.5 18.2 18.2 19.7 21.3 19.8 25.8 Subdivisional Hospitals (SDHs) 10.3 8.9 9.0 10.3 10.8 12.6 14.1 17.5 Public Health Centres (PHC) 5.5 5.6 4.7 5.1 3.4 4.1 6.1 6.6
Northern 21.2 19.2 18.4 20.2 21.2 22.3 23.6 26.0 Divisional hospitals 13.0 11.7 11.6 12.2 13.7 14.7 13.7 15.2 Subdivisional Hospitals (SDHs) 4.7 4.0 3.6 4.2 4.7 5.0 6.4 6.2 Public Health Centres (PHC) 3.6 3.5 3.2 3.7 2.7 2.6 3.5 4.6
Specialized Hospitals (National Level)
7.5 6.4 6.7 7.2 6.3 5.1 5.0 9.1
Mental health hospitals 3.7 3.2 3.4 3.7 3.1 2.9 2.8 4.2 Tamavua hospital (TB and Leprosy)
3.8 3.1 3.3 3.5 3.2 2.2 2.2 4.9
Total 116.0 106.9 104.4 111.7 116.8 122.9 130.2 146.2 Public Health Facilities = Divisional Hospitals, SDHs, PHCs & Specialized Hospitals
Figure 6-6 shows the share of GCHE incurred by facilities (divisional, SDHs and PHCs) in the
geographic divisions, excluding expenditure incurred by specialized facilities. There has been
a decrease in share of expenditure in Central, Northern and Eastern division whilst increase
in Western division from 2013 to 2014.
The largest share of GCHE was spent in the central division which amounted to FJ$54.7m or
42.1% in 2013 and FJ$56.2m or 38.4% in 2014 (refer Table 6-4 and Figure 6-6). The northern
division expenditure increased in dollar terms but declined in terms of share. Eastern
division expenditures were the lowest which was FJ$6.9m or 5.3% in 2013 or FJ$5.1m or
3.5% in 2014. Except for Eastern division all other divisions increased in expenditure over
the eight year period from 2007 to 2014. The specialized hospitals represented FJ$5.0m or
3.8% in 2013 and FJ$9.1m or 6.2% in 2014.

FIJI HEALTH ACCOUNTS: NATIONAL HEALTH EXPENDITURE 2011-2014 45
Figure 6-6 Share of GCHE by geographic divisions (excluding Specialized services), (%)
Source: Table 6-4
In 2014 the sub divisional hospitals were allocated an average expenditure per facility as
follows: Central FJ$1.4m, Western FJ$3.5m, Northern FJ$2.1m and Eastern FJ$0.9m. In the
same year the health centres were allocated an average expenditure per facility as follows:
Central FJ$600K, Western FJ$200K, Northern FJ$200K and Eastern FJ$40K.
Figure 6-7 and Figure 6-8 shows the distribution of GCHE incurred by hospitals and health
centres respectively by the geographic divisions. The hospital is inclusive of both divisional
and sub divisional hospitals but exclusive of specialized hospitals.
39.5% 40.3% 40.1% 40.2% 43.7% 42.3% 42.1% 38.4%
30.3% 30.0% 30.6% 30.0% 29.0% 31.0% 30.7% 34.1%
18.3% 17.9% 17.7% 18.0% 18.1% 18.2% 18.1% 17.8%
5.4% 5.9% 5.3% 5.3% 3.8% 4.5% 5.3% 3.5%
0%
10%
20%
30%
40%
50%
60%
70%
80%
90%
100%
2007 2008 2009 2010 2011 2012 2013 2014
Pe
rce
nta
ge (
%)
Year
Central Western Northern Eastern

FIJI HEALTH ACCOUNTS: NATIONAL HEALTH EXPENDITURE 2011-2014 46
Figure 6-7 Share of GCHE on hospitals by geographic divisions
Source: Table 6-4 Hospitals = Divisional Hospitals + Sub divisional hospitals (excludes specialized hospitals)
Figure 6-8 Share of GCHE on Health Centres by geographic divisions
Source: Table 6-4
43.7% 44.9% 44.0% 44.0%
45.6%
42.2% 41.5%
38.1%
32.0% 31.2% 32.7% 32.1% 31.6%
33.9% 34.0%
38.7%
19.1% 18.4% 18.3% 18.6% 19.2% 19.7% 20.2% 19.1%
5.2% 5.5% 5.0% 5.3% 3.6% 4.2% 4.3% 4.0%
0%
5%
10%
15%
20%
25%
30%
35%
40%
45%
50%
2007 2008 2009 2010 2011 2012 2013 2014
Pe
rce
nta
ge (
%)
Year
Central
Western
Northern
Eastern
34.6% 35.5%
32.3% 31.9% 24.0% 23.4% 23.8% 26.1%
33.9%
31.8%
36.2% 37.2%
49.8%
55.0% 52.2% 53.3%
22.3% 22.3% 22.2% 23.2%
18.9%
14.4%
13.8% 18.2%
9.2% 10.5% 9.3% 7.8% 7.2% 7.1%
10.2% 2.4%
0%
10%
20%
30%
40%
50%
60%
2007 2008 2009 2010 2011 2012 2013 2014
Pe
rce
nta
ge (
%)
Year
Western
Central
Northern
Eastern

FIJI HEALTH ACCOUNTS: NATIONAL HEALTH EXPENDITURE 2011-2014 47
For both hospitals and health centres, Central division has the highest GCHE expenditures
followed by Western, Northern and then Eastern. The Central division caters for a larger
population and is also the main referral centre for all other hospitals and health centres. In
the central division, hospital expenditures increased whilst health center expenditures
decreased.
Table 6-5 GCHE on hospitals plus health centres by Province (FJ$m)
Province 2007 2008 2009 2010 2011 2012 2013 2014
Rewa 36.3 33.6 33.0 34.9 41.6 41.0 38.5 39.0 Ba 29.2 26.8 27.0 28.0 28.9 32.5 32.3 41.3 Macuata 15.1 13.7 13.5 14.4 15.4 16.4 15.3 17.7 Tailevu 5.0 4.4 4.5 5.2 5.4 6.0 7.9 8.2 Cakaudrove 4.6 3.9 3.5 4.1 4.2 4.2 6.2 6.2 Nadroga/Navosa 3.6 3.0 2.8 3.2 3.0 3.4 4.8 5.5 Naitasiri 2.8 3.1 2.8 3.2 2.6 3.2 5.4 6.5 Ra 2.4 2.3 2.0 2.4 1.9 2.1 2.7 2.9 Lau 2.3 2.2 1.9 1.9 1.6 2.1 2.9 1.6 Lomaiviti 1.9 1.9 1.7 2.0 1.3 1.7 1.8 1.8 Bua 1.6 1.6 1.5 1.7 1.5 1.6 2.0 1.9 Serua 1.5 1.7 1.4 1.5 1.5 1.7 2.6 2.1 Kadavu 1.4 1.5 1.2 1.4 1.0 1.2 1.6 1.0 Rotuma 0.7 0.7 0.6 0.7 0.5 0.6 0.7 0.7 Namosi 0.2 0.2 0.2 0.2 0.1 0.1 0.1 0.1
Total 108.5 100.5 97.7 104.6 110.5 117.8 124.6 136.5 Note - Expenditure excludes specialized hospitals
The five provinces receiving the largest budget allocation in the eight year period from 2007
to 2014 were Rewa, Ba, Macuata, Tailevu and Cakaudrove. The provinces receiving the least
budget allocation in the eight year period from 2007 to 2014 were Namosi, Rotuma, Kadavu,
Serua and Bua. Rewa, Ba and Macuata are expected to have high expenditure since they
house the three divisional hospitals (CWM, Lautoka, and Labasa hospital respectively).
The trend over the period 2007 to 2014 show that apart from the top five recipient
provinces of budget allocations, all other provinces have mostly remained unchanged or
decreased in terms of budget allocation.
Table 6-6 provides the GCHE on health facilities (divisional, SDHs and PHCs) per capita by
provinces and divisions. The per capita information is computed using the 2007 census of
population figures and projected population1 figures provided by Fiji Bureau of Statistics for
the years 2008 to 2014. Fiji Bureau of Statistics (FBoS) does not produce population
estimates at sub-national level, due to the non-availability of demographic indicators at this
level.
1 Population figures are projected estimates sourced from the Fiji Bureau of Statistics (FBOS)

FIJI HEALTH ACCOUNTS: NATIONAL HEALTH EXPENDITURE 2011-2014 48
Table 6-6 Per capita GCHE on hospitals plus health centres by Divisions and Province (FJ$)
Province by Divisions
2007 2008 2009 2010 2011 2012 2013 2014
Eastern Division 160.60 160.08 138.75 148.82 111.04 136.51 170.66 125.75
Rotuma 349.14 329.92 318.94 343.16 240.73 284.00 315.86 339.43
Lau 215.25 206.99 178.54 170.08 149.77 187.19 260.26 144.59
Kadavu 135.46 150.03 119.80 132.75 95.38 113.64 148.19 95.60
Lomaiviti 117.17 114.55 102.17 120.82 79.21 99.04 107.94 105.90
Northern Division 156.23 140.24 133.73 145.86 152.36 159.61 167.97 183.83
Macuata 207.87 188.36 183.54 195.61 208.09 221.19 205.25 236.74
Bua 112.21 111.83 103.26 115.55 106.12 112.36 136.59 128.24
Cakaudrove 93.07 77.82 69.45 81.68 84.00 82.99 122.27 122.14
Central Division 133.72 125.23 120.51 129.57 146.46 148.33 154.26 157.82
Rewa 359.51 331.99 322.48 341.06 404.33 396.59 369.81 373.86
Tailevu 90.58 79.20 79.49 92.33 94.57 105.22 137.40 142.15
Serua 80.12 91.24 73.79 80.79 78.77 90.28 140.20 111.30
Namosi 26.05 31.85 23.34 27.12 11.44 13.17 11.61 17.27
Naitasiri 17.51 19.14 17.29 19.48 15.82 19.55 32.40 38.84
Western Division 110.00 99.84 98.42 103.39 103.80 116.01 120.84 150.34
Ba 125.94 115.00 115.15 118.98 122.54 137.07 135.55 172.45
Ra 81.60 77.67 68.07 79.06 61.50 68.19 87.93 93.68
Nadroga/Navosa 61.06 50.89 47.39 53.89 50.90 56.77 79.04 91.17
Total
129.57 119.61 115.08 123.13 129.47 137.27 144.50 157.69
Note - Expenditure excludes specialized hospitals
Across the four divisions, the provinces with the highest per capita health expenditure are
notably those that have the divisional hospitals situated within them (Macuata, Rewa and
Ba). However across all provinces, Rewa and Rotuma have the highest per capita health
spending. Rewa houses the main national referral hospital in the country and Rotuma due
to its geographical location.

FIJI HEALTH ACCOUNTS: NATIONAL HEALTH EXPENDITURE 2011-2014 49
Figure 6-9 Per capita GCHE on hospitals plus health centres by Divisions and by Province (FJ$)
Source: Table 6-6 Note - Expenditure excludes specialized hospitals
Figure 6-9 shows from 2007 to 2014; provinces of Western, Central and Northern division
show an increasing trend per capita. Eastern division has a fluctuating trend from 2009.
6.5. Government Current Health Expenditure by Functions
This section focuses on Government current health expenditures (GCHE) by function and is
reflected in Table 6-7.
Table 6-7 Government Current Health Expenditures by Functions (FJ$m)
Functions 2007 2008 2009 2010 2011 2012 2013 2014
Curative care 68.6 62.5 64.0 64.1 69.2 74.2 70.6 79.4 Inpatient curative care 37.9 34.5 34.7 37.1 40.0 41.6 36.1 41.1 Outpatient curative care 30.7 28.0 29.3 27.0 29.2 32.6 34.4 38.3 Rehabilitative care 5.1 4.9 4.7 5.0 5.2 4.7 3.4 3.6 Long-term care (health) 0.5 0.5 0.5 0.5 0.7 0.8 0.7 1.0 Ancillary services (non-specified by function)
14.2 12.8 13.3 14.1 15.9 16.1 20.6 25.2
Medical goods (non-specified by function)
- - - - - - 0.7 1.8
Preventive care 36.2 34.7 32.3 33.8 26.3 31.0 48.3 63.1 Governance, and health system and financing administration
21.9 19.2 18.7 25.3 21.4 22.3 14.2 16.9
Total 146.6 134.5 133.5 142.6 138.7 149.1 158.5 191.1 Note: GCHE on medical goods for MoHMS are incorporated into the above categories mainly in inpatient and outpatient care. The amount that appears under Medical goods comes from other Ministries.
110.00
99.84 98.42 103.39 103.80
116.01 120.84
150.34
133.72
125.23 120.51
129.57
146.46
148.33
154.26
157.82
156.23
140.24 133.73
145.86
152.36
159.61
167.97
183.83 160.60 160.08
138.75
148.82
111.04
136.51
170.66
125.75
80.00
100.00
120.00
140.00
160.00
180.00
200.00
2007 2008 2009 2010 2011 2012 2013 2014
FJ$
Year
Western Division Central Division Northern Division Eastern Division

FIJI HEALTH ACCOUNTS: NATIONAL HEALTH EXPENDITURE 2011-2014 50
Curative services incur the largest expense, FJ$70.6m or 44.5% in 2013 and FJ$79.4m or
41.6% in 2014 (refer Table 6-7 and Figure 6-11) of GCHE. Curative services comprise of both
inpatient and outpatient services. The allocation of curative care expenditure between
inpatient and outpatient is shown in Figure 6-10. In 2007 spending on Inpatient Curative
care was 55.2% and in 2014 was 51.7%. In 2007 the Outpatient Curative care was 44.8% and
in 2014 was 48.3%. Costs in nominal terms have not changed much over the eight year
period in both services.
Figure 6-10 Government Curative Care by Inpatient and Outpatient (%)
Source: Table 6-7
In-patient services are provided at hospitals whilst outpatient services are provided both at
hospitals, health centres, and nursing stations. In both cases the expenditure has increased
in 2014 however as a share of GCHE it has declined.
55.2% 55.2% 54.3% 57.8% 57.8% 56.1%
51.2% 51.7%
44.8% 44.8% 45.7% 42.2% 42.2% 43.9%
48.8% 48.3%
0%
10%
20%
30%
40%
50%
60%
70%
2007 2008 2009 2010 2011 2012 2013 2014
Pe
rce
nta
ge
Year
Inpatient Curative Care Outpatient Curative Care

FIJI HEALTH ACCOUNTS: NATIONAL HEALTH EXPENDITURE 2011-2014 51
Figure 6-11 Share of Government Current Health Expenditure by Functions (%)
Source: Table 6-7
Preventive care has the second largest share of health expenditure which accounts for
FJ$48.3m or 30.5% in 2013 and FJ$63.1m or 33.0% in 2014 of GCHE. There have been
significant increases in the Preventive care programmes over the last eight years.
Preventive care programmes are further broken down into six (6) categories of services and
the expenditures have been distributed accordingly by respective years as shown in Table 6-
8.
46.8% 46.5% 47.9% 44.9%
49.9% 49.8% 44.5%
41.6%
24.7% 25.8% 24.2% 23.7%
18.9% 20.8% 30.5% 33.0%
15.0% 14.2% 14.0% 17.7% 15.4% 14.9% 9.0% 8.8%
9.7% 9.5% 9.9% 9.9% 11.5% 10.8% 13.0% 13.2%
3.5% 3.6% 3.5% 3.5% 3.7% 3.2% 2.1% 1.9%
0.4% 0.3% 0.4% 0.3% 0.5% 0.5% 0.5% 0.5%
0%
10%
20%
30%
40%
50%
60%
70%
80%
90%
100%
2007 2008 2009 2010 2011 2012 2013 2014
Pe
rce
nta
ge (
%)
Year
Medical goods (non-specified by function)
Long-term care (health)
Rehabilitative care
Ancillary services (non-specified by function)
Governance, and healthsystem and financingadministration
Preventive care
Curative care

FIJI HEALTH ACCOUNTS: NATIONAL HEALTH EXPENDITURE 2011-2014 52
Table 6-8 Preventive care categories (FJ$m)
Preventive care 2007 2008 2009 2010 2011 2012 2013 2014
Information, education and counselling programmes
8.9 8.8 8.3 8.7 6.8 8.2 10.3 14.5
Immunisation programmes 8.1 7.5 6.9 7.5 6.2 8.6 8.7 10.3 Early disease detection programmes 5.4 5.2 4.7 5.0 3.9 4.0 9.1 12.3 Healthy condition monitoring programmes
4.6 4.4 4.2 4.2 3.1 3.5 10.3 13.6
Epidemiological surveillance and risk and disease control programmes
5.2 5.1 4.7 4.8 3.6 4.1 5.2 6.9
Preparing for disaster and emergency response programmes
4.0 3.8 3.5 3.6 2.6 2.6 4.6 5.6
Total 36.2 34.7 32.3 33.8 26.3 31.0 48.3 63.1
Most of the health expenditures in the Preventive care programmes over the eight year
period are on Information, education and counseling programmes whilst lowest
expenditures are on Preparing for disaster and emergency response programmes as shown
in Figure 6-12.
Figure 6-12 Share of Preventive care categories (%)
Source: Table 6-8
24.6% 25.3% 25.8% 25.7% 26.0% 26.4% 21.4% 22.9%
22.3% 21.7% 21.4% 22.3% 23.8% 27.6%
18.1% 16.3%
15.1% 14.9% 14.5% 14.9% 14.7%
12.9%
18.9% 19.5%
14.3% 14.6% 14.5% 14.1% 13.9% 13.2%
10.7% 10.9%
12.7% 12.6% 13.0% 12.5% 11.8% 11.3%
21.4% 21.6%
11.0% 10.8% 10.7% 10.6% 9.8% 8.5% 9.4% 8.8%
0%
10%
20%
30%
40%
50%
60%
70%
80%
90%
100%
2007 2008 2009 2010 2011 2012 2013 2014
Pe
rce
nta
ge (
%)
Year
Preparing for disasterand emergencyresponse programmes
Healthy conditionmonitoringprogrammes
Epidemiologicalsurveillance and riskand disease controlprogrammes
Early disease detectionprogrammes
Immunisationprogrammes
Information, educationand counselingprogrammes

FIJI HEALTH ACCOUNTS: NATIONAL HEALTH EXPENDITURE 2011-2014 53
Governance, and health system and financing administration is the third largest functional
expenditure which accounts for FJ$14.2m or 9.0% in 2013 and FJ$16.9m or 8.8% in 2014 of
GCHE (refer Figure 6-12). These are expenditures which involve administration of
management of funds, formulation and administration of Government policies and
monitoring and evaluation of such resources. Generally there is decline in this expenditure
in 2014 when compared over the eight year period since 2007.
Ancillary services which is related to diagnosis and monitoring services accounted for
FJ$20.6m or 13.0% in 2013 and FJ$25.2m or 13.2% in 2014 of GCHE. The expenditure has
increased over the period 2007 to 2014.
Rehabilitative care has the second lowest expenditure and accounted for FJ$3.4m or 2.1% in
2013 and FJ$3.6m or 1.9% in 2014 of GCHE. Rehabilitative services are treatments provided
to improve or restore impaired body functions and structures (e.g. disease, disorder and
injury) to improve the quality of life.
Long term care (health) has the lowest expenditure and accounted for FJ$0.7m or 0.5% in
2013 and FJ$1.0m or 0.5% in 2014 of GCHE. Long term (health) consists of a range of
medical and personal care services that are consumed with the primary goal of alleviating
pain and suffering and reducing or managing the deterioration in health status in patients
with a degree of long-term dependency e.g. Senior Citizens home.
The GCHE on medical goods for all years 2007 to 2014 are incorporated mostly into curative
care (in-patient and outpatient care). Government spending in purchasing of drugs is shown
in Table 6-9.
Table 6-9 Government drugs expenditure
Year 2003 2004 2005 2006 2007 2008 2009 2010 2011 2012 2013 2014
FJ$m 6.3 3.9 9.3 7.8 6.4 13.2 6.6 9.9 10.2 8.8 9.5 9.0
2003 – 2006 expenditure figures from MoHMS EPICOR System
2007 – 2014 expenditure figures from FMIS system

FIJI HEALTH ACCOUNTS: NATIONAL HEALTH EXPENDITURE 2011-2014 54
7. Private Current Health Expenditure
Private Current Health Expenditure (PCHE) represents all money spent on health by
households, private firms, non-government organizations, religious and community based
organizations and excludes development partners and the public (government) sector.
7.1. Private Current Health Expenditure by Sources
The Private sector expenditure increased substantially by FJ$26.7m from FJ$80.6m in 2011
to FJ$107.3m in 2014 (refer Table 7-1).
Table 7-1 depicts that the primary source of revenue for the private sector is mainly from
households (other domestic revenues) which accounted for 60.6% (FJ$65.0m) in 2014. Over
the four years, the largest increase was for voluntary prepayments by FJ$19.5m.
Table 7-1 Private Current Health Expenditure by Sources, 2011 to 2014
Description
2011 2012 2013 2014
Amount
(FJ$m)
Share
(%)
Amount
(FJ$m)
Share
(%)
Amount
(FJ$m)
Share
(%)
Amount
(FJ$m)
Share
(%)
Transfers from government domestic revenue
0 0.0% 0 0.0% 0.4 0.4% 0.4 0.4%
Voluntary prepayment 22.3 27.6% 24.8 28.5% 34.4 35.1% 41.8 39.0% Voluntary prepayment from individuals/households
11.3 14.0% 12.3 14.1% 20.6 21.0% 24.8 23.1%
Voluntary prepayment from employers
11.0 13.7% 12.6 14.4% 13.8 14.1% 17.1 15.9%
Other domestic revenues
58.3 72.4% 62.3 71.5% 63.3 64.5% 65.0 60.6%
TOTAL 80.6 100% 87.2 100% 98.1 100% 107.3 100%
Figure 7-1 shows that the expenditure for all categories increased except for other domestic
revenue from households as a share of PCHE. However, expenditure in dollar terms
increased for all categories for revenue sources (refer Table 7-1).

FIJI HEALTH ACCOUNTS: NATIONAL HEALTH EXPENDITURE 2011-2014 55
Figure 7-1 Share of Private Current Health Expenditure by Source, 2011 to 2014
Source: Table 7-1
7.2. Private Current Health Expenditure by Financing Schemes
Households Out-of-pocket (OOP) is the dominant financing scheme over the four years. OOP
accounted for 73.2% of PCHE in 2014. Voluntary health care payment schemes contributed
significantly towards the increase in PCHE (refer Table 7-2).
Table 7-2 Private Current Health Expenditure by Schemes, FJ$m 2011 to 2014
Schemes
2011 2012 2013 2014
Amount (FJ$m)
Share (%)
Amount (FJ$m)
Share (%)
Amount (FJ$m)
Share (%)
Amount (FJ$m)
Share (%)
Government schemes 0 0.0% 0 0.0% 0.4 0.4% 0.4 0.4% Voluntary health care payment schemes
12.8 15.9% 14.4 16.6% 23.1 23.5% 28.3 26.4%
Employer-based insurance (other than enterprises schemes)
5.3 6.6% 6.3 7.2% 13.8 14.1% 17.1 15.9%
Other primary coverage schemes
7.5 9.3% 8.2 9.4% 9.3 9.4% 11.3 10.5%
Household Out-of-pocket (OOP)
67.8 84.1% 72.7 83.4% 74.6 76.0% 78.5 73.2%
TOTAL 80.6 100% 87.2 100% 98.1 100% 107.3 100%
Figure 7-2 highlights that OOP as a share of PCHE declined over the period 2011 to 2014
while voluntary health care payment schemes have increased.
72
.4%
14
.0%
13
.7%
71
.5%
14
.1%
14
.4%
64
.5%
21
.0%
14
.1%
0.4
%
60
.6%
23
.1%
15
.9%
0.4
%
0%
10%
20%
30%
40%
50%
60%
70%
80%
Other revenues fromhouseholds n.e.c.
Voluntary prepaymentfrom
individuals/households
Voluntary prepaymentfrom employers
Transfers fromgovernment domesticrevenue (allocated to
health purposes)
Pe
rce
nta
ge (
%)
2011
2012
2013
2014

FIJI HEALTH ACCOUNTS: NATIONAL HEALTH EXPENDITURE 2011-2014 56
Figure 7-2 Share of Private Current Health Expenditure by Schemes, 2011 to 2014
Source: Table 7-1
7.3. Private Current Health Expenditure by Providers
Retail and other providers of medical goods accounted for largest share of PCHE. The
expenditure on Hospitals and Private Medical Practices (mainly Private doctors) has doubled
over the four years (refer Table 7-3).
Table 7-3 Private Current Health Expenditure by Providers, 2011 to 2014
Providers
2011 2012 2013 2014
Amount
(FJ$m)
Share
(%)
Amount
(FJ$m)
Share
(%)
Amount
(FJ$m)
Share
(%)
Amount
(FJ$m)
Share
(%)
Hospitals 11.5 14.2% 11.9 13.6% 16.6 17.0% 21.3 19.9% Pvt Medical practices 15.4 19.1% 18.4 21.2% 27.1 27.6% 30.6 28.5% Dental Practice 3.8 4.7% 4.1 4.7% 4.1 4.1% 4.9 4.6% Optometrists 2.8 3.5% 2.8 3.3% 2.6 2.7% 2.9 2.7% Ambulatory health care centres
0.1 0.1% 0.2 0.2% 0.0 0.0% 0.0 0.0%
Providers of ancillary services
0.2 0.2% 0.4 0.4% 0.6 0.7% 1.0 1.0%
Retailers and other providers of medical goods
42.2 52.4% 44.2 50.8% 38.4 39.2% 35.9 33.5%
Rest of the world 4.6 5.7% 5.1 5.8% 8.6 8.8% 10.6 9.9%
TOTAL 80.6 100% 87.2 100% 98.1 100% 107.3 100%
84
.1%
15
.9%
83
.4%
16
.6%
76
.0%
23
.5%
0.4
%
73
.2%
26
.4%
0.4
%
0%
10%
20%
30%
40%
50%
60%
70%
80%
90%
Household Out-of-pocket(OOP)
Voluntary health care paymentschemes
Government schemes
Pe
rce
nta
ge (
%)
Financing Schemes
2011
2012
2013
2014

FIJI HEALTH ACCOUNTS: NATIONAL HEALTH EXPENDITURE 2011-2014 57
Figure 7-3 shows an increase in expenditure across all private health care providers except
for retailers and other providers of medical goods. Retailers and other providers of medical
goods decreased both in dollar value and as a percentage share of PCHE.
Figure 7-3 Private Current Health Expenditure by Providers, 2011 to 2014
Source: Table 7-3
7.4. Private Current Health Expenditure by Functions
Curative care (both inpatient and outpatient services) accounted for the largest functional
expenses out of the PCHE, 43.8% in 2014 (refer Table 7-4). In 2014 inpatient care was 21.5%
whilst outpatient was 78.5% of curative care. Expenditure on preventive care increased
from FJ$2.6m in 2011 to FJ$6.1m in 2014. Preventive care expenditure was mostly for
information, education and counseling.
52
.4%
19
.1%
14
.2%
5.7
% 4
.7%
3.5
%
50
.8%
21
.2%
13
.6%
5.8
% 4
.7%
3.3
%
39
.2%
27
.6%
17
.0%
8.8
%
4.1
%
2.7
%
33
.5%
28
.5%
19
.9%
9.9
%
4.6
%
2.7
%
0%
5%
10%
15%
20%
25%
30%
35%
40%
45%
50%
55%
Retailers andother providers
of medicalgoods
Pvt Medicalpractices
Hospitals Rest of theworld
Dental Practice Eye Care
Pe
rce
nta
ge (
%)
Health Providers
2011
2012
2013
2014

FIJI HEALTH ACCOUNTS: NATIONAL HEALTH EXPENDITURE 2011-2014 58
Table 7-4 Private Current Health Expenditure by Functions, 2011 to 2014
Functions
2011 2012 2013 2014
Amount
(FJ$m)
Share
(%)
Amount
(FJ$m)
Share
(%)
Amount
(FJ$m)
Share
(%)
Amount
(FJ$m)
Share
(%)
Curative care 26.5 32.9% 29.9 34.3% 40.3 41.1% 47.0 43.8%
Inpatient curative care 5.4 6.7% 5.4 6.2% 8.7 8.9% 10.1 9.4% Outpatient curative care 21.1 26.2% 24.5 28.1% 31.6 32.2% 36.9 34.4%
Rehabilitative care 0.02 0.03% 0.04 0.05% 0.0 0.04% 0.0 0.05% Ancillary services (non-specified by function)
8.2 10.2% 8.5 9.7% 10.8 11.0% 14.7 13.7%
Medical goods (non-specified by function)
42.9 53.2% 45.4 52.1% 41.3 42.0% 39.5 36.8%
Preventive care 2.6 3.2% 2.8 3.2% 5.7 5.8% 6.1 5.7% Governance, and health system and financing administration
0.4 0.5% 0.5 0.6% 0.0 0.0% 0.0 0.0%
TOTAL 80.6 100% 87.2 100% 98.1 100% 107.3 100%
Figure 7-4 reflects that the share of PCHE by Functions increased for all categories except for medical
goods.
Figure 7-4 Share of Private Current Health Expenditure by Function, 2011 to 2014
Source: Table 7-4
53
.2%
32
.9%
10
.2%
3.2
%
52
.1%
34
.3%
9.7
%
3.2
%
42
.0%
41
.1%
11
.0%
5.8
%
36
.8%
43
.8%
13
.7%
5.7
%
0%
5%
10%
15%
20%
25%
30%
35%
40%
45%
50%
55%
Medical goods (non-specified by function)
Curative care Ancillary services(non-specified by
function)
Preventive care
Pe
rce
nta
ge (
%)
Health Functions
2011
2012
2013
2014
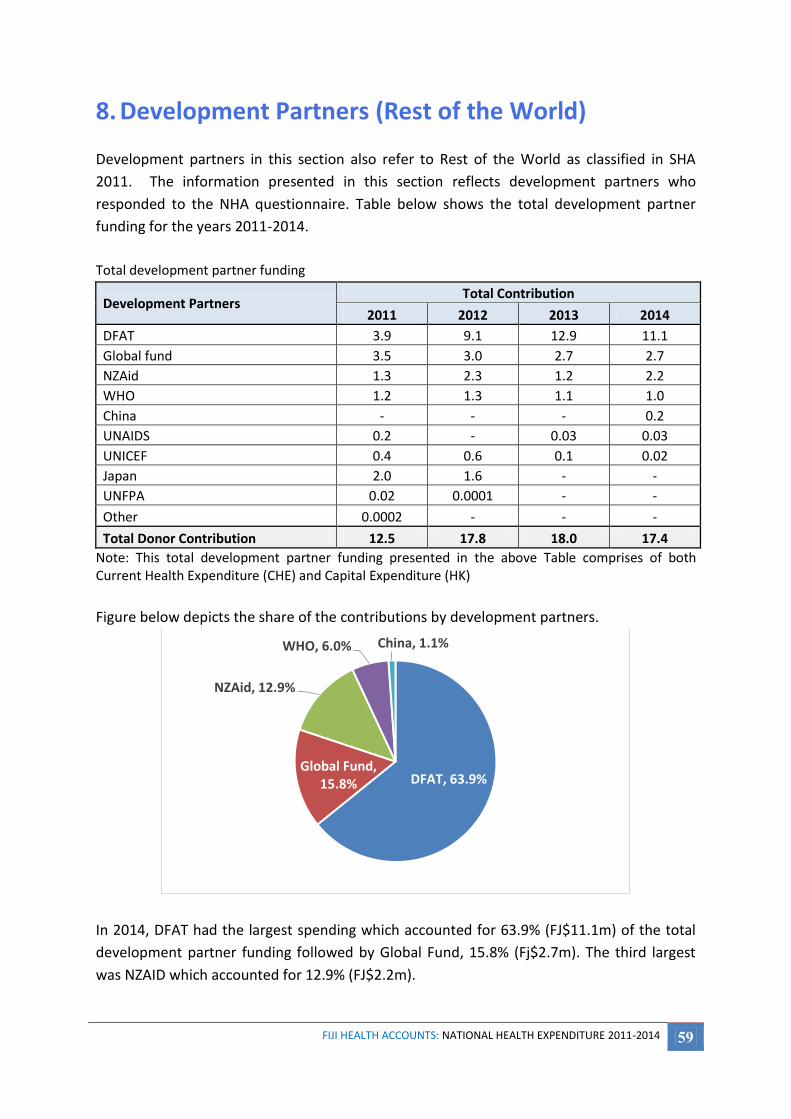
FIJI HEALTH ACCOUNTS: NATIONAL HEALTH EXPENDITURE 2011-2014 59
8. Development Partners (Rest of the World)
Development partners in this section also refer to Rest of the World as classified in SHA
2011. The information presented in this section reflects development partners who
responded to the NHA questionnaire. Table below shows the total development partner
funding for the years 2011-2014.
Total development partner funding
Development Partners Total Contribution
2011 2012 2013 2014
DFAT 3.9 9.1 12.9 11.1
Global fund 3.5 3.0 2.7 2.7
NZAid 1.3 2.3 1.2 2.2
WHO 1.2 1.3 1.1 1.0
China - - - 0.2
UNAIDS 0.2 - 0.03 0.03
UNICEF 0.4 0.6 0.1 0.02
Japan 2.0 1.6 - -
UNFPA 0.02 0.0001 - -
Other 0.0002 - - -
Total Donor Contribution 12.5 17.8 18.0 17.4
Note: This total development partner funding presented in the above Table comprises of both Current Health Expenditure (CHE) and Capital Expenditure (HK)
Figure below depicts the share of the contributions by development partners.
In 2014, DFAT had the largest spending which accounted for 63.9% (FJ$11.1m) of the total
development partner funding followed by Global Fund, 15.8% (Fj$2.7m). The third largest
was NZAID which accounted for 12.9% (FJ$2.2m).
DFAT, 63.9% Global Fund,
15.8%
NZAid, 12.9%
WHO, 6.0% China, 1.1%

FIJI HEALTH ACCOUNTS: NATIONAL HEALTH EXPENDITURE 2011-2014 60
The Ministry of Health & Medical Services (MoHMS) continues to benefit from the
development partners and receive this support through direct (cash grants), Aid-in kind
(technical expertise, supplies and equipment) and ad-hoc cash grants. The MoHMS
traditional bilateral partners are Department of Foreign Affairs and Trade (DFAT), New
Zealand Aid (NZAID), Japanese International Cooperation Agency (JICA) and the People’s
Republic of China (PRC) and multilateral agencies include World Health Organization (WHO),
United Nations Children’s Funds (UNICEF) and the Global Fund (GF). Table 8-1 reflects direct
development partner funding to the MoHMS which has increased from FJ$11.1m in 2011 to
FJ$11.9m in 2014.
Table 8-1 Financing contributions by Development Partners - Direct foreign transfers
Development Partners 2011 2012 2013 2014
DFAT 3.0 9.1 9.4 8.4 WHO 1.1 1.3 1.1 1.0 Japan 1.8 1.4 0.0 0.0 China 0.0 0.0 0.0 0.2 NZAID 1.3 1.6 0.6 2.2 Global fund 3.5 1.3 0.0 0.0 UNICEF 0.4 0.6 0.0 0.0 UNAIDS 0.2 0.0 0.0 0.0
Total 11.1 15.2 11.1 11.9
This total development partner funding presented in 2014 in Table 8-1 is similar to that reported by OECD database (as accessed on 12th November, 2015 ) on donor funds disbursed to Fiji (FJ$11.02m in 2014).

FIJI HEALTH ACCOUNTS: NATIONAL HEALTH EXPENDITURE 2011-2014 61
Figure 8-1 Share of funding by Development Partners, - Direct foreign transfers (%), 2014
Source: Table 8-1
Figure 8-1 depicts the share of the expenditure by development partners. In 2014, DFAT had
the largest spending which accounted for 70.6% (FJ$8.4m) of the total development partner
funding followed by NZAID, 18.8% (FJ$2.2m). The third largest was WHO which accounted
for 8.7% (FJ$1.0m).
Table 8-2 Financing contributions of Development Partners as a share of CHE
Year CHE (FJ$m) Funding by Development
Partners(FJ$m)
Share of Development Partners funding to CHE
(%)
2011 230.4 11.1 4.8% 2012 251.5 15.2 6.1% 2013 267.8 11.1 4.2% 2014 310.3 11.9 3.8%
Table 8-2 shows that development partner funding as a share of Current Health Expenditure
(CHE) had fluctuated over the four year period (2011 to 2014). In 2014 the share was 3.8%
of CHE which reflects a reduction of 1.0% from 2011.
DFAT, 70.6%
NZAID, 18.8%
WHO, 8.7%
China, 1.5% UNAIDS, 0.3%

FIJI HEALTH ACCOUNTS: NATIONAL HEALTH EXPENDITURE 2011-2014 62
8.1. Development Partners funding by Providers
Preventative care programs accounted for the largest portion of the development partner
funding increasing from 48.9% in 2011 to 70.0% in 2014 (refer Figure 8-2). Healthcare
administration and financing, the second largest expenditures item for development
partners, has also increased gradually over the period 2011 to 2014.
The appearance of certain expenditure items in some years and yet missing in other years
shows priorities of donor funding changes across years.
Figure 8-2 Allocation of Development Partners funding by Providers
Source: Table 8-3 Table 8-3 Allocation of Development Partners funding by Providers
Providers 2011 2012 2013 2014
Hospitals 0.1 - - - Providers of ambulatory health care - - 0.2 0.1 Providers of ancillary services 0.2 0.3 - - Providers of preventive care 5.4 10.1 7.3 8.3 Providers of health care system administration and financing
2.2 3.3 3.3 3.0
Rest of economy 3.1 0.9 - - Rest of the world 0.1 0.6 0.3 0.4
Total 11.1 15.2 11.1 11.9
48
.9%
27
.5%
19
.4%
2.2
%
1.2
%
0.7
%
66
.6%
6.0
%
21
.6%
1.8
%
4.0
%
65
.8%
30
.1%
2.3
%
1.9
%
70
.0%
25
.5%
3.4
%
1.1
%
0%
10%
20%
30%
40%
50%
60%
70%
80%
Preventivecare
Rest ofeconomy
Health careadministrationand financing
Ancillaryservices
Rest of theworld
Hospitals Ambulatoryhealth care
Pe
rce
nta
ge (
%)
Health Providers
2011 2012 2013 2014

FIJI HEALTH ACCOUNTS: NATIONAL HEALTH EXPENDITURE 2011-2014 63
8.2. Development Partners funding by Functions
Preventive care accounted for largest portion of the development partner funding over the
four year period (2011 to 2014), increasing from 48.9% in 2011 to 70.0% in 2014 (refer
Figure 8-2). In 2014, development partner funds were largely used for preventative care
(70%) followed by governance, health system, financing and administration (25.5%).
Combined these two areas reflect 95.5% of development partner investment.
Table 8-4 Allocation of Development Partners funding by Functions
Functions 2011 2012 2013 2014
Curative care 1.1 1.2 0.4 0.5 Ancillary services (non-specified by function) 1.1 0.4 0.0 0.0 Medical goods (non-specified by function) 0.0 - - - Preventive care 3.8 8.3 7.3 8.3 Governance, and health system and financing administration 4.9 5.3 3.3 3.0 Other health care services not elsewhere classified (n.e.c.) 0.2 - - -
Total 11.1 15.2 11.1 11.9
Figure 8-3 Share of funding by Function (%), 2011 to 2014
Source: Table 8-3
44.0% 34.6%
30.1% 25.5%
34.3% 54.3% 65.8% 70.0%
9.9%
8.1% 3.7% 4.1%
9.7% 2.9%
0.4% 0.4% 1.7%
0%
10%
20%
30%
40%
50%
60%
70%
80%
90%
100%
2011 2012 2013 2014
Pe
rce
nta
ge (
%)
Year
Other health care servicesnot elsewhere classified
Ancillary services (non-specified by function)
Curative care
Preventive care
Governance, and healthsystem and financingadministration

FIJI HEALTH ACCOUNTS: NATIONAL HEALTH EXPENDITURE 2011-2014 64
Table 8-5 Preventive care funding by Development Partners, FJ$m
Preventive care 2011 2012 2013 2014
Information, education and counselling programmes 2.1 4.4 2.1 2.2 Immunisation programmes 0.5 1.5 2.4 2.1 Early disease detection programmes 0.1 0.3 1.5 2.0 Healthy condition monitoring programmes 0.3 1.2 0.6 0.6 Epidemiological surveillance and risk and disease control programmes
0.6 0.4 0.6 0.7
Preparing for disaster and emergency response programmes 0.1 0.4 0.1 0.7
Total 3.8 8.3 7.3 8.3
The Table 8-5 provides the breakdown of the Preventive care funding by Development
partners into various preventive care categories. The development partners have largely
invested in information, education and counselling programs, Immunization and Early
disease detection programmes for prevention and control.
Figure 8-4 Share Preventive care funding by Development Partners (%), 2014
Source: Table 8-5
Information, education and
counseling programmes ,
26.5%
Immunisation programmes ,
25.7%
Early disease detection
programmes , 23.8%
Preparing for disaster and emergency response
programmes , 8.6%
Epidemiological surveillance and risk and disease
control programmes ,
8.4%
Healthy condition monitoring
programmes , 6.9%

FIJI HEALTH ACCOUNTS: NATIONAL HEALTH EXPENDITURE 2011-2014 65
8.3. Development Partners spending by Capital Expenditure
The Table below provides the breakdown of the capital expenditure by the Development partners. Since 2013, DFAT, Global Fund and NZAid has been largely investing in health sector.
Development Partners Capital Expenditure (HK)
2011 2012 2013 2014
DFAT 0.9 - 3.6 2.7
Global fund - - 0.2 0.6
WHO - - - -
Japan 0.3 0.1 - -
China - - - -
NZAid 0.1 0.7 0.6 -
UNFPA - - - -
UNICEF - - - -
UNAIDS - - - -
Other - - - -
Total Donor Contribution 1.2 0.8 4.4 3.3
Table 9-5 in Chapter 9 provides the types of Assets in which the development partners have invested over the period 2011 to 2014.

FIJI HEALTH ACCOUNTS: NATIONAL HEALTH EXPENDITURE 2011-2014 66
9. Capital Expenditure
SHA 2011 describes Capital Expenditure (HK) as a very integral component in health
expenditure towards production of health services. For example construction of new health
facilities or expansion/upgrading of existing ones, investment into new medical equipment
or upgrading or enhancements in computer or information systems. The HK information
helps in analyzing the health systems production capability whether it’s appropriate,
deficient or excessive.
This chapter provides how much Capital Expenditure has been spent on the production of
services which was contributed by Government, private and development partners and
what types of services have been provided. The information presented on private and
development partners have been consolidated from the survey responses.
1.1. Types of Assets in production of health services
Capital Expenditure is classified under two major categories where i) Gross Capital formation
comprises of infrastructure, machinery & equipment, ICT & other related machinery; and ii)
Non - produced non – financial assets comprising of land and others.
Figure 9-1 Capital Expenditure by type of asset, (nominal Fiji dollars)
Source: Table 9-1
54
.9%
46
.3%
40
.7%
36
.4%
41
.6%
47
.6%
45
.9%
55
.5%
1.8
%
3.4
%
1.9
%
1.8
%
1.7
%
2.7
%
0.4
%
0.3
%
11
.0%
6.0
%
0.0%
10.0%
20.0%
30.0%
40.0%
50.0%
60.0%
2011 2012 2013 2014
Pe
rce
nta
ge (
%)
Year Machinery and equipment InfrastructureComputer software and databases Non-produced non-financial assetsEducation of health personnel
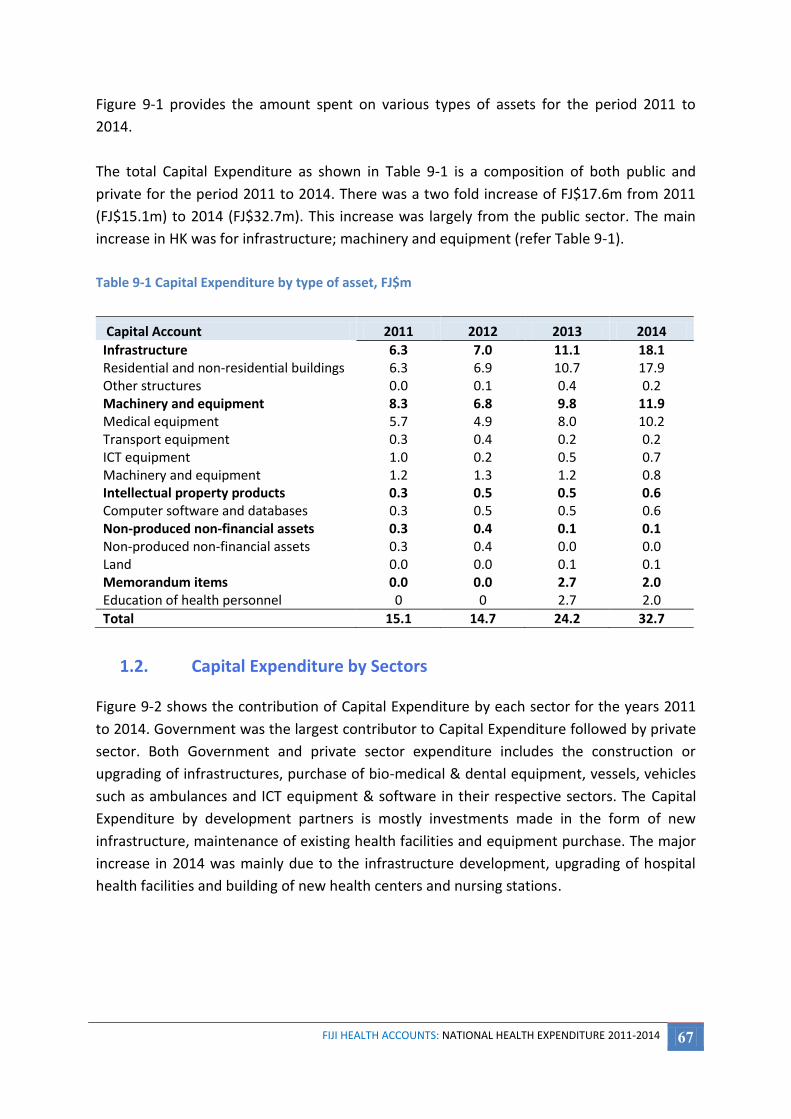
FIJI HEALTH ACCOUNTS: NATIONAL HEALTH EXPENDITURE 2011-2014 67
Figure 9-1 provides the amount spent on various types of assets for the period 2011 to
2014.
The total Capital Expenditure as shown in Table 9-1 is a composition of both public and
private for the period 2011 to 2014. There was a two fold increase of FJ$17.6m from 2011
(FJ$15.1m) to 2014 (FJ$32.7m). This increase was largely from the public sector. The main
increase in HK was for infrastructure; machinery and equipment (refer Table 9-1).
Table 9-1 Capital Expenditure by type of asset, FJ$m
Capital Account 2011 2012 2013 2014
Infrastructure 6.3 7.0 11.1 18.1 Residential and non-residential buildings 6.3 6.9 10.7 17.9 Other structures 0.0 0.1 0.4 0.2 Machinery and equipment 8.3 6.8 9.8 11.9 Medical equipment 5.7 4.9 8.0 10.2 Transport equipment 0.3 0.4 0.2 0.2 ICT equipment 1.0 0.2 0.5 0.7 Machinery and equipment 1.2 1.3 1.2 0.8 Intellectual property products 0.3 0.5 0.5 0.6 Computer software and databases 0.3 0.5 0.5 0.6 Non-produced non-financial assets 0.3 0.4 0.1 0.1 Non-produced non-financial assets 0.3 0.4 0.0 0.0 Land 0.0 0.0 0.1 0.1 Memorandum items 0.0 0.0 2.7 2.0 Education of health personnel 0 0 2.7 2.0
Total 15.1 14.7 24.2 32.7
1.2. Capital Expenditure by Sectors Figure 9-2 shows the contribution of Capital Expenditure by each sector for the years 2011
to 2014. Government was the largest contributor to Capital Expenditure followed by private
sector. Both Government and private sector expenditure includes the construction or
upgrading of infrastructures, purchase of bio-medical & dental equipment, vessels, vehicles
such as ambulances and ICT equipment & software in their respective sectors. The Capital
Expenditure by development partners is mostly investments made in the form of new
infrastructure, maintenance of existing health facilities and equipment purchase. The major
increase in 2014 was mainly due to the infrastructure development, upgrading of hospital
health facilities and building of new health centers and nursing stations.

FIJI HEALTH ACCOUNTS: NATIONAL HEALTH EXPENDITURE 2011-2014 68
Figure 9-2 Capital Expenditure by sectors
Source: Table 9-2
Table 9-2 Capital Expenditure by sectors, FJ$m
Sector 2011 2012 2013 2014
Government 11.1 9.3 14.5 24.4 Private 2.7 4.6 5.2 5.0 Development Partners 1.2 0.8 4.4 3.3
Total 15.1 14.7 24.2 32.7
1.3. Government Capital Expenditure
Government capital expenditure mostly includes the construction or maintenance/
upgrading of infrastructures and purchase of equipment such as bio-medical & dental
equipment, vessels, vehicles mostly ambulances and ICT equipment & software. The
Government Capital Expenditure had significantly increased from FJ$11.1m in 2011 to
FJ$24.4m in 2014 (refer Table 9-3). Capital Expenditure depends mainly on two things 1)
Government’s Public Sector Investment Programme (PSIP) allocation of funds. 2) Time
taken by Ministry to implement the capital project.
73.9% 63.2% 60.2%
74.7%
17.8% 31.0%
21.7%
15.2%
8.2% 5.7% 18.1%
10.1%
0%
10%
20%
30%
40%
50%
60%
70%
80%
90%
100%
2011 2012 2013 2014
Pe
rce
nta
ge (
%)
Year
Government Private Development Partners

FIJI HEALTH ACCOUNTS: NATIONAL HEALTH EXPENDITURE 2011-2014 69
Table 9-3 Capital Expenditure by Government
Capital Account
2011 2012 2013 2014
Amount (FJ$m)
Share (%)
Amount (FJ$m)
Share (%)
Amount (FJ$m)
Share (%)
Amount (FJ$m)
Share (%)
Infrastructure 5.3 47.4% 4.1 43.9% 6.9 47.3% 15.7 64.2% Residential and non-residential buildings
5.3 4.1 6.9 15.7
Machinery and equipment 5.9 52.6% 5.2 56.1% 7.7 52.7% 8.7 35.8% Medical equipment 4.7 3.4 6.2 7.6 Transport equipment 0.0 0.4 0.0 0.0 ICT equipment 0.1 0.2 0.3 0.3 Machinery and equipment 1.1 1.2 1.2 0.8
Total 11.1 100% 9.3 100% 14.5 100% 24.4 100%
Infrastructure expenditure within Government Capital Expenditure had increased by three
fold in 2014 to FJ$15.7m from FJ$5.3m in 2011 (refer Table 9-3). Machinery and Equipment
expenditure is primarily for ongoing purchases of new medical equipment for new and
existing health facilities and replacement of obsolete ones which had also increased by
FJ$2.6m in 2014.
1.4. Private Capital Expenditure
Private capital expenditure includes the construction or maintenance/upgrading of
infrastructures and purchase of equipment such as bio-medical & dental equipment and ICT
equipment & software. Table 9-4 displays that overall private sector Capital Expenditure had
increased by FJ$2.3m in 2014 from FJ$2.7m in 2011 to FJ$5.0m in 2014. Largely the increase
in Capital Expenditure was on machinery and equipment.
Table 9-4 Capital Expenditure by private sector
Capital Account
2011 2012 2013 2014
Amount
(FJ$m)
Share
(%)
Amount
(FJ$m)
Share
(%)
Amount
(FJ$m)
Share
(%)
Amount
(FJ$m)
Share
(%)
Infrastructure 0.9 35.1% 2.1 45.8% 2.5 48.4% 1.6 32.8%
Residential and non-residential buildings
0.9 2.1 2.4 1.4
Other Structures 0.0 0.0 0.2 0.2
Machinery and equipment 1.2 45.5% 1.6 35.3% 2.1 40.7% 2.6 53.4%
Medical equipment 1.1 1.5 1.8 2.0
Transport Equipment 0.0 0.0 0.2 0.2
ICT Equipment 0.0 0.0 0.2 0.4
Machinery and equipment n.e.c. 0.1 0.1 0.0 0.0
Intellectual property products 0.3 10.0% 0.5 9.9% 0.5 9.0% 0.6 11.6%
Computer software and databases 0.3 0.5 0.5 0.6
Non-produced non-financial assets 0.3 9.4% 0.4 9.0% 0.1 2.0% 0.1 2.1%
Non-produced non-financial assets 0.3 0.4 0.0 0.0
Land 0.0 0.0 0.1 0.1
Total 2.7 100% 4.6 100% 5.2 100% 5.0 100%

FIJI HEALTH ACCOUNTS: NATIONAL HEALTH EXPENDITURE 2011-2014 70
1.5. Development Partners Capital Expenditure
Capital expenditure by development partners shows an overall increase from FJ$1.2m in
2011 to FJ$3.3m in 2014 (refer Table 9-5).
In 2014, the increase in expenditure was mainly for education and training for health
personnel which equates to 59.5%. The expenditure on infrastructure had increased by
FJ$0.7m over the period from 2011 to 2014.
Table 9-5 Capital Expenditure by Development Partners
Capital Account
2011 2012 2013 2014
Amount (FJ$m)
Share (%)
Amount (FJ$m)
Share (%)
Amount (FJ$m)
Share (%)
Amount (FJ$m)
Share (%)
Infrastructure 0.1 4.6% 0.8 100.0% 1.7 38.4% 0.8 25.3% Residential and non-residential buildings
0.1 0.7 1.4 0.8
Other structures 0.0 0.1 0.2 0.0 Machinery and equipment 1.2 95.4% 0.0 0.0% 0.0 1.0% 0.5 15.2% Medical Equipment 0.0 0.0 0.0 0.5 Transport equipment 0.3 0.0 0.0 0.0 ICT equipment 0.9 0.0 0.0 0.0 Memorandum items 0.0 0.0% 0.0 0.0% 2.7 60.6% 2.0 59.5% Education of health personnel 0.0 0.0 2.7 2.0 Total 1.2 100% 0.8 100% 4.4 100% 3.3 100%

FIJI HEALTH ACCOUNTS: NATIONAL HEALTH EXPENDITURE 2011-2014 71
10. Factors of Health Care Provision
This classification of health expenditure in this chapter specifically focuses on the inputs
needed to produce the health care goods and services (Factors of Provision - FP). The
discussion and results presented here are for public and private sectors.
The Government Current Health Expenditure (GCHE) by “factors of provision” was captured
from the Financial Management Information System (FMIS). The FMIS is Government
electronic accounting system which captures and records financial information at a detail
level. The Government’s budget system is an input-based however, the costs captured by
FMIS is also at an input-based. Information presented in this chapter on private sector was
based on the survey responses received.
10.1. Factors of Provision for CHE
Table 10-1 below provides details of various resource inputs within the GCHE. The FP by
GCHE in 2011 was FJ$138.7m and in 2014 was FJ$187.3m. The expenditure in 2014 had
increased substantially. Major increase was in Human Resource (HR) costs and Other health
care goods.
Table 10-1 Factors of Provision by GCHE
Category
2011 2012 2013 2014
Amount (FJ$m)
Share (%)
Amount (FJ$m)
Share (%)
Amount (FJ$m)
Share (%)
Amount (FJ$m)
Share (%)
Human Resource (HR) Costs*
71.0 51.2% 77.4 51.9% 79.2 50.8% 103.5 55.3%
FNPF 6.5 4.7% 6.3 4.2% 6.5 4.2% 8.8 4.7% Other HR Costs* 8.4 6.1% 5.1 3.4% 7.2 4.6% 4.0 2.2% Health care services 12.7 9.1% 13.6 9.1% 14.1 9.0% 15.6 8.3% Health care goods - 0.0% - 0.0% - 0.0% - 0.0% Pharmaceuticals (Drugs) 10.3 7.4% 8.9 6.0% 9.7 6.2% 9.0 4.8% Other health care goods 17.0 12.2% 20.6 13.8% 22.5 14.4% 26.2 14.0% Non-health care services 1.7 1.2% 1.7 1.2% 1.7 1.1% 1.6 0.9% Non-health care goods - 0.0% - 0.0% 0.7 0.5% 0.9 0.5% Taxes (VAT)** 6.6 4.8% 8.3 5.6% 6.8 4.4% 10.3 5.5% Other items of spending 4.6 3.3% 7.2 4.8% 7.5 4.8% 7.4 3.9%
Total 138.7 100% 149.1 100% 155.7 100% 187.3 100% The FP by GCHE presented in Table 10-1 is only for MoHMS and does not include other Ministries *HR Costs refers to Wages & Salaries and Other HR Costs refers to Allowances, Overtime and Relieving etc. ** Taxes here refer to VAT paid on the purchase of healthcare goods and services. It was not possible to distribute these across the categories in the above table.
The private sector also had high input costs in 2013 and 2014. The FP by Private Current
Health Expenditure (PCHE) in 2013 was FJ$79.0m and in 2014 was FJ$83.5m (refer Table 10-
2). The expenditure in 2014 had increased substantially. Major increases were recorded in

FIJI HEALTH ACCOUNTS: NATIONAL HEALTH EXPENDITURE 2011-2014 72
Human Resource (similar to public sector), Pharmaceuticals and Non-health care goods.
Unfortunately, there was no information for private sector for years 2011 and 2012.
Table 10-2 Factors of Provision by Private CHE
Category 2013 2014
Amount (FJ$m)
Share (%)
Amount (FJ$m)
Share (%)
Human Resource (HR) + Other HR Costs 22.3 28.3% 24.5 29.4% Health care services 14.2 18.0% 14.7 17.6% Health care goods 28.5 36.1% 29.6 35.4% Pharmaceuticals (Drugs) 11.8 15.0% 12.3 14.7% Other health care goods 16.7 21.1% 17.3 20.7% Non-health care goods 13.9 17.6% 14.7 17.5%
Total 79.0 100% 83.5 100%
10.2. Factors of Provision by Health Providers, GCHE
In this section we look at how resource input costs are distributed across the government
owned health providers.
10.2.1. Factors of Provision by Health Providers, Government
Government health providers exist at different levels within the health care system and they
are defined by the types of health services they provide. Figure 10-1 provides the
distribution of input costs amongst the various providers in the public sector. In both years
2013 and 2014 Hospitals had the largest costs followed by Ambulatory services. However,
due to overall Government’s initiative for a healthier population there was a lot of emphasis
put on prevention and in 2014 was the third largest expenditure. Administration costs also
increased in 2014. All other cost categories remained stagnant.

FIJI HEALTH ACCOUNTS: NATIONAL HEALTH EXPENDITURE 2011-2014 73
Figure 10-1 Factors of Provision costs by health Providers
10.2.2. Human Resources
Human resource remains the largest expenditure in the public sector. Figure 10-2 shows
that the majority of HR associated expenditure was incurred at hospitals, 76.9% in 2013 and
70.6% in 2014. Providers of Ambulatory care which incorporates Health centers and Nursing
stations account for the second largest expenditure; 15.0% in 2013 and 13.2% in 2014.
Preventive care costs changed significantly from 4.2% in 2013 to 11.8% in 2014.
Figure 10-2 Human Resource Expenditure by health Providers
66.8%
16.8%
6.9% 5.8%
1.7%
0.9%
0.6%
0.5%
2013 Hospitals
Ambulatory healthcare
Rest of the world
Preventive care
Ancillary services
Rest of economy
Health care systemadministration
Residential long-term care
64.3% 14.4%
0.9%
11.4%
1.8% 0.6%
6.0% 0.6%
2014 Hospitals
Ambulatory healthcare
Rest of the world
Preventive care
Ancillary services
Rest of economy
Health caresystemadministration
76.9%
15.0%
4.2%
3.3% 0.6%
2013 Hospitals
Ambulatory healthcare
Preventive care
Health care systemadministration
Residential long-term care
70.6%
13.2%
11.8%
3.7% 0.7%
2014 Hospitals
Ambulatoryhealth care
Preventive care
Health caresystemadministration
Residential long-term care
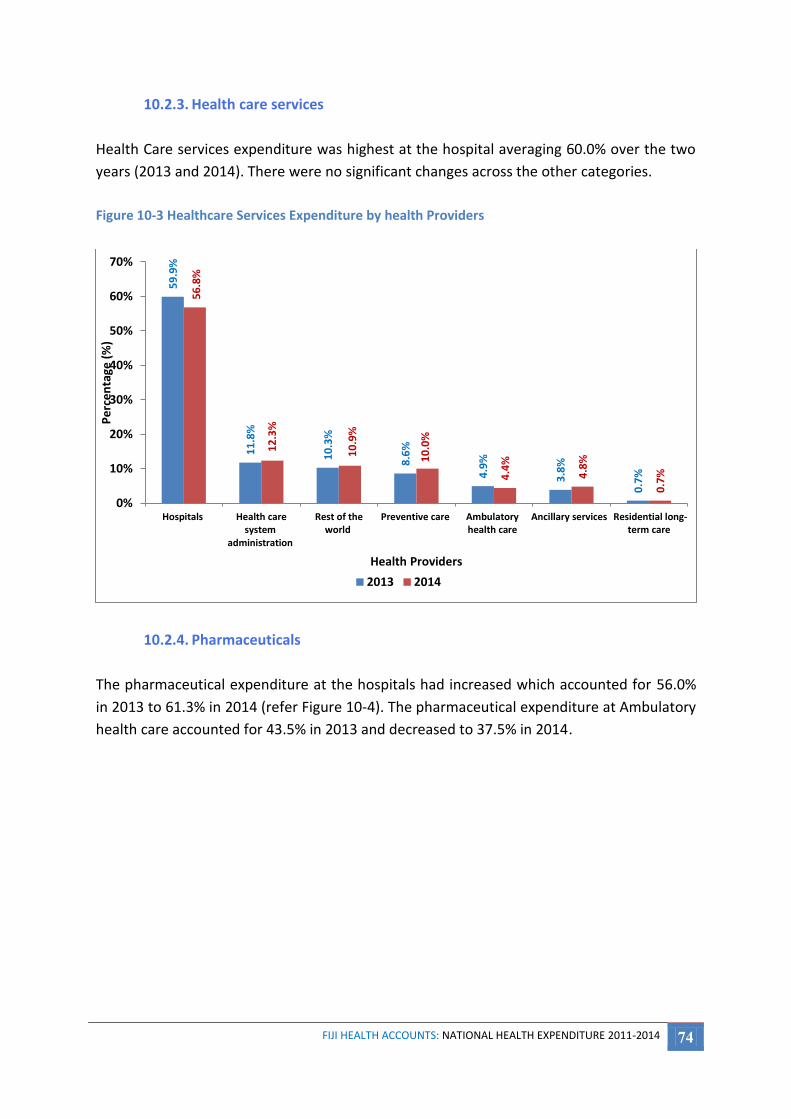
FIJI HEALTH ACCOUNTS: NATIONAL HEALTH EXPENDITURE 2011-2014 74
10.2.3. Health care services
Health Care services expenditure was highest at the hospital averaging 60.0% over the two
years (2013 and 2014). There were no significant changes across the other categories.
Figure 10-3 Healthcare Services Expenditure by health Providers
10.2.4. Pharmaceuticals
The pharmaceutical expenditure at the hospitals had increased which accounted for 56.0%
in 2013 to 61.3% in 2014 (refer Figure 10-4). The pharmaceutical expenditure at Ambulatory
health care accounted for 43.5% in 2013 and decreased to 37.5% in 2014.
59
.9%
11
.8%
10
.3%
8.6
%
4.9
%
3.8
%
0.7
%
56
.8%
12
.3%
10
.9%
10
.0%
4.4
%
4.8
%
0.7
%
0%
10%
20%
30%
40%
50%
60%
70%
Hospitals Health caresystem
administration
Rest of theworld
Preventive care Ambulatoryhealth care
Ancillary services Residential long-term care
Pe
rce
nta
ge (
%)
Health Providers
2013 2014

FIJI HEALTH ACCOUNTS: NATIONAL HEALTH EXPENDITURE 2011-2014 75
Figure 10-4 Pharmaceutical Expenditure by Health Providers
10.2.5. Other health care goods
Health care goods are goods and services purchased by the Provider used in the diagnosis,
treatment or prevention of a disease or other abnormal condition. Hospitals account for
51.4% in 2013 and 53.8% in 2014 followed by Ambulatory health care which accounted for
24.1% in 2013 and 20.8% in 2014. The other Providers shared the remaining costs (refer
Figure 10-5).
Figure 10-5 Other health care goods expenditure by health Providers
56.0%
43.5%
0.4%
0.04%
0.01%
2013 Hospitals
Ambulatory healthcare
Health care systemadministration
Preventive care
Rest of economy
61.3%
37.5%
1.1% 0.1%
2014 Hospitals
Ambulatory healthcare
Health care systemadministration
Preventive care
51
.4%
24
.1%
9.4
%
8.8
%
3.9
%
2.2
%
0.2
%
53
.8%
20
.8%
8.9
%
9.3
%
4.6
%
2.4
%
0.2
%
0%
10%
20%
30%
40%
50%
60%
Hospitals Ambulatoryhealth care
Preventive care Ancillaryservices
Rest ofeconomy
Health caresystem
administration
Residentiallong-term care
Pe
rce
nta
ge (
%)
Health Providers
2013 2014
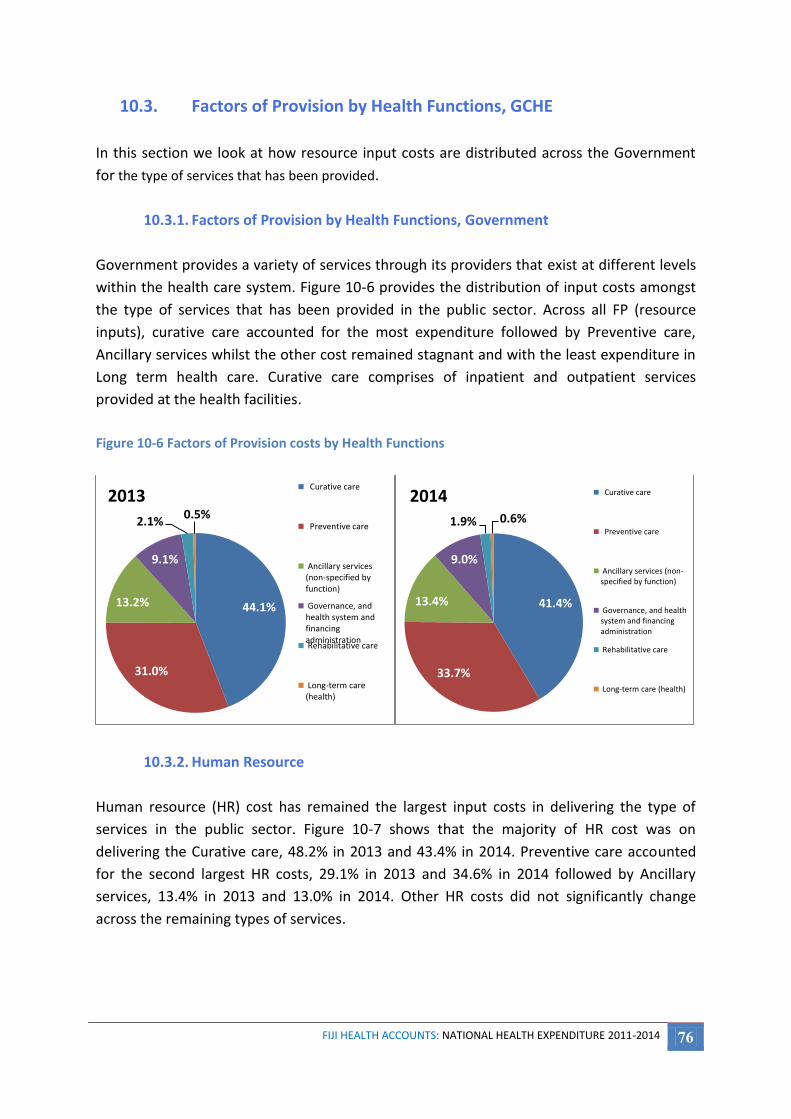
FIJI HEALTH ACCOUNTS: NATIONAL HEALTH EXPENDITURE 2011-2014 76
10.3. Factors of Provision by Health Functions, GCHE
In this section we look at how resource input costs are distributed across the Government
for the type of services that has been provided.
10.3.1. Factors of Provision by Health Functions, Government
Government provides a variety of services through its providers that exist at different levels
within the health care system. Figure 10-6 provides the distribution of input costs amongst
the type of services that has been provided in the public sector. Across all FP (resource
inputs), curative care accounted for the most expenditure followed by Preventive care,
Ancillary services whilst the other cost remained stagnant and with the least expenditure in
Long term health care. Curative care comprises of inpatient and outpatient services
provided at the health facilities.
Figure 10-6 Factors of Provision costs by Health Functions
10.3.2. Human Resource
Human resource (HR) cost has remained the largest input costs in delivering the type of
services in the public sector. Figure 10-7 shows that the majority of HR cost was on
delivering the Curative care, 48.2% in 2013 and 43.4% in 2014. Preventive care accounted
for the second largest HR costs, 29.1% in 2013 and 34.6% in 2014 followed by Ancillary
services, 13.4% in 2013 and 13.0% in 2014. Other HR costs did not significantly change
across the remaining types of services.
44.1%
31.0%
13.2%
9.1%
2.1% 0.5%
2013 Curative care
Preventive care
Ancillary services(non-specified byfunction)
Governance, andhealth system andfinancingadministration Rehabilitative care
Long-term care(health)
41.4%
33.7%
13.4%
9.0%
1.9% 0.6%
2014 Curative care
Preventive care
Ancillary services (non-specified by function)
Governance, and healthsystem and financingadministration
Rehabilitative care
Long-term care (health)
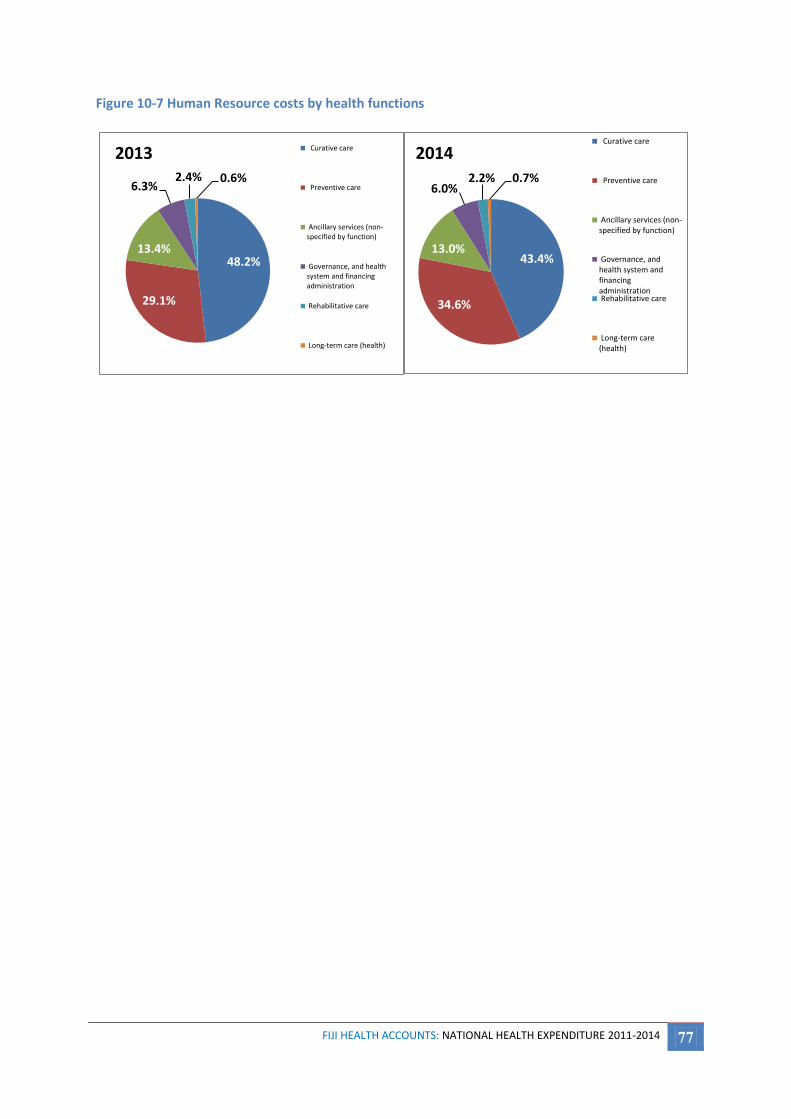
FIJI HEALTH ACCOUNTS: NATIONAL HEALTH EXPENDITURE 2011-2014 77
Figure 10-7 Human Resource costs by health functions
48.2%
29.1%
13.4%
6.3% 2.4% 0.6%
2013 Curative care
Preventive care
Ancillary services (non-specified by function)
Governance, and healthsystem and financingadministration
Rehabilitative care
Long-term care (health)
43.4%
34.6%
13.0%
6.0% 2.2% 0.7%
2014 Curative care
Preventive care
Ancillary services (non-specified by function)
Governance, andhealth system andfinancingadministration Rehabilitative care
Long-term care(health)

FIJI HEALTH ACCOUNTS: NATIONAL HEALTH EXPENDITURE 2011-2014 78
11. Disease Based Costs
The disease costing presented here is based on inpatient and outpatient data from both
public and private sectors.
Patient days (for inpatient analysis) and outpatient visits (for outpatient analysis) coded by
International Coding of Disease 10 Australian Modification (ICD 10 AM) classification were
used to allocate facility expenditure by disease category.
11.1. Expenditure by Disease for Inpatients
11.1.1. Expenditure by Disease for Inpatients
All text based diagnoses have been classified by ICD 10 AM, as this is the standard morbidity
classification used in the public health sector in Fiji. The total inpatient cost of disease for
2013 stood at FJ$45.1m compared to FJ$51.5m in 2014. This was an increase of FJ$6.5m
(14.2%). This increase was mostly in the category of certain infectious and parasitic diseases
(A00-B99) (refer Table 11-1).
At a glance, the largest proportion of the expenditure in 2013 was borne by Pregnancy,
Childbirth and the Puerperium (34.6%), followed by, Diseases of the Respiratory System
(9%), followed by Diseases of the Circulatory System (8.4%).it is important to note that with
greater insight and further analysis, non-communicable diseases accounted for 25% of the
cost of disease in 2013 [this accumulates the total percentages of neoplasms, endocrine,
nutritional and metabolic disorders, mental and behavioural disorders, diseases of the
circulatory system, injury, poisoning and certain other consequences of external causes,
external causes of morbidity and mortality and factors influencing health status and contact
with health services].
The comparison with 2014 yields a similar rank order to 2013. The largest portion of the cost
is attributable to Pregnancy, Childbirth and Puerperium [32.1%]; followed by certain
infectious and parasitic diseases [18.8%] due to frequent disease outbreaks and diseases of
the respiratory tract [11.4%]. However, once again with further analysis, the non-
communicable diseases make up 18% of the total cost of illness.

FIJI HEALTH ACCOUNTS: NATIONAL HEALTH EXPENDITURE 2011-2014 79
Table 11-1 Inpatient Disease-based Cost for 2013 and 2014
ICD 10 AM CODE
ICD 10 AM CODE DESCRIPTION
2013 2014
Amount (FJ$m)
Share (%) Amount (FJ$m)
Share (%)
A00-B99 Certain infectious and parasitic diseases 3.8 8.4% 9.7 18.8%
C00-D48 Neoplasms 1.1 2.5% 0.2 0.5%
D50-D89 Diseases of the blood and blood-forming organs and certain disorders involving the immune mechanism
0.6 1.2% 0.7 1.3%
E00-E89 Endocrine, nutritional and metabolic diseases 1.9 4.2% 1.5 2.9%
F00-F99 Mental, Behavioral and Neurodevelopmental disorders 0.2 0.5% 0.1 0.3%
G00-G99 Diseases of the nervous system 0.6 1.4% 0.4 0.9%
H00-H59 Diseases of the eye and adnexa 0.2 0.4% 0.0 0.1%
H60-H95 Diseases of the ear and mastoid process 0.1 0.2% 0.1 0.2%
I00-I99 Diseases of the circulatory system 3.8 8.4% 4.8 9.4%
J00-J99 Diseases of the respiratory system 4.1 9.0% 5.9 11.4%
K00-K93 Diseases of the digestive system 2.0 4.5% 1.3 2.6%
L00-L99 Diseases of the skin and subcutaneous tissue 2.0 4.4% 3.7 7.1%
M00-M99 Diseases of the musculoskeletal system and connective tissue 0.7 1.5% 0.7 1.4%
N00-N99 Diseases of the genitourinary system 2.2 4.9% 1.6 3.1%
O00-O99 Pregnancy, childbirth and the puerperium 15.6 34.6% 16.5 32.1%
P00-P96 Certain conditions originating in the perinatal period 1.0 2.2% 0.5 1.0%
Q00-Q99 Congenital malformations, deformations and chromosomal abnormalities
0.2 0.5% 0.0 0.1%
R00-R99 Symptoms, signs and abnormal clinical and laboratory findings, not elsewhere classified
1.4 3.1% 1.1 2.2%
S00-T88 Injury, poisoning and certain other consequences of external causes 2.8 6.2% 2.0 3.8%
U50-Y98 External Causes of Morbidity and Mortality 0.1 0.3% 0.1 0.1%
Z00-Z99 Factors influencing health status and contact with health services 0.7 1.5% 0.4 0.8%
Total 45.1 100% 51.5 100%

FIJI HEALTH ACCOUNTS: NATIONAL HEALTH EXPENDITURE 2011-2014 80
Figure 11-1 Inpatient Disease Expenditure by ICD 10AM in 2013 and 2014 as a Percentage
Source: Table 11-1
0%
5%
10%
15%
20%
25%
30%
35%
40%
0.0
2.0
4.0
6.0
8.0
10.0
12.0
14.0
16.0
18.0
O00-O99
A00-B99
J00-J99
I00-I99 L00-L99
S00-T88
N00-N99
E00-E89
K00-K93
R00-R99
M00-M99
D50-D89
P00-P96
G00-G99
Z00-Z99
C00-D48
F00-F99
H60-H95
U50-Y98
Q00-Q99
H00-H59
Pe
rce
nta
ge (
%)
of
Tota
l Co
st
FJ$
m
ICD-10 Disease Classification
2013 Costs 2014 Costs % of 2013 Costs % of 2014 Costs
FIJI HEALTH ACCOUNTS: NATIONAL HEALTH EXPENDITURE 2011-2014 81
The top 5 ranked chapters in terms of cost by ICD 10AM Code in 2013 were O00-O99-
Pregnancy, childbirth and the puerperium , J00-J99 - Diseases of the respiratory system, I00-I99
-Diseases of the circulatory system, A00-B99 -Certain infectious and parasitic diseases, S00-T88
- Injury, poisoning and certain other consequences of external causes. In comparison to 2014,
O00-O99- Pregnancy, childbirth and the puerperium, A00-B99 -Certain infectious and parasitic
diseases, J00-J99 - Diseases of the respiratory system, I00-I99 -Diseases of the circulatory
system and L00-L99 Diseases of the skin and subcutaneous tissue were the top 5 ranked
chapters in terms of cost by ICD 10 AM Code.
11.1.2. Expenditure by Gender
The highest % of total cost borne by females in 2013, was attributed to Pregnancy Childbirth
and Puerperium (54%), followed by Diseases of the Respiratory System (5.9%) and then Certain
Infectious and parasitic Diseases (5.7%). In males the cost attribution was highest in Diseases of
the Circulatory System (14.7%), followed by Diseases of the Respiratory tract (14.6%) and then
Certain Infectious and Parasitic Diseases (13.1%) refer Figure 11-2.

FIJI HEALTH ACCOUNTS: NATIONAL HEALTH EXPENDITURE 2011-2014 82
Figure 11-2 Inpatient Expenditure by Gender and ICD 10AM in 2013
0.0%
10.0%
20.0%
30.0%
40.0%
50.0%
60.0%
-
2.00
4.00
6.00
8.00
10.00
12.00
14.00
16.00
18.00
O0
0 -
O9
9
A0
0 -
B9
9
J00
- J
99
I00
- I9
9
L00
- L
99
N0
0 -
N9
9
E00
- E
89
S00
- T
88
R0
0 -
R9
9
D5
0 -
D8
9
K0
0 -
K9
3
Z00
- Z
99
P0
0 -
P9
6
M0
0 -
M9
9
C0
0 -
D4
8
G0
0 -
G9
9
F00
- F
99
H6
0 -
H9
5
U5
0 -
Y9
8
H0
0 -
H5
9
Q0
0 -
Q9
9
% o
f To
tal C
Ost
(G
en
de
r Sp
eci
fic)
FJ$
m
2013 Costs (Female) 2013 Costs (Male) % 2013 Cost Female % 2013 Cost Male

FIJI HEALTH ACCOUNTS: NATIONAL HEALTH EXPENDITURE 2011-2014 83
The highest % of total cost borne by females in 2014, was attributed to Pregnancy Childbirth
and Puerperium (52%), followed by Certain Infectious and Parasitic Diseases (13%), then
Diseases of the Respiratory System (7.6%). In males the cost attribution was highest in Certain
Infectious and Parasitic Diseases (28.5%), followed by Diseases of the Respiratory tract (17.6%)
and then Diseases of the Circulatory System (14.5%).
For females the trend remained similar, except for reversal of certain infectious and parasitic
diseases and diseases of the respiratory tract in 2014 (from 2013). In males, there was a
resequencing of disease categories where certain infectious and parasitic diseases was leading
in 2014, followed by diseases of the respiratory tract and then diseases of the circulatory
system. Diseases of the circulatory system were the leading cause of inpatient cost in males in
2013, followed by diseases of the respiratory tract and then certain infectious and parasitic
diseases (refer Figure 11-3).

FIJI HEALTH ACCOUNTS: NATIONAL HEALTH EXPENDITURE 2011-2014 84
Figure 11-3 Inpatient Expenditure by Gender and ICD 10AM in 2014
0.0%
10.0%
20.0%
30.0%
40.0%
50.0%
60.0%
0.00
2.00
4.00
6.00
8.00
10.00
12.00
14.00
16.00
18.00
O0
0 -
O9
9
A0
0 -
B9
9
J00
- J
99
I00
- I9
9
L00
- L
99
N0
0 -
N9
9
E00
- E
89
S00
- T
88
R0
0 -
R9
9
D5
0 -
D8
9
K0
0 -
K9
3
Z00
- Z
99
P0
0 -
P9
6
M0
0 -
M9
9
C0
0 -
D4
8
G0
0 -
G9
9
F00
- F
99
H6
0 -
H9
5
U5
0 -
Y9
8
H0
0 -
H5
9
Q0
0 -
Q9
9
% o
f To
tal C
ost
(G
en
de
r Sp
eci
fic)
FJ$
m
2014 Costs (Female) 2014 Costs (Male) % 2014 Cost Female % 2014 Cost Male

FIJI HEALTH ACCOUNTS: NATIONAL HEALTH EXPENDITURE 2011-2014 85
The percentage change in gender by ICD 10AM chapter is demonstrated in Figure 11-4. The
greatest fluctuations are demonstrated in the male gender in certain infectious and parasitic
diseases (158%), diseases of the skin and subcutaneous tissue (88%) factors influencing
health status and contact with health services (85%), neoplasms (82%), Congenital
malformations, deformations and chromosomal abnormalities (77%), diseases of the eye and
adnexa (73%), diseases of the ear and mastoid process (73%) and external causes of
morbidity and mortality (63%). There are also some fluctuations in cost for males noted in
mental, behavioral and neurodevelopmental disorders (27%).
For females the greatest changes in cost were for certain infectious and parasitic diseases
(156%), Congenital malformations, deformations and chromosomal abnormalities (86%),
diseases of the skin and subcutaneous tissues (82%), neoplasms and diseases of the eye and
adnexa (76%), followed by mental, behavioral and neurodevelopmental disorders (56%).
Figure 11-4 Percentage Change by Gender and ICD 10AM between 2013 and 2014
-100
-50
0
50
100
150
200
A0
0 -
B9
9
L00
- L
99
Z00
- Z
99
I00
- I9
9
J00
- J
99
D5
0 -
D8
9
U5
0 -
Y9
8
M0
0 -
M9
9
O0
0 -
O9
9
E00
- E
89
H6
0 -
H9
5
R0
0 -
R9
9
S00
- T
88
G0
0 -
G9
9
N0
0 -
N9
9
K0
0 -
K9
3
P0
0 -
P9
6
F00
- F
99
H0
0 -
H5
9
C0
0 -
D4
8
Q0
0 -
Q9
9
Pe
rce
nta
ge (
%)
% Change in Females % Change in Males

FIJI HEALTH ACCOUNTS: NATIONAL HEALTH EXPENDITURE 2011-2014 86
Figure 11-5 Disease based expenditure as a % of total expenditure for the given gender: 2013
Figure 11-6 Disease based expenditure as a % of total expenditure for the given gender: 2014
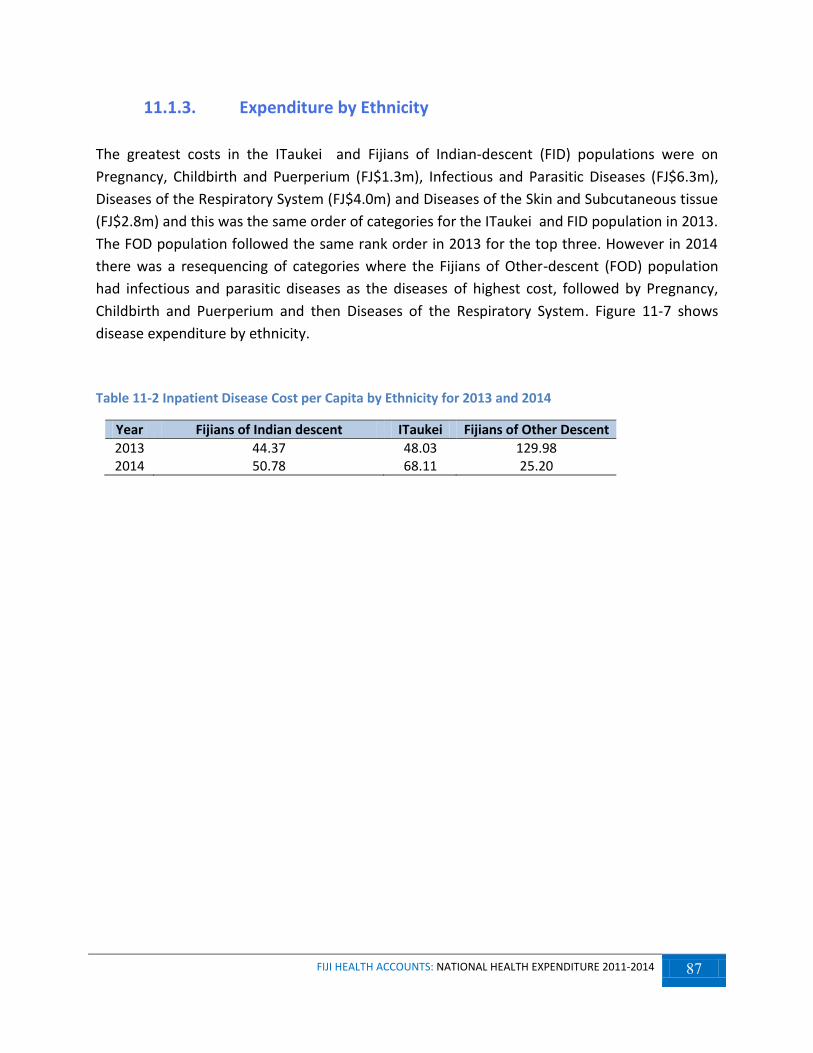
FIJI HEALTH ACCOUNTS: NATIONAL HEALTH EXPENDITURE 2011-2014 87
11.1.3. Expenditure by Ethnicity
The greatest costs in the ITaukei and Fijians of Indian-descent (FID) populations were on
Pregnancy, Childbirth and Puerperium (FJ$1.3m), Infectious and Parasitic Diseases (FJ$6.3m),
Diseases of the Respiratory System (FJ$4.0m) and Diseases of the Skin and Subcutaneous tissue
(FJ$2.8m) and this was the same order of categories for the ITaukei and FID population in 2013.
The FOD population followed the same rank order in 2013 for the top three. However in 2014
there was a resequencing of categories where the Fijians of Other-descent (FOD) population
had infectious and parasitic diseases as the diseases of highest cost, followed by Pregnancy,
Childbirth and Puerperium and then Diseases of the Respiratory System. Figure 11-7 shows
disease expenditure by ethnicity.
Table 11-2 Inpatient Disease Cost per Capita by Ethnicity for 2013 and 2014
Year Fijians of Indian descent ITaukei Fijians of Other Descent
2013 44.37 48.03 129.98 2014 50.78 68.11 25.20

FIJI HEALTH ACCOUNTS: NATIONAL HEALTH EXPENDITURE 2011-2014 88
Figure 11-7 Share of inpatient expenditure by ethnicity and ICD 10AM: 2013 & 2014

FIJI HEALTH ACCOUNTS: NATIONAL HEALTH EXPENDITURE 2011-2014 89
The greatest percentage changes were noted in Infectious and Parasitic Diseases, Diseases of
the Skin and Subcutaneous Tissue and Pregnancy, Childbirth and Puerperium in both 2013 and
2014 in the 2 major ethnicities.
11.1.4. Expenditure by Age Group
The age category 0-4 occupied 8.7% of the total inpatient services related costs in 2014
(0.51% from 2013). The age group 5-9 accounted for 1.7% of inpatient service expenditure in
2014 (50.2% from 2013) (refer to Figure 11.8).
The age group 10-14, accounted for 4.9% % inpatient service expenditure in 2014; there was a
reduction of 186.5% from 2013. Age group 15-19, accounted for 13.8% inpatient service
expenditure in 2014; there was a reduction of 402.7% from 2013.
The age group 20-24, accounted for 14.9% of inpatient service expenditure in 2014 (56.2%
from 2013). The age group 25-29 accounted for accounted for 11.4% of inpatient service
expenditure in 2014,with a subsequent reduction of 9.8% from 2013.
Only 6.32% of total inpatient services expenditure in inpatient service expenditure was
dedicated to the 30-34 year age group in 2014 (39.8% from 2013). The age category 35-39,
accounted for 4.1% of the total inpatient services expenditure in 2014 (43.2% from 2013).
The age category 40-44, accounted for 4.9% of the total inpatient services expenditure in 2014
(9.7% from 2013). The age category 45-49 accounted for 4.5% of the total inpatient services
expenditure in 2014 (6.1% from 2013).
The 50-54 age categories consumed 50.8% of the inpatient service expenditure in 2014
(25.5% from 2013). The.55-59 age category accounted for 5.2% of the inpatient service
expenditure in 2014 ( 12.2% from 2013)
The age category 60-64 occupied 3.47% of total inpatient services cost in 2014. It was observed
that there was a drop of 10.1% in inpatient services expenditure from 2013. For the 65-69 age
categories, only 5% of the total inpatient services expenditure was allocated to this segment in
2014. It was observed that there was an increase of 27.6% in inpatient services expenditure
from 2013 for this segment

FIJI HEALTH ACCOUNTS: NATIONAL HEALTH EXPENDITURE 2011-2014 90
The patients who were 70 years or older, consumed 6.1% of total expenditure in this inpatient
services segment in 2014. When compared to 2013, there was an increase of 4.4% in the
inpatient expenditure.
Figure 11-8 Inpatient services related distribution of costs by Age Group: 2013 & 2014
Figure 11-9 and 11-10 refer to the % distribution by cost for Age Groups by ICD 10AM category. The greatest costs were incurred in the category O00-O99 for both years in the reproductive age group (15-44 age group).
0.0%
2.0%
4.0%
6.0%
8.0%
10.0%
12.0%
14.0%
16.0%
0.00
1.00
2.00
3.00
4.00
5.00
6.00
7.00
8.00
9.00
0-4
5-9
10
-14
15
-19
20
-24
25
-29
30
-34
35
-39
40
-44
45
-49
50
-54
55
-59
60
-64
65
-69
70
plu
s
% o
f To
tal C
ost
FJ$
m
2013 Costs 2014 Costs 2013 % of Total Cost 2014 % of Total Cost

FIJI HEALTH ACCOUNTS: NATIONAL HEALTH EXPENDITURE 2011-2014 91
Figure 11-9 Distribution of Cost by Age Group and ICD 10AM Category for 2013 (FJ$m)
Figure 11-10 Distribution of Cost by Age Group and ICD 10AM Category for 2014 (FJ$m)

FIJI HEALTH ACCOUNTS: NATIONAL HEALTH EXPENDITURE 2011-2014 92
11.2. Expenditure by Disease for Outpatients
Conditions that could not be coded amounted to the largest portion of the outpatient costs.
This is concerning as information given by outpatient providing facilities is not specific enough
to be allocated a code. The challenge remains to capture outpatient encounters to provide
useful evidence for policymakers. This category demonstrated a 54% increase from 2013
Figure 11-11 Outpatient Cost by ICD 10AM: 2013 & 2014
Note: - XXX represents procedural services in outpatient visits where no ICD 10 AM codes was assigned
0.0%
5.0%
10.0%
15.0%
20.0%
25.0%
0.00
2.00
4.00
6.00
8.00
10.00
12.00
14.00
16.00
18.00
20.00
XX
X
Z00
- Z
99
J00
- J
99
I00
- I9
9
M0
0 -
M9
9
L00
- L
99
K0
0 -
K9
3
E00
- E
89
H6
0 -
H9
5
H0
0 -
H5
9
S00
- T
88
O0
0 -
O9
9
A0
0 -
B9
9
N0
0 -
N9
9
U5
0 -
Y9
8
F00
- F
99
P0
0 -
P9
6
C0
0 -
D4
8
% o
f To
tal C
ost
FJ$
m
2013 Costs 2014 Costs % of Total Cost 2013 % of Total Cost 2014

FIJI HEALTH ACCOUNTS: NATIONAL HEALTH EXPENDITURE 2011-2014 93
Figure 11-12 Percentage Change between 2013 and 2014 by ICD 10AM
11.2.1. Outpatients Costs by Ethnicity
The highest cost was accounted for by Fijians of Indian Descent, followed by the iTaukei and
then Fijians of Other Descent for both 2013 and 2014. However there were increases in costs
for FID (27%) and FOD (6%). Alternatively, the IT population demonstrated a 0.2% decrease
in costs in the reporting period.
67
54
26 22 21 21 19 17
-5 -6 -9 -11 -12 -15 -16 -19 -20 -27
-40
-20
0
20
40
60
80
H0
0 -
H5
9
XX
X
K0
0 -
K9
3
I00
- I9
9
M0
0 -
M9
9
F00
- F
99
L00
- L
99
J00
- J
99
C0
0 -
D4
8
E00
- E
89
U5
0 -
Y9
8
S00
- T
88
N0
0 -
N9
9
A0
0 -
B9
9
O0
0 -
O9
9
Z00
- Z
99
H6
0 -
H9
5
P0
0 -
P9
6
% Change

FIJI HEALTH ACCOUNTS: NATIONAL HEALTH EXPENDITURE 2011-2014 94
Figure 11-13 Cost breakdown by Ethnicity comparative 2013 & 2014
Table 11-3 Outpatient Disease Cost per Capita by Ethnicity for 2013 and 2014
Year Fijians of Indian descent ITaukei Fijians of Other Descent
2013 116.02 57.97 51.41 2014 149.58 57.14 53.35
11.2.2. Outpatients Costs by Gender
The percentage distribution of costs between females and males, were 72 and 28% for 2013
and 66 and 24% in 2014, respectively. The greatest outpatient costs were borne by the female
gender. However between the years the costs % increase in costs for females was 4%; there
was also an increase in costs among males between 2013 and 2014 by 39%.
56%
40%
4%
50%
45%
4%
0%
10%
20%
30%
40%
50%
60%
Fijian of Indian ITaukei Other
Pe
rce
nta
ge (
%)
Ethnicity
2014 2013

FIJI HEALTH ACCOUNTS: NATIONAL HEALTH EXPENDITURE 2011-2014 95
Figure 11-14 Percentage distribution of OPD Expenditure by Gender and ICD 10AM: 2013-2014
The greatest % cost was attributed to external causes of morbidity and mortality for both
genders for both years. Diseases of the circulatory systems and diseases of the eye and adnexa,
endocrine, nutritional and metabolic diseases ranked among the top five for males in % cost in
the OP setting.
Female costs, apart from external causes of morbidity and mortality, were also attributed to
diseases of the respiratory system, certain conditions originating in the perinatal period,
diseases of the eye and adnexa and diseases of the circulatory system (as the top five).

FIJI HEALTH ACCOUNTS: NATIONAL HEALTH EXPENDITURE 2011-2014 96
12. Technical Notes
This section describes the technical aspects related to the production of this FJHA report.
These technical aspects describe the estimation and data collection techniques used to
estimate the financial figures reported in this document. This report presents the Fiji
National Health Accounts expenditure for the years 2012 to 2014 using the SHA 2011
classification system.
The transition to the SHA 2011 classification continue to present many challenges (discussed
at the end of this chapter) to the compilation of this report and different approaches and
estimation methods were used in situations where the data available or collected was not
sufficient in detail to meet the detailed reporting requirements of the SHA 2011
classification. However there have been some improvements in estimation techniques since
our first attempt at the SHA 2011 methodology (used in the 2011 & 2012 NHA report). Thus
readers will note that expenditure figures reported here for the years 2011 & 2012 differ
from that presented in the last NHA report for the years 2011 & 2012.
Certainly, estimation techniques and approaches will continue to improve over time, and
expenditure numbers will be further refined as methods improve and the SHA 2011
classification is institutionalized.
12.1. Fiji SHA 2011 Classifications
To develop the Fiji SHA 2011 classification, the NHA committee first looked at the
international SHA 2011 classification skeletal structure. The committee also looked at the
Fiji SHA 1.0 classification structure that was used in NHA reports for the years 2007 to 2010.
The SHA 1.0 was first mapped to the international classification and then this was
contextualized to Fiji’s reporting needs and the Fiji SHA 2011 classification was developed.
Contextualized meant that sub-categories were created where the Country saw it important
that certain expenditure be reported separately. For example all government hospitals and
health centres were created as sub-categories in the Fiji SHA 2011 health provider
classification.
12.2. Government data sources
Government data was primarily obtained from the following sources:
FMIS data from the MoF
Patient utilization data from the Health Information Unit for the MoHMS
Pharmaceutical data from the Fiji Pharmaceutical & Biomedical Services
FIJI HEALTH ACCOUNTS: NATIONAL HEALTH EXPENDITURE 2011-2014 97
Expert opinions from various staff of the MoHMS
National macro-economic data was obtained from the Fiji Bureau of Statistics
Health expenditure data from other Government Ministries
12.2.1. Financial Data
The audited financial data for the years 2013 and 2014 was obtained from the Ministry of
Finance. Data was extracted in the raw form directly out of the Financial Management
Information System (FMIS). This raw data had expenditures by actual transaction line items
and linked to an accounting code (GL code). This GL code was the basis on which
expenditure was mapped to the Fiji SHA 2011 classification system codes. GL codes that
contained expenditure that needed distribution to more than one classification code was
distributed based on various rules of allocation. In most cases the rules of allocation either
used past year’s actual expenditure distributions or expert opinion.
12.2.1.1. Patient utilization data
Inpatient and Outpatient data were obtained from several databases at the Health
Information Unit of the Ministry of Health. These databases included:
Patient Information System (PATIS)
Public Health Information System (PHIS)
Hospital Discharge Data (HDD)
Hospital Monthly Returns (HMR)
National Notifiable Disease Surveillance System (NNDSS)
12.2.1.2. Disease-based data
Inpatient disease data coded by ICD-10 classification was obtained from the Health
Information Unit for the years 2013 and 2014. This data was a combination of all patient
information system databases (see list in 11.2.1.1).
12.2.1.3. Macro level data
This data was obtained from the Fiji Bureau of Statistics latest issue of Key National Statistics
2015. These data include Gross Domestic Product, Total government spending and
population figures.

FIJI HEALTH ACCOUNTS: NATIONAL HEALTH EXPENDITURE 2011-2014 98
12.2.2. Data estimation techniques
Various estimation techniques were used to enable mapping of Public sector expenditure to
the Fiji SHA 2011 classification. These are discussed below.
12.2.2.1. Revenues of Financing Schemes (FS) and Financing Schemes (HF)
The GL codes in the financial raw data, in most cases, were able to classify the schemes and
revenue sources. In cases where GL codes were insufficient to identify sources or schemes,
financial officers (mainly the senior accountants and managers) from both the MoHMS and
the MoF were consulted. Coding of sources and schemes was not too difficult considering
that the public health system is largely Government financed through tax revenue.
12.2.2.2. Health Providers (HP)
The GL codes in the FMIS system allowed mapping of some expenditures directly to public
hospitals and health centres. This means that each hospital or health centre has its own
unique GL code. This was not the case with Nursing Stations (apart from those nursing
stations in the maritime zones) which were all clustered under one GL code. Thus most
expenditure for Nursing Stations was lumped together under one HP classification code
since it was difficult to disaggregate individual expenditures by each Nursing Station.
GL codes in the FMIS system that represented individual public health programs were
mapped to created classification codes under section HP.6 of the Fiji SHA classification.
There were cases where one GL code represented expenditure for more than one provider
and where these providers had individual mapping codes in the HP classification. In these
cases discussions with financial officers and program managers enabled a percentage
distribution rule that was used to distribute expenditures to providers.
There were cases where separation was not possible and the team had to decide to which
provider in the classification the expenditure was coded to. For example some Nursing
Stations expenditure was locked under the GL code of the nearest Health Centre. However
there was no way to estimate what this Nursing station expenditure might have been and
thus this was left coded to the Health Centre rather than to the HP code for Nursing
Stations.
The Fiji Pharmaceutical and Biomedical Service (FPBS) expenditure was attached to one GL
code however FPBS is not a provider in the Fiji SHA classification. FPBS expenditure (mainly
government spending on drugs, consumables and durable medical goods) was distributed
across health providers in the HP classification using drugs distribution (includes

FIJI HEALTH ACCOUNTS: NATIONAL HEALTH EXPENDITURE 2011-2014 99
consumables) percentages as allocation keys. The drugs distribution database was accessed
from FPBS.
12.2.2.3. Health Functions (HC)
The Fiji financial management information system (GL codes) cannot separate expenditures
by functions as outlined in the functional classification.
In the case of expenditure on Curative Services (HC.1), for a small number of facilities this
was obtained by using the percentage distribution of unit costs presented in a previous
facility costing study (Irava et. al 2010) since this was at present the best source of data.
For other facilities consultations were held with Divisional and Sub-divisional doctors and
nurses on a percentage distribution of costs across the functional classification. The same
was done for public health programs where program managers and officers were asked to
distribute their expenditure across the functional classification mainly the category
Preventive Care (HC.6). Expert Opinion was predominantly used in most cases.
12.2.2.4. Capital Expenditure (HK)
The SHA 2011 guidelines report capital expenditure in a separate classification from current
expenditure. Capital expenditure was identified by specific GL codes that represented all
capital related expenditure. At this stage capital expenditure only included capital
acquisitions and purchases during the reported period. Changes in inventories, capital
consumption and disposable of assets were not accounted for.
12.2.2.5. Disease-based expenditure
Allocation key for inpatient expenditure distribution to diseases was patient bed days.
Allocation key for outpatient expenditure distribution was number of outpatient visits.
12.3. Private Sector data
Private data was primarily obtained from the Surveys of private health providers and
stakeholders. Secondary reports and documents such as Annual reports (when available and
accessible) were also used to clarify or verify reported expenditures. The response rates of
the various private sector surveys conducted are shown in Table 1 for the years 2010, 2012
and 2014. Some providers have increased their response rates while others have declined.
Based on the survey questions, health spending (using a revenue approach) was calculated
in four different ways – daily, weekly, monthly and annually. This is shown in detail in Table

FIJI HEALTH ACCOUNTS: NATIONAL HEALTH EXPENDITURE 2011-2014 100
2. On comparing the four different figures, we found that the monthly and annual
estimations were more realistic and thus the higher of the two values were used as the final
health expenditure for the health providers.
Table 1: Response rates of surveys of the private sector
Name Surveyed
population 2010
Surveyed population
2012
Surveyed population
2014
Response Rates (%)
2010 2012 2014
General Practitioners 127 148 126 54 80 78
Private Dentist 35 37 33 35 81 85
Retail Pharmacies 54 55 58 54 56 66
Private Hospitals 1 2 2 100 100 100
Private Employers 0 17 27 57 24 52
Private Laboratory and X-Ray 3 2 2 67 50 100
Private Insurance 10 4 4 30 50 50
Private Optometrists 15 14 15 67 71 80
Development Partners 14 13 18 71 54 28
NGO’s 29 19 25 3 5 0
Table 2: Revenue estimations of private sector surveys
Daily revenue Calculated using average fee per patient multiplied by total number of patients seen in a year
Weekly revenue Average number of patient per week multiply by 50 weeks (here assuming 2 weeks closure in the year) to get total number of patients and then multiply by average consulting fees per patient
Monthly revenue Average revenue reported per month multiplied by 12 months
Annual revenue Annual revenue reported in survey
In the case of the non-responses from private doctors, dentists, optometrists, and
pharmacies health expenditure was estimated using the average expenditure of those that
responded by geographical region (Central, Western and Northern). This expenditure was
then distributed across sources, schemes and functions based on the total percentage
distributions presented by those who responded.
No estimations were done for employers, insurance companies, private ancillary services,
private hospital, and development partners. Those who responded were included and those

FIJI HEALTH ACCOUNTS: NATIONAL HEALTH EXPENDITURE 2011-2014 101
that did not respond were excluded (these were providers after several attempts failed to
respond).
Data received in the private surveys were compared with
- aggregate revenue data obtained from FRCA across the different providers
- the insurance survey results were compared with data presented in the Reserve
Bank of Fiji annual insurance reports
- total out-of-pocket expenditure reported in surveys was compared with out-of-
pocket reported in the last HIES survey and adjusting for inflation
In certain cases it was difficult to remove instances where double-counting was suspected.
In these instances expenditure was included with the assumption made that the double-
counts would be off-set both by the non-responses (e.g. development partners, non-
governmental organizations, employers, etc.) and with the under reporting suspected of
those that responded (especially private doctors, dentists, eye care and pharmacies).
12.3.1. Private Sector survey limitations
There were various limitations in the private sector surveys that should be noted here, and
must be considered when interpreting the health expenditure numbers presented of the
private sector.
The low response rates from across the providers but especially from development
partners, non-governmental organizations (NGOs), and employers means that the
expenditures reported here are likely under-reported. Donor and NGO response rates
are at their lowest this round in comparison to previous rounds of NHA surveys.
Unfortunately many who responded either provided responses that were incomplete,
inaccurate or deliberately flawed. Thus data cleaning and verification was a long process
and required several follow-ups with respondents to clarify received data. Estimations
were used to replace deliberate flawed data when follow-ups to respondent were
unsuccessful.
The survey questionnaires could have been better designed. The shift to SHA 2011
reporting guidelines meant that previous survey questionnaires had to be redesigned to
capture new data. There were no exemplary surveys available for the team to follow and
thus the team designed and developed their own questionnaires. A tight time schedule
also resulted in the questionnaires not being properly pilot tested.

FIJI HEALTH ACCOUNTS: NATIONAL HEALTH EXPENDITURE 2011-2014 102
12.4. Lessons learnt
This section details the lessons learnt from the entire process during the production of this
NHA report.
The membership of the committee needs to extend to include representatives from the
private sector and development partners. This may help in improving survey response
rates.
The involvement of the Ministry of health finance team would allow feedback with
regards to improving the recording and allocation of expenditures, as well as provide
clarity to the NHA committee on how funds are allocated and expended.
There needs to be better management and coordination with regards to the surveys of
the private sector. A more systematic process towards recruiting enumerators, training
them on the surveys, remuneration and reporting of collected data needs to be
established to allow smooth execution of the surveys. Improved communication and
establishment of relationships between professional bodies such as the Fiji Medical
Council, Fiji Dental council, etc. needs to be strengthened. A stronger case with regards
to confidentiality of information and the usefulness of the NHA report to the private
sector needs to be made.
There is a possibility to tag the reporting of health information needed for the NHA
report to the registration of medical doctors and dentists. This would help simplify the
survey process of the private sector and perhaps in the long term provide a routine data
source for the private sector (without the need to run surveys).
There still needs to be increased awareness created amongst both the private and
government sectors on the purpose and usefulness of the NHA report. Education and
advocacy workshops should be organized with invitations sent out to all private health
providers and organizations included in providing some health service (primary or
secondary providers) in the country. The intention to develop more policy briefs from
the current report will further increase the awareness and usefulness of the report
amongst the executive management of the MoHMS.
Institutional memory of the NHA process needs to documented and captured. This
would make easy the future production of NHA by giving clarity to future committee
members on what procedures and estimation techniques was employed in past
productions of NHA.

FIJI HEALTH ACCOUNTS: NATIONAL HEALTH EXPENDITURE 2011-2014 103
The mapping of raw financial data to the SHA-2011 classifications was not straight
forward. Some of the limitations had to do with the way in which the FMIS system
recorded and captured the data. A discussion between the MoHMS and the Finance
Ministry needs to happen where requests should be made that all health providers be
given the status of cost centres in the system. This is not impossible since 80% of
providers currently exist as such in the FMIS system. This would allow direct mapping of
expenditures of health providers to the provider classification in SHA-2011.
A more standard methodology needs to be established with regards to how data is
coded to the functional categories for various health providers and public programs. If
costing studies are one of these ways, then more up to date costing of facilities needs to
be undertaken to provide unit costs for the functional categories.
In the case of Fiji, the financing schemes (the major change in SHA-2011) provided little
advantage or improvement from SHA 1 since the health financing system in the country
is largely government taxed financed. The mapping between revenue sources and
financing schemes was easy to undertake.

FIJI HEALTH ACCOUNTS: NATIONAL HEALTH EXPENDITURE 2011-2014 104
13. Bibliography and References
Annual Reports 2007 to 2014, Ministry of Health and Medical Services
Costing Study of Selected Health Facilities in Fiji 2010, Ministry of Health and Medical Services, Fiji
Fiji Budget Estimates Reports 2005 - 2014, Ministry of Finance, Fiji
Fiji Health Accounts 2007 – 2010 using SHA 1.0, Ministry of Health and Medical Services, Fiji
Fiji Health Accounts 2011 – 2012 using SHA 2011, Ministry of Health and Medical Services, Fiji
Fiji Key Statistics – December 2014, Fiji Bureau of Statistics, Ministry of Strategic Planning, National Development and Statistics, Fiji
Health Financing Strategy for the Asia Pacific Region (2010-2015), WHO 2009
National Research Council. (2010). Accounting for Health and Health Care: Approaches to Measuring the Sources and Costs of Their Improvement. Panel to Advance a Research Program on the Design of National Health Accounts, Committee on National Statistics. In N. R. Council, & D. o. Education (Ed.), Washington DC, USA: National Academies Press (US) OECD. 2000. A System of Health Accounts. Paris, France: Organisation for Economic Co-operation and Development
OECD. A System of Health Accounts. Paris 2011 Edition, France: Organisation for Economic Co-operation and Development
OECD Health Division. (2013, December). Extension of work on expenditure by disease, age and gender: EU CONTRIBUTION AGREEMENT 2011 53 01. Retrieved September 22nd, 2015, from www.oecd.org/health: http://www.oecd.org/els/health-systems/Extension-of-work-on-expenditure-by-disease-age-and-gender_Final-Report.pdf The World Health Report 2010: Health systems financing: the path to universal coverage, WHO 2010
World Health Organization. 2003. Guide to producing national health accounts: with special applications for low-income and middle-income countries. Geneva, Switzerland: World Health Organization

FIJI HEALTH ACCOUNTS: NATIONAL HEALTH EXPENDITURE 2011-2014 105
14. Glossary Definition of Terms used in this report
Ambulatory health care relates to procedures and treatments that are provided at private clinics by General Practitioners, dentists, optometrists’ etc. and health centres and nursing stations at Government facilities
Ancillary services are services such as X-Ray, Laboratory and patient transportation
Beneficiary characteristics of those who receive the health care goods and services or benefit from those activities (beneficiaries can be categorized in many different ways, including their age and gender, their socio economic status, their health status and their location) Capital expenditure is the construction or expansion of health facilities and purchase of medical equipment or ICT equipment that helps in the production of health services
Capital formation the types of assets that health providers have acquired during the accounting period and that are used repeatedly or continuously for more than one year in production of health services
Clinical Services means types of procedure or a series of such procedures such as diagnostic, therapeutic, rehabilitative, or palliative services that are provided by a facility to patients. This may be synonymous with curative care
Constant (Real) value relates to Gross domestic product (GDP) at current price deflated by price index of goods and services. It is also called real value Curative care is a combination of inpatient care and outpatient care. Curative care refers to treatment and therapies provided to a patient
Current (Nominal) value relates to Gross domestic product (GDP) at current prices which means GDP at prices of the current
reporting period. It is also called nominal value Current Health Expenditure final consumption expenditure of resident units on health care goods and services excluding capital expenditure on health care Day Curative Care includes only day cases of non-rehabilitative services within the same day Factors of production the types of inputs used in producing the goods and services or activities conducted in the health boundary
Financing agents are institutional units that manage health financing schemes Governance, health system and financing administration are administration of government policy; the setting of standards; the regulation, licensing or supervision of producers; management of the fund collection; and the administration, monitoring and evaluation of such resources, etc. Government current health expenditure is similar to current health expenditure provided by public (Government) sector
Gross capital formation in the health care system is measured by the total value of the assets that providers of health services have acquired during the accounting period (less the value of the disposals of assets of the same type) and that are used repeatedly or for more than one year in the provision of health services Gross Domestic Product is the market value of all officially recognized final goods and services produced within a country in a given period of time. Gross fixed capital formulation in the health care system is measured by the total value of the assets that providers of health services have acquired during the accounting period (less the value of the disposals of assets of the same type) and that are used repeatedly or

FIJI HEALTH ACCOUNTS: NATIONAL HEALTH EXPENDITURE 2011-2014 106
for more than one year in the provision of health services.
Health Care Functions relates to the type of services that has been provided Health care goods these are goods and services purchased by the provider used in the diagnosis, treatment or prevention of a disease or other abnormal condition. E.g. are pharmaceuticals, consumables, vaccines etc. Health care services these are services purchased by the health provider to complement the package of services offered within the same unit. E.g. travel, cartage and telephone expenses Health Financing Schemes components of a country’s health financial system that channel revenues received and use those funds to pay for, or purchase, the activities inside the health accounts boundary Health Functions the types of goods and services provided and activities performed within the health accounts boundary Health Providers are entities, organizations or units that receive money in exchange for or in anticipation of producing goods and services as their primary activity as well as those for which health care provision is only one among a number of activities Hospitals comprise licensed establishments that are primarily engaged in providing medical, diagnostic and treatment services that include physician, nursing and other health services to inpatients and the specialized accommodation services required by inpatients. In public sector hospitals includes major hospitals, specialized hospitals, and subdivisional hospitals and in private sector all private hospitals Household out of Pocket are payments done by a group or family or individuals directly from personal the personal funds Household provision of health care is the provision of health care services not only
takes place in health care facilities, but also in private households, where care for the sick, disabled or elderly is provided by family members Households are a group or family or individuals of the country Infrastructures in the health care system are components, residential and non-residential building and other structures Inpatient curative care includes stay overnight of non-rehabilitative services and excludes hospital day-care and home-based hospital treatment Intellectual property products are the result of research, development, investigation or innovation leading to knowledge that the developers can market or use their own benefit production because use of knowledge is restructured by mean of legal or other productions.
Internal transfer and grants - transfer: includes revenues allocated to government schemes which may be an internal transfer within the same level of government or a transfer between central and local governments, Grant: includes: grants by central government to local government financing schemes Machinery and equipment used in hospital for delivery of health services
Medical goods relates to both pharmaceutical goods and therapeutic appliances
Neoplasms a new and abnormal growth of tissue in some part of the body
Non-health care services and Non-health care goods these are goods and services used for health care production, but of a non-specialized health nature. They are of a general nature such as those required in the operational activities of the provider, as in management offices (e.g. software, pens and paper), kitchens (in hospitals and to supply to overnight patients if they are not outsourced

FIJI HEALTH ACCOUNTS: NATIONAL HEALTH EXPENDITURE 2011-2014 107
services), transport (e.g. oil and tools to operate vehicles) or other types of more general usage, such as electricity, water and the like. Non-produced non-financial assets in health care system relates to land purchase and development
Occupational health care expenditure is the sum of expenditures incurred by corporations, general Government and non-profit organisations on the provision of occupational health care. Occupational health care includes the surveillance of employee health (routine medical check-ups) and therapeutic care (including emergency health care services) on or off business premises Other health care goods includes all medicines and pharmaceutical products such as vaccines and serum and other consumable goods, such as cotton, wound dressings and tools used exclusively or mainly at work, for example, clothing or footwear worn exclusively or mainly at work (such as protective clothes and uniforms)
Outpatient Curative Care includes general medical services provided on day care basis Per Capita for each person taken individually Preventive care is any measure that aims to avoid the occurrence or the severity of injuries and diseases and their complications. Preventive medicine or preventive care consists of measures taken to prevent diseases, rather than curing them or treating their symptoms
Primary health care services first level health services provided at a health facility e.g. health centres or sub-divisional hospital
Private Current health expenditure is similar to current health expenditure provided by private sector
Products the various goods and services provided by the providers, including the non-
health care goods and services produced and consumed Public Sector Investment Programs are capital programs allocated in Government budget for construction, maintenance & refurbishment of facilities, purchase of medical equipment and ICT equipment
Rehabilitative care is the care provided to patients with the intention of curing their disease or improving their condition.
Residential and non-residential building acquired less those disposed by health care providers are included in the category. Example is nursing and residential care facilities, hospital setting and ambulatory facilities.
Residential long-term care facilities comprises establishments that are primarily engaged in providing residential long-term care that combines nursing, supervisory or other types of care as required by the residents Rest of the economy refers to industries or organizations that offer health care as a secondary activity or promote health with a multi-sectorial approach but do not provide health care services Rest of the World represents development partners or donors or foreign Governments who provides health services to residents
Retailers and other providers of medical goods relates to retail pharmacies, retail sellers and other suppliers of durable medical goods and appliances
Revenues of financing schemes provides information from whom the revenue is provided for health care
Therapeutic appliances such as spectacles, hearing aids, orthopedic appliances
Total Government Expenditure means expenditure by general Government
FIJI HEALTH ACCOUNTS: NATIONAL HEALTH EXPENDITURE 2011-2014 108
Total Government Health Expenditure relates to combination of both current health expenditure plus capital expenditure provided by Government
Trade in health imports of health care goods and services provided to residents by nonresident providers, and exports of health care goods and services provided to non-residents by resident providers Transfers distributed by government from foreign origin refers to allocation of funds by Government from the aid or donated funds received Transfers from government domestic revenue (allocated to health purposes) refers to allocation of funds by Government through general tax Voluntary payments refers to payments done at one’s free choice
Voluntary prepayment refers Voluntary premiums or payments received from the households or other institutional units to secure an entitlement to benefits. Eg premiums received from an insurer to secure benefits of the voluntary health insurance schemes

FIJI HEALTH ACCOUNTS: NATIONAL HEALTH EXPENDITURE 2011-2014 109
15. Appendix
_________________________
Matrices _________________________

FIJI HEALTH ACCOUNTS: NATIONAL HEALTH EXPENDITURE 2011-2014 110
Table 1: Current Health Expenditure of Revenue sources by financing schemes, 2013
Government
schemes
Voluntary health
insurance schemes
(a+b)
Employer-based
insurance (a)
Other primary
coverage schemes
(b)
NPISH financing schemes
Household out-of-pocket
payment
Rest of the world financing schemes
(non-resident)
Total Percentage
Transfers from government domestic revenue (allocated to health purposes)
156.43 - - - - - - 156.43 58.4%
Transfers distributed by government from foreign origin 2.46 - - - - - - 2.46 0.9%
Voluntary prepayment - 20.12 13.84 6.29 - 74.63 - 94.75 35.4%
Voluntary prepayment from individuals/households - 6.29 - 6.29 - 74.63 - 80.91 30.2%
Voluntary prepayment from employers - 13.84 13.84 - - - - 13.84 5.2%
Other domestic revenues n.e.c. - - - - 3.23 - - 3.23 1.2%
Other revenues from NPISH n.e.c. - - - - 3.23 - - 3.23 1.2%
Direct foreign transfers - - - - - - 10.87 10.87 4.1%
Direct foreign transfers - - - - - - 10.87 10.87 4.1%
Total 158.89 20.12 13.84 6.29 3.23 74.63 10.87 267.75 100.0%
Percentage 59.3% 7.5% 5.2% 2.3% 1.2% 27.9% 4.1% 100.0%
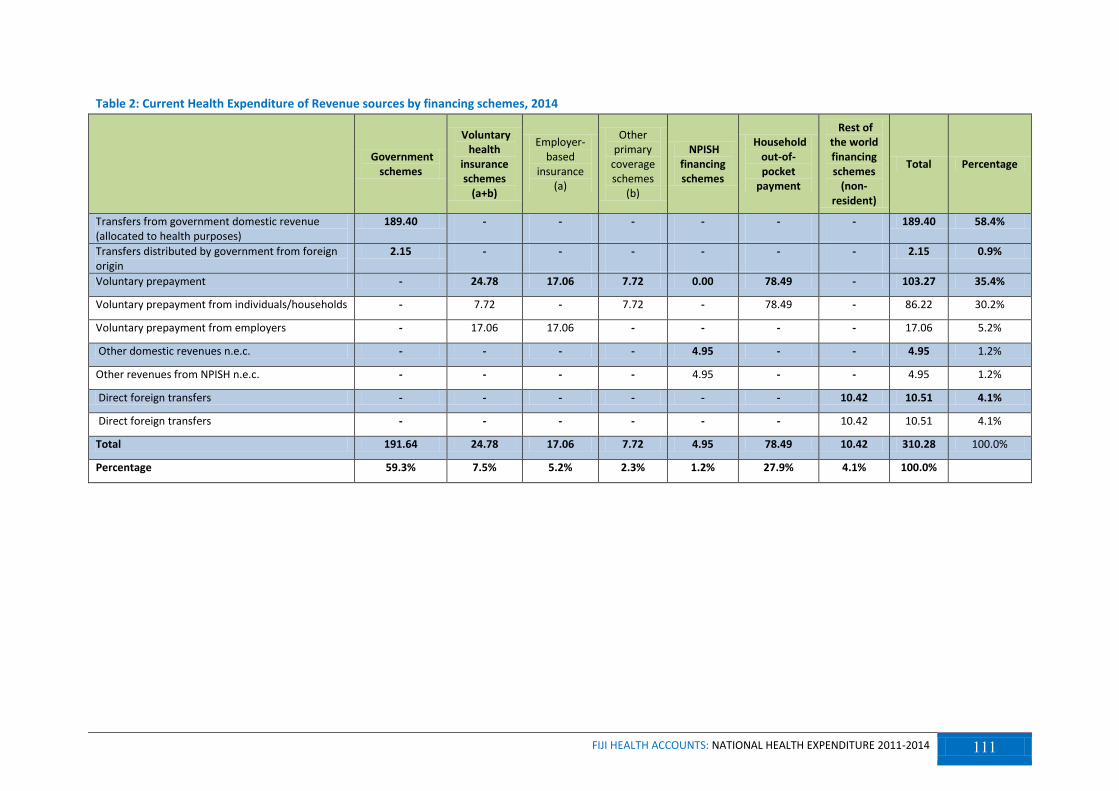
FIJI HEALTH ACCOUNTS: NATIONAL HEALTH EXPENDITURE 2011-2014 111
Table 2: Current Health Expenditure of Revenue sources by financing schemes, 2014
Government
schemes
Voluntary health
insurance schemes
(a+b)
Employer-based
insurance (a)
Other primary
coverage schemes
(b)
NPISH financing schemes
Household out-of-pocket
payment
Rest of the world financing schemes
(non-resident)
Total Percentage
Transfers from government domestic revenue (allocated to health purposes)
189.40 - - - - - - 189.40 58.4%
Transfers distributed by government from foreign origin
2.15 - - - - - - 2.15 0.9%
Voluntary prepayment - 24.78 17.06 7.72 0.00 78.49 - 103.27 35.4%
Voluntary prepayment from individuals/households - 7.72 - 7.72 - 78.49 - 86.22 30.2%
Voluntary prepayment from employers - 17.06 17.06 - - - - 17.06 5.2%
Other domestic revenues n.e.c. - - - - 4.95 - - 4.95 1.2%
Other revenues from NPISH n.e.c. - - - - 4.95 - - 4.95 1.2%
Direct foreign transfers - - - - - - 10.42 10.51 4.1%
Direct foreign transfers - - - - - - 10.42 10.51 4.1%
Total 191.64 24.78 17.06 7.72 4.95 78.49 10.42 310.28 100.0%
Percentage 59.3% 7.5% 5.2% 2.3% 1.2% 27.9% 4.1% 100.0%
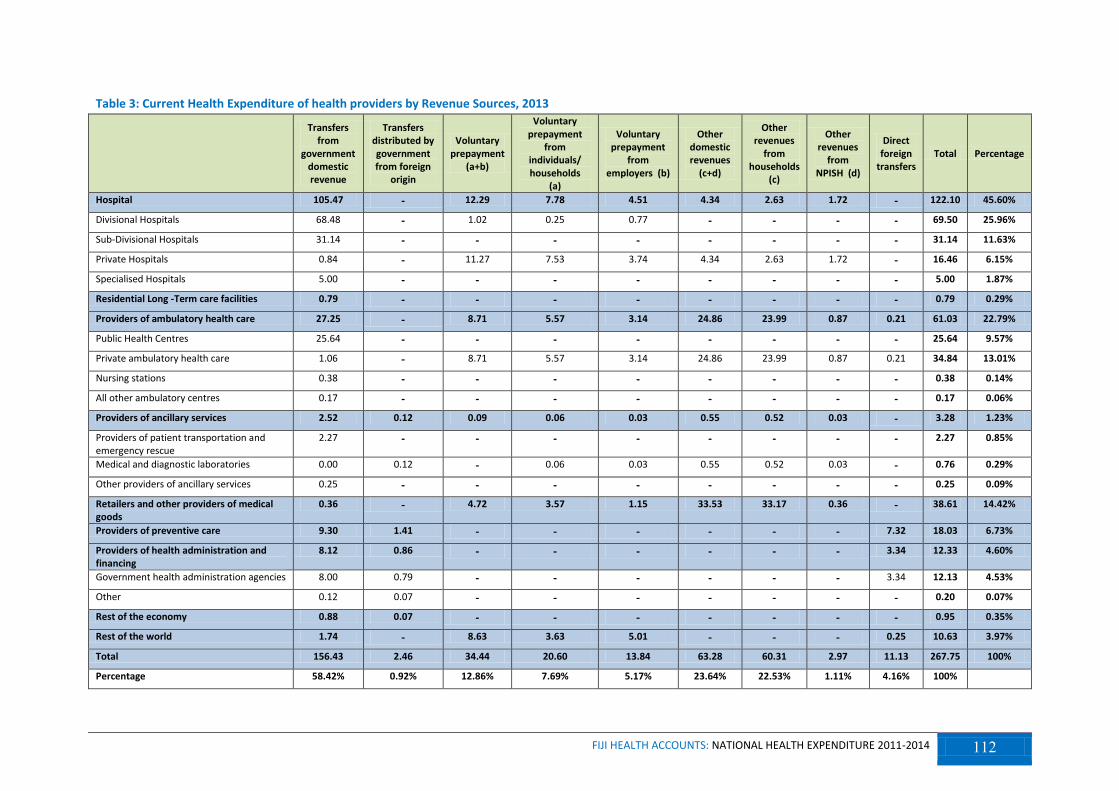
FIJI HEALTH ACCOUNTS: NATIONAL HEALTH EXPENDITURE 2011-2014 112
Table 3: Current Health Expenditure of health providers by Revenue Sources, 2013
Transfers from
government domestic revenue
Transfers distributed by government from foreign
origin
Voluntary prepayment
(a+b)
Voluntary prepayment
from individuals/ households
(a)
Voluntary prepayment
from employers (b)
Other domestic revenues
(c+d)
Other revenues
from households
(c)
Other revenues
from NPISH (d)
Direct foreign
transfers Total Percentage
Hospital 105.47 - 12.29 7.78 4.51 4.34 2.63 1.72 - 122.10 45.60%
Divisional Hospitals 68.48 - 1.02 0.25 0.77 - - - - 69.50 25.96%
Sub-Divisional Hospitals 31.14 - - - - - - - - 31.14 11.63%
Private Hospitals 0.84 - 11.27 7.53 3.74 4.34 2.63 1.72 - 16.46 6.15%
Specialised Hospitals 5.00 - - - - - - - - 5.00 1.87%
Residential Long -Term care facilities 0.79 - - - - - - - - 0.79 0.29%
Providers of ambulatory health care 27.25 - 8.71 5.57 3.14 24.86 23.99 0.87 0.21 61.03 22.79%
Public Health Centres 25.64 - - - - - - - - 25.64 9.57%
Private ambulatory health care 1.06 - 8.71 5.57 3.14 24.86 23.99 0.87 0.21 34.84 13.01%
Nursing stations 0.38 - - - - - - - - 0.38 0.14%
All other ambulatory centres 0.17 - - - - - - - - 0.17 0.06%
Providers of ancillary services 2.52 0.12 0.09 0.06 0.03 0.55 0.52 0.03 - 3.28 1.23%
Providers of patient transportation and emergency rescue
2.27 - - - - - - - - 2.27 0.85%
Medical and diagnostic laboratories 0.00 0.12 - 0.06 0.03 0.55 0.52 0.03 - 0.76 0.29%
Other providers of ancillary services 0.25 - - - - - - - - 0.25 0.09%
Retailers and other providers of medical goods
0.36 - 4.72 3.57 1.15 33.53 33.17 0.36 - 38.61 14.42%
Providers of preventive care 9.30 1.41 - - - - - - 7.32 18.03 6.73%
Providers of health administration and financing
8.12 0.86 - - - - - - 3.34 12.33 4.60%
Government health administration agencies 8.00 0.79 - - - - - - 3.34 12.13 4.53%
Other 0.12 0.07 - - - - - - - 0.20 0.07%
Rest of the economy 0.88 0.07 - - - - - - - 0.95 0.35%
Rest of the world 1.74 - 8.63 3.63 5.01 - - - 0.25 10.63 3.97%
Total 156.43 2.46 34.44 20.60 13.84 63.28 60.31 2.97 11.13 267.75 100%
Percentage 58.42% 0.92% 12.86% 7.69% 5.17% 23.64% 22.53% 1.11% 4.16% 100%

FIJI HEALTH ACCOUNTS: NATIONAL HEALTH EXPENDITURE 2011-2014 113
Table 4: Current Health Expenditure of Health providers by Revenue sources, 2014
Transfers from government
domestic revenue
Transfers distributed
by government from foreign
origin
Voluntary prepayment
(a+b)
Voluntary prepayment
from individuals/ households
(a)
Voluntary prepayment
from employers
(b)
Other domestic revenues
(c+d)
Other revenues
from households
(c)
Other revenues
from NPISH
(d)
Direct foreign
transfers Total Percentage
Hospital 122.43 - 15.52 9.85 5.67 5.71 3.47 2.24 - 143.65 46.30%
Divisional Hospitals 76.48 - 1.70 0.37 1.34 - - - - 78.18 25.20%
Sub-Divisional Hospitals 35.55 - - - - - - - - 35.55 11.46%
Private Hospitals 1.34 - 13.81 9.48 4.33 5.71 3.47 2.24 - 20.86 6.72%
Specialised Hospitals 9.06 - - - - - - - - 9.06 2.92%
Residential Long -Term care facilities 1.10 - - - - - - - - 1.10 0.35%
Providers of ambulatory health care 28.29 - 10.59 6.70 3.89 27.69 26.71 0.98 0.13 66.70 21.50%
Public Health Centres 25.36 - - - - - - - - 25.36 8.17%
Private ambulatory health care 1.38 - 10.59 6.70 3.89 27.69 26.71 0.98 0.13 39.79 12.82%
Nursing stations 1.40 - - - - - - - - 1.40 0.45%
All other ambulatory centres 0.16 - - - - - - - - 0.16 0.05%
Providers of ancillary services 3.18 0.11 0.16 0.11 0.05 0.87 0.84 0.03 - 4.31 1.39%
Providers of patient transportation and emergency rescue
2.75 - - - - - - - - 2.75 0.89%
Medical and diagnostic laboratories - 0.11 0.16 0.11 0.05 0.87 0.84 0.03 - 1.14 0.37%
Other providers of ancillary services 0.43 - - - - - - - - 0.43 0.14%
Retailers and other providers of medical goods
0.47 - 4.97 3.77 1.20 30.75 30.44 0.31 - 36.19 11.66%
Providers of preventive care 20.32 0.95 - - - - - - 8.33 29.60 9.54%
Providers of health administration and financing
10.23 1.09 - - - - - - 3.04 14.36 4.63%
Government health administration agencies 10.09 1.09 - - - - - - 3.04 14.21 4.58%
Other 0.14 - - - - - - - - 0.14 0.05%
Rest of the economy 1.20 - - - - - - - - 1.20 0.39%
Rest of the world 2.19 - 10.59 4.34 6.25 - - - 0.40 13.18 4.25%
Total 189.40 2.15 41.82 24.77 17.06 65.01 61.45 3.56 11.90 310.28 100%
Percentage 61.04% 0.69% 13.48% 7.98% 5.50% 20.95% 19.80% 1.15% 3.84% 100%

FIJI HEALTH ACCOUNTS: NATIONAL HEALTH EXPENDITURE 2011-2014 114
Table 5: Current Health Expenditure of health providers by financing schemes, 2013
Government
schemes
Voluntary health
insurance schemes
(a+b)
Employer-based
insurance (a)
Other primary
coverage schemes (b)
NPISH financing schemes
Household out-of-pocket
payment
Rest of the world
financing schemes
(non-resident)
Total Percentage
Hospitals 105.47 6.58 4.51 2.07 1.72 8.33 - 122.10 45.6%
Divisional Hospitals 68.48 0.80 0.77 0.04 - 0.22 - 69.50 26.0%
Sub-Divisional 31.14 - - - - - - 31.14 11.6%
Private Hospitals 0.84 5.78 3.74 2.04 1.72 8.12 - 16.46 6.1%
Specialized 5.00 - - - - - - 5.00 1.9%
Residential long-term care facilities 0.79 - - - - - - 0.79 0.3%
Providers of ambulatory health care 27.25 3.73 3.14 0.58 1.08 28.98 - 61.03 22.8%
Public Health Centres 25.64 - - - - - - 25.64 9.6%
Private ambulatory health care 1.06 3.73 3.14 0.58 1.08 28.98 - 34.84 13.0%
Nursing stations 0.38 - - - - - - 0.38 0.1%
All other ambulatory centres 0.17 - - - - - - 0.17 0.1%
Providers of ancillary services 2.64 0.03 0.03 - 0.03 0.58 - 3.28 1.2%
Providers of patient transportation and emergency rescue
2.27 - - - - - - 2.27 0.8%
Medical and diagnostic laboratories 0.12 0.03 0.03 - 0.03 0.58 - 0.76 0.3%
National blood services 0.25 - - - - - - 0.25 0.1%
Retailers and other providers of medical goods
0.36 1.15 1.15 - 0.36 36.74 - 38.61 14.4%
Pharmacies (Private) 0.36 1.15 1.15 - 0.36 36.74 - 38.61 14.4%
Providers of preventive care 10.71 - - - - - 7.32 18.03 6.7%
Providers of health care system administration and financing
8.98 - - - - - 3.34 12.33 4.6%
Government health administration agencies 8.79 - - - - - - 8.79 3.3%
Others 0.20 - - - - - - 0.20 0.1%
Rest of economy 0.95 - - - - - - 0.95 0.4%
Rest of the world 1.74 8.63 5.01 3.63 0.05 - 0.20 10.63 4.0%
Total 158.89 20.12 13.84 6.29 3.23 74.63 10.87 267.75 100%
Percentage 59.3% 7.5% 5.2% 2.3% 1.2% 27.9% 4.1% 100%

FIJI HEALTH ACCOUNTS: NATIONAL HEALTH EXPENDITURE 2011-2014 115
Table 6: Current Health Expenditure of health providers by financing schemes, 2014
Government
schemes
Voluntary health
insurance schemes
(a+b)
Employer-based
insurance (a)
Other primary
coverage schemes (b)
NPISH financing schemes
Household out-of-pocket
payment
Rest of the world
financing schemes
(non-resident)
Total Percentage
Hospitals 122.43 7.99 5.67 2.32 2.24 11.00 - 143.65 46.3%
Divisional Hospitals 76.48 1.44 1.34 0.10 - 0.27 - 78.18 25.2%
Sub-Divisional 35.55 - - - - - - 35.55 11.5%
Private Hospitals 1.34 6.55 4.33 2.22 2.24 10.73 - 20.86 6.7%
Specialized 9.06 - - - - - - 9.06 2.9%
Residential long-term care facilities 1.10 - - - - - - 1.10 0.4%
Providers of ambulatory health care 28.29 4.96 3.89 1.07 1.12 32.34 - 66.70 21.5%
Public Health Centres 25.36 - - - - - - 25.36 8.2%
Private ambulatory health care 1.38 4.96 3.89 1.07 1.12 32.34 - 39.79 12.8%
Nursing stations 1.40 - - - - - - 1.40 0.4%
All other ambulatory centres 0.16 - - - - - - 0.16 0.1%
Providers of ancillary services 3.28 0.05 0.05 - 0.03 0.95 - 4.31 1.4%
Providers of patient transportation and emergency rescue
2.75 - - - - - - 2.75 0.9%
Medical and diagnostic laboratories 0.11 0.05 0.05 - 0.03 0.95 - 1.14 0.4%
National blood services 0.43 - - - - - - 0.43 0.1%
Retailers and other providers of medical goods
0.47 1.20 1.20 - 0.31 34.21 - 36.19 11.7%
Pharmacies (Private) 0.47 1.20 1.20 - 0.31 34.21 - 36.19 11.7%
Providers of preventive care 21.36 - - - 1.10 - 7.14 29.60 9.5%
Providers of health care system administration and financing
11.32 - - - - - 3.04 14.36 4.6%
Government health administration agencies
11.18 - - - - - - 11.18 3.6%
Others 0.14 - - - - - - 0.14 0.0%
Rest of economy 1.20 - - - - - - 1.20 0.4%
Rest of the world 2.19 10.59 6.25 4.34 0.16 - 0.25 13.18 4.2%
Total 191.64 24.78 17.06 7.72 4.95 78.49 10.42 310.28 100%
Percentage 61.8% 8.0% 5.5% 2.5% 1.6% 25.3% 3.4% 100.0%

FIJI HEALTH ACCOUNTS: NATIONAL HEALTH EXPENDITURE 2011-2014 116
Table 7: Current Health Expenditure of health providers by health functions, 2013
Inpatient Curative
Care
Outpatient Curative
Care
Rehabilitative & Long Term
Care
Ancillary Services
Medical Goods
Preventive Care
Governance and Health
system administration
Total Percentage
Hospital 38.53 32.49 3.09 21.43 1.39 21.29 3.87 122.10 45.60%
Divisional Hospitals 25.73 15.42 1.12 14.24 0.60 8.94 3.45 69.50 25.96%
Sub-Divisional Hospitals 5.75 10.22 1.06 3.37 - 10.74 - 31.14 11.63%
Private Hospitals 5.48 5.86 0.06 3.73 0.79 0.55 - 16.46 6.15%
Specialised Hospitals 1.58 0.99 0.86 0.09 - 1.06 0.42 5.00 1.87%
Residential Long -Term care facilities - - 0.73 - - 0.05 - 0.79 0.29%
Providers of ambulatory health care 1.11 28.21 0.34 6.01 2.40 22.97 - 61.03 22.79%
Public Health Centres - 7.65 0.28 0.37 - 17.33 - 25.64 9.57%
Private ambulatory health care 1.11 20.48 0.06 5.64 2.40 5.15 - 34.84 13.01%
Nursing stations - 0.07 - - - 0.31 - 0.38 0.14%
All other ambulatory centres - - - - - 0.17 - 0.17 0.06%
Providers of ancillary services - - - 3.04 - 0.15 0.10 3.28 1.23%
Providers of patient transportation and emergency rescue
- - - 2.27 - - - 2.27 0.85%
Medical and diagnostic laboratories - - - 0.76 - - - 0.76 0.29%
Other providers of ancillary services - - - - - 0.15 0.10 0.25 0.09%
Retailers and other providers of medical goods 0.29 0.33 0.01 0.04 37.95 - - 38.61 14.42%
Providers of preventive care 0.72 - - 0.13 - 16.81 0.35 18.02 6.73%
Providers of health administration and financing - - - 0.05 - - 12.28 12.33 4.61%
Government health administration agencies - - - - - - 12.13 12.13 4.53%
Other - - - 0.05 - - 0.15 0.20 0.07%
Rest of the economy - - - - - - 0.95 0.95 0.35%
Rest of the world 4.43 5.18 - 0.81 0.21 - - 10.63 3.97%
Total 45.08 66.21 4.17 31.51 41.95 61.28 17.55 267.74 100%
Percentage 16.84% 24.73% 1.56% 11.77% 15.67% 22.89% 6.55% 100%
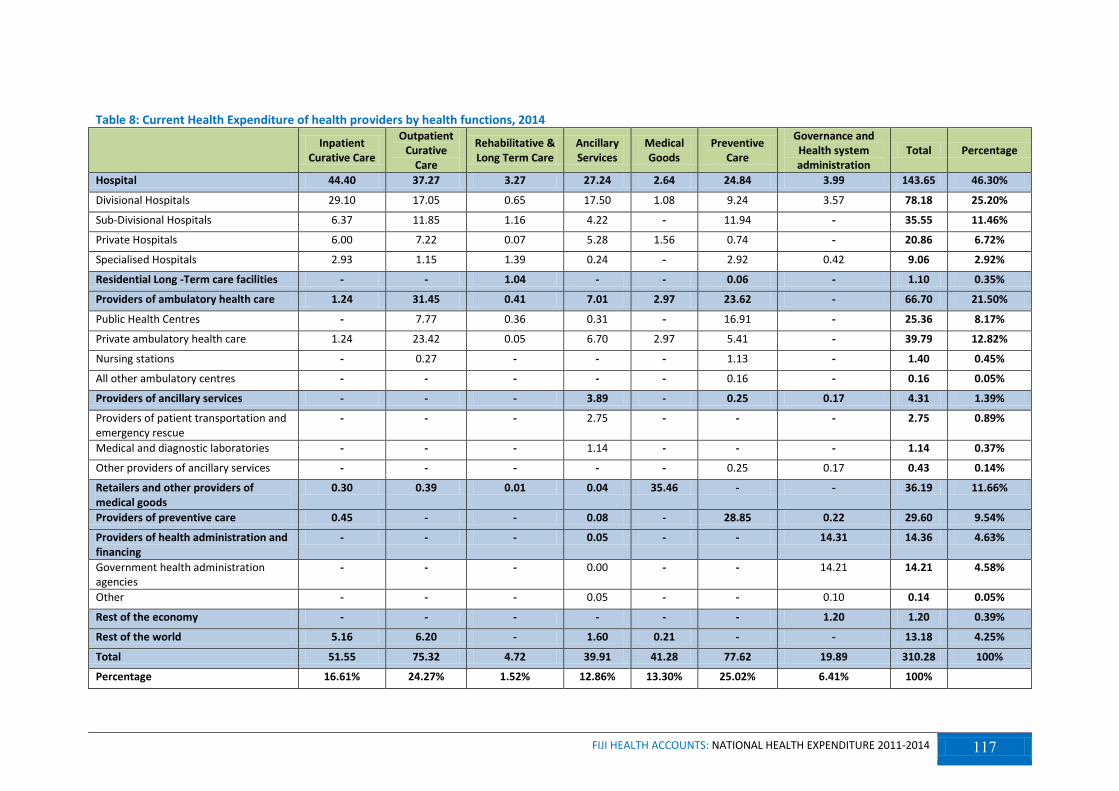
FIJI HEALTH ACCOUNTS: NATIONAL HEALTH EXPENDITURE 2011-2014 117
Table 8: Current Health Expenditure of health providers by health functions, 2014
Inpatient
Curative Care
Outpatient Curative
Care
Rehabilitative & Long Term Care
Ancillary Services
Medical Goods
Preventive Care
Governance and Health system administration
Total Percentage
Hospital 44.40 37.27 3.27 27.24 2.64 24.84 3.99 143.65 46.30%
Divisional Hospitals 29.10 17.05 0.65 17.50 1.08 9.24 3.57 78.18 25.20%
Sub-Divisional Hospitals 6.37 11.85 1.16 4.22 - 11.94 - 35.55 11.46%
Private Hospitals 6.00 7.22 0.07 5.28 1.56 0.74 - 20.86 6.72%
Specialised Hospitals 2.93 1.15 1.39 0.24 - 2.92 0.42 9.06 2.92%
Residential Long -Term care facilities - - 1.04 - - 0.06 - 1.10 0.35%
Providers of ambulatory health care 1.24 31.45 0.41 7.01 2.97 23.62 - 66.70 21.50%
Public Health Centres - 7.77 0.36 0.31 - 16.91 - 25.36 8.17%
Private ambulatory health care 1.24 23.42 0.05 6.70 2.97 5.41 - 39.79 12.82%
Nursing stations - 0.27 - - - 1.13 - 1.40 0.45%
All other ambulatory centres - - - - - 0.16 - 0.16 0.05%
Providers of ancillary services - - - 3.89 - 0.25 0.17 4.31 1.39%
Providers of patient transportation and emergency rescue
- - - 2.75 - - - 2.75 0.89%
Medical and diagnostic laboratories - - - 1.14 - - - 1.14 0.37%
Other providers of ancillary services - - - - - 0.25 0.17 0.43 0.14%
Retailers and other providers of medical goods
0.30 0.39 0.01 0.04 35.46 - - 36.19 11.66%
Providers of preventive care 0.45 - - 0.08 - 28.85 0.22 29.60 9.54%
Providers of health administration and financing
- - - 0.05 - - 14.31 14.36 4.63%
Government health administration agencies
- - - 0.00 - - 14.21 14.21 4.58%
Other - - - 0.05 - - 0.10 0.14 0.05%
Rest of the economy - - - - - - 1.20 1.20 0.39%
Rest of the world 5.16 6.20 - 1.60 0.21 - - 13.18 4.25%
Total 51.55 75.32 4.72 39.91 41.28 77.62 19.89 310.28 100%
Percentage 16.61% 24.27% 1.52% 12.86% 13.30% 25.02% 6.41% 100%
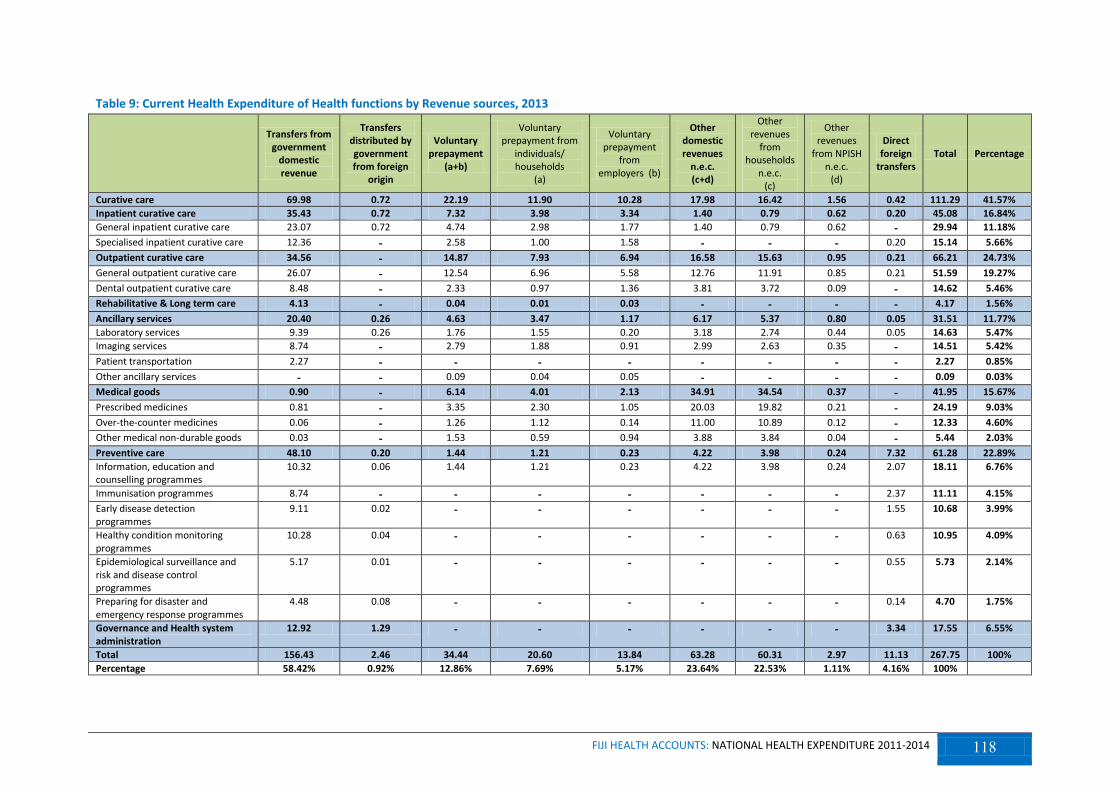
FIJI HEALTH ACCOUNTS: NATIONAL HEALTH EXPENDITURE 2011-2014 118
Table 9: Current Health Expenditure of Health functions by Revenue sources, 2013
Transfers from government
domestic revenue
Transfers distributed by government from foreign
origin
Voluntary prepayment
(a+b)
Voluntary prepayment from
individuals/ households
(a)
Voluntary prepayment
from employers (b)
Other domestic revenues
n.e.c. (c+d)
Other revenues
from households
n.e.c. (c)
Other revenues
from NPISH n.e.c.
(d)
Direct foreign
transfers Total Percentage
Curative care 69.98 0.72 22.19 11.90 10.28 17.98 16.42 1.56 0.42 111.29 41.57%
Inpatient curative care 35.43 0.72 7.32 3.98 3.34 1.40 0.79 0.62 0.20 45.08 16.84%
General inpatient curative care 23.07 0.72 4.74 2.98 1.77 1.40 0.79 0.62 - 29.94 11.18%
Specialised inpatient curative care 12.36 - 2.58 1.00 1.58 - - - 0.20 15.14 5.66%
Outpatient curative care 34.56 - 14.87 7.93 6.94 16.58 15.63 0.95 0.21 66.21 24.73%
General outpatient curative care 26.07 - 12.54 6.96 5.58 12.76 11.91 0.85 0.21 51.59 19.27%
Dental outpatient curative care 8.48 - 2.33 0.97 1.36 3.81 3.72 0.09 - 14.62 5.46%
Rehabilitative & Long term care 4.13 - 0.04 0.01 0.03 - - - - 4.17 1.56%
Ancillary services 20.40 0.26 4.63 3.47 1.17 6.17 5.37 0.80 0.05 31.51 11.77%
Laboratory services 9.39 0.26 1.76 1.55 0.20 3.18 2.74 0.44 0.05 14.63 5.47%
Imaging services 8.74 - 2.79 1.88 0.91 2.99 2.63 0.35 - 14.51 5.42%
Patient transportation 2.27 - - - - - - - - 2.27 0.85%
Other ancillary services - - 0.09 0.04 0.05 - - - - 0.09 0.03%
Medical goods 0.90 - 6.14 4.01 2.13 34.91 34.54 0.37 - 41.95 15.67%
Prescribed medicines 0.81 - 3.35 2.30 1.05 20.03 19.82 0.21 - 24.19 9.03%
Over-the-counter medicines 0.06 - 1.26 1.12 0.14 11.00 10.89 0.12 - 12.33 4.60%
Other medical non-durable goods 0.03 - 1.53 0.59 0.94 3.88 3.84 0.04 - 5.44 2.03%
Preventive care 48.10 0.20 1.44 1.21 0.23 4.22 3.98 0.24 7.32 61.28 22.89%
Information, education and counselling programmes
10.32 0.06 1.44 1.21 0.23 4.22 3.98 0.24 2.07 18.11 6.76%
Immunisation programmes 8.74 - - - - - - - 2.37 11.11 4.15%
Early disease detection programmes
9.11 0.02 - - - - - - 1.55 10.68 3.99%
Healthy condition monitoring programmes
10.28 0.04 - - - - - - 0.63 10.95 4.09%
Epidemiological surveillance and risk and disease control programmes
5.17 0.01 - - - - - - 0.55 5.73 2.14%
Preparing for disaster and emergency response programmes
4.48 0.08 - - - - - - 0.14 4.70 1.75%
Governance and Health system administration
12.92 1.29 - - - - - - 3.34 17.55 6.55%
Total 156.43 2.46 34.44 20.60 13.84 63.28 60.31 2.97 11.13 267.75 100%
Percentage 58.42% 0.92% 12.86% 7.69% 5.17% 23.64% 22.53% 1.11% 4.16% 100%

FIJI HEALTH ACCOUNTS: NATIONAL HEALTH EXPENDITURE 2011-2014 119
Table 10: Current Health Expenditure of Health functions by Revenue sources, 2014
Transfers from
government domestic revenue
Transfers distributed by government from foreign
origin
Voluntary prepayment
(a+b)
Voluntary prepayment
from individuals/ households
(a)
Voluntary prepayment
from employers (b)
Other domestic revenues
n.e.c. (c+d)
Other revenues
from households
(c)
Other revenues
from NPISH (d)
Direct foreign
transfers Total Percentage
Curative care 79.12 0.45 26.09 14.15 11.93 20.72 18.77 1.95 0.49 126.87 40.89%
Inpatient curative care 40.66 0.45 8.33 4.69 3.63 1.75 0.99 0.76 0.36 51.55 16.61%
General inpatient curative care 25.71 0.45 5.73 3.64 2.09 1.75 0.99 0.76 0.11 33.76 10.88%
Specialised inpatient curative care 14.95 - 2.59 1.05 1.54 - - - 0.25 17.79 5.73%
Outpatient curative care 38.45 - 17.76 9.46 8.30 18.97 17.78 1.19 0.13 75.32 24.27%
General outpatient curative care 28.37 - 14.78 8.27 6.52 14.32 13.24 1.08 0.13 57.61 18.57%
Dental outpatient curative care 10.08 - 2.98 1.19 1.79 4.65 4.54 0.12 - 17.71 5.71%
Rehabilitative & Long term care 4.68 - 0.05 0.01 0.04 - - - - 4.72 1.52%
Ancillary services 25.08 0.19 6.98 4.88 2.10 7.61 6.61 1.00 0.04 39.91 12.86%
Laboratory services 11.80 0.19 2.26 2.03 0.23 4.07 3.52 0.56 0.04 18.36 5.92%
Imaging services 10.53 - 3.67 2.42 1.25 3.54 3.09 0.45 - 17.74 5.72%
Patient transportation 2.75 - - - - - - - - 2.75 0.89%
Other ancillary services - - 1.06 0.43 0.62 - - - - 1.06 0.34%
Medical goods 2.00 - 7.09 4.35 2.74 32.19 31.86 0.33 - 41.28 13.30%
Prescribed medicines 1.91 - 3.87 2.49 1.38 18.53 18.34 0.19 - 24.31 7.83%
Over-the-counter medicines 0.06 - 1.26 1.15 0.11 9.84 9.74 0.10 - 11.16 3.60%
Other medical non-durable goods 0.03 - 1.96 0.71 1.25 3.82 3.78 0.04 - 5.81 1.87%
Preventive care 62.97 0.20 1.62 1.38 0.25 4.49 4.21 0.28 8.33 77.62 25.02%
Information, education and counselling programmes
14.40 0.09 1.62 1.38 0.25 4.49 4.21 0.28 2.21 22.81 7.35%
Immunisation programmes 10.29 - - - - - - - 2.14 12.43 4.01%
Early disease detection programmes 12.32 0.02 - - - - - - 1.98 14.32 4.62%
Healthy condition monitoring programmes
13.60 0.03 - - - - - - 0.57 14.21 4.58%
Epidemiological surveillance and risk and disease control programmes
6.85 0.01 - - - - - - 0.70 7.57 2.44%
Preparing for disaster and emergency response programmes
5.51 0.05 - - - - - - 0.72 6.28 2.02%
Governance and Health system administration
15.55 1.31 - - - - - - 3.04 19.89 6.41%
Total 189.40 2.15 41.82 24.77 17.06 65.01 61.45 3.56 11.90 310.28 100%
Percentage 61.04% 0.69% 13.48% 7.98% 5.50% 20.95% 19.80% 1.15% 3.84% 100%

FIJI HEALTH ACCOUNTS: NATIONAL HEALTH EXPENDITURE 2011-2014 120
Table 11: Current Health Expenditure of health functions by financing schemes, 2013
Government
schemes
Voluntary
health insurance schemes
(a+b)
Employer-based
insurance (a)
Other primary
coverage schemes
(b)
NPISH financing schemes
Household
out-of-pocket
payment
Rest of the
world financing schemes
(non-resident)
Total Percentage
Curative care 70.71 15.90 10.28 5.61 1.77 22.71 0.20 111.29 41.6%
Inpatient curative care 36.15 5.31 3.34 1.97 0.62 2.80 0.20 45.08 16.8%
General inpatient curative care 23.79 2.79 1.77 1.02 0.62 2.74 - 29.94 11.2%
Specialised inpatient curative care 12.36 2.52 1.58 0.94 - 0.06 0.20 15.14 5.7%
Outpatient curative care 34.56 10.59 6.94 3.65 1.16 19.91 - 66.21 24.7%
General outpatient curative care 26.07 8.32 5.58 2.74 1.06 16.13 - 51.59 19.3%
Dental outpatient curative care 8.48 2.26 1.36 0.91 0.09 3.78 - 14.62 5.5%
Rehabilitative care and Long-term care 4.13 0.03 0.03 - - 0.01 - 4.17 1.6%
Ancillary services 20.66 1.71 1.17 0.55 0.84 8.29 - 31.51 11.8%
Laboratory services 9.65 - 0.20 - - - - 9.65 3.6%
Imaging services 8.74 - 0.91 0.51 - - - 8.74 3.3%
Patient transportation 2.27 - - - - - - 2.27 0.8%
Other ancillary services - - 0.05 0.04 - - - - 0.0%
Medical goods 0.90 2.26 2.13 0.13 0.37 38.43 - 41.95 15.7%
Prescribed medicines 0.81 0.26 0.26 - 0.21 21.86 - 23.13 8.6%
Over-the-counter medicines 0.06 0.14 0.14 - 0.12 12.01 - 12.33 4.6%
Other medical non-durable goods 0.03 1.86 1.73 0.13 0.04 4.56 - 6.49 2.4%
Preventive care 48.30 0.23 0.23 - 0.24 5.19 7.32 61.28 22.9%
Information, education and counselling programmes 10.37 0.23 0.23 - 0.24 5.19 2.07 18.11 6.8%
Immunisation programmes 8.74 - - - - - 2.37 11.11 4.2%
Early disease detection programmes 9.13 - - - - - 1.55 10.68 4.0%
Healthy condition monitoring programmes 10.32 - - - - - 0.63 10.95 4.1%
Epidemiological surveillance and risk and disease control programmes 5.18 - - - - - 0.55 5.73 2.1%
Preparing for disaster and emergency response programmes 4.55 - - - - - 0.14 4.70 1.8%
Governance and Health system administration 14.20 - - - - - 3.34 17.55 6.6%
Total 158.89 20.12 13.84 6.29 3.23 74.63 10.87 267.75 100%
Percentage 59.3% 7.5% 5.2% 2.3% 1.2% 27.9% 4.1% 100%

FIJI HEALTH ACCOUNTS: NATIONAL HEALTH EXPENDITURE 2011-2014 121
Table 12: Current Health Expenditure of health functions by financing schemes, 2014
Government
schemes
Voluntary
health insurance schemes
(a+b)
Employer-based
insurance (a)
Other primary
coverage schemes
(b)
NPISH financing schemes
Household out-of-pocket
payment
Rest of the
world financing schemes
(non-resident)
Total Percentage
Curative care 79.57 18.42 11.93 6.49 2.20 26.43 0.25 126.87 40.9%
Inpatient curative care 41.11 5.92 3.63 2.29 0.87 3.40 0.25 51.55 16.6%
General inpatient curative care 26.16 3.33 2.09 1.24 0.87 3.39 - 33.76 10.9%
Specialised inpatient curative care 14.95 2.58 1.54 1.04 - 0.01 0.25 17.79 5.7%
Outpatient curative care 38.45 12.51 8.30 4.20 1.33 23.03 - 75.32 24.3%
General outpatient curative care 28.37 9.61 6.52 3.10 1.21 18.41 - 57.61 18.6%
Dental outpatient curative care 10.08 2.89 1.79 1.10 0.12 4.62 - 17.71 5.7%
Rehabilitative care and Long-term care 4.68 0.04 0.04 - - 0.01 - 4.72 1.5%
Ancillary services 25.27 3.23 2.10 1.13 1.05 10.36 - 39.91 12.9%
Laboratory services 11.99 - 0.23 - - - - 11.99 3.9%
Imaging services 10.53 - 1.25 0.70 - - - 10.53 3.4%
Patient transportation 2.75 - - - - - - 2.75 0.9%
Other ancillary services - - 0.62 0.43 - - - - 0.0%
Medical goods 2.00 2.84 2.74 0.11 0.33 36.10 - 41.28 13.3%
Prescribed medicines 1.91 0.21 0.21 - 0.19 20.50 - 22.81 7.4%
Over-the-counter medicines 0.06 0.11 0.11 - 0.10 10.89 - 11.16 3.6%
Other medical non-durable goods 0.03 2.52 2.42 0.11 0.04 4.71 - 7.31 2.4%
Preventive care 63.27 0.25 0.25 - 1.38 5.59 7.14 77.62 25.0%
Information, education and counselling programmes 14.49 0.25 0.25 - 0.58 5.59 1.90 22.81 7.4%
Immunisation programmes 10.29 - - - - - 2.14 12.43 4.0%
Early disease detection programmes 12.34 - - - 0.50 - 1.48 14.32 4.6%
Healthy condition monitoring programmes 13.63 - - - - - 0.57 14.21 4.6%
Epidemiological surveillance and risk and disease control programmes 6.87 - - - 0.20 - 0.50 7.57 2.4%
Preparing for disaster and emergency response programmes 5.66 - - - 0.09 - 0.53 6.28 2.0%
Governance and Health system administration 16.85 - - - - - 3.04 19.89 6.4%
Total 191.64 24.78 17.06 7.72 4.95 78.49 10.42 310.28 100%
Percentage 61.8% 8.0% 5.5% 2.5% 1.6% 25.3% 3.4% 100%

FIJI HEALTH ACCOUNTS: NATIONAL HEALTH EXPENDITURE 2011-2014 122