in baseball pitching and throwing limb movement · international journal of sport biomechanics,...
TRANSCRIPT
INTERNATIONAL JOURNAL OF SPORT BIOMECHANICS, 1988,4, 5967
Timing of the Lower Limb Drive and Throwing Limb Movement
in Baseball Pitching
Bruce Elliott, 1. Robert Grove, and Barry Gibson
Eight international baseball pitchers were mmed in a laboratory while throwing from a pitching rubber attached to a Kistler force platform. Following a warm- up, all subjects threw fastballs (FB) unt3 two strike pitches were assessed by an umpire positioned behind the catcher for both wind-up and set pitching techniques. Subjects then followed the same procedures for curveball pitches (CB). Both vertical (2) and horizontal 01) ground reaction force (GRF) data were recorded. A shutter correlation pulse was encoded so the temporal data from the film could be synchronized with the kinetic data from the force plat- form. Analysis of variance was used to analyze differences in force data at selected points in both pitching actions for both techniques. Vertical and horizontal GRFs increased from the first balance position to maximum levels at the cocked position for both techniques. Nonsignificant changes in GRF then occurred between the cocked position and front-foot landing. The Z GRFs were similar throughout the pitching action but higher in magnitude for the CB compared to the FB. Mean resultant forces were similar for the three fastest FB pitchers when compared to the three slowest pitchers. However, the ~ l o w e r - ~ r o u ~ produced their peak resultant force earlier in the action, thus reducing the ability to drive over a stabilized front leg.
The defensive nature of baseball causes it to be dominated by the skill of the pitcher, who through speed of pitch or a combination of speed and guile in controlling the ball often determines the result of the game (Polk, 1982). Cor- rect pitching mechanics that enable the pitcher to throw the ball repeatedly with high velocities and without undue risk of injury will only be achieved through
Bruce C. Elliott and J. Robert Grove are with the Department of Human Movement and Recreation Studies at the University of Western Australia, Nedlands 6009. Barrydbson is with the Department of Human Movement Studies, Western Australian College of Ad- vanced Education. Direct all correspondence to Dr. B.C. Elliott.
60 r ELLIOTT, GROVE9 AND GIBSON
the coordination of complex body movements. Coordination in pitching there- fore concerns the timing of various body motions such as trunk rotation, lower limb drive, and nonthrowing-limb and throwing-limb movements. Erratic pitch- ing performance will almost inevitably result from an incorrect sequencing of individual body segment motions.
It is generally agreed that the pitch using the wind-up technique begins with a rocking action back onto the stride limb,which.pushes off and theh leaves the ground and shifts the center of gravity (CG) forward over the pivot limb at the first balance position (Hay, 1985; Pappas, Zawacki, & Sullivan, 1985; Polk, 1982). From the first balance position, the pivot limb extends at the hip and knee joints and plantar flexes at the ankle to drive the body forward toward the plate (Hay, 1985; Ryan & Torre, 1977; Shaw, 1977). This movement, if coordinated with the initial movement forward of the CG, enables the body to be driven for- ward rather than upwardi(Hay, 1985).
House (1983, p. 40) advocated that th hddd in fact begin a "con- trolled fall, not a violent drive" toward home plat& which was contrary to the statement by Ryan and Torre (1977, p. 24) that "power pitcher or not, you should bend the knee of your back leg and drive as hard as you can off the rubber." The stride limb, ~hich~should first impact the pitching mo~nd~with the ball of the foot, should.be flexed at the knee to help absorb the forces of impact (Polk, 1982; Sain & Andrews, 1985). Trunk rotation in the transverse,plane and move- ment forward of the throwing, limb then follows the planting of the stride foot (Elliott, Grove, Gibson, & Thurston, 1986; Feltner & Dapenai 1986; Pappas et al., 1985; Polk, 1982). Thurston (1985) stated that the head and upper body are driven over the-stride limb as the body weight is transferred forward. This tech- nique supports the timing proposed by Alston and Weiskopf (1974, p., 127), who wrote that "the stride-foot should be planted firmly before the pitcher starts to apply genuine power of the pitch." House (1983) also advocated that the pivot foot ghould be in contact with thembber as the stride foot lands, but made no comment on timing of the weight transfer onto the front foot. .tt*l
The issue of whether*a skilled pitcherdrives toward the plate over a stabi- lized front leg or drives prior to front leg stabilization has not been adequately addressed in the scientific literature. This ,study investigates the role of ground reaction force (GRF) recorded from the pivot foot related to upper body move- ments infastball (FB) and curveball (CB) pitching using both the wind-up and set techniques. Specific questions addressed in this study involved (a) the general timing of GRF in relation to upper body movements, (b) the influence of pitch- ing technique (wind-up vs, set) on GRF, (c) the influence of pitch typei(FB vs. CB) on GRF,,and (d) differences in GRFin relation to pitch velocity for the FB.
Eight baseball pitehers representing Japan, Chinese Taipei, and Australia were filmed in a laboratory setting while throwing from a pitching mbber that was firmly att;?ched to a f m e platform set in tlft flbor. ~ l f subjectsibere in training at theZime of the filming and were in Perthr WesEm Australi"2, to compete in the merica's Cup Festival of the Sport International Baseball Tdumament dur-1 ing December of 1986.
TIMING IN BASEBALL PITCHING 61
Procedures
A Photosonics 16mm high-speed camera loaded with 200 ASA film and operat- ing at a nominal rate of 200 fps was used to film each subject. This camera, which was fitted with a 25mm Schneider lens, was positioned at right angles to the plane of motion of the pitch. A large clock to calculate film speed was included in the photographic field, while a reference marker of known length (to convert film measurement to actual size) was filmed prior to any subjects being tested.
All subjects were instructed to pitch FBs, using first a wind-up technique and then a set technique, until two strikes were recorded using each technique. Strikes were determined by an umpire positioned behind the catcher. A similar procedure was then followed for CB pitches. All pitching actions started with the pivot foot on the pitching rubber, which was firmly attached to a Kistler Type 9281 force platform. As a warm-up and to familiarize them with the laboratory environment, the pitchers were given as many practice throws (both FB and CB) as requested prior to the FB filming. Five practice CB pitches were permitted prior to that section of the filming procedure. All GRF data (Z vertical; Y anterior-posterior) were recorded using a Schlumberger Instrumentation Recorder for later off-line analysis (bandwidth 0-1OKH2, while a BWD 845 Storage Os- cilloscope was used to monitor the data. A shutter correlation pulse was encoded on both the film and the magnetic tape so that the kinematic and temporal data from the film could be synchronized with the kinetic data from the force platform.
Treatment and Analysis of the Data
A DEC 8/E computer was used to convert the analogue force traces into a digital time series. Values for each pitch were then transferred to the DEC System-10 computer for graphic display and determination of scalar values at selected points in time. Force data were normalized for each trial by dividing the force recorded at the particular point in the throwing action by the subject's body weight (BW). Following processing, the film image was projected onto the horizontal surface of an analysis table using a stop-action projector. The trial that produced the higher velocity of the strike pitches for both the FB and CB was selected for kinetic analysis.
The force data were statistically analyzed using ANOVA procedures. Fac- tors in the analyses were type of delivery (wind-up, set), type of pitch (FB, CB), and time. The time factor had six levels corresponding to different positions in the pitching action. The first balance position referred to the point where the pitcher was balanced on the pivot foot, and the stride limb was raised so that the thigh was parallel to the ground and the shoulders and hips were aligned with the in- tended direction of the pitch (Polk, 1982). The time when the ball was removed from the glove, as observed from the film, was termed "ball out of the glove." The maximum extension of the throwing arm was the position during the down- and-backward movement of this limb when maximum extension was recorded at the elbow joint. The cocked position, also termed "the second balance point" or "power positiop" (Polk, 1982), referred to the time in the pitching action when the throwing arm was flexed to 90' at the elbow joint prior to any forward rotation of the trunk. Front-foot landing referred to that point in the pitching ac- tion when the stride foot was fully placed on the ground. Separate three-way ANO- VAs were conducted for the Z forces and Y forces.

62 ELLIOTT, GROVE, AND GIBSON
Additiond m O V A s were then conducted on the resultant GRP during delivery of the FB using both the wind-up and set techniques by the three fastest pitchers and the three dowest pitchers. Factors in these latter analyses were group (fast, slow) and time. The time factor consisted of the six positions in the pitch- ing action described above. In all cases in which compound symmetry assump- tions were violated, more conservative F ratios with adjusted degrees of freedom were used Wuynh & Feldt, 1976). m e n follow-up tests were needed, the recom- mendations of Jaccard, Becker, and Wood (1984) concerning appropriate multi- ple comparison procedures were followed.
Results Vertical Forces
The analysis of the Z forces for type of delivery revealed a significant effect for the time factor, F(5, 40) = 19.22, p < .001. This effect is shown in the upper curves of Figure 1. Examination of the data suggested that for both the wind-up (WU) and set (S) techniques, the Z forces were close to BW until the ball was removed from the glove. From these levels, they increased steadily and reached their maximum when the throwing arm was in the cocked position. Relatively large Z forces were also evident at stride-foot landing, but there was a decrease after landing. Follow-up procedures using the multiple-comparison Bonferroni method (Dunn, 1961) indicated that the Z forces generated at the cocked position were signficantly greater than those at any other time except at stride-foot land- ing. The Z forces at stride-foot landing were, in turn, significantly greater than those generated prior to maximum extension of the throwing arm and those gener- ated 0.04 sec after landing.
FIRST BALL TNROMING-ARM COCKED FRONT-FOOT .04 AFTER BALANCE OUT OF EXTENDED POSITION LANDING LANDIWG
POIMT GLOVE
Figure 1 - M m force data for fwtball p i t c ~ g using the h d - u p m d set Ewhnlaiqua.
TIMING IN BASEBALL PITCHING 63
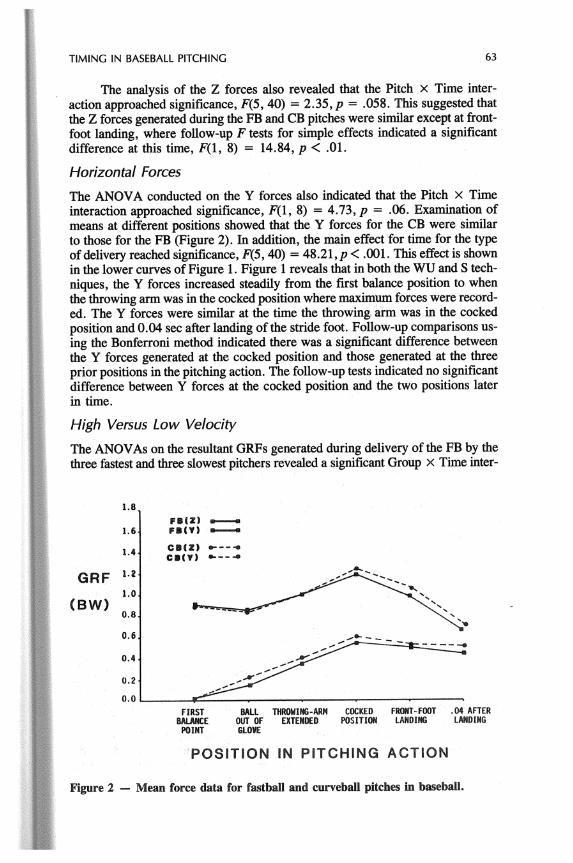
The analysis of the Z forces also revealed that the Pitch X Time inter- action approached significance, F(5,40) = 2.35, p = .058. This suggested that the Z forces generated during the FB and CB pitches were similar except at front- foot landing, where follow-up F tests for simple effects indicated a significant difference at this time, F(l, 8) = 14.84, p < .01.
Horizontal Forces
The ANOVA conducted on the Y forces also indicated that the Pitch X Time interaction approached significance, F(l, 8) = 4.73, p = .06. Examination of means at different positions showed that the Y forces for the CB were similar to those for the FB (Figure 2). In addition, the main effect for time for the type of delivery reached significance, F(5,40) = 48.21, p < .001. This effect is shown in the lower curves of Figure 1. Figure 1 reveals that in both the WU and S tech- niques, the Y forces increased steadily from the first balance position to when the throwing arm was in the cocked position where maximum forces were record- ed. The Y forces were similar at the time the throwing arm was in the cocked position and 0.04 sec after landing of the stride foot. Follow-up comparisons us- ing the Bonferroni method indicated there was a significant difference between the Y forces generated at the cocked position and those generated at the three prior positions in the pitching action. The follow-up tests indicated no significant difference between Y forces at the cocked position and the two positions later in time.
I-ligh Versus Low Velocity
The ANOVAs on the resultant GRFs generated during delivery of the FB by the three fastest and three slowest pitchers revealed a significant Group x Time inter-
FBtZ) - 1 . 6 FBtV) -
GRF
CBtZ) *---• 1 . 4 C,(V) *--a
1.2.
1.0. ~* -- 0.8.
0 . 6 . '-'--
0.4. \
0.2.
0.0 FIRST BALL THRMIIWG-ARM COCKED FRONT-FOOT . o ~ AFTER
BALANCE OUT OF EXTENDED POSITION LANOIN6 LANDING POINT GLOVE
"POSITION IN PITCHING ACTION
Figure 2 - Mean force data for fastball and curveball pitches in baseball.
ELLIOTT, GROVE, AND GIBSON
0 . ~ 1 "SLOW QROUP' *--4
1.4. RES.
1.2.
GRf= 1.0 .
(BW) o.8.
0.6.
0.4.
0.01 FIRST BALL THROWING-ARM COCKED FROM-FOOT .04 AFTER
BALWCE OUT OF EXTEIIWD WSlTIOAl LAADING LAMDIMG M I N T GLOVE
\
'FAST QROUP. - 'Is
POSITION IN PITCHING ACTION
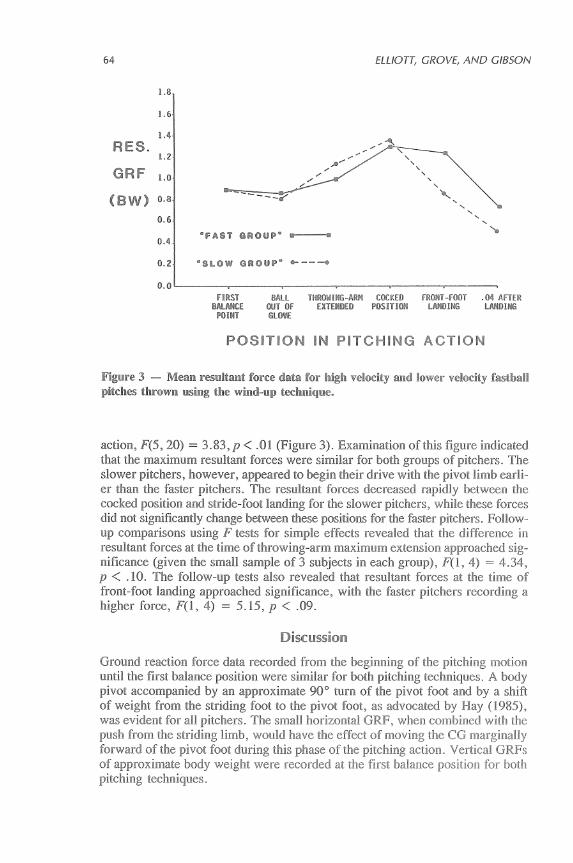
Figure 3 - Mean resultant force data for high velocity and lower velocity fastball pitches thrown using the wind-up technique.
action, F(5,20) = 3.83, p < .O1 (Figure 3). Examination of this figure indicated that the maximum resultant forces were similar for both groups of pitchers. The slower pitchers, however, appeared to begin their drive with the pivot limb earli- er than the faster pitchers. The resultant forces decreased rapidly between the cocked position and stride-foot landing for the slower pitchers, while these forces did not significantly change between these positions for the faster pitchers. Follow- up comparisons using F tests for simple effects revealed that the difference in resultant forces at the time of throwing-arm maximum extension approached sig- nificance (given the small sample of 3 subjects in each group), F(l, 4) = 4.34, p < .lo. The follow-up tests also revealed that resultant forces at the time of front-foot landing approached significance, with the faster pitchers recording a higher force, F(l, 4) = 5.15, p < .09.
Discussion
Ground reaction force data recorded from the beginning of the pitching motion until the first balance position were similar for both pitching techniques. A body pivot accompanied by an approximate 90" turn of the pivot foot and by a shift of weight from the striding foot to the pivot foot, as advocated by Nay (1985), was evident for all pitchers. The small horizontal GRF, when combined with the push from the striding limb, would have the effect of moving the CG marginally forward of the pivot foot during this phase of the pitching action. Vertical GRFs of approximate body weight were recorded at the first balance position for both pitching techniques.
TIMING IN BASEBALL PITCHING 65
From the first balance position, the pivot limb extended at the hip and knee joints and plantar flexed at the ankle to drive the body forward toward the plate (Elliott et al., 1986; Hay, 1985; Ryan & Torre, 1977; Shaw, 1977). Prior to this lower-limb drive, the pivot limb flexed, which produced an unweighting effect as the vertical GRF decreased from the first balance position (a mean for WU and S = 0.90 BW) to a Z ground reaction force of 0.80 body weight (mean for WU and S) recorded when the ball was removed from the glove. No signifi- cant differences were recorded in the Z ground reaction force between the first balance position and the time when the throwing limb was in its most extended position. However, the Y ground reaction force displayed a significant increase from 0.08 BW at the first balance position to 0.35 (wind-up) and 0.28 BW (set) at the position when the throwing limb was maximally extended.
The pivot limb extended for both pitching techniques, pushing downward and backward such that the GRFs drove the body toward the plate. Maximum mean Z and Y ground reaction forces for both techniques of 1.10 BW and 0.55 BW, respectively, were recorded as the throwing limb reached the cocked posi- tion. These levels, which were similar for both pitching techniques, were signifi- cantly higher than those recorded at the early positions in the throwing action. No significant reduction in Z or Y ground reaction force was recorded at stride- foot impact, which closely followed the throwing limb reaching the cocked posi- tion. Although Y ground reaction forces of 0.44 BW for both wind-up and set techniques 0.04 sec after stride-foot impact were not significantly different from those recorded at the cocked position, the Z ground reaction forces had signifi- cantly reduced from peak values at the cocked position to 0.65 BW (fastball- wind-up) and 0.80 BW (fastball-set).
The levels of GRF recorded were not high when compared to the forces generated in impact sports (Nigg et al., 1984). These forces, however, were of sufficient magnitude to conclude that while a pitcher may not drive off the rub- ber as hard as he can (Ryan & Torre, 1977), he certainly produced more force than would be equated with a "controlled fall" (House, 1983). This sample of high performance pitchers all produced a resultant vector that would have helped their upper body movements drive the body over the fixed front foot. Thus, it appeared essential in weight transfer that the pivot limb was capable of driving the body forward as the stride foot was totally on the ground. Stride-foot impact occurred with the ball of the foot in the majority of trials, as suggested by Polk (1982) and Sain and Andrews (1985); however, heel-first and flat-foot impacts were also recorded. A reduction in Z direction GRF was recorded after the front- foot impact, which supported the view of Sain and Andrews (1985) that a toe or ball-of-the-foot impact helped reduce any blocking of the forward movement pattern from the cocking to acceleration phases of the pitch.
Trunk rotation in the transverse plane and movement forward of the throwing limb did not occur until after the stride foot was planted. It would seem reason- able to assume that the genuine power in the pitch followed the planting of the stride foot. However, the effects that the GRF had on enabling the upper body to rotate efficiently would demand an efficient preparation so that the body could be driven over the fixed front foot. Soon after front-foot impact, the trunk rotat- ed forward in the transverse plane such that by ball release no GRF was derived from contact between the pivot foot and the ground.

66 ELLIOT, GROVE, AND GIBSON
Early in the pitching action, very similar GRFs were recorded for both the FB and CB pitches (Figure 2). Later in the action, the Z forces were simiiar in pattern but higher in magnitude for the CB compared to the FB. Perhaps the emphasis that coaches place on "getting on top of the curve" was responsible for this higher Z ground reaction force at front-foot landing (Alston & Weiskopf, 1974; Polk, 1982). The effort to attain a cocked position earlier in the throwing action and the shorter stride recorded for the CB when compared to the FB may have allowed the pitcher to derive and maintain slightly higher Z ground reaction force values throughout this phase of the pitching action.
The mean velocities recorded using the wind-up technique for both the FB (34.6 m s-' = 77.4 mph) and CB (30.1 m s-' = 67.3 mph) show that these high performance pitchers were throwing at similar velocities to those reported when pitching from a mound under laboratory conditions in a previous study (El- liott et al., 1986), and at approximately 90 % of their predicted maximum velocity. No difference was recorded in pitching velocity between the WU and S tech- niques, which supports the findings of Atwater (1977) and Speiser (1975).
When the resultant (Z and Y) force spectrum for the three fastest pitchers were compared with the same three FB pitches thrown by the slowest pitchers, it was evident that peak resultant force, though similar for both groups, occurred at different positions within the throwing action. Higher resultant forces were recorded at the time the throwing arm was extended by the slow group, while the fast group recorded higher values at front-foot landing. There was then a definite delay in the timing of the resultant GRF for the fast group when com- pared to the slow group. The ability to drive the body over a stabilized front leg was a characteristic of the fast pitchers.
References 1 I Alston, W., & Weiskopf, D. (1974). The complete baseball handbook. Boston: Allyn &
Bacon. Atwater, A.E. (1977, May). Biomechanical analysis of different pitches deliveredfrom
the windup and stretch positions. Paper presented at American College of Sports Medicine annual meeting, Chicago.
Dunn, O.J. (1961). Multiple comparisons among means. Journal of the American Statis- tical Association, 56, 52-64.
Elliott, B., Grove, J.R., Gibson, B., & Thurston, B. (1986). A threedimensional cinema- tographic analysis of the fastball and curveball pitches in baseball. International Journal of Sport Biomechanics, 2, 20-28.
Feltner, M., & Dapena, J. (1986). Dynamics of the shoulder and elbow joints of the throwing arm during a baseball pitch. International Journal of Sport Biomechanics, 2, 237-259.
Hay, J.G. (1985). The biomechanics of sports techniques (3rd ed.). Englewood Cliffs, NJ: Prentice-Hall.
House, T. (1983). A contemporary guide to pitching a baseball. San Diego: San Diego School of Baseball.
Huynh, H., & Feldt, L.S. (1976). Estimation of the box correction for degrees of W o r n from sample data in randomized block and split-plot designs. Educational Statis- tics, 1, 69-82.

TIMING IN BASEBALL PITCHING 67
Jaccard, J., Becker, M.A., &Wood, G. (1984). Pairwise multiple comparison procedures: A review. Psychological Bulletin, 96, 589-596.
Nigg, B.M., Denoth, J., Kerr, B., Luethi, S., Smith, D., & Stacoff, A. (1984). Load sport shoes and playing surfaces. In E.C. Frederick (Ed.), Sport shoes andplaying suflaces (pp. 1-23). Champaign, IL: Human Kinetics.
Pappas, A.M., Zawacki, R.M., & Sullivan, T.J. (1985). Biomechanics of baseball pitch- ing. The American Journal of Sports Medicine. 13, 216-222.
Polk, R. (1982). Baseball playbook. Mississippi State, MS: Mississippi State University. Ryan, N., & Torre, J. (1977). Pitching and hitting. Englewood Cliffs, NJ: PrenticeHall. Sain, J., & Andrews, J.R. (1985). Proper pitching technique. In B. Zarins, J.R. Andrews,
& W.G. Carson (Eds.), Injuries to the throwing a m (pp. 30-37). Philadelphia: W.B. Saunders.
Shaw, B. (1977). Pitching: The basicfundamentals and mechanics of successfulpitching. New York: Viking.
Speiser, T.R. (1975). A comparison of the linear velocity of the baseball inpitchingfrom the windup position, stretch position and modified windup. Unpublished master's thesis, Springfield College.
Thurston, B. (1985). Baseball pitching: The mechanics of correct technique. Videotape available from Department of Human Movement and Recreation Studies, Univer- sity of Western Australia, Perth.
Acknowledgment
The authors thank the Western College of Advanced Education for the financial assistance for this study.