in-canopy environment of sprinkler irrigated potato … - in... · rain, irrigation water, and dew...
TRANSCRIPT
In-canopy Environment of Sprinkler Irrigated Potato Fieldsas a Factor for Late Blight Management in the SemiaridEnvironment of the Columbia Basin
Dennis A. Johnson1& Thomas F. Cummings1
# The Potato Association of America 2016
Abstract Relative humidity (RH), leaf wetness and tempera-ture were quantitatively characterized within potato crop can-opies and their potential effect on late blight development wasestimated in commercial potato fields under sprinkler irriga-tion in the Columbia Basin in 1993, 1994, 1996, 2004, and2013. Humid periods of relative humidity>90 % for 10 ormore hours per day with mean temperatures favorable of lateblight development were not observed prior to canopy clo-sure. However, at and after canopy closure, a total of 34 of54 (62.9 %) weeks summed over 5 fields during 1993, 1994,1996, and 2004 had humid periods favorable for late blightdevelopment when considering 10 h humid periods, and atotal of 47 of 54 (87 %) weeks had late blight favorable pe-riods when considering 12 h humid periods. In 2013, the meannumber of days per week after canopy closure from four sitesranged from 0 to 5.5 days when RH was>90 % for at least10 h per day, ranged from 0 to 4.3 days when RH was>90 %for at least 12 h per day, ranged from 0 to 3.0 days when RHwas>90 % for at least 14 h per day, and ranged from 0 to2.0 days when RH was>90 % for at least 16 h per day. Dailyhours of contiguous RH>90% varied between mid- and low-canopy levels, monitoring sites within fields and betweenfields. Daily humid periods favorable for late blight develop-ment were frequent in June at mid- and low-canopy levels andcontinued intermittently in July and August in 2 of 2 fields in2013. Mean temperatures after row closure were generallyfavorable for late blight development during the humid pe-riods and were > 7.2 °C in June and>12.2 °C in July and
August. Number of rainy days per week and weeks with longperiods of RH>90 % within the potato canopy was signifi-cantly correlated, indicating that rare rain events in a semi-aridenvironment promote long periods of RH in irrigated fields.However, favorable late blight periods occurred without rainand were a factor of sprinkler irrigation. Canopy and ambientrelative humidity and temperatures were highly associated,and the association could be used to model late blight devel-opment from existing, proximal weather stations. The meanhourly RH over the trial season at all sites for potato canopiesattained minima between 1500 and 1700 h in 2013 of<46 %.From the minima the RH increased rapidly to approximately2200 h then increased moderately until attaining maxima at0600. Monitoring duration of RH>90 % was more practicaland efficient than monitoring leaf wetness.
Resumen Se caracterizaron cuantitativamente la humedadrelativa (RH), la humedad de la hoja y la temperatura, al interiordel follaje del cultivo de papa, y se estimó su efecto potencialen el desarrollo del tizón tardío en campos comerciales de papabajo riego por aspersión en la rivera del Columbia en 1993,1994, 1996, 2004 y 2013. No se observaron períodos dehumedad relativa >90 % por 10 o más horas al día, contemperaturas medias favorables para el desarrollo del tizóntardío antes del cierre del follaje. No obstante, durante ydespués del cierre de la parte aérea, un total de 34 de 54(62.9 %) semanas sumadas sobre cinco campos durante 1993,1994, 1996 y 2004 tuvieron períodos de humedad favorablespara el desarrollo del tizón cuando se consideraron lapsos de10 horas de humedad, y un total de 47 de 54 (87 %) semanastuvieron períodos favorables para el tizón cuando seconsideraron lapsos de humedad de 12 horas. En el 2013, elpromedio del número de días por semana después del cierre delfollaje de cuatro sitios fluctuó de 0 a 5.5 días cuando la RH fue>90 % por lo menos 10 hs por día. La amplitud fue de 0 a 4.3
* Dennis A. [email protected]
1 Washington State University, Pullman, WA 99164, USA
Am. J. Potato Res.DOI 10.1007/s12230-016-9500-1

días cuando la RH fue >90 % por lo menos 12 hs por día. Elrango fue de 0 a 3.0 días cuando la RH fue >90% por lo menos14 hs por día, y varió de 0 a 2.0 días cuando la RH era de >90%por lo menos 16 hs diarias. Las horas diarias de RH >90 %contiguas variaron entre niveles medio y bajo del follaje alcuantificarse sitios dentro y entre los campos. Los períodosdiarios de humedad favorable para el desarrollo del tizóntardío fueron frecuentes en junio en niveles medio y bajo defollaje y continuaron intermitentemente en julio y agosto en dosde dos campos en 2013. Las temperaturas medias despuésdel cierre del follaje fueron generalmente favorables para eldesarrollo del tizón tardío durante los períodos húmedos, yfueron >7.2 ° C en junio y >12.2 ° C en julio y agosto.Como se esperaba, las temperaturas medias estuvieronnegativamente correlacionadas con la humedad relativa. Elnúmero de días lluviosos por semana, y semanas conperíodos largos de RH >90 % al interior del follaje de la papa,estuvieron correlacionados significativamente, indicando queeventos raros de lluvia en un ambiente semiárido promuevenperíodos largos de RH en campos de riego. No obstante, sepresentaron períodos favorables para el tizón tardío sinlluvia, y fueron un factor en riego por aspersión. Elfollaje, la humedad relativa del ambiente y las temperaturas,estuvieron estrechamente asociados, y la asociación pudousarse para modelar el desarrollo del tizón tardío de estacionesmeteorológicas existentes cercanas. Lamedia de RH por horassobre el ciclo de cultivo de los ensayos en todos los sitios paralos follajes de la papa alcanzó la mínima entre 1500 a 1700horas en 2013 de <46 %. De la mínima, la RH se incrementórápidamente a aproximadamente 2200 horas. Después elincremento fue moderado, hasta alcanzar una máxima a las0600 horas de >90 %. La duración del monitoreo de RH>90 % fue más práctico y eficiente que el de la humedad dela hoja.
Keywords Microclimate . Disease forecasting . Relativehumidity . Leaf wetness . Late blightmanagement
Introduction
The Columbia Basin of Washington and Oregon is similar toother regions of the world where potato late blight, caused byPhytophthora infestans, is dependent on the physical environ-ment for development (Johnson et al. 1996, 2009). Foliageand tubers of potato cultivars grown in the region are suscep-tible to infection (Inglis et al. 1996; Porter et al. 2004) andaggressive genotypes of P. infestans are often present (Milleret al. 1995; Miller and Johnson 2000; Porter and Johnson2007). When initial inoculum of P. infestans is present, onlya favorable environment and sufficient time are needed forepidemic development (Hirst and Stedman 1960).
The role of environment on late blight epidemics is exten-sively documented (Bashi et al. 1982; Harrison 1992;Minogue and Fry 1981; Rotem et al. 1971). Cool, wet weatherwith rainfall, ambient relative humidity above 90 %, and tem-peratures of 7 to 24 °C favor development of late blight (Lacey1967; Rotem et al. 1971). Sprinkler irrigation increases lateblight in semiarid regions (Easton 1982; Rotem et al. 1970;Rotem and Cohen 1974). High humidity in the crop canopyfavors sporulation of P. infestans and leaf wetness is crucialfor infection.
Early season rain is an effective predictor of potato lateblight epidemics in the Columbia Basin (Johnson et al.1998, 2009), and is likely important for the build-up ofinoculum in fields during the early stage of epidemics.Early in epidemics, moisture promotes transmission ofP. infestans from infected seed tubers to emerged shootsin fields. Transmission from seed tubers to shoots bearingsporangia can occur within 24 h during rainy weather(Johnson 2010). Secondary infections will proceed almostimmediately if a favorable environment with moisture con-tinues. Moisture is also essential for effective dissemination ofsporangia to additional fields. Rain, irrigation water, and dewsupply high humidity for sporulation andmoisture for infection.
Solar irradiance disfavors late blight development (Johnson2009; Mizubuti et al. 2000; Porter and Johnson 2004; Sunseriet al. 2002). Reduced solar irradiance due to cloud coveris correlated with the increasing incidence of late blightepidemics in the Columbia Basin (Johnson et al. 2009).Ultraviolet light reduces survivability of sporangia and cloudydays contribute to late blight development within fields andpossible dissemination to adjacent fields (Sunseri et al. 2002).
Ambient temperatures are generally favorable for lateblight development after canopy closure between crop rowsin the Columbia Basin. Canopy closure is when foliage be-tween rows come in contact and, for the main cultivars grownincluding Russet Burbank, generally begins from the first tosecond week of June in the southern Columbia Basin to theend of June in the northern Basin. The canopy environmentafter canopy closure often contributes to increased risk ofepidemic development (Hirst and Stedman 1960; Van derPlank 1963). Dramatic shifts from local to general epidemicshave been observed after canopy closure (Hirst and Stedman1960; Johnson et al. 2003).
The Columbia Basin of south-central Washington andnorth-central Oregon is a major potato-growing region inNorth America with a semiarid environment. Over 65,000 ha of potato are grown annually in the region with meantuber yields exceeding 74 t/ha (Anonymous 2014). Potato isplanted mainly in March through April and harvested fromAugust through October. Most potato fields are irrigated bysprinkler, center-pivot systems.
Late blight is managed regionally in the Columbia Basinbecause sporangia of P. infestans can become airborne in
Am. J. Potato Res.

turbulent air currents and be quickly and widely disseminatedwithin the region during cloudy and wet weather (Aylor et al.2001; Sunseri et al. 2002) and, when disease-favoring mildtemperatures and rain occur, they usually prevail over theentire region (Johnson et al. 1998, 2015). Additionally, sprin-kler irrigation may potentially create a favorable microclimatewithin the potato canopy after canopy closure. Consequently,late blight can quickly increase in a field and spread to neigh-boring fields and then to more distant fields (Bashi et al. 1982;Johnson et al. 2003). Late blight and other rapidly spreadingfoliar diseases have been managed regionally (Coakley et al.1984; Henderson et al. 2007; Johnson et al. 1994).
Late blight has not been observed before canopy closure inthe region (Johnson et al. 2009). However, once row closurehas occurred, microclimate conditions generally are favorablefor late blight development whenever a field is irrigated(Easton 1982). Late blight is extremely difficult to manageonce the disease is established in an irrigated field. For exam-ple, in a field with inoculum originating from infected seedtubers, incidence of late blight increased from 0.2 to 70% overa 4-week period after canopy closure even with nine applica-tions of efficacious fungicides (Johnson et al. 2003).
The effect of microenvironment within potato canopies onlate blight develop in the Columbia Basin is not fully under-stood and needs to be better characterized to more efficientlymanage the disease. Quantitative information for temperature,relative humidity and moisture within potato canopies isneeded to augment decision support and disease forecastingsystems. The purpose of this study was to quantitativelycharacterize relative humidity, leaf wetness, and tempera-ture, and estimate their potential effect on late blight devel-opment in commercial potato field under sprinkler irrigationin the Columbia Basin.
Materials and Methods
Air temperature, relative humidity, and leaf wetness weremonitored in seven potato fields of cultivar Russet Burbankin southcentral Washington in 1993, 1994, 1996, 2004, and2013. All fields were irrigated with overhead pivot systems.Six fields were for commercial production and one of twofields in 2013 was at the Washington State UniversityExperiment Station at Othello, WA. Potato growth at theExperiment Station was managed using cultural practicestypical for commercial potato operations in the ColumbiaBasin. Commercial fields were located north of Pasco in1993 (Pasco/93), north of Pasco in 1994 (Glade/94), westof Mesa in 1996 (Mesa/96), northeast of Pasco in 1996(Pasco/96), west of Warden in 2004 (Ward/04), and southof Eureka in 2013 (Eureka).
Soil type was a Quincy loamy fine sand at Pasco/93, Glade/94, Mesa/96, and Eureka in 2013; a Kahlotus very fine sand at
Pasco/96; a Quincy fine sand at Ward/04; and a Shano siltloam at Othello in 2013. Potatoes were planted in April eachyear at 25.4 cmmean spacing between plants within rows and86.4 cm distance between rows. Row furrows were approxi-mately 15 cm below the top of formed hills.
Instrumentation
Temperature and relative humidity (RH) were recorded withhygrothermographs and leaf wetness was recorded withDatapod digital recorders (Omnidata International Inc. Logan,UT) in 1993. Temperature, RH, and leaf wetness were recordedwith Datapod digital recorders in 1994 and 1996 and withSpectrum Watchdog® data loggers (Spectrum Technologies,Inc. Plainfield, IL 60585) in 2004 and 2013. Watchdog sensorsfor RH and temperature were model 450 or model 150 dataloggers and connected to leaf wetness sensors model 3666. Allsensors were calibrated together using humidity chambers andbulb thermometers, respective differences for humidity werewithin<2 % and temperature was<1 %. Mean hourly valueswere recorded and used to calculate means for each variable forvarious time intervals.
Hygrothermographs, digital recorder, temperature sensors,and relative humidity sensors were placed in louvered weathershelters placed approximately 15 cm above the soil surfacewithin a plant row a third of the distance from the outer edgeto the center of circular fields in 1993, 1994, 1996, and 2004.Leaf wetness sensors were 6 x 8 cm rectangular grids paintedwith white latex paint with approximately 10 ml lamp blackadded / l of paint (Sutton et al. 1984) in 1993 through 1996,and Spectrum® leaf wetness sensors were used in 2004 and2013. Leaf wetness sensors were placed at a 45° angle to theupright main stem on the north side of plant at mid height. Allsensors were calibrated prior to use and checked periodicallyduring the assessment period.
Monitoring Sites and Timing
Watch Dog® sensors were placed within the crop canopy attwo monitoring sites per field at Eureka and Othello, WA in2013. The sites were distinguished as W and X at Eureka andY and Z at Othello. Sites were separated by 50 m at Othelloand 200 m at Eureka and contained sensors with rain and solarshields supported with PVC pipe place in a row furrow.Sensors at each site recordedmean hourly data for temperatureand RH at two canopy levels. One canopy level (low-canopy)was at 12 to 15 cm above top of potato hill (base of stemcrown) and the second level (mid-canopy) was 30 to 33 cmabove the top of the hill. Leaf wetness sensors were placedeven with the top of the hill within the furrow at one site
Am. J. Potato Res.

(site Z Othello) and at the mid-canopy level at both sitesat Othello and Eureka.
Ambient environment data for temperature and rainfall weretaken from Washington State University AGWeatherNet(AWN) stations nearest the trial field stations. In 2013 theOthello AWN was 100 m from the Othello canopy sites andthe Fishhook AWN was 1200 m from the Eureka sites.
For the fields studied in 1993 through 2004, the monitoringof environmental variables started approximately 60 daysafter planting and was at or before canopy closure in lateMay (1 to 2 weeks prior to row closure) to early June andcontinued until mid- to late August. In 2013, environmen-tal variables were recorded approximately 60 days afterplanting in fields near row closure on 1 June at Eurekaand 15 June at Othello. Data were collected through 30August which was toward the end of tuber bulking andthe start of canopy collapse and before exposure of sen-sors to direct sun light, giving 77 and 91 days of data atOthello and Eureka, respectively.
Irrigation
All irrigations were monitored, recorded, and scheduled usingsoil moisture data from neutron probes at both fields in 2013by the same consultant (Professional AG Services, Pasco WA99301). Irrigation amounts were collected twice weekly at 3and 4 day intervals throughout the season. Irrigation start andend times varied daily over the season for both fields in 2013where amount and hours of irrigation was dependent ondepths of soil moisture capacity. Because of this variationand being no consistent sign for an irrigation event over thesensor sites, irrigation was treated as random for each hour ofdata collected.
Data Management and Late Blight FavorableConditions
Hours of RH> than 10, 12, 14, and 16 h/day were calculatedfor 24 h periods beginning at noon each day of the monitoringperiod of each year. This permitted the recording of humid andwet periods as occurring on a single day, inasmuch as thesevariables regularly increased in the evening and continued intothe next morning (Thurston et al. 1958). Individual days weregrouped into 7 day weekly periods through the trial period forsummary statistics. Mean temperature was calculated for pe-riods when RH was>90 %.
Due to a large variation between years, cultivation, andweather, data for the five fields taken from 1993 through2004 were presented separately. Data in 2013 for the four sitesfrom two fields were combined and also reported separately.The 2013 data added descriptive statistics between in-field
sites, between fields, and proximal ambient sites to furthercharacterize daily and seasonal environment variation withinthe canopy.
Favorable periods for late blight development were similarto those suggested by Wallin (Wallin 1962; Wallin andWaggoner 1950) and used by Thurston et al. (1958) wherein:RH>90% and mean temperatures for a 10 h period were 15.5to 25 °C, for 12 h 12.2 to 25 °C, and for 14 and 16 h were 7.2to 25 °C. These conditions were considered favorable only ifthe maximum temperature during the following 24 h did notexceed 35 °C (Thurston et al. 1958).
Data Analysis
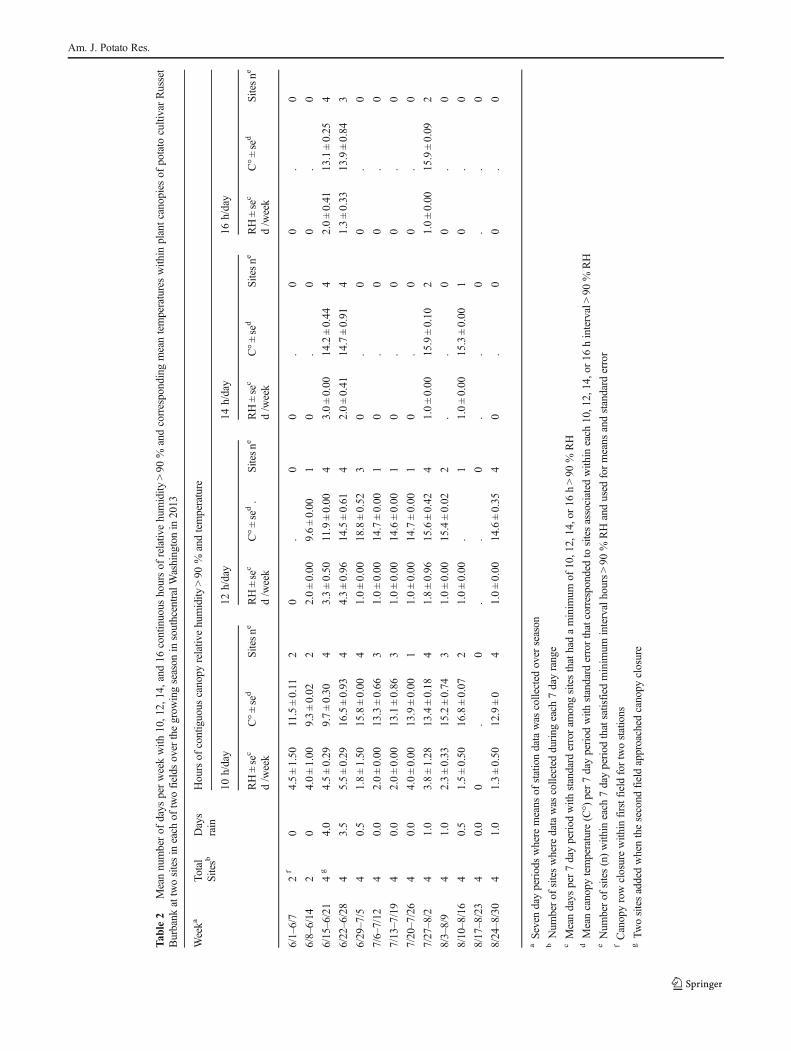
Mean daily data were taken through the season for the vari-ables RH, leaf wetness, temperature, days that had periods ofcontiguous hours of RH>90 %, duration of leaf wetness, andmean temperatures coinciding with hourly periods ofRH>90 %. To facilitate tracking these variables throughoutthe season, daily data were reported in descriptive formats asmean days per week that met RH and temperature criteria forfive single fields over various years between 1993 and 2004(Table 1), combined sites within fields in 2013 (Table 2) andstatistical comparisons between sites in 2013 (Table 3).
The 2013 sites contained a detailed data set for periods ofRH and temperatures that were aligned in time that utilizedmatching irrigation management methods for the fields.Consequently the 2013 data was used to statistically comparefactors within and between sites. Since row closure was offset14 days between fields in 2013, data for sites and levels ofcanopy within sites were analyzed on a per field basis usingPROC GLM and PROC CORR in SAS statistical softwarever. 9.2 (SAS Institute Inc., Cary NC, USA). Site comparisonswithin fields used the mean weekly data as repeated measureson canopy levels for variables and were analyzed by hypothe-sis tests in a one-way repeated measures analysis of variance inProc GLM. Sites were treated as random and canopy levelswere fixed. Significant differences for variables among canopylevels for each field were then derived by Least Square Meanstests using week x site as the error term. Weekly data for fieldswas n= 13 weeks (91 days) at Eureka and n = 11 weeks(77 days) at Othello. Results were assigned P=0.05 signifi-cance level and reported as total number days out of trial daysfor each field for the listed variables.
Descriptive statistics for the 2013 data were generated forthe mean and standard error of hourly RH and temperature(n=24 h) over the trial from canopy closure to 30 August forthe mid-canopy level for sites at Eureka (n=91 days) andOthello (n= 77 days), and for corresponding ambient RHand temperature (Table 4).
Pearson correlation coefficients for data collected in 2013were used to assess the linear relationship between the mean
Am. J. Potato Res.

Table 1 Number of days per week with 10, 12, 14, and 16 contiguoushours of relative humidity > 90 % and corresponding mean temperatureswithin plant canopies of potato cultivar Russet Burbank in five commercial
potato fields over the growing season in southcentral Washington state in1993, 1994, 1996, and 2004
Weekb Pasco/93a Glade/94a Mesa/96a Pasco/96a Ward/04a
RH> 90 d/wkc C°d RH>90 d/wkc C°d RH>90 d/wkc C°d RH> 90 d/wkc C°d RH> 90 d/wkc C°d
10 h
5/25–5/31 –e – 2 10 – – 2 12 – –
6/1–6/7 5 f 16 4 f 12 2 f 18 1 f 15 – –
6/8–6/14 6 14 3 12 3 16 1 16 – –
6/15–6/21 6 17 2 17 5 14 5 15 –f –
6/22–6/28 3 14 2 22 7 16 6 17 6 16
6/29–7/5 4 14 3 14 6 20 1 19 5 15
7/6–7/12 7 14 2 14 6 21 5 21 2 12
7/13–7/19 7 15 6 16 5 16 4 17 4 13
7/20–7/26 5 15 3 17 5 22 7 23 6 16
7/27–8/2 5 14 3 16 3 19 5 16 4 15
8/3–8/9 2 17 4 13 5 20 3 20 4 15
8/10–8/16 3 14 4 14 4 19 5 17 7 14
8/17–8/23 – – – – – – 3 19 2 17
12 h
5/25–5/31 –e – 0 – – – 0 – – –
6/1–6/7 5 f 16 3 f 12 0 f – 0 f – – –
6/8–6/14 5 15 2 14 3 16 0 – – –
6/15–6/21 6 17 2 17 5 14 4 15 –f –
6/22–6/28 3 14 1 11 6 16 5 17 5 16
6/29–7/5 3 15 2 15 4 19 1 21 5 15
7/6–7/12 6 13 0 – 4 21 4 21 1 14
7/13–7/19 7 15 6 16 4 17 4 17 3 14
7/20–7/26 3 15 1 15 5 22 5 22 4 17
7/27–8/2 4 14 2 16 1 19 3 17 0 –
8/3–8/9 2 17 2 14 3 21 1 23 2 15
8/10–8/16 2 15 4 14 3 18 3 17 2 14
8/17–8/23 – – – – – – 3 19 2 17
14 h
5/25–5/31 –e – 0 – – – 0 – – –
6/1–6/7 5 f 16 2 f 12 0 f – 0 f – – –
6/8–6/14 5 15 2 14 0 – 0 – – –
6/15–6/21 5 22 2 17 3 15 2 14 –f –
6/22–6/28 1 12 0 – 5 17 1 18 3 17
6/29–7/5 2 15 2 14 3 19 0 – 0 –
7/6–7/12 2 25 0 – 2 22 2 20 0 –
7/13–7/19 5 15 1 16 4 17 2 16 0 –
7/20–7/26 1 16 0 – 4 22 5 22 2 20
7/27–8/2 0 – 1 16 0 – 1 19 0 –
8/3–8/9 0 – 0 – 0 – 0 – 1 17
8/10–8/16 1 16 0 – 0 – 0 – 1 15
8/17–8/23 – – – – – – 2 19 0 –
16 h
5/25–5/31 –e – 0 – – – 0 – – –
6/1–6/7 3 f 16 0 f – 0 f – 0 f – – –
Am. J. Potato Res.

hourly data over the trial period at each monitoring site amongthe variables of RH, temperature, and leaf wetness within mid-canopy. Similarly correlation coefficients were made to assessthe linear relationship between mid-canopy measurementswith proximal ambient measurements (Table 5). Pearson cor-relations for the two fields in 2013 were used to determine ifthe number of days per week having 10, 12, 14, and 16 con-tinuous hours of RH>90 % at mid-canopy was correlated tothe number of days per week having an ambient rain event ortotal ambient rain over the trial period (Table 6).
Results
1993 to 2004 Canopy
Prior to canopy closure, 2 days per week were observedwhen RH was>90 % for at least10 h per day at Glade/94and Pasco/96. Mean temperatures during the humid periodswere<15.5 °C; therefore, the humid periods were considerednot to be favorable for late blight development. There were nodays before row closure when RH was > 90 % for 12 h(Table 1). Sensors were not placed in the other three fieldsbefore row closure from 1993 to 2004.
At and after canopy closure, number of days per weekwhen RH was>90 % for at least 10 h in 1993, 1994, 1996,and 2004 ranged from 1 to 7. Mean temperatures duringhumid periods were>15.5 °C for 5 of 11 weeks at each
Pasco/93 and Glade/94, 10 of 11 at Mesa/96, 10 of 12 atPasco/96, and 3 of 9 at Ward/04 (Table 1). A total of 33of 54 (61.1 %) weeks summed over the 5 fields hadhumid periods favorable for late blight development whenconsidering 10 h periods.
Number of days per week at and after canopy closure whenRHwas>90% for 12 h per day andmean temperature>12 °Cranged from 2 to 7 days for 11 of 11 weeks at Pasco/93, 1 to6 days for 8 of 11 at Glade/94, 1 to 6 days for 10 of 11 atMesa/96, 1 to 5 days for 10 of 12 at Pasco/96, and 1 to 5 daysfor 8 of 9 at Ward/04 (Table 1). A total of 47 of 54 (87 %)weeks were considered favorable for late blight whensummed over the 5 fields with 12 h humid periods withmean temperatures>12 °C.
Relative humidity was > 90 % and mean temperaturewas>7.2 °C after canopy closure for 14 h per day for≥1 daya week for 9 of 11 weeks at Pasco/93, 6 of 11 at Glade/94 andat Mesa/96, 7 of 12 at Pasco/96, and 4 of 9 at Ward/04. Meantemperature during all these humid periods was>7.2 °C, indi-cating favorable late blight. Consequently, a total of 32 of 54(59.3 %) weeks were considered favorable for late blight whensummed over the 5 fields with 14 h humid periods.
Relative humidity was>90% after canopy closure for 16 hper day for≥1 days a week for 7 of 11 weeks at Pasco/93, 2 of11weeks at Glade/94, 5 of 11weeks atMesa/96, 6 of 12weeksat Pasco/96, and 1 of 9 weeks at Ward/04 (Table 1). Meantemperature during all these humid periods as>7.2 °C, indi-cating favorable late blight. A total of 21 of 54 weeks summed
Table 1 (continued)
Weekb Pasco/93a Glade/94a Mesa/96a Pasco/96a Ward/04a
RH> 90 d/wkc C°d RH>90 d/wkc C°d RH>90 d/wkc C°d RH> 90 d/wkc C°d RH> 90 d/wkc C°d
6/8–6/14 4 15 0 – 0 – 0 – – –
6/15–6/21 4 19 1 15 2 16 1 14 –f –
6/22–6/28 1 12 0 – 2 18 1 18 0 –
6/29–7/5 1 14 0 – 0 – 0 – 0 –
7/6–7/12 0 – 2 15 1 23 2 20 0 –
7/13–7/19 4 15 0 – 2 17 1 15 0 –
7/20–7/26 0 – 0 – 2 22 1 21 1 21
7/27–8/2 0 – 0 – 0 – 0 – 0 –
8/3–8/9 0 – 0 – 0 – 0 – 0 –
8/10–8/16 1 16 0 – 0 – 0 – 0 –
8/17–8/23 – – – – – – 1 18 0 –
a Fields were in southcentralWashington State north of Pasco in 1993 and 1994, west ofMesa in 1996, northeast of Pasco in 1996, andwest ofWarden in2004 and were designated as Pasco/93, Glade/94, Mesa/96, Pasco/96, and Ward/04, respectivelyb Seven day periods of data collection where field data was recorded within 2 days of start time of initial periodc Mean days per 7 day period that had a minimum of 10, 12, 14, or 16 h > 90 % RHd Mean canopy temperature (C°) per 7 day period that corresponded to data associated within each 10, 12, 14, or 16 h interval > 90 % RHe (−) = sensors either not in place or zero wet period and calculation for temperature was not relevantf Period of canopy closure for fields
Am. J. Potato Res.
Tab
le2
Meannumberof
days
perweekwith
10,1
2,14,and
16continuous
hoursof
relativehumidity
>90
%andcorrespondingmeantemperatureswith
inplantcanopies
ofpotato
cultivarRusset
Burbank
attwositesin
each
oftwofields
over
thegrow
ingseason
insouthcentralWashingtonin
2013
Weeka
Total
Sitesb
Days
rain
Hoursof
contiguous
canopy
relativ
ehumidity
>90
%andtemperature
10h/day
12h/day
14h/day
16h/day
RH±se
c
d/week
C°±se
dSitesne
RH±se
c
d/week
C°±se
d.
Sitesne
RH±se
c
d/week
C°±se
dSitesne
RH±se
c
d/week
C°±se
dSitesne
6/1–6/7
2f
04.5±1.50
11.5±0.11
20
.0
0.
00
.0
6/8–6/14
20
4.0±1.00
9.3±0.02
22.0±0.00
9.6±0.00
10
.0
0.
0
6/15–6/21
4g
4.0
4.5±0.29
9.7±0.30
43.3±0.50
11.9±0.00
43.0±0.00
14.2±0.44
42.0±0.41
13.1±0.25
4
6/22–6/28
43.5
5.5±0.29
16.5±0.93
44.3±0.96
14.5±0.61
42.0±0.41
14.7±0.91
41.3±0.33
13.9±0.84
3
6/29–7/5
40.5
1.8±1.50
15.8±0.00
41.0±0.00
18.8±0.52
30
.0
0.
0
7/6–7/12
40.0
2.0±0.00
13.3±0.66
31.0±0.00
14.7±0.00
10
.0
0.
0
7/13–7/19
40.0
2.0±0.00
13.1±0.86
31.0±0.00
14.6±0.00
10
.0
0.
0
7/20–7/26
40.0
4.0±0.00
13.9±0.00
11.0±0.00
14.7±0.00
10
.0
0.
0
7/27–8/2
41.0
3.8±1.28
13.4±0.18
41.8±0.96
15.6±0.42
41.0±0.00
15.9±0.10
21.0±0.00
15.9±0.09
2
8/3–8/9
41.0
2.3±0.33
15.2±0.74
31.0±0.00
15.4±0.02
2.
.0
0.
0
8/10–8/16
40.5
1.5±0.50
16.8±0.07
21.0±0.00
.1
1.0±0.00
15.3±0.00
10
.0
8/17–8/23
40.0
0.
0.
.0
..
0.
.0
8/24–8/30
41.0
1.3±0.50
12.9±0
41.0±0.00
14.6±0.35
40
.0
0.
0
aSeven
dayperiodswhere
means
ofstationdatawas
collected
over
season
bNum
berof
siteswhere
datawas
collected
during
each
7dayrange
cMeandays
per7dayperiod
with
standard
erroram
ongsitesthathadaminim
umof
10,12,14,or16
h>90
%RH
dMeancanopy
temperature
(C°)per7dayperiod
with
standard
errorthatcorresponded
tositesassociated
with
ineach
10,12,14,or16
hinterval>90
%RH
eNum
berof
sites(n)with
ineach
7dayperiod
thatsatisfied
minim
umintervalhours>90
%RHandused
formeans
andstandard
error
fCanopyrowclosurewith
infirstfield
fortwostations
gTw
ositesaddedwhenthesecond
fieldapproached
canopy
closure
Am. J. Potato Res.

over the 5 fields had 16 h humid periods considered favorablefor late blight.
2013 Canopy Data
Data were not recorded before canopy closure on 1 June atEureka and 15 June at Othello in 2013. Mean number of daysper week with RH>90 % ranged from 0 to 5.5 days for atleast10 h per day, 0 to 4.3 days for 12 h per day, 0 to 3 days for14 h per day, and 0 to 2 days for 16 h per day in 2013(Table 2). Relative humidity was>90 % for 16 h more thanone day a week at 4 of 4 sites and 3 of 3 sites during the weeksof June 15 and June 22, respectively. Mean temperatureswere>15.5 °C 3 of the 12 weeks when RH was>90 % forat least 10 h/ day, was>12.2 °C 8 of the 11 weeks when RHwas>90 % for at least 12 h per day, and was>7.2 °C 4 of4 weeks for 14 h and 3 of 3 for 16 h when RH>90 % for each14 and 16 h, respectively, per day in 2013 (Table 2). Fourteenof the 26 humid periods after row closure were consideredfavorable for late blight development.
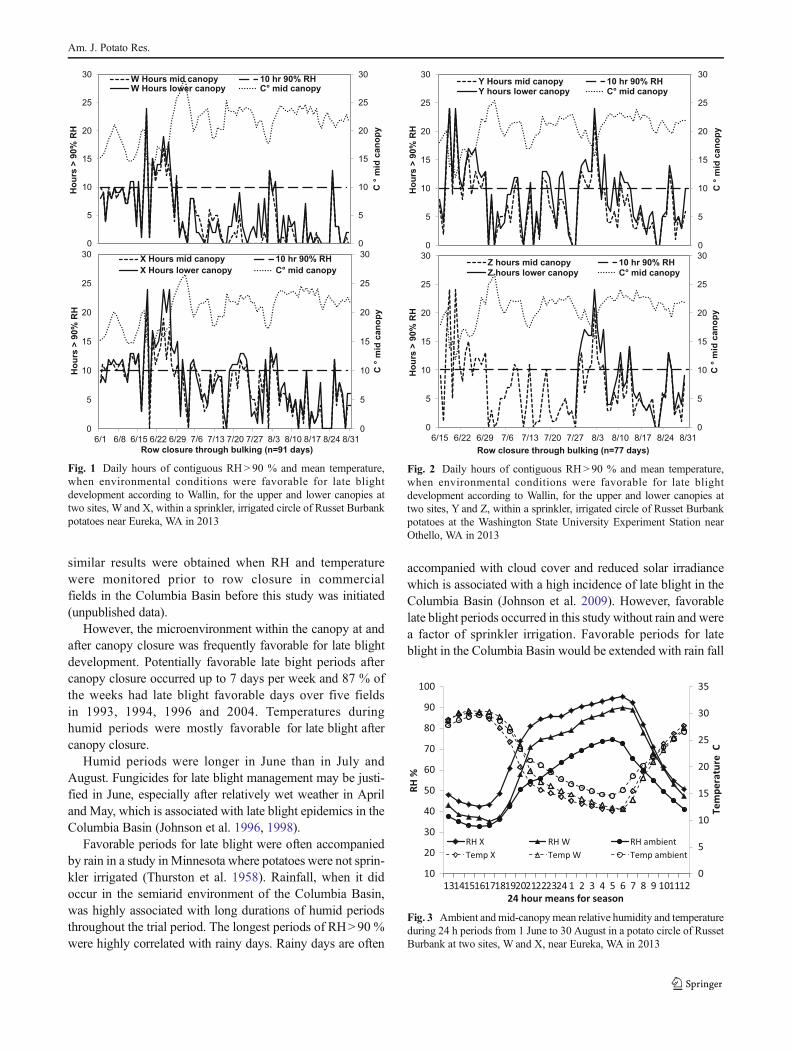
Daily hours of contiguous RH>90 % over the trial periodvaried between canopy levels, the twomonitoring sites at eachfield and the fields at each Eureka and Othello in 2013. Dailyhumid periods favorable for late blight development were fre-quent in June for both canopy levels at both sites in both fields(Figs. 1 and 2). Favorable humid periods in July and Augustwere occasional at both sites at Eureka and Othello, but werepresent the end of July and early August at the X site at Eureka
and at both sites at Othello (Figs. 1 and 2). Mean temperaturewere > 7.2 °C in June and > 12.2 °C in July and August(Figs. 1 and 2).
Twice the number of days with RH>90 % for 10 h for themid- and low-canopies was observed at site X than site W atEureka over the trial period. The difference was statisticallysignificant (P<0.05). Similarly, the low-canopy at site X atEureka had significantly more days with RH>90 % for 12and 14 h than either canopy level at site W at Eureka. MeanRH for the trial period was significantly greater at Eurekasite X for the mid- and low-canopy levels than eithercanopy level at site W. However, at Othello, mean RHand hours of RH >90 % did not differ significantly betweensites at the mid-canopy level, but RH categories differed sig-nificantly between the mid- and low-canopy levels at site Y(Table 3). Mean RH was higher and mean temperature waslower within the canopy than ambient conditions at both fieldsin 2013 (Tables 3 and 4).
Relative humidity and temperatures were higher at theOthello ambient station than the Eureka ambient station forsimilar hours and were generally reflected within the canopyfor the corresponding field sites. Standard errors generallydecreased as RH increased approaching saturation as did thecorresponding declining temperatures (Table 4).
Curves for RH verses 24 h time periods for the two mon-itoring sites and ambient weather station near Eureka had sim-ilar shapes but differed inmagnitude (Table 4 and Fig. 3). Datafor the hourly time periods at the Othello sites, along with theambient weather station, had similar responses and differed in
Table 3 Number of days when relative humidity was > 90% for 10, 12,14, and 16 h, mean relative humidity, mean temperature, and meantemperature when relative humidity was > 90 % during the trial period
at two canopy levels at two sites, within two potato circles with ambienttemperature in 2013
Field (days)a Canopy Number of days for RH≥ 90 % mn Season Temperature C°
Site Levelb >10 h. >12 h. >14 h. >16 h. mn % RH Mean RH>90 %
Eureka (91) X Upper 40 a 14 b 6 b 4 71.2 a 20.5 b 13.0 b
X Lower 39 a 27 a 12 a 6 76.0 a 19.8 c 14.0 a
W Upper 20 b 11 b 5 b 2 64.2 b 21.1 a 12.9 b
W Lower 19 b 11 b 7 b 3 66.0 b 20.5 b 12.9 b
lsd 15.6 9.0 4.3 5.3 4.95 0.51 0.86
Ambient 0 0 0 0 53.3 22.1 15.2
Othello (77) Z Upper 26 b 13 b 6 b 4 69.8 b 20.7 a 13.7 b
Z Lower . . . . . . .
Y Upper 24 b 14 b 6 b 4 71.2 b 20.5 b 13.9 b
Y Lower 37 a 28 a 13 a 8 76.9 a 19.9 c 14.8 a
lsd 4.6 7.2 6.7 5.5 1.84 0.23 0.43
Ambient 6 3 2 1 60.0 21.6 14.9
a Number of days from canopy closer at Eureka and Othello to end of rapid tuber bulking on 30 August 2013b Significance for canopy levels among variables for the two fields based on repeated measures analyses derived from thirteen and eleven weekly meansfor Eureka and Othello respective over a growing a season
Am. J. Potato Res.
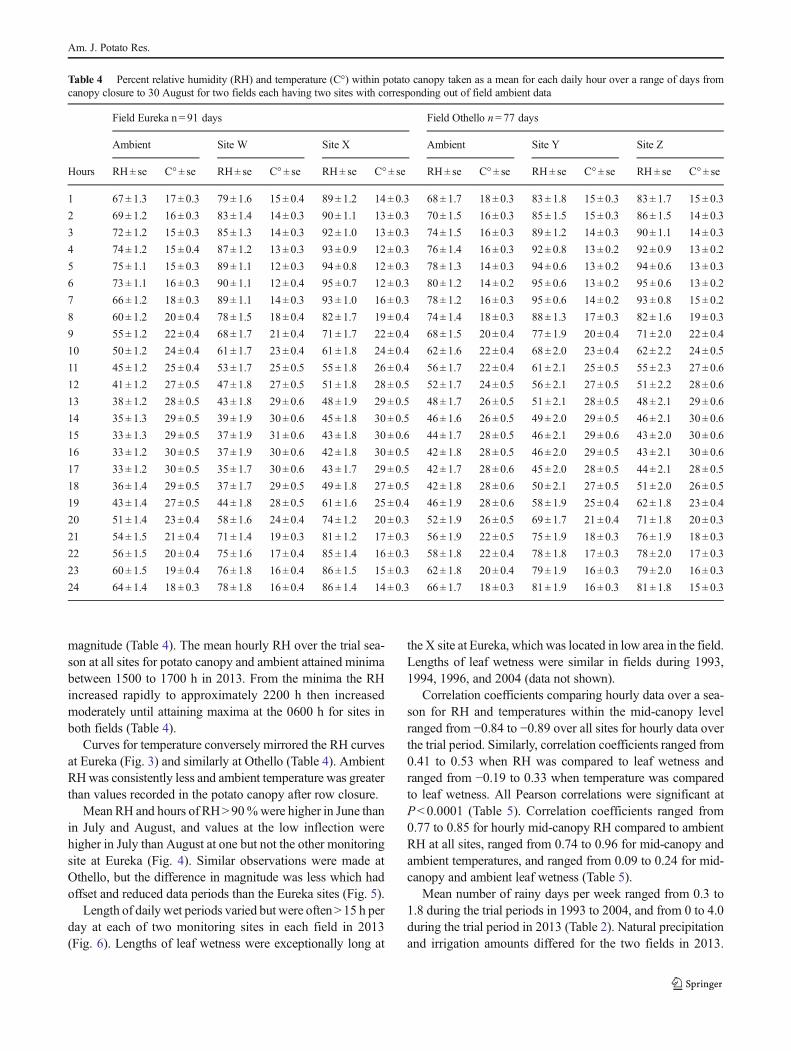
magnitude (Table 4). The mean hourly RH over the trial sea-son at all sites for potato canopy and ambient attained minimabetween 1500 to 1700 h in 2013. From the minima the RHincreased rapidly to approximately 2200 h then increasedmoderately until attaining maxima at the 0600 h for sites inboth fields (Table 4).
Curves for temperature conversely mirrored the RH curvesat Eureka (Fig. 3) and similarly at Othello (Table 4). AmbientRHwas consistently less and ambient temperature was greaterthan values recorded in the potato canopy after row closure.
Mean RH and hours of RH>90%were higher in June thanin July and August, and values at the low inflection werehigher in July than August at one but not the other monitoringsite at Eureka (Fig. 4). Similar observations were made atOthello, but the difference in magnitude was less which hadoffset and reduced data periods than the Eureka sites (Fig. 5).
Length of daily wet periods varied but were often>15 h perday at each of two monitoring sites in each field in 2013(Fig. 6). Lengths of leaf wetness were exceptionally long at
the X site at Eureka, which was located in low area in the field.Lengths of leaf wetness were similar in fields during 1993,1994, 1996, and 2004 (data not shown).
Correlation coefficients comparing hourly data over a sea-son for RH and temperatures within the mid-canopy levelranged from −0.84 to −0.89 over all sites for hourly data overthe trial period. Similarly, correlation coefficients ranged from0.41 to 0.53 when RH was compared to leaf wetness andranged from −0.19 to 0.33 when temperature was comparedto leaf wetness. All Pearson correlations were significant atP<0.0001 (Table 5). Correlation coefficients ranged from0.77 to 0.85 for hourly mid-canopy RH compared to ambientRH at all sites, ranged from 0.74 to 0.96 for mid-canopy andambient temperatures, and ranged from 0.09 to 0.24 for mid-canopy and ambient leaf wetness (Table 5).
Mean number of rainy days per week ranged from 0.3 to1.8 during the trial periods in 1993 to 2004, and from 0 to 4.0during the trial period in 2013 (Table 2). Natural precipitationand irrigation amounts differed for the two fields in 2013.
Table 4 Percent relative humidity (RH) and temperature (C°) within potato canopy taken as a mean for each daily hour over a range of days fromcanopy closure to 30 August for two fields each having two sites with corresponding out of field ambient data
Field Eureka n = 91 days Field Othello n= 77 days
Ambient Site W Site X Ambient Site Y Site Z
Hours RH± se C° ± se RH± se C° ± se RH± se C°± se RH± se C° ± se RH± se C° ± se RH± se C° ± se
1 67± 1.3 17 ± 0.3 79± 1.6 15± 0.4 89 ± 1.2 14± 0.3 68± 1.7 18 ± 0.3 83± 1.8 15± 0.3 83± 1.7 15± 0.3
2 69± 1.2 16 ± 0.3 83± 1.4 14± 0.3 90 ± 1.1 13± 0.3 70± 1.5 16 ± 0.3 85± 1.5 15± 0.3 86± 1.5 14± 0.3
3 72± 1.2 15 ± 0.3 85± 1.3 14± 0.3 92 ± 1.0 13± 0.3 74± 1.5 16 ± 0.3 89± 1.2 14± 0.3 90± 1.1 14± 0.3
4 74± 1.2 15 ± 0.4 87± 1.2 13± 0.3 93 ± 0.9 12± 0.3 76± 1.4 16 ± 0.3 92± 0.8 13± 0.2 92± 0.9 13± 0.2
5 75± 1.1 15 ± 0.3 89± 1.1 12± 0.3 94 ± 0.8 12± 0.3 78± 1.3 14 ± 0.3 94± 0.6 13± 0.2 94± 0.6 13± 0.3
6 73± 1.1 16 ± 0.3 90± 1.1 12± 0.4 95 ± 0.7 12± 0.3 80± 1.2 14 ± 0.2 95± 0.6 13± 0.2 95± 0.6 13± 0.2
7 66± 1.2 18 ± 0.3 89± 1.1 14± 0.3 93 ± 1.0 16± 0.3 78± 1.2 16 ± 0.3 95± 0.6 14± 0.2 93± 0.8 15± 0.2
8 60± 1.2 20 ± 0.4 78± 1.5 18± 0.4 82 ± 1.7 19± 0.4 74± 1.4 18 ± 0.3 88± 1.3 17± 0.3 82± 1.6 19± 0.3
9 55± 1.2 22 ± 0.4 68± 1.7 21± 0.4 71 ± 1.7 22± 0.4 68± 1.5 20 ± 0.4 77± 1.9 20± 0.4 71± 2.0 22± 0.4
10 50± 1.2 24 ± 0.4 61± 1.7 23± 0.4 61 ± 1.8 24± 0.4 62± 1.6 22 ± 0.4 68± 2.0 23± 0.4 62± 2.2 24± 0.5
11 45± 1.2 25 ± 0.4 53± 1.7 25± 0.5 55 ± 1.8 26± 0.4 56± 1.7 22 ± 0.4 61± 2.1 25± 0.5 55± 2.3 27± 0.6
12 41± 1.2 27 ± 0.5 47± 1.8 27± 0.5 51 ± 1.8 28± 0.5 52± 1.7 24 ± 0.5 56± 2.1 27± 0.5 51± 2.2 28± 0.6
13 38± 1.2 28 ± 0.5 43± 1.8 29± 0.6 48 ± 1.9 29± 0.5 48± 1.7 26 ± 0.5 51± 2.1 28± 0.5 48± 2.1 29± 0.6
14 35± 1.3 29 ± 0.5 39± 1.9 30± 0.6 45 ± 1.8 30± 0.5 46± 1.6 26 ± 0.5 49± 2.0 29± 0.5 46± 2.1 30± 0.6
15 33± 1.3 29 ± 0.5 37± 1.9 31± 0.6 43 ± 1.8 30± 0.6 44± 1.7 28 ± 0.5 46± 2.1 29± 0.6 43± 2.0 30± 0.6
16 33± 1.2 30 ± 0.5 37± 1.9 30± 0.6 42 ± 1.8 30± 0.5 42± 1.8 28 ± 0.5 46± 2.0 29± 0.5 43± 2.1 30± 0.6
17 33± 1.2 30 ± 0.5 35± 1.7 30± 0.6 43 ± 1.7 29± 0.5 42± 1.7 28 ± 0.6 45± 2.0 28± 0.5 44± 2.1 28± 0.5
18 36± 1.4 29 ± 0.5 37± 1.7 29± 0.5 49 ± 1.8 27± 0.5 42± 1.8 28 ± 0.6 50± 2.1 27± 0.5 51± 2.0 26± 0.5
19 43± 1.4 27 ± 0.5 44± 1.8 28± 0.5 61 ± 1.6 25± 0.4 46± 1.9 28 ± 0.6 58± 1.9 25± 0.4 62± 1.8 23± 0.4
20 51± 1.4 23 ± 0.4 58± 1.6 24± 0.4 74 ± 1.2 20± 0.3 52± 1.9 26 ± 0.5 69± 1.7 21± 0.4 71± 1.8 20± 0.3
21 54± 1.5 21 ± 0.4 71± 1.4 19± 0.3 81 ± 1.2 17± 0.3 56± 1.9 22 ± 0.5 75± 1.9 18± 0.3 76± 1.9 18± 0.3
22 56± 1.5 20 ± 0.4 75± 1.6 17± 0.4 85 ± 1.4 16± 0.3 58± 1.8 22 ± 0.4 78± 1.8 17± 0.3 78± 2.0 17± 0.3
23 60± 1.5 19 ± 0.4 76± 1.8 16± 0.4 86 ± 1.5 15± 0.3 62± 1.8 20 ± 0.4 79± 1.9 16± 0.3 79± 2.0 16± 0.3
24 64± 1.4 18 ± 0.3 78± 1.8 16± 0.4 86 ± 1.4 14± 0.3 66± 1.7 18 ± 0.3 81± 1.9 16± 0.3 81± 1.8 15± 0.3
Am. J. Potato Res.

Eleven rainy days totaling 3.1 cm occurred during the13 weeks of the trail period at Eureka (n=91 days), and 12rainy days totaling 5.3 cm occurred during the 11 weeks of thetrial period at Othello (n=77 days). Amount of irrigation wa-ter and natural rainfall per field was 55.4 cm at Eureka and41.7 cm at Othello. The average daily irrigation and naturalrain amounts over the trial periods was 0.61 cm at Eureka and0.54 cm at Othello.
Number of rainy days per week and amount of rain perweek were both significantly (P<0.002) correlated with num-ber of days per week with long periods of RH>90 % withinthe potato canopy at Eureka and Othello (Table 6). For exam-ple, the correlation coefficient was 0.94 for number of rainydays per week with 14 h of RH>90% at Eureka, and 0.82 fortotal amount of rain per week with 14 h RH>90 % at Eureka(Table 6). Correlation coefficients were higher for number ofrainy days per week with hours RH>90 % than total amountof rain per week compared to days with hours RH>90 % atboth locations. Duration of leaf wetness was not significantlycorrelated (P>0.05) with either number of rainy days perweek or amount of rain per week (data not shown).
There was a significant, positive correlation for the com-bined sites at Othello for biweekly (3 and 4 day) amount ofirrigation water collected over the trial season compared to
similar period number of days with 10, 12, 14, and 16 hRH>90 % (r=0.35 to 0.37, P<0.02). However similar cor-relations for the individual sites were non-significant as werethe combined and individual sites at Eureka. Additionally,there were no significant correlations for the weekly meansfor amount of irrigationwater collected compared to theweeklynumber of days the canopy had 10, 12, 14, and 16 h RH>90%(data not shown). There was a negative correlation betweenamount of weekly irrigation water compared to amount ofambient rain (r=−0.39, P=0.07) at Othello and similarly astronger correlation at Eureka (r=−0.60, P=0.001).
Discussion
The microenvironment near potato plants did not favor poten-tial late blight development before canopy closure, and ex-plains why late blight has not been observed in potato fieldsbefore canopy closure in the Columbia Basin. This result wasexpected since air movement and solar irradiance are not re-stricted by a dense plant canopy and ambient relative humidityis relatively low in the semiarid atmosphere. In addition,
Table 5 Correlation coefficients for corresponding hourly data over thetrial period among relative humidity (RH), temperature (C °), and leafwetness (LW) within the potato mid-canopy level and for correlationsbetween ambient and canopy data at two separated sites each withintwo fields in Washington in 2013
Pearson correlation coefficients |r|a
Field / siteb Within canopy |r| Ambientc x Canopy |r| d
Eureka/W RH x C ° −0.89 RH 0.84
RH x LW 0.53 C ° 0.96
C ° x LW −0.33 LW 0.24
Eureka/X RH x C ° −0.87 RH 0.77
RH x LW 0.41 C ° 0.94
C ° x LW −0.19 LW 0.09
Othello/Y RH x C ° −0.84 RH 0.76
RH x LW 0.43 C ° 0.90
C ° x LW −0.20 LW 0.20
Othello/Z RH x C ° −0.86 RH 0.85
RH x LW 0.47 C ° 0.74
C ° x LW −0.26 LW 0.23
a Probability of Pearson correlations < 0.0001b Correlations for each site at Eureka and Othello were n = 2184 andn= 1848 h respectivec Ambient weather stations were proximal to and unique to each fieldd Leaf wetness sensors used in fields and ambient stations used linear butdifferent scalar ordinals
Table 6 Correlation coefficients for number of days per week having10, 12, 14, and 16 continuous hours of relative humidity (RH) > 90 % incv Russet Burbank potato canopy relative to the number of days per weekhaving an ambient rain event and total ambient rain per week at two fieldsover the trial period in Washington in 2013
Pearson correlation coefficients (r)a
Field b (n) Canopy RHdays/week c
No. rainydays /wkd (r)
Total amountrain/wke (r)
Eureka (26)
10 h 0.58 0.52
12 h 0.91 0.88
14 h 0.94 0.82
16 h 0.90 0.81
Othello (22)
10 h 0.64 0.41
12 h 0.84 0.67
14 h 0.89 0.72
16 h 0.77 0.56
a Probability of correlations P< 0.002 except P= 0.05 at Othello at 10 hRH>90 % for amount ambient rain per weekb Weekly data from two sites for each field from row closer at Eureka on6/01 and Othello on 6/15 through 8/30c Data using number of days per weekly periods of RH for all hours andhours of 10, 12, 14, and 16 h of contiguous RH over 90 % at mid-canopyd Data using number of days per weekly periods having measurableambient rain events over the trial periode Data using total amount of precipitation per weekly periods havingmeasurable ambient rain events over the trial period
Am. J. Potato Res.
similar results were obtained when RH and temperaturewere monitored prior to row closure in commercialfields in the Columbia Basin before this study was initiated(unpublished data).
However, the microenvironment within the canopy at andafter canopy closure was frequently favorable for late blightdevelopment. Potentially favorable late bight periods aftercanopy closure occurred up to 7 days per week and 87 % ofthe weeks had late blight favorable days over five fieldsin 1993, 1994, 1996 and 2004. Temperatures duringhumid periods were mostly favorable for late blight aftercanopy closure.
Humid periods were longer in June than in July andAugust. Fungicides for late blight management may be justi-fied in June, especially after relatively wet weather in Apriland May, which is associated with late blight epidemics in theColumbia Basin (Johnson et al. 1996, 1998).
Favorable periods for late blight were often accompaniedby rain in a study inMinnesota where potatoes were not sprin-kler irrigated (Thurston et al. 1958). Rainfall, when it didoccur in the semiarid environment of the Columbia Basin,was highly associated with long durations of humid periodsthroughout the trial period. The longest periods of RH>90 %were highly correlated with rainy days. Rainy days are often
accompanied with cloud cover and reduced solar irradiancewhich is associated with a high incidence of late blight in theColumbia Basin (Johnson et al. 2009). However, favorablelate blight periods occurred in this study without rain and werea factor of sprinkler irrigation. Favorable periods for lateblight in the Columbia Basin would be extended with rain fall
0
5
10
15
20
25
30
0
5
10
15
20
25
30
C °
mid
can
opy
Hou
rs >
90%
RH
W Hours mid canopy 10 hr 90% RHW Hours lower canopy C° mid canopy
0
5
10
15
20
25
30
0
5
10
15
20
25
30
6/1 6/8 6/15 6/22 6/29 7/6 7/13 7/20 7/27 8/3 8/10 8/17 8/24 8/31
C °
mid
can
opy
Hou
rs >
90%
RH
Row closure through bulking (n=91 days)
X Hours mid canopy 10 hr 90% RHX Hours lower canopy C° mid canopy
Fig. 1 Daily hours of contiguous RH> 90 % and mean temperature,when environmental conditions were favorable for late blightdevelopment according to Wallin, for the upper and lower canopies attwo sites, W and X, within a sprinkler, irrigated circle of Russet Burbankpotatoes near Eureka, WA in 2013
0
5
10
15
20
25
30
0
5
10
15
20
25
30
C °
mid
can
opy
Hou
rs >
90%
RH
Y Hours mid canopy 10 hr 90% RHY hours lower canopy C° mid canopy
0
5
10
15
20
25
30
0
5
10
15
20
25
30
6/15 6/22 6/29 7/6 7/13 7/20 7/27 8/3 8/10 8/17 8/24 8/31
C °
mid
can
opy
Hou
rs >
90%
RH
Row closure through bulking (n=77 days)
Z hours mid canopy 10 hr 90% RHZ hours lower canopy C° mid canopy
Fig. 2 Daily hours of contiguous RH> 90 % and mean temperature,when environmental conditions were favorable for late blightdevelopment according to Wallin, for the upper and lower canopies attwo sites, Y and Z, within a sprinkler, irrigated circle of Russet Burbankpotatoes at the Washington State University Experiment Station nearOthello, WA in 2013
0
5
10
15
20
25
30
35
10
20
30
40
50
60
70
80
90
100
131415161718192021222324 1 2 3 4 5 6 7 8 9 101112
Tem
pera
ture
C
RH %
24 hour means for season
RH X RH W RH ambientTemp X Temp W Temp ambient
Fig. 3 Ambient andmid-canopymean relative humidity and temperatureduring 24 h periods from 1 June to 30 August in a potato circle of RussetBurbank at two sites, W and X, near Eureka, WA in 2013
Am. J. Potato Res.

and increase the potential for late blight development andpromote spread within and between fields. Fungicide applica-tion just before major rainfall would be important in theColumbia Basin if inoculum is present between canopy clo-sure and harvest (Johnson et al. 2015). Forecasts for rain arebeneficial in managing late blight in the Columbia Basin(Johnson et al. 2015).
Significant differences for mean RH and number of dayswith hours of RH>90 % were observed between monitoringsites at Eureka but not at Othello in 2013 (Table 3). This waslargely due to differences in topography of the two fields. Thefield at Eureka had a gradual swale where site W was locatedon the crown and approximately 4 m higher than site X whichwas at the bottom. During field inspections the furrow adja-cent to site W was dry while the furrow at site X was wet orcontained water. The topography at Othello was flat with nodetectable drainage differences between sites. Consequently,variation within fields needs to be considered when scoutingfor disease and managing late blight.
More hours of RH>90 % occurred and mean RH washigher at the low- than the mid-canopy level at the three mon-itoring sites where both variables were recorded in 2013. Asexpected, canopy height is also a factor in placing environ-mental monitoring sensors and on late blight development.
20
30
40
50
60
70
80
90
100RH
%RH
%
W RH JuneW RH JulyW RH August
20
30
40
50
60
70
80
90
100
131415161718192021222324 1 2 3 4 5 6 7 8 9 101112Hours
X RH JuneX RH JulyX RH August
Fig. 4 Mean relative humidity during 24 h periods for early, mid, and lateseason growing stages within mid-canopy in a potato circle of RussetBurbank at two sites, W and X, near Eureka, WA in 2013
20
30
40
50
60
70
80
90
100
RH %
RH %
Y RH 6/16-7/11Y RH 7/12-8/6Y RH 8/7-8/30
20
30
40
50
60
70
80
90
100
131415161718192021222324 1 2 3 4 5 6 7 8 9 101112Hours
Z RH 6/16-7/11Z RH 7/12-8/6Z RH 8/7-8/30
Fig. 5 Mean relative humidity during 24 h periods for early, mid, and lateseason growing stages within mid-canopy in a potato circle of RussetBurbank at two sites, Y and Z, near Othello, WA in 2013
Fig. 6 Hours of leaf wetness in the plant canopy of pivot irrigation circlesat two monitoring sites in commercial fields of cultivar Russet Burbank atEureka and Othello WA in 2013
Am. J. Potato Res.

Canopy temperatures were generally favorable for lateblight development after canopy closure in the ColumbiaBasin. Low temperatures near 7 °C were sometimes encoun-tered in June and would likely retard but may not prevent lateblight development. Late blight may slowly develop in theColumbia Basin when temperatures are less than those con-sidered as favorable in some disease forecasting models(Wallen 1962; Wallin andWaggoner 1950). Late blight devel-opment progressed slowly in the tropical highland regions ofthe Toluca Valley of Mexico at temperatures below thresholdsof 7 to 10 °C, which were defined in north-temperate climates(Grunwald et al. 2000). Temperature thresholds establishedfor predictive models in the north-temperate climates maynot fully account for slowed progress of the pathogen at 7 to10 °C (Grunwald et al. 2000). Relatively high levels of inoc-ulum and long humid and wet periods may compensate forrelatively low temperatures for infection (Johnson et al. 1994;Rotem et al. 1971; Rotem 1978). Because temperatures aregenerally favorable for late blight development, they may notneed to be a major component for late blight managementmodels after row closure for the Columbia Basin.
Hourly mid-canopy relative humidity and temperaturecompared to the corresponding ambient values differed inmagnitude. However, the canopy and proximal ambientvalues were significantly and highly associated at all monitor-ing sites in 2013 (Table 5). This association may be used inmodeling favorable conditions for late blight in a semi-aridregion with existing proximal weather stations. RH varied dueto canopy height and field location in this study. Such varia-tion should be accounted for when predicting the developmentof late blight and in making disease management decisions.
Leaf wetness duration is difficult to define because variousportions of leaves and canopies are wet and dry at differenttimes (Huber and Gillespie 1992). Obtaining reliable datafrom leaf wetness sensors is problematic, especially in potatocanopies, in that sensors require regularly cleaning in the fieldof dirt and plant material to give consistent data. Plant materialsuch as a leaflet adhering to the sensor traps moisture betweenthe two surfaces giving a false value, and frequent trips toclear sensors would trample surrounding foliage and thus alterthe canopymicroenvironment. Consequently, leaf wetness du-ration may be over stated in this study. However, the mainpoint from the leaf wetness data is valid in that wet periodsare sufficient in duration to promote late blight in irrigatedpotato fields in the Columbia Basin.
The arbitrary ordinal data among leaf wetness sensors wasdifficult to relate to temperatures or RH. There were low as-sociations between hourly leaf wetness compared to tempera-tures and RH within the crop canopy (r=−0.33), and betweencanopy and ambient leaf wetness (r=0.24). Also there wereno significance correlations for number of days of leaf wetnesscompared to days with contiguous hours of RH >90% or dayswith rain for the trial season at the two fields in 2013. Leaf
wetness data can be a valuable tool in environmental studiesbut in this study using standard RH and temperature sensingmethods for canopy modeling in a semi-arid region was morepractical and efficient as also noted by Rowlandson et al.(2015).
The management strategy in the Columbia Basin is to ini-tially keep late blight out of fields. Once inoculum is in a field,the disease is extremely difficult to manage. For example, lateblight incidence increased from 0.6 to 70 % in 35 days in afield of Russet Norkotah even with nine fungicide applica-tions being made during that time period. Initial inoculumfor this field originated from infected seed tubers (Johnsonet al. 2003). However, fungicide applications for late blightbefore row closure in the Columbia Basin are likely not war-ranted unless a prolonged rainy period is expected. Rain fore-casts are helpful in identifying future rainy periods (Johnsonet al. 2015). Fungicides could then be effective in protectingfoliage from infection by sporangia (Inglis et al. 1999;Powelson and Inglis 1999) that could be potentially producedon latently infected potato shoot arising from infected seedpieces (Johnson 2010; Johnson and Cummings 2013); Keary1953), and possibly from other inoculum sources such as in-fected refuse tubers and infected volunteer potatoes.
Acknowledgments We thank Dr. Frank Fronek for stimulating discus-sions over several decades on late blight management. We thank Drs.Kenneth Frost, Lyndon D. Porter, and Hilary S. Mayton for their criticalreview of themanuscript. This project was supported by grant 2011-68004-30154 from the USDA National Institute of Food and Agriculture. PPNSno. 0697, Department of Plant Pathology, College of Agricultural, Human,and Natural Resource Sciences Agricultural Research Center, HatchProject No. WNPO 0678, Washington State University, Pullman, WA99164–6430.
References
Anonymous. 2014. Crop Report. National Agricultural Statistics Service.U. S. Dept. Agric. Washington Field Office, Olympia, WA
Aylor, D.E., W.E. Fry, H. Mayton, and J.L. Andrade-Piedra. 2001.Quantifying the rate of release and escape of Phytophthora infestanssporangia from a potato canopy. Phytopathology 91: 1189–1196.
Bashi, E., Y. Ben-Joseph, and J. Rotem. 1982. Inoculum potential ofPhytophthora infestans and the development of potato late blight.Phytopathology 72: 1043–1047.
Coakley, S.M., W.S. Boyd, and R.L. Line. 1984. Development of region-al models that use meteorological variables for predicting stripe rustdisease on winter wheat. Climatic Application Meteorology 23:1234–1240.
Easton, G.D. 1982. Late blight of potatoes and prediction of epidemics inarid central Washington State. Plant Disease 66: 452–455.
Grunwald, N.J., O.A. Rubio-Covarrubias, and W.E. Fry. 2000. Potatolate-blight management in the Toluca Valley: forecasts and resistantcultivars. Plant Disease 84: 410–416.
Harrison, J.G. 1992. Effects of the aerial environment on late blight ofpotato foliage – a review. Plant Pathology 41: 384–416.
Am. J. Potato Res.

Henderson, D., C.J. Williams, and J.S. Miller. 2007. Forecasting lateblight in potato crops of southern Idaho using logistic regressionanalysis. Plant Disease 91: 951–956.
Hirst, J.M., and O.J. Stedman. 1960. The epidemiology of Phytophthorainfestans. II. The source of inoculum. Annual Application Biology48: 489–517.
Huber, L., and T.J. Gillespie. 1992. Modeling leaf wetness in relation toplant disease epidemiology. Annual Review of Phytopathology 30:353–357.
Inglis, D.A., D.A. Johnson, D.E. Legard,W.E. Fry, and P.B. Hamm. 1996.Relative resistances of potato clones in response to new and oldpopulations of Phytophthora infestans. Plant Disease 80: 575–578.
Inglis, D.A., M.L. Powelson, and A.E. Dorrance. 1999. Effect of regis-tered potato seed piece fungicides on tuber-borne Phytophthorainfestans. Plant Disease 83: 229–234.
Johnson, D.A. 2010. Transmission ofPhytophthora infestans from infect-ed potato seed tubers to emerged shoots. Plant Disease 94: 18–23.
Johnson, D.A., and R.F. Cummings. 2013. A plant stem inoculation assayfor assessing transmission of Phytophthora infestans from potatoseed tubers to emerged shoots. Plant Disease 97: 183–188.
Johnson, D.A., J.R. Alldredge, and J.R. Allen. 1994. Weather and downymildew epidemics of hop in Washington State. Phytopathology 84:524–527.
Johnson, D.A., J.R. Alldredge, and D.L. Vakoch. 1996. Potato late blightforecasting models for the semiarid environment of southcentralWashington. Phytopathology 86: 103–106.
Johnson, D.A., J.R. Alldredge, and P.B. Hamm. 1998. Expansion ofpotato late blight forecasting models for the Columbia Basin ofWashington and Oregon. Plant Disease 82: 642–645.
Johnson, D.A., J.R. Alldredge, P.B. Hamm, and B.E. Frazier. 2003. Aerialphotography used for spatial pattern analysis of late blight infectionin irrigated potato circles. Phytopathology 93: 805–812.
Johnson, D.A., T.F. Cummings, R. Abi Ghanem, and J.R. Alldredge.2009. Association of solar irradiance and days of precipitation withincidence of potato late blight in the semiarid environment of theColumbia Basin. Plant Disease 93: 272–280.
Johnson, D.A., T.F. Cummings, and A.D. Fox. 2015. Accuracy of rainforecasts for use in scheduling late blight management tactics in theColumbia Basin of Washington and Oregon. Plant Dis. 99:in press.
Keary, M.W. 1953. Delayed sporulation of Phytophthora infestans oninfected potato shoots. Plant Pathology 2: 68–71.
Lacey, L. 1967. The role of water in the spread of Phytophthora infestansin the potato crop. Annual Application Biology 59: 245–255.
Miller, J.S., and D.A. Johnson. 2000. Competitive fitness of Phytophthorainfestans isolates under semiarid field conditions. Phytopathology90: 220–227.
Miller, J.S., D.A. Johnson, and P.B. Hamm. 1995. Aggressiveness ofisolates of Phytophthora infestans from the Columbia Basin ofWashington and Oregon. Phytopathology 88: 190–197.
Minogue, K.P., and W.E. Fry. 1981. Effect of temperature, relative hu-midity, and rehydration rate on germination of dried sporangia ofPhytophthora infestans. Phytopathology 71: 1181–1184.
Mizubuti, E.S.G., D.E. Aylor, andW.E. Fry. 2000. Survival ofPhytophthorainfestans sporangia exposed to solar radiation. Phytopathology90: 78–84.
Porter, L.D., andD.A. Johnson. 2004. Survival ofPhytophthora infestansin surface water. Phytopathology 94: 380–387.
Porter, L.D., and D.A. Johnson. 2007. Survival of sporangia of newclonal lineages of Phytophthora infestans in soil under semiaridconditions. Plant Disease 91: 835–841.
Porter, L.D., D.A. Inglis, and D.A. Johnson. 2004. Identification andcharacterization of resistance to Phytophthora infestans in leaves,stems, flowers, and tubers of potato clones in the Pacific Northwest.Plant Disease 88: 965–972.
Powelson, M.L., and D.A. Inglis. 1999. Foliar fungicides as protectiveseed piece treatments for management of late blight of potatoes.Plant Disease 83: 265–268.
Rotem, J. 1978. Climatic and weather influences on epidemics. Pages317–338 in. Plant Disease, An Advanced Treatise. J.G. Horsfalland E. B. Cowling, eds. Academic Press, New York.
Rotem, J., and Y. Cohen. 1974. Epidemiological patterns of Phytophthorainfestans under semi-arid conditions. Phytopathology 64: 711–7144.
Rotem, J., J. Palti, and J. Lomas. 1970. Effects of sprinkler irrigation atvarious times of the day on development of potato late blight.Phytopathology 60: 839–843.
Rotem, J., Y. Cohen, and J. Putter. 1971. Relativity of limiting and opti-mum inoculum loads, wetting durations, and temperatures for infec-tion by Phytophthora infestans. Phytopathology 61: 275–278.
Rowlandson, T., M. Gleason, P. Sentelhas, T. Gillespie, C. Thomas, andB. Hornbuckle. 2015. Reconsidering leaf wetness duration determi-nation for plant disease management. Plant Disease 99: 310–319.
Sunseri, M.A., D.A. Johnson, and N. Dasgupta. 2002. Survival of de-tached sporangia of Phytophthora infestans exposed to ambient,relative dry atmospheric conditions. American Journal of PotatoResearch 79: 443–450.
Sutton, J.C., T.J. Gillespie, and P.D. Hidebrand. 1984. Monitoring weath-er factors in relation to plant disease. Plant Disease 68: 78–84.
Thurston, H.D., K. Knutson, and C.J. Eide. 1958. The relation of lateblight development on potato foliage to temperature and humidity.American Potato Journal 35: 397–406.
Van der Plank, J.E. 1963. Sanitation with special reference to potatoblight. Pg. 122–136 in. Plant Diseases: Epidemics and Control.Academic Press, New York.
Wallin, J.R. 1962. Summary of recent progress in predicting late blightepidemics in United States and Canada. American Potato Journal39: 306–312.
Wallin, J.R., and P.E. Waggoner. 1950. The influence of climate in the devel-opment and spread of Phytophthora infestans in artificially inoculatedpotato plots. Plant Disease Reproduction Supplement 190: 19–23.
Am. J. Potato Res.