€¦ · in-depth report aug 29, 2013. ica gruppen . food, glorious food • leading food retailer...
TRANSCRIPT

FOOD RETAIL, SWEDEN
ICA Gruppen
Initiating coverage
In-depth report Aug 29, 2013
Food, glorious food Swedish market leader with strong real estate backing
Solid earnings growth potential coupled with dividend power
Still mispriced, initiating at BUY with a SEK 235 target price
Contents Investment case summary ......................................................................... 4
Valuation and recommendation ................................................................. 6
How Hakon Invest became ICA Gruppen ................................................ 11
Financial forecasts ................................................................................... 13
Company description of ICA Gruppen ..................................................... 26
Nordic and Baltic food retail market dynamics ......................................... 33
Appendix ................................................................................................. 37
Disclosures .............................................................................................. 48
Erik Sandstedt, CFA 0046 (0)8 701 3128

3 August 29, 2013
FOOD RETAIL, SWEDEN Initiating coverage
In-depth report Aug 29, 2013
ICA Gruppen Food, glorious food • Leading food retailer with strong real estate backing
• Solid earnings growth potential coupled with dividend power
• Still mispriced, initiating at BUY with a SEK 235 target price
We see solid earnings growth, deleveraging and good dividends We see a bright future for food retailer ICA Gruppen, whose name was changed from Hakon Invest to reflect a new focus after the acquisition of 60% of the ICA shares from Ahold which gave the group full ownership. We model a solid EBIT CAGR of 9% during 2013-15 accompanied by a further boost to PTP growth thanks to gradually declining financial expenses. While we expect significant deleveraging ahead, we still see a 4% average dividend yield – with capacity to distribute much more.
Valuation multiples a lot lower than they appear The current headline valuation multiples look expensive, but looks can be deceiving. We believe the multiples fail to factor in the real estate portfolio (42% of market cap) and are also heavily inflated by the Norwegian losses. Looking behind these factors, suggests investors can still buy discounted assets: 2014e EV/EBIT of 13.9x drops to 11.7x excl. Norway and 11.9x excl. real estate. We believe ICA Gruppen deserves a premium valuation based on its rock solid Swedish operations, the significant property backing, growth opportunities in the Baltics, and recovery or exit potential in Norway.
Strong track record with a bright future We value ICA Gruppen at SEK 235 per share, based on our sum-of-the-parts approach and backed by our DCF analysis, indicating 22% potential upside to the current share price. We initiate coverage with a BUY on ICA Gruppen, the second-largest listed retailer in the Nordics, boasting a strong track record and a bright future. Company page on Handelsbanken’s REON
Web address: Link to company website IR web address: Link to IR website Next event: Nov 13, 2013: Q3 report
Source: Handelsbanken Capital Markets
Absolute and relative performance
Source: Reuters
Share price (SEK): 193Mkt cap (EURm): 4,468Mkt cap (SEKm): 38,821No of shares (m): 201.1Est. buybacks next 12m (% of MC): n.mFree float (%): 39Avg daily volume (000'): 199Avg daily value (EURm): 4Bloomberg: ICA SSReuters: ICAA.ST
Balance sheet 2012Net debt (SEKm): 12,988
Main owners Votes (%) Capital (%)ICA-handlarnas Förbund 51 51Industrivärden 10 10
90
110
130
150
170
190
95
125
155
185
A S O N D J F M A M J J A
IndexSEK
ICA Gruppen rel. DJ Stoxx 600
% -1m -3m -12mAbsolute: 7 4 89Absolute EUR: 6 3 79Relative DJStoxx: 6 3 5752w range (SEK): 198 / 99.9
SEKm 2011 2012 2013e 2014e 2015e Sales 2,498 99,535 98,780 100,095 102,063 Sales growth (%) -6.2 >900 -0.76 1.3 2.0 Gross margin (%) 44.0 15.1 14.5 14.8 14.9 EBIT adj 302 3,061 3,119 3,440 3,699 margin (%) 12.1 3.1 3.2 3.4 3.6 EBT 252 10,867 2,240 2,800 3,149 EPS reported (SEK) 0.62 42.2 7.4 10.1 11.4 EPS adj (SEK) 1.84 2.18 7.9 10.1 11.4 Y-o-y growth (%) n.m 19 265 28 12 P/E adj (x) 52.3 54.4 24.3 19.1 17.0 P/BV (x) 1.95 1.16 1.66 1.58 1.49 ROE adj (%) 6.1 3.1 7.1 8.5 9.0 EV/EBIT (x) 32.8 12.3 16.0 14.0 12.7 EV/sales (x) 4.0 0.38 0.50 0.48 0.46 FCFE adj yield (%) 2.6 31.1 -17.9 5.5 5.6 Tot DPS (SEK) 5.9 0 6.5 7.5 8.5 Tot Div yield (%) 6.1 0 3.4 3.9 4.4 Net debt/equity (%) -6.5 59.4 48.3 40.3 33.2
12m target return Target price, inc. div. (SEK): 235 Expected total return (%): 22 Expected total dividend yield (%): 3.4 DCF Value (SEK): 243

4 August 29, 2013
Investment case summary Nordic food retailer ICA Gruppen is poised for continued strong performance based on the cornerstones of Swedish market dominance and strong income from its overlooked real estate portfolio, spiced with the recovery/exit potential in ICA Norway. We forecast a 2013-15 EBIT CAGR of 9% and also see a 16% PTP CAGR, supported by gradually lowered interest rate expenses as the group significantly deleverages. The current, expensive-looking valuation multiples are inflated by the Norwegian losses and overlook the real estate portfolio (42% of market cap), suggesting to us that assets are actually priced at a discount. We initiate coverage with a BUY recommendation and target price of SEK 235 and advise investors to finance their ICA Gruppen position with Axfood (REDUCE) based on relative valuation.
How an investment company became a food retailer On February 11, 2013, Hakon Invest announced an agreement on the acquisition of the remaining 60% of the shares in ICA from Ahold for a cash consideration of SEK 20bn. With the completion of the transaction on March 27, 2013, Hakon Invest held all shares in ICA and changed its name to ICA Gruppen to reflect the new direction of the group. ICA Gruppen will be a retail company with four business areas: Food, Banking, Real Estate and Non-food. As of June 30, 2013, ICA Gruppen was owned 51% by the Association of ICA retailers and 10% by AB Industrivärden.
Figure 1: ICA Gruppen structure
Source: Company data
Sweden and Real Estate: Twin pillars of earnings support A cornerstone of ICA’s sound financial position is continued solid performance in ICA Sweden and ICA Real Estate. With a market share of 37%, twice as high as numbers two and three, ICA is the indisputable market leader in Sweden, and it seems likely to us that the business will continue to generate operating profits of at least SEK 3bn per year in the foreseeable future. At the same time, property holdings makes up 42% of market cap and offers steady cash flow generation, factors that are often overlooked in valuations of the company.
Solid EBIT growth, with PTP boosted further by drop in interest costs We model a 2% sales CAGR during 2013-15 and foresee a 9% EBIT CAGR during the same period, driven by a solid performance in ICA Sweden and somewhat lower losses in Norway. As the group is on track of rapid amortisation of debt, we see financial expenses gradually declining, explaining the strong PTP CAGR of 16% that we expect. In a scenario where Norwegian losses do not fall from the 2013 level (HCMe: SEK -769m), we calculate that the 2013e-15e EBIT CAGR would still translates into a solid 4%.
We expect the group to lower the gearing (net debt/EBITDA) to its 1-1.5x long-term target by 2016 (and below 2x 2014e) while distributing at least a 4% average dividend yield, but with a capacity to distribute much more.
ICA Gruppen owns 100% of ICA
Dominant market position in Sweden, and 42% of market cap in property
9% and 16% EBIT and PTP CAGR (2013-15e)
4.0% average dividend yield

August 29, 2013 5
We only see ICA staying in Norway if losses are gradually reduced, either through collaboration or other measures. If profits deteriorate significantly from here, we believe the group will exit the market. As such, the risk of a continued presence in the market, but with significantly accentuating losses is rather low, in our view. Based on our scenario analysis of ICA Norway, we believe the cash cost to exit Norway is SEK 2.2bn, which is also the negative value we assign to this segment in our SOTP valuation.
Figure 2: Two-year CAGR (2013e-15e)
Source: Handelsbanken Capital Markets and company data 2012 and 2013 are pro forma. 2009-2012 ICA. 2013-15 ICA Gruppen
Figure 3: EBIT delta (2013e-15e)
Source: Handelsbanken Capital Markets and company data
Valuation multiples a lot better than they seem ICA Gruppen is trading at a 2014e EV/EBIT of 13.9x. Considering our view of ICA Norway, we also look at the valuation excluding Norway and find that the 2014e EV/EBIT drops substantially to 11.7x. Further, ICA Gruppen has real estate holdings valued at SEK 16bn, or 43% of the current market cap and 33% of the EV. To gain an understanding of the multiple implied by the current share price for the non-property businesses (i.e. Food and Banking), we deduct the real estate market value and earnings from the current market cap. This would result in the share trading at a 2014e EV/ EBIT of 11.9x, in line with Axfood, and at a discount to other Swedish consumer staples.
Figure 4: EV/EBIT valuation
Source: Handelsbanken Capital Markets
A strong track record and a bright future We value ICA Gruppen at SEK 235 per share, based on our sum-of-the-parts (SOTP) approach and backed by our DCF analysis, indicating 22% potential upside to the current share price. We initiate coverage with a BUY recommendation on ICA Gruppen, the second-largest listed retailer in the Nordics with a strong track record and a bright future.
1%
8%
10%
2%
9%
16%
0%
2%
4%
6%
8%
10%
12%
14%
16%
18%
20%
Sales EBIT (adj.) PTP (adj.)
2009-2012 2013e-2015e
-200-100
0100200300400500600700
15.8
13.914.7
11.912.5
11.710.7
9.5
6.07.08.09.0
10.011.012.013.014.015.016.017.018.0
2013e 2014e
Reported ex Real Estate ex Norway ex Norway & Real Estate
Simply put, ICA Norway will be turned or exited
Multiples inflated by Norway… 2014e EV/EBIT of 13.9x falls to 11.7x when excluding the loss-maker… ...and there is a significant property backing (42% of market cap)
Initiate with BUY
6 August 29, 2013
Valuation and recommendation The share is trading at a 2014e EV/EBIT of 13.9x, but 11.7x excluding Norway, backed by a significant property portfolio valued at SEK 16bn, or 42% of the current market cap. The current share price puts ICA Gruppen’s non-property assets at a 2014e EV/EBIT of 11.9x – highly attractive, in our view, as this includes losses in the Norwegian business. Excluding Real Estate and Norway, the 2014e EV/EBIT drops as low as 9.5x, suggesting assets can still be bought at a discount. We value ICA Gruppen at SEK 235 and recommend buying into the second-largest listed retailer in the Nordics with a strong track record and a bright future.
Current valuation multiples not nearly as high as they look ICA Gruppen is trading at a 2014e EV/EBIT of 13.9x, or a 15-20% premium to Swedish food retailer Axfood and a 10-15% premium to other Swedish consumer staple stocks. Considering our view that Norway will be exited unless losses are significantly reduced, we also look at the valuation excluding Norway and find that the 2014e EV/EBIT drops substantially to 11.7x, or in line with Axfood.
ICA Gruppen has real estate holdings valued at SEK 16bn, or 42% of the current market cap and 33% of the enterprise value (EV). Deducting the real estate market value and earnings from the current market cap, to gain an understanding of what multiple the current share price implies for the non-property business (i.e. food and banking), the share would trade at a 2014e EV/ EBIT of 11.9x, which we find attractive.
Adjusting for Real Estate and Norway, to find the implied multiple of the healthy part of the business – ICA Sweden, Rimi Baltic and the ICA Bank – translates into a 2014e EV/EBIT of 9.5x, which we believe is far too low in light of the stability of the Swedish business and the growth opportunities in Rimi Baltic.
The high P/E ratio (24.3x in 2013e) reflects unusually high interest-rate expenses following the debt that ICA Gruppen took on in conjunction with the buyout of ICA. These costs will decrease as debt is amortised, leaving a 2015e P/E of 17.0x, or 13.9x excluding Norway. Also, the group’s current tax rate is inflated due to tax loss carry-forwards in Norway.
We argue that ICA Gruppen should trade at a premium to peers for the following reasons:
• A superior business model (store owners highly incentivised to perform)
• Best-in-class margins (7% “total” margin in Sweden vs. European peers at 4%)
• Category heavyweight in Sweden (37% market share vs. nearest peer at 15%)
• Backing from property assets (market value of SEK 16bn)
• The recovery potential in Norway (large swing factor on SEK ~700m in losses)
Multiples inflated by Norwegian losses
Significant property backing, or 42% of market cap P/E drops on reduced interest costs
ICA Gruppen deserves a premium

August 29, 2013 7
Table 1: ICA Gruppen valuation summary
Source: Handelsbanken Capital Markets
SOTP: ICA Sweden the heavyweight, ICA Real Estate the overlooked jewel We value ICA Gruppen at SEK 235 per share, offering 22% potential upside to the current share price. Our target price is based on a some-of-the-parts (SOTP) approach; below we elaborate on the constituents.
Table 2: Sum-of-the-parts valuation (SOTP)
Source: Handelsbanken Capital Markets, company data, FactSet
SOTP price target 235DCF value 243Current share price 193
Upside to SOTP target 22%Upside to DCF 26%
Valuation 2013e 2014e 2015eEV/S 0.50 0.48 0.46EV/EBIT 15.8 13.9 12.6P/E 24.3 19.1 17.0Dividend yield 3.4% 3.9% 4.4%
Valuation (excl. Real Estate) 2013e 2014e 2015eEV/S 0.50 0.48 0.46EV/EBIT 14.7 11.9 10.4P/E 31.2 18.0 14.9
Valuation (excl Norway) 2013e 2014e 2015eEV/S 0.60 0.57 0.54EV/EBIT 12.5 11.7 11.1P/E 16.0 14.5 13.9
Valuation (excl. Norway & Real Estate) 2013e 2014e 2015eEV/S 0.41 0.38 0.36EV/EBIT 10.7 9.5 8.8P/E 14.4 11.8 11.1
Holding Value SEKm Per share Methodology
ICA Sweden 100% 42,636 212 14x EBIT (2013e)ICA Norge 100% -2,173 -11 Exit cash costRimi Baltic 100% 4,533 23 0.15x sales (2013e) + real estateICA Bank 100% 1,425 7 1.5x equity (2012)ICA Real Estate 100% 13,281 66 Market valueICA Group function 100% -2,157 -11 6x EBIT (2014e)ICA 57,545 286
Forma 100% -14 0 1x book value Kjell & Co 50% 407 2 1x sales (2012)Cervera 91% 94 0 1x book value inkClub 100% 265 1 0.5x sales (2012)Hemtex 69% 245 1 Market capNon-Food 997 5
Net debt -11,281 -56 2013e
Equity value 47,261 235
2014e EV/EBIT of 13.9x… …11.9x excluding Real Estate… …11.7x excluding Norway… …9.5x “rest of ICA”
Sweden and Real Estate above current market cap No hope value attached to Norway Portfolio companies insignificant

8 August 29, 2013
SOTP constituents • ICA Sweden: We apply a multiple of 14x EBIT to our 2013 forecast, valuing ICA
Sweden at SEK 42.6bn, or SEK 212 per share. This multiple corresponds to what we believe is a well deserved 20% premium to Axfood (11.8x), which is supported by the difference in the quality of business models. ICA Sweden should trade at a high multiple as it enjoys a 37% market share, approximately twice as high as its nearest two peers, Axfood and Coop, with a 4.5% wholesale margin and an approximate 7% store margin – best-in-class in Europe. The five-year EBIT CAGR is an impressive 14% per annum and we forecast a 2012-15e CAGR of 5% per annum.
• ICA Norway: We assign a negative value to ICA Norway of SEK -2.2bn, or SEK -11 per share. After five consecutive years of losses amounting to nearly SEK 4bn (reported) and almost SEK 3bn (adjusted), we struggle to find any value in this business. Our value is based on assumed cash flow burdens from exiting the market, although this excludes SEK 1bn in deferred tax assets that the group could potentially utilise if the market is exited. In a more bullish scenario (although far from our base case), assuming the group can reach a 2% EBIT margin and these profits valued at 8x, would lift our SOTP by SEK 23 per share, or 10%.
• Rimi Baltic: We apply a multiple of 0.15x our 2013 sales forecast, and add the SEK 3bn in real estate holdings, valuing the business at SEK 4.5bn, or SEK 23 per share. The valuation multiples drop quickly in the coming years on the back of strong earnings growth, with the Baltic region a key growth and focus area of ICA Gruppen. We model a three-year EBIT CAGR of 7% per annum in 2012-15e (2007-12 was 21% per annum).
• ICA Bank: We value the bank at 1.5x reported equity (2012), translating into 8.4x our 2013 EBIT forecast. This puts the bank at a value of SEK 1.4bn, or SEK 7 per share
• ICA Real Estate: Following the transaction in which ICA Gruppen bought out Ahold’s ICA stake, the group disclosed a market value on the real estate portfolio of SEK 18.1bn. As this includes around SEK 3bn in the Baltic region, which is not part of ICA Real Estate, we assume a value of SEK 13.3bn, after also deducting SEK 1.8bn of sale and leaseback properties, translating into a yield of 7.4% on cash earnings.
• Non-food portfolio companies: We value Hemtex at the current market capitalisation, or SEK 245m adjusted for the 68.5% ownership. We see limited value in Forma and Cervera; to which we assign book values; or in essence zero value. We are more upbeat about Kjell & Company, which we value at 1x 2013e sales (2012 EBIT margin 7.5%) whereas we value inkClub to 0.5x sales (2012 EBIT margins 7.2%). In total, we value the Non-food companies at SEK 1bn, or SEK 5 per share, comprising only 1.7% of ICA Gruppen’s EV.
Figure 5: SOTP bridge
Source: Handelsbanken Capital Markets
212235
23 7
66 5
11
11
56
0
50
100
150
200
250
300
350
Best-in-class margins
Valued at a loss
Future growth area with real estate support
1.5x book
Significant property holdings
Little value
Sweden and Real Estate key value drivers, with Norway the swing factor

August 29, 2013 9
Table 3: Peer group valuation – European food retailers
Source: Handelsbanken Capital Markets and FactSet
Table 4: Peer group valuation – Swedish consumer staples
Source: Handelsbanken Capital Markets and FactSet
Valuation excluding Norway deflates multiples significantly We argue that ICA Gruppen’s valuation is substantially inflated by large losses in Norway, amounting to more than SEK 500m per year. As we believe that ICA Gruppen will exit or at least significantly restructure the business, unless performance improves, either organically or by the suggested collaboration with Norgesgruppen, we look at the valuation excluding Norway. The 2014e EV/EBIT multiple drops from 13.9x to 11.7x when Norway is excluded (or to 12.2x if estimated cash flow costs for leaving the market are added on net debt).
Figure 6: EV/EBIT valuation, with and without Norway
Source: Handelsbanken Capital Markets
ROE
2013 2014 2013 2014 2013 2014 2013 2014 2013 2014 2013 2013 2014Ahold 0.38 0.39 5.7 5.8 9.1 9.2 14.4 12.6 3.7% 4.1% 13% 4.2% 4.2%Axfood 0.42 0.41 8.2 7.8 12.5 11.8 16.3 15.5 4.4% 4.5% 25% 3.4% 3.4%Carrefour 0.27 0.26 5.5 5.1 9.3 8.6 16.8 14.4 2.7% 3.0% 12% 2.9% 3.1%Casino 0.30 0.29 4.5 4.2 6.4 5.9 13.9 12.6 4.3% 4.6% 8% 4.7% 4.8%Colruyt 0.74 0.69 8.9 8.3 12.1 11.3 17.3 16.3 2.5% 2.7% 19% 6.1% 6.2%Delhaize 0.31 0.28 4.7 4.4 8.6 7.8 11.1 10.6 3.0% 3.3% 8% 3.6% 3.7%Jeronimo 0.84 0.75 12.0 10.6 17.2 14.9 22.9 19.6 2.2% 2.5% 29% 4.9% 5.0%Kesko 0.26 0.26 6.4 6.0 10.7 9.8 15.5 13.4 5.1% 5.5% 7% 2.5% 2.6%Morrison 0.54 0.53 7.6 7.3 11.1 10.8 11.5 11.3 4.4% 4.6% 11% 4.8% 4.9%Sainsbury 0.42 0.40 7.2 6.8 11.8 10.8 12.4 11.7 4.3% 4.5% 10% 3.6% 3.7%Tesco 0.53 0.50 6.9 6.4 10.1 9.3 11.4 10.7 4.0% 4.3% 15% 5.3% 5.4%
Median 0.42 0.40 6.9 6.4 10.7 9.8 14.4 12.6 4.0% 4.3% 12% 4.2% 4.2%Average 0.46 0.43 7.1 6.6 10.8 10.0 14.9 13.5 3.7% 4.0% 14% 4.2% 4.3%
ICA Gruppen 0.50 0.48 10.2 9.2 15.8 13.9 24.3 19.1 3.4% 3.9% 7.1% 3.2% 3.4%Premium/discount to median 19% 19% 47% 42% 48% 42% 69% 51% -0.7% -0.4% -4.8% -1.0% -0.8%
EV/SALES EV/EBITDA EV/EBIT P/E EBIT marginDiv yld
ROE
2013 2014 2013 2014 2013 2014 2013 2014 2013 2014 2013 2013 2014AAK 1.01 0.91 11.5 9.8 14.9 12.4 19.7 16.7 1.6% 1.8% 17% 6.8% 7.3%Axfood 0.42 0.41 8.2 7.8 12.5 11.8 16.3 15.5 4.4% 4.5% 25% 3.4% 3.4%Cloetta 1.68 1.52 12.6 9.5 18.6 12.2 17.5 13.2 0.0% 0.0% 9% 9.0% 12.5%Oriflame 1.05 1.03 8.5 8.0 10.1 9.7 12.3 11.7 7.8% 7.8% 47% 10.4% 10.6%SCA 1.67 1.59 10.5 8.9 16.2 12.9 18.7 15.3 2.8% 3.0% 10% 10.3% 12.3%Swedish Match 4.42 4.26 14.6 14.0 15.9 15.5 17.4 16.2 3.1% 3.4% 27.7% 27.6%
Median 1.36 1.28 11.0 9.2 15.4 12.3 17.4 15.4 3.0% 3.2% 17% 9.7% 11.5%Average 1.71 1.62 11.0 9.6 14.7 12.4 17.0 14.8 3.3% 3.4% 22% 11.3% 12.3%
ICA Gruppen 0.50 0.48 10.2 9.2 15.8 13.9 24.3 19.1 3.4% 3.9% 7.1% 3.2% 3.4%Premium/discount to median -63% -63% -7% 0% 2% 13% 39% 24% 0.4% 0.7% -10.3% -6.5% -8.1%
EV/SALES EV/EBITDA EV/EBIT P/E EBIT marginDiv yld
15.8
13.913.0
12.212.511.7
6.07.08.09.0
10.011.012.013.014.015.016.017.018.0
2013e 2014e
Reported ex Norway (incl exit cash costs) ex Norway
Losses in Norway inflate multiples

10 August 29, 2013
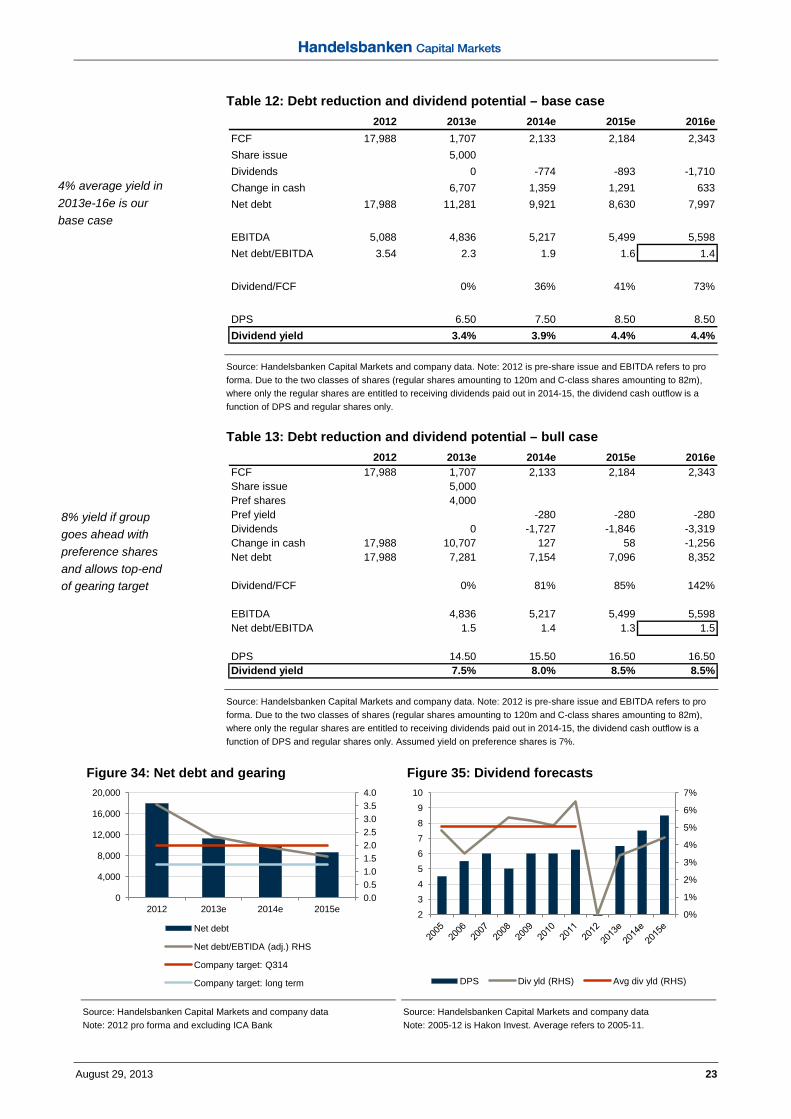
Dividend potential – 4% average yield with upside potential Following the acquisition of the remaining shares in ICA, amounting to SEK 20bn, net debt was at SEK 18bn in Q1 2013, corresponding to net debt/EBITDA of 3.7x on a pro forma basis. After a share issue in May 2013 that raised SEK 5bn and strong cash flow generation (with no dividend paid in 2013 due to the transaction), we expect the group to end 2013 with SEK 11.3bn of net debt, or 2.3x EBITDA, which compares to the group’s target of reaching 2x before Q3 2014. Despite paying out dividends of nearly SEK 1bn per year in the coming two years, we see the gearing reaching around 1.4x in 2016, which is within the company’s long-term target of 1-1.5x that the group expects to reach in 2016.
In terms of the dividend capacity, we model no issuance of preference shares in our base case, which ICA Gruppen has stated could be one option to reduce gearing (it would be treated as equity), and we also assume the group will be within the 1-1.5x target by year-end 2016. In this scenario, the average dividend yield in the period 2013 to 2016 is 4%.
For more information on our dividend scenarios, see page 23-24.
Table 5: Debt reduction and dividend potential – base case
Source: Handelsbanken Capital Markets and company data. Note: 2012 is pre-share issue and EBITDA refers to pro forma. Due to the two classes of shares (regular shares amounting to 120m and C-class shares amounting to 82m), where only the regular shares are entitled to receiving dividends paid out in 2014 and 2015, the dividend cash outflow is a function of DPS and regular shares only.
DCF valuation – cash flow nourished by defensive food and real estate Our DCF model values ICA Gruppen at SEK 243 per share, or slightly above our SOTP valuation. ICA’s cash flow has been strong and stable in the past few years, and we expect sustained healthy cash flow underpinned by the stability of food retail and wholesale, backed by the steady earnings stream from the Real Estate business. We foresee operating cash flow of around SEK 4-4.5bn per year, or SEK 2-2.5bn after capex in the coming few years. We assign a beta of 0.8x and a terminal growth rate of 2.5%, which yields a total value of SEK 243 per share, or 24% upside to the current share price. For more details, refer to our DCF on page 45.
Initiating with BUY and target price of SEK 235 We value ICA Gruppen at SEK 235 per share, based on a SOTP approach and backed by our DCF, offering 22% potential upside to the current share price. We initiate coverage with BUY and recommend buying into the second-largest listed retailer in the Nordics with a strong track record and a bright future. We also recommend that investors should finance a position in ICA with Axfood on relative valuation grounds.
2012 2013e 2014e 2015e 2016eFCF 17,988 1,707 2,133 2,184 2,343Share issue 5,000Dividends 0 -774 -893 -1,710Change in cash 6,707 1,359 1,291 633Net debt 17,988 11,281 9,921 8,630 7,997
EBITDA 5,088 4,836 5,217 5,499 5,598Net debt/EBITDA 3.5 2.3 1.9 1.6 1.4
Dividend/FCF 0% 36% 41% 73%
DPS 6.50 7.50 8.50 8.50Dividend yield 3.4% 3.9% 4.4% 4.4%
Significant deleveraging ahead
Dividend base case
4% average yield in 2013-16 is our base-case
Strong cash flow and low WACC underpin DCF DCF of SEK 243
Target price of SEK 235 BUY ICA and finance with Axfood

August 29, 2013 11
How Hakon Invest became ICA Gruppen On February 11, 2013, Hakon Invest announced an agreement on the acquisition of the remaining 60% of the shares in ICA from Ahold for a cash consideration of SEK 20bn. The transaction was completed on March 27, 2013, and, as a result, Hakon Invest holds all shares in ICA and has changed its name to ICA Gruppen to reflect the new direction of the group. As of June 30, 2013, ICA Gruppen was owned 51% by the Association of ICA retailers and 10% by AB Industrivärden.
Background on Hakon Invest’s acquisition of ICA from Ahold On February 11, 2013, Hakon Invest announced an agreement on the acquisition of the remaining 60% of the shares in ICA from Ahold for a cash consideration of SEK 20bn. The transaction was completed on March 27, 2013, and, as a result, Hakon Invest holds all shares in ICA.
The board of Hakon Invest proposed that the AGM on May 20, 2013, resolved to change the company’s name to ICA Gruppen in order to reflect the new direction of the group, having previously been more of an investment company. ICA Gruppen will be a retail company with four business areas: Food, Banking, Real Estate and Non-food. The five portfolio companies that ICA Gruppen owns in addition to ICA constitute less than 5% of the group’s assets and will be evaluated based on the group’s new direction.
The acquisition of the remaining shares in ICA was financed by existing cash and cash equivalents and by secured bridge financing. The share issue of SEK 5bn conducted in May 2013 has replaced part of the bridge financing used for the acquisition. On June 30, 2013, net debt amounted to around SEK 13.2bn.
ICA’s Chief Executive Officer, Per Strömberg, has replaced Claes-Göran Sylvén as Chief Executive Officer of the parent company ICA Gruppen. Claes-Göran Sylvén will remain the President of the Association of ICA retailers (“ICA-handlarnas Förbund”). The members of ICA Gruppen’s new executive management team took their positions on May 20, 2013.
Figure 7: Simplified group structure, before and after transaction
Before transaction After transaction
Source: Handelsbanken Capital Markets and company data
Hakon Invest acquired remaining ICA stake… ...and changed name to ICA Gruppen Financing measures in place
Per Strömberg CEO of ICA Gruppen
ICA Gruppen owns 100% of ICA No longer an investment company

12 August 29, 2013
Figure 8: Transaction financing (SEKbn)
Source: Handelsbanken Capital Markets and company data. *Preference shares issue not yet conducted or decided
Ownership structure post the transaction As of June 30, 2013, ICA Gruppen was owned 51% by the Association of ICA retailers and 10% by AB Industrivärden, with both of the main owners acquiring their respective pro rata allotments in the issue of new shares completed during Q2 2013.
There are two classes of shares: regular shares and C-class shares. They have equal voting rights, but the C shares lack the right to dividends. However, this will change in 2016, as the Association of ICA retailers has exercised an option to convert its C shares to regular shares.
The Association of ICA retailers is a non-profit organisation, comprising all ICA store owners in Sweden, and it does not pay dividends to its members. According to the Association’s charter, it must retain at least 51% of the ownership in ICA Gruppen. While it is possible to change the charter with 75% of the votes, we see it as highly likely that the Association will remain majority owner of ICA Gruppen for the foreseeable future. The arrangement, in essence, restricts ICA Gruppen’s access to a significant amount of new equity, especially for the next few years, as the Association of ICA retailers would have to vote against a share issue were it unable to subscribe for its part (as it would then dilute its ownership to below 50%). We expect this constraint to gradually loosen, as the conversion of C shares in 2016 will increase the dividend received, which we expect the Association to use for building a financial buffer.
Table 6: Shareholder structure
Source: Euroclear. As of June 30, 2013.
Figure 9: Free float
Source: Handelsbanken Capital Markets and SIS
1
20
5
14
0
3
6
9
12
15
18
21
24
Cas
h
Rig
hts
issu
e
Deb
t +
pote
ntia
l pre
f sh
are
Aqu
isiti
on
pric
e
Shareholder Common C Cap %ICA-handlarnas Förbund 21,095,707 82,067,892 51.3%Industrivärden 20,125,000 0 10.0%AMF 3,686,185 0 1.8%Handelsbanken Funds 2,625,895 0 1.3%Lannebo Funds 2,442,638 0 1.2%SEB 1,989,785 0 1.0%Swedbank Robur 1,894,154 0 0.9%JPM Chase 1,865,354 0 0.9%Leif Jönsson 1,254,651 0 0.6%Robur Insurance 1,209,807 0 0.6%Total 119,078,903 82,067,892 100%
ICA-handlarnas
Förbund51.3%
Industrivärden
10.0%
Free float38.7%
Mix of financing
Two asset classes until 2016
Association of ICA retailers the main shareholder

August 29, 2013 13
Financial forecasts The cornerstone of ICA’s sound financial position is continued solid performance in ICA Sweden and ICA Real Estate, while the largest swing factor would be reduced losses in Norway, either through collaboration with Norgesgruppen or an exit of the Norwegian market. Combined, we see these factors making for an impressive 9% EBIT CAGR in 2013-15, and a 16% PTP CAGR as interest expenses are lowered on debt amortisation. We expect the group to extend its track record of sustainably generating significant positive cash flow, and despite our expectation of a reinstated dividend in 2013 and distribution of around a 4% yield, we see the gearing dropping markedly to below 2x EBITDA in 2014. If the group went ahead with its preference share issuance and levered the balance sheet to the high-end of its gearing target, the dividend yield could more than double.
Summary of forecasts We model 2% sales CAGR during 2013-15 and foresee a 9% EBIT CAGR during 2013-15, driven by continued solid performance in ICA Sweden and somewhat reduced losses in Norway. As debt is rapidly amortised, we see financial expenses being gradually lowered, explaining the strong PTP CAGR of 16%. In a scenario where Norwegian losses are not reduced from the 2013e level (HCMe SEK -769m), the 2013e-15e EBIT CAGR still translates into a solid 4% per annum.
We expect the group to lower the gearing (net debt/EBITDA) to within its 1-1.5x medium target by 2016 whilst during this period distributing a 4% average dividend yield, at the current share price. We expect the group to deliver on some, but not all, of its financial medium-term objectives.
Figure 10: Two-year CAGR (2013-15e)
Source: Handelsbanken Capital Markets and company data Note: 2012 and 2013 are pro forma numbers. 2009-12 is ICA. 2013-15 is ICA Gruppen.
Figure 11: EBIT delta (2013e-15e)
Source: Handelsbanken Capital Markets and company data
1%
8%
10%
2%
9%
16%
0%
2%
4%
6%
8%
10%
12%
14%
16%
18%
20%
Sales EBIT (adj.) PTP (adj.)
2009-2012 2013e-2015e
-200-100
0100200300400500600700
Reduced interest expenses explains stronger PTP growth
4.0% average dividend growth

14 August 29, 2013
Table 7: Summary of key financials
Source: Handelsbanken Capital Markets and company data. 2012 and 2013 pro forma numbers. 2008-11 is Hakon Invest. 2012-15 is ICA Gruppen.
ICA Sweden: category heavyweight With a market share of 37%, twice as high as numbers two and three, ICA is the indisputable market leader in Sweden. On the back of its strong position in Sweden, ICA generates predictably stable margins, with an average EBIT margin of 4% in the past five years, never falling being below 3%. It should be noted that ICA’s margin is essentially a wholesale margin and that the store owners on average make another 2-3%, leaving the “total” margin well in line with best-in-class peers in Europe. ICA’s strong position in an attractive, concentrated market translates into what we see as resilient, sustainable earnings capacity. It seems likely to us that ICA Sweden will continue to generate operating profits of at least SEK 3bn per year in the foreseeable future. The ability to generate such positive earnings is a cornerstone of our positive view of the ICA share.
Figure 12: ICA Sweden, sales (SEKbn) and LFL
Source: Handelsbanken Capital Markets and company data LFL refers to stores
Figure 13: ICA Sweden, EBIT (SEKm)
Source: Handelsbanken Capital Markets and company data
2008 2009 2010 2011 2012 2013e 2014e 2015eSales 1,184 2,392 2,663 2,498 99,535 98,780 100,095 102,063Gross profit 423 988 1,201 1,099 15,069 14,309 14,795 15,207EBIT (adj.) 612 423 -387 302 3,061 3,119 3,440 3,699PTP 163 671 -341 252 10,867 2,240 2,800 3,149Net income 187 726 -303 99 9,058 1,486 2,037 2,289EPS adj. 1.09 4.23 -1.54 1.84 2.18 7.94 10.13 11.38DPS 5.00 6.00 6.00 6.25 0.00 6.50 7.50 8.50
Growth -879 -640 -550Sales 10% 102% 11% -6% n.a. -1% 1% 2%EBIT (adj.) n.a. n.a. n.a. n.a. n.a. 2% 10% 8%
Margins 1,717 1,777 1,800Gross margin 35.7% 41.3% 45.1% 44.0% 15.1% 14.5% 14.8% 14.9%EBIT margin 51.7% 17.7% -14.5% 12.1% 3.1% 3.2% 3.4% 3.6%
Balance sheetNet debt/(cash) -1,456 -628 -627 -563 12,988 11,281 9,921 8,630Net debt/EBITDA -2.3 -1.4 1.7 -1.8 2.6 2.3 1.9 1.6
0.0%
1.0%
2.0%
3.0%
4.0%
5.0%
6.0%
40
45
50
55
60
65
70
75
Sales LFL (RHS)
2.5%
2.8%
3.1%
3.4%
3.7%
4.0%
4.3%
4.6%
4.9%
0
500
1,000
1,500
2,000
2,500
3,000
3,500
EBIT Adj. EBIT Adj. EBIT margin (RHS)
EBIT growth on margin improvement EPS boosted further by reduced financial expenses on debt amortisation
Undisputed market leader, with high and stable margins

August 29, 2013 15
Figure 14: ICA Sweden, market share
Source: Handelsbanken Capital Markets and company data
Figure 15: Key peers’ market share, Sweden
Source: SCB/HUI and Magazine Markets, 2011. Other channels include petrol stations, kiosks, mail order, online, outdoor markets and pharmacy
Drivers of continued strong profits in Sweden: • ICA’s market share has been very high and stable, in recent years at around 37%. We
expect the group to sustain its market share, underpinned by superior scale advantage, and even see further scope for ICA to increase its market share in metropolitan areas, where it is somewhat below that of other parts of Sweden
• Management is targeting to increase private label sales (i.e. sales of ICA’s own brands) by around 1 p.p. per year from the current level of 20%. As margins on private labels are approximately twice as high those on external brands, any such increase yields a positive margin impact. We estimate a 3bp positive impact on every percentage point of higher private label sales, suggesting a 20bp boost to margins if ICA reaches a 25% private label share, which we find highly feasible given that key competitor Axfood is already at 25%.
• We foresee further efficiency and leverage potential on continued strong sales, where we note that ICA has a sales density (revenues/sqm) around 50% higher than that of its nearest peers. Revenues per employee have improved by 2% in the past three years and by 11% in the past five years. In addition, ICA has invested considerably in the supply chain in recent years, where we expect efficiency gains to materialise.
• ICA’s small-scale entry into the pharmacy business in 2010 under its Cura brand (52 stores as of March 31, 2013) has burdened profitably since inception, as the operations have been in the investment phase. With the business maturing, we expect the recent trend of reduced operating losses to continue.
Figure 16: Sales density (SEK ‘000/sqm)
Source: Handelsbanken Capital Markets, company data and DLF. *Sales density defined as sales/sqm in SEK (‘000) in the Stockholm region
Figure 17: ICA Sweden, private labels share
Source: Handelsbanken Capital Markets and company data
35%
36%
37%
38%
2006 2007 2008 2009 2010 2011
37%
15% 13%
5% 4%9%
17%
0%5%
10%15%20%25%30%35%40%45%
96
66 6352
0
20
40
60
80
100
120
ICA Coop Axfood Bergendahls
15%17% 17%
16% 17%18% 19% 20%
21%22%
23%
9%11%13%15%17%19%21%23%25%
Scale advantage
Private labels to boost margins Superior sales density + efficient operations
Leverage on pharmacy business

16 August 29, 2013
ICA Norway: problem child with swing factor ICA Norway has been loss-making for the past five years, with an average negative EBIT margin of 4% and accumulated losses of nearly SEK 4bn on a reported basis and SEK 3bn in adjusted terms. While the fact that Norway is one of the most penetrated markets in the world as measured by food retail stores per capita and that ICA’s brand equity is not particularly strong does not help, we believe the two main reasons behind the high losses are rather significant market share losses in the recent decade and high purchasing prices.
Market share losses... Five years ago, ICA had market share in Norway of 19% vs. its 14% today, meaning the group has lost around 1 unit every year, on average. Revenue growth in the past five years has been zero, which compares highly unfavourably to the 30% growth reported in ICA Sweden during the same period. In an industry with razor-thin margins and opex usually growing in line with inflation (rents, wages etc) the group, simply put, has a revenue problem.
...and sourcing problems On top of the unfavourable market share evolution, the group has a COGS problem. ICA’s purchasing prices are approximately 4-5% higher than that of peers on diseconomies of scale, as purchasing prices generally reflect volume size. Very statically and simplistic, ICA Norway would be breakeven at the same purchasing prices as peers.
Similar to ICA Sweden, the group owns significant real estate assets relating to ICA Norway that are held outside of the business unit, in ICA Real Estate, which means that the combined Norwegian operations are not quite as loss-making as the divisional reporting suggests. However, all in all, we view ICA Norway as the main weakness in the group’s business.
Figure 18: ICA Norway, revenue trend, SEKbn
Source: Handelsbanken Capital Markets and company data
Figure 19: ICA Norway, EBIT losses, SEKm
Source: Handelsbanken Capital Markets and company data
Figure 20: ICA Norway, market share trend
Source: Handelsbanken Capital Markets and company data
Figure 21: ICA, private label share markets
Source: Handelsbanken Capital Markets and company data, 2012
-4.0%
-3.0%
-2.0%
-1.0%
0.0%
1.0%
2.0%
3.0%
4.0%
10
12
14
16
18
20
22
24
Sales LFL (RHS)
-5.0%
-4.5%
-4.0%
-3.5%
-3.0%
-2.5%
-2.0%
-1.5%
-1.0%
-1,400
-1,200
-1,000
-800
-600
-400
-200
0
EBIT Adj. EBIT Adj. EBIT margin (RHS)
19.0%
17.5%
16.5%15.7%
14.8%14.1%
10%
11%
12%
13%
14%
15%
16%
17%
18%
19%
20%
2006 2007 2008 2009 2010 2011
20%
13%
10%
0%
5%
10%
15%
20%
25%
Sweden Baltic Norway
ICA Norway has been loss-making for the past five years
5% market share loss last five years
Sourcing costs 4-5% higher than peers
Significant real estate backing
August 29, 2013 17
Three ways to go in Norway ICA entered Norway in 1992 when the group acquired a 30% stake in Hagen Group (owned by Stein Erik Hagen), who ran the Rimi format, and the two companies merged in 1998. The division posted solid margins until 2005, when it turned into losses and has since remained loss-making. Poor profitability has led to repeated restructuring initiatives at ICA Norway, which has not helped. We see three different ways to move forward in Norway:
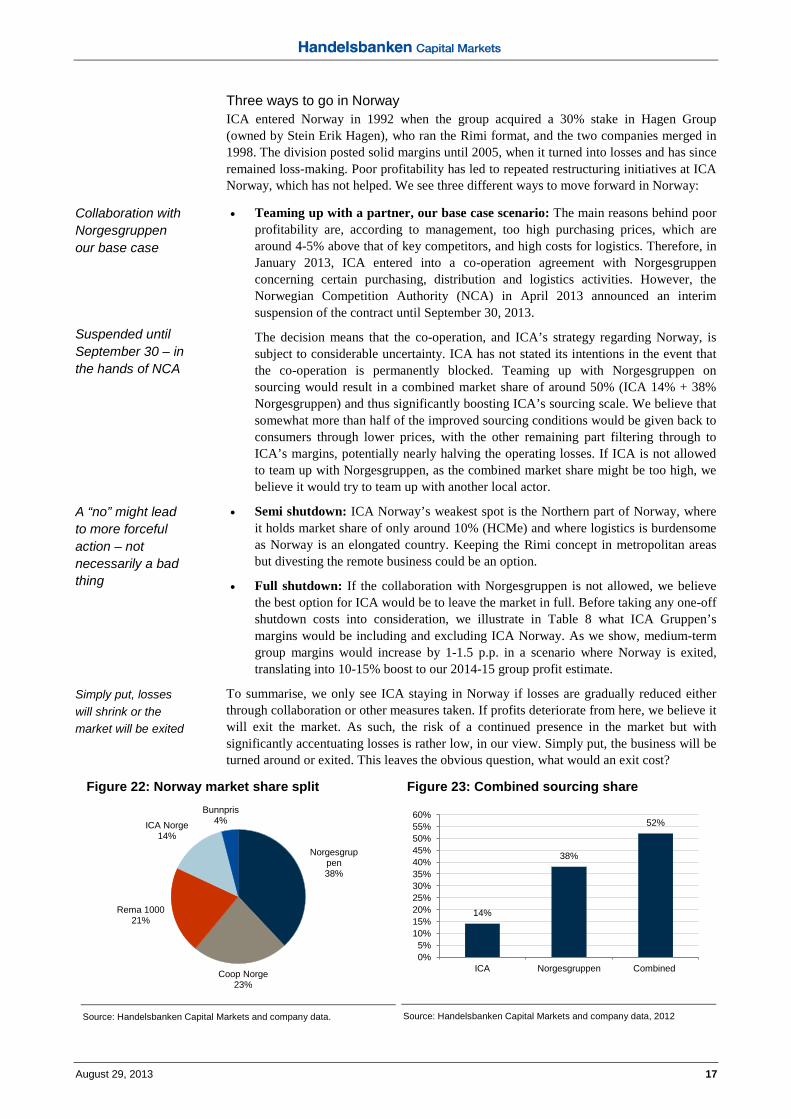
• Teaming up with a partner, our base case scenario: The main reasons behind poor profitability are, according to management, too high purchasing prices, which are around 4-5% above that of key competitors, and high costs for logistics. Therefore, in January 2013, ICA entered into a co-operation agreement with Norgesgruppen concerning certain purchasing, distribution and logistics activities. However, the Norwegian Competition Authority (NCA) in April 2013 announced an interim suspension of the contract until September 30, 2013.
The decision means that the co-operation, and ICA’s strategy regarding Norway, is subject to considerable uncertainty. ICA has not stated its intentions in the event that the co-operation is permanently blocked. Teaming up with Norgesgruppen on sourcing would result in a combined market share of around 50% (ICA 14% + 38% Norgesgruppen) and thus significantly boosting ICA’s sourcing scale. We believe that somewhat more than half of the improved sourcing conditions would be given back to consumers through lower prices, with the other remaining part filtering through to ICA’s margins, potentially nearly halving the operating losses. If ICA is not allowed to team up with Norgesgruppen, as the combined market share might be too high, we believe it would try to team up with another local actor.
• Semi shutdown: ICA Norway’s weakest spot is the Northern part of Norway, where it holds market share of only around 10% (HCMe) and where logistics is burdensome as Norway is an elongated country. Keeping the Rimi concept in metropolitan areas but divesting the remote business could be an option.
• Full shutdown: If the collaboration with Norgesgruppen is not allowed, we believe the best option for ICA would be to leave the market in full. Before taking any one-off shutdown costs into consideration, we illustrate in Table 8 what ICA Gruppen’s margins would be including and excluding ICA Norway. As we show, medium-term group margins would increase by 1-1.5 p.p. in a scenario where Norway is exited, translating into 10-15% boost to our 2014-15 group profit estimate.
To summarise, we only see ICA staying in Norway if losses are gradually reduced either through collaboration or other measures taken. If profits deteriorate from here, we believe it will exit the market. As such, the risk of a continued presence in the market but with significantly accentuating losses is rather low, in our view. Simply put, the business will be turned around or exited. This leaves the obvious question, what would an exit cost?
Figure 22: Norway market share split
Source: Handelsbanken Capital Markets and company data.
Figure 23: Combined sourcing share
Source: Handelsbanken Capital Markets and company data, 2012
Norgesgruppen38%
Coop Norge23%
Rema 100021%
ICA Norge14%
Bunnpris4%
14%
38%
52%
0%5%
10%15%20%25%30%35%40%45%50%55%60%
ICA Norgesgruppen Combined
Collaboration with Norgesgruppen our base case Suspended until September 30 – in the hands of NCA
A “no” might lead to more forceful action – not necessarily a bad thing
Simply put, losses will shrink or the market will be exited

18 August 29, 2013
Table 8: ICA Gruppen comparison excl. Norway
Source: Handelsbanken Capital Markets and company data. SEKm
Figure 24: ICA Gruppen comparison excl. Norway
Source: Handelsbanken Capital Markets and company data. SEKm
An exit cost scenario on ICA Norway When ICA Norway divested its Maxi concept in 2012, it booked a cost of SEK 367m in Q2 2012. From the 2012 annual report, we conclude that the cash cost was slightly less than 50% of the amount with the remainder being impairment and write-downs.
In general, costs attached for leaving a leased store normally are:
• Payment to landlord for early exit (subject to landlord giving consent in the first place)
• Write-downs of store equipment
• Impairment of goodwill
• Operating loss during time of closure
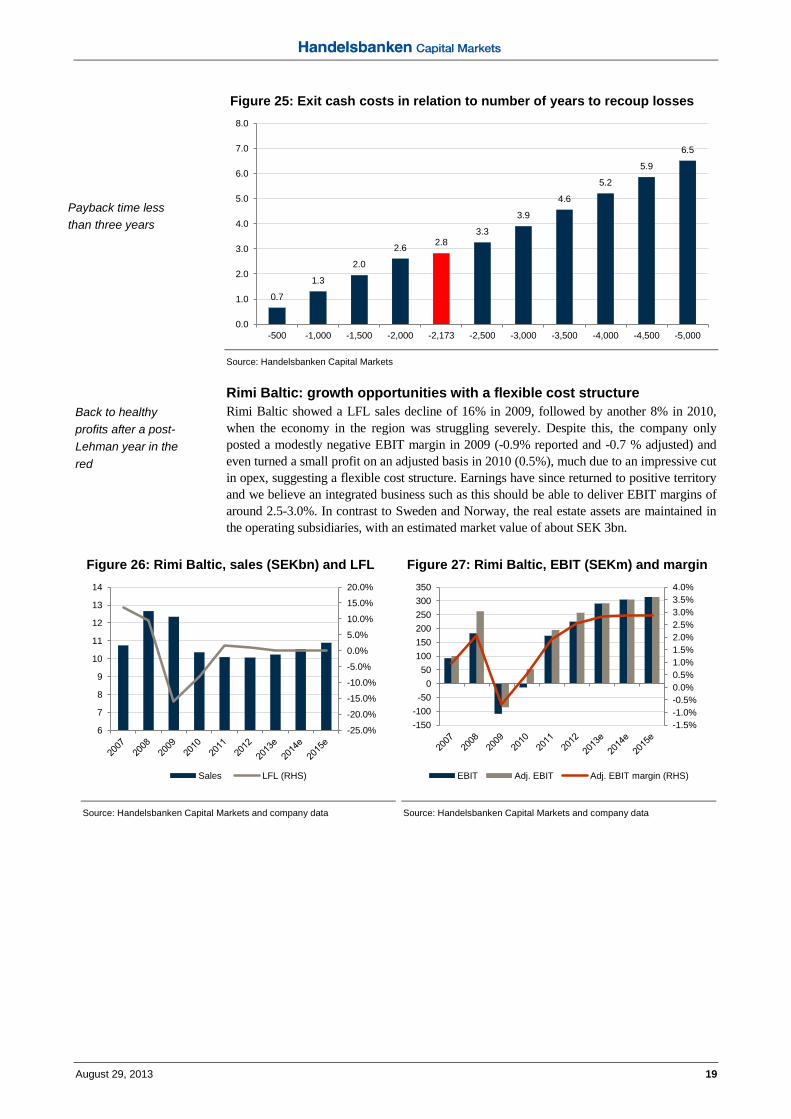
In analysing the costs for exiting the whole of Norway we use the Maxi divestment as a proxy. Maxi comprised 15% of ICA Norway revenues, suggesting the pro-rata cash cost would be nearly SEK 1.2bn to exit the remaining 85%. In addition, one would have to add costs for closing central operations such as distribution centres and severance payments to HQ staff as well as factoring in the fact that the Maxi stores were newer than the other formats, which we estimate to SEK 1bn. We thus assume total cash costs of SEK 2.2bn (stores + central costs) and use this as our negative value of ICA Norway in our SOTP valuation. Considering annual losses of around SEK 600 would suggest a payback time of 2.8x years, which we find attractive.
In a worst case scenario, where we pro-rate the Maxi cash cost on stores (Maxi was 4% of the store base) rather than on sales (15% of sales) would mean a cash cost of SEK 4bn, or SEK 5bn including central operations. We find this scenario too pessimistic as the Maxi stores are significantly larger than the remaining stores, making a pro-rata analysis on the number of stores misleading.
Table 9: Costs to exit Norway (SEKm) – base case
Source: Handelsbanken Capital Markets
Table 10: Costs to exit Norway (SEKm) – worst case
Source: Handelsbanken Capital Markets
2012 2013e 2014e 2015eIncluding NorwaySales 96,862 98,780 100,095 102,063EBIT (adj.) 3,427 3,119 3,440 3,699EBIT margin (adj.) 3.5% 3.2% 3.4% 3.6%
Excluding NorwaySales 77,812 82,373 84,490 86,614EBIT (adj.) 4,021 3,888 4,040 4,149EBIT margin (adj.) 5.2% 4.7% 4.8% 4.8%
DifferenceEBIT margin 1.6% 1.6% 1.3% 1.2%EBIT 17% 25% 17% 12%
2.0%
2.5%
3.0%
3.5%
4.0%
4.5%
5.0%
5.5%
6.0%
1,000
1,500
2,000
2,500
3,000
3,500
4,000
4,500
5,000
Including Norway Excluding Norway
Group EBIT Group EBIT margin (RHS)
Maxi closure Maxi sales % of Norway Rest of Norway P&L cost -367 15% -1,565Cash cost -176 15% -1,173
Maxi closure Maxi stores % of Norway Rest of Norway P&L cost -367 4% -7,528Cash cost -176 4% -4,033
Normal shutdown costs
Using Maxi shut-down as a proxy for the remaining stores
SEK 2bn in cash costs assumed for a Norwegian exit SEK 5bn worse case but unlikely
August 29, 2013 19
Figure 25: Exit cash costs in relation to number of years to recoup losses
Source: Handelsbanken Capital Markets
Rimi Baltic: growth opportunities with a flexible cost structure Rimi Baltic showed a LFL sales decline of 16% in 2009, followed by another 8% in 2010, when the economy in the region was struggling severely. Despite this, the company only posted a modestly negative EBIT margin in 2009 (-0.9% reported and -0.7 % adjusted) and even turned a small profit on an adjusted basis in 2010 (0.5%), much due to an impressive cut in opex, suggesting a flexible cost structure. Earnings have since returned to positive territory and we believe an integrated business such as this should be able to deliver EBIT margins of around 2.5-3.0%. In contrast to Sweden and Norway, the real estate assets are maintained in the operating subsidiaries, with an estimated market value of about SEK 3bn.
Figure 26: Rimi Baltic, sales (SEKbn) and LFL
Source: Handelsbanken Capital Markets and company data
Figure 27: Rimi Baltic, EBIT (SEKm) and margin
Source: Handelsbanken Capital Markets and company data
0.7
1.3
2.0
2.6 2.83.3
3.9
4.6
5.2
5.9
6.5
0.0
1.0
2.0
3.0
4.0
5.0
6.0
7.0
8.0
-500 -1,000 -1,500 -2,000 -2,173 -2,500 -3,000 -3,500 -4,000 -4,500 -5,000
-25.0%
-20.0%
-15.0%
-10.0%
-5.0%
0.0%
5.0%
10.0%
15.0%
20.0%
6
7
8
9
10
11
12
13
14
Sales LFL (RHS)
-1.5%-1.0%-0.5%0.0%0.5%1.0%1.5%2.0%2.5%3.0%3.5%4.0%
-150-100-50
050
100150200250300350
EBIT Adj. EBIT Adj. EBIT margin (RHS)
Payback time less than three years
Back to healthy profits after a post-Lehman year in the red

20 August 29, 2013
Figure 28: Rimi Baltic, market share
Source: Handelsbanken Capital Markets and company data
Figure 29: Rimi Baltic, nr of personnel, y-o-y
Source: Handelsbanken Capital Markets and company data
ICA Real Estate: the oft-overlooked jewel EBIT excluding capital gains in ICA Real Estate is around SEK 0.8-1bn on revenues of SEK 1.9-2.3bn (of which around SEK 1bn internal), and has been consistently in this range over the past few years. Considering the underlying stability of the business, we expect the past couple of years to be a good proxy for the coming years, with the exception that the SEK 8.5bn revaluation of the property portfolio that occurred in conjunction with the transactions from Ahold will be depreciated by around SEK 200m per year. This deprecation was booked in group central costs in Q2 2013, but we expect it to be relocated to ICA Real Estate in due course and model this with effect from Q3 2013 (some of it could end up in Rimi Baltic). We also note that the divesture of Norwegian ICA Maxi properties will lower EBIT somewhat. We model EBIT around SEK 800m per year in the coming years. Earnings in ICA Real Estate relate mainly to owned properties, as sub-lease arrangements are principally designed with no margin.
Figure 30: ICA Real Estate, sales and EBIT (SEKm)
Source: Handelsbanken and company data. *Adjusted is clean of capital gain/losses
ICA Bank: a growth segment Despite investments in a broader product offering, profitability continues to be healthy in ICA Banken. In 2012, the RoE was 14.3%, with the key to profitability being wide lending margins due to inexpensive deposit funding. In 2011-12, credit losses were just above 50bp, which is high compared to the larger Swedish banks, but the ratio has come down over time. We model EBIT of around SEK 200m per year in the coming three years, or a margin slightly above 20%.
23.8%
22.1%22.8%
22.4%21.8%
16%
17%
18%
19%
20%
21%
22%
23%
24%
25%
26%
2007 2008 2009 2010 2011
-10%
20%
-20%
-3%
2%4%
-25%
-20%
-15%
-10%
-5%
0%
5%
10%
15%
20%
25%
2007 2008 2009 2010 2011 2012
0
200
400
600
800
1,000
1,200
1,400
1,600
2007 2008 2009 2010 2011 2012 2013e 2014e 2015e
EBIT Adj. EBIT
Defensive income stream
SEK 800m in annual EBIT seen (includes additional SEK 200m of depreciations from market value revaluation)
~20% margins

August 29, 2013 21
Figure 31: ICA Bank, sales and EBIT (SEKm)
Source: Handelsbanken Capital Markets and company data
Non-food portfolio companies: small in the bigger scheme The performance among the five Non-food portfolio companies in ICA Gruppen varies, but on aggregate the portfolio has been loss-making for the past three years. Ongoing restructuring might yield performance better than that seen recently, but we still factor in cautious assumptions on the back of the weak track record. In total, these companies comprise less than 3% of group sales and value (based on our SOTP).
Table 11: Sales and EBIT, Non-food portfolio companies
Source: Handelsbanken Capital Markets and company data
0.0%
5.0%
10.0%
15.0%
20.0%
25.0%
30.0%
0
100
200
300
400
500
600
700
800
900
1,000
2007 2008 2009 2010 2011 2012 2013e 2014e 2015e
Sales EBIT Adj. EBIT Adj. EBIT margin (RHS)
2008 2009 2010 2011 2012 2013e 2014e 2015eFormaSales 880 870 875 847 533 386 366 348Sales growth 11% -1% 1% -3% -37% -28% -5% -5%EBIT 13 -21 15 -12 -124 -50 -50 -50EBIT margin 1% -2% 2% -1% -23% -13% -14% -14%
CerveraSales 341 544 707 722 723 717 717 717Sales growth -10% 60% 30% 2% 0% -1% 0% 0%EBIT -24 -25 -33 -12 -7 -28 -20 -20EBIT margin -7.0% -4.6% -4.7% -1.7% -1.0% -3.9% -2.8% -2.8%
HemtexSales 1391 1295 1081 929 941 948 976 976Sales growth -14% -7% -17% -14% 1% 1% 3% 0%EBIT -33 -221 -233 -116 -46 -24 -12 -10EBIT margin -2.3% -17.0% -21.5% -12.5% -4.9% -2.6% -1.3% -1.0%
inkClubSales 394 452 497 504 529 532 532 532Sales growth 8% 15% 10% 1% 5% 1% 0% 0%EBIT 53 64 39 34 38 26 26 21EBIT margin 13.5% 14.2% 7.8% 6.7% 7.2% 5.0% 5.0% 4.0%
Kjell & CoSales 441 550 644 684 814 909 954 1,002Sales growth 28% 25% 17% 6% 19% 12% 5% 5%EBIT 13 22 23 38 61 59 59 65EBIT margin 2.9% 3.9% 3.6% 5.6% 7.5% 6.5% 6.2% 6.5%
TotalSales 3,447 3,711 3,804 3,686 3,540 3,492 3,546 3,576Sales growth -1% 8% 2% -3% -4% -1% 2% 1%EBIT 22 -181 -189 -68 -78 -17 3 6EBIT margin 1% -5% -5% -2% -2% 0% 0% 0%
Small but solid profit
Less than 3% of group sales
Forma: changing industry dynamics Cervera: highly competitive market Hemtex: losses being reduced after a few tough years inklClub: online retailer with good margins but slowing sales growth Kjell & Co: portfolio star!

22 August 29, 2013
Cash flow and balance sheet: reduced gearing whilst healthy dividends ICA’s cash flow generation has been very stable in the past few years, underpinned by its solid Swedish operations, as well as by the healthy and low-volatility cash flow from the Real Estate business. Despite the Norwegian problems, cash flow from operations grew by 4% per annum in 2007-12 and we expect the group to sustainably generate significant positive cash flow.
Figure 32: Cash flow from operations
Source: Handelsbanken Capital Markets and company data Note: 2005-12 is ICA, 2013e-15e is ICA Gruppen
Figure 33: Free cash flow
Source: Handelsbanken Capital Markets and company data Note: 2005-12 is ICA, 2013e-15e is ICA Gruppen. CFO after capex
Dividend scenarios Following the acquisition of the remaining shares in ICA, amounting to SEK 20bn, net debt was SEK 18bn in Q1 2013, corresponding to net debt/EBITDA of 3.7x on a pro forma basis. After a share issue in May 2013, raising SEK 5bn and strong cash flow generation (with no dividend paid in 2013 due to the transaction), we expect the group to end 2013 with SEK 11.3bn of net debt, or 2.3 EBITDA, which compares to the group’s target of reaching 2x before Q3 2014. Despite paying out dividends of nearly SEK 1bn per year in the coming two years, we see the gearing reaching around 1.4x in 2016, which is within the company’s long-term target of 1-1.5x that the group expects to reach in 2016.
In our base case, we model no issuance of preference shares, which ICA Gruppen has stated could be one option to reduce gearing (as it would be treated as equity), and also assume it will be within the 1-1.5x target by year-end 2016. In this scenario, the average dividend yield in 2013e-16e is 4%.
In a scenario where the group issues SEK 4bn in preference shares (SEK 3-5bn was mentioned in conjunction with the Ahold transaction) and also assuming it will allow the gearing to be in the high end of its 1-1.5x target translates into an average dividend yield of 8% during 2013e-16e. Now, we see it highly unlikely that the group would issue preference shares and allow a top-of-the-range gearing with continued uncertainties as the Norwegian turnaround just to be able to distribute an 8% dividend yield, but it nonetheless highlights the dividend capacity in ICA Gruppen.
0
1,000
2,000
3,000
4,000
5,000
6,000
CFO Average
0500
1,0001,5002,0002,5003,0003,5004,0004,5005,000
FCF Average
Sustained strong cash flow
Significant deleveraging ahead
Base... ...and bull case
August 29, 2013 23
Table 12: Debt reduction and dividend potential – base case
Source: Handelsbanken Capital Markets and company data. Note: 2012 is pre-share issue and EBITDA refers to pro forma. Due to the two classes of shares (regular shares amounting to 120m and C-class shares amounting to 82m), where only the regular shares are entitled to receiving dividends paid out in 2014-15, the dividend cash outflow is a function of DPS and regular shares only.
Table 13: Debt reduction and dividend potential – bull case
Source: Handelsbanken Capital Markets and company data. Note: 2012 is pre-share issue and EBITDA refers to pro forma. Due to the two classes of shares (regular shares amounting to 120m and C-class shares amounting to 82m), where only the regular shares are entitled to receiving dividends paid out in 2014-15, the dividend cash outflow is a function of DPS and regular shares only. Assumed yield on preference shares is 7%.
Figure 34: Net debt and gearing
Source: Handelsbanken Capital Markets and company data Note: 2012 pro forma and excluding ICA Bank
Figure 35: Dividend forecasts
Source: Handelsbanken Capital Markets and company data Note: 2005-12 is Hakon Invest. Average refers to 2005-11.
2012 2013e 2014e 2015e 2016eFCF 17,988 1,707 2,133 2,184 2,343Share issue 5,000Dividends 0 -774 -893 -1,710Change in cash 6,707 1,359 1,291 633Net debt 17,988 11,281 9,921 8,630 7,997
EBITDA 5,088 4,836 5,217 5,499 5,598Net debt/EBITDA 3.54 2.3 1.9 1.6 1.4
Dividend/FCF 0% 36% 41% 73%
DPS 6.50 7.50 8.50 8.50Dividend yield 3.4% 3.9% 4.4% 4.4%
2012 2013e 2014e 2015e 2016eFCF 17,988 1,707 2,133 2,184 2,343Share issue 5,000Pref shares 4,000Pref yield -280 -280 -280Dividends 0 -1,727 -1,846 -3,319Change in cash 17,988 10,707 127 58 -1,256Net debt 17,988 7,281 7,154 7,096 8,352
Dividend/FCF 0% 81% 85% 142%
EBITDA 4,836 5,217 5,499 5,598Net debt/EBITDA 1.5 1.4 1.3 1.5
DPS 14.50 15.50 16.50 16.50Dividend yield 7.5% 8.0% 8.5% 8.5%
0.00.51.01.52.02.53.03.54.0
0
4,000
8,000
12,000
16,000
20,000
2012 2013e 2014e 2015e
Net debt
Net debt/EBTIDA (adj.) RHS
Company target: Q314
Company target: long term
0%
1%
2%
3%
4%
5%
6%
7%
23456789
10
DPS Div yld (RHS) Avg div yld (RHS)
4% average yield in 2013e-16e is our base case
8% yield if group goes ahead with preference shares and allows top-end of gearing target

24 August 29, 2013
ICA Gruppen’s financial objectives The current financial goals will be reviewed in 2013 by the new board of directors and management, as the underlying conditions for the existing goals have changed due to the transaction. This could require existing financial goals to be replaced with new ones or for figures in the existing goals to be changed. Our understanding is that the focus of the basic strategy will, however, remain the same.
Table 14: Financial objectives vs. HCM expectations
Source: Handelsbanken Capital Markets and company data
Table 15: Forecasts by division, yearly
Source: Handelsbanken Capital Markets and company data. Note: 2008-12 is ICA. 2013-15 is ICA Gruppen. 2013 is pro forma.
Financial objectives 2013e 2014e 2015eOutgrow the market in each market -0.8% 1.3% 2.0%EBIT margin 3.5-4.0% 3.2% 3.4% 3.6%ROE 14-16% over a business cycle 7.1% 8.5% 9.0%Equity ratio 30–35% 33% 33% 34%Dividend payout ratio above 40% 88% 74% 75%Strong and stable dividend yield 3.4% 3.9% 4.4%Net debt of 1.0–1.5x EBITDA long term 2.3 1.9 1.6
Sales 2008 2009 2010 2011 2012 2013e 2014e 2015eICA Sweden 55,969 59,003 60,596 62,500 65,751 67,576 69,265 70,997ICA Norway 20,164 21,666 21,225 20,679 19,050 16,408 15,605 15,449RIMI Baltic 12,661 12,329 10,352 10,089 10,050 10,217 10,542 10,877ICA Bank 582 634 612 764 814 822 880 924ICA Real Estate 1,969 2,095 2,135 2,202 2,252 2,204 2,249 2,294ICA Group functions 1,221 467 452 348 102 91 100 100Intra group sales -1,603 -1,543 -1,512 -1,403 -1,155 -1,124 -1,138 -1,151Non-Food portfolio 2,587 2,592 2,574Total 90,963 94,651 93,860 95,179 96,864 98,780 100,095 102,063
EBIT 2008 2009 2010 2011 2012 2013e 2014e 2015eICA Sweden 1,709 2,320 2,750 2,617 2,869 3,045 3,174 3,275ICA Norway -719 -506 -588 -1,255 -1,020 -962 -600 -450RIMI Baltic 182 -109 -13 173 224 290 304 314ICA Bank 111 132 91 171 181 170 198 208ICA Real Estate 1,134 1,025 917 1,005 1,298 949 779 780ICA Group functions -300 -149 -233 -206 -244 -410 -359 -369Non-Food portfolio -73 -56 -59Total 2,117 2,713 2,924 2,505 3,309 3,008 3,440 3,699
EBIT (adj.) 2008 2009 2010 2011 2012 2013e 2014e 2015eICA Sweden 1,709 2,408 2,750 2,617 2,869 3,045 3,174 3,275ICA Norway -679 -466 -588 -646 -594 -769 -600 -450RIMI Baltic 262 -85 52 194 256 291 304 314ICA Bank 111 132 91 171 181 170 198 208ICA Real Estate 802 882 893 1,005 986 867 779 780ICA Group functions -300 -159 -233 -206 -244 -411 -359 -369Non-Food portfolio 0 -73 -56 -59Total 1,923 2,711 2,960 3,101 3,454 3,119 3,440 3,699
EBIT margin (adj.) 2008 2009 2010 2011 2012 2013e 2014e 2015eICA Sweden 3.1% 4.1% 4.5% 4.2% 4.4% 4.5% 4.6% 4.6%ICA Norway -3.4% -2.2% -2.8% -3.1% -3.1% -4.7% -3.8% -2.9%RIMI Baltic 2.1% -0.7% 0.5% 1.9% 2.5% 2.8% 2.9% 2.9%ICA Bank 19.1% 20.8% 14.9% 22.4% 22.2% 20.7% 22.5% 22.5%ICA Real Estate 40.7% 42.1% 41.8% 45.6% 43.8% 39.3% 34.6% 34.0%Total 2.1% 2.9% 3.2% 3.3% 3.6% 3.2% 3.4% 3.6%
Ticking some but not all boxes

August 29, 2013 25
Table 16: Forecasts by division, quarterly
Source: Handelsbanken Capital Markets and company data. Note: 2008-12 is ICA. 2013-15 is ICA Gruppen. 2013 is pro forma
Q112 Q212 Q312 Q412 Q113 Q213 Q313e Q413e Q114e Q214e Q314e Q414eICA Sweden 15,371 16,698 16,498 17,184 16,043 17,177 16,828 17,528 16,444 17,606 17,249 17,966ICA Norway 5,017 4,957 4,395 4,681 4,138 4,151 3,999 4,119 3,848 3,860 3,859 4,037RIMI Baltic 2,418 2,589 2,418 2,625 2,367 2,581 2,539 2,730 2,485 2,684 2,615 2,757ICA Bank 198 210 199 207 219 203 200 200 220 220 220 220ICA Real Estate 25 26 23 28 30 11 25 25 25 25 25 25ICA Group functions -292 -298 -276 -289 -280 -268 -282 -295 -283 -271 -285 -298Intra group sales 572 577 548 555 561 557 537 549 572 568 548 560Non-Food portfolio 563 613 570 841 561 613 572 846Total 23,309 24,758 23,805 24,990 23,641 25,025 24,417 25,697 23,872 25,306 24,803 26,113
EBIT ICA Sweden 540 673 858 798 629 719 883 814 645 755 923 852ICA Norway -120 -606 -130 -164 -439 -193 -170 -160 -160 -170 -140 -130RIMI Baltic 29 60 36 99 40 72 71 106 44 76 75 109ICA Bank 39 58 58 26 54 32 42 42 50 50 50 50ICA Real Estate -62 -85 -45 -52 -100 -147 -81 -83 -89 -89 -88 -94ICA Group functions 262 532 274 230 313 246 195 195 195 195 195 195Non-Food portfolio -60 -35 -44 66 -58 -30 -39 71Total 690 631 1,051 937 437 694 897 980 627 786 974 1,053
EBIT (adj.)ICA Sweden 540 673 858 798 629 719 883 814 645 755 923 852ICA Norway -120 -180 -130 -164 -246 -193 -170 -160 -160 -170 -140 -130RIMI Baltic 29 60 68 99 40 73 71 106 44 76 75 109ICA Bank 39 58 58 26 54 32 42 42 50 50 50 50ICA Real Estate -62 -85 -45 -52 -100 -148 -81 -83 -89 -89 -88 -94ICA Group functions 257 264 246 219 247 230 195 195 195 195 195 195Non-Food portfolio -60 -35 -44 66 -58 -30 -39 71Total 684 751 1,055 937 564 678 897 980 627 786 974 1,053
EBIT margin (adj.)ICA Sweden 3.5% 4.0% 5.2% 4.6% 3.9% 4.2% 5.3% 4.6% 3.9% 4.3% 5.4% 4.7%ICA Norway -2.4% -3.6% -3.0% -3.5% -5.9% -4.6% -4.3% -3.9% -4.2% -4.4% -3.6% -3.2%RIMI Baltic 1.2% 2.3% 2.8% 3.8% 1.7% 2.8% 2.8% 3.9% 1.8% 2.8% 2.9% 4.0%ICA Bank 19.7% 27.6% 29.1% 12.6% 24.7% 15.8% 21.0% 21.0% 22.5% 22.5% 22.5% 22.5%ICA Real Estate 44.9% 45.8% 44.9% 39.5% 44.0% 41.3% 36.3% 35.4% 34.0% 34.3% 35.6% 34.7%Total 2.9% 3.0% 4.4% 3.7% 2.4% 2.7% 3.7% 3.8% 2.6% 3.1% 3.9% 4.0%

26 August 29, 2013
Company description of ICA Gruppen On March 27, 2013, ICA Gruppen acquired the remaining 60% stake in food retailer ICA from Royal Ahold for SEK 20bn. ICA Gruppen is dominated by ICA, the largest food retailer in Sweden, but it also has substantial operations in Norway and the Baltic countries. The group also includes significant real estate activities, a bank and a portfolio of non-food companies.
ICA Gruppen is primarily active in food retailing in Sweden, Norway and the Baltic countries through its ICA subsidiaries, which also include banking and real estate operations. Besides ICA-related activities, the group also includes holdings in mainly non-food retailers. Our understanding is that each holding will be reviewed, as they must be regarded as core to ICA to remain within the business ahead.
Figure 36: Business areas
Source: Company data
ICA's revenue generation There are four cornerstones that generate ICA’s revenues: the stores (retail), the supply chain (wholesale), real estate development and financial services.
• Supply chain (53.9% of revenue in 2012): ICA buys products and sells them at a mark-up to retailer-owned stores in Sweden and franchised stores in Norway. ICA also sells services to these stores, such as marketing communications, logistics, training and retail technology.
• Stores (42.5% of revenue): ICA generates retail revenue in several ways. In Sweden, it comes from royalties and/or profit distributions from the stores. It also comes from end-customers through Maxi Special, the wholly-owned company that sells houseware and leisure products at Maxi ICA Hypermarkets. In Norway, revenue comes from wholly-owned stores and franchise fees. In the Baltic countries, it comes from wholly-owned stores.
• Properties (2.8% of revenue): It is strategically important for ICA to obtain and develop the right retail locations and shopping centres. It therefore owns many of its retail properties. Tenants can include other retailers too. The operations generate revenue in the form of rent. If the properties have appreciated in value when they are sold, they generate a capital gain (and vice versa).
• Financial services (0.8% of revenue): Offering financial services is one of many ways ICA is trying to build customer loyalty. In Sweden, ICA Bank’s customers can save, borrow and obtain insurance. Net interest income and commissions contribute to earnings, while the use of ICA Bank’s cards reduces fees paid to other card issuers. The bank also offers services such as payment terminals and ATMs to other companies for a fee.

August 29, 2013 27
The group has organised its operations into five business divisions, which we elaborate on in detail below. ICA’s profit generation is mainly concentrated to ICA Sweden and ICA Real Estate, while ICA Norway weighs on group profitability. Rimi Baltic and the ICA Bank contribute small, but positive, earnings.
Figure 37: ICA revenue split by activity
Source: Handelsbanken Capital Markets and company data *Data refers to 2012
Figure 38: ICA revenue split by division
Source: Handelsbanken Capital Markets and company data *Data refers to 2012
Figure 39: ICA EBIT by division
Source: Handelsbanken Capital Markets and company data *EBIT is adjusted for one-offs and refers to 2012
Figure 40: ICA number of employees
Source: Handelsbanken Capital Markets and company data *Excluding franchise and independent stores
Store structure ICA manages its stores in the following way:
• Independent retailers working in cooperation: The retailers own and manage their stores but have central agreements with ICA covering a number of areas. This is called the “ICA idea” and is used only in Sweden. The number of stores using this concept is 1,330.
• Wholly-owned stores: ICA owns and manages the stores as an integrated chain. It is the only store format used in the Baltic countries and is the dominant format in Norway. The number of stores using this format is 577.
• Franchising: These stores are managed by franchisee, used only in Norway. The number of stores using this format is 155.
• Combination: The above models can be combined, depending on the situation. Maxi ICA Hypermarkets in Sweden is a combination solution where retailers manage the food departments while ICA manages non-food goods. 75 stores use this format.
54%
43%
3% 1%0%
10%
20%
30%
40%
50%
60%
Wholesale Retail Real estate Financial services
67%
20%
10%
1% 2%0%
10%
20%
30%
40%
50%
60%
70%
80%
ICA Sweden ICA Norway Rimi Baltic ICA Bank ICA Real Estate
-1,000
-500
0
500
1,000
1,500
2,000
2,500
3,000
3,500
ICA Sweden
ICA Real Estate
RIMI Baltic
ICA Bank ICA Group
functions
ICA Norway
76
4,667
8,078 8,199
21,020
0
3,000
6,000
9,000
12,000
15,000
18,000
21,000
24,000
Other Norway Baltics Sweden Total
The “ICA idea” in Sweden only
Baltics and part of Norway
Norway also franchise

28 29 August 2013
ICA Sweden In 2012, ICA Sweden generated revenue of SEK 65.7bn and an operating profit of SEK 2.8bn. For Sweden, revenue mainly relates to ICA’s wholesale activities, which accounted for SEK 52.2bn, but revenue also derives from non-food sales at the 75 ICA Maxi stores, store rentals, royalties (we estimate that around one-third of ICA Sweden’s EBIT stems from royalties) and various services. Consolidated revenue of SEK 65.7bn can be compared to total store sales of SEK 98.8bn (which is the number used in market share analysis, for example).
The ICA idea: unique to Sweden ICA Sweden operates a food retail business in cooperation with independent ICA retailers based on the ICA concept, which is unique to ICA Sweden. Each retailer owns and operates their own store and can therefore meet customers’ needs through locally-adapted concept offerings. ICA originated from this concept, which also involves individual retailers working together in, for example, procurement, logistics and market communications to achieve the same economies of scale as a wholly-owned retail chain. The ICA retailers are able to use ICA’s purchasing organisation to deliver goods to the stores but are not obliged to purchase products through ICA. Today, around 75% of ICA retailers’ purchasing goes through the ICA system, with the balance generally being dairy products, where industry praxis is to buy goods from third-party vendors and locally-produced products.
The percentage of products bought centrally from ICA has proven to be stable over time, as it is normally cheaper and more efficient for the store owners to purchase from ICA. The ICA concept is owned by the Association of ICA retailers, whose main mission is to preserve and develop the ICA concept. The ICA agreement contains a pre-emption clause that applies if the ICA retailer wants to sell its company or operations (the selling price is 1x net income). New stores are normally established by ICA Sweden, which provides financing to the retailers to establish their stores. In this way, the retailer initially only owns a small percentage of the shares (9%) in the company that operates the store, but when enough profit has been accumulated the retailer’s ownership rises to 99% as they control all the shares apart from one “golden share”, which is held centrally at ICA.
In addition to independent stores, about 75 ICA Maxi stores operate in a mixed format, with the ICA retailer responsible for food items and ICA responsible for non-food items.
Table 17: ICA Sweden store format
Source: Handelsbanken Capital Markets and company data. Excludes Cure (52 pharmacy stores) and ICA To Go (four stores). Revenues refer to 2012.
Table 18: ICA Sweden store trends
Source: Handelsbanken Capital Markets and company data. Excludes Cura (the pharmacy stores)
Name Format Nr of stores Sales Store itemsICA Nära Convinience 700 15,041 5,000ICA Supermarket Supermaket 430 30,919 7,000-11,000ICA Kvantum Large supermarket 121 23,577 10,000-30,000ICA Maxi Hypermarket 75 28,735 35,000
2005 2006 2007 2008 2009 2010 2011 2012Maxi ICA Stormarknad 45 52 60 66 69 72 75 75ICA Kvantum 126 122 119 117 118 116 117 121ICA Supermarket 488 477 460 454 444 443 435 430ICA Nära 758 746 743 732 728 716 704 700ICA To Go 2 3 4Sweden total 1,417 1,397 1,382 1,369 1,359 1,349 1,334 1,330
SEK 100bn business when measured on store sales to end-customer
Independent store owners manage the stores but are closely linked to ICA 75% of goods bought from ICA ICA always keeps a “golden” share
Supermarket format the largest
Negative store growth but positive space growth

August 29, 2013 29
Figure 41: ICA Maxi store layout
Source: Company data
ICA Norway ICA entered Norway in 1992, when the group acquired a 30% stake in Hagen Group (owned by Stein Erik Hagen), who ran the Rimi format, and the two companies merged in 1998. The division posted solid margins until 2005, when it turned into losses and has since remained loss-making.
At the end of 2012, ICA had 497 outlets in Norway, down by 53 from the year before, the result of the divestment of ICA Maxi in Norway. The majority of the outlets are wholly-owned (69%) while the remainder (31%) are franchised. Total revenue in 2012 was SEK 19bn and an operating loss of SEK 597m was posted, excluding non-recurring items (SEK 1,023m on a reported basis).
At the start of 2013, ICA operated four formats in Norway, of which one (ICA Naer) will be discontinued during the year.
Poor profitability has led to repeated restructuring initiatives at ICA Norway. The main reasons behind poor profitability are, according to management, too high purchasing prices, which are around 4-5% above that of key competitors, and high costs for logistics. Therefore, in January 2013 ICA entered into a co-operation agreement with Norgesgruppen concerning certain purchasing, distribution and logistics activities. However, the Norwegian Competition Authority (NCA) announced in April 2013 an interim suspension of the contract until September 30, 2013. The decision means that the co-operation—and ICA’s strategy regarding Norway—is subject to considerable uncertainty. ICA has not stated its intentions in the event that the co-operation is permanently blocked. In addition to unfavourable purchasing prices, we note that ICA lacks the scale, market share and strong brand equity that it enjoys in Sweden.
Table 19: ICA Norway store format
Source: Handelsbanken Capital Markets and company data
Name Format Nr of stores Sales Store itemsRimi Discount 315 9,701 3.500-4.000ICA Supermarked Supermarket 78 4,750 12.000-13.000ICA Naer Convenience 68 2,149 10,000-30,000Matkroken Convenience 36 n.a 3.000-5.000
ICA’s hypermarket format
Long history in Norway
Large losses
Teaming up with Norgesgruppen on sourcing? Collaboration currently suspended by NCA
Shifting portfolio towards Rimi and Supermarket

30 29 August 2013
Figure 42: ICA Norway, store count
Source: Handelsbanken Capital Markets and company data
Figure 43: ICA Norway, store structure
Source: Handelsbanken Capital Markets and company data
Figure 44: Rimi store layout
Source: Company data
Rimi Baltic ICA has operated indirectly in the Baltic region since 1996, through its Norwegian business which expanded the Rimi concept into the Baltic region. ICA Baltic was established in 1999 and in 2004, the group agreed with Finnish retailer Kesko on a joint venture in the Baltic region, creating Rimi Baltic. Two years thereafter, ICA acquired Kesko’s interest in Rimi Baltic and consolidated the business.
Rimi Baltic is a wholly-owned subsidiary with 235 outlets in Estonia (83), Latvia (114) and Lithuania (38). Total revenue was SEK 10bn and operating profit was SEK 224m in 2012.
Table 20: Rimi Baltic store format
Source: Handelsbanken Capital Markets and company data
200
300
400
500
600
700
800
2006 2007 2008 2009 2010 2011 2012
Owned69%
Franchise31%
Name Format Nr of stores Store itemsRimi Hypermarket Hypermarket 48 30.000-40.000Rimi Supermarket Supermarket 72 12.000-18.000Supernetto and Säästumarket Discount 115 2,500
Rimi store entrance
In the Baltic region since 1996
Discount and hypermarket focus

August 29, 2013 31
Table 21: Number of stores in Baltic countries
Source: Handelsbanken Capital Markets and company data
Figure 45: Rimi store layout
Source: Company data
ICA Real Estate By nature, food retailing requires plenty of retail space, so retailers typically have extensive property activities. Stores may be leased or owned, with each option having different implications for reported financials. ICA’s business model of independent stores implies that it need not necessarily control the stores. However, controlling the stores is preferable, as it allows ICA to better manage store locations and tie the store owners closer to the group.
Most of the group’s real estate activities in Sweden and Norway are centralised within ICA Real Estate, but the real estate activities in the Baltic States are integrated in the food retail operation. ICA also has a joint-venture property company (Ancore), together with Alecta. As of year-end 2012, group-owned properties were booked at SEK 12bn, of which SEK 9bn was in ICA Real Estate and the balance was in the Baltic region. In conjunction with the acquisition, the total property portfolio’s value was lifted by SEK 6.1bn, to SEK 18.1bn (including properties in Rimi Baltic of SEK 3bn and sale and leaseback properties of SEK 1.8bn, the latter which we deduct from the market value).
Table 22: ICA Real Estate facts
Source: Handelsbanken Capital Markets and company data
2006 2007 2008 2009 2010 2011 2012Estonia 64 65 74 78 80 82 83Latvia 90 94 97 102 108 111 114Lithuania 51 56 62 66 47 46 38Total 205 215 233 246 235 239 235
Book Nr of Sqm % of Nr of leases Sqm Employeesvalue properties owned owned outside tenants outside landlords leased
Sweden 7 110 560,000 10% 620 1,300,000Norway 2 80 190,000 30% 460 600,000Ancore 0 17 160,000Total 9 190 750,000 15% 1,090 1,900,000 78
Charcuterie desk in Rimi Baltic
Significant real estate portfolio
Market value of SEK ~16bn

32 29 August 2013
ICA Bank Founded in 2001, ICA Bank is active in the Swedish market with the original objective of building customer loyalty (although the bank has since expanded). The bank offers cards, deposits and lending, savings in funds, and insurance. Mortgages are offered in co-operation with state-owned mortgage bank SBAB, with no recourse to the ICA Bank. As of year-end 2012, the bank had on-balance-sheet assets of SEK 11.6bn and equity of SEK 944m. The bank is entirely deposit funded, with a loan-to-deposit ratio at 72% as of year-end 2012, although this ratio benefits from mortgages being transferred to SBAB.
ICA Bank has had restrictive credit assessment criteria over the years, which have resulted in very low credit losses. Of the bank’s total lending, credit losses in 2012 were 0.52%, the second lowest to date. In 2012, around 89,000 new debit/credit cards were issued and at the end of the year the total number of issued cards was approximately 430,000.
At the end of 2012, ICA Bank had around 331 ATMs located inside ICA stores. ICA retailers lease the ATMs from ICA Bank and load them themselves with cash from their operations, according to the security rules in place.
Non-food portfolio holdings ICA Gruppen has five portfolio companies that combined account for less than 5% of group assets. Three are Swedish non-food retailers:
• Cervera (91% ownership): kitchen equipment retailer
• Kjell & Co (50%): home electronics accessories retailer
• Hemtex (68.5%): home textiles retailer
• inkClub (100%): an online retailer of ink and printer accessories
• Forma Publishing Group (100%): publisher of magazines and books
Building customer loyalty
0.52% credit losses
Non-food portfolio under review

33 August 29, 2013
Nordic and Baltic food retail market dynamics Swedish food retail offers the defensive characteristics one expects to find in food retail, with high concentration making it an attractive market for the incumbents. Norway is tougher, with highly price conscious consumers and challenging logistics; the fact that the market is one of the most penetrated in the world measured by stores per inhabitant does not make things easier. The Baltic countries are growing rapidly; purchasing power is still substantially below that of the Nordic markets, making it an interesting growth market to be exposed to from a convergence perspective.
Sweden: an attractive market for incumbents The total Swedish food retail market was worth SEK 289bn in 2012, according to HUI Research. The market is mature but attractive for incumbent players, as it has a concentrated market structure in which three dominant players—ICA, Coop and Axfood—control more than 64% of the market. A fourth player, Bergendahls, has a 5% market share, mainly thanks to its regional stronghold in the south of Sweden. The industry benefits from Sweden’s strong macroeconomic conditions and has proven to be resilient to economic downturns.
The competitive landscape in Sweden is stable, with limited competition from international players; non-domestic discounters Lidl and Netto have gained only modest market shares (4% combined).
In the past five years, hypermarkets have been the winning market segment at the expense of traditional supermarkets whereas discount and convenience have maintained their market shares relatively flat.
Figure 46: Market shares, Sweden
Source: SCB/HUI and Magazine Markets, 2011. Other channels include petrol stations, kiosks, mail order, online, outdoor markets and pharmacy
Figure 47: Format evolution, Sweden
Source: Handelsbanken Capital Markets and Axfood. Refers to 2012
Sales in the Swedish food retail market have exhibited an average annual growth rate of 2.6% since 1992, rarely falling into negative territory and showing much less volatility than many other sectors, underpinning the defensive nature of food. In volume terms (calendar-adjusted), the average growth rate is lower, at 1.2%.
36%
15% 13%
5% 4%9%
18%
0%5%
10%15%20%25%30%35%40%45%
0%10%20%30%40%50%60%70%80%90%
100%
2005 2006 2007 2008 2009 2010 2011
Hard discount Discount Hypermarkets
Supermarkets Convinience
A stable market with high concentration
Hypermarkets – the market share gainer
Averaging 3% growth

34 29 August 2013
Figure 48: Swedish food retail sales, y-o-y
Source: Statistics Sweden
Figure 49: Swedish food retail volume, y-o-y
Source: Statistics Sweden *Calendar-adjusted data
Shopping trends in Sweden • Value for the money and smart shopping: Fewer companies are talking about
discount vs. premium customers: they all target both. Private labels are a response to customer demand for good quality at a fair price.
• Simple and convenient: The common denominator for customers is that their time is in short supply. As a result, many are willing to pay for convenience in the form of prepared foods and smart solutions, such as pre-selected grocery bags. There is also a growing interest in online grocery shopping.
• Sustainable and local: An increasing number of people are caring about sustainability issues, such as using leftovers to reduce waste, shopping less but more often, and choosing organic and local foods.
Norway: the most penetrated food market in Europe In Norway, the food retail industry is even more concentrated than in Sweden, with four groups (Norgesgruppen, Coop, Rema 1000 and ICA Norway) having a combined 96% of the market, according to statistics from AC Nielsen. However, these statistics are measured more narrowly than the Swedish data.
Norgesgruppen is the clear market leader in Norway, with a particular stronghold in wholesale. Norway has proven to be a difficult market for discounters, with German retailer Lidl entering in 2004 only to exit in 2008. The Norwegian food retail market was worth NOK 144bn in 2011 (AC Nielsen).
Trends in the Norwegian food retail market are positive: in 2012, growth was 3% and net sales were NOK 148bn. However, Norway is an elongated country, with much of the population spread out as a result. This makes it necessary for the food retail sector to coordinate efficient transport options. Due to the proximity to Sweden, many Norwegians travel to Sweden to shop more cheaply. Cross-border shopping accounted for 7.8% of Norwegian food retail sales in 2011.
Food purchases constitute an average of 12% of Norwegian customers’ total expenditure. The country has the most grocery stores per capita in Europe. Norwegians demand high quality, while price awareness is high. Price awareness is a contributing factor to the low price segment driving growth in the Norwegian food retail market.
-4.0%-3.0%-2.0%-1.0%0.0%1.0%2.0%3.0%4.0%5.0%6.0%7.0%
199219931994199519961997199819992000200120022003200420052006200720082009201020112012
Sales Average
-2.0%
-1.0%
0.0%
1.0%
2.0%
3.0%
4.0%
5.0%
6.0%
7.0%
199219931994199519961997199819992000200120022003200420052006200720082009201020112012
Volume, calendar-adjusted Average
Highly concentrated market
Challenging logistics due to geography
Most groceries per inhabitant in Europe

August 29, 2013 35
Figure 50: Food retail market share, Norway
Source: AC Nielsen, 2011
Figure 51: Norwegian food retail sales, y-o-y
Source: Handelsbanken Capital Markets and company data
Baltic region: a European convergence play
Estonia Based on its GDP performance, Estonia handled the financial crisis well and had the fastest recovery. The Estonian food retail market amounted to around EUR 1.9bn in 2012, growing by 8.8%. ETK holds 21% market share, followed by ICA’s Rimi concept at 19%.
Latvia Latvia’s economic performance previously lagged that of its neighbouring countries, but over the past two years there has been a sharp increase in growth. Unemployment is falling but remains high, so price is an important factor. According to ICA Gruppen, the food retail market is affected by demand for special items by a large proportion of the population given that 45% of the population originate from Russia. On average, Latvians spend around 30% of their income on food. Latvia’s food retail market amounted to around EUR 2.3bn and grew by 5.3% in local currency in 2012. Rimi Baltic (ICA’s brand) holds 25% of the market, which, together with Maxima, makes them the largest players in the market.
Lithuania Unemployment is still high in Lithuania, at around 13% in 2012. Competition in the food retail market is very tough and the rate of new establishments is high. Purchasing power is still low. On average, the population spends around 30% of income on food, so focus on price is much stronger than customer loyalty. The Lithuanian food retail market amounted to around EUR 3.4bn and grew by 4.4% in 2012. Maxima is the clear market leader, controlling more than 15% of the market, whereas Rimi is the fourth largest player with 9% market share.
Table 23: Key facts Baltic countries
Source: Handelsbanken Capital Markets, company data, Estonian Foreign Ministry, LIAA. AC Nielsen. *Data refers to 2012
37%
23% 21%
14%
4%
0%
10%
20%
30%
40%
50%
5.5%
9.0%
6.2%
3.2%3.8%
3.0%
0%
2%
4%
6%
8%
10%
12%
2007 2008 2009 2010 2011 2012
Estonia Latvia LithuaniaMarket size (EURbn) 1.9 2.3 3.4Sales growth, y-o-y (local FX) 8.8% 5.3% 4.4%
Rimi Baltic market share 19% 25% 9%Rimi Baltic number of stores 83 114 38Implied sales (SEKm) 3,141 5,003 2,662
9% market growth in 2012
Price conscious consumers
Largest market in the Baltic region
Lithuania the largest market but the slowest growth

36 29 August 2013
Figure 52: Market shares, Estonia
Source: Handelsbanken Capital Markets and Estonian Foreign Ministry
Figure 53: Market shares, Latvia
Source: Handelsbanken Capital Markets, company data and LIAA
Figure 54: Market shares, Lithuania
Source: AC Nielsen, 2011
Figure 55: Food retail growth in Baltic region
Source: Source: Macrobond. Rolling 3-months
21%19%
17%15%
8%
0%
5%
10%
15%
20%
25%
ETK Rimi Selver Maxima Prisma
25% 25%
7%4% 3%
0%
5%
10%
15%
20%
25%
30%
Rimi Maxima IKI Mego Elvi
53%
22%
16%
9%
0%
10%
20%
30%
40%
50%
60%
Maxima IKI Norfa Rimi
70
80
90
100
110
120
130
140
150
Jan-
06Ju
n-06
Nov
-06
Apr
-07
Sep
-07
Feb-
08Ju
l-08
Dec
-08
May
-09
Oct
-09
Mar
-10
Aug
-10
Jan-
11Ju
n-11
Nov
-11
Apr
-12
Sep
-12
Feb-
13
Latvia Estonia Lithuania

37 August 29, 2013
Appendix ICA Gruppen’s management ICA’s CEO Per Strömberg has replaced Claes-Göran Sylvén as CEO of the parent company, ICA Gruppen. Claes-Göran Sylvén will remain as the President of the Association of ICA retailers, a position he has held since 2003. Hakon Invest’s CFO Göran Blomberg and Legal Counsel Fredrik Hägglund have also left their positions to become employed by the Association of ICA retailers.
Table 24: ICA Gruppen management
Source: Company data
ICA’s eight strategic priorities • Grow the retail business: Continue to develop the retail operations, especially in the
Baltic countries and in Sweden’s three major metropolitan regions: Stockholm, Göteborg and Malmö.
• Increase profitable private label penetration: The company’s goal is that the share of private labels will grow by one percentage point per year. In 2012, ICA’s private label penetration was 20% in Sweden, 10% in Norway and 13% in the Baltic region.
• Ensure competitive pricing and fair price perception: In all of its markets ICA is, according to the company, perceived as more expensive than it actually is. Focus is to change customer perception in this area.
• Build a digital sale position: Online sales continue to grow in importance. ICA strives to be a leader in digital sales and work is currently undertaken to roll out a digital offering in 2014.
• Turnaround the ICA Norway business: Reversing several years of losses at ICA Norway is a high priority for the group.
• Collaborate to capture synergies within the Group: Finding synergies between various operations and companies is also a priority. Important areas include digital sales, CRM systems, private label development and sourcing.
• Ensure efficient operations with focus on the supply chain
• Create common ICA values
Function NameCEO Per StrömbergDeputy CEO and CFO Sonat Burman-OlssonCEO of ICA Special Björn AbildCEO of ICA Real Estate Lena BobergSVP Strategy & Business Development Liv Forhaug, SVP HR & ICA School Åsa GabrielSVP Corporate Communications Björn OlssonCEO of Rimi Baltic Edgar SesemannSVP Portfolio Companies Stein Petter SkiCEO of ICA Sweden Anders SvenssonCEO of ICA Norway Thorbjørn Theie CEO of ICA Bank Jörgen Wennberg

38 29 August 2013
ICA Gruppen (Hakon Invest) history 2000 ICA Gruppen, which was previously called Hakon Invest, was originally ICA
Förbundet Invest and was formed in 2000, when Ahold became an owner of ICA AB. At this stage, ICA AB was 50% owned by Ahold, 30% by Hakon Invest and 20% by the Norwegian company Canica.
2004 Canica sold its 20% holding in ICA AB to Ahold. Half of the shares were then acquired by Hakon Invest. Following these transactions, Ahold owned 60% and Hakon Invest owned 40% of the shares in ICA AB
2005 ICA Förbundet Invest changed its name to Hakon Invest ahead of the IPO. Hakon Invest was listed on the Stockholm Stock Exchange’s O list on December 8, 2005.
At the same time, Hakon Invest’s operational strategy was broadened, with a continued significant ownership influence in ICA AB and the ICA idea as a base, to include active and long-term investment operations with a focus on retail companies.
The change of name to Hakon Invest marked a step towards clarification of the new direction and that its operations were separate from ICA AB. Ahead of the listing on the Stockholm Stock Exchange, a new share structure was established with ordinary shares and C shares.
2006-2011 In 2006, Hakon Invest acquired stakes in the electronics chain Kjell & Company, white goods chain Hemma and glass and porcelain chain Cervera.
In 2007, Hakon Invest became majority owner of the white goods chain Hemma and part owner of the online retailer inkClub.
In 2008, Hakon Invest steadily increased its holding in the home furnishings chain Hemtex.
In 2011, the tough situation in the white goods market contributed to Hakon Invest's decision to divest portfolio company Hemma.
2013 In February 2013, Hakon Invest concluded an agreement with Ahold to acquire the remaining 60% of the shares in ICA, which meant that ICA became wholly owned by Hakon Invest. In order to reflect the Group’s focus on ICA and ICA-related operations, it was decided to change the name of Hakon Invest to ICA Gruppen at the Annual General Meeting in May 2013.
In conjunction with the acquisition of ICA, the Association of ICA Retailers reduced its holding in ICA Gruppen from 67.3% to 51.3%, partly through the sale of a 10% shareholding to Industrivärden and partly through sales to institutional investors. The Association of ICA Retailers has subsequently established a long-term level for its ownership in ICA Gruppen.
Source: Handelsbanken Capital Markets and company data

August 29, 2013 39
ICA history 1917 Hakon Swenson founded Hakonbolaget, the origin of today’s ICA, in
Västerås. At the core of the ICA concept lies the idea of getting individual retailers to join forces and form purchasing centres, allowing them to achieve the same economies of scale as the chains by making joint purchases, establishing stores and sharing their marketing costs.
1938 Hakonbolaget took the name ICA AB.
1940 ICA Förbundet, the membership organisation for ICA retailers, was formed. Originally, this organisation had no ownership stake in ICA, but between 1972 and 2000, ICA Förbundet became the largest owner of ICA.
1945 ICA Förlaget was founded.
1964 The four purchasing centres within ICA AB agreed on a joint ICA symbol – today’s ICA label.
1966 ICA’s sales figures overtook those of Konsum and the company became a market leader.
1972 ICA was organised into three regional companies known as ICA Hakon, ICA Eol and ICA Essve, whose origins lie in the companies that made up ICA from 1917 onwards.
1988 ICA bought the mail order company Ellos in order to expand the operations conducted alongside its principal activities, i.e. selling food. ICA had previously acquired Hjalmar Blomquist AB (which later became the DUKA stores), BOB-industrier in Kumla (fruit drinks and jam), Svea Choklad (Polly candy, among others) and the Lindex clothing chain, which later, in its turn, bought Gulins. All these companies were sold during the 1990s, when the operations decided once again to focus entirely on selling food.
1990 The ICA customer card was launched.
1992 ICA took a 30% stake in Hagen Group in Norway, who owns the Rimi format.
1998 ICA and Norway’s Hakon Gruppen AS merged into a single parent company; ICA AB.
2001 The ICA Bank was registered in July.
2002 Netto-stores were established in the south of Sweden in cooperation with Dansk Supermarked.
2004 ICA Baltic agreed with Finnish Kesko on a joint venture in the Baltics, creating Rimi Baltic.
2006 ICA acquires Kesko’s interest in Rimi Baltic AB with the brands Rimi Hypermarket, Rimi Supermarket, Säästu Market and Super Netto. It also sold ICA Meny and reduced its holding in Netto to 5%.
2008 Conversion to the new Red Rimi begins in Norway.
2010 ICA opened pharmacies in Sweden under the brand name Cura, as well as a new convenience concept called ICA To Go. ICA Norway divested the Maxi stores.
Source: Handelsbanken Capital Markets and company data

40 August 29, 2013
Geographical revenue split, 2012
Ownership structure
Source: : Handelsbanken Capital Markets Source: Handelsbanken Capital Markets
Opportunities • Turnaround potential in ICA Norway • Increasing sale of non-food and private labels • Growth opportunities in the Baltic region • Online opportunity • Market share gains in metropolitan areas in Sweden
Risks • Delayed turnaround in ICA's Norwegian business • Large costs if Norway is exited • Potential conflict between main and minority owners • Sensitive to a potential weakening of the property market
Investment case summary Rock solid Swedish business with Real Estate backing ICA Sweden is a category heavyweight with 37% market share and best-in-Europe margins with significant real estate backing Good dividends despite de-leveraging We foresee a 4% medium-term dividend potential whilst the balance sheet is de-leveraged Valuation multiples a lot lower than they appear 2014e EV/EBIT ~12x excl. Norway and ~12x excl. real estate and ~10x excl. both
Source: Handelsbanken Capital Markets and Reuters Source: Handelsbanken Capital Markets
Revenue, 12-month rolling
Source: Handelsbanken Capital Markets, Reuters
EBIT, 12-month rolling
Source: Handelsbanken Capital Markets
0
20
40
60
80
100
Nordics Eastern Europe
% of total sales
28 June 2013 Votes (%) Capital (%)ICA-handlarnas Förbund 51.3 51.3Industrivärden 10.0 10.0AMF 1.8 1.8Handelsbanken Funds 1.3 1.3Lannebo Funds 1.2 1.2
Number of A-shares
Number of B-shares
Total
Free float
201,146,795
201,146,795
39%
-70
0
70
140
210
280
350
0
24,000
48,000
72,000
96,000
120,000
Q2 12 Q3 12 Q4 12 Q1 13 Q2 13 Q3 13e Q4 13e Q1 14e
%SEKm
Sales, Rolling 12m y/y growth (RHS)
2.6
2.8
3.0
3.2
3.4
0
700
1,400
2,100
2,800
3,500
Q2 12 Q3 12 Q4 12 Q1 13 Q2 13 Q3 13e Q4 13e Q1 14e
%SEKm
EBIT, Rolling 12m Adj EBIT-marg (RHS)
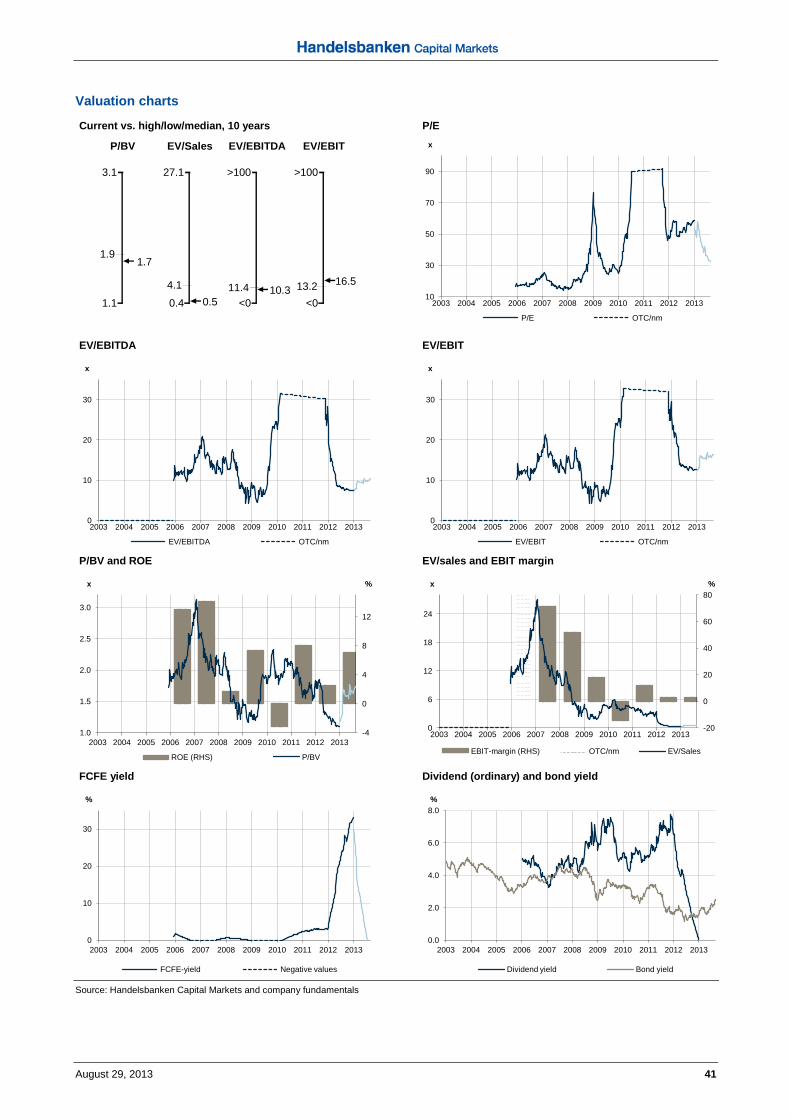
August 29, 2013 41
Valuation charts
Current vs. high/low/median, 10 years
P/E
EV/EBITDA
EV/EBIT
P/BV and ROE
EV/sales and EBIT margin
FCFE yield
Dividend (ordinary) and bond yield
Source: Handelsbanken Capital Markets and company fundamentals
>100
<0
EV/EBITDA EV/EBIT
>100
<0
3.1
1.1
P/BV EV/Sales
27.1
0.4
1.91.7
4.10.5
11.4 10.3 13.2 16.510
30
50
70
90
2003 2004 2005 2006 2007 2008 2009 2010 2011 2012 2013
x
P/E OTC/nm
0
10
20
30
2003 2004 2005 2006 2007 2008 2009 2010 2011 2012 2013
x
EV/EBITDA OTC/nm
0
10
20
30
2003 2004 2005 2006 2007 2008 2009 2010 2011 2012 2013
x
EV/EBIT OTC/nm
-4
0
4
8
12
1.0
1.5
2.0
2.5
3.0
2003 2004 2005 2006 2007 2008 2009 2010 2011 2012 2013
%x
ROE (RHS) P/BV
-20
0
20
40
60
80
0
6
12
18
24
2003 2004 2005 2006 2007 2008 2009 2010 2011 2012 2013
%x
EBIT-margin (RHS) OTC/nm EV/Sales
0
10
20
30
2003 2004 2005 2006 2007 2008 2009 2010 2011 2012 2013
%
FCFE-yield Negative values
0.0
2.0
4.0
6.0
8.0
2003 2004 2005 2006 2007 2008 2009 2010 2011 2012 2013
%
Dividend yield Bond yield

42 August 29, 2013
Technical indicators, one year Share price and moving averages
Volume
Bollinger bands
Relative strength index (RSI)
Volume-weighted change (VWC)
Source: Reuters Note: RSI compares the magnitude of recent share price gains with the magnitude of recent share price losses. Rule-of-thumb: RSI>70 => overbought; RSI<30 => oversold. VWC is the volume weighted relation between [close-open] and [high-low] and indicates the momentum of the price change.
100
120
140
160
180
200
Feb 13 Mar 13 Apr 13 May 13 Jun 13 Jul 13 Aug 13
SEK
ICA Gruppen MAV 20d MAV 200d
0
78
156
234
312
Feb 13 Mar 13 Apr 13 May 13 Jun 13 Jul 13 Aug 13
Volume (thousands)
100
130
160
190
Feb 13 Mar 13 Apr 13 May 13 Jun 13 Jul 13 Aug 13
SEK
+(-)2 STDEV MAV 20D ICA Gruppen
10
30
50
70
90
Feb 13 Mar 13 Apr 13 May 13 Jun 13 Jul 13 Aug 13
RSI
120
140
160
180
200
-50
-20
10
40
70
Feb 13 Mar 13 Apr 13 May 13 Jun 13 Jul 13 Aug 13
SEK%
Volume Weighted Change ICA Gruppen (RHS)

August 29, 2013 43
Valuation data
Source: Handelsbanken Capital Markets
Financial ratios
Source: Handelsbanken Capital Markets
SEK 2008 2009 2010 2011 2012 2013e 2014e 2015eShare price year-end/current 89.3 112 118 96.0 118 193 193 193Share price high 141 122 144 119 120 198 - -Share price low 67.8 66.3 102 76.5 90.0 118 - -Market cap (SEKm) 15,316 19,177 20,181 16,483 25,397 38,821 38,821 38,821Net debt (SEKm) -1,456 -628 -627 -563 12,988 11,281 9,921 8,630MV associates (SEKm) 7,419 7,678 6,818 6,185 772 806 829 855MV minorities (SEKm) 0 178 90 157 0 -9 -18 -18EV (SEKm) 6,441 11,049 12,826 9,892 37,613 49,287 47,895 46,579 P/E reported (x) 76.7 24.7 n.m >99 2.8 26.1 19.1 17.0P/E adj (x) 81.9 26.4 n.m 52.3 54.4 24.3 19.1 17.0P/CEPS (x) 76.6 26.0 n.m 50.3 2.3 12.1 10.2 9.5P/BV (x) 1.61 1.91 2.28 1.95 1.16 1.66 1.58 1.49ROE adj (%) 1.8 7.1 -2.9 8.1 2.9 7.0 8.5 9.0Pre-tax ROIC (%) 7.8 4.8 -4.3 3.7 54.3 8.6 9.9 10.6 EV/sales (x) 5.4 4.6 4.8 4.0 0.38 0.50 0.48 0.46EV/EBITDA (x) 10.3 25.3 n.m 31.4 7.4 10.2 9.2 8.5EV/EBIT (x) 10.5 26.1 n.m 32.8 12.3 16.0 14.0 12.7 FCF adj yield (%) 3.0 2.1 2.3 3.9 31.1 -17.9 5.5 5.6Tot Div yield (%) 5.2 5.0 4.8 6.1 0 3.4 3.9 4.4Payout ratio (%) 403 125 <-200 951 0 88.0 74.0 74.7
% 2008 2009 2010 2011 2012 2013e 2014e 2015eEquity/total assets 95.0 89.8 85.1 85.6 29.9 33.2 34.8 36.6Net debt/equity -15.3 -6.1 -7.0 -6.5 59.4 48.3 40.3 33.2Net debt/EBITDA (x) n.m n.m n.m n.m 0.9 2.4 1.9 1.6Net cash flow/capex <-200 <-200 -1.5 <-200 <-200 85.4 66.3 61.4EBITDA net interest cover (x) 1.4 -27.3 n.m -22.5 17.0 6.2 8.2 10.0EBIT net interest cover (x) 1.4 -26.4 n.m -21.6 14.5 3.9 5.4 6.7
FCFF/total debt >500 26.3 31.4 164 48.9 -52.8 17.0 19.1Total debt/capital 0.46 3.9 6.2 4.7 40.3 36.3 32.4 28.5Short-term debt/capital 0.05 1.2 4.1 2.2 19.4 15.3 11.3 7.4Long-term debt/capital 0.41 1.3 0.51 0.36 20.9 21.0 21.1 21.1
Inventory/sales 13.3 23.5 20.7 19.9 4.5 4.5 4.5 4.5Receivable/sales 24.9 16.2 14.5 13.6 11.8 8.5 8.5 8.5Acc.payable/sales 20.0 26.2 24.9 24.0 18.8 26.4 26.6 26.6Working capital/sales 12.1 8.9 5.6 4.2 -9.2 -9.7 -10.0 -10.0Current ratio 620 231 184 197 55.5 52.9 54.8 57.4Quick ratio 570 166 137 143 41.7 37.0 38.2 39.8
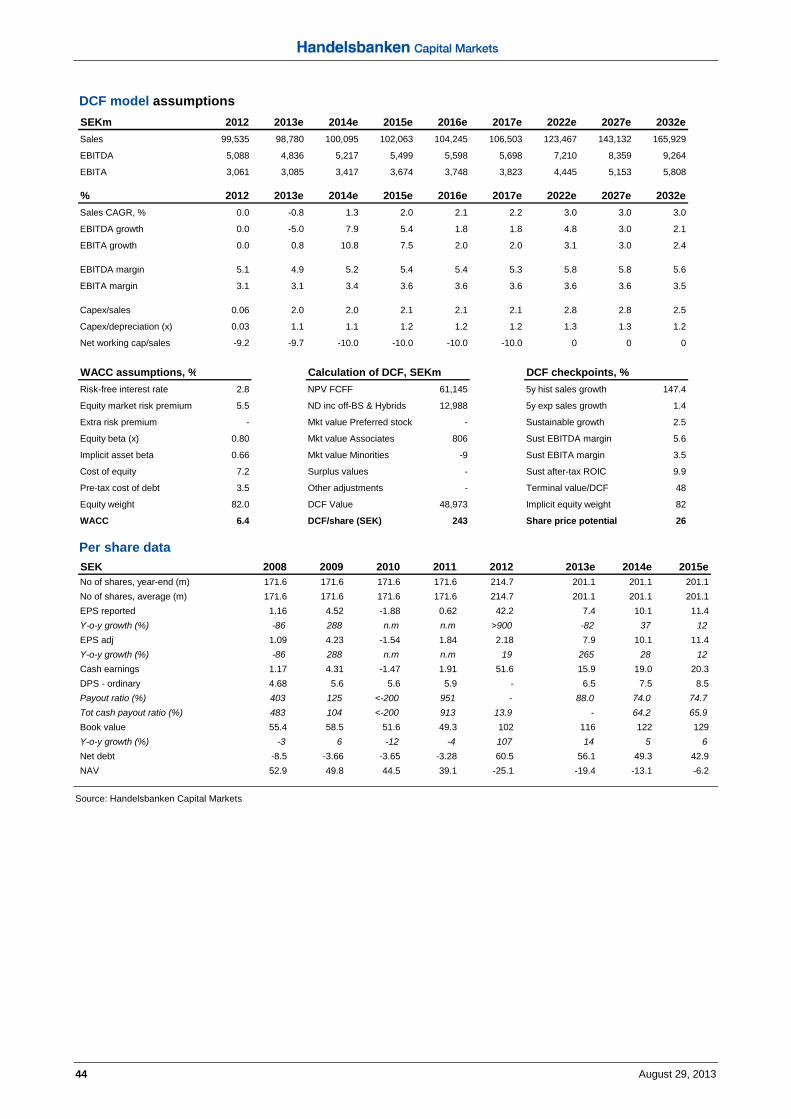
44 August 29, 2013
DCF model assumptions
Per share data
Source: Handelsbanken Capital Markets
SEKm 2012 2013e 2014e 2015e 2016e 2017e 2022e 2027e 2032eSales 99,535 98,780 100,095 102,063 104,245 106,503 123,467 143,132 165,929
EBITDA 5,088 4,836 5,217 5,499 5,598 5,698 7,210 8,359 9,264
EBITA 3,061 3,085 3,417 3,674 3,748 3,823 4,445 5,153 5,808 % 2012 2013e 2014e 2015e 2016e 2017e 2022e 2027e 2032eSales CAGR, % 0.0 -0.8 1.3 2.0 2.1 2.2 3.0 3.0 3.0
EBITDA growth 0.0 -5.0 7.9 5.4 1.8 1.8 4.8 3.0 2.1
EBITA growth 0.0 0.8 10.8 7.5 2.0 2.0 3.1 3.0 2.4 EBITDA margin 5.1 4.9 5.2 5.4 5.4 5.3 5.8 5.8 5.6
EBITA margin 3.1 3.1 3.4 3.6 3.6 3.6 3.6 3.6 3.5 Capex/sales 0.06 2.0 2.0 2.1 2.1 2.1 2.8 2.8 2.5
Capex/depreciation (x) 0.03 1.1 1.1 1.2 1.2 1.2 1.3 1.3 1.2
Net working cap/sales -9.2 -9.7 -10.0 -10.0 -10.0 -10.0 0 0 0
DCF checkpoints, %Risk-free interest rate 2.8 NPV FCFF 61,145 5y hist sales growth 147.4
Equity market risk premium 5.5 12,988 5y exp sales growth 1.4
Extra risk premium - Mkt value Preferred stock - Sustainable growth 2.5
Equity beta (x) 0.80 Mkt value Associates 806 Sust EBITDA margin 5.6
Implicit asset beta 0.66 Mkt value Minorities -9 Sust EBITA margin 3.5
Cost of equity 7.2 Surplus values - Sust after-tax ROIC 9.9
Pre-tax cost of debt 3.5 Other adjustments - Terminal value/DCF 48
Equity weight 82.0 DCF Value 48,973 Implicit equity weight 82
WACC 6.4 DCF/share (SEK) 243 Share price potential 26
WACC assumptions, % Calculation of DCF, SEKm
ND inc off-BS & Hybrids
SEK 2008 2009 2010 2011 2012 2013e 2014e 2015eNo of shares, year-end (m) 171.6 171.6 171.6 171.6 214.7 201.1 201.1 201.1No of shares, average (m) 171.6 171.6 171.6 171.6 214.7 201.1 201.1 201.1EPS reported 1.16 4.52 -1.88 0.62 42.2 7.4 10.1 11.4Y-o-y growth (%) -86 288 n.m n.m >900 -82 37 12EPS adj 1.09 4.23 -1.54 1.84 2.18 7.9 10.1 11.4Y-o-y growth (%) -86 288 n.m n.m 19 265 28 12Cash earnings 1.17 4.31 -1.47 1.91 51.6 15.9 19.0 20.3DPS - ordinary 4.68 5.6 5.6 5.9 - 6.5 7.5 8.5Payout ratio (%) 403 125 <-200 951 - 88.0 74.0 74.7Tot cash payout ratio (%) 483 104 <-200 913 13.9 - 64.2 65.9Book value 55.4 58.5 51.6 49.3 102 116 122 129Y-o-y growth (%) -3 6 -12 -4 107 14 5 6Net debt -8.5 -3.66 -3.65 -3.28 60.5 56.1 49.3 42.9NAV 52.9 49.8 44.5 39.1 -25.1 -19.4 -13.1 -6.2

August 29, 2013 45
P&L accounts, annual data
Source: Handelsbanken Capital Markets
SEKm 2008 2009 2010 2011 2012 2013e 2014e 2015eSales 1,184 2,392 2,663 2,498 99,535 98,780 100,095 102,063Cost of goods sold -761 -1,404 -1,462 -1,399 -84,466 -84,472 -85,300 -86,855Gross profit 423 988 1,201 1,099 15,069 14,309 14,795 15,207Other operating income 17 56 48 67 9,321 304 200 200Associated income 704 612 212 553 130 34 23 25Sales and marketing costs -326 -929 -1,267 -1,056 -9,569 -11,639 -11,578 -11,734Admin costs -206 -304 -297 -361 -3,299 - - -S,G&A -532 -1,233 -1,564 -1,417 -12,868 -11,639 -11,578 -11,734OPEX -532 -1,233 -1,564 -1,417 -12,868 -11,639 -11,578 -11,734Other operating expenses - - -284 - - 0 0 0EBIT 612 423 -387 302 11,652 3,008 3,440 3,699change (%) - 232 - - - - - -Net interest expenses -449 16 -3 14 -806 -768 -640 -550Net financials -449 248 46 -50 -785 -768 -640 -550EBT 163 671 -341 252 10,867 2,240 2,800 3,149Paid tax 9 21 -12 23 -1,827 -763 -772 -860Deferred tax -2 - - - - - - -Tax 7 30 -12 23 -1,827 -763 -772 -860 tax rate (%) -4.3 -4.5 -3.5 -9.1 16.8 34.1 27.6 27.3Discontinued ops - - -38 -216 - - - -Minorities 17 25 88 40 18 9 9 -Net income 187 726 -303 99 9,058 1,486 2,037 2,289 Growth % 2008 2009 2010 2011 2012 2013e 2014e 2015eSales 10 102 11 -6 >900 -1 1 2EBIT -20 -31 n.m n.m >900 -74 14 8Net income -86 288 n.m n.m >900 -84 37 12 % of sales 2008 2009 2010 2011 2012 2013e 2014e 2015eGross margin 35.7 41.3 45.1 44.0 15.1 14.5 14.8 14.9EBIT margin 51.7 17.7 -14.5 12.1 11.7 3.0 3.4 3.6EBT margin 13.8 28.1 -12.8 10.1 10.9 2.3 2.8 3.1Net margin 14.4 29.3 -14.7 2.4 9.1 1.5 2.0 2.2SG&A 44.9 51.5 58.7 56.7 12.9 11.8 11.6 11.5OPEX 44.9 51.5 58.7 56.7 12.9 11.8 11.6 11.5 Profitability % 2008 2009 2010 2011 2012 2013e 2014e 2015eROE reported 1.9 7.4 -2.8 3.6 59.7 6.6 8.5 9.0ROE adj 1.9 7.4 -2.4 6.1 3.1 7.1 8.5 9.0ROCE 6.3 4.2 n.m 3.3 13.4 8.5 9.4 10.2Pre-tax ROIC 7.8 4.8 -4.3 3.7 54.3 8.6 9.9 10.6After tax ROIC 8.3 4.9 -4.5 4.0 45.2 5.6 7.2 7.7Sales/capital invested (x) 0.2 0.3 0.3 0.3 >500 2.8 2.9 3.0Sales/total assets (x) 0.1 0.2 0.2 0.2 2.4 1.4 1.4 1.4 Adjusted values SEKm 2008 2009 2010 2011 2012 2013e 2014e 2015eTotal adjustments to net inc - - -38 -216 8,591 -111 - -
EBIT 612 423 -387 302 3,061 3,119 3,440 3,699margin (%) 51.7 17.7 -14.5 12.1 3.1 3.2 3.4 3.6EBT 163 671 -341 252 2,276 2,351 2,800 3,149Net income 187 726 -265 315 467 1,597 2,037 2,289

46 August 29, 2013
Business areas, annual data
Source: Handelsbanken Capital Markets
Sales - SEKm 2008 2009 2010 2011 2012 2013e 2014e 2015eICA Sweden - - - - - 67,576 69,265 70,997ICA Norway - - - - - 16,408 15,605 15,449RIMI Baltic - - - - - 10,217 10,542 10,877ICA Bank - - - - - 822 880 924ICA Real Estate - - - - - 2,204 2,249 2,294ICA Group functions - - - - - 91 100 100Intra group sales - - - - - -1,124 -1,138 -1,151Non-Food portfolio - - - - - 2,587 2,592 2,574Total 1,184 2,392 2,663 2,498 99,535 98,780 100,095 102,063 Sales growth %ICA Sweden - - - - - - 3 2ICA Norway - - - - - - -5 -1RIMI Baltic - - - - - - 3 3ICA Bank - - - - - - 7 5ICA Real Estate - - - - - - 2 2ICA Group functions - - - - - - 10 0Intra group sales - - - - - - 1 1Non-Food portfolio - - - - - - 0 -1Total 10.1 102 11.3 -6.2 3,885 -0.8 1.3 2.0 EBIT - Reported - SEKmICA Sweden - - - - - 3,045 3,174 3,275ICA Norway - - - - - -962 -600 -450RIMI Baltic - - - - - 290 304 314ICA Bank - - - - - 170 198 208ICA Real Estate - - - - - 949 779 780ICA Group functions - - - - - -410 -359 -369Non-Food portfolio - - - - - -73 -56 -59Total - - - - - 3,008 3,440 3,699 EBIT - Reported margin %ICA Sweden - - - - - 4.5 4.6 4.6ICA Norway - - - - - -5.9 -3.8 -2.9RIMI Baltic - - - - - 2.8 2.9 2.9ICA Bank - - - - - 20.7 22.5 22.5ICA Real Estate - - - - - 43.0 34.6 34.0ICA Group functions - - - - - <-200 <-200 <-200Non-Food portfolio - - - - - -2.8 -2.2 -2.3Total - - - - - 3.0 3.4 3.6

August 29, 2013 47
Forecast balance sheet
Source: Handelsbanken Capital Markets
Forecast cash flow
Source: Handelsbanken Capital Markets
SEKm 2008 2009 2010 2011 2012 2013e 2014e 2015eAccounts receivable 191 204 190 155 5,868 3,457 3,503 3,572Inventory 158 563 550 496 4,463 4,445 4,504 4,593Other current assets 104 184 196 185 5,839 4,939 5,005 5,103Cash other interest-bearing 1,500 1,041 1,218 992 1,797 2,004 1,864 1,755Current assets 1,953 1,992 2,154 1,828 17,967 14,846 14,876 15,023Goodwill 304 712 431 687 14,116 14,116 14,116 14,116Other intangible 129 782 779 1,057 13,149 13,149 13,149 13,149Tangible assets 32 152 109 66 21,382 21,631 21,881 22,157Shares associates 7,419 7,678 6,818 6,185 772 806 829 855Oth non-IB fixed assets 184 67 225 237 5,778 5,778 5,778 5,778Total assets 10,021 11,383 10,516 10,060 73,164 70,326 70,629 71,078Equity 9,515 10,040 8,854 8,456 21,882 23,368 24,632 26,028Minorities 0 178 90 157 0 -9 -18 -18Shareholders equity 9,515 10,218 8,944 8,613 21,882 23,359 24,613 26,009Pension provisions 139 147 155 198 2,597 2,597 2,597 2,597Deferred tax liabilities 13 14 195 286 4,835 4,835 4,835 4,835LT interest-bearing debt 39 142 49 33 7,677 7,677 7,677 7,677ST interest-bearing debt 5 124 387 198 7,108 5,608 4,108 2,708Provisions - - - - 3,777 3,777 3,777 3,777Trade payables 180 522 562 483 14,746 8,199 8,308 8,471Oth current liabilities 130 216 224 249 10,542 14,274 14,714 15,003Current liabilities 315 862 1,173 930 32,396 28,081 27,130 26,182Total equity & liabilities 10,021 11,383 10,516 10,060 73,164 70,326 70,629 71,078Net interest bearing debt -1,456 -628 -627 -563 12,988 11,281 9,921 8,630
SEKm 2008 2009 2010 2011 2012 2013e 2014e 2015eEBITA 612 423 -387 302 11,652 2,974 3,417 3,674 + Net financials -449 27 30 - -785 -768 -640 -550 - Paid Tax 9 21 -12 23 -1,827 -763 -772 -860 + Dividends from associates 347 276 260 - - - - - - Chg in NWC 10 212 61 52 - 513 378 197 + Depreciation/Impairment 13 13 13 13 2,027 1,751 1,800 1,825 + Other adjustment -74 -487 569 279 -3,113 - - -Cash flow from operations (CFFO) 468 486 534 669 7,954 3,707 4,183 4,285 - Net recurring capex -14 -77 -65 -24 -57 -2,000 -2,050 -2,101FCF bef Acq. & Div. (FCF) 454 409 469 645 7,897 1,707 2,133 2,184 - Acquisitions -465 -513 -36 -217 - - - -FCF to Equity (FCFE) -11 -104 433 428 7,897 1,707 2,133 2,184 - Paid dividends to share holders -472 -393 -472 -472 - - -774 -893 - Share buy-backs -12 -3 - - - - - - + New share issue 1 - - - 5,000 - - - + Other adjustments -269 -328 38 -20 -26,448 - - -NET Cash flow/Chg in NIBD -763 -828 -1 -64 -13,551 1,707 1,359 1,291
Funds from operations (FFO) 111 -2 213 617 7,954 3,194 3,805 4,089Cash flow from operations (CFFO) 468 486 534 669 7,954 3,707 4,183 4,285FCF bef Acquisitions & Divestments 454 409 469 645 7,897 1,707 2,133 2,184FCF to Equity (FCFE) -11 -104 433 428 7,897 1,707 2,133 2,184

48 August 29, 2013
Disclosures Recommendation structure, definitions and allocations Handelsbanken Capital Markets Equity Research (HCM) employs a four-graded recommendation scale. The recommendations reflect the analyst’s assessment of how much the share price may appreciate or depreciate in absolute terms in a 12-month time horizon and takes into account risks related to both fundamental expectations and share performance. Investment ratings are determined by the ranges described in the table below. The recommendations do not represent the analyst’s or the bank’s assessment of the company’s fundamental value or quality. All investments involve risks and investors are encouraged to make their own decision as to the appropriateness of an investment in any securities referred to in this report, based on their specific investment objectives, financial status and risk tolerance. The recommendations and absolute performance intervals, together with the allocation of the rating categories amongst companies under coverage and amongst companies under coverage for which Handelsbanken has provided investment banking services in the past 12 months are listed below:
Source: Handelsbanken Capital Markets, as per 29/8 2013 Buy SEK 193 At times, the expected total returns may fall outside of the above stated ranges because of price movement and/or volatility. Such interim deviations from specified ranges will be permitted but will become subject to review by Research Management. Recommendations are continuously reviewed by the analyst and monitored by the Research Management and will be updated and/or refreshed regularly. The rationale behind a change in recommendation will be explained in such a refresher/update. On 28/08/2013 the recommendation ''Accumulate'', which was set on 02/11/2010 at the share price of SEK 122.50, was changed to the current recommendation ''Buy'' at a share price of SEK 193.00. The target price (TP) is the analyst’s assessment of the level at which the share should be traded in a 12-month period. The TP is used as a basis for the recommendation (see explanation above) and takes into account timing-related issues and triggers, such as relative valuation and newsflow. The TP does not represent the analyst’s or the bank’s assessment of the company’s fundamental value or quality. Unless otherwise specified, share prices mentioned in this report refer to the closing price of the previous day. 98,780 -0.9 100,095 -1 7.94 3.3 10.13 5.2 Buy No Under Work 97868 910
Valuation and earnings forecasts Target prices, outlooks and recommendations expressed in this research report are based on a combination of valuation models, such as discounted cash flow (DCF) and relative valuation to peers using ratios such as price-to-earnings (P/E), enterprise-value-to-operating profit (EV/EBITDA), price-to-book (P/B) and earnings models. Sales and earnings forecasts are based on historical financial data as reported by the company and the analyst's expectations for company-specific performance are derived from expectations of micro- and macro-economic developments. The company's different business segments are modelled separately in this process and then aggregated to achieve group forecasts for sales, earnings, cash flow and the balance sheet.
Research Disclaimers Handelsbanken Capital Markets, a division of Svenska Handelsbanken AB (publ) (collectively referred to herein as ‘SHB’), is responsible for the preparation of research reports. SHB is regulated in Sweden by the Swedish Financial Supervisory Authority, in Norway by the Financial Supervisory Authority of Norway, in Finland by the Financial Supervisory of Finland and in Denmark by the Danish Financial Supervisory Authority. All research reports are prepared from trade and statistical services and other information that SHB considers to be reliable. SHB has not independently verified such information and does not represent that such information is true, accurate or complete. Accordingly, to the extent permitted by law, neither SHB, nor any of its directors, officers or employees, nor any other person, accept any liability whatsoever for any loss, however it arises, from any use of such research reports or its contents or otherwise arising in connection therewith. In no event will SHB or any of its affiliates, their officers, directors or employees be liable to any person for any direct, indirect, special or consequential damages arising out of any use of the information contained in the research reports, including without limitation any lost profits even if SHB is expressly advised of the possibility or likelihood of such damages. The views contained in SHB research reports are the opinions of employees of SHB and its affiliates and accurately reflect the personal views of the respective analysts at this date and are subject to change. There can be no assurance that future events will be consistent with any such opinions. Each analyst identified in this research report also certifies that the opinions expressed herein and attributed to such analyst accurately reflect his or her individual views about the companies or securities discussed in the research report. Research reports are prepared by SHB for information purposes only. The information in the research reports does not constitute a personal recommendation or personalised investment advice and such reports or opinions should not be the basis for making investment or strategic decisions. This document does not constitute or form part of any offer for sale or subscription of or solicitation of any offer to buy or subscribe for any securities nor shall it or any part of it form the basis of or be relied on in connection with any contract or commitment whatsoever. Past performance may not be repeated and should not be seen as an indication of future performance. The value of investments and the income from them may go down as well as up and investors may forfeit all principal originally invested. Investors are not guaranteed to make profits on investments and may lose money. Exchange rates may cause the value of overseas investments and the income arising from them to rise or fall. This research product will be updated on a regular basis. No part of SHB research reports may be reproduced or distributed to any other person without the prior written consent of SHB. The distribution of this document in certain jurisdictions may be restricted by law and persons into whose possession this document comes should inform themselves about, and observe, any such restrictions. Please be advised of the following important research disclosure statements: SHB employees, including analysts, receive compensation that is generated by overall firm profitability. Analyst compensation is not based on specific corporate finance or debt capital markets services. No part of analysts’ compensation has been, is or will be directly or indirectly related to specific recommendations or views expressed within research reports. From time to time, SHB and/or its affiliates may provide investment banking and other services, including corporate banking services and securities advice, to any of the companies mentioned in our research. We may act as adviser and/or broker to any of the companies mentioned in our research. SHB may also seek corporate finance assignments with such companies. We buy and sell securities mentioned in our research from customers on a principal basis. Accordingly, we may at any time have a long or short position in any such securities. We may also make a market in the securities of all the companies mentioned in this report. [Further information and relevant disclosures are contained within our research reports.] SHB, its affiliates, their clients, officers, directors or employees may own or have positions in securities mentioned in research reports. According to the Bank’s Ethical Guidelines for the Handelsbanken Group, the board and all employees of the Bank must observe high standards of ethics in carrying out their responsibilities at the Bank, as well as other assignments. The Bank has also adopted Guidelines concerning Research which are intended to ensure the integrity and independence of research analysts and the research department, as well as to identify actual or potential conflicts of interests relating to analysts or the Bank and to resolve any such conflicts by eliminating or mitigating them and/or making such disclosures as may be appropriate. As part of its control of conflicts of interests, the Bank has introduced restrictions (“Information barriers”) on communications between the Research department and other departments of the Bank. In addition, in the Bank’s organisational structure, the Research department is kept separate from the Corporate Finance department and other departments with similar remits. The Guidelines concerning Research also include regulations for how payments, bonuses and salaries may be paid out to analysts, what marketing activities an analyst may participate in, how analysts are to handle their own securities transactions and those of closely related persons, etc. In addition, there are restrictions in communications between analysts and the subject company. For full information on the Bank’s ethical guidelines please see the Bank’s website www.handelsbanken.com/About the bank/Investor relations/Corporate social responsibility/Ethical guidelines. Handelsbanken has a ZERO tolerance of bribery and corruption. This is established in the Bank’s Group Policy on Bribery and Corruption. The prohibition against bribery also includes the soliciting, arranging or accepting bribes intended for the employee’s family, friends, associates or acquaintances. For company-specific disclosure texts, please consult the Handelsbanken Capital Markets website: www.handelsbanken.com/research. When distributed in the UK Research reports are distributed in the UK by SHB. SHB is authorised by the Swedish Financial Supervisory Authority (Finansinspektionen) and the Prudential Regulation Authority and subject to limited regulation by the Financial Conduct Authority and Prudential Regulation Authority. Details about the extent of our authorisation and regulation by the Prudential Regulation Authority, and regulation by the Financial Conduct Authority are available from us on request. UK customers should note that neither the UK Financial Services Compensation Scheme for investment business nor the rules of the Financial Conduct Authority made under the UK Financial Services and Markets Act 2000 (as amended) for the protection of private customers apply to this research report and accordingly UK customers will not be protected by that scheme. This document may be distributed in the United Kingdom only to persons who are authorised or exempted persons within the meaning of the Financial Services and Markets Act 2000 (as amended) (or any order made thereunder) or (i) to persons who have professional experience in matters relating to investments falling within Article 19(5) of the Financial Services and Markets Act 2000 (Financial Promotion) Order 2005 (the “Order”), (ii) to high net worth entities falling within Article 49(2)(a) to (d) of the Order or (iii) to persons who are professional clients under Chapter 3 of the Financial Conduct Authority Conduct of Business Sourcebook (all such persons together being referred to as “Relevant Persons”). When distributed in the United States Important Third-Party Research Disclosures: SHB and its employees are not subject to FINRA’s research analyst rules which are intended to prevent conflicts of interest by, among other things, prohibiting certain compensation practices, restricting trading by analysts and restricting communications with the companies that are the subject of the research report. SHB research reports are intended for distribution in the United States solely to “major U.S. institutional investors,” as defined in Rule 15a-6 under the Securities Exchange Act of 1934. Each major U.S. institutional investor that receives a copy of research report by its acceptance hereof represents and agrees that it shall not distribute or provide research reports to any other person Reports regarding fixed-income products are prepared by SHB and distributed by SHB to major U.S. institutional investors under Rule 15a-6(a)(2). Reports regarding equity products are prepared by SHB and distributed in the United States by Handelsbanken Markets Securities Inc. (“HMSI”) under Rule 15a-6(a)(2). When distributed by HMSI, HMSI takes responsibility for the report. Any U.S. person receiving these research reports that desires to effect transactions in any equity product discussed within the research reports should call or write HMSI. HMSI is a FINRA Member, telephone number (+1-212-326-5153).
ICA Gruppen This report has been submitted to the subject company prior to publication to approval the accuracy of the facts presented. Comments received from the subject company have not affected the analyst's recommendation, target price or estimates. As of aug 28, 2013 - Handelsbanken's analyst Erik Sandstedt has no position in ICA Gruppen or a related instrument. Handelsbanken has participated in a public offering of financial instruments of the subject company during the past twelve months Handelsbanken has received payment or a commitment to payment for corporate finance services from the subject company during the past twelve months
HCM rating RTP is expected to be1 HCM Universe2 IB services3
Buy >+20% 21% 8%Accumulate +5% - +20% 50% 5%Reduce -15% - +5 % 28% 3%Sell < -15 % 1% 0%1 RTP is defined as the expected share price appreciation (depreciation) including dividends over the next 12 months2 Percentage of companies under coverage within each rating category3 Percentage of companies within each rating category for which investment banking services have been provided in the past 12 months
Ratings: definitions and allocations

August 29, 2013 49
Company overview
P&L SEK 1997 1998 1999 2000 2001 2002 2003 2004 2005 2006 2007 2008 2009 2010 2011 2012 2013e 2014e 2015eSales, bn - - - - - 0.7 0.6 0.6 0.6 0.7 1.1 1.2 2.4 2.7 2.5 99.5 98.8 100.1 102.1 growth (%) - - - - - n.m -4 -1 -2 8 63 10 102 11 -6 >900 -1 1 2Gross margin % - - - - - 45.7 45.1 51.6 51.1 48.8 38.2 35.7 41.3 45.1 44.0 15.1 14.5 14.8 14.9SG&A to sales % - - - - - 54.9 50.8 49.4 54.7 52.7 46.8 44.9 51.5 58.7 56.7 12.9 11.8 11.6 11.5EBITDA, bn - - - - - 0.6 0.6 0.5 0.6 0.9 0.8 0.6 0.4 -0.4 0.3 13.7 4.7 5.2 5.5 margin % - - - - - 85.6 88.1 82.5 95.1 136 72.7 52.8 18.2 -14.0 12.6 13.7 4.8 5.2 5.4EBITA, bn - - - - - 0.6 0.5 0.5 0.6 0.9 0.8 0.6 0.4 -0.4 0.3 11.7 3.0 3.4 3.7 margin % - - - - - 85.6 83.7 78.0 93.0 134 71.4 51.7 17.7 -14.5 12.1 11.7 3.0 3.4 3.6EBIT, bn - - - - - 0.6 0.5 0.5 0.6 0.9 0.8 0.6 0.4 -0.4 0.3 11.7 3.0 3.4 3.7 margin % - - - - - 85.6 83.7 78.0 93.0 134 71.4 51.7 17.7 -14.5 12.1 11.7 3.0 3.4 3.6Net income, bn - - - - - -1.0 0.4 0.6 0.9 1.1 1.3 0.2 0.7 -0.3 0.1 9.1 1.5 2.0 2.3 growth % - - - - - n.m n.m 64 48 23 27 -86 288 n.m n.m >900 -84 37 12Adj net income, bn - - - - - -1.0 0.4 0.6 0.9 1.1 1.3 0.2 0.7 -0.3 0.3 0.5 1.6 2.0 2.3 Balance sheet 1997 1998 1999 2000 2001 2002 2003 2004 2005 2006 2007 2008 2009 2010 2011 2012 2013e 2014e 2015eTangible assets, bn - - - - - 0.1 0.1 0.1 0.1 0.1 0.0 0.0 0.2 0.1 0.1 21.4 21.6 21.9 22.2Goodwill, bn - - - - - 0.1 0.1 0.1 0.1 0.1 0.3 0.3 0.7 0.4 0.7 14.1 14.1 14.1 14.1Current assets, bn - - - - - 3.7 3.5 2.8 3.2 2.9 2.7 2.0 2.0 2.2 1.8 18.0 14.8 14.9 15.0Cash, bn - - - - - 3.5 3.3 2.7 3.0 2.7 2.3 1.5 1.0 1.2 1.0 1.8 2.0 1.9 1.8Total assets, bn - - - - - 7.4 7.3 7.6 8.3 9.1 10.4 10.0 11.4 10.5 10.1 73.2 70.3 70.6 71.1Equity, bn - - - - - 7.1 6.9 7.2 7.9 8.7 9.8 9.5 10.0 8.9 8.5 21.9 23.4 24.6 26.0Minority, m - - - - - - - - - - - - 178 90 157 - -9 -18 -18LT int bearing debt, b - - - - - 0.0 - - - - 0.1 0.0 0.1 0.0 0.0 7.7 7.7 7.7 7.7ST int bearing debt, b - - - - - - - - - - 0.0 0.0 0.1 0.4 0.2 7.1 5.6 4.1 2.7Current liab, bn - - - - - 0.2 0.2 0.2 0.2 0.2 0.4 0.3 0.9 1.2 0.9 32.4 28.1 27.1 26.2Total liabilities, bn - - - - - 7.4 7.3 7.6 8.3 9.1 10.4 10.0 11.4 10.5 10.1 73.2 70.3 70.6 71.1Net int bearing debt, b - - - - - -3.5 -3.3 -2.7 -3.0 -2.7 -2.2 -1.5 -0.6 -0.6 -0.6 13.0 11.3 9.9 8.6 Cash flow 1997 1998 1999 2000 2001 2002 2003 2004 2005 2006 2007 2008 2009 2010 2011 2012 2013e 2014e 2015eCapex, bn - - - - - 0.0 0.0 0.0 0.0 0.0 0.0 0.0 -0.1 -0.1 0.0 -0.1 -2.0 -2.1 -2.1FCF to firm, bn - - - - - 1.6 0.2 -0.4 -0.9 -0.3 0.1 0.6 0.1 0.2 0.7 7.2 1.6 2.0 2.0FCF to equity, bn - - - - - 0.8 0.6 -2.2 0.3 -0.2 0.1 0.0 -0.1 0.4 0.4 7.9 1.7 2.1 2.2Acquisitions, bn - - - - - - - -2.4 0.0 -0.3 -0.5 -0.5 -0.5 0.0 -0.2 - - - -Divestments, m - - - - - 77 8 - - - - - - - - - - - -Dividends, m - - - - - - - -141 -325 -355 -433 -472 -393 -472 -472 - - -774 -893CFFO, bn - - - - - 0.7 0.6 0.2 0.3 0.2 0.6 0.5 0.5 0.5 0.7 8.0 3.7 4.2 4.3 Ratios (%) 1997 1998 1999 2000 2001 2002 2003 2004 2005 2006 2007 2008 2009 2010 2011 2012 2013e 2014e 2015ePre-tax ROIC - - - - - 0 14.7 11.9 12.1 16.3 11.4 7.8 4.8 -4.3 3.7 54.3 8.6 9.9 10.6ROE reported - - - - - n.m 5.0 8.2 11.3 12.7 14.5 1.9 7.4 -2.8 3.6 59.7 6.6 8.5 9.0ROCE - - - - - n.m 7.5 6.8 7.5 10.7 8.3 6.3 4.2 n.m 3.3 13.4 8.5 9.4 10.2Capex to sales - - - - - 4.6 3.3 6.9 2.1 1.4 0.09 1.2 3.2 2.4 0.96 0.06 2.0 2.0 2.1NWC to sales - - - - - -15.1 -15.6 -13.2 -14.9 0.45 7.3 12.1 8.9 5.6 4.2 -9.2 -9.7 -10.0 -10.0Sales/assets (x) - - - - - 0.18 0.09 0.08 0.08 0.08 0.11 0.12 0.22 0.24 0.24 2.39 1.38 1.42 1.44Sales/IC (x) - - - - - n.m 0.18 0.15 0.13 0.12 0.16 0.15 0.27 0.30 0.31 >500 2.84 2.89 2.95Net debt/equity - - - - - -49 -48 -38 -38 -31 -23 -15 -6 -7 -7 59 48 40 33Equity/total assets - - - - - 94.7 95.2 95.8 95.0 95.2 94.4 95.0 89.8 85.1 85.6 29.9 33.2 34.8 36.6 Share data 1997 1998 1999 2000 2001 2002 2003 2004 2005 2006 2007 2008 2009 2010 2011 2012 2013e 2014e 2015eAvg no shares (m) - - - - - 161 161 161 161 161 161 161 161 161 161 201 201 201 201change (%) - - - - - n.m 0 0 0 0 0 0 0 0 0 25 0 0 0Avg diluted shares (m - - - - - 172 172 172 172 172 172 172 172 172 172 215 201 201 201change (%) - - - - - n.m 0 0 0 0 0 0 0 0 0 25 -6 0 0Share price YE (SEK) - - - - - - - - 99.8 167.6 141.4 95.3 119.3 125.5 102.5 126.3 193.0 - -Market cap (SEK), bn - - - - - - - - 16.1 27.0 22.7 15.3 19.2 20.2 16.5 25.4 38.8 38.8 38.8EV (SEK), bn - - - - - - - - 8.0 18.3 13.5 6.4 11.0 12.8 9.9 37.6 49.3 47.9 46.6Net debt/share - - - - - -20.2 -19.4 -15.9 -17.7 -15.7 -12.9 -8.5 -3.7 -3.7 -3.3 60.5 56.1 49.3 42.9EPS reported - - - - - -6.1 2.19 3.60 5.3 6.6 8.3 1.16 4.52 -1.88 0.62 42.2 7.4 10.1 11.4 growth (%) - - - - - n.m n.m 64 48 23 27 -86 288 n.m n.m >900 -82 37 12EPS adj - - - - - -5.7 2.05 3.37 4.97 6.1 7.8 1.09 4.23 -1.54 1.84 2.18 7.9 10.1 11.4 growth (%) - - - - - n.m n.m 64 48 23 27 -86 288 n.m n.m 19 265 28 12BVPS - - - - - 41.1 40.5 42.2 46.2 50.4 57.1 55.4 58.5 51.6 49.3 102 116 122 129DPS - Ordinary - - - - - - - - 4.22 5.2 5.6 4.68 5.6 5.6 5.9 - 6.5 7.5 8.5Total cash distr./share - - - - - 0 0 0 0 4.22 5.2 5.6 4.68 5.6 5.6 5.9 0 6.5 7.5 Valuation (x) 1997 1998 1999 2000 2001 2002 2003 2004 2005 2006 2007 2008 2009 2010 2011 2012 2013e 2014e 2015eP/E reported - - - - - - - - 17.6 24.0 16.0 76.7 24.7 n.m >99 2.8 26.1 19.1 17.0P/E adjusted - - - - - - - - 18.8 25.6 17.0 81.9 26.4 n.m 52.3 54.4 24.3 19.1 17.0P/CEPS - - - - - - - - 18.5 25.3 16.9 76.6 26.0 n.m 50.3 2.3 12.1 10.2 9.5EV/EBITDA - - - - - - - - 13.8 20.4 17.3 10.3 25.3 n.m 31.4 7.4 10.2 9.2 8.5EV/sales - - - - - - - - 13.1 27.7 12.6 5.4 4.6 4.8 4.0 0.38 0.50 0.48 0.46EBIT margin (%) - - - - - - - - 93.0 134 71.4 51.7 17.7 -14.5 12.1 11.7 3.0 3.4 3.6P/sales - - - - - - - - 26.3 40.9 21.2 12.9 8.0 7.6 6.6 0.26 0.39 0.39 0.38P/BV - - - - - - - - 2.0 3.1 2.3 1.6 1.9 2.3 1.9 1.2 1.7 1.6 1.5ROE reported (%) - - - - - - - - 11.3 12.7 14.5 1.9 7.4 -2.8 3.6 59.7 6.6 8.5 9.0FCF adj yield (%) - - - - - - - - 1.7 0.58 2.8 3.0 2.1 2.3 3.9 31.1 -17.9 5.5 5.6Tot Div yield (%) - - - - - - - - 4.5 3.3 4.2 5.2 5.0 4.8 6.1 0 3.4 3.9 4.4
CalendarQ3 report Nov 13, 2013 (08:00)Full-year repo Feb 12, 2014 (08:00)
ManagementCEO: Per StrömbergCFO: Sonat Burman-OlssonIR: Pernilla Grennfelt
Company profileICA Gruppen is the second largest listed retailer in the Nordic region with annual revenues of around SEK 100bn and around 2,400 retail stores. The group operates in Sweden, Norway and the Baltic countries. The main business areas are food, real estate, banking and non-food. The group was formerly called Hakon Invest and changed it name in 2013 to reflect the aquision of the remaining shares in ICA.

Svenska Handelsbanken AB (publ) Stockholm Blasieholmstorg 11 SE-106 70 Stockholm Tel. +46 8 701 10 00 Fax. +46 8 611 11 80
Copenhagen Havneholmen 29 DK-1561 Copenhagen V Tel. +45 33 41 8200 Fax. +45 33 41 85 52
Helsinki Aleksanterinkatu 11 FI-00100 Helsinki Tel. +358 10 444 11 Fax. +358 10 444 2578
Oslo Tjuvholmen allé 11 Postboks 1249 Vika NO-0110 Oslo Tel. + 47 22 39 70 00 Fax. + 47 22 39 71 60
London 3 Thomas More Square London GB-E1W 1WY Tel. +44 207 578 8668 Fax. +44 207 578 8090
New York Handelsbanken Markets Securities, Inc. 875 Third Avenue, 4th Floor New York, NY 10022-7218 Tel. +1 212 326 5153 Fax. +1 212 326 2730 FINRA, SIPC