in-depth survey report dust-control technology … · in-depth survey report dust-control...
TRANSCRIPT

In-Depth Survey Report
DUST-CONTROL TECHNOLOGY FOR ASPHALT-
PAVEMENT MILLING
LEO MICHAEL BLADE, CIH
STANLEY A. SHULMAN, PhD
ANDREW CECALA
GREGORY CHEKAN
JEANNE ZIMMER
ALBERTO GARCIA, MS
LI-MING LO, PhD
JARRETT CALAHAN
Division of Applied Research and Technology Engineering and Physical Hazards Branch
EPHB Report No. 282-17a Site of former Marquette County Airport
Marquette, Michigan
September, 2011
DEPARTMENT OF HEALTH AND HUMAN SERVICES
Centers for Disease Control and Prevention National Institute for Occupational Safety and Health

EPHB Report No. 282-17a
Page ii
Site Surveyed:
Site of former Marquette County Airport
Marquette, Michigan
NAICS Code:
1611 (Highway and Street Construction)
Survey Dates:
June and September, 2008
Survey Conducted By:
Leo Michael Blade, NIOSH/DART
Stanley A. Shulman, NIOSH/DART
Andrew Cecala, NIOSH/PRL
Gregory Chekan, NIOSH/PRL
Jeanne Zimmer, NIOSH/PRL
Alberto Garcia, NIOSH/DART
Li-Ming Lo, NIOSH/DART
Jarrett Calahan, NIOSH/DART
Employer Representatives
Contacted:
Tony Bodway (Chairman), Payne and Dolan
R. Gary Fore, National Asphalt Pavement Association (NAPA)
Donald Elisburg, NAPA Consultant
Employee Representatives Contacted:
None contacted

EPHB Report No. 282-17a
Page iii
Disclaimer
The findings and conclusions in this report are those of the authors and do not necessarily represent the views of NIOSH. Mention of any company or product does not constitute endorsement by NIOSH. In addition, citations to websites external to
NIOSH do not constitute NIOSH endorsement of the sponsoring organizations or their programs or products. Furthermore, NIOSH is not responsible for the content
of these websites. All Web addresses referenced in this document were accessible as of the publication date.

EPHB Report No. 282-17a
Page iv
Acknowledgements
The authors thank the members of the Silica/Milling-Machines Partnership, especially the National Asphalt Pavement Association, the participating manufacturers including the manufacturers of the milling machines tested during
this field study, Partnership Chair Tony Bodway and his company, Payne and Dolan, and the property owners of the study site, for their efforts on behalf of this study
and for their assistance in arranging and conducting this field study.

EPHB Report No. 282-17a
Page v
Table of Contents
DUST-CONTROL TECHNOLOGY FOR ASPHALT-PAVEMENT MILLING .............. i
Disclaimer ........................................................................................ iii
Acknowledgements ........................................................................... iv
Abstract ........................................................................................... vi
Introduction ...................................................................................... 8
Occupational Exposure to Crystalline Silica ............................................ 9
Summary of Preliminary Field Research .............................................. 10
Methods .......................................................................................... 14
Results and Discussion ..................................................................... 21
Conclusions and Recommendations .................................................... 44
References ...................................................................................... 44
Appendix ........................................................................................ 52

EPHB Report No. 282-17a
Page vi
Abstract
The process of milling asphalt- and concrete-paved surfaces undergoing maintenance or rehabilitation produces dust that usually contains crystalline
silica, a natural constituent of most asphalt- and concrete-pavement mixes. Inhalation of respirable crystalline silica is a well-documented workplace
hazard, with chronic overexposures causing silicosis and increasing the risk of lung cancer. Preliminary NIOSH field research from 2004 through 2006,
in which industrial hygiene surveys of asphalt pavement-milling operations on highway resurfacing jobs were conducted, suggested that milling
machines’ existing water-spray dust-suppression systems are not consistently effective enough to adequately control exposures among
workers conducting asphalt milling. Based on these findings, NIOSH
researchers and the Silica/Milling-Machines Partnership, coordinated by the National Asphalt Pavement Association (NAPA), determined a need for
improved dust emission-control systems for pavement-milling machines. In 2007, NIOSH mining engineers used their experience with related coal-
mining equipment to recommend preliminary design guidelines for improved emission-control systems, and the milling-machine manufacturers in the
Partnership then developed prototypes incorporating these preliminary guidelines. In 2008, the current field study was conducted at a former
commercial airport in Marquette, Michigan, to evaluate the dust emission-reduction performance of these prototype systems.
Four manufacturers brought machines equipped with their prototype dust
emission-control systems to this site for testing, two in June 2008 and two in September 2008. Runways of this former airport site provided a controlled
test environment since no other activities were occurring nearby at the time,
and milling tests could be conducted as needed for the study. The tests consisted of numerous, replicate short-term milling trials (nominally about
10 minutes each in duration). During a trial, a test milling machine removes approximately 2 inches of depth of the asphalt surface of the runway while
operating either its existing, production water-spray system (the “baseline configuration”) or one of its modified test emission-control configurations.
During the trials, respirable-dust concentrations were measured at ten selected locations around each mill using continuous “real-time” data-
logging dust monitors. The trials involving each test mill were divided into sets, with each set including one trial of the mill’s baseline configuration and
one each of its modified configurations. The results from six key monitoring locations (among the ten) together are considered to best represent relative
dust-emission rates, because they surround the relatively low-to-the-ground dust-generating areas of the machine where the modified emission controls
are located. Trial-mean concentrations from these “lower six” locations were

EPHB Report No. 282-17a
Page vii
averaged together to obtain a single lower-six-location average for that trial.
The average lower-six result for the baseline dust-control configuration in a set was compared with that for each of the modified test configurations in
that set, and dust-emission reductions computed for each test configuration versus the baseline in that set. Average reductions across all sets for that
machine were computed, along with their statistical confidence intervals.
Promising results were obtained for some modified dust emission-control systems. One test configuration, which included additional water-spray
nozzles oriented counter to the material flow in the primary conveyor area near the cutter-housing discharge, yielded an estimated, statistically
significant reduction of 43% to 55% (depending on data-set selection) in
respirable-dust concentrations at the lower-six locations compared to those for the baseline configuration on the same mill. Another, which used a fan
and ductwork to place the cutter housing and its discharge area under negative static pressure and evacuate dust-laden air to the top of the
secondary conveyor boom, yielded an estimated, statistically significant reduction in dust emissions of about 60%. In most cases, these test
configurations did not result in statistically significant reductions of a similar magnitude in dust concentrations at the remaining four monitoring locations,
which were evaluated as two location groups (two conveyor-top locations and two operator-bridge locations). However, those four locations are
farther from the dust-generating areas targeted by the test emission controls, and concentrations at those locations generally are appreciably
lower. These facts possibly make differences in dust levels less evident. They also raise the possibility that differences in dust concentrations at
these locations may not be as directly affected by changes in dust-emission
rates as those at the lower-six locations, and affected relatively more by changes in ambient dust levels and ambient conditions like wind.
NIOSH researchers and Partnership members concluded from these results
that further optimization of the dust emission-control systems followed by an additional set of field tests should be undertaken. This will allow for
confirmation of the effectiveness of the most successful design elements and the opportunity to further improve and evaluate dust emission-control
performance. Following successful completion of these additional controlled field tests, plans call for conducting industrial-hygiene field surveys to
measure workers’ full-shift personal breathing-zone exposures to respirable crystalline silica during the use of each manufacturer’s optimized dust
emission-control system.
EPHB Report No. 282-17a
Page 8
Introduction
The National Institute for Occupational Safety and Health (NIOSH) is conducting a research study of the effectiveness of dust-emission control measures during asphalt pavement-milling operations. The initial aim of this project is to determine
if the dust emission-control systems installed on new pavement-milling machines and operated according to the manufacturers’ recommendations are adequate to
control worker exposures to respirable dust, especially that containing crystalline silica, a long-recognized occupational respiratory hazard. Chronic over-exposures to such dust may result in silicosis, a chronic progressive lung disease that
eventually may be disabling or even fatal, and an increased risk of lung cancer. The long term goal of this project is to adequately control worker exposures to
respirable dust and crystalline silica by providing data to support the development of a set of best practice guidelines for the equipment if the engineering controls are
adequate, or to develop a set of recommendations to improve the performance of controls if they are not adequate.
Many construction tasks have been associated with overexposure to crystalline silica [Rappaport et al. 2003]. Among these tasks are tuck pointing, concrete
sawing, concrete grinding, and abrasive blasting [NIOSH 2000; Thorpe et al. 1999; Akbar-Kanzadeh and Brillhart 2002; Glindmeyer and Hammad 1988]. Road milling
has also been shown to result in overexposures to respirable crystalline silica [Linch 2002; Rappaport et al. 2003; Valiante et al. 2004]. However, all three of those road-milling studies are limited because they do not provide enough information
about the operating parameters and engineering controls present on the milling machines to determine if the overexposures were due to a lack of effective controls
or poor work practices. This study is helping to fill that knowledge gap.
A variety of machinery and work practices are employed in asphalt pavement recycling, including cold-planers, heater planers, cold-millers, and heater-
scarifiers [Public Works 1995]. Cold-milling uses a toothed, rotating drum to grind and remove the pavement to be recycled. The reclaimed asphalt pavement (RAP) is transported via the milling machine’s conveyors from the drum enclosure to trucks
that travel with the milling machine. Cold milling is primarily used to remove surface deterioration on both petroleum-asphalt aggregate and Portland-cement
concrete road surfaces [Public Works 1995]. The milling machines used in cold-milling are the focus of this investigation.
This field research evaluated and compared the performance of several milling machines’ existing and modified prototype systems for the control of emissions of
respirable dust. Numerous short-term milling trials were conducted at a closed, controlled test site, using each dust emission-control system, and respirable-dust
concentrations in the air surrounding the test mills were measured and compared.
This study is facilitated by the Silica/Milling-Machines Partnership, which is affiliated with and coordinated through the National Asphalt Pavement Association (NAPA).
The partnership includes NAPA itself, the Association of Equipment Manufacturers,

EPHB Report No. 282-17a
Page 9
the manufacturers of almost all pavement-milling machines sold in the U.S., numerous construction contractors, employee representatives, NIOSH, and other
interested parties.
NIOSH, a component of the U.S. Centers for Disease Control and Prevention (CDC), was established in 1970 by the federal Occupational Safety and Health Act, at the
same time that the Occupational Safety and Health Administration (OSHA) was established within the U.S. Department of Labor (DOL). The OSH Act legislation
mandated NIOSH to conduct research and education programs separate from the standard-setting and enforcement functions conducted by OSHA. An important field of NIOSH research involves methods for controlling occupational exposure to
potential chemical and physical hazards. The Engineering and Physical Hazards Branch (EPHB) of the NIOSH Division of Applied Research and Technology (DART)
has responsibility within NIOSH to study and develop engineering exposure-control measures and assess their impact on reducing the risk of occupational illness. Since 1976, EPHB (and its predecessor, the Engineering Control Technology
Branch) has conducted a large number of studies to evaluate engineering control technology based upon industry, process, or control technique. The objective of
each of these studies has been to evaluate and document control techniques and to determine their effectiveness in reducing potential health hazards in an industry or for a specific process.
Occupational Exposure to Crystalline Silica
Silicosis is an occupational respiratory disease caused by inhaling respirable crystalline-silica dust. Silicosis is irreversible, often progressive (even after
exposure has ceased), and potentially fatal. Because no effective treatment exists for silicosis, prevention through exposure control is essential. Exposure to respirable crystalline silica dust occurs in many occupations, including construction.
Crystalline silica refers to a group of minerals composed of chemical compounds containing the elements silicon and oxygen; a crystalline structure is one in which
the molecules are arranged in a repeating three-dimensional pattern [Bureau of Mines 1992]. The three major forms of crystalline silica are quartz, cristobalite, and tridymite; quartz is the most common form [Bureau of Mines 1992]. Respirable
refers to that portion of airborne crystalline silica that is capable of entering the gas-exchange regions of the lungs if inhaled; this includes particles with
aerodynamic diameters less than approximately 10 micrometers (μm) [NIOSH 2002].
When proper practices are not followed or controls are inadequate or not
maintained, respirable crystalline silica exposures can exceed the NIOSH Recommended Exposure Limit (REL), the OSHA Permissible Exposure Limit (PEL), or the American Conference of Governmental Industrial Hygienists (ACGIH®)
Threshold Limit Value (TLV®) [NIOSH 2002; 29 CFR 1910.1000 and 29 CFR 1926.55; ACGIH 2011]. The NIOSH REL is 0.05 milligrams (mg) of
respirable crystalline silica per cubic meter (m3) of air, or 0.05 mg/m3, for a full-workshift time-weighted average exposure, for up to a 10-hour workday during a

EPHB Report No. 282-17a
Page 10
40-hour workweek. This level is intended to minimize exposed workers’ risks of developing silicosis, lung cancer, and other adverse health effects.
The OSHA general-industry PEL for airborne respirable dust containing 1% or more
crystalline silica is expressed an equation. For quartz, the following equation applies [29 CFR 1910.1000]:
10 mg/m3
Respirable PEL =
% Silica + 2
If, for example, the dust contains no crystalline silica, the PEL for an 8-hour time-weighted average exposure is 5 mg/m3; if the dust is 100% crystalline silica, the PEL is 0.1 mg/m3. For cristobalite and tridymite, the PELs are each one half the
value obtained with the above equation [29 CFR 1910.1000]. When more than one of these three forms of crystalline silica are present, the additive mixture formula in
29 CFR 1900.1000 must be applied to the individually determined PELs.
In contrast to the general-industry PEL, the construction-industry PEL for airborne respirable dust which contains crystalline silica is based upon measurements made
with impinger sampling and particle counting, and is expressed in millions of particles per cubic foot (mppcf) of air in accordance with the following formula [29 CFR 1926.55]: 250 mppcf
Respirable PEL =
% Silica + 5
The “Mineral Dusts” table in 29 CFR 1926.55 specifies the above equation to determine the PEL for 8-hour time-weighted average exposures to quartz. No limits are specified in the table for other forms of crystalline silica such as
cristobalite or tridymite. Since the PELs were adopted, impinger sampling and particle-counting methodology has been rendered obsolete by respirable size-
selective sampling and gravimetric analysis such as that used to determine compliance with the general-industry PEL for silica, and the latter is the only
methodology currently available to OSHA compliance personnel [OSHA 2008]. To allow for comparison of gravimetric results reported in mg/m3 with the mppcf PEL in 29 CFR 1926.55, OSHA has further specified that a conversion factor of 0.1 mg/m3
per 1 mppcf should be applied to the results of gravimetric respirable-dust samples [OSHA 2008].
The ACGIH® TLV® for airborne respirable crystalline silica, including both quartz and
cristobalite, is 0.025 mg/m3 for an 8-hour time-weighted average exposure [ACGIH 2011].
Summary of Preliminary Field Research
NIOSH collaborated with the Silica/Milling-Machines Partnership to conduct
preliminary field research on respirable-dust and crystalline-silica exposures and

EPHB Report No. 282-17a
Page 11
exposure controls from 2003 through 2006. With the assistance of the Partnership in identifying pavement-milling job sites appropriate for study and in arranging for
the field work, NIOSH researchers completed a pilot field survey [Echt et al. 2004] and another four successful field surveys from 2004 to 2006 [Echt et al. 2007;
Blade et al. 2009a; Blade et al. 2009b; Blade et al. 2009c].
The pilot survey allowed the field-research team to assess the practicality of the
methodology planned for the study, and for adjustments to be made prior to the subsequent four surveys. However, the road-milling job evaluated during the pilot
study was not considered representative of typical jobs. It was a “full-depth removal” job, which is relatively uncommon, and therefore the subsequent field surveys evaluated so-called “mill-and-fill” jobs, which are perhaps the most
common. Therefore, the data developed from the pilot survey is not judged to be appropriate for inclusion among the overall study findings. Although the pilot-study
data are considered unrepresentative, the measurements themselves were accurate and valid. Therefore, these data have some limited usefulness, such as a side-by-side comparison of various types of air-contaminant monitoring methods discussed
below. A pavement-milling machine produced by Manufacturer A was used for the asphalt-milling job evaluated during the pilot study.
Each of the subsequent four successful field surveys examined one of the four (at the time) major domestically-marketed equipment manufacturers’ latest highway
milling machines. The primary purposes of these field surveys were two-fold: One was to characterize milling-crew workers’ exposures to respirable dust and
crystalline silica; the other was to evaluate whether changing the water-flow rates of the machines’ water-spray systems would appreciably affect the respirable-dust and crystalline-silica concentrations around the machine and in the workers’
breathing zones. To this end, the mills were operated for measured time periods with “normal” and “maximum” water-flow rates. Each of these four field surveys
evaluated a “mill-and-fill” asphalt-milling job being conducted on a public highway. The location, date, and machine manufacturer for each survey were as follows:
Wisconsin, July 2004, Manufacturer A [Echt et al. 2007] Minnesota, June 2006, Manufacturer B [Blade et al. 2009a]
South Dakota, August 2006, Manufacturer C [Blade et al. 2009b] New York state, September 2006, Manufacturer D [Blade et al. 2009c]
The key findings from the four successful field surveys were three-fold:
(1) Respirable crystalline-silica exposures sometimes exceed the NIOSH
REL (0.05 mg/m3 for a full-workshift TWA exposure), which is the primary exposure criterion against which results from this study are compared. The measured personal breathing-zone exposures are summarized in Table 1.
(2) Raising the water flow rate of the milling-machine water-spray systems from the “normal” rate to the maximum rate was not consistent in reducing
respirable dust concentrations by an appreciable and statistically significant amount. The data revealed appreciable reductions in some cases but not in

EPHB Report No. 282-17a
Page 12
others. The area air-sampling results shown in Table 2 demonstrate these findings, as do the personal exposure data in Table 1.
(3) Uncontrolled factors may obscure changes in respirable-dust levels that might be attributable to changes in engineering-control effectiveness,
especially if the magnitude of the changes in control effectiveness is not large (e.g., in a case where only modest changes in water-flow rates were possible with existing equipment). For example, substantial dust may be
generated by passing traffic, nearby agricultural operations, the motorized “broom” vehicle used to brush away accumulations of relatively fine milled
paving material left behind the milling machine. Other uncontrolled factors include environmental parameters such as wind speed and direction. These were measured and recorded during the field surveys, but it is not always
possible to account for their effects.
Table 1. Personal breathing-zone exposures to respirable crystalline silica during asphalt pavement-milling operations, measured during preliminary
NIOSH field surveys, 2004-2006. PBZ Air Sampling for Respirable Crystalline Silica: Summary of Results (concentrations in mg/m3)
Mfr. A, Wisconsin field survey
Mfr. B, Minnesota field survey
Mfr. C, South Dakota field survey
Mfr. D, New York state field survey
Exposures of operator to respirable crystalline silica, at max. water flow
(0.05), (0.06), (0.07)
ND, ND ND
All ND (N=6)
0.097, 0.31, 0.36
Exposures of operator to respirable crystalline silica, at normal water flow
(0.06), 0.12, 0.17
ND, ND, (0.02)
All ND (N=5)
(0.04), 0.064
Exposures of ground man to respirable crystalline silica, at max. water flow
ND, ND, (0.04)
(0.02), (0.06), (0.06)
All ND (N=6)
0.12, 0.13, 0.16
Exposures of ground man to respirable crystalline silica, at normal water flow
ND, (0.04), (0.05)
(0.004), (0.03), (0.06)
All ND (N=5)
(0.02), 0.098
# Exceedances of NIOSH REL (0.05 mg/m3)
for respirable crystalline silica / # samples, at maximum water flow rate and at normal water flow rate
3/6
4/6
2/6
1/6
0/12
0/10
6/6
2/4
ND = not detected. Results in parentheses are below precisely quantifiable levels.

EPHB Report No. 282-17a
Page 13
Table 2. Summary of air sampling results from preliminary 2004 through 2006 field surveys, showing comparisons between water-spray flow rates
and types of measurements. % Reduction
time-
integrated respirable-dust source-area concentration, maximum vs. normal water flow rate
% Reduction real-time
respirable-dust source-area concentration, maximum vs. normal water flow rate
% Reduction
respirable-quartz
source-area concentration, maximum vs. normal water flow rate
Arithmetic-mean
respirable-quartz area concentration
(mg /m3), at maximum water flow
Geometric-mean
respirable-quartz area concentration
(mg /m3), at maximum water flow
Maximum respirable-
quartz personal exposure
(mg /m3), at maximum water flow
Pilot Study
(Manufacturer A)
19 17 13 0.13 0.080 0.09
Manufacturer A 53 53 45 0.26 0.11 0.07
Manufacturer B 1 -38 3 0.13 0.056 0.06
Manufacturer C 41 53 ND ND ND ND
Manufacturer D -9 -49 -80 0.60 0.28 0.36
Note: Negative percent reductions indicate an increase during maximum water flow rate relative to normal flow. ND indicates that the concentrations were not detectable.
As shown in Table 1, exposures do sometimes exceed the primary study criterion, the NIOSH REL of 0.05 mg/m3, and simply using the maximum water-flow rates
available with existing systems does not consistently reduce exposures to below this level. One measured exposure during normal water-flow operation,
0.17 mg/m3, was more than three times the REL. Together, the data from the 2003 through 2006 field work provide the following
observations:
The data reveal a tendency for higher respirable-dust concentrations on the side of the milling machine adjacent to passing traffic on highway jobs than the other side – which should not be surprising, but is reassuring in that the
data are consistent with what might be expected.
The data reveal that real-time area respirable-dust measurements at the operator's platform tend to correlate very well with time-integrated filter-sample dust determinations from the operator's breathing zone. (The
groundman's breathing zone filter sample determinations are harder to correlate with area measurements because the groundman does not a have a
restricted position where he stands.)

EPHB Report No. 282-17a
Page 14
The data also reveal reasonably good agreement between the results from side-by-side measurements using the various methods employed for
measuring respirable dust and crystalline silica. These methods are explained in detail in the Methods section, below. Specifically, the data in
Table 2 suggest that all measurement types are reasonably close to one another where there was a clear reduction in the concentrations during maximum water-spray flow-rate.
Methods
Based upon the preliminary findings, the NIOSH researchers and other Partnership members jointly decided to pursue improvements in the dust emission-control
performance of milling machines. NIOSH mining engineers were consulted about possible improvements in design of the water-spray dust-suppression systems and other engineering dust emission-control measures, based upon their experience
with similar coal-mining machinery. The manufacturers provided NIOSH with detailed information about existing water-spray system designs, and from this
information, the NIOSH engineers developed a set of design concepts which they presented to the Partnership in November 2007. These included general recommendations for water spray-bar location, nozzle location and type, water flow
rates, and other modifications. Most aspects of the design concepts were believed feasible by the Partnership members, especially the milling-machine manufacturers.
The participating milling-machine manufacturers (numbering five at the time of this testing in 2008, including the four manufacturers included in the previous
evaluation) agreed to develop prototypes for testing that would utilize the NIOSH design concepts. The manufacturers worked in consultation with the NIOSH engineers and engineers from water-spray nozzle manufacturers to optimize their
water-spray designs and produce the prototypes for testing. During the spring of 2008, the manufacturers presented their initial designs to the Partnership, and
specified the planned configurations to be tested.
Given the findings from the previous field testing during actual road-milling jobs, particularly the uncontrolled factors noted above, the NIOSH researchers and other Partnership members jointly decided to identify a controlled-test site at which the
performance of the improved dust-emission controls could better be evaluated. Such a site would be located away from live highway traffic and other possible dust-
generating activities, and would have expanses of asphalt which could be milled at the pace required for the testing rather than a pace dictated by “live” road job requirements. This was intended to minimize the uncontrolled factors. Through
the facilitation of the Partnership, a former airport was identified as a controlled-test site.
Performance testing of the prototype dust-emission control of systems was
conducted at that site in June 2008 for two manufacturers’ milling machines, and in September 2008 for two additional manufacturers’ machines. Each manufacturer
modified a large, new or late-model milling machine to allow testing on one machine of multiple dust-suppression and emission-control systems – a “baseline”

EPHB Report No. 282-17a
Page 15
or existing production configuration and either two or three modified, prototype “test” configurations. Ten continuous-monitoring, data-logging optical particle
counters (pDR instruments) were mounted at fixed locations on each machine. Six key locations in particular were chosen to best represent the areas where dust is
emitted by the sources that are controlled by the dust emission-control measures focusing on the cutter housing and the primary-to-secondary material-conveyor transition point. The six key monitoring locations included four locations around the
cutter housing and two locations on either side of the transition point. The other four monitoring locations include both sides of the operator’s bridge and both sides
of the top of the conveyor. Data from these four locations supplement the data from these six key locations. Multiple sets or blocks of trials, with each set testing the baseline and each modified configuration in randomized order, were conducted
and the average concentration at each location during each trial was determined. A typical trial was about 11 minutes in duration, although this parameter varied. The
mean of these six key location average concentrations (referred to as the “lower-six source location” mean concentration) for each modified configuration tested within a set was compared with the similar mean for the baseline configuration tested
within that set. Ratios of modified-to-baseline values were calculated, and also expressed as percent reduction for each modified configuration versus the baseline.
The reduction in mean “lower-six source location” concentration is used as a surrogate for reduction in respirable dust-emission rate from the primary source
areas.
Descriptive-data collection
Descriptive data about the facility and the pavement were collected and recorded.
These data included pavement age and type and the runways’ directional orientation and dimensions.
Descriptive data about the milling machines were collected during the field testing
and in consultation with the manufacturers’ representatives. In particular, the cutter-drum width was noted, and information about the machines’ water-spray
systems and other dust emission-control systems were collected.
During the actual milling and data collection, the forward speed of the mill was recorded by NIOSH researchers observing and periodically recording the speed reading (ft/min) on the instrument panel of the mill. Depth of cut was obtained
through regular observations of the machines’ automated milling control-system displays and measurements using a tape measure held at the edge of the cut
pavement, and was recorded for each trial or pass along the runway, as appropriate. The width of the cut is not always exactly the same as the width of the cutter drum, since cuts may overlap. Therefore, the width of the cut was
recorded for each milling trial or pass along the runway, as appropriate. The researchers also noted the exact time when each milling trial began and ended,
when each dump truck was loaded and pulled away from the milling machine, and the time and nature of any stoppages, interruptions, or problems during the trial. The operator’s location (left or right side of the bridge) during each trial was also

EPHB Report No. 282-17a
Page 16
noted, as was any other observations that might be relevant to the data collection and analysis. Testing was also recorded with video cameras to have a means of
observing the machine and test activities at a later time.
Ambient air temperature and wind measurements
Ambient air temperature and wind speed and direction were continuously monitored and recorded using weather-station instruments (Model 26800, R.M. Young Co.,
Traverse City, MI) operating in the real-time monitoring mode, with data logging for subsequent download of electronic computerized data files. Each device’s sensors were mounted atop a pole attached to the operator-bridge railing of one of the test
milling machines. One weather station was mounted on each test machine except for the Manufacturer E machine. These conditions were not monitored on that
machine due to technical problems with one of the weather stations.
Water-spray system water-flow and pressure measurements
Water flow rates were measured using digital water-flow meters (GPI Electronic Digital Meter, Model S10N, Great Plains Industries, Wichita, KS) with a range of 5 to 50 gallons per minute (gpm) installed in the main water-supply lines on the mills.
Water pressure was measured using a standard analog pressure gauge attached to “tee” fittings also installed in the main water lines. NIOSH personnel supplied the
manufacturers with water flow meters and pressure gauges as needed. The readings on these devices were observed and recorded periodically during milling.
Respirable-dust and crystalline-silica air-sampling measurements
During all milling trials, area air samples for respirable dust and crystalline silica were collected at ten locations on the milling machine, using an array of
instruments mounted on a metal frame at each location. The locations were on the railings on both sides of the operator’s platform, near the front and the rear of the
cutter-drum housing on both sides of the mill, on both sides near the transition from the primary conveyor to the secondary conveyor, and on both sides at the top of the secondary-conveyor boom near the discharge of the secondary conveyor into
the trucks. These locations are shown in Figure 1. The sampling instruments in each array included a light-scattering aerosol photometer (pDR, Model 1000, MIE,
Inc., Bedford, MA) operated in the passive-sampling, real-time monitoring mode, with data logging for subsequent download of electronic computerized data files. Also included in each sampling array were two air-sampling assemblies for the
collection of time-integrated respirable-dust samples. Each sampler assembly consisted of a battery-operated sampling pump (Escort Elf Pump, Mine Safety
Appliances Company, Pittsburgh, PA) connected through flexible tubing to a sampling head consisting of a standard 10-mm, nylon, respirable size-selective cyclone followed by a pre-weighed, 37-mm diameter, 5-micron (µm) pore-size
polyvinyl chloride filter supported by a backup pad in a two-piece filter cassette sealed with a cellulose shrink band, in accordance with NIOSH Methods 0600 and
7500 [NIOSH 1994]. Each sampling pump drew air at a nominal air-flow rate of

EPHB Report No. 282-17a
Page 17
1.7 liters per minute (L/min) through the cyclone and filter assembly. Actual air-flow rates were measured before and after each day of testing, and re-calibrated to
the nominal rate as needed. When this apparatus was used for area sampling on a milling machine as during this survey, both the pump and cyclone/filter assembly
are attached to the metal frame. Filters were submitted for subsequent laboratory analysis as described below. The primary purpose of these two area samples was to measure the time-integrated respirable-dust concentration and the quartz
content of the respirable dust for each sampling location for each entire day. The mean of the resulting two respirable-dust concentrations was used to establish the
corrected mean for all respirable-dust concentration measurements on that day from the pDR instrument at that location. This allowed a correction factor to be determined that was then applied to each respirable-dust concentration
measurement from that instrument on that day. The secondary purpose of these samples is to determine the crystalline-silica content of the airborne respirable dust
at each location for each full day.
Gravimetric analysis of each filter for respirable particulate was carried out in accordance with NIOSH Method 0600. After this analysis was completed, crystalline
silica analysis of each filter was performed using X-ray diffraction in accordance with NIOSH Method 7500. The samples were analyzed for quartz, cristobalite, and tridymite.
Bulk-material sampling and analysis for crystalline-silica
Bulk-material samples of asphalt-pavement material milled during this study were
collected in screw-cap glass vials for crystalline-silica analysis. Analysis of each sample was performed using X-ray diffraction in accordance with NIOSH Method
7500. The samples were analyzed for quartz, cristobalite, and tridymite.
Experimental design and methodology
The participating manufacturers and other Partnership members agreed that this
study should involve testing of new or late-model highway-class milling machines with the latest production water-spray configurations. Each machine would be
modified with additional dust emission-control elements to allow replicate sequential testing of the production dust emission-control configuration (baseline) and multiple modified, prototype dust-control configurations using the same
machine. During the testing, milling parameters such as depth and forward speed were chosen to mimic “mill-and-fill” highway resurfacing jobs, since these are the
most commonly encountered milling jobs.
This field study consisted of a series of short-term trials, with a typical duration of about 11 minutes (but ranging between 7 and 25 minutes), to test the respirable-
dust emission-control performance of pavement-milling machines equipped with prototype emission-control systems. During each trial, one of the emission-control systems was operated while the machine milled a section of asphalt pavement, and
respirable-dust concentrations were measured at ten locations (described above in
EPHB Report No. 282-17a
Page 18
the measurement methods description) around the machine being tested. Four milling machines were evaluated during the study, two during an initial group of
tests conducted during June 2008 and two more during a second group conducted in September of that year. The two mills tested in June were from Manufacturers A
and B, while those tested in September were from Manufacturers D and E. (Manufacturer C was unable to participate in the 2008 field testing, while Manufacturer E, a relatively new Partnership member, was included along with the
remaining three participants from the 2004 through 2006 field surveys.) The mill from Manufacturer A was tested with the mill’s existing, baseline configuration and
two modified test configurations. The mills from Manufacturers B, D, and E each were tested with the mill’s baseline configuration plus three modified configurations. Trials conducted with a given machine were grouped into sets, each
of which included one trial to test each configuration, conducted in randomized order within the set. Ideally, all trials within a set would be conducted under
identical conditions, but this is not possible during outdoor testing in which a given mill can only be used to conduct one trial at a time. To best address this issue, all trials within a set were conducted as closely together in time and space as possible
to help keep ambient conditions as similar as possible during all trials within the set, and, as noted, the configurations were tested in randomized order within each
set.
Description of tested dust-emission control configurations
Each of the four pavement milling-machine manufacturers that participated in this testing worked independently in developing their designs. All production milling machines are equipped with water-spray systems to cool the cutting teeth and
suppress dust, and most of the modified test configurations involved additional spray nozzles and/or variations in water pressures and flows. One manufacturer’s
test prototype included a local exhaust-ventilation system to produce negative static pressure in the cutter housing and the discharge area from the housing to the primary conveyor. The following summarizes each manufacturer’s modified test
configurations and how they differed from their standard-production, or baseline, configurations.
Manufacturer A
Baseline Configuration A1: Water sprays in cutter housing, at discharge to primary conveyor, and at conveyor transfer.
Configuration A2: Modified spray nozzles in cutter housing, vs. A1.
Configuration A3: High water pressure and flow operation of Configuration
A2.
Manufacturer B Baseline Configuration B1: Water sprays at front and rear of cutter housing,
and at discharge to primary conveyor. Configuration B2: Improved sprays (vs. B1) at housing discharge (and
counter to material flow), plus eliminate upper front-housing sprays, add
sprays to primary conveyor transition.
EPHB Report No. 282-17a
Page 19
Configuration B3: Adds (to B2) water sprays at housing shell, fewer at rear of housing.
Configuration B4: Adds (to B2) water sprays at housing side plates, fewer at
rear of housing.
Manufacturer D Baseline Configuration D1: Water sprays at cutter housing only, water
pressure of 60 psig.
Configuration D2: Adds (to D1) sprays at discharge to primary conveyor, and increases water pressure (to 120 psig) and total water flow.
Configuration D3: Vacuum or negative pressure local exhaust ventilation (LEV) system in the cutter housing area used with D1 (baseline)
water-spray configuration. Configuration D4: Vacuum LEV system in the cutter housing area used with
D2 (modified) water-spray configuration.
Manufacturer E
Baseline Configuration E1: Standard water sprays (e.g., in cutter housing) only.
Configurations E2, E3, and E4: Add additional water sprays at the primary-to-secondary conveyor transfer location, and use various water pressures and flow rates.
The total water-flow rates to all spray nozzles ranged between 20 and 30 gallons
per minute (gpm), depending on configuration. Detailed design information is incorporated into the discussion of the study results, below.
Test procedures
The test milling surface for this field study consisted of asphalt-paved runways at
an abandoned airport. The lengths of the trials were not always the same, for a variety of reasons. During the initial group of tests in June, all the work was on a single section of runway, specifically the remains of the former main (nominally
east-west) runway. About one-half of the length of this runway had been removed prior to this study. A length of about 2340 feet remained, the runway was 150 feet
wide, and the asphalt thickness ranged from approximately 5 to 5½ inches. With a
milling depth averaging just under 2 inches per pass, the asphalt pavement was
thick enough for three passes. During the first day of the June 2008 test, each trial consisted of milling about 2300 feet, almost an entire pass across the length of the
pavement. The target forward milling speed was 100 feet per minute (ft/min), so these passes lasted about 20 to 25 minutes. At the end of this day, researchers reconsidered the length of the trials and decided to divide each pass along the
2300-foot length into two trials. First, it was clear that such long trials were not needed to reach stable levels of respirable dust. Additionally, excessive proportions
of the available asphalt were being consumed with the longer trials, limiting the total number of trials that could be completed at this site. Finally, excessive

EPHB Report No. 282-17a
Page 20
amounts of field time were being consumed with the longer trials. The shorter trials generally lasted between 10 and 13 minutes. To keep the test conditions as
similar as possible within each set, trials were conducted as close together in time and location as possible, and always while milling in the same direction along the
runway. Therefore, at the completion of each pass, the mill had to tram back to the original starting end of the runway. While one mill trammed back, the other was milling a pass, thus passes of milling trials were alternated between the two
mills being tested. This alternating arrangement helped make the best use of the time in the field. During the June tests, the milling direction was always nominally
west to east.
For the second group of tests in September 2008, the test milling surfaces included most of the remaining asphalt pavement from the former main runway, and the
asphalt pavement from an approximately 1400-foot-long segment of a former auxiliary (nominally north-south) runway which intersected the main runway. The auxiliary runway was 75 feet wide and its asphalt depth was between 4 and
5 inches. The main runway’s asphalt was not completely removed; a 22-foot-wide strip was retained for use as a roadway, and was not milled. On the first day of
testing, a portion of the remaining main-runway asphalt was milled, and each pass again was divided in half for two trials. On the second day, to further conserve the remaining asphalt, each pass of the main runway was divided into three trials of
about 750 feet in length, with passes lasting about 8 minutes each. On the auxiliary runway, each pass was divided into two trials of about 700 feet in length
and about 7 minutes in duration. When the September testing began, milling trials on the main runway again were conducted (nominally) west-to-east. However, in order to accommodate the needs of the site owner, it became more practical to
reverse the direction of milling during the later sets of trials on the main runway. All trials within the same set always were conducted in the same direction, and as
close together in time and location as possible. All trials conducted on the auxiliary runway were run nominally north-to-south. To the extent possible, milling trials again were conducted by alternating passes along the runways between the two
machines being tested, but due to machine availability and logistics, this was not always possible.
Water application rates from the water-spray systems varied during the testing due
to the varied rates of asphalt removal and the different water-flow rates used for the different test configurations. During the trials with the lowest total water-flow
rates to all spray nozzles, water-to-asphalt application rates normally ranged from about 0.8% to 1.2% by weight, and for the highest total water-flow rates, they normally ranged from about 1.2% to 1.7% by weight. However, some trials were
conducted during the milling of thin, lower layers of asphalt, and water-to-asphalt rates for these trials were as high as 2.1% and 3.2% by weight for the lowest and
highest total water-flow rates, respectively. Water-to-asphalt ratios for specific test configurations are provided below in the discussion of results.

EPHB Report No. 282-17a
Page 21
Results and Discussion
Overview of respirable-dust measurements from test milling trials
The test data consisted of measurements of airborne respirable-dust concentrations recorded every 10 seconds by each of ten monitors positioned at locations affixed to the machine. The individual 10-second-interval measurements from a given
location during a given trial are averaged together to provide the trial-mean concentration for that location, and the trial means from all ten locations represent
the results for that trial. These trial means usually are placed into groups as described below. The design allowed for an estimate of error even when trial means were used since there were replicate trials of each test configuration. It was
not clear that the use of each 10-second-interval measurement, instead of the trial mean for each location, would necessarily add to the statistical power. Many of the
trials display considerable intra-trial variability in respirable-dust measurements, and some display intra-trial trends in measurements. Some of the variability can be explained based on researcher observations. A comparison of a mixed linear
model based on use of the individual 10-second-interval measurements versus the use of the trial means did not indicate narrower confidence intervals by using the
individual measurements.
When the results are evaluated and summarized, those from each of the ten respirable-dust sampling locations generally are placed into one of three different groupings of locations. These groupings are: (1) the “lower six source
locations” that include the cutter-drum rear sampling locations (right and left), the cutter-drum front locations (right and left), and the lower conveyor locations (right
and left); (2) the “conveyor top locations,” on either side of the secondary conveyor boom, near the point where milled asphalt material is discharged into dump trucks
moving ahead of the machine; and, (3) the “operator-bridge locations,” two locations on the right and left sides of the operator bridge. Each grouping brings together locations with similar primary purposes and uses of their results.
Arithmetic means separately are determined and presented for each of the three groupings for each trial. Each mean is calculated from the trial means for all
locations in the grouping for that trial.
Test data for Manufacturer A mill: Respirable-dust measurements – results and discussion
The calculated means for the three different groupings for the Manufacturer A milling machine are shown in the Table 3. These results together are summarized
in Table 4. Table 5 provides additional data comparisons among location groups. Table A-1 in the Appendix provides wind-measurement data and a qualitative
examination of the effects of wind for all these trials.
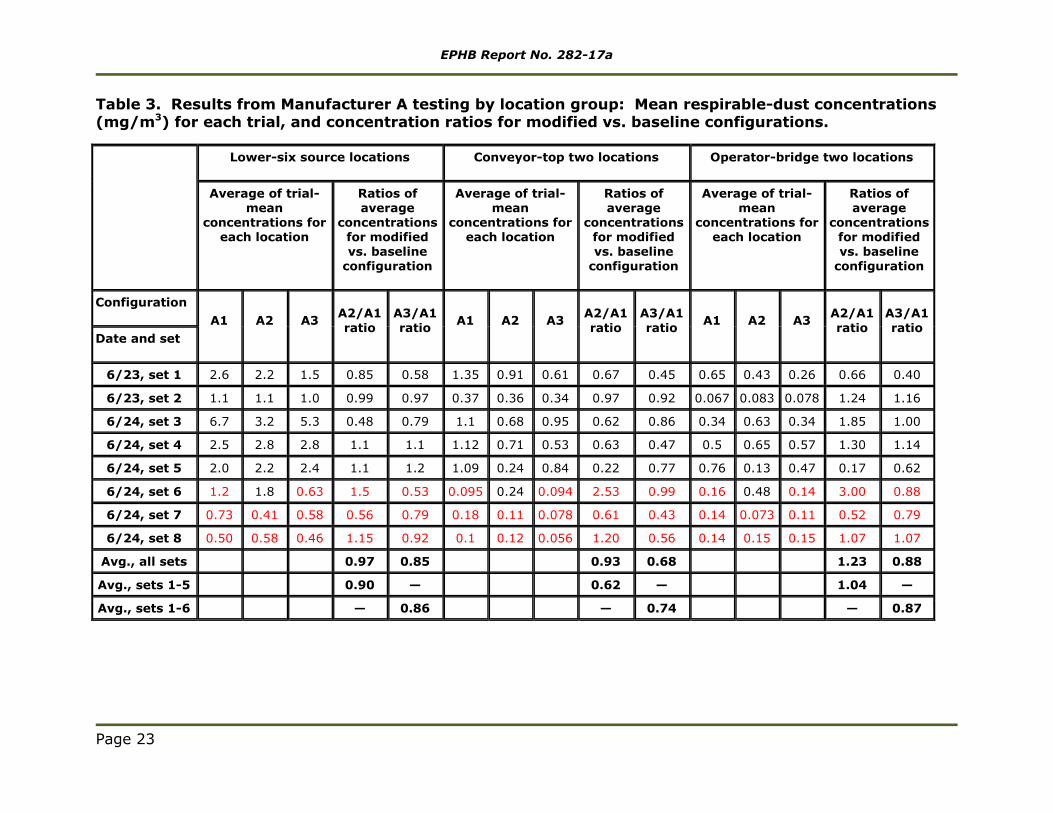
The data in Table 3 show that, for the trials testing the Manufacturer A standard-production or baseline configuration (A1), the trial arithmetic mean concentrations
for the lower-six source locations vary between 0.50 and 6.7 mg/m3. The ratios of

EPHB Report No. 282-17a
Page 22
the trial-mean concentrations for the two modified test configurations, A2 and A3, to those for the baseline configuration ranged from 0.48 to 1.5 and from 0.53 to
1.2, respectively. As shown in Table 4, for the lower-six source locations the average ratios for the two test configurations (A2 and A3) compared to baseline
(A1) ranged between 0.85 and 0.97. These ratio calculations indicate the extent to which dust levels changed between the two configurations, and may be expressed more conveniently as the percentage reduction of the modified configuration versus
the baseline. (1 – ratio = percent reduction.) For Configurations A2 and A3, the two ratios cited are equivalent to average dust-concentration reductions of 15% to
3%. Since the mean respirable-dust concentration at the lower-six source locations is considered an appropriate surrogate for respirable-dust emission rates from the primary source areas, the reductions from this location grouping suggest the
relative effectiveness of that particular configuration. The data reveal some differences in dust-concentration reductions between the days. The data for the
first day indicate reductions of about 10% for A2 and about 20% for A3. For the second day, the average reductions are approximately 0% for A2 and about 10% for A3. These estimated reductions are relatively small.
The average ratios of the trial-mean respirable-dust concentrations for the three location groups are shown together in Table 3. Two different average reductions are shown; the first average is for all sets of trials, while the second is for either
five or six selected sets of trials, depending upon which comparison is involved, out of the eight sets conducted. The rationale for this selection is as follows. Some
values in Table 3 are highlighted in red to indicate trials where the milling machine removed a relatively thin, lower layer of asphalt, atop a stone-and-gravel base mixed with soil. This thin layer is what remained of the approximately 5-inch thick
main runway after two milling passes across its surface of 2 inches in depth apiece. Since the lowest layer was not as thick as the upper layers and some of the
material milled on this lower layer may have been loose gravel and dirt, and milling this layer may have created less dust than milling thicker layers consisting entirely of asphalt pavement. Therefore, the trial means while milling the lower layer is
suspected of being different than the trial means when milling other layers. In addition, the baseline configurations during two of these sets, Sets 7 and 8,
produced relatively low trial-mean dust concentrations (less than 1 mg/m3), and it is suspected that when the baseline produces a low concentration, changes from the baseline may be less evident due to the effect of ambient dust levels and of
uncharacterized “noise” in the data. This issue is complicated somewhat by the change in wind speed during the course of the second sampling day June 24, 2008
(see Table A-1 in the Appendix). The wind speeds at the end of the second day of sampling are the highest wind speeds of this evaluation. There is no way to know whether the relatively high wind speeds, which may better dilute and remove
airborne dust, the bottom-layer milling, or some combination of both are responsible for the lower concentrations at the end of the second day of testing.
This is the reason for computing the selected-trial averages, which include Sets 1 through 5 for the A2/A1 comparison and Sets 1 through 6 for A3/A1.
EPHB Report No. 282-17a
Page 23
Table 3. Results from Manufacturer A testing by location group: Mean respirable-dust concentrations (mg/m3) for each trial, and concentration ratios for modified vs. baseline configurations.
Lower-six source locations Conveyor-top two locations Operator-bridge two locations
Average of trial-mean
concentrations for each location
Ratios of average
concentrations for modified vs. baseline
configuration
Average of trial-mean
concentrations for each location
Ratios of average
concentrations for modified vs. baseline
configuration
Average of trial-mean
concentrations for each location
Ratios of average
concentrations for modified vs. baseline
configuration
Configuration
A1 A2 A3 A2/A1
ratio
A3/A1
ratio A1 A2 A3
A2/A1
ratio
A3/A1
ratio A1 A2 A3
A2/A1
ratio
A3/A1
ratio Date and set
6/23, set 1 2.6 2.2 1.5 0.85 0.58 1.35 0.91 0.61 0.67 0.45 0.65 0.43 0.26 0.66 0.40
6/23, set 2 1.1 1.1 1.0 0.99 0.97 0.37 0.36 0.34 0.97 0.92 0.067 0.083 0.078 1.24 1.16
6/24, set 3 6.7 3.2 5.3 0.48 0.79 1.1 0.68 0.95 0.62 0.86 0.34 0.63 0.34 1.85 1.00
6/24, set 4 2.5 2.8 2.8 1.1 1.1 1.12 0.71 0.53 0.63 0.47 0.5 0.65 0.57 1.30 1.14
6/24, set 5 2.0 2.2 2.4 1.1 1.2 1.09 0.24 0.84 0.22 0.77 0.76 0.13 0.47 0.17 0.62
6/24, set 6 1.2 1.8 0.63 1.5 0.53 0.095 0.24 0.094 2.53 0.99 0.16 0.48 0.14 3.00 0.88
6/24, set 7 0.73 0.41 0.58 0.56 0.79 0.18 0.11 0.078 0.61 0.43 0.14 0.073 0.11 0.52 0.79
6/24, set 8 0.50 0.58 0.46 1.15 0.92 0.1 0.12 0.056 1.20 0.56 0.14 0.15 0.15 1.07 1.07
Avg., all sets 0.97 0.85 0.93 0.68 1.23 0.88
Avg., sets 1-5 0.90 — 0.62 — 1.04 —
Avg., sets 1-6 — 0.86 — 0.74 — 0.87

EPHB Report No. 282-17a
Page 24
Table 4. Summary of Manufacturer A results: Arithmetic means and confidence limits* of selected blocks’ (sets’) respirable-dust concentration
reductions ( = 1 – ratio, then expressed as a %) for modified vs. baseline configurations.
A2/A1 A3/A1
“Lower-six”
source-area
locations
All values (N = 8) Mean reduction = 3%
(Lower 95% CL < 0%)
Mean reduction = 15%
(Lower 95% CL < 0%)
Exclude Sets 7 and 8
(and for A2/A1, also exclude Set 6)
Mean reduction = 10%
(Lower 95% CL < 0%)
(N=5)
Mean reduction = 14%
(Lower 95% CL < 0%)
(N=6)
Conveyor-top locations (two)
All values (N = 8) Mean reduction = 7%
(Lower 95% CL < 0%)
Mean reduction = 32%
(Lower 95% CL =10%)
Exclude Sets 7 and 8 (and for A2/A1, also
exclude Set 6)
Mean reduction = 38%
(Lower 95% CL < 0%)
(N=5)
Mean reduction = 26% (Lower 95% CL = 3%)
(N=6)
Operator-bridge
locations (two)
All values (N = 8) Mean ratio = 1.23,
or a 23% increase
(Lower 95% CL < 0%)
Mean reduction = 12%
(Lower 95% CL < 0%)
Exclude Sets 7 and 8 (and for A2/A1, also
exclude Set 6)
Mean ratio = 1.04,
or a 4% increase
(Lower 95% CL < 0%)
(N=5)
Mean reduction = 13% (Lower 95% CL < 0%)
(N=6)
* Under an alternative combined model there were no statistically significant differences between the three locations with regard to the effectiveness of A2 and A3 compared to A1, but that model gives
too much weight to the observed reduction at the conveyor top, which is of less importance than reduction at the two other locations. Therefore, the model used for the above confidence limits includes estimated differences in the effectiveness of A2 and A3 by location, and the only statistically significant reductions it indicates are for the conveyor-top locations.

EPHB Report No. 282-17a
Page 25
Table 5. Ratios for each trial of mean respirable-dust concentrations for operator-bridge locations compared to those for conveyor-top and lower-
six source locations, by manufacturer/configuration.
Date, set no. Operator-bridge to conveyor-top Operator-bridge to lower-six
A1 A2 A3 A1 A2 A3
6/23, set 1 0.48 0.47 0.43 0.25 0.20 0.17
6/23, set 2 0.18 0.23 0.23 0.06 0.08 0.08
6/24, set 3 0.31 0.93 0.36 0.05 0.20 0.06
6/24, set 4 0.45 0.92 1.08 0.20 0.23 0.20
6/24, set 5 0.70 0.54 0.56 0.38 0.06 0.20
6/24, set 6 1.68 2.00 1.49 0.13 0.27 0.22
6/24, set 7 0.78 0.66 1.41 0.19 0.18 0.19
6/24, set 8 1.40 1.25 2.68 0.28 0.26 0.33
B1 B2 B3 B4 B1 B2 B3 B4
6/23, set 1 1.07 0.98 0.80 1.02 0.39 0.64 0.32 0.45
6/23, set 2 1.17 1.03 2.25 1.10 0.40 0.65 0.48 0.59
6/24, set 3 3.70 7.55 0.13 0.29 0.27 0.47 0.65 0.05
6/24,set 4 7.17 2.29 6.73 3.63 0.47 0.41 0.41 0.43
6/24, set 5 4.90 1.00 0.80 3.59 0.38 0.28 0.12 0.29
6/24, set 6 0.97 1.34 0.84 1.45 0.31 0.43 0.39 0.37
6/24, set 7 1.30 1.18 1.30 0.86 0.32 0.35 0.24 0.27
D1 D2 D3 D4 D1 D2 D3 D4
9/16, set 1 6.19 3.13 5.00 3.26 0.16 0.12 0.21 0.14
9/16, set 2 3.10 3.97 5.71 2.28 0.08 0.10 0.18 0.14
9/16, set 3 2.43 1.98 3.71 2.36 0.10 0.06 0.20 0.18
9/17, set 4 0.39 0.30 2.69 0.19 0.16 0.86
9/17, set 5 0.35 2.26 0.93 0.11 0.61 0.60
9/17, set 6 0.79 3.61 0.88 0.16 0.30 0.54
9/17, set 7 2.88 1.11 3.00 0.12 0.07 0.20
9/17, set 8 0.77 0.88 4.63 4.25 0.15 0.07 0.45 0.54
9/17, set 9 1.07 2.39 6.50 1.85 0.08 0.14 0.25 0.15
E1 E2 E3 E4 E1 E2 E3 E4
9/16, set 1 8.00 2.81 9.43 7.76 0.19 0.06 0.21 0.21
9/16, set 2 6.00 66.00 18.05 12.27 0.40 0.44 0.49 0.53
9/17, set 3* 3.84 0.83 0.60 0.36 0.44 0.74
9/17, set 4 1.45 1.16 0.65 0.75 0.68 0.48
9/17, set 5 3.50 8.02 6.90 0.91 0.35 1.14
9/17, set 6 1.21 2.58 2.07 0.32 0.52 0.38
9/18, set 7 2.36 3.21 2.27 0.78 0.83 0.72 0.42 0.29
9/18. set 8 3.01 9.71 3.62 2.53 0.37 0.28 0.36 0.35
9/18, set 9 4.50 5.48 8.04 5.17 0.40 0.27 0.28 0.35
9/18, set 10 3.47 5.19 5.45 3.72 0.33 0.29 0.34 0.25

EPHB Report No. 282-17a
Page 26
Table 4 shows the mean percentage reductions for the full and selected data sets along with the associated lower 95%-confidence limits. In the case of the
Manufacturer A results, the full and selected data sets do not yield differing overall conclusions about emission-control effectiveness. A key observation about the data
from the Manufacturer A test configurations is that there is little average dust-concentration reduction for any of the modified designs. None of the lower-six location comparisons or the operator-bridge locations showed a reduction of more
than 15% for either of the configurations, and none were statistically significant. Only for the conveyor-top locations comparisons for configuration A3 are
statistically significant at the 95% confidence level, with a reduction of approximately 30%.
Test data for Manufacturer B mill: Respirable-dust measurements – results and discussion
The calculated means for the three different groupings for the Manufacturer B
milling machine are shown in the Table 6. These results together are summarized in Table 7. Table 5 provides additional data comparisons among location groups. Table A-1 in the Appendix provides wind-measurement data and a qualitative
examination of the effects of wind for all these trials.
The data in Table 6 show that, for the trials testing the Manufacturer B baseline configuration (B1), the trial arithmetic mean concentrations for the lower-six source locations vary between 0.19 and 5.1 mg/m3. As shown in Table 7, average ratios
relative to B1 for three modified test configurations, B2, B3, and B4 are 0.57, 1.09, and 0.98, respectively. These ratios expressed as percentage reductions would be
a reduction of 43%, an increase of 9%, and a reduction of 2%, for B2, B3, and B4, respectively. (Any resulting “negative percent reductions” indicate increases in average concentrations.) There is some difference between the days; the data for
the first day indicates reductions (or increases) of about 38% reduction for B2, and about 12% increase for B3, and about 19% reduction for B4. For the second day,
the average reductions (or increases) are approximately a 46% reduction for B2, a 9% increase for B3, and a 4% increase for B4.
Table 7 shows the average ratios of the trial-mean concentrations for the lower-six, conveyor-top, and operator-bridge locations. Two different average reductions are
shown; the first shows the comparison for each grouping is for all sets of trials, while the second is for selected sets of trials (the first four or five) out of the seven sets conducted.
The rationale for this selection was similar to the explanation for Manufacturer A.
Some values in Table 6 highlighted in red to indicate trial means and ratios for trials conducted during milling of the thin lower layer of asphalt. The trial means while milling the lower layer is suspected of being different than the trial means when
milling other layers. In addition, the baseline-configurations during two of these sets, Sets 6 and 7, produced relatively low trial-mean dust concentrations, and it is
suspected that when the baseline produces a low concentration, changes from the baseline may be less evident due to the effect of ambient dust levels and of

EPHB Report No. 282-17a
Page 27
uncharacterized “noise” in the data. This issue is complicated somewhat by the change in wind speed during the course of the second sampling day, June 24, 2008
(see Table A-1 in the Appendix). The wind speeds at the end of the second day of sampling are the highest wind speeds of this evaluation. There is no way to know
whether the relatively high wind speeds, which may better dilute and remove airborne dust, or the lower-layer milling are responsible for the lower concentrations at the end of the second day of sampling.
Table 7 shows the mean percentage reductions for the full and selected data sets
along with associated lower 95%-confidence limits. Note that the reductions for B2 relative to B1 for the lower-six source-area locations increase from 43% for the full data set to 55% when only the selected data (the first four sets of trials) are used.
Both of these mean reductions are statistically significant 95% confidence level, the only statistically significant reductions for the Manufacture B machine. The lower
95%-confidence limit on the 43% mean reduction for the full data set (all seven sets) is 22%. On the 55% mean reduction for the selected data (first four sets), the lower 95%-confidence limit is 28%. Configurations B3 and B4 do not show
reductions at the lower-six locations for either the full or selected data sets. However, an examination of the data for B4 shows a data point at the lower-six
locations yielding a 2.2 ratio for B4/B1 (Table 6). This point, a trial-mean respirable-dust concentration of 11.3 mg/m3 for the B4 trial in Set 3, was the highest concentration measured in the entire field study, and was found to be
extremely close to being an outlier at the 99% confidence level. If this particular ratio is excluded from the analysis, the average reduction is 29%, as shown in
Table 7. The B4 configuration includes the added nozzles B2 adds to the baseline B1 configuration, but adds some additional over the B2 configuration. The additional B4 nozzles that may have used some of the total water flow without
much beneficent effect. The results suggest that some attributes of Configuration B4 may be beneficent in reducing dust emissions.

EPHB Report No. 282-17a
Page 28
Table 6. Results from Manufacturer B testing by location group: Mean respirable-dust concentrations (mg/m3) for each trial, and concentration ratios for modified vs. baseline configurations.
Lower-six source locations Conveyor-top two locations Operator-bridge two locations
Average of trial-mean
concentrations for each
location
Ratios of average
concentrations for
modified vs. baseline
configuration
Average of trial-mean
concentrations for each
location
Ratios of average
concentrations for
modified vs. baseline
configuration
Average of trial-mean
concentrations for each
location
Ratios of average
concentrations for
modified vs. baseline
configuration
Configuration
B1 B2 B3 B4 B2/B1
ratio
B3/B1
ratio
B4/B1
ratio
B1 B2 B3 B4 B2/B1
ratio
B3/B1
ratio
B4/B1
ratio
B1 B2 B3 B4 B2/B1
ratio
B3/B1
ratio
B4/B1
ratio Date and set
6/23, set 1 1.6 0.74 1.8 1.3 0.46 1.1 0.81 0.58 0.48 0.71 0.57 0.83 1.22 0.98 0.62 0.47 0.57 0.54 0.76 0.92 0.87
6/23, set 2 0.67 0.52 0.75 0.54 0.77 1.1 0.80 0.23 0.33 0.16 0.29 1.43 0.70 1.26 0.27 0.34 0.36 0.32 1.26 1.33 1.19
6/24, set 3 5.1 1.5 7.7 11.3 0.29 1.5 2.2 0.37 0.094 0.99 1.77 0.25 2.68 4.78 1.37 0.71 0.13 0.52 0.52 0.09 0.38
6/24,set 4 1.5 0.39 1.8 0.67 0.27 1.2 0.45 0.099 0.070 0.11 0.080 0.71 1.11 0.81 0.71 0.16 0.74 0.29 0.23 1.04 0.41
6/24, set 5 1.3 0.23 0.67 0.96 0.18 0.52 0.77 0.10 0.065 0.10 0.078 0.65 1.00 0.78 0.49 0.065 0.080 0.28 0.13 0.16 0.57
6/24, set 6 0.19 0.23 0.16 0.23 1.2 0.83 1.2 0.060 0.074 0.075 0.058 1.23 1.25 0.97 0.058 0.099 0.063 0.084 1.71 1.09 1.45
6/24, set 7 0.27 0.21 0.37 0.16 0.79 1.4 0.60 0.067 0.062 0.067 0.050 0.93 1.00 0.75 0.087 0.073 0.087 0.043 0.84 1.00 0.49
Avg., all sets 0.57 1.09 0.98 0.86 1.28 1.48 0.78 0.80 0.77
Avg., exclude
lower layer
0.45
(n=4)
1.23
(n=4)
1.01
(n=5)
0.81
(n=4)
1.43
(n=4)
1.72
(n=5)
0.69
(n=4)
0.85
(n=4)
0.68
(n=5)
EPHB Report No. 282-17a
Page 29
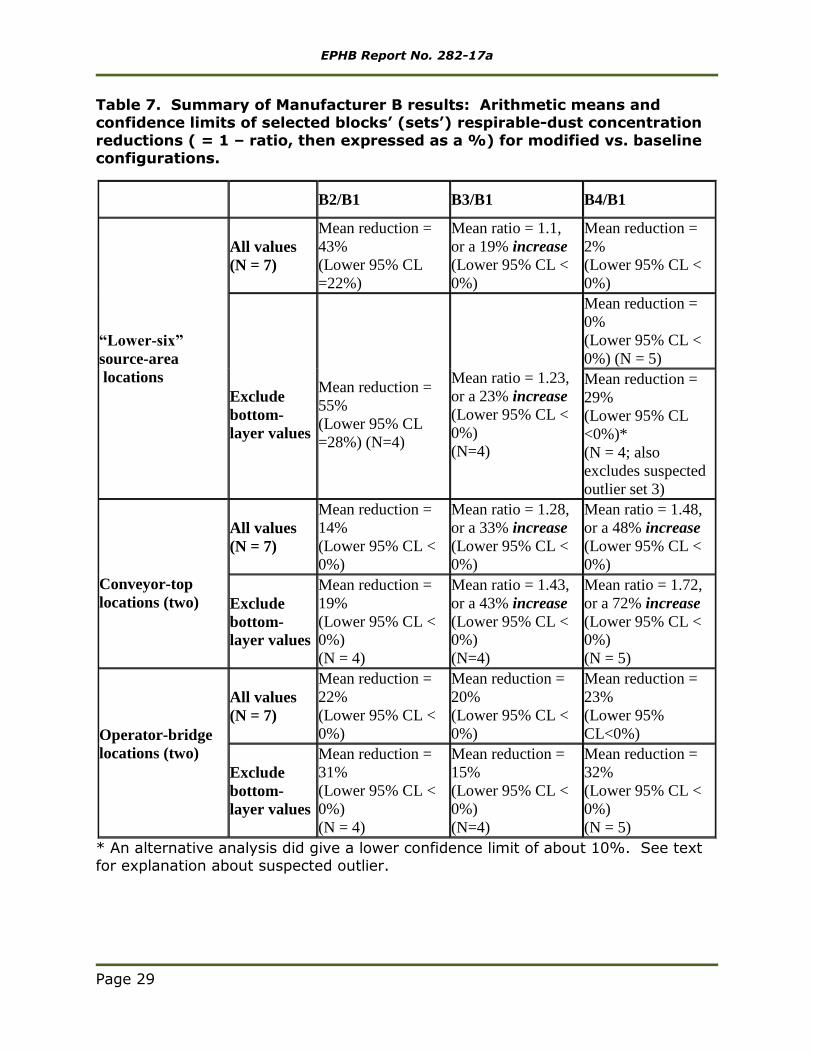
Table 7. Summary of Manufacturer B results: Arithmetic means and confidence limits of selected blocks’ (sets’) respirable-dust concentration
reductions ( = 1 – ratio, then expressed as a %) for modified vs. baseline configurations.
B2/B1 B3/B1 B4/B1
“Lower-six”
source-area
locations
All values
(N = 7)
Mean reduction =
43%
(Lower 95% CL
=22%)
Mean ratio = 1.1,
or a 19% increase
(Lower 95% CL <
0%)
Mean reduction =
2%
(Lower 95% CL <
0%)
Exclude
bottom-
layer values
Mean reduction =
55%
(Lower 95% CL
=28%) (N=4)
Mean ratio = 1.23,
or a 23% increase
(Lower 95% CL <
0%)
(N=4)
Mean reduction =
0%
(Lower 95% CL <
0%) (N = 5)
Mean reduction =
29%
(Lower 95% CL
<0%)*
(N = 4; also
excludes suspected
outlier set 3)
Conveyor-top
locations (two)
All values
(N = 7)
Mean reduction =
14%
(Lower 95% CL <
0%)
Mean ratio = 1.28,
or a 33% increase
(Lower 95% CL <
0%)
Mean ratio = 1.48,
or a 48% increase
(Lower 95% CL <
0%)
Exclude
bottom-
layer values
Mean reduction =
19%
(Lower 95% CL <
0%)
(N = 4)
Mean ratio = 1.43,
or a 43% increase
(Lower 95% CL <
0%)
(N=4)
Mean ratio = 1.72,
or a 72% increase
(Lower 95% CL <
0%)
(N = 5)
Operator-bridge
locations (two)
All values
(N = 7)
Mean reduction =
22%
(Lower 95% CL <
0%)
Mean reduction =
20%
(Lower 95% CL <
0%)
Mean reduction =
23%
(Lower 95%
CL<0%)
Exclude
bottom-
layer values
Mean reduction =
31%
(Lower 95% CL <
0%)
(N = 4)
Mean reduction =
15%
(Lower 95% CL <
0%)
(N=4)
Mean reduction =
32%
(Lower 95% CL <
0%)
(N = 5)
* An alternative analysis did give a lower confidence limit of about 10%. See text for explanation about suspected outlier.
EPHB Report No. 282-17a
Page 30
Average ratios and reductions (and increases) were also computed for the operator-bridge and conveyor-top locations, along with lower 95%-confidence limits for the
reductions (see Tables 6 and 7). B2 and B4 yield the largest reductions relative to B1. For B2, the reductions for both the operator-bridge and conveyor-top locations
are much lower than for the lower-six source locations. The largest reductions for B2 are obtained by using just the selected data sets (first four sets). For the operator-bridge locations, the largest reductions for B2 and B4 are 31% and 32%,
respectively, but these are not statistically significant at the 95%-confidence level and are appreciably lower than the corresponding ratio for the lower-six locations.
For the conveyor-top locations, the mean reductions for B2 using the full and selected data sets are 14% and 19%, respectively, also not statistically significant. The reductions seen for the operator-bridge locations for Configurations B3 and B4
are somewhat unexpected, suggesting some reduction even though the lower-six locations data generally suggest no reduction. However, these mean reductions are
not statistically significant.
The reductions for the lower-six source locations are important because respirable
dust and crystalline silica are generated in the area. The mean concentration from these locations is considered a surrogate for the respirable-dust emission rate. The
failure to observe equivalent reduction at the operator-bridge locations is difficult to explain, given that reductions in the dust emission rate would seem to result in reduced concentrations at the locations immediately above the source. One
explanation may be that there were relatively low concentrations at the operator bridge since only some of the source area dust will reach these locations. With low
levels of dust generation from milling, ambient background dust may have a greater effect on operator-bridge concentrations.
Another possibility to explain the lack of reductions at the operator bridge is an additional source of dust, specifically, the conveyor-top at front of the milling
machine where the milled material is discharged into the dump truck. For this source to affect the operator-bridge location, the wind would need to come from the front side of the machine. In Table A-1 in the Appendix, it can be seen that on
June 23, the wind did come from the front of the milling machine. However, because there is relative consistency of the ratios of operator-bridge to lower-six
means (Table 5), it seems unlikely that the conveyor-top is a source of dust measured at the operator-bridge.

EPHB Report No. 282-17a
Page 31
Test data for Manufacturer D mill: Respirable-dust measurements –
results and discussion
The calculated means for the three different location groupings for the
Manufacturer D milling machine are shown in the, Table 8. These results together are summarized in Table 9. Table 5 provides additional data comparisons among
location groups. Table A-1 in the Appendix provides wind-measurement data and a qualitative examination of the effects of wind for all these trials.
The data in Table 8 show that, for the trials testing the Manufacturer D standard-production or baseline configuration D1, the trial arithmetic mean concentrations
for the lower-six source locations vary between 1.08 and 3.80 mg/m3. As also shown in that table, the average ratios for the three modified test configurations relative to D1, ranged from 0.34 to 2.5 for D2, from 0.24 to 0.6 for D3, and from
0.24 to 0.61 for D4. There is some difference between the days; the data for the first day indicates an average 11% increase for D2 relative to D1, about a 64%
decrease for D3, and about a 75% decrease for D4. For the second day, the average reductions (or increases) are approximately a 10% increase for D2, a 60% reduction for D3, and a 58% reduction for D4.
Manufacturer D configurations were evaluated on two successive days in the
September study. Sets 1 through 3 were conducted on the former main runway on the first day, with two trials completed on each pass of the runway’s length. On the second day of the study, because of limited asphalt available for milling, three trials
were done on each pass on the main runway for Sets 4 through 7. Sets 8 and 9 then were conducted on the former auxiliary runway during the second day, with
two trials per pass.
There was a decreasing trend in the concentration levels over the first four sets of
the second day (Sets 4, 5, 6, and 7). Many of these trends are difficult to explain, in terms of the wind (see Table A-1 in the Appendix). For example, similar mean
wind speeds of 4.1 and 3.8 miles per hour, with similar directions, were measured during test trials of Configuration D2 in Sets 4 and 6, but the average respirable-dust concentration at the lower-six source locations dropped from 3.83 to 0.70 mg/
m3 (see Table 8). Sets 6 and 7 were conducted while milling the lower layer of asphalt, and the machine may have been removing some of the gravel base.
However, the lower layer of asphalt on the main runway left to mill during the September testing was thicker than the lower layer milled in June. For the auxiliary runway, the lower layer seemed to be thick enough that the mill was removing
mostly asphalt, not gravel and soil.
Table 8 shows the average ratios of the trial-mean respirable-dust concentrations from the lower-six, conveyor-top, and operator-bridge locations. For each location grouping, two different average ratios are shown. The first average shown for each
comparison for each grouping is for all sets of trials; the second average is for selected sets (all except Set 2). Two trials within Set 2 were carried out over a
“wedge” in the asphalt that had a decreasing thickness across the width of the cut, and, therefore, seemed unrepresentative for comparison purposes. The means for

EPHB Report No. 282-17a
Page 32
those two trials are highlighted in red. The full and selected data set mean ratios are similar.
Other trial means displayed in red are for milling trials carried out on lower layers of
asphalt; these mean values do not differ much from those for the other layers. As mentioned above, the lower layer milled during second day’s sets was about the same thickness as the upper layers (in contrast to the thin lower layers milled
during the June testing). Because the concentration levels from the lower-layer baseline-configuration trials are not nearly as low as was seen with the
Manufacturer A or B test data, the selected data set does not exclude trials conducted during lower-layer asphalt milling.
The average concentrations at the conveyor-top and operator-bridge locations are shown in Table 8. The average ratios relative to the baseline configuration D1
indicate reductions of 48% or more at the conveyor top for D3 and D4, but little reduction at the operator bridge. However, the reductions at the operator bridge on the first day were 36% for D3 and 62% for D4, but showed increases the second
day. For D2, the results indicate minimal reduction at the conveyor-top locations, but a reduction of 13% overall and 20% with Set 2 excluded at the operator-bridge
locations. The operator-bridge location does not show consistent reduction for either D3 or D4. One peculiarity of the data is that the ratios of the operator-bridge to the lower-six means (Table 5) for D1 and D2 are more constant and almost
always lower than that ratio for D3 and D4. This contrast is very apparent for the sets on Day 2 with three trials per pass. It is difficult to explain these results based
on wind speed and direction, which seem similar for most of these trials. For the second day, Configuration D2, with no reduction for the lower-six source-area locations, has higher reductions at the operator bridge than D3 or D4, which each
show considerable reduction at the lower-six locations. A possible explanation is that the baseline (D1) operator average concentrations are quite low; only one D1
average exceeds

EPHB Report No. 282-17a
Page 33
Table 8. Results from Manufacturer D testing by location group: Mean respirable-dust concentrations (mg/m3) for each trial, and concentration ratios for modified vs. baseline configurations.
Lower-six source locations Conveyor-top two locations Operator-bridge two locations
Average of trial-
mean
concentrations for
each location
Ratios of
average
concentrations
for modified vs.
baseline
configuration
Average of trial-
mean
concentrations for
each location
Ratios of
average
concentrations
for modified vs.
baseline
configuration
Average of trial-
mean
concentrations for
each location
Ratios of
average
concentrations
for modified vs.
baseline
configuration
Configuration D1 D2 D3 D4
D2/D1
ratio
D3/D1
ratio
D4/D1
ratio D1 D2 D3 D4
D2/D1
ratio
D3/D1
ratio
D4/D1
ratio D1 D2 D3 D4
D2/D1
ratio
D3/D1
ratio
D4/D1
ratio Date and set
9/16, set 1 1.60 1.25 0.77 0.45 0.78 0.48 0.28 0.042 0.048 0.032 0.019 1.14 0.76 0.45 0.26 0.15 0.16 0.062 0.58 0.62 0.24
9/16, set 2 2.30 2.42 0.54 0.55 1.05 0.24 0.24 0.058 0.058 0.017 0.036 1.00 0.29 0.62 0.18 0.23 0.097 0.082 1.28 0.54 0.46
9/16, set 3 1.78 2.66 0.66 0.43 1.50 0.37 0.24 0.070 0.081 0.035 0.033 1.16 0.50 0.47 0.17 0.16 0.13 0.078 0.94 0.76 0.45
9/17, set 4 3.80 3.83 1.00 * 1.01 0.26 1.88 2.03 0.32 * 1.08 0.17 0.74 0.61 0.86 * 0.82 1.16
9/17, set 5 1.93 * 1.15 0.67 0.60 0.35 0.62 * 0.31 0.43 0.50 0.69 0.22 * 0.70 0.40 3.18 1.82
9/17, set 6 * 0.70 0.87 0.39 * 0.14 0.072 0.24 * 0.11 0.26 0.21
9/17, set 7 1.24 0.42 * 0.39 0.34 0.31 0.052 0.027 * 0.026 0.52 0.50 0.15 0.03 * 0.078 0.20 0.52
9/17, set 8 1.64 4.09 0.42 0.63 2.50 0.26 0.39 0.31 0.34 0.041 0.080 1.10 0.13 0.26 0.24 0.30 0.19 0.34 1.25 0.79 1.42
9/17. set 9 1.08 0.62 0.51 0.66 0.58 0.48 0.61 0.081 0.036 0.020 0.054 0.44 0.25 0.67 0.087 0.086 0.13 0.10 0.99 1.49 1.15
Avg., all sets 1.11 0.38 0.35 0.92 0.37 0.52 0.87 1.22 0.87
Avg., sets 1, 3-9 1.12 0.41 0.36 0.91 0.39 0.51 0.80 1.33 0.93
* In Sets 4 through 7, just three configurations are tested in each set, as explained in the text.

EPHB Report No. 282-17a
Page 34
0.5 mg/m3. Therefore, it may be difficult to distinguish true differences in levels among the configurations.
Table 9 lists the mean reduction percentages and lower 95%-confidence limits for
these means. The reductions at the lower-six locations compared to D1 are 59% for D3 (37% lower 95%-confidence limit) and 64% for D4 (52% lower 95%-confidence limit). For D2 at the lower-six locations, there is no statistically
significant reduction at the 95% level of confidence. At the conveyor-top locations, the reductions compared to D1 are 61% for D3 (41% lower 95%-confidence limit)
and 49% for D4 (23% lower 95%-confidence limit). For D2 at the conveyor-top locations, there is no statistically significant reduction at the 95% level of confidence. At the operator-bridge locations, only D4 had a statistically significant
reduction at the 95% level compared to D1, at least a 7% reduction. A possible reason for the small reductions at the operator-bridge locations is that the D1
(baseline) mean concentrations at the operator bridge are all quite low, less than 1 mg/m3. The large reductions at the conveyor top for D3 and D4 may have been related to the location of the exhaust outlet for the local exhaust system.
Table 9. Summary of Manufacturer D results: Arithmetic means and
confidence limits of selected blocks’ (sets’) respirable-dust concentration reductions ( = 1 – ratio, then expressed as a %) for modified vs. baseline configurations.
D2/D1 D3/D1 D4/D1
“Lower-six”
source-area
locations
All values (N
= 7)
Mean ratio = 1.1,
or a 10% increase
(Lower 95% CL<0)
Mean reduction =
62% (Lower 95% CL
= 47%)
Mean reduction =
65% (Lower 95% CL
= 56%)
Exclude set 2
(N = 6)
Mean ratio = 1.12,
or a 12% increase
(Lower 95% CL<0)
Mean reduction =
59% (Lower 95% CL
= 37%)
Mean reduction =
64% (Lower 95% CL
= 52%)
Conveyor-top
locations (two)
All values (N
= 7)
Mean reduction = 8%
(Lower 95% CL<0)
Mean reduction =
63%
(Lower 95% CL =
51%)
Mean reduction =
48%
(Lower 95% CL =
25%)
Exclude set 2
(N = 6)
Mean reduction = 9%
(Lower 95% CL<0)
Mean reduction =
61%
(Lower 95% CL =
41%)
Mean reduction =
49%
(Lower 95% CL =
23%)
Operator-bridge
Locations (two)
All values (N
= 7)
Mean reduction =
13%
(Lower 95% CL<0)
Mean ratio = 1.22,
or a 22% increase
(Lower 95% CL<0)
Mean reduction =
13%
(Lower 95% CL =
8%)
Exclude set 2
(N = 6)
Mean reduction=20%
(Lower 95% CL<0)
Mean ratio = 1.33,
or a 33% increase
(Lower 95% CL<0)
Mean reduction = 7%
(Lower 95% CL =
6.7%)

EPHB Report No. 282-17a
Page 35
Examination of Table 8 indicates how consistent the reductions for Configurations D3 and D4 are over the eight trials at the six-lower locations, between 60% and
65%. Perhaps this is because the baseline Configuration D1 concentrations have somewhat limited spread – between 1 and 4 mg/m3. The reductions at the
conveyor top are substantial for both D3 and D4, although greater for D3, even though D4 has a spray nozzle at the conveyor top. Wind is not a factor.
Test data for Manufacturer E mill: Respirable-dust measurements – results and discussion
The calculated means for the three different groupings for the Manufacturer E
milling machine are shown in the Table 10. This table also shows that the Manufacturer E baseline configuration (Configuration E1) trial arithmetic mean concentrations for the lower-six source locations varied between 0.73 and
7.48 mg/m3. The ratios of the trial-mean concentrations for the three modified-test configurations, ranged from 0.66 to 2.71 for E2, from 0.60 to 3.18 for E3, and from
0.86 to 2.02 for E4. Table 5 provides additional data comparisons among location groups. Weather data for the evaluation of the Manufacturer E milling machine was not available due to equipment malfunctions. Table 10 shows that the average
ratios relative to Configuration E1 for all sets of trials are 1.4 for E2, 1.5 for E3, and 1.2 for E4. The ratios of respirable-dust levels from trials of modified test
configurations to those from trials of the baseline configuration may be expressed more conveniently as the percentage reduction of respirable dust for the modified configuration versus the baseline (by calculating the term [1 – ratio], and
expressing the result as a percentage.) Any resulting “negative percent reductions” indicate increases in average concentrations. These ratios expressed as a
percentage reduction relative to E1would be an increase of 41% for E2, an increase of 50% for E3, and an increase of 20% for E4. There is little difference between the days.
Table 10 also provides the average ratios for the operator-bridge and conveyor-top
locations. At the operator bridge locations, there are no estimated decreases relative to E1. At the conveyor top, the estimated reductions are 39% for E2, 4% for E3, and an increase of 13% for E4, all relative to the baseline configuration, E1.
Because the lower six source locations and the operator-bridge locations indicate concentration increases for all the configurations, statistical confidence limits on the
percent reductions were not calculated.
Crystalline-silica measurements – results and discussion
Bulk-material samples analyzed for crystalline silica.
Four bulk-material samples of asphalt-pavement material milled during this study
were collected for crystalline-silica analysis. Two samples were collected in June 2008 of pavement milled from the main runway, one from the top layer of pavement (reported to be a “friction coarse” pavement) and one from the lower
layer of pavement (reported to be a “binder asphalt” pavement). These samples consisted of 39% and 24% crystalline silica by weight, respectively. Two samples

EPHB Report No. 282-17a
Page 36
were also collected in September 2008 of pavement milled from the auxiliary runway, one from the top layer and one from the lower layer of pavement (reported
to be similar types of pavement). These samples consisted of 26% and 25% crystalline silica by weight, respectively. All crystalline silica detected in the four
bulk-material samples was quartz. No cristobalite or tridymite was detected. The analytical limits of detection for cristobalite were 2%, 2%, 8%, and 4% by weight for the four samples, respectively, and for tridymite were 1%, 0.8%, 4%, and 2%
by weight for the four samples, respectively.

EPHB Report No. 282-17a
Page 37
Table 10. Results from Manufacturer E testing by location group: Mean respirable-dust concentrations (mg/m3) for each trial, and concentration ratios for modified vs. baseline configurations.
Lower-six source locations Conveyor-top two locations Operator-bridge two locations
Average of trial-
mean
concentrations for
each location
Ratios of
average
concentrations
for modified vs.
baseline
configuration
Average of trial-
mean
concentrations for
each location
Ratios of
average
concentrations
for modified vs.
baseline
configuration
Average of trial-
mean
concentrations for
each location
Ratios of
average
concentrations
for modified vs.
baseline
configuration
Configuration E1 E2 E3 E4
E2/E1
ratio
E3/E1
ratio
E4/E1
ratio E1 E2 E3 E4
E2/E1
ratio
E3/E1
ratio
E4/E1
ratio E1 E2 E3 E4
E2/E1
ratio
E3/E1
ratio
E4/E1
ratio Date and set
9/16, set 1 1.87 2.79 2.39 1.81 1.49 1.28 0.97 0.045 0.064 0.053 0.049 1.42 1.18 1.09 0.36 0.18 0.5 0.38 0.50 1.39 1.06
9/16, set 2 1.81 3.03 2.23 2.54 1.67 1.23 1.40 0.12 0.02 0.060 0.11 0.17 0.50 0.92 0.72 1.32 1.09 1.35 1.83 1.51 1.88
9/17, set 3 * 6.52 3.71 2.31 * 0.61 1.97 2.86 * 2.34 1.64 1.71
9/17, set 4 3.15 * 1.90 2.95 0.60 0.93 1.62 * 1.11 2.17 0.69 1.34 2.35 * 1.29 1.41 0.55 0.60
9/17, set 5 0.77 2.09 * 1.21 2.71 1.40 0.2 0.091 * 0.2 0.46 1.00 0.7 0.73 * 1.38 1.04 1.97
9/17, set 6 0.73 0.48 0.82 * 0.66 1.12 0.19 0.097 0.15 * 0.51 0.79 0.23 0.25 0.31 * 1.09 1.35
9/18, set 7 3.38 5.82 6.71 6.83 1.72 1.99 2.02 1.19 1.3 1.24 2.52 1.09 1.04 2.12 2.81 4.17 2.81 1.96 1.48 1.00 0.70
9/18. set 8 7.48 9.84 7.85 6.46 1.32 1.05 0.86 0.93 0.28 0.77 0.89 0.30 0.83 0.96 2.8 2.72 2.79 2.25 0.97 1.00 0.80
9/18, set 9 1.81 1.28 2.80 1.76 0.71 1.55 0.97 0.16 0.062 0.097 0.12 0.39 0.61 0.75 0.72 0.34 0.78 0.62 0.47 1.08 0.86
9/18, set 10 1.02 0.98 3.23 1.27 0.97 3.18 1.25 0.098 0.054 0.2 0.086 0.55 2.04 0.88 0.34 0.28 1.09 0.32 0.82 3.21 0.94
Avg., all sets 1.41 1.5 1.2 0.61 0.96 1.13 1.03 1.39 1.10
* In Sets 3 through 6, just three configurations are tested in each set, as explained in the text.
EPHB Report No. 282-17a
Page 38
Computation and use of estimated crystalline-silica content of
airborne respirable dust.
Table 11 summarizes the crystalline-silica percentages in the respirable dust
measured during this field study. The crystalline-silica content includes the total of the quartz, cristobalite, and tridymite measured in each sample. With only two
exceptions, the only form of crystalline silica detected in the respirable dust was quartz. Two respirable-dust samples for Manufacturer E contained relatively low quantities of cristobalite. No tridymite was detected in any of the samples. The
crystalline-silica percentages in Table 11 were computed for each of the three air-sampling location groupings (operator-bridge, conveyor-top, and lower-six source
locations) and for each day. The respirable crystalline-silica concentrations from the full-day time-integrated (cyclone/filter/pump) samples (two of which were collected each day at each individual sampling location) were averaged and divided
by the average of the corresponding respirable-dust concentrations from the same samples. This provides the average crystalline-silica content, as a percent by mass,
of the respirable dust collected each day for each location grouping.
Because some crystalline-silica results were reported as less than the analytical
limit of detection (LOD), each of the location-group average crystalline-silica percentages was computed two ways:
(1) All results for the group are included, and for each crystalline-silica sample-mass result reported as “less than the LOD” – indicating a non-
detectable (ND) concentration of crystalline silica – an estimated concentration was substituted using the method of Hornung and
Reed [1990]. This method suggests using an estimated sample mass equal to the LOD divided by the square root of 2 (LOD/√2). These criteria also state that that if the number of results reported as ND exceeds 50% of the
total within a group of samples, then it is best not to compute averages for that group. Where those instances occurred in this study, Table 11 lists the
percentage crystalline silica as “ND.”
(2) “ND” results are omitted, and an average is computed only from the
results with detectable levels of crystalline silica. Table 11 also provides the number of results used to compute this average, along with the number and
percentage of “ND” results and the total number of results.
The lowest crystalline-silica content was estimated at 5.0% for method 1 and
5.4% for method 2, both at the lower-six locations on the Manufacturer A mill while milling the top layer of the main runway on June 23, 2008. The highest crystalline-
silica content estimate was 16.4% for method 1 and 14.4% for method 2, both at the operator-bridge locations on the Manufacturer E mill, while milling the top layer of the main runway on June 23, 2008.

EPHB Report No. 282-17a
Page 39
Table 11. Estimated mean percentage of quartz in the airborne respirable dust
(average respirable-quartz concentration / average respirable-dust
concentration), calculated for each location grouping for each day – from results
for all four manufacturers’ test mills.
Air-sampling
location grouping
Average percent crystalline-silica content (by mass) in respirable
dust, for each sampling-location on each day
Computed using all results, with estimated
values for “ND” results (i.e., results <LOD),
unless number of ND results is more than half
of total. Then, average % not computed, instead
reported as ND. Estimated values use quartz
LOD/√2 as crystalline-silica mass. See text.
Data-cell format = Date: Average percent
quartz (fraction and percent ND results.)
Computed using only results with
values >LOD. Results reported as
ND not used. See text for complete
explanation.
Data-cell format =
Date: Average percent quartz (no.
of results >LOD out of total)
Manufacturer A
Operator-bridge
locations (two)
6/23: ND (3 ND / 4 = 75%)
6/24: 9.3% (2 ND / 4 = 50%)
6/23: 8.5% (n = 1 of 4)
6/24: 7.7% (n = 2 of 4)
Conveyor-top
locations (two)
6/23: 7.2% (2 ND / 4 = 50%)
6/24: 8.7% (2 ND / 4 = 50%)
6/23: 6.2% (n = 2 of 4)
6/24: 7.9% (n = 2 of 4)
“Lower-six”
source-area locations
6/23: 5.0% (5 ND / 11 = 45%)
6/24: 6.8% (2 ND / 12 = 16.7%)
6/23: 5.4% (n = 6 of 11)
6/24: 6.8% (n = 10 of 12)
Manufacturer B
Operator-bridge
locations (two)
6/23: ND (3 ND / 4 = 75%)
6/24: 7.9% (2 ND / 4 = 50%)
6/23: 7.6% (n = 1 of 4)
6/24: 6.4% (n = 2 of 4)
Conveyor-top
locations (two)
6/23: 9.0% (2 ND / 4 = 50%)
6/24: 8.5% (2 ND / 4 = 50%)
6/23: 7.5% (n = 2 of 4)
6/24: 9.3% (n = 2 of 4)
“Lower-six”
source-area locations
6/23: 6.5% (5 ND / 12 = 42%)
6/24: 6.4% (4 ND / 12 = 33.3%)
6/23: 6.1% (n = 7 of 12)
6/24: 6.3% (n = 8 of 12)
Manufacturer D
Operator-bridge
locations (two)
9/16: ND (3 ND / 4 = 75%)
9/17: 8.5% (2 ND / 4 = 50%)
9/16: 8.8% (n = 1 of 4)
9/17: 11.5% (n = 2 of 4)
Conveyor-top
locations (two)
9/16: ND (4 ND / 4 = 100%)
9/17: 6.1% (1 ND / 3 = 33.3%)
9/16: ND (n = 0 of 4)
9/17: 5.0% (n = 2 of 3)
“Lower-six”
source-area locations
9/16: 13.0% (6 ND / 12 = 50%)
9/17: 11.2% (4 ND / 12 = 33.3%)
9/16: 12.6% (n = 6 of 12)
9/17: 11.0% (n = 8 of 12)
Manufacturer E
Operator-bridge
locations (two)
9/16: 16.4% (2 ND / 4 = 50%)
9/17: 8.8% (2 ND / 4 = 50%)
9/18: 9.9% (0 ND / 4 = 0%)
9/16: 14.4% (n = 2 of 4)
9/17: 8.0% (n = 2 of 4)
9/18: 9.9% (n = 4 of 4)
Conveyor-top
locations (two)
9/16: ND (4 ND / 4 = 100%)
9/17: 11.1% (2 ND / 4 = 50%)
9/18: 9.7% (2 ND / 4 = 50%)
9/16: ND (n = 0 of 4)
9/17: 9.9% (n = 2 of 4)
9/18: 9.0% (n = 2 of 4)
“Lower-six”
source-area locations
9/16: 11.1% (4 ND / 12 = 33.3%)
9/17: 7.8% (3 ND / 12 = 25%)
9/18: 8.6% (1 ND / 12 = 8.3%)*
9/16: 10.7% (n = 8 of 12)
9/17: 7.7% (n = 9 of 12)
9/18: 8.6% (n = 11 of 12)*
* These averages include two samples, both collected at the cutter-drum front-right location, which contained both quartz and cristobalite. In both samples, the quartz content was relatively high compared to the cristobalite content. The quartz and cristobalite masses were summed for the
computation. As noted in the text, no other respirable-dust samples collected during this study contained forms of crystalline-silica other than quartz.

EPHB Report No. 282-17a
Page 40
In comparing these data with the results of analyses of the bulk-material samples of milled material for crystalline-silica, it can be seen that the respirable dust
samples contained much less crystalline silica than the bulk samples. This is consistent with findings from previous studies. Although the data do not allow for a
definitive explanation of this relationship, it is reasonable to speculate that when the asphalt-pavement material fractionates during milling, relatively little of the crystalline silica in the material ends up in the particles that are emitted as
respirable dust, while a greater fraction ends up in the larger non-respirable and non-airborne material.
The specific reason for such a difference is not apparent. However, it is clear that the percent crystalline-silica content of the mass of bulk milled material is not a
suitable estimate of the percent crystalline-silica content of the respirable dust produced.
These data also add to the knowledge of the distribution of percent crystalline-silica contents in milling work. The combined data from all asphalt-pavement milling
studies may allow the development of a statistical profile of distributions of percent crystalline-silica in respirable dust. Combining such a distribution with that of
respirable-dust concentrations and personal exposures produced by milling may provide a tool that allows us to better evaluate workers’ potential crystalline-silica exposures in the future.
Overall Discussion of Controlled-Test Results
The data from the 2008 controlled-site testing have provided some interesting observations:
The testing revealed dust emission-control improvements that suggest
appreciable, statistically significant reductions in respirable-dust emissions compared to existing, baseline configurations, based upon measurements made at the lower-six source-area locations. Mean reductions of 43% to
55% from a specific improved water-spray design and at least 59% from negative pressurization via an LEV system alone were observed. The milling
machine employing both the LEV system and a modified water-spray configuration saw at least a 64% reduction; this particular modified water-spray configuration has not yet been optimized.
The 2008 controlled-testing data almost always demonstrated higher respirable-dust concentrations on the down-wind side of the machine than on
the up-wind side. Dust is likely brought back toward the machine by eddies that may form on the down-wind side.
The results and findings to date support the concept of conducting a series of
replicate short-term milling trials to evaluate existing and modified dust-emission controls. This includes the use of real-time, data-logging
respirable-dust monitors to assess relative emission rates and estimate the potential effectiveness of proposed improvements.

EPHB Report No. 282-17a
Page 41
The 2008 results also demonstrate the validity of the air-sampling approach employed, surrounding the dust-generation and release areas of the machine
with six air-monitoring locations.
The specific findings of the 2008 controlled-site test may be summarized as follows:
Manufacturer A. Compared to baseline Configuration A1, Configurations A2
and A3 produced estimated mean reductions in respirable-dust emissions at the lower-six source-area locations of 10% and 14%, respectively, which
were not statistically significant. Manufacturer B. Compared to baseline Configuration B1, Configuration B2
produced an estimated mean reduction in respirable-dust emissions (based
upon lower-six source-area concentration measurements) of 43% to 55%, depending on data set selected. Both estimates were statistically significant,
with lower 95%-confidence limits of 28% and 22%, respectively. This appears to be an effective configuration.
Manufacturer D. Compared to baseline Configuration D1, Configuration D2
did not produce a reduction in respirable-dust emissions. However, Configurations D3 and D4, which included LEV-system operation, produced
estimated mean reductions in respirable-dust emissions at the lower-six source-area locations of 59% and 64%, respectively. These were statistically significant, with lower 95%-confidence limits of 37% for D3 and 52% for D4.
The use of local exhaust ventilation to produce negative pressurization in the cutter housing, which both of these configurations share, appears to be an
effective emission control and could be further optimized. Manufacturer E. None of the modified test configurations provided reductions
in respirable-dust emissions at the lower-six source-area locations compared
with baseline Configuration E1. Mean increases in concentration were measured for the modified configurations relative to the baseline at the
lower-six and operator-bridge locations.
In most cases, the most effective test configurations based upon lower-six-location
dust concentrations did not produce statistically significant reductions of similar magnitude at the other monitoring locations (operator-bridge and conveyor-top
locations). However, concentrations at those sampling locations are generally appreciably lower, thus making differences less evident.
Dust emission-control designs
The results of this study provided insightful information for future dust-control efforts. Two different techniques, water sprays and a vacuum or negative-pressure
LEV system, were evaluated control respirable dust emissions. The tested water-spray systems utilized two general water-spray principles in varying degrees. The first principle involved spraying water to wet the milled asphalt material, preventing
the dust from becoming airborne. The second used water sprays to knock dust particles that have already become airborne out of the air. This is achieved by
spraying water into dust clouds, causing the dust particles and water droplets to

EPHB Report No. 282-17a
Page 42
collide, agglomerate, and settle out of the air. The LEV technique uses negative pressure to capture dust particles and then transports this dust to a location where
it can be discharged at a point where it will not impact workers’ exposures. The most effective applications of the two control approaches are Manufacturer B with
Configuration B2 for the water spray, and Manufacturer D with Configurations D3 and D4 for the LEV. The following provides detailed design information for these configurations.
Design Comparison for Manufacturer B.
Table 12 summarizes spray details for each of the water-spray locations for Configurations B1 (baseline) and B2, from Manufacturer B. Figures 2-4 show the
three spray locations for Configuration B2. Water-application to asphalt-removal ratios for Configuration B1 were 0.90% by weight for milling of the upper layers,
and up to 1.8% during thin lower-layer milling trials. These ratios for Configuration B2 were 0.86% by weight for upper layers and up to 1.7% for lower layers.
Table 12. Details of water sprays by location for Manufacturer B,
Configurations B1 and B2.
Location Number
of Sprays
Flow
gpm @ 20
psi
Spray Type/Spray
Pattern
Spray
Systems Co.
Part #
Configuration B1
Front of Housing
Rear of Housing
Discharge of
Housing
4
10
2
1.4
1.4
1.4
Standard/Square Full
Cone
Standard/Square Full
Cone
Standard/Square Full
Cone
1/4QHA-
10SQ
1/4QHA-
10SQ
1/4QHA-
10SQ
Totals 16 22.4
Configuration B2
Rear of Housing
Discharge of
Housing
Upper Transition
10
2
2
1.4
1.8
1.9
Standard/Square Full
Cone
Spiral Jet/CircularFull
Cone
Standard/Circular Full
Cone
1/4QHA-
10SQ
1/4HHSJ-
15013
1/4GGA-14W
Totals 14 21.4
Comparing design changes from Configuration B1 to Configuration B2 shows: (1) sprays at the front of the housing were eliminated; (2) sprays at the rear of the
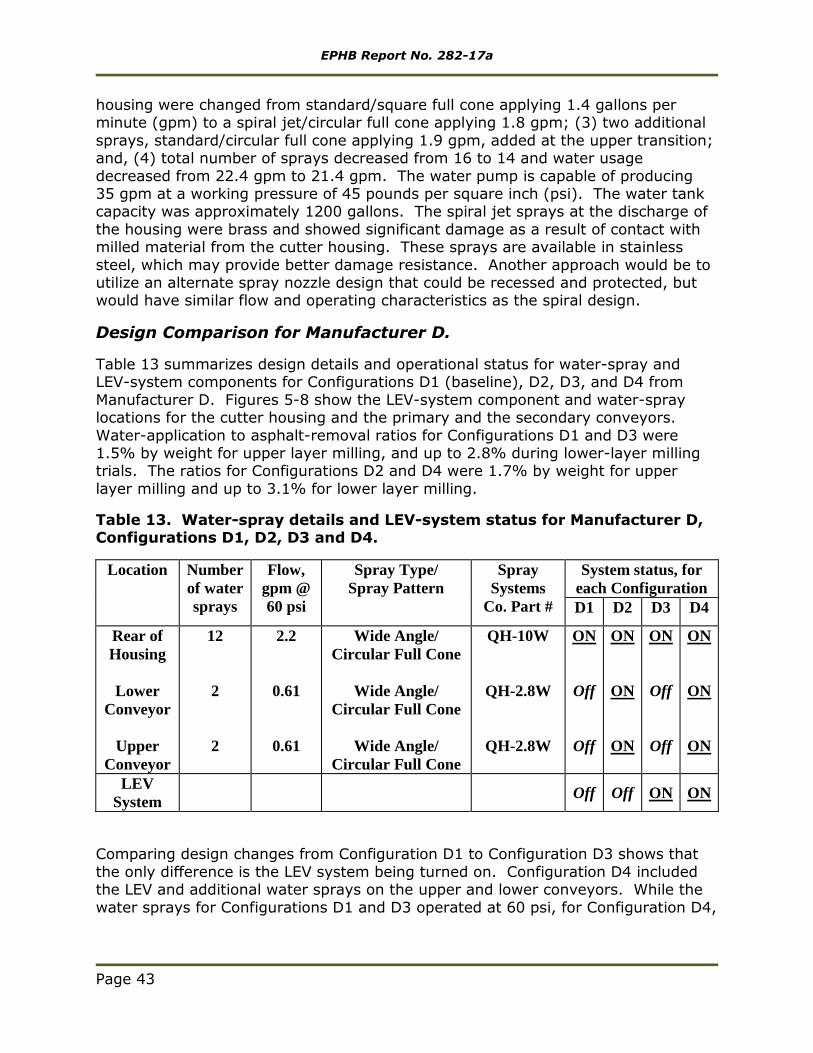
EPHB Report No. 282-17a
Page 43
housing were changed from standard/square full cone applying 1.4 gallons per minute (gpm) to a spiral jet/circular full cone applying 1.8 gpm; (3) two additional
sprays, standard/circular full cone applying 1.9 gpm, added at the upper transition; and, (4) total number of sprays decreased from 16 to 14 and water usage
decreased from 22.4 gpm to 21.4 gpm. The water pump is capable of producing 35 gpm at a working pressure of 45 pounds per square inch (psi). The water tank capacity was approximately 1200 gallons. The spiral jet sprays at the discharge of
the housing were brass and showed significant damage as a result of contact with milled material from the cutter housing. These sprays are available in stainless
steel, which may provide better damage resistance. Another approach would be to utilize an alternate spray nozzle design that could be recessed and protected, but would have similar flow and operating characteristics as the spiral design.
Design Comparison for Manufacturer D.
Table 13 summarizes design details and operational status for water-spray and LEV-system components for Configurations D1 (baseline), D2, D3, and D4 from
Manufacturer D. Figures 5-8 show the LEV-system component and water-spray locations for the cutter housing and the primary and the secondary conveyors.
Water-application to asphalt-removal ratios for Configurations D1 and D3 were 1.5% by weight for upper layer milling, and up to 2.8% during lower-layer milling trials. The ratios for Configurations D2 and D4 were 1.7% by weight for upper
layer milling and up to 3.1% for lower layer milling.
Table 13. Water-spray details and LEV-system status for Manufacturer D, Configurations D1, D2, D3 and D4.
Location Number
of water
sprays
Flow,
gpm @
60 psi
Spray Type/
Spray Pattern
Spray
Systems
Co. Part #
System status, for
each Configuration
D1 D2 D3 D4
Rear of
Housing
Lower
Conveyor
Upper
Conveyor
12
2
2
2.2
0.61
0.61
Wide Angle/
Circular Full Cone
Wide Angle/
Circular Full Cone
Wide Angle/
Circular Full Cone
QH-10W
QH-2.8W
QH-2.8W
ON
Off
Off
ON
ON
ON
ON
Off
Off
ON
ON
ON
LEV
System Off Off ON ON
Comparing design changes from Configuration D1 to Configuration D3 shows that
the only difference is the LEV system being turned on. Configuration D4 included the LEV and additional water sprays on the upper and lower conveyors. While the
water sprays for Configurations D1 and D3 operated at 60 psi, for Configuration D4,

EPHB Report No. 282-17a
Page 44
they were operated at 200 psi. The water pump is capable of producing 42 gpm at 200 psi and the water tank capacity was approximately 1300 gallons.
The LEV-system fan was powered by a 6.5-hp gasoline-fueled engine and produced
an estimated airflow between 4000 and 6000 cubic feet per minute (cfm), according to Manufacturer D representatives. This flow rate varied because control of the gasoline engine’s speed was imprecise. When the engine was run at full
throttle, the LEV system was capable of sucking in small chunks of stone along with airborne dust. Four-inch flexible ducting carried dust from the drum housing
directly to the top of the secondary conveyor. No dust collection was used to treat the exhausted air. Note, the LEV system tested on this milling machine was a prototype; if a similar system utilizing a gasoline engine were to be installed on a
production machine, measures would be needed to ensure the engine exhaust did not create a carbon monoxide exposure hazard to the workers.
Conclusions and Recommendations
Two techniques were found to have appreciable, statistically significant impacts on lowering respirable dust levels in and around the milling machine. These are a LEV system in the housing area, utilized by Manufacturer D, and the addition of water
sprays in the transfer area from the cutter housing to the primary conveyor loading area, with spray orientation counter to material flow, utilized by Manufacturer B.
NIOSH researchers and Partnership members concluded from these results that further optimization of the dust emission-control systems followed by an additional field testing should be undertaken. This will confirm the effectiveness of the most
successful design approaches and provide the opportunity to further improve and evaluate dust emission-control performance. This could include adding additional
water sprays in the transition area, as well as determining if an alternate spray nozzle would be effective. With the LEV system, various exhaust volumes could be evaluated. Optimized designs should be re-tested against the original baseline
configurations.
It would be ideal to incorporate and test both water spray and LEV designs on the same milling machine. This would allow for a comparison of the dust reduction capabilities for each technique separately as well as in combination.
Following completion of these additional controlled field tests, industrial-hygiene
field surveys should be conducted to measure workers’ full-shift personal breathing-zone exposures to respirable crystalline silica during the use of each manufacturer’s optimized dust emission-control system.
References
29 CFR 1910.1000 [2001]. Occupational Safety and Health Administration: air contaminants.
29 CFR 1926.55 [2003]. Occupational Safety and Health Administration: gases, vapors, fumes, dusts, and mists.
EPHB Report No. 282-17a
Page 45
ACGIH [2011]. Threshold limit values (TLVs®) for chemical substances and physical agents and biological exposure indices (BEIs®). Cincinnati, OH: American
Conference of Governmental Industrial Hygienists.
Akbar-Khanzadeh F, Brillhart RL [2002]. Respirable crystalline silica dust exposure during concrete finishing (grinding) using hand-held grinders in the construction industry. Ann Occup Hyg 46(3):341–346.
Blade LM, Shulman SA, Colinet J, Chekan G, Garcia A [2009a]. In-depth field
evaluation: dust-control technology for asphalt pavement milling, at U.S Highway 2 resurfacing project, Wilton, Minnesota, June 20 through 22, 2006. Cincinnati, OH: U.S. Department of Health and Human Services, Public Health Service, Centers for
Disease Control and Prevention, National Institute for Occupational Safety and Health. Report No. EPHB 282-15a.
Blade LM, Garcia A, Shulman SA, Colinet J, Chekan G [2009b]. In-depth field evaluation: dust-control technology for asphalt pavement milling, at South Dakota
Highway 79 resurfacing project, Buffalo Gap, South Dakota, August 15 through 17, 2006. Cincinnati, OH: U.S. Depart-ment of Health and Human Services, Public Health Service, Centers for Disease Control and Prevention, National Institute for
Occupational Safety and Health. Report No. EPHB 282-14a.
Blade LM, Shulman SA, Garcia A, Marlow DA [2009c]. In-depth field evaluation: dust-control technology for asphalt pavement milling, at New York State Thruway (Interstate Highway 90) resurfacing project, Hamburg, New York,
September 25 and 26, 2006. Cincinnati, OH: U.S. Department of Health and Human Services, Public Health Service, Centers for Disease Control and Prevention,
National Institute for Occupational Safety and Health. Report No. EPHB 282-16a.
Bureau of Mines [1992]. Crystalline silica primer. Washington, DC: U.S. Department
of the Interior, Bureau of Mines, Branch of Industrial Minerals, Special Publication.
Echt A, Shulman S, Colinet J, Goodman G [2004]. Results of a pilot study of dust control technology for asphalt milling, at Payne & Dolan, Inc., U.S. route 12 project, Wisconsin, October 7 through 9, 2003. Cincinnati, OH: U.S. Department of Health
and Human Services, Public Health Service, Centers for Disease Control and Prevention, National Institute for Occupational Safety and Health. Report No. EPHB
282-11b.
Echt A, Garcia A, Shulman S, Colinet J, Cecala A, Carlo RV, Zimmer J [2007].
In-depth survey of dust control technology for asphalt milling, at Northeast Asphalt, Inc., state routes 22 and 64 projects, Wisconsin, July 13 through 15, 2004.
Cincinnati, OH: U.S. Department of Health and Human Services, Public Health Service, Centers for Disease Control and Prevention, National Institute for Occupational Safety and Health. Report No. EPHB 282-12a.
Glindmeyer HW, Hammad YY [1988]. Contributing factors to sandblasters' silicosis: inadequate respiratory protection equipment and standards. J Occup Med
30(12):917–921.

EPHB Report No. 282-17a
Page 46
Hornung R, Reed L [1990]. Estimation of average concentration in the presence of nondetectable values. Appl Occup Environ Hyg 5(1):46–51.
Linch KD [2002]. Respirable concrete dust – silicosis hazard in the construction
industry. Appl Occup Environ Hyg 17(3):209–221.
NIOSH [1994]. NIOSH manual of analytical methods. 4th rev. ed., Eller PM, ed.
Cincinnati, OH: U.S. Department of Health and Human Services, Public Health Service, Centers for Disease Control and Prevention, National Institute for
Occupational Safety and Health. DHHS (NIOSH) Publication No. 94-113.
NIOSH [2000]. Respirable crystalline silica exposures during tuck pointing.
Cincinnati, OH: U.S. Department of Health and Human Services, Public Health Service, Centers for Disease Control and Prevention, National Institute for Occupational Safety and Health. DHHS (NIOSH) Publication No. 2000-113.
NIOSH [2002]. NIOSH hazard review: health effects of occupational exposure to
respirable crystalline silica. Cincinnati, OH: U.S. Department of Health and Human Services, Centers for Disease Control and Prevention, National Institute for Occupational Safety and Health. DHHS (NIOSH) Publication No. 2002-129.
OSHA [2008]. Directive number CPL 03-00-007: National Emphasis Program –
Crystalline silica. Effective date January 24, 2008.
[http://www.osha.gov/OshDoc/Directive_pdf/CPL_03-00-007.pdf accessed on
April 1, 2009]
Public Works [1995]. Pavement recycling. Public Works 126: April 15, 1995.
Rappaport SM, Goldberg M, Susi P, Herrick RF [2003]. Excessive exposure to silica
in the U.S. construction industry. Ann Occup Hyg 47(2):111–122.
Thorpe A, Ritchie AS, Gibson MJ, Brown RC [1999]. Measurements of the
effectiveness of dust control on cut-off saws used in the construction industry. Ann Occup Hyg 43(7):443–456.
Valiante DJ, Schill DP, Rosenman KD, Socie E [2004]. Highway repair: a new silicosis threat. Am J Public Health 94(5):876–880
EPHB Report No. 282-17a
Page 47
Figure 1. Diagram of typical pavement-milling machine showing 10 area air-sampling locations. ( Front of machine is to the left.)
Figure 2. Manufacturer B, Configuration B2: Cross-sectional diagram of
inside the cutter housing, showing location and orientation relative to cutter drum of typical water-spray nozzle at upper rear of housing. (Front of machine is to the right.)

EPHB Report No. 282-17a
Page 48
Figure 3. Manufacturer B, Configuration B2: Cross-sectional diagram of inside the primary-conveyor area at cutter-housing discharge, showing
location and orientation relative to discharge of water-spray nozzle above conveyor. (Front of machine is to the right.)
Figure 4. Manufacturer B, Configuration B2: Plan view from above showing conveyor transition area with location and orientation of water-
spray nozzles. (Front of machine to right.)

EPHB Report No. 282-17a
Page 49
Figure 5. Manufacturer D: Plan view from above (at top) and side elevation (center) of milling machine (see Figure 6 for remainder of
secondary-conveyor boom at front of machine), with cutaway diagram of primary-conveyor assembly (at bottom), together showing locations of
lower-conveyor transition water-spray nozzles and LEV-system takeoff from side of lower-conveyor enclosure near cutter-housing discharge. (Front of machine is to the right.)
EPHB Report No. 282-17-a
Page 50
Figure 6. Manufacturer D: Spray location at upper conveyor and LEV exhaust dump point. Plan view from above (at top) and side elevation (at
bottom) of secondary-conveyor boom at front of milling machine (see Figure 5 for remainder of machine), showing locations of upper-conveyor
water-spray nozzles and LEV-system discharge into top of upper-conveyor enclosure near point of material discharge into dump truck. (Front of machine is to the right.)
EPHB Report No. 282-17a
Page 51
Figure 7. Manufacturer D: Prototype LEV system as installed on milling machine. (Front of machine is to the right.)
Figure 8. Manufacturer D: Cross-sectional diagram of inside the cutter housing, showing location and orientation relative to cutter drum of typical
water-spray nozzle at upper rear of housing. (Front of machine is to the right.)

EPHB Report No. 282-17a
Page 52
Appendix
Wind speed and direction data

EPHB Report No. 282-17a
Page 53
Table A-1. Wind speed and direction, by milling trial. Note weather data were not recorded for Machine E due to weather station equipment
malfunction. Date Configuration Set Wind
speed, mph
Wind direction
in degrees
Wind direction, relative to side
of machine
Predominant side of machine for highest dust concentrations
(Left=L, Right=R)
6/23/2008 A1 1 7.3 298 Front L R (except operator,L)
6/23/2008 A2 1 7.4 294 Front L R (except operator,L)
6/23/2008 A3 1 8.3 296 Front L R (except operator,L)
6/23/2008 A1 2 8 311 Front L R (except operator,L)
6/23/2008 A2 2 8.7 318 Front L R (except operator,L)
6/23/2008 A3 2 8.2 315 Front L R (except operator,L)
6/23/2008 B1 1 7.1 303 Front L R
6/23/2008 B2 1 7.7 324 Front L R
6/23/2008 B3 1 7.6 307 Front L R
6/23/2008 B4 1 8 333 Front L R
6/23/2008 B1 2 7.4 329 Front L R
6/23/2008 B2 2 7.9 321 Front L R
6/23/2008 B3 2 Front L R
6/23/2008 B4 2 8.7 338 Front L R
6/24/2008 A1 3 6 166 Rear R L
6/24/2008 A2 3 5.4 134 Rear R L
6/24/2008 A3 3 6.4 160 Rear R L
6/24/2008 A1 4 6.5 136 Rear R L
6/24/2008 A2 4 7.1 128 Rear R L
6/24/2008 A3 4 6.7 136 Rear R L
6/24/2008 A1 5 4.7 128 Rear R L
6/24/2008 A2 5 8.4 186 Rear R L
6/24/2008 A3 5 6 132 Rear R L
6/24/2008 A1 6 11.6 155 Rear R L
6/24/2008 A2 6 6.3 139 Rear R L
6/24/2008 A3 6 11.2 133 Rear R L
6/24/2008 A1 7 10.9 134 Rear R L
6/24/2008 A2 7 11 128 Rear R L
6/24/2008 A3 7 11.6 141 Rear R L
6/24/2008 A1 8 10.3 130 Rear R L
6/24/2008 A2 8 12.6 134 Rear R L
6/24/2008 A3 8 12.9 129 Rear R L
6/24/2008 B1 3 6.9 153 Rear R Neither
6/24/2008 B2 3 8.6 146 Rear R L
6/24/2008 B3 3 3.5 152 Rear R L
6/24/2008 B4 3 3.4 188 Rear L L
6/24/2008 B1 4 7.9 138 Rear R L
6/24/2008 B2 4 6.4 151 Rear R L
6/24/2008 B3 4 10.6 185 Rear L L
6/24/2008 B4 4 7.2 165 Rear R L

EPHB Report No. 282-17a
Page 54
Date Configuration Set Wind
speed, mph
Wind
direction in degrees
Wind direction,
relative to side of machine
Predominant side of
machine for highest dust concentrations
(Left=L, Right=R)
6/24/2008 B1 5 9.8 150 Rear R L
6/24/2008 B2 5 10 152 Rear R L
6/24/2008 B3 5 10.5 134 Rear R L
6/24/2008 B4 5 8.1 131 Rear R L
6/24/2008 B1 6 10.2 154 Rear R L
6/24/2008 B2 6 10.3 146 Rear R L
6/24/2008 B3 6 11.7 134 Rear R L
6/24/2008 B4 6 12 159 Rear R L
6/24/2008 B2 7 11.8 144 Rear R L
6/24/2008 B3 7 12.5 166 Rear R L
9/16/2008 D2 1 6.6 171.4 Rear R
9/16/2008 D1 1 7.2 189.8 Rear R
9/16/2008 D3 1 7.6 175.6 Rear R
9/16/2008 D4 1 10.3 166.5 Rear R
9/16/2008 D4 2 8.8 160.2 Rear R
9/16/2008 D3 2 9.8 144.1 Rear R
9/16/2008 D2 2 10.3 178.1 Rear R
9/16/2008 D1 2 11.2 182.3 Rear
9/16/2008 D1 3 13.4 210.9 Rear L
9/16/2008 D3 3 13.3 228.0 Rear L
9/16/2008 D2 3 12.0 196.3 Rear L
9/16/2008 D4 3 12.6 211.9 Rear L
9/17/2008 D2 4 4.1 107.1 Right
9/17/2008 D3 4 3.2 99.1 Right
9/17/2008 D1 4 3.5 113.6 Right
9/17/2008 D1 5 4.6 140.6 Rear R
9/17/2008 D3 5 3.8 124.4 Right
9/17/2008 D4 5 5.8 115.0 Right
9/17/2008 D3 6 4.0 164.0 Rear R
9/17/2008 D2 6 3.8 81.1 Right
9/17/2008 D4 6 4.7 158.7 Rear R
9/17/2008 D4 7 5.6 194.7 Rear
9/17/2008 D2 7 8.1 240.9 Rear L
9/17/2008 D1 7 7.8 208.3 Rear L
9/17/2008 D3 8 6.1 298.5 Left
9/17/2008 D2 8 7.8 308.7 Front L
9/17/2008 D1 8 6.6 314.0 Front L
9/17/2008 D4 8 6.6 323.9 Front L
9/17/2008 D2 9 6.8 292.7 Left
9/17/2008 D4 9 9.0 244.0 Left
9/17/2008 D1 9 7.1 259.8 Left
9/17/2008 D3 9 7.8 289.8 Left

EPHB Report No. 282-17a
Page 55
Delivering on the Nation’s promise:
Safety and health at work for all people
through research and prevention.
To receive NIOSH documents or other information about
occupational safety and health topics, contact NIOSH at
1-800-CDC-INFO (1-800-232-4636)
TTY: 1-888-232-6348
E-mail: [email protected]
or visit the NIOSH Web site at www.cdc.gov/niosh
For a monthly update on news at NIOSH, subscribe to NIOSH eNews by visiting www.cdc.gov/niosh/eNews
SAFER ● HEALTHIER ● PEOPLE