in-flight rain damage tests of the shuttle thermal protection system
TRANSCRIPT

c 1
NASA Technical Memorandum 100438
In-Flight Rain Damage Tests of the Shuttle Thermal Protection System Robert R. Meyer, Jr. and Jack Barneburg
[ NAS A-TH- 1004 38) IN-FLIGHT- RAIN DAH A G E T G T S OF THE SHUTTLE THERBAL PPOTECTICN
N 38-2 1241
SYSTEB (NASA) 16 p CSCL L 2 U Unclas
G3/18 0 137317
.
National Aeronautics and Space Administ rat ion
https://ntrs.nasa.gov/search.jsp?R=19880011857 2018-02-18T06:33:56+00:00Z
NASA Technical Memorandum 100438
*
In-flight Rain Damage Tests of the Shuttle Thermal Protection System Robert R. Meyer, Jr. Ames Research Center, Dryden Flight Research Facility, Edwards, California
Jack Barneburg Johnson Space Center, Houston, Texas
1988 ?
4
National Aeronautics and Space Administration Ames Rosearch Center Dryden Flight Research Facility Edwards, California 93523 - 5000
IN-FLIGHT RAIN DAMAGE TESTS OF THE SHUTTLE THERMAL PROTECTION SYSTEM
Robert R. Meyer, Jr. NASA Ames Research Center
Dryden Flight Research Facility Edwards, California
and
Jack Barneburg NASA Johnson Space Center
IIouston, Texas
Abstract
NASA conducted in-flight rain damage tests of the Shuttle thermal protection system (TPS). The niajor- ity of the tests were conducted on an F-104 aircraft at the Dryden Flight Research Facility of NASA’s Arnes Research Center, although some tests were conducted by the National Oceanographic and Atmospheric Ad- ministration (NOAA) on a WP-3D aircraft off the eastern coast of southern Florida. Tlie thermal pro- tection system components tested included LI900 and LI2200 tilcs, advanced flexible reusable surface insula- tion (AFRSI), reiiiforced carbon carbon (RCC), and an advanced tufi tile. The objective of the test was to de- fine the damage threshold of various thermal protection materials during flight through rain. Tlie test hard- ware, test technique, and results from both the F-104 and WP-3D aircraft are described. Results have shown that dainage can occur to the Shuttle TPS during flight i n raiii.
Introduction
Space Sliuttle launch arid landing operations at present arc restricted due to weather constraints. One of the constraints is potential damage to the orbiters’ tliermal piotection system (TPS) while flying through rain or clouds (Fig. 1). Launch TPS damage could coinproniise safely during entry, and launch or land- ing TPS damage would require postflight TPS repair, resulting i n schedule and cost impacts. These weatlier- related restrictions are of concern priinarily for me- teorological coiicli tions cornmonly experienced at the I<eniietly Space Cciitm (I<SC). Consequently, NASA is engaged in a flight test program to define the Shuttle TPS daiiiage tliresliold for flight through rain or clouds ill ternis of speed, droplet size, and other weather r e lated eiiviionmental factors.
?
Tlie test, prograni was the primary responsibility of the NASA Johnson Space Center (JSC). NASA JSC re-
quested tlie Dryden Flight Research Facility of NASA’s Ames Research Center (Ames-Dryden) at Edwards, California to perform tlie majority of the tests on an instrumented NASA-Lockheed F-104 aircraft in both a USAF KC-135 water spray tanker generated mois- ture environment and actual cloud-rain conditions. NASA JSC has also requested the National Oceano- graphic and Atmospheric Administration (NOAA) Of- fice of Flight Operations in Miami, Florida to conduct tests on an instrumented NOAA-Lockheed WP-3D air- craft in a natural cloud-rain environment. Both air- craft were equipped with raindrop-size-measuring in- struments. Distinct features of tlie aircraft are cloud radars carried by tlie WP-3D and tlie greater speed and altitude capability of tlie F-104 airplane.
The test liardwa.re, test techniques, and results from both aircraft, with primary emphasis on the NASA Ames-Dryden F-104 activity, are described in this re- port. Limited comparisons have been made to previous ground-based test results. In-flight rain damage of an advanced TPS tile, hereafter referred to as a “tufi” tile, has also been included.
Descriptio11 of Test Aircraft and Test Hardware
F-104 Aircraf t
Shuttle TPS coupons were mounted on the nosecap of a flight test fixture (FTF) carried beneath an in- strumented F-104 aircraft (Fig. 2). The F-104 airplane was capable of test airspeeds of 250 to 550 knots indi- cated airspeed (ICIAS) or 1.5 Mach witli this test hard- ware installed.
The test coupons were composed of 2 by G in. pieces of TPS material mounted “fixed” a t 90°, G O O , 30° , and 15O and an 8 by 8 in. piece mounted at 0’ to the free- stream flow (Fig. 3). Although not shown in Fig. 3, two 30’ mounting locations were available, one on tlie left side (as shown in the figure) and one (not shown) on
1

the right side of the fixture. The tile test coupons were flush with the surrounding test fixture surface when mounted in the test fixture.
Instrumentation consisted primarily of a particle measurement probe, airdata probes, and video cam- era (Fig. 2). The particle measurement probe op- tically detected and measured particle size, distribu- tion, and concentration. The device used on tlie F-104 aircraft was a one-dimensional optical array droplet probe (model PMS OAP-2GOY) capable of detecting particles between 0.050 to 3.000 mm with a resolu- tion of 0.050 mm. Airdata were determined from two sources - one was a probe mounted on the lower lead- ing edge of the TPS flight test fixture, and the other was the pilot's standard airspeed system. Two video cameras were used to determine when damage occurred to the various TPS test coupons. One video camera was mounted on the lower forward fuselage providing aft viewing of tlie forward portion of tlie flight test fix- ture. This camera provided coverage of the 90°, 60°, and two 30' TPS test samples. Another video caniera was mounted on a left wing pylon and provided a view of the left side of the flight test fixture. This camera primarily viewed the 15' and 0' TPS test samples.
WP-3D Aircraft
Shuttle TPS test coupons were mounted on a pylon underneath the right wing of tlie NOAA WP-3D air- craft (Fig. 4). The WP-3D weather research aircraft obtained rain impact data for airspeeds between 180 aiid 260 MAS.
Test samples were mounted on two movable doors contained within both the left and right sides of the test fixture, for a total of four doors (Fig. 5). These doors could be opened or closed in-flight to angles of Oo, 15O, 30°, 45O, or GOo to the free-stream flow.
Instrumentation consisted of onboard weather radars, particle size measuring devices, and video cam- eras. The weather radars consisted of a C-band 5 cm belly-mounted radar, an X-band 3 cm tail-mounted Doppler radar, and a C-band nose-mounted naviga- tion weather radar. There were three particle niea- surement devices mounted under the left wing of tlie aircraft (Fig. 6): a one-dimeiisional forward scattering spectrometer probe that detects particle sizes betwcen 0.03 to 0.45 mm, a two-dimensional optical array cloud droplet imaging probe that detects particle sizes be- tween 0.05 to 1 . G mm, and a two-dimensional optical array precipitation imaging probe that detects particle sizes between 0.2 to G.4 nim. Each of the three probes recorded data during the flights, but only t,he latter two were used for data reduction during these Iliglils. A video camera was mounted forward of the test fis- ture (Fig. 5b) and recorded test article damage during the flights. Airdata were determined from an airtlnt;i probe mounted on the left wiiig.
TPS Test Articles
Standard LIOOO and L12200 tiles, reinforced carbon carbon (RCC) aiicl advanced flexible reusable surhcc insulation (AFRS1) quilt materials'-4 were flown dur- ing these tests. On one F-104 flight, a toughened uni- piece fibrous insulation tile,5 or a so-called "tufi" tile was flowu.
The F-104 tile test coupons coiisisted priniarily of 2 by G in. pieces cut from G by 6 in. tilcs. The 2 by G in. LI900 test coupons were cut from flight worthy G by 6 in. tiles, saving the two edge pieces aiid discarding the centerpiece. The cut edge was treated using a stan- dard TPS repair, and tlie cut edge was iiistallcd facing aft in the test fixture. The 2 by G in. L12200 and tuli tile were specifically constructed for tlicse tests. rl'lie tiles were bonded to an aluminum plate using a strain isolation pad (standard sliuttle installation) iiiccliani- cally attached to the test fixture. Exrtinples of L l O O O and L12200 tiles prior to testing are sliown in Fig. 7.
The WP-3D test coupons consisted of G by G in . LI900 and L12200 tiles and flexible reusable surface in- sulation (FltSI) aiid AFRSI bonded in a similar man- ner to tlie F-104 test coupons. Oiily results from the L1900 tiles are presented in this report.
Test Approach
0
+
Tests were coiiducted i n a natural rain and clouds environment and atternptetl i n ail artificially geiicr- ated rain eiiviroiiiiicnt froin a USAF liC-135 \vot,cr spray tanker.
Spray Taiikcr
Tests in moisture generated by a USAI' ICC-135 wa- ter spray tanker with an uiicalibrnted rain nozzle were attempted using oiily the F-104 aircraft a t speeds froni 250 to 350 KIAS. The t,aiiker was flown at pretleter- mined speeds, nlt,itudes, and water flow rates. \Vater spray from a nozzle was directed at the tile test art,icles mounted beneath the F-104 aircraft (Fig. 8).
Natural R a i n
Tests were conducted using both tlie F-104 aiid WP- 3D aircrafl in natural raiii, altlioiigli different tecli- niques were used finding and enteriug the rain.
Tlie F-104 tcsts were conducted withiii Edwards A i r Force Uasc, Califorilia test areas at speeds froin 250 to 550 KIAS ant1 altitudes generally I)etwecn 11000 to 8000 Et. The tests were iiorinally conducted i i i tlie win- ter months and rain was generally encountered OH the leeward side of tlic soulhern Sierra Nevada mountains.
Rain \ v a s locatcd visually by the aircraft pilot ant1 a racet.rack pattern was establislietl (Fig. 9) wlicre tJie aircraft was flown through the rain at increasing slweds, generally at 25 KIAS increments. Tlie race- t r i d pattern WrW flow11 until tlie clcsiretl TPS coupoli
2

8
failures had occurred or a maximum test speed of 550 KIAS was achieved.
The WP-3D tests were conducted off the eastern coast of southern Florida. The tests were nornially con- ducted in maritime tropical rain at speeds from 180 to 260 knots. The altitiides were gciierally just below the base of tlie rain cloud between 1500 and 2000 ft. Some tests were conducted through tlie middle and top of tlie rain cloud between 5000 and 10,000 ft.
Rain was located using tlie previously dcscribcd on- board weather radars. Tlie TPS coupons were ex- tended at tlie previously described angles from the test fixture before entering the rain areas. Once a partic- ular test coupon failed, it was retracted into tlie test fixture, and tlie other coupons continued to be exposed.
For both tlie F-104 and WP-3D aircraft, tlie TPS failures were noted using tlie onboard video cameras and docunicnted as a function of particle size and velocity.
Naturad Clouds
Limited tests were conducted in low-altitude cu- mulus and higli-cirrus clouds at Edwards AFB using only tlie F-104 aircraft at speeds up t o 550 KIAS or 1.5 Mach, respectively.
Test Results and Discussion
In-flight evaluation of tlie F-104 particle measure- ment probe, results of flight through natural rain and clouds wit l i various TPS, and flight behind the USAF IiC-135 water spray tanker are discussed.
Particlc Measurcnicnt Probe Eviilu- d t’ 1011
A major concern a t the onsct of tliis test program was tlie accuracy of tlie particle nieasuremcnt probe in a high-speed flight environment, particularly since lhe probe was used at speeds liiglier than i t was de- signed for. Evaluation of the probe was made for two environments with the F-104 aircraft. One evaluation test was conducted i n natural rain and tlie other was in natural clouds.
After natural rain flights, TPS tiles eroded by rain often esliibited small holes in the soft substrate of the tile (Fig. 10). A method of evaluation was to corre- late tlie iesulting postfliglit tile substrate hole diame- ter with particle diameters obtained from tlie particle iiieiLSurcnicnts probe a t the time tlie damage occurred. Tlic in;isimuin liole dinineter measured from tlic tile i i i Fig. 10 (postflight) was betwecii 2.5 to 3.0 mm, colnparcd to a maxiiiiuni rccordetl particle diameter of 2.7 i i i i i i measured ill real time by tlie particle mea- surement probe. This close agreement between the two inctliods increased tlie confidence that the parti- cle nieasiirement probe provided accurate results in a natural rain environment.
During flight in natural clouds, a comparison of a difrerent sort was made. In this case, a series of cali- bration runs were niatle at increasing speeds through a nonprecipitating cloud that did not change visually. The evaluation in tliis case was to compare the out- put from the particle measurement probe at different speeds in a relatively constant cloud. A comparison of the raw count histogram from 275 and 550 KIAS runs through the cloud is showii in Fig. 11. The figure clearly shows a marked difference in tlie distribution and maximum particle size a t the two speeds through tlie cloud. For example, a t 275 KIAS tlie maximum particle size wits about 0.7 mm, while at 550 KIAS the maximum indicated particle size was about 2.0 mm. These differences were believed to be much too large to be accounted for by changes in tlie cloud character with time and are thought to be attributable to problems as- sociated with the probe’s ability to accurately measure or process tlie extremely large number of particles en- countered in clouds at high speeds. Consequently, par- ticle measurement probe results from nonprecipitatiiig clouds will not, be presented in tliis report.
Natural Rain
Flights through rain with both the F-104 and WP- 3D aircraft resulted in damage and erosion to tlie TPS tiles. The damage to tlie TPS tiles started as “star” cracks in tlie black face coat of the tile and were normally not visible from tlie onboard video cameras but were sometimes noted during postflight inspection. The next definable level of damage was scaring of the tiles, where pits were formed in the TPS tile, penetrat- ing the black face coat and exposing tlie white sub- strate of tlie tile. The last definable level of damage was major erosion of tlie tile substrate. Examples of tliese three stages of damage are shown in Fig. 12. The pitting and erosion of tlie tiles were normally visible in real time with the onboard video cameras. In this paper, tile damage threshold is defined as pitting of tlic surface.
Tlie tile damage data are plotted in terms of velocity and drop diameter on Figs. 13 to 18, which have lilies of constant kinetic energy shown for reference in later discussions. The 0.000 ft-lb energy line represents an empirically derived surface fracture energy for failure from an impact with a solid, such as a metal sphere, at 00’ to the surface. Tlie 0.08 ft-lb energy line is shown for reference.
Figures 13 and 14 present results of tlie LI900 and LI2200 tile fliglits through rain. The figures present tlie velocity and maximum raindrop diameter (detected by the particle measurement probe) fcr damage threshold or pitting of the surface. Tlie F-104 aircraft results are summarized in Table 1 , and tlie WP-3D results are summarized in Table 2.
3

For tlie WP-3D results, summarized in Table 2, data are presented for both failure or pitting as well as no occurrence of damage or no failure. The no failure data were presented because of uncertainties in defining the damage threshold for tlie WP-3D data.
The WP-3D results were obtained from a maritime tropical rain, where the in-flight rain intensity usually changed rapidly and the tiles often failed in an over- whelming manner, resulting in damage from a broad range of drop diameters extending well beyond the damage threshold. The F-104 results were obtained in a relatively stable environment where raindrop di- ameter did not tend to change rapidly. Consequently, the determination of pitting or damage threshold from the F-104 tests was obtained with a high degree of con- fidence, but tlie WP-3D results were somewhat uncer- tain. An indicator of this uncertainty is the difference between the no failure and failure columns of Table 2. For example, the used LI900 tile at 30' and 117 fps had no failure a t 2.6 nun but failed at 2.8 mm, in- dicating a high degree of confidence in determination of the failure threshold. Another example is the new LI2200 tile at 60' and 378 fps, which had no failures at 2.4 and 3.0 mm, but failed at 4.6 and 5.6 mm, respec- tively, indicating a low degree of confidence because of the large difference in tlie no failure and failure par- ticle diameters.
For the LI900 tile, tlie damage threshold data indi- cate a higher failure energy for tlie large particle sizes and a lower failure energy for the small particle sizes relative to tlie 0.06 ft-lb reference energy line (the slope of the plotted failures is flatter than tlie O.OG ft-lb ref- erence energy line). This is particularly noticeable for the high incidence angles (Figs. 13c and 13d). The same trend seems to exist for tlie LI2200 tile, for an incidence angle of 60' (Fig. 14a); however, the change in energy with particle size does not seem as definite as with the LI900 tiles, especially for the 90' incidence angle (Fig. 14b). It is unclear whether this trend is due to the tile failure mechanism or lack of data points to accurately define the trend.
Figures 13b and 13c include data for tiles that were first flown or used on tlie orbiter Columbia for five mis- sions (five launches and entries) before being exposed to rain during F-104 aircraft flights. In both cases, the used tile failure data teiided to occur at tlie low edge of the scatter in the data, indicating that the used tilcs fail at a slightly lower energy than new or unused tiles.
The LI900 tile failure data for thc 90' test coupon from both flight and ground tests, along with t,he pre- viously discussed lines of constant energy, are shown in Fig. 15. Also included on the figure are published and unpublished single impact water drop failure data obtained from ground tests. The flight test results indi- cate for a particle > 2.0 mm a damage thresliold encrgy > 0.06 ft-lb, or a factor of tell more energy rcquirccl to
fail the tile than tlie O.OOG ft-11) surface fracture crite- ria. Extrapolation of tlie flight data to smaller particle sizes, < 1.0 mm, suggests that the test data may ap- proach the 0.006 ft-lb surface fracture criteria. This is the same data trend discussed earlier (Figs. 13c, 13d, and 14a). The flight test data also indicate consid- erably higher failure energies than the single impact water drop ground tests.
The differences in damage threshold energy with par- ticle size between tlie O.OOG ft-lb surface fracture and the flight test rcsults are attributed to chaiigcs in the kinetic energy being transferred during iiiipact with particle size aiid speed. Tlie 0.006 ft-11) siirfxe frac- ture is based on results from tlie kinetic eiicrgy of a solid-solid impact (solid particle impacting a solid sur- face at 90' to tlie surface). Tlie flight and grouiid tcst water droplet impact damage threshold rcsults arc, from a liquid-solid impact (liquid particle impacting a solid surface). Tlie data presented in Fig. 15 indicate that the Itinetic energy transfer of the large particle-slow- speed water drop impact is much less tliaii a solitl-solid impact, wliile the small particle size-liigh-spccd water drop impact approach tlie solid-solid impact.
The differences bctweeii the singlc impact water drop ground tests and flight tests are not understood at, this time.
Tlie LI2200 tile damage tliresliold data at 90' and one data point from the so-called tuf tile5 arc shown in Fig. 16. Also iiicluded are publishedG ant1 tinpub- lislied single impact watcr drop failure data obtaiiiecl from ground tests. The data for the LI2200 tile intli- cate closer agrecinent between the unpublished ground and flight test results than for the LI900 tile results, although the published ground tests are still consider- ably lower.
The tufi tile shows a significant improvcinent over the existing LI2200 tile. The damage to the tufi tile was different tliaii tlie previously described damage to LI900 and LI2200 tile. The face coat on tlie tufi tile is considerably tliicker than either the 1,1900 or the L12200 tile. Tlie data point for tlie tufi tile reprcaents pitting of tlie face coat only and does not rcprescnt, exposure of tlie wliite substrate under the face coat.
No damage occurred to either the TPS tile or quilt materials mounted a t 0' to tlie free-stream flow, or to the RCC material mounted 90° to the frce-stream flow. The maxiniuni coiidition that tlie respective niatcrials were exposed to without damage is shown in Table 3.
Natiwal Clouds
No damitge occiirrctl to any TPS (tile or quilt) ins-
terials during flight in nonprecipitating clouds. This included thick higli-cirrus clouds at speeds up to 1.5 h4ach number or cumulus clouds at speeds up to 550 MAS. Tlie Iiigli-cirrus clouds are believed to have
4

been composed of small liquid drops rather than large ice crystah.
Spray Taiiker
Tests were conducted behind the USAF KC-135 spray tanker using tlie rain nozzle at a maximum flow rate of 55 gal/min and 350 KIAS. For this test L1900 TPS tiles were installed in all positions of the test fix- ture. No TPS damage occurred from these flights. I t was believed tliat the spray tankcr did not correctly sirriulate natural rain impact damage, and the tecli- nique was discontinued.
The visual observations froin tlie flight crews during the spray taiikcr tests indicated that the spray eniit- ted by the tanker rain nozzle was more of a mist tlian rain. The observations were confirmed by the parti- cle measuremelit probe output from a typical spray tanker test. Tlie particle distribution was similar to a cloud distribution shown in Fig. 11. As previously dis- cussed, data from the particle measurement probe in a cloud witli small particle size and high particle count were not considered reliable. Consequently, the parti- cle measurement probe data during the spray tanker test points also were not considered reliable.
Because TI’S tile damage did not occur from spray tanker flights but did occur in natural rain, an inference can be made as to tlie maximum effective particle im- pact that could possibly exist in the spray tanker mist. The maximum speed of the tanker tests was 350 I<IAS a t an altitude of 11,700 ft, representing approximately 650 fps. Comparing the damage threshold of Fig. 13d (LI9OO tile at 90’) a t 650 fps indicates a particle size of approximately 1.7 mm. Thus it can be inferred tliat the maximum effective particle impact in the spray tanker mist was 1.7 nim or less.
L
S u iiiiiiary
The following is a sumniary of the test results to
1. A viable in-flight test tcclinique has been estab- lished for natural rain damage testing of TI’S mate- rials. 2. Various types of SliutLle TI’S have been tested to the raindrop moisture impact damage threshold. 3. Tlie USAF KC-135 spray tanker did not simulate natural rain impact damage and was dropped from subsequent tests. 4. Tiles exposed to several Iauiicli and landing cy- cles appear to fail a t lower impact energies than new tiles.
date:
5 . The impact energy for damage varies with rain- drop size. The damage requires higher energy for large raindrop diameter relative to small raindrop tl i ameters. G. The impact energy for tile damage was higher during these flight tests than from single impact ground tests.
7. An advanced tufi tile was flown to damage thresli- old and failed a t a significantly higher velocity than current LI2200 tiles. 8. Preliminary results indicate that launch or land- ing in light rain may be permissible without exten- sive tile damage; however, further testing and anal- ysis are required.
References
Korb, L.J.; Morant, C.A.; Calland, R.M.; and Thatcher, C.S.: “The Shuttle Orbiter Thermal Pro- tection Syst,ein.” Ceramic Bulletin, vol. G O , no. 11, NOV. 1981, pp. 1188-1193.
* Dotts, R.L.; Curry, D.M.; and Tillian, D.J.: “The Shuttle Orbiter Thermal Protection System Mate- rials, Designs, and Flight Performance Overview.” SAE Technical Paper Series 831118, July 1983.
Curry, D.M.; Scott, H.C.; and Webster, C.N.: “Ma- terial Characteristics of Space Shuttle Reinforced Carbon-Carbon .” 24th National Society for tlie Ad- vancement of Material and Process Engineering (SAMPE) Symposium, May 1979.
Sawko, P.M.: “Effect of Processing Treatments on Strength of Silica Thread for Quilted Ceramic In- sulation on Space Shuttle.” Society for the Advance- ment of Material a i i d Process Engineering Quarterly, vol. 16, no. 4, July 1985.
’ Leiser, Daniel; Churchward, Rex; Katvala, Victor; Stewart, David; and Aliza, Balter: “Advanced Porous Coating for Low Density Ceramic Insulation Materials.” Cerairiic Engineering and Science Pro- ceedings, vol. 8, no. 7-8, 1988.
Cooper, R.M.: Rain Impact Assessment of Advanced Thermal Protection System Materials, Phase I Test Results. Space Division, Air Force Systems Com- mand, SD-Tl3-85-61, Sept. 1985.
5

Table 1. - In-Flight Rain Damage Threshold for TPS Tile Test Coupons
Tile Angle, Particle Velocity, fps, - deg diameter, mm for pitting
Ll900 New New
New New Used Used New New New New New New New Used New Used
Used New New
New New New
LI2200 New New New New New New
New New New
‘rufi
15 2.1 2.7
30 1.5 1.55 2.0 2.2 2.2 2.2 2.2 2.3 2.3 2.5 2.7 2.7 2.75 2.9
60 1.7 1.9 2.4
90 1.75 1.25 2.4
60 1.7 1.75 1.9 1.95 2.2 2.3
90 1.5 1.9 2.05
90 2.2
795 740
722 860 710 565 625 670 780 700 720 680 650 500 550 610
550 660 550
590 800 550
700 670 660 645 540 550
690 495 455
793
c
6

Table 2. - WP-3D Aircraft In-Flight No Damage and Damage Results for TI'S Test Coupons
Particle Particle Tile Angle, diameter, mm, diameter, mm, Velocity, fps
no failures failures deg resulting in resulting in
LI900 New 30 3.6 3.8 309 Used 2.4 3.0 309 Used 2.0 2.8 417
New 45 2.6 3.6 309 New 2.6 3.2 393 Used 1 .6 4.2 309
New GO 2.4 3.8 309 New 2.6 4.6 309 New 2.6 3.2 393 New 2.2 4.2 446 Used 1.8 2.8 309 Used 2.4 2.0 417
LI2200 New 60 2.4 4.6 378 New 3.0 5.6 378
Table 3. - Maximum Coiiditions That TPS Test Coupons
Were Flown Without Damage
TI'S test Particle Velocity, coupons size, mm fps
ltCC at 90"
flow to free-stream 3.05 928.0
TI'S at 0'
flow to freestream 2.7 698.0
AFItSI a t 0" to free-stream 2.8 039.2
flow
7

108-I<SC-385C-3053/2 Fig. 1 Shut t le Columbia windscreen area t i le d a m a g e caused by r a i n dur ing f e r r y flight atop 7 4 7 carrier aircraft, at 250 KIAS and 15,uuu f t .
8241 Airdata p r o b e 1
9Qo facet
60° facetJ L30° facet
J
8242
Fig. s y s t e m on leading edge of f l i g h t t es t f ix ture.
3 Nosecap to hold t h e r m a l protect ion
EC-33378-027 5 8 6- 2 5 5 4 7 Fig. 2 In- f l ight p h o t o of F - l o 4 flight tes t f i x - ture u.sed for r a i n damage tes t s .
Fig. 4 N O A A WP-3D aircraf t w i t h tes t f i x - t u r e / p y l o n m o u n t e d on t h e lower surface of right wing t ip .
8
ORIGINAL PAGZ IS OE POOR QUALITY,

ORIrVTT?AC PAGE IS. OF POOR QUALIT3
(a) Forward v iew w i t h t e s t coupons extended a t 15O, 30°, 4 5 O , and GOO.
Fig. mounted on the W P - 3 0 left ,wing t i p p y l o ~ l . .
6 Three part ic le measurenaelzt p m b e s
( b ) Right-s ide V ~ C W .
Fhg. 5 N O A A W P - 3 D tes t f i z ture .
- ... flown on five missions on
Columbia
EC 8 5- 3 3 2 3 (i- 0 02 Fig. 7 Typical tiles p r i o r t o flight tes t in r n i n .
9
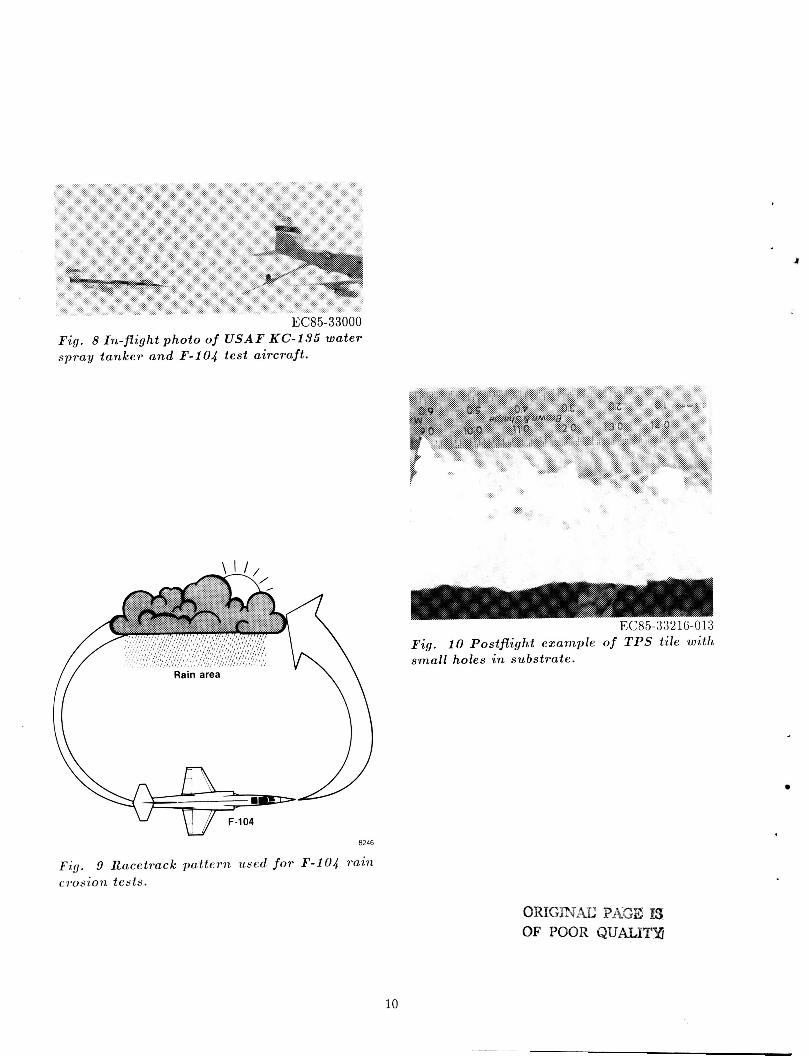
EC85-33000 Fig. 8 In-flight p h o t o of U S A F KC-135 w a t e r spray tanker and F-104 tes t a i rcraf t .
Fig. 10 Postf l ight example of T P S tile with small holes i n subs tra te .
8246
F i g . 9 Racetrack pa t t e rn used for F - l o 4 r a i n C l ~ O S i O l L t e s t s .
ORIGEJW: PAGE 93 OF POOR QUALIm
10

1000
400
200
Raw particle counts
I I I 0 1 2 3 4
8247 Size, mm
(a) 275 knots .
’OoO c
counts . *
8248 Size, mm
(b ) 550 knots .
Fig. 1 1 Part ic le count histogram f r o m a cloud measured b y particle measurement probe.
8249
ES8-0002-00 1 Fig. 12 Examples of the three definable stcr,qcss
of damage t o TPS LI900 t i les.
11

2ooo r 1500
Impact velocity, 1000
fPS
500
0 New tile, F-104 aircraft, pitting
2000
0 1 2 3 4 5 6 I 8?50
Particle size, mm
(a ) 15' to free-stream flow.
2000
1500
Impact
fPS velocity, 1000
500
0 New tile, F-104 aircraft, pitting Used tile, F-104 aircraft, pitting
0 New tile, WP-3D aircraft, pitting A Used tile, WP-3D aircraft, pitting r
0 1 2 3 4 5 6 Particle size, mm
8251
1500
Impact velocity, 1000
fPS
500
0
0 New tile, F-104 aircraft, pitting 1 Used tile, F-104 aircraft, pitting 0 New tile, WP-3D aircraft, pitting A Used tile, WP-3D aircraft, pitting r
0 New tile, F-104 aircraft, pitting 1 Used tile, F-104 aircraft, pitting 0 New tile, WP-3D aircraft, pitting A Used tile, WP-3D aircraft, pitting
L
0.06 ft-lb - reference energy line
-
-
I I I 1 I 1 2 3 4 5 6
0.06 ft-lb - reference energy line
-
-
I I I 1 I 1 2 3 4 5 6
Particle size, mm 8252
( c ) 600 to free-stream flow.
2ooor I 0 New tile, F-104
aircraft, pitting
1500
Impact velocity, 1000
fPS
500
0 1 2 3 4 5 6
8253 Particle size, mm
( b ) 300 to free-stream flow. ( d ) 900 to free-stream pow.
Fig. 13 In-flight exposure of LI900 tile to rain.
12

Impact velocity,
fPS
2ooo r 0 New tile, F-104
aircraft. pitting 0 New tile, WP-3D
aircraft, pitting
1500 -
1000 -
500 -
0 1 2 3 4 5 6
200(
150(
Impact
fPS velocity. 1000
500
0
Particle size, mm 8254
(a) GOO to free-stream flow.
0 New tile, F-104 aircraft, pitting
1 2 3 4 5 6 Particle size, mm
l1,’b.S
( b ) 900 to free-stream flow. Fig . T*ain.
I 4 In-flight exposure of LI2200 tile to
2000 0.06 ft-lb
reference energy line
empirical energy line
0.006 ft-lb
0 New tile, F-104
1500
aircraft flight test rain
Unpublished sin- velocity, 1000
Impact fPS t I \ gle impact water drop ground tests
Single impact water drop ground tests 6
500
\ 0 1 2 3 4 5 6
Particle size, mm 8256
Fig. 15 Damage threshold f o r LI900 tile f rom flight and ground tests mounted at 900 to f r e e - stream flow.
200(
150L
Impact velocity, 1000
fP0
500
0
0.06 ft-lb reference energy line
0 New tile, F-104 aircraft flight test rain
Tufi, F-104 flight test rain
Unpublished sin- gle impact water drop ground tests
A Single impact
1 2 3 4 5 6 Particle size, mm
8257
Fig. 16 Damage threshold for LI2200 tile f rom flight and ground tests and tufi mounted at 90° to free-stream f low.
13
Report Documentation Page I
1. Rqwrt No. 2. Govornmont AcurJon No. 3. Rocipiont’r Catalog No.
NASA 1”-100438 4. T i and Subtitlo 5. Roport Dato
In-Flight Rain Damage Tests of the Shuttle Thermal Protection System
7. Author(sl 8. Porforming Organizstion R ~ p o r t No.
Robert R. Meyer, Jr . and Jack Barneburg
19. Socurity Classif. (of this roportl 20. Socurii Classif. (of this PIQI) 21. NO. of paws
Unclassified Unclassifiecl 14
RTOP 505-61-41 9. Porforming Organization Nanw and Addrru 11. Contract or Grant No.
NASA Ames Research Center Dryden Flight Research Facilily P.O. Box 273, Edwards, CA 93523-5000 13. Typo of Roport and Pwod Covorod
12. Sponsoring Agoncy N m and Addnw Teclinical Memorandum
22. Price
A02
Nation a1 Aeronautics and Space Ad nii ii ist r at ion Washington, DC 2054G
14. Sponwring Agrncy Cod. b I
15. Supplomontary N o t r
Prepared for presentation as paper no. 88-2137 for tlie AIAA 4th Flight Test Conference, May 18-20, 1988, a t San Diego, California.
6. Abstract
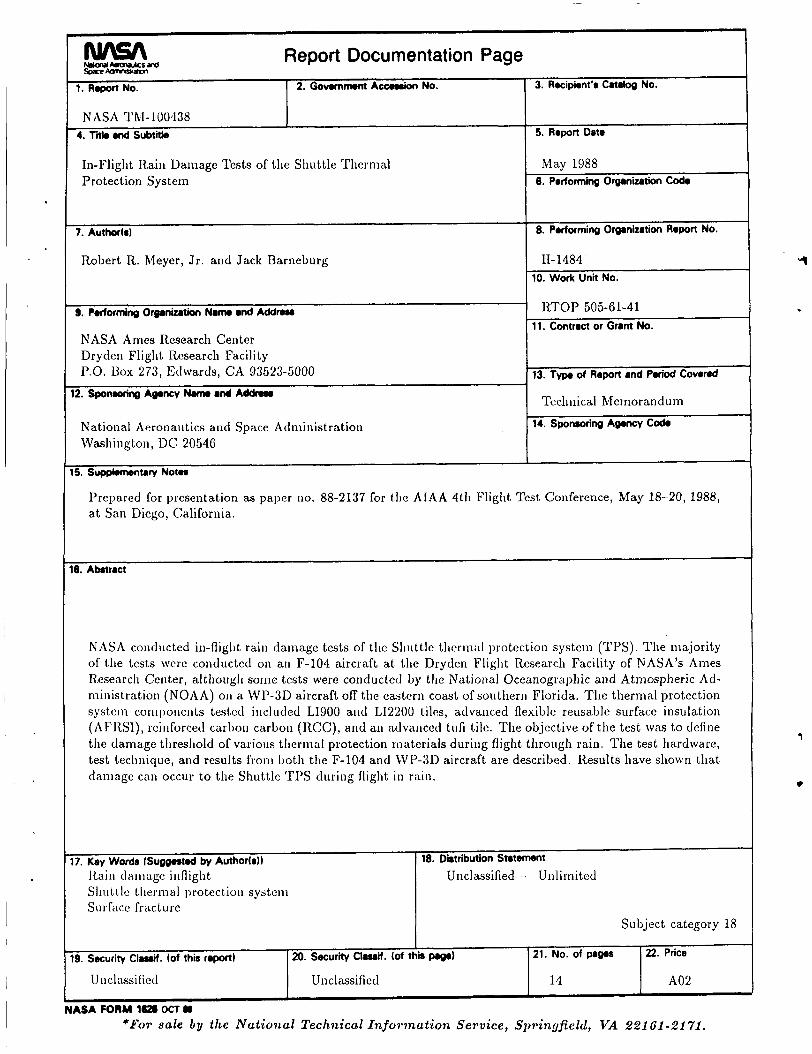
NASA conducted in-flight raiii damage tcsts of tlic Shuttle tlicr~nal protection systein (TPS). The majority of the tcsts wcrc concluctccl on an 17-104 aircraft a t the Dryden Flight Research Facility of NASA’s Anies Research Center, althougli some tcsts were conducted by the Nrttioiial Oceanographic and Atmospheric Ad- miiiistration (NOAA) on a WP-3D aircraft off the eastern coast of southern Florida. The thermal protection systciii compoiients t&cd iiicluded LIS00 and LI2200 tilrs, advanced flexible reusable surface insulation (AFRSI), reiiiforcetl car1)on carbon (ILCC), and an a(Ivaiicet1 tufi tile. The objcclive of the test was to define the damage tliresliold of various tlicrinal protection inaterials during flight througli rain. The test hardware, test technique, and results froni I)oth the F-104 and \.V1’-3D aircraft are described. Results have shown that damage can occur to the Shuttle TI’S during flight i n raiii.
17. Key Words ISuggestod by Authods)) I 18. Distribution StotemOnt Rain tl i i i II agc i i i flight Sliut,tlc lliermal protectmion system s urfacc fracture
Unclassified - Unliinitcd
Sullject category 18
1 I I !
NASA FORM i s a OCT a *For sale by the N a t i o n a l Technical Infomtatz‘on S e w i c e , Spi*ingj?eld, VA 221 01-21 71.