in- insight not whether to
TRANSCRIPT

collective in-
WINTER 2006 3
REGIONAL INVESTING is a subject on which everyone seems to have an opinion but not necessarily a
clearly thought out plan. Views remain highly divergent as to how to go about it, where to invest and, most conten-tious, whether investing internationally isn’t perhaps unpatriotic.
Let’s just explore that point. In a 10 February 2006 report in Business Day, Alex Pestana went boldly where few are prepared to follow by asking whether the notion of offshore investment could be regarded as unpatriotic. While the “overseas is best” mindset of years past still exists in some investment quarters, and must be changed, Pestana counters the suggestion that recent market per-formance demonstrates the opposite position – that it’s foolish to invest any-thing offshore. He sets out a number of reasons against SA-only investing:• First, he suggests that such a mindset
is the “financial equivalent of erect-ing a trade barrier” – increasing SA access to capital and decreasing the cost of such capital.
• Pestana said that economists strongly agree that a world without cross-border investment is a world of lim-ited investments, lower efficiency and lower growth. (As an aside, he observed that those who stand for a home bias often call for investment in their country by the outside world.)
• Reduced tariff barri-ers, combined with restricted capital flows, distort the ability of SA companies to compete fairly. “True patriots,” Pes-
tana wrote, “seek what is best for their citizens.” And what is best for the citizens of this country is the opportunity to invest a significant proportion of their assets outside of this country, encourag-ing foreigners in turn to
invest in the wealth and potential of SA.
Indeed, Herman Steyn, whose paper can be found on our website, estimates that the cost to SA investors of not being able to freely invest internationally has been between 1,5% and 2%/year if we regard the equity markets at only 70% to 100% over a 46-year period.
Still, while international allocations are currently limited to only 15% to 20% of our total portfolio the price of not get-ting it right can be significant.
The travesty is that few South Africans have a sensible and robust approach to investing offshore that stands the test of time and is flexible enough for adapta-tion to short-term change.
With that in mind we introduce our latest Collective Insight on “Internation-al Investing”. More than 27 submis-sions competed for the honour of being selected and we’re grateful to all who took the time to put finger to keyboard and send us their thoughts.
Given the quality of these submis-sions we felt investors would appreciate the fact that, even if a report didn’t make it into this issue, it would still be avail-able to all our readers on our website.
Starting with the basicsNorman McKechnie, of RMBAM, one of our website authors, provided the
clearest discussion on the basics of internation-al investing. As he says: Diversification is key – the last free lunch, as they say. Investing in any pair of assets whose perfor-mance is not completely correlated provides the opportunity for higher risk-adjusted return than investing in only one of these assets. So it is with SA and overseas. Country growth patterns aren’t perfectly synchro-nised and putting money in a number of different
ColleCtive insight
For e-mail, feedback and suggestions,please visit our website at
www.collectiveinsight.co.za
Not whether to invest outside SA but how?
4
1. Not whether to invest outside SA but how? 3
2. Should South African investors invest offshore? 4
3. Has an offshore investment exposure become superfluous? 8
4. Floating down the global river on an aardvark 10
5. Active management in a global economy 12
6. The changing sources of risk and return 16
7. Investing in broader Africa 16
8. Optimal strategy for offshore investing 19
9. International experiences by SA investors 22
Editor
Shaun Harris
CoNVENor
Anne Cabot-Alletzhauser CIO
AdvantageAssetManagers
EditoriAl AdViSory CommittEE
Charles Booth CIO
RMBAssetManagement
Prof dawie de Jongh Professor,CentreofBMI
UniversityofNorthwest
roland rousseau QuantitativeInvestmentStrategist
DeutscheSecurities
rob rusconi IndependentConsultant
michael Streatfield Strategist
InvestecAssetManagement
Armien tyer ExecutiveDirector
SanlamInvestmentManagement
michael Adsetts AssetConsultant
AlexanderForbes
Contents
ByROBRUSCONI
Independent Consultant
FinweekpublishesCollective Insighttri-annuallyonbehalfoftheSouthAfricaninvestmentcommunity.Theviewsexpressedhereindonotnecessarilyreflectthoseofthepublisher.Allrightsreserved.Nopartofthispublicationmaybereproducedortransmittedinanyformwithoutpriorpermissionofthepublisher.
YEAR SA EQUITY US EQUITY(%PA) (%PA)
1990 -5 -61991 31 351992 -2 171993 55 181994 23 31995 9 381996 9 541997 -5 361998 -10 531999 61 252000 0 112001 29 382002 -8 -452003 16 -32004 25 -72005 47 15CAGR 15,2 14,5

WINTER 20064
countries reduces portfolio risk.He goes on to illustrate the benefits
of diversification on the risk-return chart shown on p3. The figure illustrates the advantage of a diversified portfolio of asset classes, including international assets, over any one of the asset classes in isolation.
How much is invested offshore? He quotes a figure of between 32% and 35%, which we’re pleased to report isn’t far off the figures quoted by other authors, most of them close to the 30% mark.
We elected, though, to start our printed edition with a paper by Tom Joy, of RMB MultiMan-agers. Joy argues that:
Equity crises in a country are often accompanied by falling government bond prices, leav-ing little opportunity for asset class diversification in a local-only strategy.
Emerging market crises are unpredictable and are best pro-tected against through diversi-fied investment across coun-tries.
The SA market is small, resulting in concentration of risk across a small number of listed counters.
We follow that line of thinking
with an extract from a report submit-ted by Christo Luüs, chief economist at Absa Bank, which argues that these benefits of diversification outweigh the dreaded currency risk that’s often fore-most in investors’ minds.
Daniel Polakow, of Peregrine Secu-rities, provides a particularly provoca-tive perspective on the debate with his research that shows that “the majority of offshore movements and events are actually extremely well mirrored in the
local market”. Does that imply there’s no role for international? Read and find out.
The fact is, as Allan Slee, of Frank-lin Templeton, points out in a website report, the globalisation of financial markets is moving along with the glo-balisation of businesses. In 1970, the US accounted for two-thirds of world stock market capitalisation. By end-March 2006, the US share had fallen to 40%. Additionally, the number and size of
capital markets has expanded dramatically.
When emerging market guru Mark Mobius founded his first fund for Templeton in 1987,
there were six markets in which to invest: one in Latin America (Mexico) and five in Asia. At that time Mobius had US$100m to invest and he was considered the big boy on the block, since there were so few other funds dedi-cated to emerging markets.
Mobius is currently able to invest in 40 markets worldwide and has more than $30 000m to invest. The reason for that sea change has been the dramatic rise of privatisation and the adop-tion of market economy, even in authoritarian places like China. The change in thinking has been
ColleCt ive i ns igh t
3
4
INOURNEXTissueofCollective Insightwe’lladdressthetopicof“Investingunderfutureeconomicscenarios”.Whatstrategiesshouldinvestorsapplyinabearmarket?Inaloworhighinterestrateenvironment?Inperiodsofloworhighinflation?Inperiodsofglobaldisturbancesorwar?Howdoyoucopewithrebalancingduring volatile markets? Or cope during periods when marketsbecomehighlyilliquidorhighlyconcentrated?
Finally,how isourunderstandingabout investmentmanage-mentlikelytochangeinthefutureandhowwillthataffectinves-torsandinvestmentstrategies?
Authorsinterestedintacklingeitheroneoftheabovetopics–oratopictheyfeelisrelatedto“Investingunderfutureeconomicscenarios”–shouldsubmitarticles(approximately1200words,plusillustrations)toMatsholoMonyakaneatmatsholom@advan-tage.amnolaterthan13October2006.
Pleaserememberthisisaresearchpublicationand,assuch,isn’tinterestedinmarketcommentaryormarketingmaterials.n
in the next issue
Should South African investors invest offshore?
FOLLOWING THREE YEARS when the average rise in the South Afri-can equity market has been over
25% a year, it’s understandable that many optimistic investors are question-ing the benefits of investing offshore - especially when this strong perfor-mance from the domestic equity market has coincided with an appreciation of the rand, reducing the value of interna-tional investments in rand terms. Per-haps it’s worth reflecting on the words of the famous New York Times colum-nist Don Marquis:
“An optimist,” observed Archy the cockroach, “is a guy that has never had
much experience.” (Marquis 1934)The short-term nature of inves-
tors’ memories never ceases to amaze us. For us the question should not be whether to invest offshore but how much? Because South Africa remains an emerging market, offshore invest-ments provide diversification when it’s most needed, at times of crisis and market dislocation.
While there will always be return differentials over shorter-term periods between domestic and international equity markets, in the long-run, the dif-ferential in returns from South African equities compared to other markets is
unlikely to be significant. In their book Triumph of the Optimists1, London Busi-ness School professors Dimson, Marsh & Staunton showed that the annualised real return on South African equities between 1900 and 2000 has been 6,8%, compared to the US equity market real return of 6,7%. While South Africa deliv-ered one of the highest annual returns in their study, it was also one of the most volatile. A whole chapter in this book
ByTOMJOy
CEO, RMB MultiManagers
6

quite astounding and openings for investors have expanded accordingly.
Keeping with that theme of chang-ing global markets, Stephen Dean and Lisa Stanton, of global manager AXA Rosenberg, provide us with perhaps the most interesting insights into the chang-es taking place in global investing.
In fact, globalisation is pushing cross-country correlations upwards, reducing the benefits of diversification. Some suggest that the increase in correlations is temporary, an anomaly resulting from the rise and fall of technology shares worldwide. Our authors defend an alter-nate view, concluding that systemically higher correlations are here to stay but that that doesn’t rule out sensible off-shore investing.
They also describe the search for outperformance as focused on industry rather than country selection, defend their view that market efficiency isn’t on the increase and consider earnings to be the key driver of performance in global equity portfolios.
But if this issue has a centrefold it’s the report by Nothando Ndebele, of Renaissance Asset Managers. This personal and practical description into investing north of the Limpopo provides ample evidence of the opportunities on the continent. Did you know that Egypt
returned more than 100% in US dollar terms for the past two calendar years? She describes not only the benefits of investing in this high-growth part of the world but shares with us some of the pitfalls. Pension trustees shouldn’t for-get that the 15% offshore limit is extend-ed to 20% if the investment extends into Africa.
Having made the case for offshore diversification, we turn to Adrian Allardice and Sharon Wood’s dis-cussion on how to invest outside SA. Many of us treat offshore investing as an add-on, something that we should do – hopefully, something that provides us strong returns over the long term but not an integral part of the portfolio.
This report identifies the flaw in the approach, suggesting that it’s sub-opti-mal to separate SA from international in the portfolio-building process.
Finally, resident movie buff Michael Streatfield bookends a strong series of reports in a look back at South Afri-can investment habits and some timely warnings concerning the perils of off-shore investing. You may need to read it more than once! n

ColleCt ive i ns igh t
4
8
is dedicated to international investing, highlighting that despite strong empiri-cal evidence in favour of international diversification, equity portfolios around the world remain concentrated in their home markets.
Below we look at past emerging mar-ket crises and show how the only thing that rises during these periods is cor-relation. In almost all crises, equity mar-kets fall sharply, bond yields rise and currencies depreciate; at times of eco-nomic or political instability in emerg-ing markets, there’s no place to hide in domestic assets. In addition we look at the concentration of the SA equity market, highlighting the extent of stock specific risk and compare this to equity markets internationally; this provides a further argument in favour of inter-national exposure to achieve a more broadly diversified equity portfolio.
Past emerging market crisesAsset class correlations rise within emerging markets during periods of stress History tells us that emerging markets are prone to periods of economic and political turmoil, which have a devastat-ing effect on asset markets within the affected countries. Often these crises occur with little warning, making them notoriously difficult to forecast. While it would be extremely difficult to predict where the next emerging market cri-sis is likely to strike or whether South Africa is at risk, what’s not contro-versial are the consequences. Equity markets fall sharply, bond yields rise and the currency depreciates and any
investment offshore will rise sharply in local currency terms offering diversifi-cation benefits just at the time inves-
tors most need it. In recent years there have been three main crises; Asia in the mid-Nineties; the more general emerg-ing market crisis sparked by Russia in 1998; and Argentina in 2002. The table below shows the extent of the losses
in domestic assets suffered by local investors during these periods. It also shows the gains from a global balanced portfolio in the currency of the affected emerging country/countries and should serve as a reminder to any emerging country of the risks of a domestic-only investment policy.
The South African experience shows a similar picture. While SA has not experienced a genuine crisis on the same scale as those above, there have nevertheless been serious crises of con-fidence in the country in the past decade and it would be brave or foolhardy to predict that these will never recur.
Figure 1 shows the equity market, bond yields and the Rand/US dol-lar exchange rate since the begin-ning of 1997. We have highlighted three periods of stress; summer 1998 (Russian cri-sis), 2000 (global equity market weakness), fourth quarter 2001 (rand
weakness). For each period we show the dates used and the performance of each asset class. As with other emerg-
ing markets, at times of stress, the SA equity market falls, bond yields rise and the currency depreciates. The one exception was the 2001/2002 period when the equity market rallied while bonds and the currency fell sharply. During each of these periods a global balanced portfolio would have delivered positive returns in rand terms; returning 18,5%, 5,5% and 29,6% respectively. For interest we have also shown perfor-mance from April 2003 to highlight the extent of the recent run in South African financial markets.
South African equity market concen-trationAnother argument in favour of interna-tional diversification for SA investors is the size and concentration of the equity market. There are only 200 compa-nies in SA with a market capitalisation greater than $50m as at 31 May 2006; this compares to more than 14 000 in developed equity markets. Not only is the market small, it’s also highly con-centrated both in terms of individual stocks and sectors. Table 2 shows the percentage weight of different sectors in SA and global developed equity mar-kets. Almost 60% of the SA market is accounted for by two sectors – materials and financials. While the materials sec-tor has been one of the best perform-ing sectors globally in recent years, benefiting from the rise in commodities prices, this is unlikely to continue indefi-nitely. Hence investing internationally in equities would provide investors with a more balanced equity portfolio less exposed to sector themes that develop within markets.
Figure 2 shows the cumulative weight in the market for different numbers of stocks. The top 10 stocks account for over 45% of the South African market compared to 6,5% in global developed markets. This exposes investors in the SA equity market to significant stock specific risk. Memories of the Enron and WorldCom scandals highlight the devastating effect corporate fraud/bank-ruptcy can have on the share price of individual companies. While we are in no way suggesting this is likely to hap-pen in SA, it serves as a reminder that individual stocks, even large-cap stocks, can display a high degree of risk.
This risk would be more damaging
WINTER 20066
ASSET CLASS PERFORMANCE - PAST EMERGING MARKET CRISES>
REGION / EQUITY CHANGE IN CURRENCY GLOBAL COUNTRY MARKET BOND YIELDS VERSUS US BALANCED
(BPS) DOLLAR RETURN**Asia (Aug-Dec 1997)* -47% +295 -35% 119%Russia (Aug-Oct 1998) -62% +3 740 -63% 172%Argentina (Feb-Jun 2002) -42% +2 700 -47% 83%*Asia crisis – equities average of Taiwan, Korea, Thailand & Indonesia, bondsaverage of Thailand and Indonesia** Global balanced return – 60% global equity 40% global bond return in thecurrency of the emerging market in crisis
Source: Bloomberg, Lipper hindsight
SOUTH AFRICAN EQUITY MARKET, BONDYIELDS AND ZAR / USD EXCHANGE RATE
>
15
5
25
15
5
Bond
Yield
sZA
R/US
DEq
uity M
arke
t5000
15000
250001st May 98
to
11th Sep 98
-42,0%
-19,4%
25,4%
+731 +83 +172
-192
6,8%
162,5%
-7,0% -21,7%
-20,9%
21st Jan 00
to
14th Apr 00
2nd Nov 01 to4th Jan 02
25th Apr 03 to
9th Jun 06
Source: Bloomberg, data as at 9 June 2006 equity market - JSEall-share price index, bond market – generic 10-year
Government bond
Jan-97 Jan-00 Jan-03 Jan-06
Figure 1
table 1

for investors in a market that’s heavily concentrated in a few stocks, and South Africa is one of the most concentrated in the world.
Equity market concentration – South Africa compared to the rest of the worldIn our opinion investors advocating a 100% domestic only portfolio are focus-ing too much on recent market perfor-mance at the expense of longer-term historical evidence. They also ignore the structure of the SA equity mar-ket, which is highly concentrated from
both an industry and stock spe-cific perspective and therefore inherently more risky than a more broadly diversified equity portfolio.
Some investors may claim “it’s different this time” in an attempt to undermine the argu-ments above.
Our experience tells us that it’s rarely different and while we accept that by diversifying internationally investors might from time to time give up some short-term returns, the long-run
returns are unlikely to be significantly different. In addition, while SA has made huge strides in recent years, it remains – in financial market terms – an emerging market and by defi-nition prone to a relatively high level of political uncer-tainty and economic volatility
As shown by previous events, offshore investments offer protection during times when it’s most needed – cri-ses and market dislocations.1. Triumph of the Optimists –
101 years of Global Invest-ment Returns – Elroy Dim-son, Paul Marsh & Mike Staunton. n
ColleCt ive i ns igh t
WINTER 20068
6
tom Joy
TOM JOY is chief investment officer at RMB MultiManagers responsi-ble for constructing client-strategic asset allocations as well as man-ager research. Prior to joining RMB MultiManagers in 2003, Joy was head of multi-managers and asset allocation research at Schroder Investment Management. Joy has a BSc (Hons) Economics and MSc International Economics, Banking and Finance from Cardiff Univer-sity. n
WITH THE RAND HAVING strengthened on a nomi-nal effective basis by nearly
38% in total over the past three years, investors are understandably scepti-cal concerning the merits of investing overseas. If the rand is expected to remain fairly strong in the foreseeable future – and many analysts and inves-tors regard the return prospects on the SA markets to be more favourable than those abroad – is there then really any benefit in maintaining or acquiring an offshore exposure?
Currency movements less important than often thoughtThe answer to that question demands a clearer insight into the risks and poten-tial returns we face when we invest offshore. Investors usually assume that investing in another currency involves an extra layer of risk.
However, research by Paul Marsh, Elroy Dimson and Mike Staunton of the London Business School, showed that assumption seems to have been over-stated. They’ve analysed investment returns recorded over the past 106 years
and examined the main issues investors should face.
According to the study, over the past century it made little difference to the ranking of market returns whether they were measured in local currency or in a common currency, such as US dol-lars. That’s because over the long term exchange rates have tended to track relative inflation rates.
Has an offshore investment exposure become superfluous?
9
EQUITY MARKET SECTOR WEIGHTSCONCENTRATION
>
SOUTH DEVELOPEDAFRICA MARKETS
Energy 8,0% 9,1%Materials 28,1% 6,4%Industrials 6,5% 11,6%Financials 30,3% 25,9%Consumer Discretionary 10,5% 12,6%Information Technology 1,3% 9,8%Telecoms 8,1% 4,1%Healthcare 1,8% 8,5%Consumer Staples 5,4% 7,7%Utilities 0,0% 4,4%Total 100,0% 100,0%
Source: Style Research database, RMB MultiManagers,
Data as at 31 May 2006
STOCK SPECIFIC CONCENTRATION>
Global Developed MarketsSouth Africa
0
50
25
75
100
Cumu
lative
inde
x weig
hting
(%)
%
Source: Style Research database, RMB MultiManagers. Data asat 31 May 2006
0Number of stocks
500 1000 1500 2000 2500 3000 3500
ByCHRISTOLUÜS
Chief Economist, Absa
Figure 2
table 2

In other words, countries with high inflation rates have seen their curren-cies depreciate while those with low inflation have seen their currencies appreciate. That trend is known as pur-chasing power parity (PPP). Investors using PPP principles to time currency market movements have had little suc-cess over the short term, since other factors – such as interest rate differen-tials and balance of payments develop-ments – also came into play.
However, over the long run the annu-al moves in real exchange rates have been much smaller than the differences in stock market performance.
Therefore, the research suggests that when investing in London you should be more worried about the fate of the FTSE100 than the prospects for sterling. That also raises the question of whether investors should hedge their holdings in foreign markets (effectively separat-ing the stock market and currency deci-sions). The researchers found that the
benefits of doing so are modest.Furthermore, the times when it made
most financial sense to hedge were periods (such as wars) when it was often expensive or illegal.
Perhaps the most surprising conclu-sion of the study concerns the question of whether it’s better to invest in weak or strong currency countries. To the extent that weak currencies are usually associated with economic problems, it might be imagined that such countries should be avoided.
The researchers divided the data over the past 106 years into five baskets, based on the exchange rate movements over the previous five years.
The basket of weakest performing currencies gave investors an average return of 11,2%; the strongest curren-cies returned 9,5%.
The difference is even greater over the period since the breakdown of the Bretton Woods system in 1971. Since then, equity markets in weak currency
countries have returned 12,1%; those in strong currency countries just 3,9%. That apparent contradiction may well be because weak currencies help a country’s export performance, boosting returns. Or it may simply be that inves-tors tend to avoid weak countries that have had weak currencies in the past, driving valuations down to a point from which it’s possible to generate superior returns.
So, if currency is only a minor factor in international investment is it worth diversifying at all?
The standard answer is still yes. First, any one country will only have a limited number of investment opportunities; SA has few oil, technology, bio-fuels or biotechnology stocks, for example.
Second, different markets move in different directions at different times, so diversifying reduces the risk of the overall portfolio.
The bottom line is that currency changes and volatility should be much
WINTER 2006 9
ColleCt ive i ns igh t
8

less of a consideration than the benefits derived from diversification – ie, improv-ing overall performance or reducing risk. n

ColleCt ive i ns igh t
WINTER 200610
I’M GOING TO GIVE YOU something of a surprising answer – but there’s a simple, explicable beauty in the
answer that hopefully will make this read a worthwhile one.
For the sake of brevity, I’ll keep the question focused on South African equi-ties versus all other international asset classes. Statistical modelling of the SA equity market shows it’s driven by three dominant macroeconomic factors.
The first factor is international momentum: we take a clear signal from the developed world (largely the US) in terms of the direction our local equity takes.
Second, commodity pressure. That drives the price action of some of SA’s larger counters and is coupled tightly to our currency. Last, the spot of the rand versus any other counter (say, the US dollar). With a large proportion of our equity market being dual-listed the ramifications of the currency on our equity market are well known.
Importantly, the model of which I speak varies the importance of those drivers at any one time and over time – but explains more than 73% of the variation in SA equity returns for any three- to 24-month performance over the past 15 years. For non-statisticians that’s an impressive result.
The logic of spending so much time focusing on offshore markets from an SA perspective is seemingly sound.
There are countless asset classes that we have no exposure to, being iso-lated within SA. There are thousands of underlying equities we have no access to that herald untold promise and for-tunes; and there are exotic instruments offshore that we’re a decade or two behind from replicating here.
Our wealth (as measured by inter-national standards) is at the mercy of a sometime volatile currency and, once in a while, Afro-pessimism and emerg-ing market jitters. We currently have foreign exchange regulations limiting how much capital we can export out of SA as private investors. Surely, that’s justification enough?
But I’d argue we’ve got the question the wrong way around for starters. It’s not really a question of how much you should invest offshore but how much you invest in offshore markets already by investing in SA.
The question should actually be about how much offshore capital move-ments are already captured in SA and, if not, why not?
The performance of SA equity isn’t independent of international markets, yet inter-national markets are largely independent from us. Consider also the following studies that lay further credibility to that argument:
Give a mean variance opti-
miser a choice of SA equity and inter-national fixed-interest and international equity (all in rand terms) and ask it to find an optimal blend over time (Figure 1).
International bonds and SA equity dominate the picture, apart from mid-2003 through 2004 where international equity replaces both. Why such a preva-lence of international bonds and why not a more balanced blend of all three?
Because there’s no marginal benefit to assuming further equity risk offshore (or locally) when you have the selfsame effects and factors captured locally (or offshore). However, the optimiser sees obvious diversification benefits in often holding a constant low-volatile yielding asset class in a hard currency.
Figure 1 – A six-month rolling mean variance allocation to SA equity and two broad international asset classes, rand denominated.
In an investigation of SA market breadth (the number of “independent” bets one can assume) it was found that
ByDANIELPOLAkOW
Director and Head of Research,Peregrine Securities
Floating down the global river on an aardvarkHow much to invest offshore – and why?
11
PROPORTION>
0
60
40
20
80
100
%
Dec-
99Ma
r-00
Jun-
00Se
p-00
Dec-
00Ma
r-01
Jun-
01Se
p-01
Dec-
01Ma
r-02
Jun-
02Se
p-02
Dec-
02Ma
r-03
Jun-
03Se
p-03
Dec-
03Ma
r-04
Jun-
04Se
p-04
Dec-
04Ma
r-05
Jun-
05Se
p-05
Dec-
05Ma
r-05
Jun-
06
Top40 MSCI R World Bond Index R

ColleCt ive i ns igh t
10 across equities and bonds the number of independent bets was 10. If you then included international assets you might assume a substantial increase in breadth. In fact, such breadth doesn’t exist and you don’t find much further diversification benefits by going off-shore (ref 2, ref 3).
Related to the above, if we examine the correlations for a broad range of SA indices and sectors, as well as a similarly broad range of international indices (fixed-interest included), we’ll have to observe how closely coupled our market is to global determinants and how we’re “wedged” between the macroeconomic factors, very few of which we control.
Hence, my synthesis is this: the equi-ty market in SA is largely and simply a one-way mirror of what’s transpiring offshore – and like a minnow in a water-fall, our SA markets and instruments take a rather assertive set of signals from offshore.
The question then becomes an uncomfortable: “Well, what then is inde-pendently South African?” The answer, on a broad asset-allocation basis, is pretty close to nought, apart from some unique elements residing in the tail of SA equity market capitalisation.
“Independently South African” does exist on a finer scale: the relative valu-ations between companies – say FSR or SBK, or GFI and HAR – is a lot more entrenched in what’s uniquely South African and certainly of tremendous value-add to investors.
That’s where many fund managers and analysts strive to add value to their portfolios, some quite success-fully. However, no fund manager or analyst can deny the importance of non-resident factors influencing the earnings streams of companies, or the influence of such factors in determining the SA equity risk premium in general.
But let’s be clear about the implica-tions of these findings. Am I implying that SA equity markets have no role
in a portfolio and we ought to be only invested offshore (assuming that we could be)? Not at all: I’m stating that the SA equity market is largely governed by factors that are not endemic to SA and arise independently from SA. I’m stating that the majority of offshore movements and events are actually extremely well “mirrored” in the SA equity market.
Does that suggest that there’s no role for international investment? No. If you’re going to invest offshore as a South African be sure to do it for the right reasons and not simply because you want “exposure” to “offshore mar-kets”. I can think of three possible rea-sons for investing offshore, in order of presumed importance:
• The creation of an explicit currency hedge (or preservation of capital in a currency other than rand).
• Specific exposure to a foreign under-lying/sector or asset class to which you have very unusual and superior insight – exposure that you can’t rep-licate (remembering that you can replicate a surprising amount here).
• The possible existence of long-term offshore investment taxation ben-efits. The single most important reason for
a South African investing offshore has to be the clear diversification benefits of holding an independent positively yielding non-rand denominated asset. That’s simply because the majority of our wealth is held in rand while being profoundly exposed to non-rand influ-ences. n
dANiEl PolAKoWDANIEL POLAKOW is a director and head of research at Peregrine Securities. He obtained a PhD in Statistical Sciences from UCT in 2000 and has been servicing the industry from a derivatives and quantitative perspective for the past six years. n
WINTER 2006 11
the single most important reason for investing offshorehas to be the clear diversification benefits of
holding an independent positively yielding non-randdenominated asset.

ColleCt ive i ns igh t
WINTER 200612
INVESTORS HAVE REAPED the bene-fits of investing globally for decades. Significant return opportunities, cou-
pled with low correlations to domestic asset classes, made the allocation to
global equity markets an easy decision.However, in recent years equity mar-
kets appear to be more synchronised, thus lessening their appeal as a unique source of investment opportunity. Does that mean the benefits of investing globally are gone or greatly reduced?
This report will posit that much of the high correlations of late are directly attributable to the rise and subsequent fall of the “new economy” era and unlikely to be a permanent feature of global equity markets. We go on to iden-tify and describe the return opportuni-ties available for skilled and disciplined investors.
Equity market correlations: Secular trend of unique global synchronisa-tion?What interests us in this discussion isn’t if globalisation exists (we believe that’s no longer in question) but rather globalisation’s effect on the behaviour of equity markets and, perhaps more importantly, the expectations for the
future connectedness of markets.From the graph below we see that
between 1997 and 2003, the 24-month trailing correlations for most developed equity markets with the world market
index reached all-time highs.As the chart shows, the historical
average for global market correlations (shown in the bold black line in the chart) had bounced around 0,40 prior to 1997. Then from 1997 to 2003 the average correlation increased steadily, first to around 0,60 and then moved even higher, peaking around 0,80 at end-2003.
A rise in correlation of that mag-nitude obviously has implications for the diversification benefits that accom-pany international investing. The dif-ficult question is whether that rise is a permanent feature of the global equity markets or the result of market condi-tions specific to this time period.
There’s no doubt that the globalisa-tion of markets has played a role in the increase in correlations, but this peri-od also coincides with the technology stock boom and bust. That phenom-enon was truly a global event, causing great synchronisation in the world’s equity markets – first on the upside and
then, unfortunately, dragging markets down, as the excesses were unwound. It’s interesting to note that recent cor-relations have come down swiftly as the “bubble” period becomes further behind us.
Of course it’s not all about diversifica-tion and risk control. Investors are also looking to improve overall performance. That’s particularly true today in light of funding shortfalls and the consensus belief that equity returns will be more modest for the foreseeable future.
In response, many investors have added dedicated global equity alloca-tions to their existing regional man-dates. The expectation is that a broader universe for stock selection will equate to better opportunity for alpha. But in doing so you must understand the true sources of skill and potential outperfor-mance or underperformance.
The relative importance of countries, industries and stock selectionThough not a surprise, one of the inter-esting outcomes from increasing glo-balisation is the decline of countries and the rise of global industries as drivers of performance differences among global
ByLISASTANTON
Global Investment Com-munications, Director,
AXA Rosenberg
Active management in a global economy
BySTEPHENDEAN
Director of Global Product Strategy,
AXA Rosenberg
13
PROPORTION OF RETURNS EXPLAINEDBY COUNTRY OR INDUSTRY
>
Country Effect
Industry effect has been growing
Country effect has been declining
Industry Effect
0
25
15
5
35 25
15
10
0
% %
Source: AXA Rosenberg
Dec-86 Dec-86 Dec-90 Dec-92 Dec-94 Dec-96 Dec-98 Dec-00 Dec-02 Dec-04
CORRELATION OF GLOBAL EQUITY MARKETS – TRAILING 24-MONTH CORRELATIONS>
-0.60
-0.40
-0.20
0.00
0.20
0.40
0.60
0.80
1.00
1.20
19
70
19
72
19
74
19
76
19
78
19
80
19
82
19
84
19
86
19
88
19
90
19
92
19
94
19
96
19
98
20
00
20
02
20
04
A u s t ria
B e lg iu m
D e n m a rk
F ra n c e
G e rm a n y
I t a ly
N e t h e rla n d s
N o rw a y
S p a in
S w e d e n
S w it z e rla n d
U K
P o r t u g a l
F in la n d
I re la n d
H o n g K o n g
A u s t ra lia
N e w Z e a la n d
S in g a p o r e
J a p a n
C a n a d a
U S
A v e r a g e
SOURCE: AXA Rosenberg
Figure 1
Figure 2
stocks. Figure 2 demonstrates that the proportion of global stock returns explained by the country in which a company is located has been steadily declining since the late Eighties.
By the same measure, the impor-
tance of a company’s industry has been growing to the point where it overtook the country characteristic in its explana-tory power of global equity returns in the late Nineties.
Interestingly, the rise and fall in the
industry line in the chart is consistent with the global synchronisation of the technology industry’s rise and fall in the late Nineties/early 2000s.
The main point of the chart is that, increasingly, global investing is less a matter of choosing the right country than it is about choosing the right indus-tries and stocks (which make up the remaining portion that’s not explained by countries or industries.) Despite this evidence, many investors still approach international investing as a matter of timing country bets.
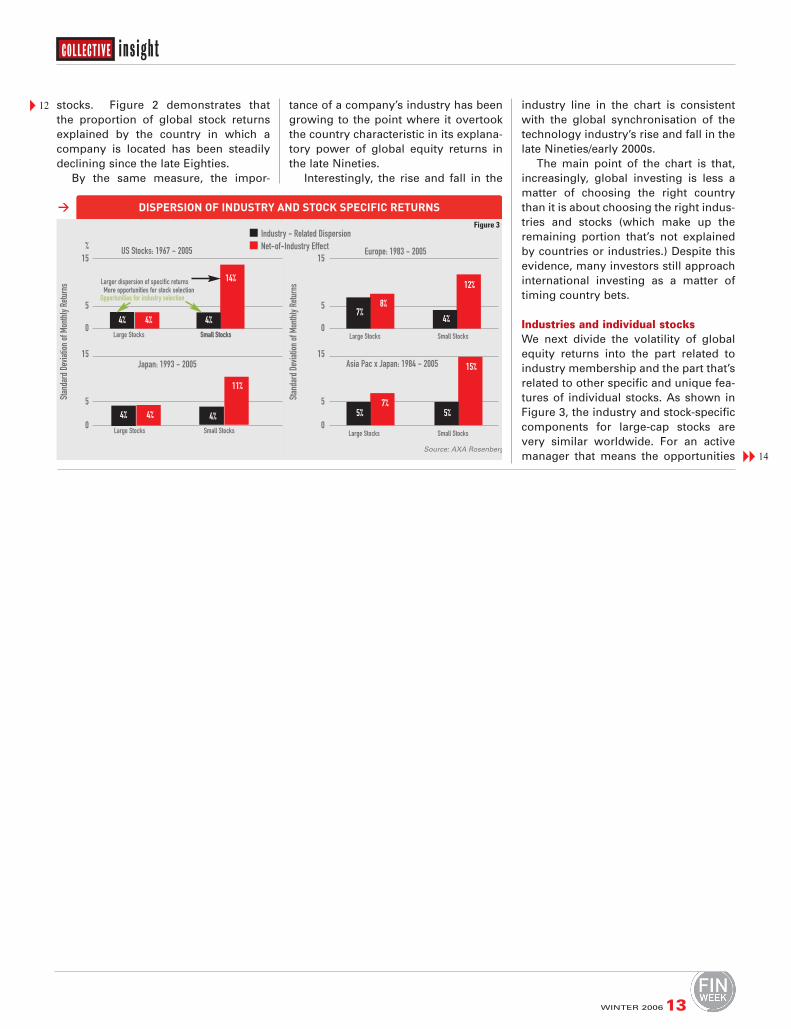
Industries and individual stocksWe next divide the volatility of global equity returns into the part related to industry membership and the part that’s related to other specific and unique fea-tures of individual stocks. As shown in Figure 3, the industry and stock-specific components for large-cap stocks are very similar worldwide. For an active manager that means the opportunities
WINTER 2006 13
ColleCt ive i ns igh t
14
12
DISPERSION OF INDUSTRY AND STOCK SPECIFIC RETURNS>
Industry - Related DispersionNet-of-Industry Effect
0
5
15
5
0
15
0
5
15
5
0
15
Larger dispersion of specific returns
Large Stocks Large Stocks
Large StocksLarge Stocks
Small StocksSmall Stocks Small Stocks
Small StocksSmall Stocks
More opportunities for stock selectionOpportunities for industry selection
% US Stocks: 1967 - 2005 Europe: 1983 - 2005
Asia Pac x Japan: 1984 - 2005Japan: 1993 - 2005
Stan
dard
Dev
iation
of M
onthl
y Retu
rns
Stan
dard
Dev
iation
of M
onthl
y Retu
rns
Source: AXA Rosenberg
4% 4% 4% 4%
8%7%
7%5% 5%
15%
4%4%4%
14%12%
11%
Figure 3

ColleCt ive i ns igh t
WINTER 200614
13 in large-cap stocks are almost equal-ly about picking industries as they’re about picking stocks. Success in invest-ing in large-cap stocks requires getting both dimensions right.
Among small- cap stocks the exhibit shows that the stock-specific compo-nent of volatility is much higher than the industry component. Thus, for active managers in small cap the opportunities for success through stock selection are tremendous and stock-picking rather than industry insights is the key for success.
It’s our belief that with less than 25 truly developed economies worldwide, betting on countries affords too few independent “bets” – making it less compelling from a return to risk per-spective than selecting from the 48 or so global industries or the roughly 19 000 individual stocks in the global markets.
As such, AXA Rosenberg doesn’t forecast country or currency returns as part of our investment process but rath-er seeks attractive investment opportu-nities within individual stocks and, to a lesser extent, between industries.
Are markets more efficient?While the characterisation of global investment opportunities into these components is interesting it isn’t mean-ingful as an investment insight if global equity markets are too efficient to pro-vide investors with large enough mis-pricings.
With increasing globalisation and the tremendous growth in the amount of information available to global inves-tors – and the speed at which that infor-mation is incorporated into stock prices – many observers have suggested that
equity markets are becoming more effi-cient.
To test that claim you need some measure of potential mispricings in the markets over time. Using AXA Rosen-berg’s proprietary valuation model (which estimates a “fair value” for each stock) we can measure the degree of misvaluation within regions and across time.
In Figure 4 we’ve assigned the com-panies in each region into one of two equal capitalisation halves based on their degree of misvaluation as esti-mated by AXA Rosenberg’s valuation model. The undervalued half represents
the 50% of market cap with the high-est valuation scores, while the overval-ued half contains the lowest valuation scores.
The ratio of the price-to-fitted value (AXA Rosenberg’s “fair value” estimate) of the undervalued half to the overval-ued half is a measure of the “valua-tion gap” present in the market. If the market’s becoming more efficient that valuation gap ratio should be declining, as mispricings diminish in the market.
While the chart shows some volatil-ity in that ratio, in general there’s no evidence of declining mispricings and increased efficiency. In fact, the volatil-
StEPHEN dEAN
STEPHEN DEAN joined AXA Rosen-berg as a portfolio engineer in 1995 and is currently the director of Global Product Strategy. From 1985 to 1987 he was a research assistant in the domestic financial markets depart-ment of the Federal Reserve Bank of New York. From 1987 to 1995 he was an associate economist in the Economic Research Department of the Federal Reserve Bank of San Francisco.
Dean obtained a BA from Ham-ilton College (1985) and in 1994 he earned an MBA from the University of California, Berkeley. He’s a Char-tered Financial Analyst. n
BEST VS WORST CUMULATIVE EARNINGS YIELD STOCKS THROUGH DECEMBER 2005>
-20
-30
20
0
40
-20-30
20
0
40
Best Good AveragePoor
Worst
Best Good AveragePoor
Worst
Best Good Average
Poor
Worst
Best Good Average PoorWorst
%
-20-30
20
0
40
-20-30
20
0
40
%United States
Japan
Europe
Asia Pac ex Japan
Quint
ile Av
erag
e Ann
ual R
eturn
Net
of Ma
rket
Quint
ile Av
erag
e Ann
ual R
eturn
Net
of Ma
rket
Source: AXA Rosenberg
VALUATION SPREAD TO FAIR VALUE>
0
2,0
1,5
1,0
0,5
2,5
3,0
January 1968 to December 2005
United StatesEuropeJapanPacific x-Japan
Price-to-fair value for the overpriced halfof the market divided by price-to-fair valuefor the undervalued half of the market
A ratio of 1,66 (1,25/,75) implies a25% under and over valuation
Ratio
Source: AXA Rosenberg
Jan-68 Jan-76 Jan-84 Jan-92 Jan-00
liSA StANtoN
LISA STANTON joined AXA Rosen-berg in 2004 as global investment communications director responsible for global marketing. Prior to joining AXA Rosenberg, she was the global head of client services at Barra, where she held various positions during her 12 years with the firm. From 1989 to 1992 she was a portfolio manager and client services officer at Wells Fargo Nikko Investment Advisers in San Francisco. In 1988/1989 she was a fixed income trader for Alliance Capital in London. Stanton has a BA from Southern Methodist University and is a Char-tered Financial Analyst. n
Figure 5
Figure 4

ity associated with the rise and fall of the technology stock bubble appears to have created increased levels of mis-pricings (as seen by AXA Rosenberg’s valuation model).
Earnings: The key driver of perfor-mance in global equity portfoliosWe find that global equity markets aren’t becoming more efficient and that stock selection, as well as industry selec-tion in large-cap stocks, is important in explaining the performance of global equities. Still, to be successful as an active global equity investor you need to ask: What are the drivers of stock performance and do they hold from one region to the next? Is it possible to com-pare companies across the globe on a consistent basis?
Predicting individual stock perfor-mance can and should be linked to economic commonsense at the highest level. We believe that link, true across all equity markets, is a company’s abil-ity to generate higher future earnings relative to their stock price at the time of initial investment than the market.
We find that, over time, that superior future earnings yield leads to superior market performance in all regions of the world. Figure 5 shows the one-year performance relative to the mar-ket for quintile groupings of all stocks in a given region of the world. The groupings are based on a company’s level of cumulative earnings over five years divided by the initial cost of those stocks at the start of the five-year period (“cumulative five-year earnings yield”).
Thus, the “top” group is the 20% of stocks that produced the highest cumulative five-year earnings yield, the “good” group is the next best 20% and so on down to the “worst” group that produced the lowest cumulative five-year earnings yield. The chart plots the average one-year performance relative to the market of these 20% groups over the entire time period.
In all regions the cumulative five-year earnings yield advantage has a one-year return advantage. Of course, nobody now knows exactly what the next five years of earnings will be. How-ever, the chart does show that earnings (at least cumulative five-year earnings relative to cost) clearly matters to per-formance.
The challenge for the active investor is to find a way to identify those top-earning stocks before other investors do.
ConclusionThe diversification benefits of investing globally, while somewhat lower than the Seventies and Eighties, remain impor-tant. The highly correlated markets dur-ing the late Nineties and early 2000s that challenged those benefits appear to be related to the unusually globally synchronised technology stock boom and bust. With that period becoming further behind us, global equity correla-tions have started to come down.
Return opportunities appear increas-ingly related to industry and stock selec-tion rather than country timing. Finding such opportunities is the challenge for investors, but we believe that over time the key to successful global investing is identifying those companies whose likely future earnings are attractively priced. n

ColleCt ive i ns igh t
WINTER 200616
COUNTRIES, GLOBAL INDUSTRIES and global styles are important sources of return and risk in inter-
national investing.The relative importance of these
sources has varied over time, particu-larly during the last decade, with global industries playing a prominent role dur-ing the technology bubble.
In emerging markets countries have been more important than global indus-tries by a wide margin. Purely local factors account for a significant amount of the variation in returns, especially in developed markets
Variability due to inter-market factors Figure 1 shows the relative contribu-
tions of the three sources – countries, global industries and global styles – in developed and emerging markets.
Figure 1: Relative importance of country, global industry and global style In developed markets, country differ-entials accounted for roughly 75% of performance variability through much of the Nineties.That’s consistent with global investment managers’ practice of allocating funds first along country lines.
In 1998, the relative contributions from industries and styles began to increase significantly, with the indus-tries actually dominating countries on a few occasions between 1999 and 2002 and again in 2004/2005. Styles increased in importance until 2003, when they briefly equalled industries. Since 2003 they’ve rapidly declined in significance, returning to their pre-1999 levels.
However, in emerging markets until the late Nineties, countries accounted for more than 90% of the dispersion due to inter-market factors.
Contrasting the performance contribu-tion from purely local factors versus inter-market factors. (Figure 2)In developed markets the inter-market factors have become less important since the early Nineties, slipping from more than 30% to roughly 20% of the dispersion today. At the same time, purely local factors have become more important, now accounting for about 25%.
the changing sources of risk and return
investing in broader AfricaWhat makes it distinctly different from investing ‘internationally’?
GIVEN THE EXCITEMENT with regard to China and India and surging commodity prices,
investors may have overlooked anoth-er success story that’s been gaining momentum over the past few years – broader Africa.
Recall that in 2003, three out of the top 10 performing markets globally came from this continent. That number increased to four in 2004. And 2005 was another great year for these markets with some, such as Egypt, up more
than 100% in US dollars for the second consecutive year.
However, while many investors are enthusiastic about the opportunities within South Africa, and knowledge-able about “international” markets, if we’re to be totally honest a large number are scared witless of the won-ders that lie north of our border. Our geographic knowledge of the continent north of Malawi is patchy at best. Sure, we can place Egypt on the map; but is Ghana east or west of Nigeria, is
Morocco next to Tunisia and who knows where Guinea Bissau really lies?
I had the privilege of exploring the rest of Africa in my previous line of employment, looking for investment opportunities. The more work I did the more I came to realise that there are real
ByNOTHANDONDEBELE
Head of Research, Renaissance AssetManagement
17
RELATIVE IMPORTANCE OF PURELY LOCALAND INTER-MARKET FACTORS
>
Developed Markets
Emerging Markets
0
50
50
75%
Specific
SpecificShar
e of a
sset
CS Va
rianc
e (%)
%
0
50
50
75%
%
1993 1995 1997 1999 2001 2003 2005
Purely Local
Inter-Market
1993 1995 1997 1999 2001 2003 2005
Purely Local
Inter-Market
RELATIVE IMPORTANCE OF COUNTRY,GLOBAL INDUSTRY AND GLOBAL STYLE
>
Developed Markets
Emerging Markets
Country
Industry
Style
0
50
25
75
100
0
50
25
75
100
SHAR
E OF I
NTER
-MAR
KET C
ROSS
-SEC
TIONA
L VAR
IANC
E
%
1993 1995 1996 1999 2001 2004 2005
1993 1995 1996 1999 2001 2004 2005
Figure 1
Figure 2

On the other hand, in emerging mar-kets the inter-market factors remained strong throughout the period, account-ing for about 30% of the dispersion on average. Meanwhile, the purely local factors accounted for around 19% on average. n

ColleCt ive i ns igh t
and attractive opportunities to be pursued throughout Africa in various asset classes: listed equities, fixed income, curren-cy, private equity and structured finance. Handsome rewards await the astute investor, with returns often outstripping the
perceived risks by a wide margin.
But why both-er at all with the rest of Africa, one may ask? Several reasons. First, investments con-tinent-wide bring d i v e r s i f i c a t i o n benefits. Both the currencies and the stock indices have low correlations to developed and other developing markets.
Second, these countries offer higher potential returns while actu-al and perceived risk is falling,
chiefly because Africa is taking positive steps forward on the growth front.
Perhaps high on investors’ minds is political risk. The prevailing view of Africa is that it continues to be a continent fraught with conflict and political corruption. (I still recall a cover of The Economist a few years back that featured a special report on Africa with the heading “Africa, the hope-less continent”.)
While that’s still true of some countries – Zimbabwe and Somalia spring to mind – there’s a growing list of countries showing greater political stability and more democratic structures. The prevalence of one party states has declined and over the past year we’ve witnessed peaceful and fairly democratic elections in places like Liberia.
While the 2005 inaugural Egyptian presidential election may not have been the most “free and fair” the fact that it happened at all is testament of Africa’s changing times.
Next to political risk is the threat of economic meltdowns in African countries. That’s not be taken lightly, as the decline in Zimbabwe over the past six years shows. With inflation more than 1 000% and the currency being virtually worth-less, investors would have found it challenging to make real returns over the period.
In 2003 and 2004 the US dollar returns of the Zimbabwean stock market dropped by more than 50%. While last year showed some positive returns, a severe lack of foreign cur-rency would have made it difficult for investors to cash in on their hard-won returns.
But for every faltering Zimbabwe there are multiple success stories to explore. For example, Tanzania’s GDP is expected to show real growth of 5,9% this year, after growing 6,8% in 20051. Between 1996 and 2002 the
WINTER 2006 17
16
18
STOCK MARKET RETURNS: 2005>
COUNTRY INDEX RETURN RETURN (LOCAL) (USD)
Egypt CASE 30 139% 163%Zambia LUSE 59% 122%Kenya NSE 30 35% 44%South Africa All Share 43% 26%Malawi Domestic 62% 36%Zimbabwe Industrial 1472% 17%Ivory Coast BRVM 28% 15%Tunisia TUNINDEX -15% 3%Morocco MASI 22% 8%Uganda Composite 72% 64%Mauritius SEMDEX 13% 5%Namibia NSX Local 11% 0%Nigeria All Share 2% 5%Botswana Domestic 23% -5%Swaziland All Share 0% -11%Tanzania Composite -3% -11%Ghana DSI -25% -26%
Source: Databank Group Research, Bloomerg,
www.africanfinancialmarkets.com

WINTER 200618
country’s GDP accelerated to an aver-age of 4,6% from 2,7% in the preceding six-year period. Consumer inflation has come down from +30% in the Nineties to current single digit figures (6,9% in April 20062).
In Ghana, GDP growth has been more than 5% over the past three years and inflation has fallen to low double-digits.
Those are just two examples of the positive economic changes taking place. I could add to the list Zambia, Nige-ria, Egypt and Kenya. The point is, some African countries are showing positive growth signs and their prog-ress shouldn’t be overshadowed by the sharp decline of economies such as that of Zimbabwe.
So having overcome political and economic concerns, what else makes investing in broader Africa different from the SA market? The first chal-lenge you’ll encounter are communica-tions systems. If you’re not blessed with patience then that may not be a suitable investment class for you.
It’s not uncommon for telephone lines to be down for hours on end, which means hitting the redial button hour after hour until you get through. That can be very frustrating when you need timely news flow or want to manage a trade. Patience and tolerance: both are needed in generous amounts.
In the SA market investors often complain of information overload: too many emails from brokers, too many presentations, management lunches, site visits and too many sales calls. Expect a significant drop in the level of
information received when you invest in the broader continent.
In some of the markets, such as Egypt, the stockbroking and research model is well developed and you’re likely to receive similar levels of service as you’d expect from any SA broker. However, in some markets, though the stockbroking model exists, the research side is still not up to SA or international standards. Research reports are scarce, but where you can find them they’ll save you time and energy.
But the situation is definitely improv-ing. For example, in Ghana one broker – Databank – has an excellent web-site and commendable research library that’s accessible via the Internet. Hope-fully, as these markets grow and the
participation of local and international institutional investors increases the quantity and quality of research will continue to improve.
The low levels of information flow-ing from listed companies themselves exacerbate the data challenge. That’s not to say companies don’t understand or manage their businesses well. My research visits took me to about 10 countries and overall I was impressed with the quality of the meetings I had with managements.
But had I not visited them my under-standing of their businesses would have been severely hampered by the lack of readily available information produced by them. In most cases
their annual reports were insufficient in scope to give me a real sense of a busi-ness – though the financial statements (accounts) were usually adequate.
Site and management visits are cru-cial: more so than in SA, where your favourite broker can give you a blow-by-blow rundown of the meeting or visit if missed.
It isn’t atypical in the smaller markets for brokers to have had minimal contact with a company’s management, hence the need to do the groundwork your-self. Unfortunately, the asymmetrical information dissemination can provide scope for front running or insider trad-ing, something you always have to be cognisant of and act against.
Another challenge worth bearing in mind is the lower levels of liquidity. Finding stock can be problematic. Take Zambian Breweries. A great company
with good growth and margin prospects but next to impossible to source any stock.
Part of the problem is that SABMiller holds 54%, which obviously limits the company’s free float.
Investors that hold stock aren’t will-ing to part with their shares and when they are they demand hefty premiums to the spot price. So getting in and out of stocks can take weeks and even months, especially when everyone is implementing the same strategy. It’s therefore important to allow sufficient time for investing inflows or dealing with redemptions from portfolios.
While most mandates in the SA mar-ket operate on 30-day notice periods it’s advisable to push that out to at least 90 days in the rest of Africa. Also remem-ber that you’re likely to move the share price fairly significantly if you try to move rapidly – that attractive 70% paper gain could fall 15% due to an aggressive exit.
Despite the challenges facing African markets it’s a geographic region that’s likely to warrant increasing attention in future. Its appeal is driven by low cor-relations to other markets, improving political and economic environments and strong commodity exposure, which are all resulting in higher levels of investment and growth.
The opportunity to make attractive gains awaits those willing to do the work, seek out the opportunities and pledge the assets.
1. IMF2. National Bureau of Statistics Tanza-nia. n
17
ColleCt ive i ns igh t
WINTER 20061
NotHANdo NdEBElE
NOTHANDO NDEBELE is head of research at Renaissance Asset Man-agement and a founding partner in the firm. Her responsibilities include management of the research process, fundamental stock analysis – focus-ing on the industrials and financials sectors – and portfolio management. Nothando has 10 years’ experience in the European and South African investment industries and is a Char-tered Financial Adviser. n
AFRICA ANNUAL REAL GDP GROWTH(%) & ANNUAL INFLATION (%)
>
0
20
15
10
5
25
30
Source: IMF World Economic Outlook September 2005
1996 1997 1998 1999 2000 2001 2002 20032004 2005 2006
GDP Growth
Inflation Growth

20
WINTER 2006 19
ASSET MANAGERS have been allowed to invest off-shore since the mid-Nineties, when the SA Reserve Bank first relaxed exchange controls on investing
internationally.Since then the industry has largely adopted two approach-
es to its offshore investment strategy: viewing it either as a standalone component of the portfolio, often outsourced to another manager or multi-manager, or integrating it fully into its existing investment process.
We would argue that it’s more efficient to manage the international portion on an integrated basis, taking into account the risk/return characteristics of the full array of local and international asset classes, rather than constructing the local and international segments independently and then adding the two together.
Tactical flexibility offered by an integrated approachWe first explored whether an integrated approach to off-shore investing would be more efficient in allowing an asset manager the flexibility to implement strong views that it may have on expected outperformance of particular assets over a specific market cycle. The period considered was 2003 to 2005: a time when local equities delivered much better returns than offshore equities, particularly in rand-denomi-nated terms.
We looked at two scenarios: one in which the asset manager used an add-on approach, managing the 75% local portfolio in-house and outsourcing the 15% interna-tional portion, and another where all decisions were taken in-house, with the only constraint that a maximum of 15% could be invested offshore.
To ensure the results were comparable, we assumed each portfolio took on the same level of risk – about 10,5% – with the view that this is a level of risk most pension fund trust-ees and consultants would be comfortable taking on when invested in an actively managed investment portfolio.
The results show that the Sharpe ratio of the integrated approach during the period was 1,26 versus the add-on strategy’s 1,01, confirming that an asset manager following an integrated approach to offshore investing is best placed to build a more efficient portfolio because it’s able to com-pare the relative attraction of all local and international asset classes together before implementing its investment views.
In this exercise, an integrated approach allowed the asset manager to devote the full 75% exposure to local equities, with nothing given to offshore because poor returns under-mined the usually attractive risk diversification characteris-tics offered by offshore assets. During this period, even SA cash and bonds delivered much better returns than offshore assets.
optimal strategy for offshore investing
ColleCt ive i ns igh t
Integrated or add-on to local portfolio over time?To consider the impact of these two approaches to offshore investing over a longer period, we generated efficient frontiers to reflect the different scenarios for the period January 1971 to December 2005 and then compared the Sharpe ratios of the optimal asset allocations generated in each case, once again at a risk level of 10,5.
To devise an optimal asset allocation and Sharpe ratio for a strategy that treats the international portion as an add-on, we determined the optimal point on a local-only efficient frontier and the optimal point on an offshore-only efficient frontier (see efficient frontier graph and notes at the end). We then com-bined the two, creating a portfolio comprising 85% of the opti-mal local portfolio and up to 15% of the optimal international
ByADRIANALLARDICE
Head of Omam Macro Strategy
team
BySHARONWOODS
Communicationsspecialist
ByWARRENMcLEOD
Member of Omam’s quantitative and risk
unit

19 portfolio (the current offshore restriction on institutional investing).
For the integrated portfolio approach, we merely set the constraint that the maximum invested offshore may be 15%, thus leaving 85% of the assets to be invested locally. In so doing, an
efficient frontier, with an optimal asset allocation, is established using the six main asset classes, SA equities, bonds and cash and offshore equity, bonds and cash.
The result of the exercise is that the optimal integrated portfolio has a bet-ter Sharpe ratio of 0,331 than the add-on approach’s 0,327, which assumes a combination of an 85% local optimal portfolio with a 15% international opti-
mal portfolio. Admittedly, the end results are very
close because we have chosen a specific time period and a limited set of asset classes.
But they do confirm it’s sub-optimal to treat building blocks within an invest-ment portfolio as completely indepen-dent decisions and there is no doubt that if the range of choice was broad-ened further, the difference between the Sharpe ratios would become even more marked.
Diversification attributes of offshore equitiesOver the longer term, what is notable is that both the integrated and add-on portfolios did put the maximum permis-sible amount into international equities, despite the better returns delivered by SA equities during the period. During the 35-year period under review, local equities delivered annual average returns of 18,1% versus offshore equities’ 16,6% (see graph below).
The reason an optimal port-folio has the maximum invested in offshore equities over the lon-ger term is that offshore equi-ties have strong diversification qualities, given their low corre-lation with other asset classes.
They also offer the benefit of delivering more return for each unit of risk than any of the other five asset classes (as witnessed by the relative steep-ness of the offshore-only efficient frontier).
When given the option between investing in low-risk but also lower-return cash assets and higher return offshore equities, the efficient portfolio shifts exposure to off-shore equities up to the optimal point where the Sharpe ratio is at a maximum on the frontier.
The determining factor of what proportion of the portfolio is devoted to offshore equities is the performance of the offshore assets. If offshore does well,
then both the approaches considered here will have the maximum allowable 15% in offshore, hence their perfor-mance will be very close. However, the add-on approach will always have the additional restriction of only being able to give a maximum of 11,25% of the 15% offshore allowance to equities because the local and offshore decisions are taken separately and it’s impractical to set a 75% equity limit centrally. Thus the constraint is usually imposed at the individual portfolio levels.
Upping the offshore weightingThe full benefit of offshore diversifica-tion would only be realised if there were no constraints on the investment man-ager as to how much could be invested offshore. That is clearly encapsulated in an efficient frontier with no con-straints, which, as you see on the graph below, dominates all the other efficient
ColleCt ive i ns igh t
WINTER 200620
22
11
15
12
17
19
%
SA Equity
OS Equity
OS Bonds
Notes:SA-only efficient frontierIt is less efficient than the unconstrained efficient frontier. Very little weight is given to SA bonds atany point on the efficient frontier. The reason being: SA bonds did not outperform SA cash by muchduring the period and SA cash is the better risk diversifier. Thus the portfolios along this efficientfrontier are effectively a weight between SA equity and SA cash.
International onlyOffhsore equity had a far greater return for not much more risk than offshore bonds hence the opti-mal portfolio has the max 75% in equities.
Add-on approach with 15% offshore limit (85% optimal local + 15%optimal international)This portfolio’s level of risk is less than the two constituents’ level of risk since the addition of otherasset classes results in risk diversification. This portfolio’s risk is 10,6%. At this level of risk, the SAoptimal portfolio has 46% in SA equity and 53% in SA cash.
Integrated approach with 15% offshore limit (85% SA + 15% interna-tional)Offshore equity has a greater return than SA cash and also offers risk diversification hence thisefficient frontier lies mostly above the SA-only efficient frontier. It is also more efficient becausethe opportunity set of asset classes has increased.
Unconstrained efficient frontierNot surprisingly the unconstrained efficient frontier is the most efficient (it lies above the other effi-cient frontiers at each level of risk. As more risk is taken on, the weight in cash is reduced and it isshared between SA equity and offshore equity, wtih more going to offshore equity because it is agood diversifier of risk.
OS Cash
SA Bonds
SA Cash
ADD-ON APPROACHOptimal local combined with Optimal Offshore
42% SA Equity1% SA Bonds42% SA Cash11% OS Equity4% OS BONDSCONSTRAINTS:
MAX 75% EQUITY, 15% OS
NO CONSTRAINTSOptimal portfolio
37% SA Equity14% SA Bonds45% OS Equity4% OS Bonds
INTEGRATEDAPPROACH
16% SA Equity5% SA Bonds64% SA Cash
15% OS EquityConstraints:
MAX 75% Equity15% OS
LOCAL ONLYOptimal only49% SA Equity2% SA Bonds49% SA CashConstraints:
MAX 75% Equity
OFFSHORE ONLYOptimal portfolio
75% OS Equity26% OS BondsConstraints:
MAX 75% EquityAnnu
alise
d Retu
rn
Source: OMAM, JPM, Ibbotson, Firer, UBS, MSCI
0 5 10
Annualised Risk
15 20 25
OPTIMAL OFFSHORE WEIGHT AT DIFFERENT RISK LEVELS
>
0
40
30
20
10
50
60
Offsh
ore w
eight
(%)0 1
Risk levels (%)2 3 4 5 6 7 8 9 10 11 12 1314 15 16 1718 19 20 2122 23 24 25
AVERAGE ANNUAL RETURNS(JAN 1971 - DEC 2005)
>
0
10
5
15
20
%
SA eq
uity
SA bo
nds
SA ca
sh
Offsh
ore
equit
y
Offsh
ore
bond
s
Offsh
ore
cash
OPTIMAL WEIGHTS (%)INVESTMENT SHARPE SA SA SA OS OS OS STRATEGIES RATIO EQUITY BONDS CASH EQUITY BONDS CASHIntegrated approach:Max 75% Equity; OS ≤ 15% 0,331 39,3 5,9 39,8 15,0 0,0 0,0Add-on approach:85% Optimal Local + 0,327 42,0 1,3 41,7 11,3 3,8 0,015% Optimal InternationalComponents:Offshore only, max 75% equity 0,0 0,0 0,0 0,0 75,0 25,0 0,0Local only, max 75% equity 0,293 45,4 1,4 53,2 0,0 0,0 0,0No Constraints 0,352 27,2 11,5 25,6 33,3 2,4 0,0

20 frontiers at all points along the frontier. In other words, any point along the fron-tier offers a better risk/return trade off than those situated on the other efficient frontiers.
The comparable Sharpe ratio of the optimal point on this efficient frontier, with a risk level of about 10,5%, is 0,352, which is more favourable than the 0,331
generated by an integrated portfolio with a 15% offshore constraint and the 0,327 generated by the portfolio that treats the offshore component as an add-on.
The strong diversifying attributes
ColleCt ive i ns igh t
WINTER 200622
SHAroN Wood
SHARON WOOD is the communica-tions specialist at Omam. A financial journalist for 15 years, she joined the asset manager in March 2005 as a specialist writer and is also respon-sible for broad investment communi-cations. She has an Honours degree in economics (cum laude) and is a Certified Financial Planner. n
AdriAN AllArdiCE
ADRIAN ALLARDICE has worked in the asset management industry for 30 years.
He heads Omam’s Macro Strategy Team, which is responsible for for-mulating the asset manager’s overall investment strategy and asset alloca-tion.
Allardice has managed the highly successful range of Profile Portfolios since their inception in 1995. He also manages the Four Plus Growth Fund of Funds, the Four Plus Global Fund of Funds and the Old Mutual Flexible Fund. n
international experiences by SA investorsOverviewLook at the errors Excon has created for SA investors.
SkeletonThe world is not enough.The scene: the murky international markets.The threat: thermonuclear inflation risk torpedoes, pool of political risk piranhas, covered by lost opportunity lasers.The villain: Dr Excon – South African exchange control.The hero: The South African interna-tional investor of mystery._____________________________________
OUR PLUCKY HERO has time and again been pitted against the machinations of Dr Excon
when looking for a safe harbour in foreign locales. Unfortunately, getting past these restraints has often led to portfolios that have been shaken and not stirred by the rand.
Think of the times of Goldfinger – when Krugerrands were the investment of choice. They were seen as a way to gain exposure to an asset where the price was set outside our borders (and a handy store of value to take overseas).
Though we’ve seen the precious metal climb to new heights over the past few years it’s been a poor performer over the long term. It’s an asset with storage costs and no income. Over the past 15 to 20 years, physical gold hasn’t beaten the jaws of inflation.
Another investment attempt in the Nineties was containers, where the expectation that hard currency returns would flow to SA “From Russia (Sin-gapore, or Rio) with Love”. These hard assets are dependent on world trade and leasing rates and, as interest rates have fallen, are less popular.
That trend moved on to looking at rand hedges, SA stocks that are listed here but predominately generate earn-ings overseas. These stocks aren’t nec-essarily well correlated with foreign currency movement, as they’re affected by market sentiment, tradability and economic conditions in the markets where they operate.
Finally, as the grip of Dr Excon was relaxed investors have gone offshore on the R750 000 express. The spiking of the rand in 2001 saw an influx of inter-national investment as the rand scared the living daylights out of investors. In retrospect, when the rand recovered with the speed of a movie car chase
many investors were left smarting and noting that diamonds and not dollars are forever.
His minister’s secret service amnesty revealed offshore assets of R68,6bn (for 42 672 people, with only 20 applications rejected). Looking offshore reveals a worrying trend: that international cash had lured investors. We’ve seen many investors unclear of what to invest in, settling for plain Miss Moneypenny cash products and relying solely on rand
ByMICHAELSTREATFIELD
Strategist, Investec Asset Management
miCHAEl StrEAtFiEld
MICHAEL STREATFIELD is a strate-gist at Investec Asset Management SA responsible for assisting the MD with leadership and business strat-egy issues. He previously headed the marketing division at Investec Asset Management, primarily involved in investment marketing and product development for the institutional and personal investment businesses. n
WArrEN mClEodWarren McLeod is a member of Omam’s quantitative and risk unit and is responsible for the asset man-ager’s investment risk management. He has a Masters’ in Business Sci-ence. n

depreciation to drive returns. Those returns are barely above inflation and will ensure that in years to come this money won’t be supporting a Krug and caviar lifestyle.
Globalisation has arrived and Dr Excon is living in a new world. Cum-bersome rules and regulations place institutional investors in a static strait-jacket, making it difficult to change their international allocation easily.
It’s a long process to get money out, so people are unlikely to bring it back to repeat it even if the SA story looks good. One can’t treat international assets as an oddjob; they have to be integrated within the whole fund’s strategy to max-imise returns. There’s a need to have the script changed to improve flexibility for investors.
Dr Excon will fade into history (retir-ing with his nice fluffy white cat) and just like the end of the Cold War, there are now new villains. The terrorists Lo Reel Return and Eddy Expenses need to be kept in check to ensure the sav-ings of queen and country are kept safe. Investors need to make sure their foray offshore adds value beyond a gamble at Casino Rand.
Ironically, ahead of this recent crack in the rand – when the rand was over-valued – unit trust and retirement fund
investors were underweight interna-tional assets (12% in September 2005). That speaks to a concern with regard to international risks after fingers were burnt in 2001. Was it time to live and let die and for SA investors to retire and hang up their Walther PPKs?
In a world where volatility is increas-ing and interest rates are heading up, global investment trends are showing a greater need than before to diversify risk. It’s time for investors to speak to their advisers and pop past Q’s office to get the following gadgets in their quest for successful international investing:1) Risk Re-breather: Gives you valu-
able oxygen to avoid panic and to think through your long-term strat-egy when your portfolio is “under water”.
2) Real Return Jet Pack: Leapfrog infla-tion by taking on more risk as appro-priate and getting into more flexible international strategies with profes-sional money management. Helps you get beyond a cash account in a single currency.
3) Steady Trigger Finger: Money needs a long-term plan and not everybody only lives twice. Investing money at extremes (as in 2001) guaran-tees poor future results when valua-tions normalise. Investing regularly according to a strategic plan is bet-
ter than reacting to currency moves after the event.
4) Multi-purpose Wristwatch (with scanners, lock-picks and laser beam): Opportunities internation-ally abound. Individual markets and geographies can be volatile on their own. There are increasing trends to “new balanced”: investing in well diversified multi-asset portfolios that have full discretion to invest across markets, hedge funds and currencies.
New times, new heroes. Dr Excon will die another day. For now, investors, it’s time to look ahead, forget about past international mistakes, keep your gad-gets at hand and never say die again. n
of offshore equity are also highlighted when you consider the optimal offshore weighting recommended at different risk levels on an unconstrained efficient frontier (see graph below). This shows that at the regulated, 15% maximum that institutions are allowed to invest offshore, portfolio risk is still a relatively low 5%. If the regulators doubled the allowance to 30%, portfolio risk would still remain well within the risk levels tolerated by pension funds in an actively
managed fund, and performance would be enhanced as long as international assets have a medium to good return relative the other asset class returns.
It’s worth noting that the optimal unconstrained portfolio recommends an offshore allocation of 34% (32% in equi-ties and 2% in bonds) at a risk constraint of 10,5% - not much higher than the range anecdotally considered appropri-ate from a prudential perspective (25% to 30%), given that the bulk of SA pen-
sion fund liabilities are denominated in SA rand and thus need to be matched by local assets. n