in montana secondary agricultural education …
TRANSCRIPT
An examination of pollution prevention in Montana secondary agricultural education laboratoriesby Thomas Martin Bass
A thesis submitted in partial fulfillment of the requirements for the degree of Master of Science inAgricultural EducationMontana State University© Copyright by Thomas Martin Bass (2000)
Abstract:The purpose of this study is to determine what practices, in the area of pollution prevention and wastemanagement, are being applied by Montana agricultural educators in the classroom, laboratory andfield settings. When certain defined practices are not applied, barriers to implementation will beexamined. Data will also be collected and analyzed regarding Montana agricultural educators’perceptions and knowledge base-concerning pollution prevention, waste management and hazardousmaterial management.
A survey titled “Pollution Prevention in Agricultural Education Laboratories and Field Areas’’ wasadministered to 73 Montana Agricultural Education Programs, which appeared on a statewideagricultural education program directory. This study was a census of the population of MontanaAgricultural Education programs. .
Subject areas examined in this study are divided into ten sections: 1) Demographic data, 2) Programinformation, 3) Agricultural and power mechanics laboratory, 4) Green house and farm plot, 5) Woodlaboratory, 6) Metals/welding laboratory , 7) Animal confinement area, 8) Curriculum and classroommanagement, 9) Perceptions, 10) Barriers to Pollution Prevention.
Results of the study found that deficiencies were identified with current practices in pollutionprevention and waste management by Montana agricultural educators. Lack of knowledge, or need forfurther education was the primary barrier to practice and improvement of pollution preventionidentified by survey respondents. Agricultural educators in Montana, had positive perceptions ofpollution prevention. Most agreed that agriculturalists are responsible for their own actions concerningthe environment and that the actions of few can have a wide effect. It was documented that Montanaagricultural educators do have a basic knowledge or awareness of pollution prevention and properwaste management.
The participants in this study indicated a need for education in pollution prevention specific toagricultural teaching laboratories and field areas. Agricultural educators in Montana are interested inpursuing this issue. Data obtained through this study may also be pertinent in other areas of vocationaleducation were similar teaching or research facilities are maintained. Such research can also contributeto that which has already been done in other areas such as chemistry and biology education.
It is recommended that a pollution prevention education or training program, specific for agriculturaleducation, should be developed as soon as possible. It should focus on source reduction of waste,management of unavoidable waste and consideration to proper facilities planning and management.Agricultural educators themselves should be as involved as possible in the development of pollutionprevention training and education. Such information should become part of a holistic pollutionprevention resource for educational institutions including all traditional, academic and vocational(agriculture included) teaching areas.
AN EXAMINATION OF POLLUTION PREVENTION
IN MONTANA SECONDARY AGRICULTURAL EDUCATION LABORATORIES
by
Thomas Martin Bass
A thesis submitted in partial fulfillment of the requirements for the degree
of . '
Master of Science
in
Agricultural Education
Montana State University Bozeman, Montana
January, 2000

ii
b APPROVAL
of a thesis submitted by
Thomas Martin Bass
This thesis has been read by each member of the thesis committee and has been found to be satisfactory regarding content, English usage, format, citations, bibliographic style, and consistency, and is ready for submission to the College of Graduate Studies.
Dr. Martin FrickCommittediChair Date
Approved for the College of Agriculture
Dr. Donald KressDate
Approved for the College of Graduate Studies
DateDr. Bruce McLeod

in
STATEMENT OF PERMISSION TO USE
In presenting this thesis in partial fulfillment of the requirements for a master’s
degree at Montana State University-Bozeman, I agree that the Library shall make it
available to borrowers under rules of the Library.
IfI have indicated my intention to copyright this thesis by including a copyright
notice page, copying is allowable only for scholarly purposes, consistent with "fair use"
as prescribed in the U.S. Copyright Law. Requests for permission for extended quotation
from or reproduction of this thesis in whole or in parts may be granted only by the
copyright holder.
Signature
Date

iv
ACKNOWLEDGMENT
The author wishes to thank his graduate committee, Dr. Martin Frick, Chair, Dr.
Van Shelhamer, and Dr. Mike Vogel. Their guidance, instruction and moral support
were essential to the completion of this thesis and my entire graduate program. The
author also wishes to thank the entire staff of the Montan State Extension Service
Pollution Prevention Program for their technical assistance and patience throughout the
development of this project. Very special thanks to Barb Planalp for all of her help on
this project and her watchful eye throughout my time in this program.
The author also wishes to thank his entire family for their support in this venture
and their continued encouragement over the distance. Final thanks to my friends and the
people of Bozeman, who welcomed me to this community and made me feel right at
home.

TABLE OF CONTENTS
, Page
1. THE PROBLEM...................... : ............... : ........................................I
Introduction....................................................................................IStatement of Purpose......................................................................3Need for Study............................................................................... 4Objectives .............................................. 5Definitions.......................................... 6Assumptions.................................... 7Limitations............................................................ 7
2. REVIEW OF LITERATURE........ ..................................................... 8
3. METHODOLOGY...................................................... ,1 6
Population Description.................................................. . . : . . . . 16Instrument D esign ........................ : ................................../........ 17Data Collection M ethods............ ................................................. 19Data Analysis Procedures ........................................................... 20
4. RESULTS OF THE STUDY ............... 21
Demographic D a ta .......................................... ; ..........................22Program Information .'................................................................. 26Agricultural or Power Mechanics Laboratory Area.....................28Green House and or Farm Plot.............. ............................. , . . . 32Wood Laboratory , ................................................ 37Metals/Welding Laboratory..................... 39Animal Confinement A rea........................................ ' ................41Curriculum and Classroom Management ............................. 43Perceptions of Environmental Issues in Agriculture................... 44Barriers to Pollution Prevention................................ ,................. 46Interest in Eco-Star Educator Award Program...................... ; . . 47

TABLE OF CONTENTS (Continued)
Page
5. CONCLUSIONS, IMPLICATIONS, ANDRECOMMENDATIONS.......................................... 49
Conclusions........ ................................................................. 50Implications..................................................... .51Recommendations'........................................................................52Recommendations for further study............................. 53
REFERENCES’ .................................. 55
APPENDICES............ ' ..........’............................ ..................................57
APPENDIX A - PRE-SURVEY POSTCARD^....................... . . 58
APPENDIX B - SURVEY INSTRUMENT .......................... 60
APPENDIX C - REMINDER POSTCARD ................. 76
APPENDIX D - SURVEY COMMENTS ................................ , .78
vi
V ll
LIST OF TABLES .
Table Page
1. Survey responses over tim e .......................................................... 232. Age group distribution of survey respondents............................. 243. Occurrence of Pollution Prevention training in college
or in-service updates ....................................................... 254. Teaching experience of survey respondents in years,
organized into categories........................................ 265. Frequency of occurrence and level of use of specific laboratory
areas maintained by respondents..................................... 276. Size of programs by number of students..................................... 287. Number of programs who acquire the following wastes
through teaching activities in agriculturalor power mechanics laboratories ................•............... 29
8. Level of awareness and practice of recycling options and bestdisposal methods for previously mentioned wastes in agricultural/power mechanics laboratories ..................31
9. Practice of safe storage methods and spill containment■ for engine fluid wastes................................................ ' . . 32
10. Occurrence of proper practices in pesticide storage, andhandling in greenhouses and/or farm plots .................... 33
11. Level of practice of proper pesticide application and handlingtechniques ......................................................,............... 34
12. Level of practice of recommended techniques related toagricultural chemical safety, storageand alternative techniques (compost)....................... 35
13. Awareness of basic water run-off patterns in the vicinityof greenhouse and/or farm plots........................................35
14. Level of awareness and practice of recycling and propertechniques in agricultural chemicaland chemical container disposal .......... ................. .. . . 36
15. Types of waste generated in wood laboratory............................3716. Occurrence of proper storage technique of wood finishing
chemicals and awareness of alternative disposal method (compost) for sawdust ................................. 38

V lll
LIST OF TABLES
Table Page
17. Level of awareness and practice of proper disposal techniquesfor wood finishing chemicals (paint,, stain,sol vents/strippers and other waste) ........... ’................... 39
18. Occurrence of waste generation form metals/weldinglaboratory and potentially hazardous gas use................... 40
19. Level of practice of recommended safety techniques inmetals/welding laboratory...................... '....................... 40
20. Level of awareness and practice of recycling options for 1scrap m etal....................................................................... 41
21. Animal species maintained by respondents................................. 4222. Occurrence of waste management plan and awareness of
water run-off patterns from animal confinement area . . . 4223. Occurrence of waste removal from animal confinement area
and occurrence of generation of veterinary or • biological (medical) w aste...............................................43
24. Occurrence of classroom material recycling other thanlaboratory waste previously mentioned and occurrenceof inclusion of environmental topics in curriculum......... 43
25 . Level of agreement with statements concerning perceptions of waste management and pollution prevention in a broad agricultural setting............................ 45
26. Reduction in barriers to pollution prevention ............................4727. Number of respondents who expressed interest in participating
in Montana Eco-Star Educator reward program for environmentally responsible educators ......................... . 48

ix
LIST OF FIGURES
Figure ' Page
1. Gender composition of survey respondents .............................24
2. Level of education attained by survey respondents.................... 25

X
ABSTRACT
The purpose of this study is to determine what practices, in the area of pollution prevention and waste management, are being applied by Montana agricultural educators in the classroom, laboratory and field settings. When certain defined practices are not applied, barriers to implementation will be examined. Data will also be collected and analyzed regarding Montana agricultural educators’ perceptions and knowledge base- concerning pollution prevention, waste management and hazardous material management.
A survey titled “Pollution Prevention in Agricultural Education Laboratories and Field Areas’’ was administered to 73 Montana Agricultural Education Programs, which appeared on a statewide agricultural education program directory. This study was a census of the population of Montana Agricultural Education programs. .
Subject areas examined in this study are divided into ten sections: I) Demographic data, 2) Program information, 3) Agricultural and power mechanics laboratory, 4) Green house and farm plot, 5) Wood laboratory, 6) Metals/welding laboratory , 7) Animal confinement area, 8) Curriculum and classroom management, 9) Perceptions, 10) Barriers to Pollution Prevention.
Results of the study found that deficiencies were identified with current practices in pollution prevention and waste management by Montana agricultural educators. Lack of knowledge, or need for further education was the primary barrier to practice and improvement of pollution prevention identified by survey respondents. Agricultural educators in Montana, had positive perceptions of pollution prevention. Most agreed that agriculturalists are responsible for their own actions concerning the environment and that the actions of few can have a wide effect. It was documented that Montana agricultural educators do have a basic knowledge or awareness of pollution prevention and proper waste management.
The participants in this study indicated a need for education in pollution prevention specific to agricultural teaching laboratories and field areas. Agricultural educators in Montana are interested in pursuing this issue. Data obtained through this study may also be pertinent in other areas of vocational education were similar teaching • or research facilities are maintained. Such research can also contribute to that which has already been done in other areas such as chemistry and biology education.
It is recommended that a pollution prevention education or training program, specific for agricultural education, should be developed as soon as possible. It should focus on source reduction of waste, management of unavoidable waste and consideration to proper facilities planning and management. Agricultural educators themselves should be as involved as possible in the development of pollution prevention training and education. Such information should become part of a holistic pollution prevention resource for educational institutions including all traditional, academic and vocational (agriculture included) teaching areas.

I
CHAPTER I
' THE PROBLEM
Introduction
Environmental concern seems to be rising in our society. A quick scan of our
media sources reveals that the environment is certainly a topic receiving much attention.
New fields of study are dedicated to this area, and environmental issues are finding their
way into our traditional subjects of study and research. All segments of society need to
become more responsible in the way that they utilize resources and manage waste and
potentially hazardous materials.
An important concept in the arena of environmental issues is pollution prevention,
conceived in the early 1980's. This idea was bom into national policy with the passing of
the Pollution Prevention Act of 1990. The pure concept of pollution prevention (P2)
deals with source reduction of waste, use of alternate (better for human health and the
environment) products, methods and processes as well as conservation of resources. The
passing of this act helped create resources for research, education, technical assistance •
and development of policy and legislation.
The movement to act more responsibly where issues of pollution are concerned
continues. It is important that all segments of society and industry recognize their

2
responsibility in helping solve these problems. Through education and increased
awareness, society can make pro-active decisions regarding these issues before regulatory
agencies force change all at once. Williams recognized agriculture’s involvement in this
arena, when he stated, “Production agriculture and agribusiness industries face, as well
as contribute to, environmental concerns” (1993, p. 5).
Institutions such as schools and colleges can potentially be incredible generators
of waste and pollution. Many schools have begun to examine their practices and take
action in acting more responsibly as a whole institution in the areas of waste reduction,
waste management and hazardous material management. Educators in science, especially
chemistry, are examining the way they teach and conduct laboratory experiments. They
are taking steps towards decreasing health risk to students, instructors and the
environment by more effective management of chemicals, potential hazards and waste.
As a part of a larger institution agricultural educators have a responsibility to do
their part in improving the environmental management practices of their programs and in
promoting practices that can have a great deal of influence on the very thing agriculture
relies on: productive, safe, non-polluted land, water and air. Williams supported the
integration of sound environmental practices and. education with agricultural education in
1993 when he stated:
If agricultural educators recognize these {environmental} concerns and . teach their students how to develop solutions to these problems through the
application of scientific principles, then the students, the agricultural industry, and the profession of agricultural education will all benefit (p. 5).

3
Helping agricultural educators in Montana become better environmental stewards will
first require an assessment of the perceptions about, and knowledge of pollution
prevention, as well as current practices in dealing with waste and hazardous materials.
An examination of these points will allow for the development of educational
programs to help agricultural educators make responsible decisions prior to regulatory
government intervention, implement new waste and resource management tools, increase
their personal safety and the safety of their students, pass on responsible behaviors to
their students, and ultimately protect the resources upon which the entire agricultural
industry is reliant. Bogo (1999), quoted former Tufts University dean, Anthony Cortese
as saying, “If the students are learning in class about the environment and how to act
responsibly, and the university through its buildings, its operations and investments is
unsustainable, then they are sending a very subtle but effective message that says ‘do
what I say, not what I do’, practicing what they preach is extremely important” (p. 39).
This idea also holds true in the high school setting, especially for agricultural education.
Statement of Purpose
The purpose of this study was to determine what practices, in the area of pollution
prevention, are being applied by Montana agricultural educators in the classroom,
laboratory and field settings. When certain defined practices were not applied, barriers to
implementation were examined. Data was collected and analyzed regarding Montana

4
agricultural educators’ perceptions and knowledge base concerning pollution prevention,
waste management and hazardous material management.
Need for Study
The following statement, published by the United States Environmental Protection
Agency (EPA, 1990), sums up the multifaceted importance of practicing and teaching
pollution prevention in educational settings.
Reduction of pollutant emissions associated with research and educational activities is an important objective consistent with traditional environmental policy. More significantly, however, the adoption of waste minimization by the research and educational community carries with it. a tremendous potential for designing pollution out of future industrial (or agricultural) processes right in the lab. Waste minimization awareness can also be instilled and propagated by educational institutions, so that today’s students and tomorrow’s professionals can apply pollution prevention in their endeavors. Hence the importance of instituting pollution prevention within research and educational organizations cannot be overstated (p. I).
The previous quote gives reasons why implementation of these concepts are
important, but does not convey the need for research. Research is needed.
Implementation or further development of practices cannot occur without an assessment
of current practices, barriers to implementation and general knowledge about the subject.
The role of agricultural educators in the area of pollution prevention, waste
management arid hazardous material management has not been examined well at all. Of
853 articles published in the Journal of Agricultural Education and papers presented at
the National Agricultural Education Research Meetings from 1986 to 1996, only 18 dealt

5
with what was categorized as “environmental” issues (Radhakrishna and Xu, 1997). That
means only two percent of published research in these two venues were dedicated to
environmental issues. Within this two percent, many papers dealt with sustainable
agriculture and organic farming. Research on pollution prevention within the realm of
agricultural education is non existent. Radhakrishna and Xu described environmental and
sustainable agriculture topics as “emerging topics” (1997). Researching issues in
pollution prevention as it pertains to agricultural education and agricultural teaching
laboratories will fill a current void. A baseline of pollution prevention information
gathered from agricultural educators will provide a platform from which future research
and education can be developed. An initial area of priority can be identified and efficient
progress can be made toward improving the perceptions, level of knowledge and practices
of pollution prevention by agricultural educators.
Objectives
The following objectives are put forth, in order to fulfill the purpose of this study:
(1) To determine Montana agricultural educators’ current practices in pollution
prevention;'
(2) To identify barriers to implementation of practices in pollution prevention by
Montana agricultural educators;
(3) To determine Montana agricultural educators’ perceptions of pollution prevention;
(4) To determine Montana agricultural educators’ level of knowledge of pollution
prevention.

6
Definitions
Pollution Prevention (P2) - an activity that relies on source reduction of pollutants. P2
stands above recycling, treatment, and disposal in a waste management hierarchy.
P2 is not limited to, but may include the following concepts: waste reduction,
reuse and in-house recycling of materials, water conservation, energy conservation
and hazardous material substitution. Under P2 one waste stream cannot be turned
into another (Peaks to Prairies P2 Information Center 1999). In the context of this
study, pollution prevention is used as an umbrella term, including waste
management and recycling. This was done for the sake of brevity in the survey
instrument and to keep new terms and concepts as simple as possible for the study
population. It should be realized that there is a distinct difference between
pollution prevention, waste management, and issues regarding environmental
compliance.
Waste - surplus, unusable or byproduct materials.
Waste Management - methods of recycling, treating or disposing of waste and surplus
materials after they are generated or accrued.
Hazardous Materials - materials which may possess personal health or environmental
hazards; material requiring special management to prevent danger to persons,
animals or the environment.

7
Assumptions
Pollution prevention is necessary to provide a safe learning environment and to
sustain and protect natural resources involved in agriculture. The researcher’s beliefs
account for the following assumptions:
1) Waste and potential pollutants'result from certain activities in agricultural
education;
2) Increased awareness of concepts in pollution prevention by educators will
contribute to increased awareness in students;
3) Proper management of waste and hazardous materials will provide a safer learning
environment for educators and students;
4) Pollution prevention in the setting of agricultural education laboratories and other
facilities can impact the environment outside of that setting;
v Limitations
The following limitations exist for this study :
1) The survey population will be limited to agricultural educators in the state of
Montana’s Public School System employed during the 1999-2000 school year;
2) Pollution prevention was primarily examined in laboratory and field activity
settings, curriculum only received brief attention;'
3) The survey was administered in the month of October 1999.

8
CHAPTER 2
REVIEW OF LITERATURE
While there is little to no research on pollution prevention, waste management and
hazardous material management related to agricultural education in secondary schools,
there are resources from parallel fields that provide insight into how these topics are/
pertinent to agricultural education. Traditional science education, predominantly
chemistry and biology, has begun to recognize the need to control wastes that result from
the educational process of conducting laboratory experiments and demonstrations. On an
industrial scale, the activities that make up most of agricultural education’s laboratory and
field projects have been studied in relation to their human health and environmental
impacts.
Collins (1995) introduced the need for pollution prevention and waste
management in the field of chemistry education and research when he stated that,
“concern for the environment has become an important factor in developments in science
and technology (p. 965).” The term “green chemistry” has been used for several years
now. This term, or related terms such as “primary prevention” and “environmentally
benign chemistry” deal with the idea that activities in chemistry education and research
that are potentially harmful to the environment can be substituted with less polluting or

9
non-polluting alternatives (Collins, 1995). Collins stated that green chemistry is the most
widely used, and offers the strongest description of the concepts involved (1995).
Comparisons can be made between the defense of green chemistry offered by
Collins and the need for pollution prevention and waste management in agricultural
education. Collins (1995) stated that:
The idea of green chemistry has an energy that properly belongs in university research laboratories and classrooms where it can be nurtured in the most positive way. It presents academic chemists with an opportunity to develop a new and optimistic way of looking at.chemistry and planning to contribute to it’s future (p. 965).
Integrating practices of pollution prevention into agricultural education allows educators
and students alike to look at agriculture with a new perspective and contribute to its
future.
One could argue that pollution prevention should be easier to integrate in
agricultural education than other fields. Swan and Spiro (1995) stated that,
“environmental issues and standard chemistry curriculum do not always map onto one
another exactly” (p. 967). The authors describe difficulty experienced by chemistry
educators in meshing the two topics. Agriculture and the environment are very
integrated. Agricultural educators and students already have an idea of how the two are
related. In a survey conducted on the impacts of sustainable agriculture, agricultural
educators and students recognized that sustainable agricultural practices involved or
contributed to the following: better conservation of soil, greater management
requirements, reduced use of chemicals, protection of groundwater, safer food, and

10
/
protection of wildlife and woodlands (Williams and Wise, 1997). Such realistic
associations between agriculture and the environment by educators and students are a
positive sign that barriers experienced in chemistry environmental education may not be
as heavily encountered.
Disappointed by low awareness of agriculture and the food and fiber systems by
elementary students, several entities in the state of Ohio developed AgYenture Magazine
a teaching tool for use in elementary education (primarily fourth grade) (Swortzel, 1997).
The purpose of AgVenture Magazine was to provide a tool to be used across all subject
matters that would increase the awareness of agriculture and the methods by which we get
our food, clothes and many raw materials by elementary students. Swortzel examined
how elementary teachers integrated this magazine into other subject areas; he fourid that
■while the most use of AgVenture Magazine was in social studies, the second most
popular use of the magazine was in education on environmental issues (1997). The
margin of environmental issues over third placing general science was 11%; social
studies led environmental issues by 13% (Swortzel, 1997). When left to their own
recognizance, non-ag elementary teachers recognized the important relation between
agriculture and the environment.
Agricultural educators maintain a variety of teaching laboratories to help fulfill
the objectives set forth in their curriculums. Some areas of study defined in the Montana
Agricultural Education Curriculum that may contain laboratory sections include the
following: animal husbandry, metallurgy, crop production, horticulture, internal
combustion engines, hydraulics (transmission of power), material fabrication and repair.

11
equipment maintenance and management and agricultural construction (MSU-AgEd,
1994). The labs associated with the previously listed areas of study can produce the same
wastes that their larger scale counterparts in industry and production agriculture. Along
with many other subject areas, agricultural education has already been identified as
producing hazardous waste through its teaching activities (EPA, 1990).
The United States EPA published a Pollution Prevention guide for research and*
■ educational institutions in 1990. Within this document waste streams from a variety of
educational activities were identified. Subjects, which may commonly be included in an
agricultural education curriculum, that were recognized as potentially producing waste or
hazardous materials included the following: (broad) agriculture, horticulture/landscaping,
woodworking, metalworking, welding, auto mechanics, masonry and machine shop
(EPA, 1990). Although not an exhaustive list of potential problem materials, the
following wastes were identified as coming from the previously mentioned subject
activities: pesticides, fertilizers, stains, solvents, wood preservatives,.paints, metal dust,
metal waste, de-greasing solvents, oil, grease, batteries, acids, alkaline wastes, and
stripping and cleaning solutions (EPA, 1990).
Many wastes pose an immediate personal health threat through poor handling
before their disposal or spillage may cause an environmental one. Rein stated, “Perhaps
more than any other occupational group, agricultural workers are exposed to a
tremendous variety of environmental hazards that are potentially harmful to their health
and well being” (1992, p. I). The environment referred to here is the work environment;
within this environment potential hazards include: respiratory hazards, noise, skin

12
disorders, cancers, chemical hazards and heat stress (Rein, 1992). Chemical and noise
hazards in the work environment not only pose threats to human health, but to the greater
environment as well. Respiratory hazards, skin disorders, cancers and chemical hazards
can all be related to how waste and hazardous materials are managed, stored, handled and
transported.
The most widely recommended method in dealing with pollutants, waste and
hazardous materials is source reduction. This is a means of reducing the amount of waste
and surplus material generated, limiting possession of hazardous materials to minimum
amounts needed. In its plan for waste management in schools, the Massachusetts
Department of Environmental Management (MDEM) recommended examining an
institution’s or program’s purchasing strategies (MDEM, 1988). Amounts of material
that are hazardous or may be difficult to dispose of should be purchased only as needed
and gross surplus avoided. MDEM (1988) continued by also recommending the practice
of maintaining detailed inventories of chemicals and stored waste, proper storage
facilities that comply with regulation, and utilizing disposal or transportation methods
that are most economical, such as “milk-run” shipments. A “milk-run” shipment utilizes
small collections from several sources in an area, all of which share shipping costs. Also
related, periodic community collections of certain materials may also prove to be cost
effective. Continuous disposal and recycling options exist for many common wastes.
The automotive repair and maintenance industry and day to day machinery
operation in agricultural production can generate a great deal waste. Engine fluid wastes
such as engine oil, transmission fluid, gasoline, diesel, solvents and cleaners, brake fluid

13
and hydraulic oil can be generated. The importance of proper management of used
engine fluids is supported by the following statements:
1) One gallon of used oil, the oil from a single oil change, can render I million
gallons of water undrinkable;
2) Oil concentrations as small as 50 to 100 parts per million in a sewage
treatment system can fowl the treatment process;
3) Concentrations as low as 310 parts per million of oil can cause serious long
term effects to freshwater fish species (EPA 1994, p. 4).
A great need exists for proper engine fluid management along the entire spectrum of
waste generators, from the “do-it-your-selfer”, to the mechanics teaching lab, and finally
large agricultural operations and commercial auto repair businesses.
■ Many agricultural education programs maintain greenhouses and small farm plots.
These teaching labs raise the same concerns one would find with their respective larger
industries of horticulture and major crop production. Latimer et al. (1996) reported the
nursery industry is the second greatest consumer of insecticides, and runoff water from
greenhouses and nurseries has been the subject of discussion on new regulations. Two
impediments to pollution prevention, with respect to conventional pesticide use in the
horticulture industry, stated by Latimer, et. al. (1996) were “lack of Sufficient educational
or resource information for users on potential or available alternatives, and lack of
funding for educating the users on the implementation of alternatives” (p.121-122).
. Risse (1998) reported that “the most common environmental pollutants from crop
production are sediment, nutrients and pesticides” (p. 37). These pollutants are produced

14
on incredible scales-in production agriculture, but management in smaller scale
operations, such as teaching labs, is just as important. The University of Florida has been
involved in a study that assessed pesticide contamination at agricultural research
universities (Thomas, 1994). In the study, 49 pesticide mixing and loading sites at
research universities were tested for pesticide contamination. Thomas (1994) reported
that, “seventy-eight percent of these sites were found to have soil or ground water
pesticide levels which exceed one or more recommended action levels. Many also
exceeded allowable levels under federal and or state hazardous waste regulations” (p.
203). In the case of agricultural chemical contamination, the problem has already been
identified in the teaching/research arena.
The residential construction industry in America is making efforts to become
more environmentally responsible with initiatives in waste reduction and resource ■
management. McStain Enterprises, a Denver based construction firm promotes practices
that reduce the impact on diminishing wood and other natural resources (Fanjoy, 1999).
“Much of the program [McStain’s Built Green Program] involves the use of recycled and
engineered building products” (Fanjoy, 1999, p. 87). Concepts of wood resource
conservation should also be understood in the agricultural and vocational
wood/construction laboratory setting.
Pollution prevention is also needed wherever agricultural animals are maintained;
large scale animal confinement operations undergo a great deal of scrutiny concerning
environmental impact. Risse (1995) stated that, “Although problems associated with
small scale, agricultural livestock production do not receive as much attention as larger

15
operations, small operations can have a substantial impact on rural environmental
quality” (p. I). Even maintaining a few animals in the teaching field area or laboratory
carries with it responsibilities related to environmental concerns.
Agricultural teaching laboratories mimic different activities and components of
the previously mentioned industrial and production agricultural situations. The same
environmental concerns raised there, should also remain in the scaled down activities
associated with agricultural and vocational education. It has already been shown that the
chemistry and biology teaching laboratories are potential sources of hazardous waste and
pollutants. All of this information may be used to facilitate environmental assessment of
agricultural teaching laboratories and field areas.
16
CHAPTER 3
METHODOLOGY
The following methods were used to meet the objectives of this study. They are
described within this chapter in four sections: I) Population Description, 2) Instrument
Design, 3) !Data Collection Methods, and 4) Data Analysis Procedures.
This was a descriptive research study to determine the current practices in
pollution prevention conducted by Montana agricultural educators in secondary schools,
as well as to determine barriers preventing these educators from engaging in pollution
prevention. Measurements related to perceptions and knowledge on the subject possessed
by agricultural educators were also made.
Population Description
Potential individuals for the study population were identified through the
Directory of Montana Agricultural Educators, maintained by the Agricultural Education
Program at Montana State University. Seventy-three programs were listed in the roster
updated fall of 1999. For programs with multiple teachers, all were included on the
address. Potential participants were contacted by postcard prior to inclusion in the survey
mailing. Every program on the roster was included in the mailing, therefore this was a
census and all agricultural education programs at secondary schools in Montana could

17
participate. A study proposal was sent to the president of the Montana Vocational
Agriculture Teachers Association. As a representative of many of the agricultural
educators in Montana, this person was considered by the researcher to possess valid
opinions concerning the proposed research population. Positive comments were received-
concerning the general project idea as well as the speculated acceptance by agricultural
educators in Montana. The population included in the study was limited to individuals
meeting the following criteria:
1. Those employed as agricultural educators in Montana secondary schools in the
school year 1999-2000.
2. Those educators listed, by their program/school name on the Directory of
Montana Agricultural Educators updated fall of 1999. '
Instrument Design
The research instrument was a survey constructed with partial adherence to the
Total Design Method (TDM) published by Dillman (1978). The survey instrument is a
collection of questions which were developed from review of related literature, expert
advice and prior use in other related surveys or audits. A brief demographic
questionnaire, one question on curriculum and a single question related to the EcoStar
award program sponsored by. the Montana State University Extension Service made up a
small portion of the survey. The remainder of the survey deals directly with this study’s
objectives. Other than demographic information, anonymity was protected. There were

18
no distinguishing features on the survey instruments which could lead to identification of
participants upon return. Identification of participants by name was solely voluntary.
The survey was constructed with a combination of questions using three and five
point Likert-type scales, nominal scale and open ended format. Question format was
chosen on appropriateness for the type of answer desired and to maintain the highest
instrument validity. Further comments were encouraged at the end of the survey on any
related topic or issue. These comments are provided in Appendix D.
A pilot test of the survey was conducted. Twenty surveys were sent out to
technology education instructors in Montana secondary schools. While this audience did
not maintain all of the same teaching laboratories, many similarities did exist. This
audience was encouraged to evaluate the survey for content and face validity. A survey
draft was also administered to an expert panel, composed of a subject matter specialists,
and two agricultural education professors (university level). Appropriate adjustments
were made to the instrument in accordance with comments made by pilot audience and
expert panel.
A Cronbaclfs Alpha-Reliability Analysis was conducted using all Likert-type
scale questions in the survey instrument on the final data. “For research purposes, a
useful rule of thumb is that reliability should be at least .70 and preferably higher”
(Franken and Wallen, 1996 p. 163). The Cronbaclfs Alpha-Reliability coefficient rating
for this instrument was .78, therefore the overall reliability of the survey was acceptable.

19
Data Collection Methods
The data for this study was collected using a mailed survey instrument. Dillman’s
TDM was considered while designing the following mailing timetable:
1) . October 12, 1999-pre-survey postcard sent (Appendix A);
2) October 15, 1999-1st cover letter and survey sent (Appendix B);
3) October 22, 1999- reminder announcement at Montana Vocational Agriculture Educators Conference made; and
4) November 2, 1999- reminder postcard sent and electronic reminder on Met-Net made (Appendix C).
As stated earlier, a total of 73 surveys were mailed to agricultural educators in .
Montana secondary schools. A cover letter accompanied the survey instrument
(Appendix B). The survey was designed to be a self mailer for return. Postage was
provided for the respondent. Data from returned surveys was manually entered into
Microsoft® Excel®. Comments and answers to open ended questions were typed in
Corel® Word Perfect® and are available in Appendix D. All spreadsheets were prepared
for presentation in table form.
A final response rate of 56.2% was obtained, a full explanation of this data is
available in Chapter 4 and also described in Table I . Two additional surveys were
received after data analysis was complete and narration was near final draft. They are not
included in the data reported here. Dillman (1978) finds that, "there is almost no
difference in response rates for various lengths below 12 pages, or about 125 items.
Eiowever beyond that length, the response rates decline to an average of 65%" (p.27).

20
The length of this survey hovered around this barrier and it may or may not have been a
factor in response rate. It is believed that surveys within special audiences should receive
higher response rates (Dillman51978). However5 other factors may contribute to reduced
rate. It was the researcher’s belief that sensitive subject matter and fear of self-
incrimination was a contributing factor to a response rate less than that projected by
Dillman. Time constraints upon the researcher, as well as financial limitations
contributed to the need to modify Dillman’s method and ability to do further follow-up.
Data Analysis Procedures
Data analysis was conducted using Microsoft® Excel® and SPSS® statistical
software. Expert guidance was sought during statistical analysis of the data. Early and
late respondents were examined for statistical difference by a t-test and Mann-Whitney U
test. Gall5 Borg5 and Gall (1996) stated that, “If you are concerned about score
distributibns of your data, you should consider doing both a t-test and its non-parametric
Counterpart5 either the Mann-Whitney U test or the Wilcoxon signed rank test” (p. 390).
The hypothesis that there would be no difference between the two groups was accepted,
as no significant differences were found at the .05 level. Late responders were combined
with early responders for the remaining data analysis. Response frequencies for all
survey questions were calculated in Excel® spreadsheets, tables and figures were prepared
in Corel® Word Perfect®, and statistical analysis on early and late respondents was done
in SPSS®.

21
CHAPTER 4
RESULTS OF THE STUDY
The study was designed to identify Montana agricultural educators’ level of
awareness and level of knowledge of pollution prevention, as well as to measure the
frequency of certain practices in pollution prevention. The study hoped to also identify
barriers to implementation of practices in pollution prevention and measure the
perceptions of pollution prevention and the environment held by Montana agricultural
educators. The results of this study are divided into ten sections: I) Demographic data, 2)
Program information, 3) Agricultural and power mechanics laboratory, 4) Green house
and farm plot, 5) Wood laboratory , 6) Metals/welding laboratory , 7) Animal
confinement area, 8) Curriculum and classroom management, 9) Perceptions, and 10)
Barriers to Pollution Prevention.
Since not all total respondents answered each section of the survey, percentages
throughout the results are representative only of the frequencies of a response to that
single question alone. The total number of responses for each question is listed under
"Frequency, Total" for that question in the table, or below the table when indicated by an
asterisk. In Table 5, these responses to a question in a section exceed the frequency listed
for that section; it is assumed that some teaching activities may take place although a full
laboratory for such activities may not exist. Due to the sensitive nature of this survey,

22
and the perception by the population that some answers may be incriminating, anonymity,
was protected. This issue also may have led respondents to omit certain demographic
data which they felt may lead to their identification. All respondents’ answers to open
ended questions are available in Appendix D.
Demographic DataJ
Seventy-three surveys were mailed to agricultural education programs identified
in Directory of Montana Agricultural Educators. All surveys were assumed to be
delivered correctly; none were returned due to postal problems. Three requests were
made to receive second copies because the original survey was lost by the potential
respondent.
Table I represents the return rate of surveys over the study period. Eighteen
surveys were returned within a week of the initial mailing, for a response rate of 24.7%.
A verbal reminder was given at the MVATA meeting in Butte, Montana on October 22,
1999. Approximately 40 teachers were present at this meeting. The eight surveys ■
returned between the MVATA meeting, and the mailing of the reminder postcard on
November 2, 1999, represent 10.9% of the total returned. Consideration was made in the
return period for the occurrence of the National FFA Convention in Louisville, Kentucky
October 25-31, 1999. A large majority of the survey population attended this event,
therefore disrupting the survey period. On November 2,1999 a reminder postcard was
mailed to encourage those who had not returned their survey to do so. Four surveys were
returned between the mailing of the postcard and the cut-off date of November 9, 1999.
23
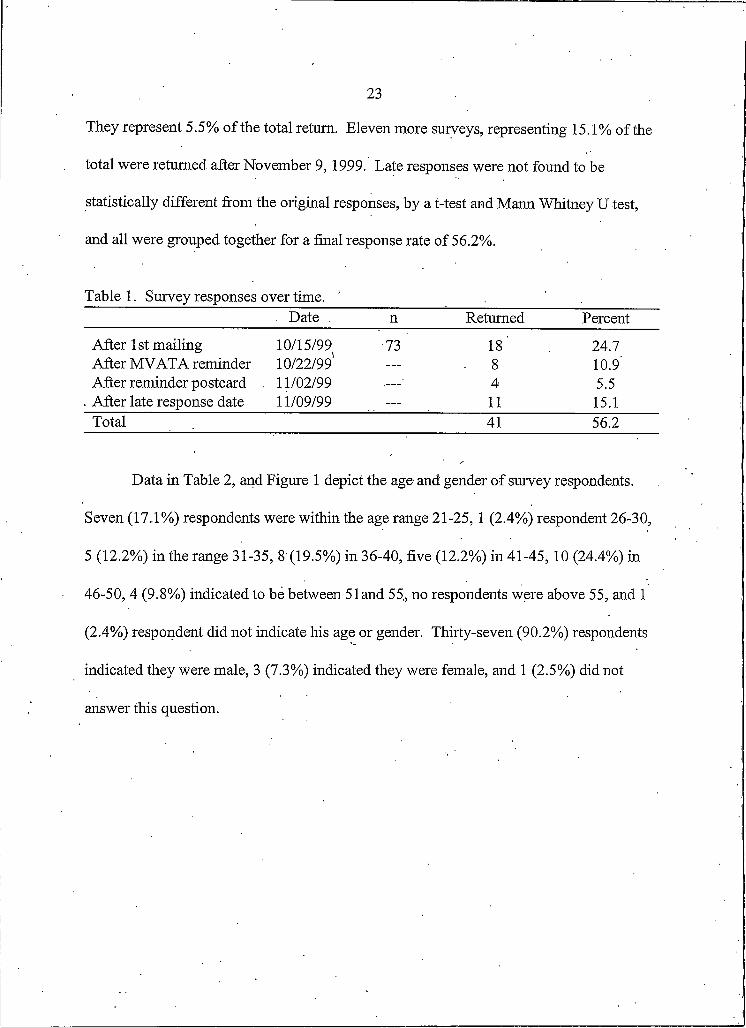
They represent 5.5% of the total return. Eleven more surveys, representing 15.1% of the
total were returned after November 9, 1999. Late responses were not found to be
statistically different from the original responses, by a t-test and Mann Whitney U test,
and all were grouped together for a final response rate of 56.2%.
Table I. Survey responses over time. '. Date . n Returned Percent
After 1st mailing 10/15/99 ■73 18 24.7After MVATA reminder 10/22/99* — 8 10.9After reminder postcard . 11/02/99 4 5.5
. After late response date 11/09/99 — 11 15.1Total 41 56.2
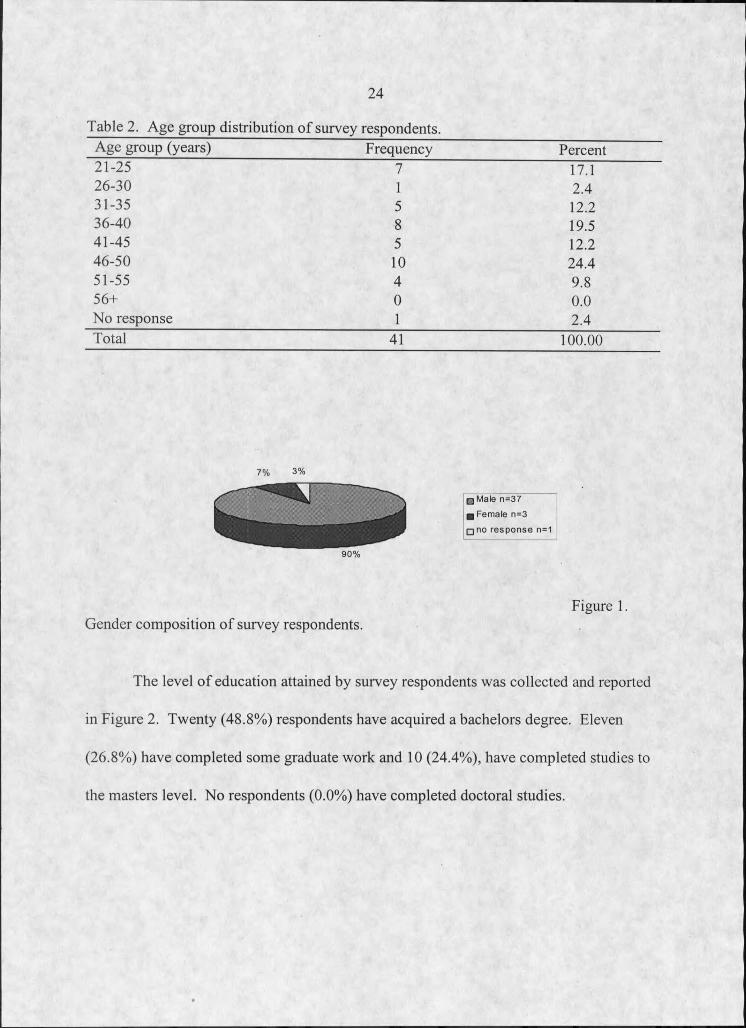
Data in Table 2, and Figure I depict the age and gender of survey respondents.
Seven (17.1%) respondents were within the age range 21-25, I (2.4%) respondent 26-30,
5 (12.2%) in the range 31-35, 8 (19.5%) in 36-40, five (12.2%) in 41-45, 10 (24.4%) in
46-50, 4 (9.8%) indicated to be between Sland 55., no respondents were above 55, and I
(2.4%) respondent did not indicate his age or gender. Thirty-seven (90.2%) respondents
indicated they were male, 3 (7.3%) indicated they were female, and I (2.5%) did not
answer this question.
24
Table 2. Age group distribution of survey respondents.Age group (years) Frequency Percent21-25 7 17.126-30 I 2.431-35 5 12.236-40 8 19.541-45 5 12.246-50 10 24.451-55 4 9.856+ 0 0.0No response I 2.4Total 41 100.00
□ Male n=37 g Female n=3□ no response n=1
Figure I.Gender composition of survey respondents.
The level of education attained by survey respondents was collected and reported
in Figure 2. Twenty (48.8%) respondents have acquired a bachelors degree. Eleven
(26.8%) have completed some graduate work and 10 (24.4%), have completed studies to
the masters level. No respondents (0.0%) have completed doctoral studies.

25
24% 0 %
49%^ B a c h e l o r s only n = 20 g S o m e g r adu a t e work n = 1 I□ Master s n = 1 0□ Doctorate n=0
Figure 2. Level of education attained by survey respondents.
Table 3 data represents the occurrence of pollution prevention training during the
career of survey respondents. Nine (21.9%) reported to have received some sort of
pollution prevention training during college while 32 (78.1%) respondents did not receive
any. Eleven (27.5%) respondents indicated they had received some sort of pollution
prevention training during in-service training updates. Twenty-nine (72.5%) have never
received pollution prevention training at in-service updates.
Table 3. Occurrence of Pollution Prevention training in college or in-service updates.Training received In college At in-service updates
Frequency Percent Frequency Percent
Yes 9 21.9 11 27.5No 32 78.1 29 72.5
Total 41 100.00 40 100.00
Respondents were asked to indicate the number of years they had been teaching.
Table 4 represents all responses to this question divided into groups. The actual mean
number of years teaching is 13.3 based on each individual numerical response. Eleven

26
(26.8%) respondents had been teaching 5 or less years, 6 (14.6%) had 6-10 years
experience, 6 (14.6%) more were found to have 11-15 years experience, 8 (19.5%) with
. 16-20, 7 (17.1%) with 21-25, 2 (5.0%) with 26-30, and I (2.4%) respondent with 31 or
more years of teaching experience.
Table 4. Teaching experience of survey respondents in years, organized into categories.*
Experience group (years) Frequency Percent0-5 11 26.86-10 6 14.611-15 6 14.616-20 8 19.5 .21-25 7 ■ . 17.126-30 2 5.031+ I 2.4
Total 41 100.00.* mean calculated by actual year responses = 13.3
Program Information
Information pertaining to the size and focus of the teaching programs of all
respondents is included in this section. Tables 5 identifies the teaching laboratory areas
maintained by survey respondents as well as the amount of usage each laboratory area
receives. Thirty-nine (95.1%) mechanics laboratories were identified out of 41 responses.
Thirty-seven (90.2%) respondents operated a metals/welding laboratory, 29 (70.1%) a
wood laboratory, 22 (53.6%) respondents maintained greenhouses or farm/garden plots, 3
(7.3%) animal confinement areas and 2 (4.8%) indicated other areas were maintained (see

27r
Appendix D for comments on other). A total of 132 teaching laboratory areas were
maintained. The researcher assumed that some activities associated with certain
laboratory areas may still be practiced even though that laboratory area is not officially
maintained. Teachers were asked to identify which areas were used the most, the results
are as follows, based on the number of times a laboratory area was ranked first
(percentages are only of those who possess such a laboratory area): metals/welding
laboratory ranked first 20 (54.1%) times, mechanics laboratory ranked first 12 (30.8%)
' times, wood laboratory and green house/farm plot were both ranked first 5 (17.2% and
22.7% respectively) times each, animal confinement area received 3 (100.0%) first place
rankings and "other" received no (0.0%) first place rankings. For further explanation to
the percentages listed above and in column five of Table 5 use this example, "54.1% of
those respondents who maintain a metals lab use it the most."
Table 5. Frequency of occurrence and level of use of specific laboratory areas maintained by respondents.
Occurrence Level of UseLaboratory Area Frequency Percent* Frequency Percent*
Metals/welding 37 90.2 20 54.1Ag/power mechanics 39 95.1 12 30.8Wood 29 70.1 5 17.2 -Green house/garden or farm plot 22 53.6 5 22.7 'Animal confinement or pasture 3 7.3 . 3 100.00.Other ■ 2 4.8 0 0.0Total 132 N/A N/A ■ N/A
* Percentage based on 41 respondents to entire survey** Percentage based on number of times ranked first by those who maintain such ah area

28
Table 6 describes the number of students in respondents’ programs. Actual
number of-students was indicated on returned surveys, however data is grouped into
categories. Four (10.5%) programs had 30 or less students, 10 (26.3%) had 31-50, 11
(28.9%) had 51-70, 6 (15.8%) had 71-90, 2 (5.3%) had 91-110 and 5 respondents (13.2%)
had l l l o r more students in their program. The actual mean number of students
calculated from individual responses was 70.35.
Table 6. Size of programs by number of students.*
Number of students in program Frequency Percent
1-30 ■ 4 10.531-50 10 26.351-70 11 28.971-90 6 15.891-110 2 5.3111+ 5 13.2'
Total 38 100.00*mean calculated by actual number of students = 70.35
Agricultural or Power Mechanics Laboratory Area
Thirty-nine respondents answered questions in this section. They identified a
variety of wastes generated through the activities of their agricultural or power mechanics
laboratory. Four wastes were generated by over fifty percent of respondents; they are as
follows: Oil frequency =35 (89.7%), Used oil filters frequency =33 (84.6%), Cleaning
solvents frequency =27 (69.2%) and Antifreeze frequency =24 (61.5%). Waste diesel or
gasoline was acquired by 18 (46.1%) respondents and waste transmission fluid was

29
acquired by 17 (43.5%) respondents. Wastes acquired by the smallest amount of
respondents were: Batteries frequency =9 (23.0%), Brake fluid frequency =8 (20.5%),
Tires frequency =5 (12.8%) and other waste frequency =2 (5.1%). Please see Appendix
D for comments related to "Other". Table 7 also describes this data.
Table 7. . Number of programs who acquire the following wastes through teachingactivities in agricultural or power mechanics laboratories.*
Type of waste frequency percent
Oil (O) 35 89.7Used oil filters (OF) 33 84.6Cleaning solvents (CS) 27 69.2Anti-freeze (AF) ■ 24 61.5Diesel or gasoline (D or G) ' 18 - 46.1Transmission Fluid (TF) 17 43.5Batteries (B) 9 23.0Brake fluid (BF) 8 20.5Tires (T) 5 12.8Other 2 5.1
* Percentage of agricultural or power mechanics laboratories acquiring said waste based on 39 respondents to this portion of the survey. •
Respondents of this section were asked to first indicate their level of awareness of
recycling options and best disposal methods for the wastes identified in Table 7, and then
to indicate how often those options and methods are utilized or practiced.. Table 8
indicates responses to these questions with wastes being divided into two categories. Oil,
transmission fluid, anti-freeze, brake fluid, diesel or gas and cleaning solvents were .
grouped together as engine fluid wastes. Out of 35 respondents to this question, 5
(14.3%) indicated they were very aware of recycling and best disposal methods for these

30
wastes, 19 (54.3) said they were aware, and 11 (31.4%) were not aware. When asked if
they practiced recycling or best disposal methods, 9 (25.7%) answered "Always", 17
(48.6%) answered "Mostly", 8 (22.9%) "Seldom", and only I (2.8%) never practiced
recycling or best disposal methods.
Awareness of recycling options and best disposal methods were not high with
solid waste associated with the mechanics laboratory (batteries, tires and oil filters, and
other). Six (17.6%) respondents out of 34 indicated they were very aware, 16 (47.1%)
aware, and 12 (35.3%) said they were not aware of recycling options or best disposal
methods for such waste. Level of practice of recycling options and best disposal methods
for these waste, also noted in Table 8, is as follows: 7 (20.5%) respondents answered that
they always practiced said options and methods, 11 (32.4%) "Mostly", 11 (32.4%)
"Seldom", and 5.(14.7%) indicated "Never".

31
Table 8. Level of awareness and practice of recycling options and best disposal methods for previously mentioned wastes in agricultural/power mechanics laboratories. .
___________ ■____ Type of waste0, TF, AT, BF, D or G, CS * B, T, OF, Other_____ (fluids) ________________ (solids)
Level of awareness Frequency . Percent Frequency Percentvery aware 5 14.3 6 17.6aware 19 54.3 16 . 47.1not aware 11 31.4 12 35.3
Total 35 100.00 34 100.00
Level of practice Frequency Percent Frequency Percent
’ always 9 25.7 7 20.5mostly 17 48.6. 11 . 32.4seldom ■ 8 22.9 11 32.4never I 2.8 5 . 14.7Total 35 100.00 34 . 100.00
* See Table 7 for explanation of abbreviations.
Where engine fluid wastes were concerned, respondents were asked to indicate
whether they practiced safe storage techniques and utilized spill containment methods.
The following data is also available in Table 9. Of 35 respondents to these questions, 32
(91.4%) indicated that they used sealed containers or spill prevention in storage areas.
Three (8.6%) respondents indicated that they did not. Only 16 (45.7%) respondents
indicated some sort of spill containment method was used in the work area, the remaining
19 (54.3%) indicated that no such methods were used.

32
Table 9. Practice of safe storage methods and spill containment for engine fluid wastes.Use of sealed containers and Use of spill prevention and spill spill prevention in storage area containment in work area
Frequency Percent Frequency PercentYes 32 91.4 16 45.7Nd 3 8.6 19 54.3Total 35 100.00 35 100.00
Green House and/or Farm Plot
Respondents answered a bank of questions related to storage methods and
practices of pesticides and agricultural chemicals. Data related to these questions is.
presented in Table 10. Twelve of 21 (57.1%) respondents maintain an inventory of
pesticides on school property, while the remaining 9 (42.9%) did not. Eighteen of 20
(90.0%) respondents maintain this inventory in a secure area, safe from water penetration,
while 2 (10.0%) did not. Seventeen of 20 (85.0%) indicated that their pesticides were
well labeled and identified, while three (15.0%) indicated otherwise. Of 16 respondents
to the question concerning routine calibration of spraying equipment, 10 (62.5%)
indicated that they regularly calibrated sprayers, while 6 (37.5%) indicated they did not
engage in such activity.

33
Table 10. Occurrence of proper practices in pesticide storage, and handling ingreenhouses and/or farm plots.
Pesticide inventory maintained on property
Use secure storage area safe from water penetration
Pesticides well labeled and identified
Regular calibration of sprayers
Freq.- Percent Freq. Percent Freq. Percent Freq. Percent
Yes 12 57.1 18 ■ 90.0 17 85.0 10 - 62.5No 9 42.9 • 2 10.0 3 15.0 6 37.5Total 21 100.00 20 100.00 20 100.00 . 16 100.00
Further questioning into proper pesticide application and handling techniques
revealed (also shown in Table 11) that out of 21 respondents, 8 (38.1%) always applied
pesticides to deal with targeted organisms, 8 (38.1%) mostly followed this trend, while 4
(19.0%) seldom did and I (4.8%) never applied pesticides for target organisms only. Of
21 respondents,. 13 (61.9%) indicated that they always followed recommended
application rates, 8 (38.1%) indicated they mostly followed recommended application
rates and no one answered seldom or never. When asked if pesticides were mixed on a
pad that would contain spills and prevent contamination of soils or water resources, 5 out
of 19 (26.3%) indicated they always used such an area for mixing, 6.(31.6%) mostly did,
6(31.6%) more indicated they seldom use of such an area, and 2 (10.5%) never.

34
Table 11. Level of practice of proper pesticide application and handling techniques.Apply for target Follow recommended Use spill containmentorganisms only application rates measures while
mixingLevel of practice
Frequency Percent Frequency Percent Frequency Percent'
Always 8 38.1 13 61.9 5 26.3Mostly 8 38.1 8 38.1 6 31.6Seldom ' 4 19.0 0 0.0 6 31.6Never I 4.8 0 0.0 2 10.5
Total 21 100.00 21 • 100.00 19 100.00
Twenty-one persons responded to the question concerning the use of personnel
safety measures, such as clothing, gloves, and eye wear. Table 12 describes this data. Of
those 21 respondents, 12 (57.1%) always made use of such measures, 7 (33.3%) mostly .
did, 2 (9.6 %) seldom took such measures, and no one indicated never. Sixteen of 31
(51.6%) respondents always store chemicals in original containers, 14 (45.2%) answered
mostly, no respondent indicated seldom, while I (3.2%) indicated chemicals were never
stored in original containers. None of 21 respondents indicated that they always compost
old plant material, 8 (38.1%) indicated they mostly did, 9 (42.9%) indicated they seldom
did, and 4 (19.0%) never composted old plant material.

35
Table 12. Level of practice of recommended techniques related to agricultural chemical safety, storage and alternative techniques (compost).
Take recommended Store chemicals Use old plant personal safety measures in original material for
(clothing, gloves, eye wear)____ containers______ . compost
Level of practice . Freq. Percent Freq. Percent Freq.. Percentalways 12 ■ 57.1 16 51.6 o, 0.0mostly 7 ■ . 33.3 14 45.2 8 38.1seldom • 2 9.6 0 0.0 9 42.9never 0 0.0 I 3.2 4 19.0Total " 21 100.00 31 100.00 21 100.00
Two questions were asked concerning the awareness of water run-off from
greenhouses or farm plots and the potential threat posed to water sources and those results
are indicated in Table 13. Of 20 respondents, 14 indicated that they were aware of the
run-off patterns from their green houses or plots, while 6 were not aware. Two of 20 ■
(10%) respondents indicated that the run-off from their greenhouses or farm plots could
immediately threaten water sources, while 18 (90%) were sure run-off could not threaten
water sources, '
Table 13. Awareness of basic water run-off patterns in the vicinity of green houseand/or farm plots. -
Aware of water run-off pattern from Run-off immediately threatens greenhouse or farm plot water source >
Frequency Percent Frequency Percent
Yes 14 70.0 2 10.0No 6 30.0 18 90.0
Total 20 100.00 20 100.00

36.
Twenty respondents answered the first question concerning awareness of
recycling options and proper disposal methods for agricultural chemical containers (see
Table 14). Three (15.0%) respondents indicated they very aware of such options and
methods, 13 (65%) indicated they were just aware, and 4 (20%) were not aware. Three
respondents of 21 (14.3%) indicated they always recycled or properly disposed of
chemical containers, 10 (47.6%) mostly used such options or methods, 5 (23.8%)
indicated seldom, and 3 (14.3%) indicated recycling options or proper disposal methods
were never used.
Table 14. Level of awareness and practice of recycling and proper techniques in agricultural chemical and chemical container disposal.
Recycling options and proper disposal methods for agricultural chemicals and empty chemical containers
Level of awareness Frequency Percent
very aware 3 15.0aware 13 65.0not aware 4 20.0
Total 20 100.00
Level of practice/use Frequency Percent
always 3 14.3 1mostly 10 47.6seldom 5 23.8never 3 14,3
Total 21 100.00

37
Wood Laboratory
The following data is also available in Tables 15 and 16. All 30 (100.0%)\
respondents to the wood laboratories section of the survey indicated that they had surplus
paint in their laboratories, 25 (83.3%) indicated that possessed surplus stains, 23 (76.6%)
possessed surplus solvents and strippers, and 3 (10.0%) indicated that they also possessed
other similar materials. Thirty-four responses were made for the question concerning
storage of the previously mention wood finishing chemicals on site. Thirty-three
respondents (97.0%) indicated that they did store such chemicals, while I (3.0%) •
indicated such chemicals were not stored on school property for more than a few days.'
Twenty-three of 33 respondents (69.7%) indicated that such chemicals were stored in a
fire retardant cabinet, ten (30i3%) indicated such chemicals were not. Out of 29
respondents, 20 (69.0%) indicated that they were aware sawdust could be composted, the
remaining 9 (31.0%) were not aware.
Table 15. Types of waste generated in wood laboratory.*Type of waste Frequency Percent
Paint (P) 30 100.0Stain (ST) • 25 83.3Solvents/strippers (SO) 23 76.6Other 3 10.0
*Percentages based on 30 respondents who maintain wood laboratories in their program.
38
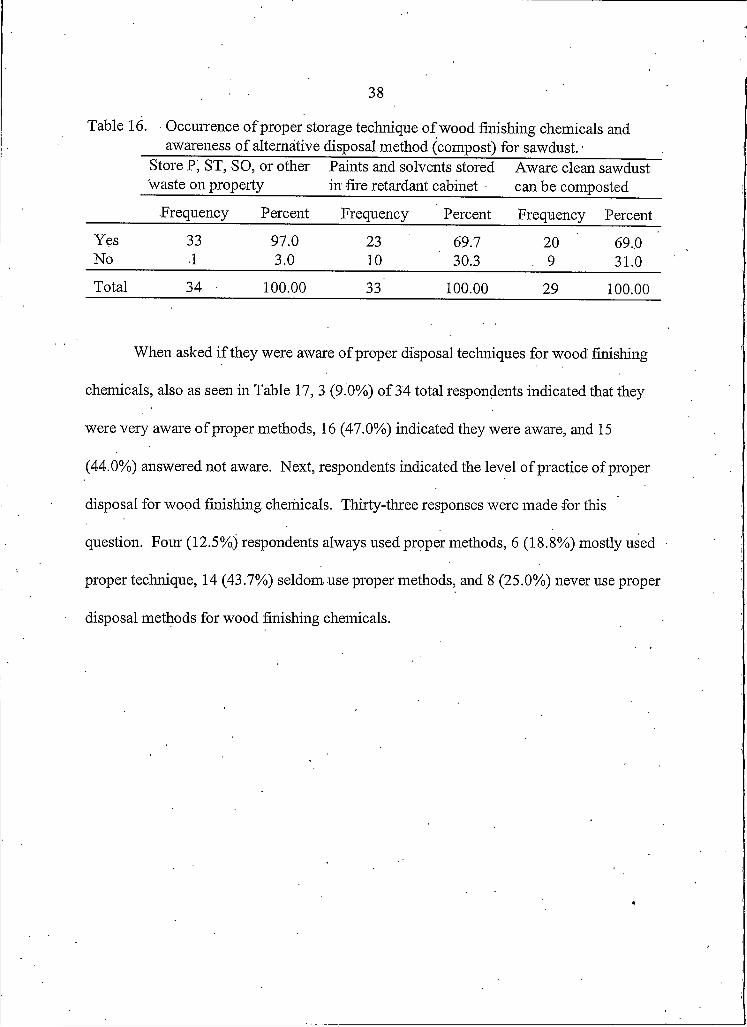
T able 16. Occurrence of proper storage technique of wood finishing chemicals and awareness of alternative disposal method (compost) for sawdust. ■
Store P, ST, SO, or other Paints and solvents stored Aware clean sawdustwaste on property_______ in fire retardant cabinet ■ can be composted
Frequency Percent Frequency Percent Frequency PercentYes 33 97.0 23 69.7 20 69.0No I 3.0 10 30.3 . 9 31.0Total 34 100.00 33 100.00 29 100.00
When asked if they were aware of proper disposal techniques for wood finishing
chemicals, also as seen in Table 17, 3 (9.0%) of 34 total respondents indicated that they
were very aware of proper methods, 16 (47.0%) indicated they were aware, and 15
(44.0%) answered not aware. Next, respondents indicated the level of practice of proper
disposal for wood finishing chemicals. Thirty-three responses were made for this
question. Four (12.5%) respondents always used proper methods, 6 (18.8%) mostly used
proper technique, 14 (43.7%) seldom use proper methods, and 8 (25.0%) never use proper
disposal methods for wood finishing chemicals.

39
Table 17. Level of awareness and practice of proper disposal techniques for wood finishing chemicals (paint, stain, solvents/strippers and other waste).
Recycling options and proper disposal methods for paint, stain, solvents/strippers and other wood shop chemical waste
Level of Awareness Frequency Percent
very aware 3 9.0aware 16 . . 47.0 .not aware 15 44.0
Total 34 . 100.00
Level of Practice Frequency Percent
always 4 12.5mostly 6 18.8seldom 14 43.7never 8 25.0
Total 32 100.00
Metals/Welding Laboratory
The following data is also described in Tables 18 and 19. Thirteen (35.1%)
respondents, out of 37 total for this question, indicated that they generate waste solvents,
paint or waste water from the activities of their metals or welding laboratory area, while
the remaining 24 (64.9%) did hot generate such waste. Also out of 37 respondents, 31
(83.8%) indicated that they used some sort of hazardous gas for welding, while 6 (16.2%)
did not. These 37 respondents also indicated the following: 29 (78.4%). always monitor
. gas tank and system for leaks and verify system is turned off, 6 (16.2%) mostly practice
those activities, 2 (5.4%) seldom engage in such activities, while no one (0.0%) indicated
that they never checked welding systems for gas leaks and verified such systems were

40s
properly turned off Concerning the use of safety clothing in the welding shop, 26
(70.3%) of 37 respondents indicated that such clothing was always used, 11 (29.7%)
indicated such clothing was mostly used, while no responses (0.0%) were recorded for
seldom use or never. Tables 18 and 19 reflect this information.
Table 18. Occurrence of waste generation from metals/welding laboratory and potentially hazardous gas use.
Generate waste solvents, paint or rinse Utilize potentially hazardous water in metal/welding laboratory______ gas for welding purposes
Frequency Percent Frequency Percent
Yes 13 35.1 31 . 83.8No 24 64.9 6 16.2
Total 37 100.00 37 • 100.00
Table 19. Level of practice of recommended safety techniques in metals/welding laboratory.Monitor gas tanks and system for leaks, Use of safety clothing in metalverify system turned off shop area
Frequency Percent Frequency Percent
always 29 78.4 . 26 70.3mostly 6 16.2 11 29.7seldom 2 5.4 0 • 0.0never 0 0.0 0 0.0
Total 37 100.00 37 100.00
Table 20 data describes awareness and use of recycling options for scrap metal.
When asked if they were aware of recycling options for scrap metal, 19 (51.3%)
respondents out of 37 respondents indicated they were very aware of such options, 17
(46.0%) indicated they were just aware and I (2.7%) indicated they were not aware of

41
recycling options for scrap metal. Thirty-six responses were recorded concerning the
level of use of recycling options for scrap metal. Twenty-two (61.1%) respondents'
always recycle, 12 (33.3%) mostly recycle, I (2.8%) seldom recycles, and I (2.8%) never
recycles.
Table 20. Level of awareness and practice of recycling options for scrap inetal.Recycling options for scrap metal
Level of awareness Frequency Percentvery aware 19 ' 51.3aware . 17 46.0not aware I 2.7
Total 37 100.00Level of practice Frequency, Percent
always . 22 61.1mostly 12 33.3seldom I 2.8never I 2.8
Total 36 100.00
Animal Confinement Area
The least number of responses were recorded for this section and are described in
Tables 21 and 22. The following information on animal species maintained is based on
five respondents to this section. Two (40.0%) respondents maintain swine, 3 (60.0%)
keep cattle, 2 (40.0%) keep sheep, I (20.0%) maintains poultry, while 3 (60.0%)
Indicated other species. Of four respondents, 2 (50%) indicated a waste management plan
was in place for their animal confinement area, 2 (50%) indicated such a plan was not in
place. Of five, 4 (80%) respondents were aware of the water run-off patterns of their

42
confinement area, and I (20%) was not aware. However, all five (100.0%) were certain
run-off from their animal confinement areas did not threaten water sources.
Table 21. Animal species maintained by respondents.Species kept Frequency Percentage*Swine 2 ■ 40.0Cattle 3 60.0Sheep 2 40.0Poultry I 20.0Other 3 60.0
* Percentages based on a total of 5 respondents to the animal section of survey.
Table 22. Occurrence of waste management plan and awareness of water run-off patterns from animal confinement area.
Waste management plan Aware of water run-off Run-off immediatelyin place from animal area threatens water source
Frequency Percent Frequency Percent Frequency ( Percent
Yes 2 50.0 4 8fr0 0 0.0No 2 . 50.0 I 20.0 5 100.0
Total 4 100.00 5 100.00 5 100.00
As seen in Table 23, all five (100.0%) respondents indicated animal waste was
removed from animal confinement areas. One (20.0%) indicated veterinary, medical or
other bio-waste was generated, 4 (80.0%) indicated such waste was not generated.

43
Table 23. Occurrence of waste removal from animal confinement area and occurrenceof generation of veterinary or biological (medical) waste.Removal of animal waste from confinement area is needed
Veterinary, medical and bio waste generated
Frequency Percent Frequency PercentYes 5 100.0 I 20.0No o , 0.0 4 80.0Total 5 100.00 5 100.00
Curriculum and Classroom Management
A measurement was also made on the occurrence of pollution prevention, or
environmental topics in other curriculum areas, as well as recycling practices in the.
regular classroom. Table 24 describes this information. Of 36 respondents, 16 (44.4%)
recycle classroom materials not covered in the previously mentioned portions of the
survey, and 20 (55.6%) did not recycle in the classroom. Pollution prevention or general
environmental topics were covered in curriculum used by 22 (59.5%) of 37 respondents
to this question, while 15 (40.5%) indicated such topics were not covered in other
curriculum areas.
Table 24. Occurrence of classroom material recycling other than laboratory wastepreviously mentioned and occurrence of inclusion of environmental topics in curriculum.
Recycle classroom materials other than Curriculum includes some sort of those previously mentioned____________ environmental topics_____________
Frequency Percent Frequency Percent
Yes 16 44.4 22 . 59.5No '2 0 55.6 15 40.5
Total 36 100.00 37 100.00

• 44
Perceptions of Environmental Issues in Agriculture
A measurement was made on the level of agreement with seven statements
concerning concepts of agriculture’s relation to environmental responsibility and
regulation, pollution prevention and waste management, Respondents answered using
the following scale: Strongly agree (SA), Agree (A), Disagree (D), or Strongly disagree
(SD). The following information is listed in Table 25.
When responding to the question, if "the behavior of one person, or small group
of people can have a significant affect on larger environments", 19 (46.3%) respondents
strongly agreed, 22 (53.7%) agreed and no responses (0.0%) were recorded under
disagree or strongly disagree (Frequency total=41). Of 41 respondents, 27 (65.9%)
- strongly agreed, and 14 (34,1%) agreed that "agriculture is dependent on clean safe soil,
air, and water". No respondent (0.0%) answered disagree or strongly disagree. Thirty-
nine responses were recorded for the following statement, "agriculturalists are responsible
for their own actions concerning the environment". Twenty (51.3%) respondents strongly
agreed, 18 (46.2%) agreed, none (0.0%) disagreed and I (2.5%) strongly disagreed.
In reaction to the statement "monetary cost, time and labor are issues to be
considered when making decisions which may affect the environment", 4 (9.8%), of 41
total responses, strongly agreed, 33 (80.5%) agreed, while 3 (7.3%) disagreed, and I
(2.4%) strongly disagreed. Thirty-nine respondents recorded their reaction to this
statement, "considering the previous issues (re: statement 4), it is still possible for
agriculturalists to make environmentally responsible decisions in almost all situations."

45
Fourteen respondents (35.9%) strongly agreed, 24 (61.5%) agreed, I (2.6%) disagreed,
and no responses (0.0%) were made for strongly disagree.
The last two statements dealt with the issue of compliance with preferred practices
or rules. None (0.0%), of 39 respondents, strongly agreed that "agriculturalists are
currently doing enough to protect the environment and sustain the industry". Eighteen
(46.2%) respondents agreed with the statement, 21 (53.8%) disagreed and no respondents
(0.0%) indicated strongly disagree. Respondents, reactions to the statement,
"agriculturalists are capable of policing themselves without intervention by government
and regulatory agencies" are as follows: 5 (12.2%) strongly agreed, 20 (48.8%) agreed,
15 (36.6%) disagreed and I (2.4%) strongly disagreed (Frequency total= 41).
Table 25. Level of agreement with statements concerning perceptions of waste management and pollution prevention in a broad agricultural setting.
Question SA A D SD Total
The behavior of one person or group can Freq. 19 22 0 0 41have a significant affect on larger environments. Percent ■ 46.3 53.7 0.0 . 0.0 100.00
Agriculture is dependent on clean safe Freq. • 27 14 0, 0 41soil, air and water.
Percent 65.9 34.1 0.0 0.0 100.00
Agriculturalists are responsible for their Freq. 20 18 0 I 39 ' ■own actions concerning the ■environment. Percent 51.3 46.2 0.0 2.5 100.00
Monetary cost, time and labor are issues Freq. 4 33 3 I 41to be considered when making decisions which may affect the environment. Percent 9.8 80.5 7-3 2.4 100.00

46
Table 25. (Continued) Level of agreement with statements concerning perceptions of waste management and pollution prevention in a broad agricultural setting.
Question SA A D SD Total
Considering the previous issues, it is still possible for agriculturalists to make
Freq. 14 24 I 0 39
environmentally responsible decisions in almost all situations
Percent 35.9 61.5 2.6 0.0 100,00
Agriculturalists are currently doing enough to protect the environment and
Freq. 0 18 21 0 39
sustain their industry. Percent 0.0 46.2 53.8 0.0 100.00
Agriculturalists are capable of policing themselves without intervention by the
Freq. 5 20 15 I ■ 41'
government and regulatory agencies. Percent 12.2 /18.8 36.6 2.4 100.00
Barriers to Pollution Prevention
Barriers to practice, or improved practice, of pollution prevention were addressed
at the end of the survey, and the data presented in Table 26. Thirty-rnine responses were
recorded for this section, more than one answer was accepted per respondent. Thirty-
three (84.6%) respondents indicated that increased knowledge could improve their
pollution prevention, 10 (25.6%) indicated increased administrative support could
improve their practices, 23 (58.9%) indicated new funds would improve pollution
prevention practices, 12 (30.7%) listed increased community support as a barrier reducing
factor, 28 (71.8%) indicated more community resources could help improve pollution
prevention, and 5 (12.8%) answered "other." Table 26 describes this data.

47
Table 26. Reduction in barriers to pollution prevention.
Reduction of barrier Frequency Percent*Increased knowledge 33 84.6Increased administrative support 10 25.6New funds for implementation of more P2 23 58.9Increased community support ' '12 30.7More community resources** 28 71.8Other 5 12.8.
^Percentages based on an Frequency of 39 respondents to this portion of the survey. ** (recycling, special collections, outside assistance) These are waste management systems, not pollution prevention in the strict definition.
Interest in Eco-Star Educator Award Program
The following information is not related to the study objectives. Since this
inquiry was made through the survey instrument, an explanation and data collected is
included here. An award system for environmentally responsible educators was proposed
by the Montana State University Extension Service. Interest in participating in this merit
based award program by agricultural educators was measured. The question was posed at
the very end of the survey instrument adjacent to the mailing instructions. This data is
also indicated in Table 27. Ten (23.8%) respondents were interested in participating in
the Montana Eco-Star Educators award program, I (16.7) indicated they were not
interested, while 25 (59.5%) did not respond. The researcher is suspect that the
placement of the Eco-Star inquiry at the back cover of the survey after a blank page may.
have contributed to the low response rate to this question.

48
Table 27. Number of respondents who expressed interest in participating in Montana _________Eco-Star Educator reward program for environmentally responsible educators.
Interested in award program Frequency PercentYes 10 23.8No 7 16.7Did not respond 25 59.5Total 42 100

49
CHAPTER 5
CONCLUSIONS, IMPLICATIONS, AND RECOMMENDATIONS
The purpose of this study was to determine what practices, in the area of pollution
prevention, were being applied by Montana agricultural educators in the classroom,
laboratory and field settings. When certain defined practices were riot applied, barriers to
implementation were examined. Data were also collected and analyzed regarding
Montana agricultural educators’ perceptions and knowledge base concerning pollution
prevention, waste management and hazardous material management.
To fulfill the purpose of this study, the following objectives were identified.
Agricultural educators were'surveyed to:
1. Determine Montana agricultural educators’ current practices in pollution
prevention;
2. Identify barriers to implementation of practices in pollution prevention by.
Montana agricultural educators;
3. Determine Montana agricultural educators’ perceptions of pollution prevention;
4. Determine Montana agricultural educators’ level of knowledge of pollution
prevention. .

50
Conclusions
Based on the analysis of quantitative data, and consideration for written comments'
by survey respondents, the following conclusions were drawn:
1. Deficiencies were identified with current practices in pollution prevention and
waste management by Montana agricultural educators. The researcher believes the most
eminent are in the mechanics laboratory, greenhouses and farm/field plots, and in the
wood laboratory. Comments indicated in Appendix D show that substances are going to
the land fill that could be re-used in house, recycled, or used outside the agricultural
education program.
2. Barriers to practice and improvement of pollution prevention were identified.
Lack of knowledge, or need for further education was the primary barrier identified by
survey respondents.
3. Agricultural educators in Montana had positive perceptions of pollution
prevention. Most agreed that agriculturalists are responsible for their own actions
concerning the environment and that the actions of few can have a wide effect. Educators
perceived that they still had room to improve based on answers to the section titled
“Barriers to Pollution Prevention”.
4. Montana agricultural educators do have a basic knowledge or awareness of .
pollution prevention and proper waste management. On all questions dealing with
awareness, over 5 0% of respondents indicated they were aware or very aware of the topic
and practices associated with that question. Tables 8, 14,17, and 20 dealing with

51
awareness of recycling options and proper disposal techniques for mechanics laboratory
waste, agricultural chemicals, wood finishing chemicals and scrap metal support this.
5. Agricultural educators surveyed appear willing to improve their practices in
pollution prevention and waste management if they could receive more community
support and have easier to use resources such as recycling and special waste collections.
6. Agricultural educators in Montana wish to improve their pollution prevention
practices and are willing to participate in further education or training as noted by several
written responses found in Appendix D.
ImplicationsJ
The data and written comments provided by this survey allowed the researcher to
believe and make.the following statements:
1. There is a need for education in pollution prevention specific to agricultural
teaching laboratories and field areas.
2. Education on managing agricultural teaching laboratories in an
environmentally responsible way should not only target instructors or educators. Students
and administrators, while on opposite ends of the educational spectrum, are also integral
components of successful pollution prevention initiatives being taken in the teaching
laboratory.
3. Data obtained through this study may also be pertinent in other areas of
vocational education were similar teaching or research facilities are maintained. Such
52-
research can also contribute to that which has already been done in other areas such as
chemistry and biology education.
4. A need for training and certification of technical support, and educators in
pollution prevention for the research and educational community may exist. Agencies
such as the EPA could offer such training and certification to individuals, who in turn
would serve a region or area by assisting educators in becoming better environmental
stewards.
5. A potential exists for agricultural educators to receive reprimands, should a
regulatory agency scrutinize current practices in waste management and pollution
prevention.
6. A responsibility exists for organizations, such as Extension, already
performing pollution prevention training and education to extend efforts to this new
audience, Le.: agricultural and vocational educators.
Recommendations
The entire research process, including review of literature, collection and analysis
of data, and consideration of comments made by survey respondents, committee members
and others led the researcher to make the following recommendations:
I . A pollution prevention education or training program, specific for agricultural
education, should be developed as soon as possible. It should focus on source reduction
of waste, management of unavoidable waste and consideration to proper facilities

53
planning and management. True pollution prevention should be the primary focus of
such education, with recycling and best disposal options secondary and tertiary choices.
2. Agricultural educators themselves should be as involved as possible in the
development of pollution prevention training and education.
3. Pollution prevention training should be made an integral part of college studies
for those pursuing teaching degrees in agriculture. Pollution prevention should be part of
career-long updates and re-certification programs for educators.
4. A holistic pollution prevention resource for educational institutions should be
developed including all traditional, academic and vocational (agriculture included)
teaching areas. Grounds and facilities maintenance could also be included.
Recommendations for further study
1. Similar research should be conducted in other vocational fields of education to
determine if education in pollution prevention is needed.
2. Existing facilities in agricultural and vocational education should be examined.
Ways to make existing facilities more environmentally friendly and considerations to be
made in construction of new agricultural teaching laboratories should be examined.
3. A needs assessment or pollution prevention audit may be in order for post
secondary institutions such as technical schools and vocational colleges. Universities
should also be considered as other institutions with a similar educational need for
pollution prevention training.

54
4. The data from this study could be used in the future to identify correlations
such as, links between certain demographic traits and perceptions or practice of pollution
prevention in educational contexts.
5. Comparing and contrasting practices, knowledge and perceptions of pollution
prevention between vocational (agriculture included) educators and educators of
traditional sciences may facilitate a more efficient development of holistic pollution
prevention resources for educators.

55
REFERENCES CITED
Bogo5 J. (1999). Sustainability 101: using the community as a classroom, colleges are rewriting the standards for environmental education. E Mapazine. 10 (6), 36-41.
Collins, T. (1995). Introducing green chemistry in teaching and research. Journal of Chemical Education. 72 t i l l 965-966.
Dillman, D.A. (1978). Mail and telephone survey: the total design method. New York: Wiley.
ERA (1990). Guides to pollution prevention: research and educational institutions.(EPA/625/7-90/010). Cincinnati, OH: United States Environmental Protection Agency.
EPA (1994). Environmental Regulations and Technology: Managing Used Motor Oil. (EPA/625/R-94/010). Cincinnati, OH: United States Environmental Protection Agency.
Fanjoy, R. (1999). Going the extra green mile. Professional Builder. 64 (I I), 86-88.
Frankel, J. & Wallen, N.E. How to design and evaluate research in education. (3 rd ed.) McGraw-Hill, Inc. 1996.
Gall, M, Borg5W., & Gall, P. Educational research, an introduction. (6th ed.) Longman Publishers USA. 1996.
Latimer, J., et. al. (1996). Reducing pollution potential of pesticides and fertilizers in the environmental horticulture industry. Hort Technology. 6 (2), 115-123.
MDEM (1988). Hazardous waste management: a handbook for schools. Boston, MA: Massachusetts Department of Environmental Management.
MSU (1994). Montana agricultural education curriculum. Bozeman, MT: Montana State University Agricultural Education Program.

56
Peaks to Prairies P2 Information Center. "Pollution Prevention: EPA Statement of Definition." A b o u t P2. 1999.http://www.montana.edu/wwwpeaks/About%20P2.htm (6 Jan. 2000).
Radhakrishna, R., & Xu, W, (1997). A review of subject matter topics researched in agricultural and extension education. Journal of Agricultural Education. 38 (3),59-69.
Rein, B. (1992). Health hazards in agriculture - an emerging issue (000102014). Washington D.C.: United States Department of Agriculture.
Risse, M. (1995). Environmental considerations for livestock production on small acreages. (ENG95-006). Athens, GA: University of Georgia Cooperative Extension Service.
Risse, M. (1998). Opportunities and impediments for establishing pollution prevention programs for crop production. Applied Engineering in Agriculture. 14 (I), 37-43
Swan, J., & Spiro, T. (1995). Context in chemistry: Integrating environmental chemistry with the chemistry curriculum. Journal of Chemical Education. 72 (11), 967-970.
Swortzel, K. (1997). How Ohio teachers use AGVENTURE MAGAZINE to increase agricultural literacy among their students. Journal of Agricultural Education. 38(2), 30-37.
Thomas, M. (1994). Pesticide contamination of mixing/loading sites: proposals forstreamlined assessment and cleanup, and pollution prevention. Environmentally sound agriculture: Proceedings of the 2nd Conference 20-22 April 1994. 203-207
Williams, D., & Wise, K. (1997). Perceptions of Iowa secondary school agricultural education teachers and students regarding sustainable agriculture. Journal of Agricultural Education. 38 (21 15-20.
Williams, R. L. (1993). Environmental studies in agriscience - an integrated approach. The Agricultural Education Magazine. 66 (4), 5-6.

57
APPENDICES

58
APPENDIX A
PRE-SURVEY POSTCARD

59
Dear Agricultural Educator,
In the next few days you will be receiving a survey from the Agricultural Education Program at Montana State University. This survey deals with management of potential waste and pollution prevention in agricultural teaching laboratories. I encourage you to take a little time and complete the survey. The results of this study are very important to field of Agricultural Education and the agriculture industry as a whole.
Thank you,
Thomas M. Bass Agricultural Education Program Montana State University (406) 994-2132 [email protected]

APPENDIX B
SURVEY INSTRUMENT

6 1
Pollution Prevention in Agricultural Education Laboratories and Field Areas
Agricultural Education Program Montana State University - Bozeman
Montana State University Extension Service
Pollution Prevention Program
Investigator:Thomas M. BassAgricultural Education ProgramCheever HallMontana State UniversityBozeman, MT 59717(406) [email protected]

62
Dear Agricultural Educator,
Thank you for taking the time to complete this survey. Myself, and the Agricultural Education faculty at MSU believe that this project can really make a contribution to Montana’s natural environment, to agriculture and to agricultural education. Once again this is a non-regulatory effort, meaning the purpose of this project is to help you as an educator make your own decisions on how to better manage waste, reduce pollution and instill these values in your students. You also have a chance become a model program within your institution exhibiting progressive waste management and heightened human and environmental safety.
■The survey was designed to provide the most amount of information in a simple and efficient manner. Most questions are “fill in the dot”, while a few ask for further . explanation. Please feel free to comment on any question by using a separate sheet of paper or on space provided at the back of this survey. In the case where pollution prevention, recycling and certain waste management methods are not being practiced, I ask that you comment on barriers that have prevented, or will continue to prevent the implementation o f such practices by your program. ■
Please take about 20 minutes to respond to the following survey. Pencil is preferred, but you may use ink. If you wish to identify yourself, at the bottom of this page, you may.
Sincerely,
Thomas M. Bass Agricultural Education Program Montana State University - Bozeman (406) 994-2132 [email protected]
program name:address:_____phone:______e-mail:

63
Demographics
1) What is your age group?0 21-25 O 26-30 0 31-35 O 36-40 0 41-45 O 46-50 0 51-55 0 55+
2) What is your gender?O male O female
3) What is the highest level of education you have attained?O bachelor’s degree O some graduate course work O masters degree O doctorate
4) How many years teaching experience do you have? _____________ (enter number ofyears)
5) Did you receive any pollution prevention or waste management training in college?O yes O no
6) Have you ever had any in service pollution prevention or waste management training?O yes O no
Program InformationI) Which of the following labs or field areas do you maintain?
a) O ag/power mechanics labb ) O green housec) O garden or small farm plotd ) O wood labe) O metals/welding labf) O animal confinement or pasture areag ) O other____________

64
2) Rank the previous lab areas in order of use, from most to least, by your program. (Forexample: b, c, a, d, e, f )__________________________ '
3) How many students, in grades 8-12, are in your program?______________(enter number of students)
Agricultural or Power Mechanics Lab
1) Which of the following waste/used engine fluids do you acquire in your labs or on your property?
O oil O brake fluidO transmission fluid O waste diesel or gasolineO antifreeze O waste cleaning solvents
2) Do you store any amounts of these waste/used fluids on your property for more than a few days?
O yes Ono
Are these fluids in sealed containers and stored in a place to prevent or contain spills?O yes O no O n/a
3) How aware are you of recycling options and best disposal methods for these fluids? O very aware O aware O not aware
4) Do you make use of recycling or best disposal avenues for these fluids?O always O mostly O' seldom O never
5) Does your mechanics work area make use of spill containment methods, ie: sump with reservoir, dams, trapped drains?
O yes O no
6) Which of the following mechanical waste products do you acquire?O batteries O used oil filtersO tires O other

65
7) How aware are you of recycling Options and best disposal methods for these items? O very aware O aware ■ O not aware
8) Do you make use of local recycling, collection or best disposal avenues?O always O mostly O seldom O never '
9) Please comment on how you dispose of wastes generated through your mechanics lab.
Green House and/or Farm Plot
. I) Do you maintain an inventory of pesticides and fertilizers?O yes O no
2) Are these materials stored in a safe and secure place, where water will not penetrate?O yes O no
3) Do you monitor plants and apply pesticide for specific pests (target organisms) only?O always O mostly O seldom . O never
4) Are you aware of the water run-off patterns from your plots and green houses?O yes O no
Does this run-off immediately threaten surface water (creek or river) or ground water?
O yes O no
5) Do you and your students follow labeled instructions, of pesticides/fertilizers/chemicals concerning application rates?
O always O mostly O seldom O never

66
6) Do you and your students follow instructions concerning your personal safety, ie: protective clothing, respiratory equipment?
O always O mostly ' O seldom O never
7) Do you mix pesticides on a pad that will contain spills and prevent contamination of .soils or water sources?.
O always O mostly O seldom O never
8) Do you regularly calibrate spraying equipment?O yes O no O n/a
9) Do you compost left over plant material for future addition to the soil?O always O mostly O seldom O never
10) Do you store pesticides/fertilizers/chemicals in their original containers?O always O mostly O seldom O never
Is all of your inventory well labeled and identified?O yes O no O. n/a
11 ) How aware are you of recycling options and best disposal methods for these agricultural chemicals and empty containers?
O very aware O aware O not aware
12) Do you make use of local recycling, collection or best disposal avenues?O always O mostly O seldom O never
13) Please comment on how you dispose of ag chemical wastes, rinse water and emptycontainers from your greenhouses and field plots._____________
Wood Lab
I) Which of the following surplus materials do you create or acquire?O paint ■ O stain O solvents or paint stripping materialsO other
67
2) Do you store any of these materials on your property for more than a few days?O yes O no
3) Are your paints and solvents stored in a fire retardant cabinet?O yes O no
4) How aware are you of recycling options and best disposal methods for these paintsand finishing chemicals? ' . . .
O very aware O aware O not aware
5) Do you make use of recycling, collection or best disposal avenues?O always O mostly O seldom O never
6) Are you aware sawdust from non-treated, non-painted wood is an excellent addition tocompost?
O yes O no
7) Please comment on how you dispose of paints, solvents, finishing chemicals andempty containers.____________________________________
8) Please comment on how you dispose of wood scraps and sawdust.
9) Please comment on how you dispose of cleaning wastes from spray guns, brushes and rollers (please consider paint waste generated in other lab areas as well).____________

68
MetaIsAVeIding Lab
1) Do you generate any waste solvents, paint or waste rinse water related to your welding/metals lab?
O yes O no
2) Do you utilize any hazardous gases for welding purposes?O yes O no
3) Do you monitor gas tanks for leaks, check that the system is turned off after use?O always O mostly O seldom O never
4) Are those working in the metal shop required to wear safety clothing?O always O mostly O seldom O never
5) How aware are you of recycling options for scrap metals? ;O very aware O aware O not aware
6) Do you make use of recycling options?O always O mostly O seldom O never
7) Please comment on how you manage and dispose of metal dust, shavings and scraps.
Animal Confinement or Pasture Area
I) What animal species does your program keep and maintain? O swine O cattle O sheepO poultry O other_____.
2) How many animal units are there, what is the approximate stocking rate?.
69
3) Is there in waste management plan or procedure in place?O yes O no
4) Are you aware of the water run-off patterns of your animal confinement area?O yes O no-
Does this run-off immediately threaten surface water (creek or river) or ground water?
O yes O no
5) Is there a need to remove animal waste from confinement area?O yes O no
6) Do you generate any veterinary, medical or bio-hazard waste?O yes O no
7) Please comment on how animal waste, vet waste, medical or bio-hazard waste isremoved and disposed of.___________________________
Curriculum and Classroom Management
I) Do you recycle any classroom materials or other waste not mentioned under other parts of this survey?
O yes O no
If yes, what?__________________________________________________
2) Does your curriculum include any education on pollution prevention or the environment?
O yes O no
70
What curriculum areas deal with environmental topics? Please comment oh this material.
Perceptions
Please indicate your feelings towards the following statements.
1) The behavior of one person or a small group of people can have a significant affect on larger environments.
O strongly agree O agree Q disagree O strongly disagree • ■
2) Agriculture is dependent on clean and safe soil, air and water.,O strongly agree O agree O disagree O strongly disagree
3) Agriculturalists are responsible for their'own actions concerning the environment.O strongly agree O agree O disagree O strongly disagree
4) Monetary cost, time and labor are issues to be considered when making decisions which may affect the environment.
O strongly agree O agree O disagree O strongly disagree
5) Considering the previous issues, it is still possible for agriculturalists to make environmentally responsible decisions in almost all situations.
O strongly agree O agree O disagree O strongly disagree
6) Agriculturalists are currently doing enough to protect the environment and sustain their industry.
O strongly .agree O agree O disagree O strongly disagree
7) Agriculturalists are capable of policing themselves without intervention by the • government and regulatory agencies.
O strongly agree O agree .O disagree O strongly disagree

71
Barriers to Pollution Prevention
My pollution prevention could be improved by: (check all that apply)O increased knowledge O increased administrative supportO new funds for implementation of more Pollution Prevention O increased community supportO more community resources (recycling, special collections, outsideassistance)O other
In situations mentioned previously in this survey, where pollution prevention methods and recycling were not utilized, please further describe barriers that have prevented you from engaging in-such activity.

72
Further CommentsPlease feel .free to comment on any part of this survey or related topics. Your input will only make this project more.successful.
73
(B la n k .p a g e corresponds to b lank p a g e in su rvey d o cu m en t.)
74
The Montana State Extension Service Pollution Prevention Program is interested in developing a Montana EcoStar Educators? Award, to complement its existing EcoStar Small Business Award. This award will be given to educational programs who set good examples by working toward responsible management of waste and promotion of pollution prevention in their classrooms and laboratories. If enough interest is shown by survey respondents, further development of this award will be done, and applications made available.
O Yes, I would be interested in participating in the Extension Service EcoStar Award program should it be developed for educators.
O No, I would not be interested in participating in the Extension Service EcoStar Award program should it be developed for educators.

75
Special thanks to the Montana Vocational Agricultural Teachers Association for assistance in distributing and collecting this survey.
Thank you for your time and attention. Please close,tape sh u tand
. return via U.S. Mail
76
APPENDIX C
REMINDER POSTCARD
7 7
Dear Agricultural Educator,
Within the last couple of weeks you most likely received a survey dealing with management of potential waste and pollution prevention in agricultural teaching laboratories. If you are one of those who has already returned the survey, thank you very much. I have received many great comments and ideas. If you have not returned your survey, please take a few minutes to complete it and drop it in the mail. In the case that you have lost your copy, please call me to request another (406) 994-2132.
Thank you,
Thomas M. Bass Agricultural Education Program Montana State University (406) 994-2132 [email protected]

APPENDIX D
SURVEY COMMENTS

79
Program Information
Question I) Which of the following lab areas do you maintain? Responses indicated under "other".
Classroom
Grounds around green house
(checked other, left blank)
Agricultural or Power Mechanics Lab
Question 6) Which of the following mechanical waste products do you acquire? Responses indicated under "other".
Very little
Metal
Question 9) Please comment on how you dispose of waste generated through your mechanics lab.
Agreement with local garage to take all of our wastes
Used oil is given to a local garage to bum in their oil burning furnace. Most of the items above are included.
Ranchers use oil to paint fences.
Haul to dump.
Try to recycle what I can - to dump with the rest.
We collect oils and solvents and take them to a local auto shop where they dispose of them for us.
We collect used petroleum based [products] into a drum, the city and county use used oil to heat. They pick up on call
[Sent] to district bus bam, in barells
80
Used motor oils are recycled, batteries are taken in for salvage, filters are sent to the landfill.
Filters are sent to landfill, oil and antifreeze in a storage tank.
Land fill, oil pick-up services
Take to local mechanic to bum oil in waste oil furnace. Other items are taken to the local gas station to dispose of.
Haven’t disposed of anything except for scrap metal which was recycled.
Drying of filters and dispose in regular trash
Trade in program
Our school system/maintenance people/ bus garage-store and then dispose of or recycle certain used products.
Local collection- approved dumpster- recycle when available
Recycle center '
Oil- is burned as fuel at wrecking yard- Antifreeze is stored until we. can get it cleaned, oil filters are thrown as are tires. Batteries are turned in as [illegible] at NAPA.
Used oil is taken to a shop in used oil burner
Agri-Power - recycle oil
I have only been here a short time so waste has been minimal. I could really use some info in this area.
Placed in containers and then handled by janitorial staff.
Couple of private shops have oil burners. Metal, batteries are sold. Oil filters thrown away. Antifreeze goes down the drain.
In containers soaked in sawdust, then to land fill.
Janitor takes barrel to county yard.
Oil goes to local machinery dealership. Filters to Pacific Recycling.

81
Green House and/or Farm Plot
Question 13) Please comment on how you dispose of ag chemical wastes, rinse water and empty containers from your greenhouses and field plots.
County disposal system
Don’t have many, dump..
We don’t really use pesticides, but do use miracle grow fertilizer.
Rinse water is diluted in the containment sump, ag chemicals are kept until all is sprayed.
Use up all chemicals, dispose of container in landfill. .
Don’t have a greenhouse yet.
Rinse well/throw in general trash.
I triple rinse containers used to handle pesticides. Rinse water is absorbed into soil under greenhouse. '
Rinse water is used to apply chemical with .
We just have a small garden plot - other than a little fertilizer and "seven" - we use no other chemicals.
Use collection methods.
Usually down the drain in the floor.
We use only for educational purposes. We don’t have a lot on hand.
Local dealers handle empty containers.
Wood Lab
Which of the following surplus materials do you create or acquire? Responses indicated under "other".
(Response to other not identified)
, 82
Question 7) Please comment on how you dispose of paints, solvents, finishing chemicals and empty containers.
County disposal
Empty containers to garbage
I don’t [dispose of paints...], they just sit around for 20 years.
Dump
We try not to use oil-based paints.
Paints and solvents are stored in plastic containers and taken to a local business for disposal.
Into the used petroleum barrel.
Rarely have waste.
Bus/district garage
We sometimes soak our solvents with sawdust and then send it to the landfill.
Dumpster
Empty containers go out with trash.
Haven’t yet
I put them in a plastic garbage bag which is hauled to the landfill.
Garbage (frequency 3)
Haven’t thrown any away yet.
Some are dried and local disposal - some EPA approved collection.
Sent to trash; paint thinner put with used oil and solvents.
Garbage cans, drains, sump
Use them up. Landfill
83
Don’t use - fire hazard in temporary building.
The drain? With lots of H20 of course. Haven’t had much yet.
Trash can
Into cans that are sealed and dropped in landfill
Put in garbage
Empty containers rinsed and sent to landfill.
Question 8) Please comment on how you dispose of wood scraps and sawdust.
People get scraps to bum
Burning
Garbage - landfill (frequency 3)
Haul to local, dump or some pick up wood to bum in stove
Bum, compost
Sawdust is collected and used for bedding, and wood scraps are given away for firewood kindling. .
Sawdust is collected and used as a floor cleaner, wood scraps go to landfill'
Fireplace
City dumpster
Sawdust is used for bedding, spills, and others to the landfill, wood scraps are burned by homeowners and landfill:
Give to people with fireplaces
Scraps are given to people to bum in wood stove. Sawdust is thrown away with trash.
Bum or give to people who want it
Don’t yet

84
I put them in a plastic garbage bag which is hauled to the landfill.
Fireplace and garden
Used as compost. Also used to soak up spilled oil, etc.
Fire starter .
Wood scraps - firewood
Sawdust - used as oil pickup, then sent to trash
Green boxes (garbage)
Wood stoves, landfill, compost
Kindling and firewood
To city incinerator
Reuse. Garbage dump
Trash can ■
Garbage
Animal bedding; oil spill pickup; wood stove use '
Put in garbage or let j anitor take home to bum in fireplace.
Wood scraps burned by students with wood stoves - sawdust is composted
Question 9) Please comment on how you dispose of cleaning wastes from spray guns, brushes, and rollers (please consider paint waste generated in other lab areas as well).
Latex paints primarily, landfill
Dump or bum
Dumpj
Place in 5-gallon waste container

85
We try not to use oil-based paints, but if we do, rollers are left to dry and then dispose of at the local landfill.
Petroleum barrel [into the used]
Drain
H20-based paint- building drain
We use as much latex paint as possible and that is diluted greatly and put down the drain; oil bases are soaked up by sawdust and sent to landfill.
Dumpster .
Latex - wash down sink. Oil-based - put with waste oil to bum in waste oil furnace.
Don’t yet
These wastes are dumped in our sink and extra water is used to flush them out of the sink trap so corrosion is kept to a minimum.
Garbage ■ 1
Rags, brushes, rollers, etc. usually in dumpster. - no liquids or fluids though
Put with used oil and solvents
Wash in sink
Recycle collector
City disposal, trash can
Pour into used-oil containers, goes to oil burning heater
(You don’t want to know) bottle up and put in landfill
Out the backdoor drain
No recycling center available. Cleaning wastes are sent to local dealership with used oil.
86
Metals/Welding Lab
Question 7) Please comment on how you manage and dispose of metal dust, shavings and scraps.
County picks them up
To the dumpster
Haul to recycling center
Haul material to local scrap buyer
Trade in for new scrap '
Local junk dealer
We collect metal waste and dispose of it at Pacific Recycling - Billings
Scrap metal is transported to Havre, to Pacific Steel and Recycling.
Scrap dealer or garbage
Shaving and scraps are taken to the recycler in Sidney, some dusts from grinding and cutting are sent to the landfill
Metal barrels collect all metal products and sent to recycle center
Dust and shavings go out with trash, scraps are recycled at Pacific or Border Steel
Take it to recycling center (frequency 2)
Throw them in garbage
Return to Pacific Steel or local welding shop
These are put in the garbage plastic bag which is hauled to the landfill.
Scrap is recycled in Billings; dust and shavings - garbage
Collected in 55 gallon drums - transport to Billings, for recycle
Packaged and taken for scrap to Pacific Recycling

8 7
Recycle (frequency 2)
Metal dust - swept up and put in trash - scrap metal - taken to recycler
Green box
Metal recyclers
Metal dust - shavings - trash; scraps - (Pacific Steel)
Garbage. I think we can take scraps into town for exchange.
Metal recycling barrels
Placed in scrap barrel then either taken to scrap yard or given to someone who will.
Haul to Pacific - Take metal for welding
Send to Pacific Steel and Recycling
Animal Confinement or Pasture Area
Question I) What animal species do.you keep or maintain. Responses indicated under other.
Rabbits
Cattle shipping yards (see comment 2, question 2)
Fish
Emus and horses
Question 2) How many animal units are there, what is the approximate stocking rate?
Beef - 6; Sheep - 6; Swine - 30
Used in fall to ship and weigh cattle - animals are only there temporarily.
2 emus, 8 cattle, 2 horses (40 acres)

88
Question 7) Please comment on how animal waste, vet waste, or bio-hazard waste is removed and disposed of. .
Animal waste - compost; medical or biohazard - bum
Dropping pans from rabbits and other small animals are lined with sawdust and then disposed of in the landfill.
Thrown in garbage
Municipal sewer (re: fish)
Trash barrel
Curriculum and Classroom Management
Question I) What other class room materials or waste not mentioned under other parts of this study do you recycle?
Paper (frequency 9)
Grader blade (from county)
Aluminum
Newspaper ■ ‘
Paper products
Pop cans/plastic pop bottles
Paper - empty cans
Paper when possiblei ■
Paper - Aluminum
Paper maybe once a year '
Cardboard, newspaper. Aluminum cans
Paper/cardboard
89
Question 2) What curriculum areas include any pollution prevention or environmental topics?
Crops - soils - livestock
Semester class called Natural Resources. Unit on tropical rainforest in Plant Science and some other units dealing with environmental concerns.
All areas should include environmental education.
General information mostly with water pollution.
Pesticide use and application - teaches methods of safe application and disposal of pesticides. H20 management - discusses pollution caused by pasture or crop land runoff.
Proper use of range, soils and water.
We utilize "Project Wet" while planning building site selection; lot drainage for stock pens; water quality for range management.
Ag Science, 7th and 8th grade ag awareness, pesticides, vet, ag management, wood construction
Very big on H20 quality. (Yellowstone River watch)
Water curriculum Soil curriculum
Natural Resources class - we spend at least 2 days on this topic
Wildlife Management; Range Management; Soils
Mostly natural resource management. Also encourage in other classes. Will discuss Ag Mech (oil, metal, etc. recycling) An. Sci (animal waste, etc.)
I
All - same approach as with career development
Range and Soils; Water Quality; Land Management
Aqua Culture; Animal Science; Plant Science; Ag Mechanics; Horticulture
"Pollution prevention"
MT. Weeds

90
Soil runoff, livestock facilities
Mechanics - Plant Technology - Ag Chemicals - Animal Science
Barriers fo Pollution Prevention
Question A) My pollution prevention could be improved by: Responses under "other"
Time and proper disposal methods
Spending less time on forms such as this one!
Simple products
Developing safer products.
Recycling is not economically , feasible at this time.
Question B) In situations mentioned previously in this survey, where pollution prevention methods and recycling were not utilized, please.further describe barriers that have prevented you from engaging in such activity.
Isolation is a problem in most of Montana. We have no where, with in a reasonable distance, to go with things like batteries, used oil, etc. If the U.S. wants to support and get recycling to work then the price of recycling at least has to break even.
Locally there is no collection spot for used oil - this is used.by a local business for heating - but it must be clean and free of H20. Our district produces a lot of used oil and housekeeping becomes a major issue. Locally - recycling is a voluntary organization - and contact persons change as they get burnt out. Shipping charges often out weigh income from objects recycled. Tried recycling school wide - but became each teacher’s responsibility - junky rooms were frowned upon so it became easier to throw away.
J
Our type of soil (high clay) allows more misuse or lazy habitats because the pollutants • don’t travel far. There is very little drinking water from wells - nothing really to pollute.
No place to store waste paper, no place for pick up nearby; my wife and I don’t care to drive a great distance to recycle plastic, but would if it were closer.
Lack of time and recycling locations.

91
Used oil - one time I looked into setting up an "Icy Igloo" recycle center for the town. . But once in place it would still cost $0.75/gal to get it recycled. Not worth it! You need a cost factor.
Lack of recycling center - Pacific and Eastern Montana Industries certainly help!
Further Comments
Please feel free to comment on any part of this survey or related topics. Your input will only make this project more successful.
Excellent ideas - some, chapters in more populated areas could do much more - closer distances [populated areas] contribute more $ which means more recycling - locally cardboard is a big issue filling landfill, so a crusher and bailer was bought.
Universal use by a few creates problems for many with pesticides and fertilizers. Even what occurs in other countries can affect our population’s perceptions of agriculture.
-This is basically useless. -You want idealism but don’t realize we are in an economic survival battle. -Get Real! -Eco B.S. is just what got us into our present situation. - . Show me ONE farmer or rancher or any other person directly related to Ag. Who is not now, or has not always been PRO-ENVIRONMENT. -I checked the address twice... I expected this to come from Missoula!
Let’s review the survey & be trained at MVATA update.
(RE: perception #7) Agriculturalists are capable of policing themselves without govt, agencies but need these agencies to keep them honest.
iI know I have a lot to Ieam and I would certainly appreciate suggestions on how to handle . wastes in my shop area. Another couple of questions should have dealt with perceptions and attitudes concerning waste management, pollution prevention, and the environment. Many times this is the root of the problem.
We need some improvements in this area.
As a teacher and a farmer, I like the idea of government incentives to prevent pollution. Regulation is difficult to enforce and distribute enforcement fairly.
j

MONTANA STATE UNIVERSITY - BOZEMAN
762 103311 79 9