(in press, 2018), behavioral research methods
TRANSCRIPT

Running head: MAKE-A-DICE TEST 1
Make-A-Dice Test: Assessing the Intersection of Mathematical and Spatial Thinking
Heather Burte1, Aaron L. Gardony1,2,3, Allyson Hutton4, & Holly A. Taylor1,2
1 Tufts University, Department of Psychology, 490 Boston Ave, Medford, MA 02155, USA
2 Center for Applied Brain & Cognitive Sciences, 200 Boston Ave, Medford, MA 02155, USA
3 Cognitive Science Team, U.S. Army Natick Soldier Research, Development, and Engineering
Center, Natick, MA 01760, USA
4 Think3d!, 3811 Van Ness St NW, Washington, DC, 20016
[email protected], [email protected], [email protected],
Correspondence concerning this submission should be addressed to Heather Burte, Department
of Psychology, 490 Boston Avenue, Tufts University, Medford, MA 02155. Email:
(in press, 2018), Behavioral Research Methods

MAKE-A-DICE TEST 2
Abstract
Individuals with better spatial thinking have increased interest and greater achievement in
science, technology, engineering, and mathematics (STEM) disciplines (Wai, Lubinski, &
Benbow, 2009). This relationship means that STEM education may benefit from leveraging
spatial thinking, but measures of spatial thinking as they relate to specific STEM disciplines are
needed. The current work presents an assessment of spatial and mathematical reasoning, called
Make-A-Dice. In Make-A-Dice, individuals are presented with a cube net (i.e., flattened cube)
with numbers on two sides. Their goal is to “make a dice” by filling in the blank sides using two
rules: opposite sides add to seven and use the numbers one through six once each. Make-A-Dice,
math, spatial, and other measures were given to adults (Study 1) and elementary students
(Studies 2 and 3), both across two sessions. Make-A-Dice had both internal and test-retest
reliability, with items ordered by difficulty. Further, performance was related to spatial and
mathematical reasoning. In Study 1, adults reported a range of strategies used to complete Make-
A-Dice and one strategy predicted performance. Studies 2 and 3 showed that Make-A-Dice is
age-appropriate for elementary students. Make-A-Dice shows promise as an individual
difference measure linking spatial and mathematical thinking and has the potential of identifying
elementary-aged children who may benefit from spatial training.
Keywords: mathematical reasoning, spatial thinking, spatial visualization, working memory
MAKE-A-DICE TEST 3
Make-A-Dice Test: Assessing the Intersection of Mathematical and Spatial Thinking
Devi, a 2nd-grader, arranges cubes on a table. She puts one down. Next to this she stacks
two atop one another. She continues in this way, stacking three blocks next to the two, four
blocks next to the three, and continues until she has a teetering stack of eight blocks at the end of
the row. Her friend Jesse asks, “What are you doing?”. In the process of explaining, Devi comes
to a realization and says, “Look! This is just like a number line. You get more as you move this
way.”, gesturing to her right. Devi has identified a number line’s spatial structure and can now
flexibly use this structure when thinking about mathematical concepts. While this natural and
intuitive mapping between spatial and mathematical concepts has previously been explored
through phenomenon such as the SNARC effect (e.g., Berch, Foley, Hill, & Ryan, 1999), the
application of this mapping has become increasingly interesting for both researchers (e.g.,
Newcombe, 2010; Uttal & Cohen, 2012) and school districts (e.g., Ontario Ministry of
Education, 2014). Longitudinal studies support this increased attention; individuals who are
better at spatial thinking have increased interest and greater achievement in science, technology,
engineering, and mathematics (STEM) disciplines (e.g., Wai, Lubinski, & Benbow, 2009). In
light of this relationship, educational practice in STEM may benefit from leveraging spatial
thinking. To accomplish this goal, an important first step is to develop assessments of spatial
thinking as they relate to specific STEM disciplines. The present work addresses this need. Here
we present both Make-A-Dice, a new assessment that targets spatial thinking in mathematics, and
validating experiments that demonstrate its utility.
Make-A-Dice Test
The Make-A-Dice test combines spatial thinking and basic math. Each item presents six
connected squares depicting a three-dimensional cube that has been taken apart and flattened

MAKE-A-DICE TEST 4
while remaining in one intact piece (i.e., a cube net). Two of the squares contain a number
between 1 and 6. People imagine folding the 2-D cube net into a 3-D cube. They then assign
numbers to the blank squares, using numbers 1 through 6 once each, such that opposite sides of
the cube sum to 7. If implemented via paper and pencil, people write numbers directly into the
squares. See Figure 1 for a sample item.
Figure 1. On the left, a sample Make-A-Dice item. The entire figure is a cube net, or a three-
dimensional cube that has been taken apart and flattened while remaining in one intact piece. Each
square represents each of the six cube sides. The cube sides with numbers provide a starting point
for making a dice. On the right, a sample “Mental Paper Folding” item. Participants determine
whether or not the sides indicated by the arrows will touch when folded.
The task design draws on Shepard and Feng’s (1972) “Mental Paper Folding” task. Their
Mental Paper Folding task differs from the more commonly known “Paper Folding Test”
(Ekstrom, French, & Harmon, 1976) and bears similarity to the Surface Development Test
(Ekstrom et al., 1976) and the Space Relations Test, both parts of the Differential Aptitudes Test
(Bennett, Seashore, & Wesman, 1973). In Shepard and Feng’s (1972) task, participants view
cube nets and cube-net-like drawings. One square is shaded to represent the fixed base of the
cube. Two squares have arrows pointing to the center of one of the edges. Participants determine
whether the two arrows would meet if the cube net was folded to form a cube. For half of the

MAKE-A-DICE TEST 5
trials, the arrows meet when mentally folded and for half they do not.
Shepard and Feng’s (1972) task provides initial insights into the task and stimulus factors
expected to influence performance. Their results suggested both spatial processing and working
memory underlie task performance. Several factors relevant to Make-A-Dice should engage
these cognitive processes, including the number of folds, the number of cube sides involved with
each fold, and the shortcut potential of the cube net configuration. They found increases in
numbers of both folds and squares per fold increased response time. The availability of a
shortcut, such as being able to “roll” adjacent cube sides, decreased response time. Rolling,
which involves consecutive folds in the same direction, is considered a short cut because it is
more continuous and integrated and as such does not involve as many attentional shifts (Shepard
& Feng, 1972). Both the number of folds required and the number of cube sides moved with
each imagined fold increase difficulty and working memory load. Conversely, shortcut potential
decreases difficulty and working memory load.
The Make-A-Dice test draws on this evidence of spatial processing. Unlike Shepard and
Feng’s task, all Make-A-Dice items involve five folds to make a cube. Thus, item difficulty with
Make-A-Dice centers on the number of squares in a row rather than the number of folds.
Adjacent squares in a row (or what we will call a “run”) ease spatial and working memory
processing by providing an opportunity to roll the row, a shortcut. When squares are in a row,
participants can also count over two squares to identify an opposite side, an analytic, non-spatial
heuristic. In contrast, when not in a row, folding the cube net requires consecutive folds in
different directions, a process that depends on spatial visualization. The participant’s goal also
differs between Make-A-Dice and Shepard and Feng’s task. Instead of matching arrows, people
must fill in numbers to complete a dice. On a dice, opposite sides sum to 7 and the numbers 1
MAKE-A-DICE TEST 6
through 6 are each used only once. The summing incorporates basic mathematical thinking and
working memory to mentally track both which squares comprise opposite sides and which
numbers have already been used. The cognitive processes involved with Make-A-Dice, including
spatial thinking, basic mathematical thinking, and working memory, have also been implicated in
STEM outcomes and STEM interest (e.g., Ashcraft & Krause, 2007; Newcombe, 2010; Wai et
al., 2009).
Spatial Thinking and STEM Outcomes
Our introductory example shows how spatial thinking can relate to mathematics. Spatial
thinking uses spatial relations, whether between objects or spaces, for comprehending, reasoning,
and problem solving. Spatial thinking appears to play a unique role in developing STEM
expertise, beyond verbal and quantitative skills (Wai et al., 2009). Importantly, spatial thinking is
not one process, but includes a range of cognitive processes (Newcombe & Shipley, 2015).
People differ in their spatial thinking skills, which include mentally representing and
manipulating spatial information (Hegarty & Waller, 2005). These differences in spatial thinking
may then manifest in STEM reasoning. If a STEM concept can be represented spatially, those
with better spatial thinking skills may have a broader range of cognitive tools for reasoning about
the concept. Uttal and Cohen (2012) argue that spatial skills can either promote or block entry
into STEM fields.
Several longitudinal studies have shown that spatial thinking differences relate to both
STEM interest and outcomes, even after controlling for verbal and mathematical reasoning
(Shea, Lubinski, & Benbow, 2001; Wai et al., 2009). In a group of academically talented
students, spatial skills predicted STEM course enrollment and STEM career interest (Shea et al.,
2001). Thirty years later, students with high spatial skills reported engineering, computer

MAKE-A-DICE TEST 7
science, or mathematics as among their favorite courses, college majors, and career options
(Lubinski & Benbow, 2006). By 35 years later, those with better spatial skills held more patents
and had more peer-reviewed publications (Kell, Lubinski, Benbow, & Steiger, 2013). The link
between spatial skills and STEM outcomes is not limited to the academically talented (Wai et al.,
2009).
Correlational work has focused on relationships between spatial thinking, including
mental manipulation and spatial visualization, and successful STEM learning (Matthewson,
1999). Spatial skills correlate with success in many STEM disciplines (Hegarty, Crookes, Dara-
Abrams, & Shipley, 2010), including medicine (Keehner et al., 2004), dentistry (Hegarty,
Keehner, Khooshabeh, & Montello, 2009), physics (Kozhevnikov, Motes, & Hegarty, 2007),
chemistry (Coleman & Gotch, 1998), mathematics (Casey, Nuttall, & Pezaris, 1997),
engineering (Peters, Chisholm, & Laeng, 1995; Sorby, Casey, Veurink, & Dulaney, 2013), and
geology (Orion, Ben-Chaim, & Kali, 1997). Taken together, the longitudinal and correlational
studies showing strong relationships between spatial thinking and STEM success suggest utility
in identifying students for whom spatial thinking practice might be helpful. Such practice is not
typical in schools as spatial thinking is considered a missing link in elementary education
(National Research Council, 2005), yet the malleability of spatial thinking skills suggests the
importance of practicing them (Uttal et al., 2013).
Several studies have explicitly examined children’s spatial thinking in mathematics.
LeFevre et al. (2010) proposed a model predicting separate contributions of children’s (ages 4.5-
7.5) basic cognitive skills to early numeracy and mathematics performance. These basic
cognitive skills included linguistic and quantitative skills, together with spatial working memory.
They found that linguistic skills related to number naming and quantitative skill related to

MAKE-A-DICE TEST 8
mentally manipulating visually represented quantities. However, linguistic skills did not relate to
quantity performance and quantitative skill did not relate to number naming. Relevant to the
current work, spatial working memory is related to both number naming and numerical quantity
skills. Zhang and Lin (2015) similarly found that spatial skills predicted multiple math outcomes,
while verbal skills showed a more limited relation. Thus, it seems that spatial skills relate to a
relatively broad range of early mathematical skills.
Further, this relationship appears to cut across different ages. First-grade girls with better
spatial skills more often invoked higher-level mental strategies when solving mathematics
problems (Laski et al., 2013). A longitudinal study indicated that first-grade spatial skills
strongly predicted both spatial and analytical mathematical reasoning (Casey et al., 2015). A
recent cross-sectional study of kindergarten, third, and sixth-grade children showed significant
overlap between spatial and math skills (Mix et al., 2016). Moving to older students, ninth-grade
students with better mental rotation ability also had better math scores (Reuhkala, 2001). While
few studies have explicitly explored adult math performance as it relates to spatial thinking,
longitudinal studies following individuals from high school through adulthood indicate that
spatial thinking measured continues to relate to STEM, including math, success 20 and even 35
years later (Lubinski & Benbow, 2006; Shea et al., 2001; Wai et al., 2009).
Not all mathematic concepts engage spatial thinking. Thus, it is important to identify
mathematics concepts that might benefit from spatial thinking. Recently, Burte, Gardony,
Hutton, and Taylor (2017) presented a math categorization to help identify mathematical
concepts most likely to engage spatial thinking. They used this categorization to demonstrate
targeted math improvements after spatial training. Results showed improvements on problems
determined to be visual and/or spatial as well as on real-world problems. Other research

MAKE-A-DICE TEST 9
examining specific mathematical concepts supports this finding. Spatial thinking underlies the
one-to-one mapping needed for counting (Gallistel & Gelman, 1992; Verdine et al., 2014).
Children’s spatial skills in grades 1 and 2 predicted improvements in linear number line
understanding, and this improvement mediated calculation skills three years later (Gunderson,
Ramirez, Beilock, & Levine, 2012). Other mathematical concepts linked to spatial thinking
include missing term problems (Cheng & Mix, 2014), many geometry concepts (Hannafin,
Truxaw, Vermillion, & Liu, 2008), and mental computation (Verdine et al., 2014).
In summary, successful mathematics problem solving frequently engages spatial
thinking, as evidenced in both longitudinal and cross-sectional studies. While spatial thinking
need not be used for every mathematical concept, it appears essential for some concepts and
useful strategically for many others. As such, having an assessment measure that captures the
relationship between spatial thinking and mathematics could have important educational utility.
Working Memory in Spatial and Mathematical Thinking
Working memory plays a role in a variety of spatial tasks. Miyake, Friedman, Rettinger,
Shah, and Hegarty (2001) explored the relationship between spatial thinking, working memory,
and executive function, and found that executive function and visuospatial working memory
were highly correlated. Further, spatial visualization, which included Paper Folding (Ekstrom et
al., 1976) and Space Relations (Bennett et al., 1973) tasks, had the highest correlation with
executive function amongst the spatial tasks explored. Children also show a strong relationship
between working memory (including digit span) and spatial visualization tasks, such as mental
rotation (Lehmann, Quaiser-Pohl, & Jansen, 2014).
Working memory also plays a role in mathematical skill development. Consider the
everyday contexts in which people engage in mental arithmetic. Studies exploring the

MAKE-A-DICE TEST 10
relationship between working memory and mathematical performance have examined the
different proposed working memory components (Baddeley & Hitch, 1975) and/or have focused
more specifically on visuospatial working memory. In their meta-analysis, van den Bos, van der
Ven, Kroesbergen, and van Luit (2013) found that for school-aged children, all working memory
components related to mathematics performance. Similarly, Bull, Espy, and Wiebe (2008) found
that visuospatial working memory span predicted math ability. Further, in a review of studies
cutting across pre-school to adolescent ages, Raghubar, Barnes, and Hecht (2010) propose
separate contributions of visuospatial and verbal working memory to math performance. They
hypothesized that people engage working memory and visual-spatial skills for learning new math
concepts, but not necessarily when using the math concepts once learned. Longitudinal studies
also support this contention, noting a specific role for visuospatial working memory in early
mathematical learning. Additional support for visuospatial memory in learning mathematical
concepts, Bull et al. (2008) showed that preschoolers’ visual-spatial working memory predicted
later performance on a range of math concepts, including graph understanding and creation,
number sequencing, and both simple and complex arithmetic. After the concept has been learned,
evidence suggests use of verbal working memory (Holmes & Adams, 2006). Executive function
also relates to math success (e.g., Bull et al., 2008), but by predicting learning more generally,
rather than learning math specifically. Notably, evidence of better executive function appears to
set the stage for early math learning (e.g., Clark, Prichard, & Woodward, 2010).
As working memory positively contributes to both spatial thinking and mathematics
performance (e.g., Ashcraft & Krause, 2007; Shah & Miyake, 1996), any assessment measure
capturing the relationship between spatial thinking and mathematics should involve working
memory. The role of visuospatial working memory in grasping mathematics at a young age and

MAKE-A-DICE TEST 11
early in learning a mathematical concept suggests that the assessment measure should integrate
visuospatial working memory. The Make-A-Dice test varies demands on working memory in the
complexity of the folds required to identify opposite sides of the cube. Further, maintaining
information about which squares line up opposite one another to then fill in numbers that sum to
7, as on a standard dice, also engages working memory.
Training Spatial Thinking
The reviewed literature noting the relationship between spatial thinking and STEM
success suggests a benefit in identifying students for whom spatial thinking practice might be
helpful. This implies that spatial practice leads to spatial thinking improvements. Spatial training
recently emerged as a research focus, exploring spatial training’s impact on both spatial thinking
and STEM outcomes. Uttal and colleagues conducted a meta-analysis combining spatial training
studies. They found stable and consistent positive training effects for both trained and untrained
spatial tasks (Uttal et al., 2013; Uttal, Miller, & Newcombe, 2013). Further, training effects
lasted even after a relatively substantial delay. The success of being able to train spatial thinking
and the relationship between spatial thinking and STEM outcomes has led to the proposal that
spatial training might impact STEM outcomes. In recent reviews, Uttal and colleagues (Stieff &
Uttal, 2015; Uttal & Cohen, 2012) suggest that spatial training may facilitate how students
conceptualize STEM ideas.
Recent studies have explicitly examined the impact of spatial training on STEM
outcomes, particularly mathematics performance. Cheng and Mix (2014) compared changes in 6-
to 8-year-old students’ math (2- and 3-digit calculation and missing term problem) and spatial
performance before and after either practicing mental rotation or doing crossword puzzles (active
control). Children who had spatial practice through mental rotation showed spatial thinking gains

MAKE-A-DICE TEST 12
and mathematics gains limited to the missing term problems. Missing term problems may
involve spatial rearrangement into standard equation format (e.g., 7 + __ = 9 into 9 – 7 = __).
Burte and colleagues (2017) explored the impact of spatial training on 8 to 12 year olds’ spatial
and mathematical thinking. The training involved a program based on origami and paper
engineering, called Think3d! (Taylor & Hutton, 2013). Results showed both spatial thinking and
mathematic performance gains, particularly on problems involving visualization and real-world
contexts. Focusing on the older-elementary age range (10 to 12 years), Lowrie, Logan, and
Ramful (2017) similarly compared changes in spatial thinking and mathematics between kids
who did and did not participate in spatial training. Spatial training involved activities related to
three spatial reasoning areas: spatial visualization, mental rotation, and spatial orientation.
Students who participated in spatial training showed greater gains on spatial visualization,
mental rotation, and mathematics assessments. These three studies suggest that spatial training
interventions have potential within mathematics classrooms.
How individual differences might interact with spatial training, particularly with respect
to spatial training’s impact on mathematics, has not been explored to our knowledge. Yet,
research identifying individual differences in either spatial reasoning or mathematics suggest
factors that may interact with spatial training. These factors include, but are not limited to,
gender (e.g., Reilly, Neumann, & Andrews, 2015), socioeconomic status (Lubinski, 2010; Wai et
al., 2009), working memory (Friso-van den Bos et al., 2013), and executive function (Bull et al.,
2008). Having a measure that identifies students for which spatial training may be particularly
impactful and could go a long way towards further developing the STEM-educated workforce
essential to support future growth in science and technology. An emphasis on spatial training is
further bolstered by Wai and Worrell’s (2016) policy statement related to spatial reasoning. They

MAKE-A-DICE TEST 13
suggest that spatial reasoning is less correlated with socioeconomic status than is mathematical
reasoning. As such, both identifying spatially talented students and training spatial thinking may
increase the representation of individuals from under-represented and disadvantaged
backgrounds in STEM disciplines.
Present Work
The present work introduces the Make-A-Dice test as a potential measure for the
intersection between spatial thinking and basic mathematics skills. Two versions of the Make-A-
Dice test were developed for both paper (see Appendix A and B) and online/electronic
(www.think3d.us.com) administration with adults (Study 1). Two shortened versions were
developed for paper administration (see Appendix C and D) with elementary aged children
(Study 2 and 3). In the paper versions, participants receive an instruction page that includes one
example item along with the correct response. After reading the instruction page, participants
should complete the items as quickly as possible without sacrificing their accuracy. In the
online/electronic format, participants also see the same instruction page and example item. After
reading the instruction page, participants complete the items one at a time in a standard order
(items approximately increase in difficulty) as quickly as possible without sacrificing accuracy.
Administration should take 10-15 minutes.
Study 1 used an 11-item version of Make-A-Dice with adult participants and Studies 2
and 3 used an 8-item version with 10- to 12-year-old participants. Both studies examined the
relationship between Make-A-Dice performance, performance on other objective measures of
spatial visualization (Mental Unfolding and Purdue Visualizations of Rotation tests), and math
problem solving. Study 1 also included self-report measures of spatial abilities (Santa Barbara
Sense of Direction scale, and spatial competency and anxiety) to elicit whether Make-A-Dice

MAKE-A-DICE TEST 14
was more related to the objective measures than to the self-report measures. Finally, study 1 also
included questionnaires designed to elicit information about cognitive strategies, including the
Visualizer-Verbalizer Cognitive Style Questionnaire to explore visualization in mathematics
problem solving and our own Make-A-Dice strategy questionnaire.
Study 1: 11-Item Make-A-Dice Test
We developed the 11-item Make-A-Dice test to assess the intersection between basic
mathematical and spatial thinking skills, combined with high working memory load. We
developed two versions of the test. Each uses all 11 possible cube nets, but differs in the numbers
provided and orientation of the cube nets. We administered it to a wide population of adults to
establish the connection between Make-A-Dice performance and measures of mathematical and
spatial thinking skills and to verify the internal and alternate-forms reliability of the two
versions.
Method
Participants. Before starting data collection, we set a goal of collecting data from around
100 Amazon Mechanical Turk workers to gather responses from adults across a range of ages,
educational backgrounds, and other demographics. We decided to collect Session 1 assessments
from 150 participants to allow for participants not completing Session 2 assessments and/or for
not passing our exclusion standards, but still reach our 100-participant goal. Given that Turk
Workers are incentivized to complete their assignments as quickly as possible, we developed
exclusion standards that would reduce the likelihood of analyzing data that was hastily entered.
These exclusion standards focus around completing assessments with less than chance accuracy,
unreasonably short response times, and failing to complete all assessments. The data was
analyzed only after the reported exclusion criteria were implemented. Note that since participants

MAKE-A-DICE TEST 15
involved Mechanical Turk workers, all data collection occurred online.
Session 1. Using Amazon’s Mechanical Turk, 150 Turk workers completed the 60-
minute Session 1 assessments for $5 participation compensation. Eighteen participants were
excluded from the analyses and from participating in Session 2 (N = 132 remaining) for one or
more of the following reasons: 1) scoring below chance (11/44 points) on Make-A-Dice; 2)
spending less than 15 seconds per item on Make-A-Dice; 3) scoring less than 25% accuracy on
the mathematical part of the Visualizer-Verbalizer Cognitive Style Questionnaire (VVCS);
and/or, 4) not specifying any strategies on the VVCS.
Session 2. A month after the Session 1, the same 132 workers were invited to complete
Session 2. Of them, 104 completed the 60-minute Session 2 assessments for $6 compensation.
Sixteen participants were excluded from the analysis (N = 88 remaining) for one or more of the
following reasons: 1) scoring less than chance on Make-A-Dice; 2) spending less than 15
seconds per item on Make-A-Dice; 3) failing the reading check; and/or, 4) having less than 20%
accuracy on the other spatial tasks (Mental Unfolding and/or Purdue Visualization of Rotation).
Both Sessions. The 88 participants (41 female; 47 male) who completed both sessions
were aged 22 to 69 (M = 36; SD = 10). The majority were right-handed (89%), and the
distribution of highest education level was: 31% high school, 24% 2-year college, 34% 4-year
college, 6% 2-year graduate degree, and 6% advanced degree.
Materials
11-Item Make-A-Dice tests and strategy questionnaire. We modified the paper versions
of Make-A-Dice to administer them online. For the online version, participants viewed a cube
net drawing. Two sides/squares had numbers and the remaining four had letters A through D.
Participants determined which numbers correspond with each lettered side to make a playing

MAKE-A-DICE TEST 16
dice (Figure 2). To do so they received two rules: 1) the numbers 1 through 6 should each be
used once; 2) numbers on opposite sides of the cube sum to seven. Participants responded by
typing the number corresponding with each lettered cube side.
Figure 2. Instructional text for the Make-A-Dice test (left) and a sample item (right). The answer
to the sample problem is A = 5, B = 6, C = 3 or 4, D = 3 or 4. The cube sides with the “2” and
the “1” are the “given sides”, as the numbers are given to participants. The sides opposite the
given sides (i.e., A and B) are “fixed sides” because their solution is fixed. The remaining sides
have two possible answers (i.e., C and D), so those are “interchangeable sides”.
The two versions (Versions 11-A in Appendix A and 11-B in Appendix B) were identical
in format, but included different items. Each version included one example with answers and
then eleven test items. The eleven items corresponded with the eleven possible cube nets
(Appendix B) and were presented in a fixed order. Following Shepard and Feng (1972), we
ordered the items by increasing difficulty, and predicted that items with four cube sides in row
would be the easiest and items with only two cube sides in row would be the most difficult. More
specifically, we ordered the cube nets based on the number of cube sides in a straight line along
both its axes (i.e., longest and shortest rows). Cube nets took one of five possible row lengths

MAKE-A-DICE TEST 17
and were presented in this order (longest row by shortest row): 4 by 3 (items A-B), 4 by 2 (items
C-F), 3 by 3 (item G), 3 by 2 (items H-J), and 2 by 2 (item K) (see Appendix B). We chose row
lengths as a proxy for difficulty because cube sides in a straight line allow for shortcuts: rolling
the sides or counting two cube sides over to find the opposite side. In Figure 2, A is two away
from the side labeled “2” so it must be on the opposite side of the cube, and therefore, should
have a “5” in it. Either shortcut allows participants to reduce the cognitive load of mentally
folding the cube. As such, multiple cube sides in a row (i.e., a run) allow for easier identification
of opposite sides.
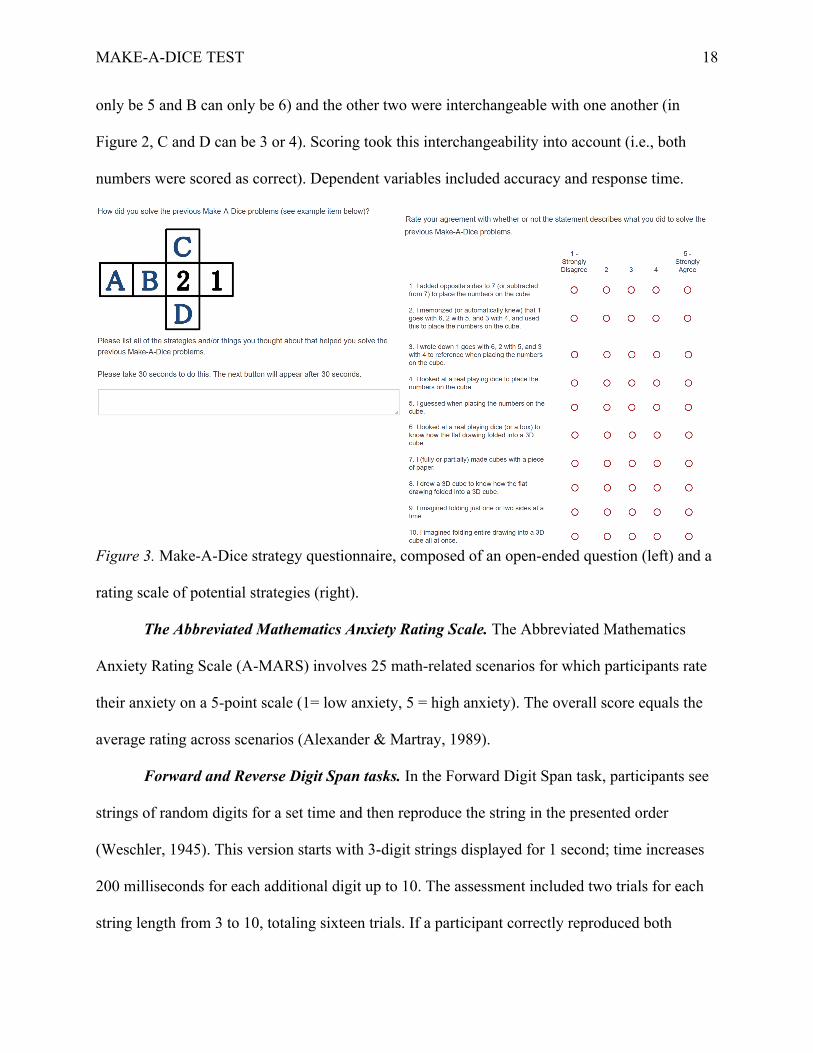
After Session 2, participants completed a Make-A-Dice strategy questionnaire (Figure 3).
The questionnaire gave an example item and participants described how they generally solved
Make-A-Dice items. Participants were forced to spend a minimum of 30 seconds reporting
descriptions of their strategy use. Afterwards, they saw ten potential strategies for Make-A-Dice
items and rated agreement (“1 – Strongly Disagree” to “5 – Strongly Agree”) as to whether they
used that strategy. These potential strategies were sourced from the strategies used by the authors
and their research assistants.
Test items across the two versions differed by altering the orientation of the cube net, the
two numbers provided, and the sides on which the numbers appeared. In the present study,
Version 11-A was used in Session 1 and Version 11-B in Session 2. For both testing sessions, the
Make-A-Dice instructions encouraged participants to answer as quickly as possible without
sacrificing accuracy. Reaction times consisted of presentation time until the participant continued
onto the next item. Participants received one point for each cube side correctly answered, for a
total possible score of 44 for each version of the test. Note that since each item provides two
numbers, two of the four numbers participants could designate were fixed (in Figure 2, A can
MAKE-A-DICE TEST 18
only be 5 and B can only be 6) and the other two were interchangeable with one another (in
Figure 2, C and D can be 3 or 4). Scoring took this interchangeability into account (i.e., both
numbers were scored as correct). Dependent variables included accuracy and response time.
Figure 3. Make-A-Dice strategy questionnaire, composed of an open-ended question (left) and a
rating scale of potential strategies (right).
The Abbreviated Mathematics Anxiety Rating Scale. The Abbreviated Mathematics
Anxiety Rating Scale (A-MARS) involves 25 math-related scenarios for which participants rate
their anxiety on a 5-point scale (1= low anxiety, 5 = high anxiety). The overall score equals the
average rating across scenarios (Alexander & Martray, 1989).
Forward and Reverse Digit Span tasks. In the Forward Digit Span task, participants see
strings of random digits for a set time and then reproduce the string in the presented order
(Weschler, 1945). This version starts with 3-digit strings displayed for 1 second; time increases
200 milliseconds for each additional digit up to 10. The assessment included two trials for each
string length from 3 to 10, totaling sixteen trials. If a participant correctly reproduced both
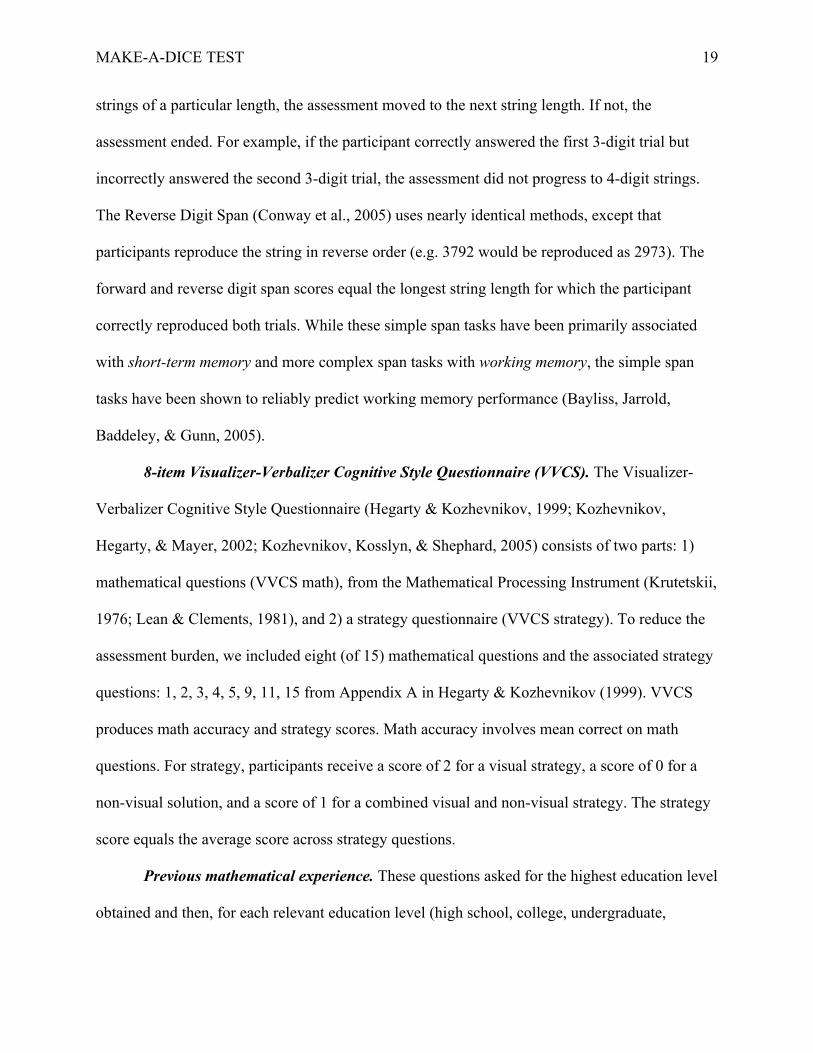
MAKE-A-DICE TEST 19
strings of a particular length, the assessment moved to the next string length. If not, the
assessment ended. For example, if the participant correctly answered the first 3-digit trial but
incorrectly answered the second 3-digit trial, the assessment did not progress to 4-digit strings.
The Reverse Digit Span (Conway et al., 2005) uses nearly identical methods, except that
participants reproduce the string in reverse order (e.g. 3792 would be reproduced as 2973). The
forward and reverse digit span scores equal the longest string length for which the participant
correctly reproduced both trials. While these simple span tasks have been primarily associated
with short-term memory and more complex span tasks with working memory, the simple span
tasks have been shown to reliably predict working memory performance (Bayliss, Jarrold,
Baddeley, & Gunn, 2005).
8-item Visualizer-Verbalizer Cognitive Style Questionnaire (VVCS). The Visualizer-
Verbalizer Cognitive Style Questionnaire (Hegarty & Kozhevnikov, 1999; Kozhevnikov,
Hegarty, & Mayer, 2002; Kozhevnikov, Kosslyn, & Shephard, 2005) consists of two parts: 1)
mathematical questions (VVCS math), from the Mathematical Processing Instrument (Krutetskii,
1976; Lean & Clements, 1981), and 2) a strategy questionnaire (VVCS strategy). To reduce the
assessment burden, we included eight (of 15) mathematical questions and the associated strategy
questions: 1, 2, 3, 4, 5, 9, 11, 15 from Appendix A in Hegarty & Kozhevnikov (1999). VVCS
produces math accuracy and strategy scores. Math accuracy involves mean correct on math
questions. For strategy, participants receive a score of 2 for a visual strategy, a score of 0 for a
non-visual solution, and a score of 1 for a combined visual and non-visual strategy. The strategy
score equals the average score across strategy questions.
Previous mathematical experience. These questions asked for the highest education level
obtained and then, for each relevant education level (high school, college, undergraduate,

MAKE-A-DICE TEST 20
graduate), asked the number of math courses completed and the average math grade.
Common Core mathematics test. A twelve-item math test (Figure 4) included questions
relevant to grade 5 Common Core State Standards for Mathematics (National Research Council,
2005) used in our previous work (Burte et al., 2017). Mean accuracy was calculated.
Figure 4. Examples of problems (sourced from www.commoncoresheets.com) in the grade 5
Common Core State Standards used in the Common Core Mathematics test.
Mental Unfolding Task. Our Mental Unfolding task (Burte, Taylor, & Hutton, in prep)
draws on the original Paper Folding Test (Ekstrom, French, Harman, & Dermen, 1976), with
modifications to identify cognitive strategies used. Similar to the Paper Folding Test, each item
involves pictures of a piece of paper being folded one to three times and then a hole being
punched through the paper and five responses items depicting possible holes configurations after
the depicted paper has been unfolded. To respond the participant must identify the correct
configuration of holes. Incorrect responses suggest cognitive strategies used. Response variables

MAKE-A-DICE TEST 21
include mean accuracy and total response time across all 36 items.
Spatial Competency and Anxiety scales. The Spatial Competency and Spatial Anxiety
Scales consist of eight descriptions of environmental spatial tasks (Lawton, 1994). To which we
added seven descriptions of small-scale spatial tasks, so that a range of everyday spatial tasks
were covered in the two scales. Separately analyzing these two sets of descriptions did not
change the reported results, so they were kept together. Participants rate their competency with
and anxiety levels during each task on 5-point scales. Scores include mean competency (5 =
high, 1 = low competency), and mean anxiety (5 = high, 1 = low anxiety).
Santa Barbara Sense of Direction Scale (SBSOD). Santa Barbara Sense of Direction
Scale (SBSOD; Hegarty, Richardson, Montello, Lovelace, & Subbiah, 2002) consists of 15
descriptions of environmental-scale spatial tasks for which participants provide their agreement
on a 7-point scale. Some items require reverse scoring. Mean score (7 represents high spatial
abilities) is calculated.
Purdue Spatial Visualization test. The Purdue Spatial Visualization Test (henceforth
referred to as Purdue Rotations; Guay, 1977) consists of 20 spatial analogies wherein a
participant views a depiction of a 3-D object before and after rotation and then select the
equivalent “after” rotation for another 3-D object. Scores involve mean accuracy and total time
for the 20 analogies.
Procedure
Session 1. Participants completed the following assessments in order: Make-A-Dice
Version 11-A, the Abbreviated Mathematics Anxiety Rating Scale, Forward Digit Span, VVCS,
previous math experience, Common Core Math, Reverse Digit Span, and demographics (age,
gender, handedness, and language fluency).

MAKE-A-DICE TEST 22
Session 2. One month after the Session 1, participants completed the following
assessments in order: Make-A-Dice Version 11-B, Make-A-Dice Strategy Questionnaire, Mental
Unfolding task, Spatial Competency and Spatial Anxiety Scales, SBSOD, Purdue Rotations, and
demographics (age, gender, handedness, and language fluency).
For all tasks/assessments, given the remote nature of Mechanical Turk, we could not
assess whether participants used external aids (e.g., paper and pencil) to respond.
Results
Make-A-Dice performance and reliability. For Session 1 (Make-A-Dice Version 11-A)
accuracy ranged from 27% to 100% (M = 90.7%; SEM = 1.8%) and mean reaction times ranged
from 18 to 130 seconds (M = 47s; SEM = 2s; Figure 5). Cronbach’s alpha for accuracy on the 11
items was .95, and a by-item analysis revealed that it shifted by less than .01 if any item was
removed. For Session 2 (Make-A-Dice Version 11-B), accuracy ranged from 27% to 100% (M =
92.5%; SEM = 1.6%) and mean reaction time ranged from 16 to 195 seconds (M = 49s; SEM =
3s; Figure 5). Cronbach’s alpha for accuracy on the 11 items was .91, and a by-item analysis
revealed that it shifted by only .02 if any item was removed.
As can be seen in Figure 5, there were outliers in both accuracy and reaction times. We
did not trim or recode these outliers as there are only 11 items on the Make-A-Dice test in each
version. Trimming and recoding of individual items would have a significant impact on our
results. Instead, we used linear regression and linear mixed models to allow for variation in
accuracy and reaction times on the participant- and item-level. In addition, Figure 5 shows
ceiling effects in accuracy because the Make-A-Dice measure was designed for use with children
(not the adult population used in Study 1). Due to these ceiling effects, the analyses that follow
maybe biased. Because of these limitations, Study 1 provides a preliminary understanding of the

MAKE-A-DICE TEST 23
connection between Make-A-Dice performance and a battery of other measures, since such a
battery would be too taxing for elementary students and some measures do not have versions that
are appropriate for use with elementary students.
Figure 5. Session 1 Make-A-Dice accuracy (far left) and reaction time in seconds (center left),
and Session 2 Make-A-Dice accuracy (center right) and reaction time in seconds (far right). For
all boxplots, the center of the box represents the median, the top and bottom of the box indicate
the first and third quartile, the whiskers indicate a 95% confidence interval, circles outside the
whiskers represent outliers, and medians are labeled.
Combining the two sessions’ data, Cronbach’s alpha for accuracy on 22 items was .95,
and a by-item analysis revealed that it shifted by only .01 if any item was removed. Session 1
and Session 2 accuracy and reaction times were highly correlated, r(86) = .75, p < .001, and,
r(86) = .30, p < .01 respectively. Using one-sample t-tests, performance across the two Make-A-
Dice tests did not significantly change across sessions. Neither mean accuracy change (M =
1.8%, SEM = 1.2%; t(87) = 1.44, p = .15) nor mean reaction time change (M = 2.1s, SEM = 3.5s;
t(87) = 0.60, p = .55) differed from zero.
Principle Components Analysis. The following Session 1 and 2 measures were
examined in a principle components analysis (PCA) with varimax rotation: Make-A-Dice
accuracy, Forward Digit Span, Reverse Digit Span, VVCS Math accuracy, Mental Unfolding

MAKE-A-DICE TEST 24
task accuracy and reaction times, Common Core (CC) Math accuracy, Spatial Competency
Score, Spatial Anxiety Score, and Purdue Rotations accuracy and reaction times. The following
variables were excluded because they did not correlate with at least one other measure at the .30
level: Make-A-Dice reaction times, VVCS strategy score, Math Anxiety score, Common Core
Math completion times, math courses and grades, and demographic variables. When multiple
measures are being evaluated and those measures are correlated, PCA allows for the independent
contributions of these variables to be assessed. By using PCA, we can investigate the
independent contributions of Make-A-Dice relative to other spatial measures, which have high
surface similarity.
The PCA was deemed suitable using the remaining items based on the following
indicators: 1) each measure significantly correlated (adjusted for multiple comparisons) with at
least one other measure at the .30 level (see the correlation matrix in Table 1); 2) the Kaiser-
Meyer-Olkin measure of sample adequacy was .67, which is above the recommended value of
.60; 3) Bartlett’s test of sphericity was significant, X2(66) = 332.41, p < .001; and, 4) the
communalities were all above .30, indicating that each item shared common variable with other
items (Table 2). The first four factors together represent 67.8% of the available variance, broken
down into 26.5%, 18.4%, 13.1%, and 9.8% respectively. All four eigen values exceeded 1 (3.18,
2.21, 1.57, and 1.18, respectively), and the screen plot showed a greatly reduced slope after the
fourth factor. All measures exceeded a minimum criterion of having a primary factor loading of
.40 or above, so all measures were retained.
The first factor reflected accuracy on objective measures of spatial visualization: Mental
Unfolding and Purdue Rotations tests. The second factor was composed of self-report measures
of spatial abilities: SBSOD score, spatial competency, and spatial anxiety. The third factor
MAKE-A-DICE TEST 25
indicated that Make-A-Dice accuracy was related to both VVCS and Common Core math
accuracy. Finally, the fourth factor was composed of the two-digit span measures. These factors
revealed that performance on the Make-A-Dice test did not load on the same factors as the self-
report and objective measures of spatial visualization, nor the short-term memory digit span
measures, but instead was more associated with math test performance.
Running head: MAKE-A-DICE TEST 26
Table 1. Correlation Coefficients for Principle Components Analysis.
Make-A-Dice
VVCS Math
Mental Unfolding
Purdue Rotations
CC Math Acc.
SBSOD Score
Digit Span Spatial
Acc. Acc. Acc. Time Acc. Time Forw. Back. Comp. Anx. M 92% 75% 66% 21s 60% 23s 84% 4.5 / 7 7.8 / 10 6.8 / 10 3.5 / 5 2.1 / 5 SD 15% 22% 18% 11s 19% 11s 14% 1.2 / 7 1.1 / 10 1.5 / 10 0.7 / 5 0.7 / 5
Make-A-Dice Acc. -- .51
*** .35 ns
.22 ns
.29 ns
.16 ns
.51 ***
.05 ns
.08 ns
.13 ns
-.03 ns
-.13 ns
VVCS Math Accuracy -- .36
* .03 ns
.26 ns
.12 ns
.44 ***
-.05 ns
.00 ns
.17 ns
.04 ns
-.15 ns
Unfolding Accuracy -- .34
ns .61 ***
.40 **
.39 **
.22 ns
-.02 ns
.32 ns
.20 ns
-.20 ns
Unfolding Time -- .12
ns .57 ***
.14 ns
.02 ns
.25 ns
.31 ns
-.33 ns
.18 ns
Purdue Accuracy -- .31
ns .19 ns
.12 ns
-.03 ns
.30 ns
.21 ns
-.14 ns
Purdue Time -- .11
ns .12 ns
.12 ns
.19 ns
-.07 ns
.04 ns
CC Math Accuracy
--
.06 ns
.03 ns
.07 ns
-.03 ns
-.15 ns
SBSOD Score
--
-.08 ns
.13 ns
.57 ***
-.50 ***
Forward Digit Span
--
.42 ***
-.06 ns
.05 ns
Backward Digit Span
--
.13 ns
-.18 ns
Spatial Competency
--
-.52 ***
Adjusted for multiple comparisons: *** p < .001; ** p < .01; * p < .05; ns = not significant
Running head: MAKE-A-DICE TEST 27
Table 2. Factor Loadings and Communalities from the Principle Components Analysis.
Factor 1 Factor 2 Factor 3 Factor 4 Communalities Make-A-Dice Accuracy -.53 .65 VVCS Math Accuracy -.56 .65 Unfolding Accuracy -.46 .73
Unfolding Time -.47 .73 Purdue Rotations Accuracy -.40 .51
Purdue Rotations Time -.59 .70 CC Math Accuracy -.53 .61
SBSOD Score -.50 .65 Forward Digit Span .75 .80
Backward Digit Span .61 .70 Spatial Competency -.58 .77
Spatial Anxiety .52 .65 Factor loadings under .40 were suppressed.
Predicting item-level Make-A-Dice performance. Linear mixed-effects models can
investigate performance on each test item nested under each participant, using hypothesized
measures of item difficulty. Using the “lme4” package in R version 3.1.2 (Bates, Mächler,
Bolker, & Walker, 2015), we developed a series of linear mixed-effects models, which used each
of the 22 Make-A-Dice items as the smallest unit of analysis (i.e., item-level), to predict Make-
A-Dice accuracy and reaction times in separate models. Null models included only Make-A-Dice
items, sessions, and participants modeled with random intercepts and slopes, and were used as a
comparison against which to judge if including the fixed effects added explanatory information
above and beyond individual differences in item, sessions, and participants. Fixed effects models
(Table 3) included the following measures of item difficulty: cube net (A through K), longest run
(2-4), shortest run (2-3), and session (1-2). Significant fixed effects were run in an interaction
model that tested for interactions with session. Models were compared using X2 tests.
Accuracy. A linear mixed model composed of cube net, t = 3.0, p < .01, longest run, t =
3.2, p < .01, shortest run, t = 2.6, p < .01, and session, t = 2.5, p < .05, significantly predicted

MAKE-A-DICE TEST 28
accuracy rates and outperformed the null model, X2(4) = 12.6, p < .05 (Figure 6). For the cube
nets (Figure 6A), participants struggled the most with K (i.e., the most difficult problem),
struggled with the first problem of each type (A was the first 4 by 3, C was the first 4 by 2, H
was the first 3 by 2), performed well with the last problem of each type (B was the last 4 by 3, J
was the last 3 by 2), and performed well with G (the only 3 by 3). Specifically, A (M = 90%), C
(M = 90%), and H (M = 91%) were significantly different than G (M = 93%). B (M = 93%) and
J (M = 93%) were significantly different than K (M = 89%). D (M = 92%), E (M = 93%), F (M
= 92%), and I (M = 92%) did not differ significantly from the other cube nets. Additionally,
accuracy was higher for items longer runs than shorter runs (Figure 6B and 6C), and accuracy
increased across the sessions (Figure 6D). This confirmed our prediction that runs (i.e., adjacent
squares in a row) predict item difficulty, hence our labeling of cube nets based on the longest and
shortest runs.
A linear mixed model composed of the interaction of the runs with session revealed that
session only significantly interacted with the shortest run (Figure 6). In this model, cube net, t =
3.0, p < .01, longest run, t = 3.2, p < .01, shortest run, t = 3.4, p < .001, session, t = 2.9, p < .01,
and the interaction between session and shortest run, t = -2.5, p < .05, significantly outperformed
the null model, X2(5) = 18.7, p < .01, and the previous model, X2(1) = 6.2, p < .05. The
interaction between shortest run and session revealed that items with different runs only
significantly differed in Session 1 and not Session 2. When first exposed to Make-A-Dice
problems, participants were less accurate on items with the shortest runs (Figure 6E). Upon a
second exposure to Make-A-Dice problems, participants performed equivalently across problem
types (Figure 6F).

MAKE-A-DICE TEST 29
Figure 6. Make-A-Dice accuracy predicted, on an item-by-item basis, by cube net (see Appendix
B) (A), longest run (B), shortest run (C), session (D), and the interaction of session with the
shortest run (E and F). Each graph includes regression lines.
Reaction Times. A linear mixed model composed of cube net, t = -2.6, p < .05, longest
run, t = -3.4, p < .01, and shortest run, t = -2.5, p < .05, significantly predicted reaction times and
outperformed the null model, X2(3) = 9.4, p < .05. Neither the longest or shortest run
significantly interacted with session. For the cube nets, reaction times linearly increased with the
first three items (A-C), then dropped for the middle four items (D-G), and increased for the last
four items (H-K) (see Appendix B to reference specific items). It seems that participants were
learning how to approach the Make-A-Dice items when completing the first three items, they
figured out how to respond quickly with the middle four items, and then had trouble with the
final four items (Figure 7A). Specifically, A (M = 52.2s) was not significantly different from any
other cube net. B (M = 45.1s) differed significantly from C along with two of the middle items
(E and G) and two of the last items (H and K). C (M = 56.5s) differed significantly from the

MAKE-A-DICE TEST 30
middle items and I. The middle four items, D (M = 41.0s), E (M = 35.1s), F (M = 37.2s), and G
(M = 35.4s), tended to have significantly faster reaction times than the final four items, H (M =
56.1s), I (M = 45.7s), J (M = 57.6s), and K (M = 64.2s). Within the last items, I was the fastest
and it significantly differed from both H and K, and was not significantly different from two of
the middle items (D and F). In addition, items with longer runs had faster reaction times than
those with shorter runs (Figure 7B and 7C). This confirmed our prediction that row length
predicts item difficulty.
MAKE-A-DICE TEST 31
Figure 7. Make-A-Dice reaction times predicted, on an item-by-item basis, by cube net (A),
longest run (B), and shortest run (C). Each graph includes regression lines.
Table 3 Estimates and Standard Errors for Linear Mixed Models. Study 1: Accuracy Study 1: Reaction times Estimate SE t p Estimate SE t p Intercept 46.3 10.7 4.3 *** Intercept 202.8 47.6 4.3 ** Cube net 1.0 0.3 3.0 ** Cube net -4.8 1.8 -2.6 * Longest run 4.6 1.4 3.2 ** Longest run -26.2 7.7 -3.4 ** Shortest run 9.1 2.7 3.4 *** Shortest run -15.8 6.3 -2.5 * Session 10.8 3.7 2.9 ** Session × Shortest run -4.0 1.6 -2.5 *
Study 2: Accuracy Study 3: Accuracy Estimate SE t p Estimate SE t p Intercept 30.0 6.7 4.5 *** Intercept -444.0 330.3 -1.3 .19 Longest run 9.1 1.6 5.6 *** Longest run 1262.8 77.6 16.3 *** Shortest run 5.0 1.7 3.0 ** Shortest run 1165.7 111.4 10.5 *** Session 17.3 7.6 2.3 * Session 4103.0 371.6 11.0 *** Session × Longest run -5.5 2.2 -2.5 * Session ×
Longest run -607.7 92.9 -6.5 ***
Session × Shortest run -605.3 133.6 -4.5 ***
* p < .05, ** p < .01, *** p < .001. Self-reported Make-A-Dice strategy use. The strategy questionnaire contained one
open-ended question followed by a strategy list with agreement rating scale (1 = strongly

MAKE-A-DICE TEST 32
disagree and 5 = strongly agree) (Figure 3). The open-ended responses to the strategy
questionnaire were coded into nine strategies (percent of participants reported using each
strategy is in Table 4): 1) Folding: mentally folding the cube net into a cube; 2) Visualizing:
visualizing, imagining, and/or see in the mind’s eye; 3) Opposite sides: identifying the opposite
sides of the cube generally; 4) Fixed sides: solving the cube sides opposite the given sides (i.e.,
sides that contained numbers); 5) Interchangeable sides: referred to using the cube sides that had
two possible correct answers; 6) Fixed first with interchangeable second: solved the cube sides
opposite the given sides first, and then solved the cube sides that had two possible correct
answers last; 7) Interchangeable first with fixed second: solved the cube sides that had two
possible correct answers first, and then solved the cube sides opposite the given sides last; 8)
Two-over: counting two over to identify the opposite cube side when cube sides are in a straight
line (or run); and, 9) Other.
Principle Components Analysis. We examined the strategies participants reported, both
coded open-ended responses (labeled 1-9) along with rated strategies (labeled A-J) using a
principle components analysis (PCA) with varimax rotation. One participant was excluded from
the PCA for not providing all ratings. PCA was used for dimension reduction given that
participants rated ten strategies and also provided self-reported strategies. The rated and self-
reported strategies likely overlap and can be used in combination. We then used the PCA to
investigate whether reported strategy use predicted Make-A-Dice performance. The following
ratings/codes were excluded because they did not correlate with at least one other measure at the
.30 level: A) Adding to 7, B) Memorized pairs summing to 7, C) Wrote out pairs summing to 7,
8) Two-over, and 9) Other. A PCA was run but the following ratings/codes needed to be
excluded from the PCA because they did not exceed a minimum criterion of having a primary
MAKE-A-DICE TEST 33
factor loading of .40 or above: E) Guessed, I) Mental folding one side, J) Mental folding whole
cube, 3) Opposite sides, and 7) Interchangeable first with fixed last.
The PCA was deemed suitable using the remaining items, given the following indicators:
1) each measure significantly correlated (adjusted for multiple comparisons) with at least one
other measure, at the .30 level (see the correlation matrix in Table 4); 2) the Kaiser-Meyer-Olkin
measure of sample adequacy was .63, which is above the recommended value of .60; 3)
Bartlett’s test of sphericity was significant, X2(36) = 383.36, p < .001; and, 4) the communalities
were all above .30, indicating that each item shared a common variable with other items (Table
5). The first four factors represent 84.3% of the available variance and represented 32.8%,
24.0%, 14.8%, and 12.7%, respectively. All five eigen values exceeded 1: 3.0, 2.2, 1.3, and 1.1,
respectively, and the screen plot showed a greatly reduced slope after the fifth factor. All
measures exceeded a minimum criterion of having a primary factor loading of .40 or above, so
all measures were retained.

Running head: MAKE-A-DICE TEST 34
Table 4. Correlation Coefficients for Principle Components Analysis.
D) F) G) H) 1) 2) 4) 5) 6) M 1.1 / 5 1.1 / 5 1.1 / 5 1.0 / 5 70% 80% 53% 44% 47% SD 0.6 / 5 0.5 / 5 0.3 / 5 0.2 / 5 -- -- -- -- --
D) Used dice for numbers -- .71
*** .13 ns
.22 Ns
-.07 ns
-.09 ns
.08 ns
-.03 ns
.10 ns
F) Used a box for folding -- .26
ns .31 Ns
-.14 ns
-.15 ns
-.01 ns
.02 ns
.01 ns
G) Made cube with paper -- .65
*** .01 ns
.13 ns
-.13 ns
-.08 ns
-.10 ns
H) Drew 3D cube -- -.10 ns
.11 ns
-.23 ns
-.19 ns
-.21 ns
1) Folding -- .56 ***
-.11 ns
-.13 ns
-.14 ns
2) Visualizing -- -.29
ns -.33 ns
-.29 ns
4) Fixed Sides -- .78 ***
.89 ***
5) Interchangeable Sides
-- .70 ***
6) Fixed; Interchangeable
--
Adjusted for multiple comparisons: *** p < .001; ** p < .01; * p < .05; ns = not significant

Running head: MAKE-A-DICE TEST 35
Table 5. Factor Loadings and Communalities from the Principle Components Analysis.
1 2 3 4 Communalities D) Used dice for numbers -.73 .88 F) Used box for folding -.67 .84 G) Made cube with paper .73 .85 H) Drew 3D cube .67 .82 1) Folding .74 .83 2) Visualizing .66 .78 4) Fixed Sides .60 .93 5) Interchangeable Sides .55 .79 6) Given; Interchangeable .58 .87 Factor loadings under .40 were suppressed.
The first factor reflected participants noticing the differences between the two types of
sides (fixed and interchangeable) and leveraging those to solve Make-A-Dice problems. The
dominant strategy seems to be solving the cube sides opposite from the fixed sides first and then
solving for the interchangeable sides, as it was difficult to find reports of other strategies. The
third factor consisted of folding and visualization strategies. The folding and visualization
strategy reports were typically vague and did not include the level of detail provided by reports
from the other factors.
Finally, the second and fourth factors reflected strategies using outside resources, such as
an actual dice and/or a box (second factor), and folding paper into a cube and/or drawing a 3D
cube (fourth factor). The strategies in the second factor would typically not be allowed in a
testing situation. Students might draw or fold their paper assessment in a testing situation, but
these strategies might be discouraged by their teacher and/or a time limit (neither of which the
MTurk participants had).
Predicting Make-A-Dice performance from self-reported strategy. Regression
models predicting combined Make-A-Dice accuracy and reaction times were run. The five
factors from the strategy PCA were included in the models as fixed effects.
MAKE-A-DICE TEST 36
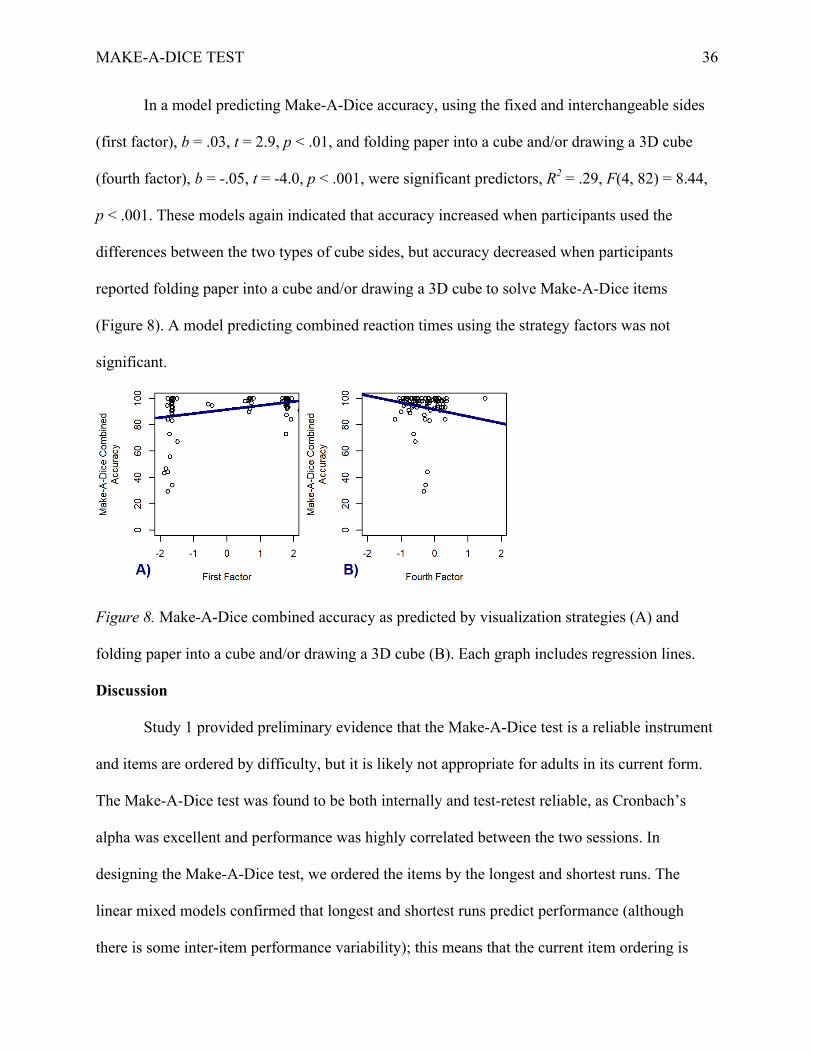
In a model predicting Make-A-Dice accuracy, using the fixed and interchangeable sides
(first factor), b = .03, t = 2.9, p < .01, and folding paper into a cube and/or drawing a 3D cube
(fourth factor), b = -.05, t = -4.0, p < .001, were significant predictors, R2 = .29, F(4, 82) = 8.44,
p < .001. These models again indicated that accuracy increased when participants used the
differences between the two types of cube sides, but accuracy decreased when participants
reported folding paper into a cube and/or drawing a 3D cube to solve Make-A-Dice items
(Figure 8). A model predicting combined reaction times using the strategy factors was not
significant.
Figure 8. Make-A-Dice combined accuracy as predicted by visualization strategies (A) and
folding paper into a cube and/or drawing a 3D cube (B). Each graph includes regression lines.
Discussion
Study 1 provided preliminary evidence that the Make-A-Dice test is a reliable instrument
and items are ordered by difficulty, but it is likely not appropriate for adults in its current form.
The Make-A-Dice test was found to be both internally and test-retest reliable, as Cronbach’s
alpha was excellent and performance was highly correlated between the two sessions. In
designing the Make-A-Dice test, we ordered the items by the longest and shortest runs. The
linear mixed models confirmed that longest and shortest runs predict performance (although
there is some inter-item performance variability); this means that the current item ordering is
MAKE-A-DICE TEST 37
appropriate. However, the test may be too easy for an adult population. Performance was
generally very good and did not improve upon retaking it (except for improvement on the most
difficult problems). The Make-A-Dice test might be made more challenging, and therefore more
appropriate for an adult population, by setting a time limit for each item. Our participants were
likely motivated to complete each session as quickly as possible, because Amazon Turk
participants receive a set compensation amount no matter how long they take. Future work might
consider adding a time limit to increase cognitive load. Since, on average, participants took less
than 50 seconds per item, a time limit of 1 minute per item might be appropriate. A minute time
limit would allow most participants to complete items unobstructed but would force slower
participants and participants completing more difficult items to respond quicker. However, paper
administration may allow for even shorter time limits as people can respond by directly writing
in each cube side and do not need to associate a number with a letter (see Figure 3).
Despite the relatively easy math involved in the Make-A-Dice test, performance was
most associated with mathematical abilities. A PCA found that Make-A-Dice accuracy was
associated with VVCS and Common Core math accuracy within a single factor, but not with any
spatial abilities measures.
Participants reported using a wide range of strategies to complete the Make-A-Dice test,
but only two of those strategies predicted performance differences. Participants were aware that
there were two types of cube sides – those opposite the given numbers (i.e., fixed sides) and
those that could be answered correctly with two numbers (i.e., interchangeable sides) – and they
tended to complete the cube sides opposite the fixed numbers first and the interchangeable sides
last. The use of the two types of cube sides predicted high levels of accuracy in both sessions.
Participants also reported using a typical spatial visualization strategy of visualizing the cube net
MAKE-A-DICE TEST 38
being folded, while others reported strategies that would not be allowed in a testing situation,
such as using a real dice or a box. The reported use of these strategies did not predict
performance. The only other strategy that predicted accuracy was folding paper or drawing a 3D
cube, the use of which predicted poor performance.
Study 2: 8-Item Make-A-Dice Test
Study 1 showed the reliability of Make-A-Dice as an instrument, indicated factors
predicting item difficulty, and found that performance related to math abilities. Since Make-A-
Dice was created for elementary students, we had elementary-aged students complete an 8-item
version of Make-A-Dice. Fewer items were used to reduce the assessment burden for this age
group. We administered these tests to elementary students to verify both the reliability of the two
versions and the connection between Make-A-Dice performance and mathematical skills. We
also aimed to make the connection between Make-A-Dice performance and spatial thinking
skills in this younger population where performance should be more variable, and should be less
biased by the ceiling effect that was found with adults.
Method
Participants. Over 80 students in grades 5 and 6 from four rural New England schools
participated. Of those students, 74 completed both Make-A-Dice tests and were included in the
analyses (Table 6; school identifiers have been anonymized). Students who did not complete
both sessions were absent from school on one of the assessment days.

MAKE-A-DICE TEST 39
Table 6. Number of students in each grade and group, split by gender.
School Grade 5 Control Grade 5 Think3d! Grade 6 Think3d! Female Male Female Male Female Male
A - - 6 6 6 9 B 8 9 5 9 - - C - - 1 7 - - D - - 6 2 - - By Gender 8 9 18 24 6 9 By Grade 17 42 15
Materials
Think3d! embodied spatial training program. While the current paper is not focused on
spatial training, the testing of Make-A-Dice was done within an experiment that investigated the
effectiveness of a spatial training program called “Think3d!”. To provide adequate context to the
conditions under which we tested Make-A-Dice, we will briefly introduce Think3d!. Think3d!
trains spatial thinking through challenges embedded in hands-on origami and pop-up paper
engineering activities (Burte et al., 2017; Taylor & Hutton, 2013). Each lesson covers specific
origami or paper engineering concepts and includes multiple challenges for exploration and
practice. The challenges require spatial thinking involved with interpreting and/or producing
diagrams, translating diagram information into actions (e.g., fold, turn, or cut), completing
actions, evaluating action results, and explaining progress to peers (Taylor & Tenbrink, 2013). In
other words, the challenges combine visual perception and action in the service of understanding
2- to 3-dimensional transformations. Think3d! itself is not the focus of the current work, but is
discussed as students participated in this program between the two assessment sessions. For more
information about the Think3d! see our previous work (Burte et al., 2017; Taylor & Hutton,
2013) or see www.think3d.us.com.
8-item Make-A-Dice test. The 8-item Make-A-Dice tests mirror the 11-item tests, but

MAKE-A-DICE TEST 40
with fewer items (cube nets: A, B, C, E, G, I, J, K) and initially started with a 6-minute time limit
(Version 8-A in Appendix C was used in Session 1, and Version 8-B in Appendix D was used in
Session 2). The two versions were matched for difficulty. Here we used the standard paper-and-
pencil implementation wherein students wrote numbers directly into blank sides of the cube nets
(instead of associating numbers with the letters A to D written on four sides of the cube).
Cronbach’s alpha was high for both versions (Session 1 α = .90; Session 2 α = .93) and test
performance was correlated, r(72) = .55, p < .001. Thus, the two versions are interchangeable.
Common Core Mathematics test. Math assessments were similar to the one used with
adults and consisted of twelve problems sourced from Common Core mathematics worksheets
(Figure 4). The assessments for a given grade used math standards from one grade younger (e.g.,
grade 5 students completed problems addressing grade 4 standards). Session 1 and 2 versions for
a given grade had matched problems to ensure similar difficulty. Each question had a total score
of 1, so if a question had two parts each part could earn 0.5 points. Mean accuracy was
calculated. For the grade 5 version, Cronbach’s alpha was high (Session 1 α = .80; Session 2 α =
.81) and test performance was correlated, r(50) = .62, p < .001. For the grade 6 version, response
rates were low contributing to low and moderate Cronbach’s alpha (Session 1 α = .47; Session 2
α = .61) and test performance was correlated, r(10) = .71, p < .05.
Mental Unfolding task. The Mental Unfolding task used with elementary students used
8-items per test from the 36-item Mental Unfolding task used with adults (Burte, Taylor, &
Hutton, in prep). Session 1 used items 1A, 2A, 12A, 18A, 22A, 28A, 31A, 35A; the Session 2
used 1B, 3B, 13B, 16B, 21B, 26B, 29B, 30B. Session 1 and 2 items were matched for difficulty
based on the number of folds, type of folds (horizontal, vertical, corner, and diagonal), and
presence of occlusion. Cronbach’s alpha was moderate (Session 1 α = .53; Session 2 α = .51) and
MAKE-A-DICE TEST 41
test performance was correlated, r(67) = .41, p < .001. This measure was in development when
we used it. The moderate Cronbach’s alpha indicates that this measure could be improved, which
we have subsequently done.
8-item Purdue Rotations test. The 8-item Purdue Rotations Tests for elementary students
used items from the 20-item Purdue Rotations Test used with adults. Session 1 used questions 1,
3, 4, 6, 8, 9, 12, 15 from the original; questions from the original but with different rotations and
response items in Session 2: 1, 15, 3, 8, 4, 9, 12, 6). Session 1 and 2 items were matched for
difficulty using rotation amount (90° or 180°) and number of rotations (1 or 2). Cronbach’s alpha
was moderate for both versions (Session 1 α = .52; Session 2 α = .60) and test performance was
correlated, r(67) = .49, p < .001. We modified this measure so that it could be used with
elementary students, which likely accounts for the moderate Cronbach’s alphas. We have since
updated our modified version.
Procedure. Students completed Session 1 assessments one week prior to Think3d!
implementation (six weeks total) and finished with Session 2 assessments one week after
Think3d!. Control classrooms completed assessments on the same schedule. Session 1 and 2
involved different versions of the four assessments. Each assessment had a different time limit:
(1) a 12-item Common Core mathematics test (10 minutes); (2) 8-item Make-A-Dice test (6
minutes); (3) 8-item Mental Unfolding task (6 minutes); and, (4) 8-item Purdue Rotations test (8
minutes). Both grades completed the same Make-A-Dice, Mental Unfolding task, and Purdue
Rotations tests; each grade completed a grade-appropriate math assessment.
Results
We first evaluated whether Think3d! participation impacted Make-A-Dice performance
by comparing Session 1 to Session 2 performance change between control and Think3d! groups

MAKE-A-DICE TEST 42
(for grade 5 only) using between-samples t-tests. Mean change in attempts (Control M = -4.4%,
SEM = 4.0%; Think3d! M = 2.1%, SEM = 2.1%) did not significantly differ between the groups,
t(57) = 1.55, p = .13, and mean change in accuracy (Control M = -4.8%, SEM = 9.1%; Think3d!
M = -1.9%, SEM = 3.5%) did not significantly differ between the groups, t(57) = 0.37, p = .71.
Further, the two groups did not differ on Session 1 and 2 tests when analyzed separately. Given
no group differences in Make-A-Dice performance, the two groups were analyzed together.
Make-A-Dice performance and reliability. Make-A-Dice Session 1 accuracy ranged
from 0% to 100% (M = 72%; SEM = 3%), and Session 2 accuracy ranged from 9% to 100% (M
= 71%; SEM = 4%). As can be seen in Figure 9, there were ceiling effects in Make-A-Dice
performance, particularly for grade 6 students and in Session 2, which might bias the results that
follow. Accuracy for both sessions were highly correlated, r(72) = .55, p < .001, and Cronbach’s
alpha was .94. Results also did not show a practice effect across sessions. Specifically, a one-
sample t-test showed mean change in attempts (M = 0.5%, SEM = 1.8%) did not significantly
differ from zero, t(73) = 0.28, p = .78, and mean change in accuracy (M = -1.3%, SEM = 3.3%)
also did not differ from zero, t(73) = -0.39, p = .70 (Figure 9).
Figure 9. Make-A-Dice Session 1 overall accuracy (A) and split by grade (B), along with
Session 2 overrall accuracy (C) and split by grade (D).
Predicting participant-level Make-A-Dice performance. Participant-level regression

MAKE-A-DICE TEST 43
models predicting Make-A-Dice accuracy were run. Measures from each session were run in
separate models. The following variables were tested as fixed effects: Make-A-Dice attempt
rates, Common Core math accuracy, Mental Unfolding accuracy, Purdue Rotation accuracy,
grade (5, 6), group (control, Think3d!), and gender (male, female).
Session 1 performance. In a model predicting Make-A-Dice accuracy, Make-A-Dice
attempts, b = .34, t = 3.6, p < .01, Common Core Math accuracy, b = .37, t = 3.8, p < .001,
Mental Unfolding accuracy, b = .30, t = 2.9, p < .01, and Purdue Rotation accuracy, b = .21, t =
1.9, p = .05, were significant predictors, R2 = .52, F(4, 59) = 14.8, p < .001. For Session 1, Make-
A-Dice accuracy increased with increasing Make-A-Dice attempts, Common Core Math
accuracy, Mental Unfolding accuracy, and Purdue Rotation accuracy (Figure 10).

MAKE-A-DICE TEST 44
Figure 10. Make-A-Dice Session 1 accuracy as predicted by Session 1: Make-A-Dice attempts
(A), Math accuracy (B), Mental Unfolding accuracy (C), and Purdue Rotations accuracy (D).
Each graph includes regression lines.
Session 2 performance. In a model predicting Make-A-Dice accuracy, Make-A-Dice
attempts, b = .22, t = 2.1, p < .05, Common Core Math accuracy, b = .40, t = 3.7, p < .001, and
Purdue Rotations accuracy, b = .29, t = 2.8, p < .01, were significant predictors, R2 = .41, F(3,
56) =12.93, p < .001. For Session 2, Make-A-Dice accuracy increased with increasing Make-A-
Dice attempts, Common Core Math accuracy, and Purdue Rotations accuracy (Figure 11).

MAKE-A-DICE TEST 45
Figure 11. Make-A-Dice Session 2 accuracy as predicted by Session 2: Make-A-Dice attempts
(A), Math accuracy (B), and Purdue Rotations accuracy (C). Each graph includes regression
lines.
Predicting item-level Make-A-Dice performance. Linear mixed-effects models allow
for investigating performance on each test item nested under each participant, using
hypothesized measures of item difficulty. Using the “lme4” package in R version 3.1.2 (Bates et
al., 2015), we developed a series of linear mixed-effects models, which included each of the 16
Make-A-Dice items as the smallest unit of analysis (i.e., item-level), to predict Session 1 and 2
Make-A-Dice accuracy. Make-A-Dice items, sessions, and participants were modelled with
random intercepts and slopes. The following variables were tested as fixed effects (i.e., measures
of item difficulty): cube net (A, B, C, E, G, I, J, K), longest run (2-4), shortest run (2-3), and
session (1-2). Significant fixed effects were run in a model that tested for interactions with
session (Table 3). Models were compared using X2 tests.
A linear mixed model composed of longest run, t = 5.4, p < .001, and shortest run, t = 3.0,
p < .01, significantly outperformed the null model, X2(2) = 19.4, p < .001. Accuracy was higher
for items with shorter runs (Figure 12). This confirmed our prediction that runs predict item
difficulty, hence our labeling of cube nets based on longest and shortest runs.
A linear mixed model composed of the interaction of runs with session revealed that

MAKE-A-DICE TEST 46
session only significantly interacted with the longest run (Figure 12). In this model, longest runs,
t = 5.6, p < .001, session, t = 2.3, p < .05, the interaction between session and longest run, t = -
2.5, p < .05, and shortest run, t = 3.0, p < .01, significantly outperformed the null model, X2(4) =
26.4, p < .001, and the previous model X2(2) = 7.0, p < .05. Accuracy increased over the sessions
with the improvement focused on items with the fewest cube sides on their longest run, or the
most difficult problems.
Figure 12. Make-A-Dice accuracy predicted, on an item-by-item basis, by longest run (A),
session (B), the interaction of session with the longest run (C and D), and the shortest run (E).
Each graph includes regression lines.
Discussion
Study 2 provided preliminary evidence that the Make-A-Dice test is a reliable instrument,
is roughly age appropriate for grade 5 and 6 students, and that it assesses the intersection
between math and spatial thinking. The Make-A-Dice test was found to be both internally and

MAKE-A-DICE TEST 47
test-retest reliable, as Cronbach’s alpha was excellent and performance was highly correlated
between the two sessions. Given that Common Core math and Purdue Rotations accuracy most
consistently predicted Make-A-Dice accuracy, the Make-A-Dice test is a novel assessment of the
combination of math and spatial thinking abilities. In terms of age appropriateness, Make-A-Dice
might be slightly too easy for grade 5 and 6 students as the only gains were on items with the
fewest cube sides on their longest run. This result indicates that students improved on the most
difficult problems. Future work should investigate the age appropriateness of the 11-item test
using a 16-minute time limit for students in grades 6 through 9. For Study 3, we sought to extend
our evaluation of the age appropriateness of the Make-A-Dice test by administering similar
measures to a larger sample of students in grades 3 through 6.
Study 3: 8-Item Make-A-Dice Test
We administered the 8-item Make-A-Dice tests to larger set of elementary-aged students,
along with a battery of updated math and spatial measures. We administered these tests to again
verify the reliability of the two versions and establish the connection between Make-A-Dice
performance and measures of mathematical and spatial thinking skills.
Method
Participants. Over 500 students in grades 3 to 6 from eleven rural New England schools
participated. Of those students, 468 completed both Make-A-Dice tests and were included in the
analyses (Table 7; school identifiers have been anonymized). Not all students completed both
sessions as some were absent from school on the assessment day(s), and not all students
completed all assessments on a given assessment day.
MAKE-A-DICE TEST 48
Table 7. Number of students who completed each assessment. School Grade 3 Think3d Grade 4 Think3d Grade 5 Think3d Grade 6 Think3d Female Male Female Male Female Male Female Male A 9 9 16 3 16 8 13 12 B - - 13 16 17 22 - - C 3 5 6 3 3 3 - - D - - 19 15 6 12 - - E - - 7 7 15 15 - - By Gender 12 14 61 44 57 60 13 12 By Grade 26 105 117 25 School Grade 3 Control Grade 4 Control Grade 5 Control Grade 6 Control Female Male Female Male Female Male Female Male F - - 5 6 4 4 1 4 G - - 9 6 5 5 - - H - - - - 10 10 - - I - - 21 29 29 26 - - J - - 14 15 - - - - K - - 15 13 - - - - By Gender - - 64 69 48 45 1 4 By Grade - 133 93 5
Materials
8-item Make-A-Dice test. The 8-item Make-A-Dice tests were updated in the following
ways: increased time to complete to 8 minutes. Cronbach’s alpha was good to excellent for both
versions (Session 1 α = .88; Session 2 α = .92) and test performance was correlated, r(465) = .67,
p < .001. Once again, Version 8-A was used in Session 1 and Version 8-B in Session 2.
Common Core Mathematics test. Math assessments were changed in the following ways:
misunderstood questions were reworded, reduced number of sub-questions (e.g., 4 sub-questions
reduced to 2), and replaced high difficulty questions with less difficult problems. Grades 3 and 4
completed math tests based on grade 3 standards, and grades 5 and 6 completed math tests based
on grade 4 standards. For the grade 3 standards test (grades 3 and 4 completed), Cronbach’s
alpha was good (Session 1 α = .83; Session 2 α = .85) and test performance was correlated,
r(247) = .73, p < .001. For the grade 4 standards test (grade 5 and 6 completed), Cronbach’s

MAKE-A-DICE TEST 49
alpha was good (Session 1 α = .81; Session 2 α = .82) and test performance was correlated,
r(223) = .53, p < .001.
Mental Unfolding task. The Mental Unfolding tasks were changed in the following
ways: we removed the most difficult problems (i.e., those where one part of the paper occluded
another part of the paper), and matched response items across the tests by their features. The
items on this test no longer coincided with items on the Mental Unfolding task used with adults.
Cronbach’s alpha was poor (Session 1 α = .59; Session 2 α = .62) but test performance was
correlated, r(466) = .55, p < .001. Again, this measure was in development when we used it. The
poor Cronbach’s alpha indicates that this measure needed some adjustments, which we have
since made.
8-item Purdue Rotations test. The 8-item Purdue Rotations Tests were changed in the
following ways: we removed the most difficult two axes problems, and reduced number of
response items from 5 to 3. Session 1 used questions 1, 3, 4, 6, 8, 9, 12, 15 from the original;
Session 2 used the same questions from the original but with different rotations and response
items: 1, 15, 3, 8, 4, 9, 12, 6). Cronbach’s alpha was poor (Session 1 α = .67; Session 2 α = .47)
but test performance was correlated, r(461) = .60, p < .001. Again, we modified this measure to
for use with elementary students, which likely contributed to the poor Cronbach’s alpha. We
have since updated this measure.
Procedure. Students completed Session 1 assessments one week prior to Think3d!
implementation (six weeks total) and finished Session 2 assessments one week after Think3d!.
Control classrooms completed assessments on the same schedule, and completed spelling games
as an active control for the six-week interim. Each assessment had a different time limit: (1) a
12-item Common Core mathematics test (10 minutes); (2) 8-item Make-A-Dice test (8 minutes);

MAKE-A-DICE TEST 50
(3) 8-item Mental Unfolding task (8 minutes); and, (4) 8-item Purdue Rotations test (8 minutes).
Both grades completed the same Make-A-Dice, Mental Unfolding, and Purdue Rotations tests;
each grade completed a grade-appropriate math assessment.
Results
We first evaluated whether Think3d! participation impacted Make-A-Dice performance
by comparing Session 1 to Session 2 performance change between control and Think3d! groups
using between-samples t-tests. Mean change in attempts (Control M = 5.5%, SEM = 16.8%;
Think3d! M = 6.6%, SEM = 19.3%) did not significantly differ between the two groups, t(466) =
0.68, p = .50, and mean change in accuracy (Control M = 6.4%, SEM = 22.9%; Think3d! M =
5.9%, SEM = 22.4%) did not significantly differ between the two groups, t(466) = -0.24, p = .81.
Further, the two groups did not differ on Session 1 and 2 tests when analyzed separately. Given
no group differences in Make-A-Dice performance, the two groups were analyzed together.
Make-A-Dice performance and reliability. Make-A-Dice Session 1 accuracy ranged
from 6.0% to 100.0% (M = 65.9%; SEM = 1.3%) and Session 2 accuracy ranged from 3.0% to
100.0% (M = 72.0%; SEM = 1.3%). As seen in Figure 13, Make-A-Dice Session 2 accuracy has
a ceiling effect, particularly in older grades, which indicates that the following results may be
biased. Accuracy for both sessions was highly correlated, r(467) = .67, p < .001, and Cronbach’s
alpha was .93. Practice effects across Session 1 and 2 tests were found. One-sample t-tests found
that mean change in attempts (M = 6.1%, SEM = 0.8%) significantly differed from zero, t(467) =
7.25, p < .001, and mean change in accuracy (M = 6.1%, SEM = 1.0%) also significantly differed
from zero, t(467) = 5.88, p < .001.

MAKE-A-DICE TEST 51
Figure 13. Make-A-Dice Session 1 overall accuracy (A) and split by grade (B), along with
Session 2 overall accuracy (C) and split by grade (D).
Predicting participant-level Make-A-Dice performance. We ran participant-level
regression models predicting Sessions 1 and 2 Make-A-Dice accuracy. Measures from each
session were run in separate models. The following variables were tested as fixed effects: Make-
A-Dice attempt rates, Common Core math accuracy, Mental Unfolding accuracy, Purdue
Rotation accuracy, grade (3-6), group (control, Think3d!), and gender (male, female).
Session 1 performance. In a model predicting Make-A-Dice accuracy, Make-A-Dice
attempts, b = .45, t = 12.5, p < .001, Common Core Math accuracy, b = .22, t = 4.8, p < .001,
Mental Unfolding accuracy, b = .28, t = 6.7, p < .001, Purdue Rotation accuracy, b = .21, t = 4.8,
p < .001, and grade, b = -.09, t = -2.3, p < .05, were significant predictors, R2 = .49, F(5, 412) =
77.62, p < .001. For Session 1, Make-A-Dice accuracy increased with increasing Make-A-Dice
attempts, with increasing accuracy on Common Core Math, Mental Unfolding, and Purdue
Rotation, along with grade (Figure 14).

MAKE-A-DICE TEST 52
Figure 14. Make-A-Dice Session 1 accuracy as predicted by Session 1: Make-A-Dice attempts
(A), Math accuracy (B), Mental Unfolding accuracy (C), Purdue Rotations accuracy (D), grade
(E). Each graph includes regression lines.
Session 2 performance. In a model predicting Make-A-Dice accuracy, Make-A-Dice
attempts, b = .29, t = 8.0, p < .001, Common Core Math accuracy, b = .32, t = 7.3, p < .001,
Mental Unfolding accuracy, b = .30, t = 6.9, p < .001, Purdue Rotations accuracy, b = .18, t =
4.4, p < .001, and grade, b = -.11, t = -2.9, p < .01, were significant predictors, R2 = .46, F(5,
413) = 71.55, p < .001. For Session 2, Make-A-Dice accuracy increased with increasing Make-
A-Dice attempts, accuracy on Common Core Math, Mental Unfolding, and Purdue Rotations,
along with grade (Figure 15).
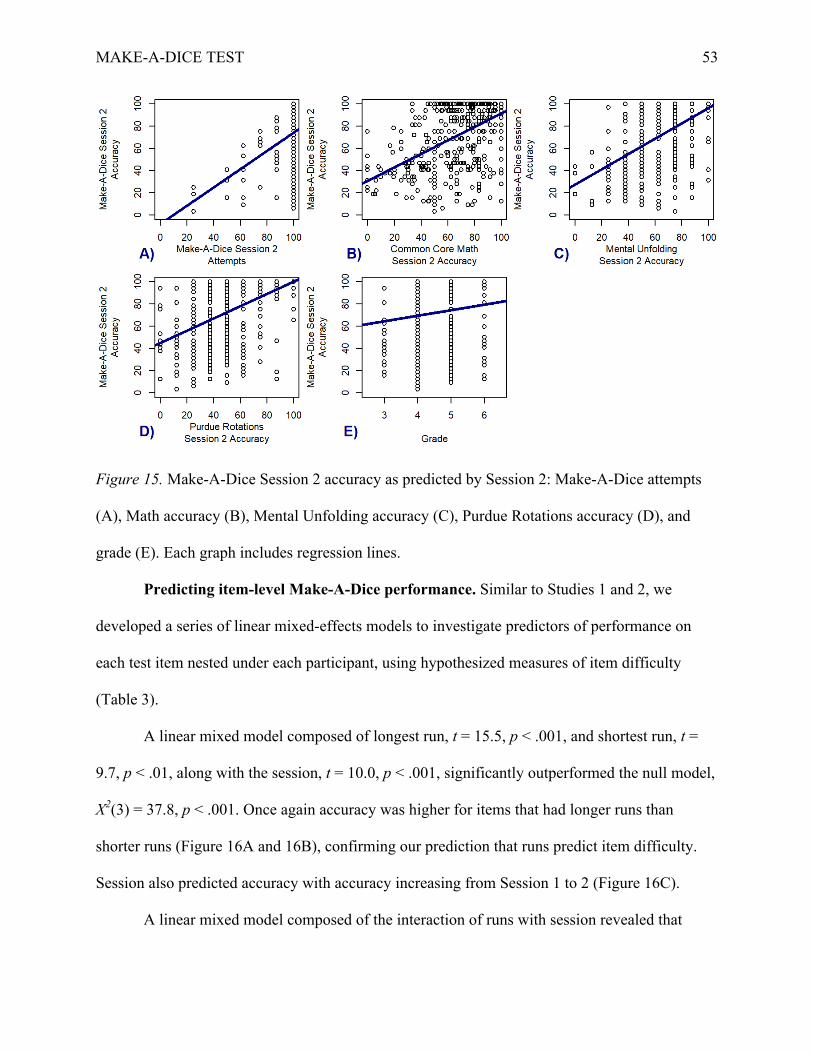
MAKE-A-DICE TEST 53
Figure 15. Make-A-Dice Session 2 accuracy as predicted by Session 2: Make-A-Dice attempts
(A), Math accuracy (B), Mental Unfolding accuracy (C), Purdue Rotations accuracy (D), and
grade (E). Each graph includes regression lines.
Predicting item-level Make-A-Dice performance. Similar to Studies 1 and 2, we
developed a series of linear mixed-effects models to investigate predictors of performance on
each test item nested under each participant, using hypothesized measures of item difficulty
(Table 3).
A linear mixed model composed of longest run, t = 15.5, p < .001, and shortest run, t =
9.7, p < .01, along with the session, t = 10.0, p < .001, significantly outperformed the null model,
X2(3) = 37.8, p < .001. Once again accuracy was higher for items that had longer runs than
shorter runs (Figure 16A and 16B), confirming our prediction that runs predict item difficulty.
Session also predicted accuracy with accuracy increasing from Session 1 to 2 (Figure 16C).
A linear mixed model composed of the interaction of runs with session revealed that
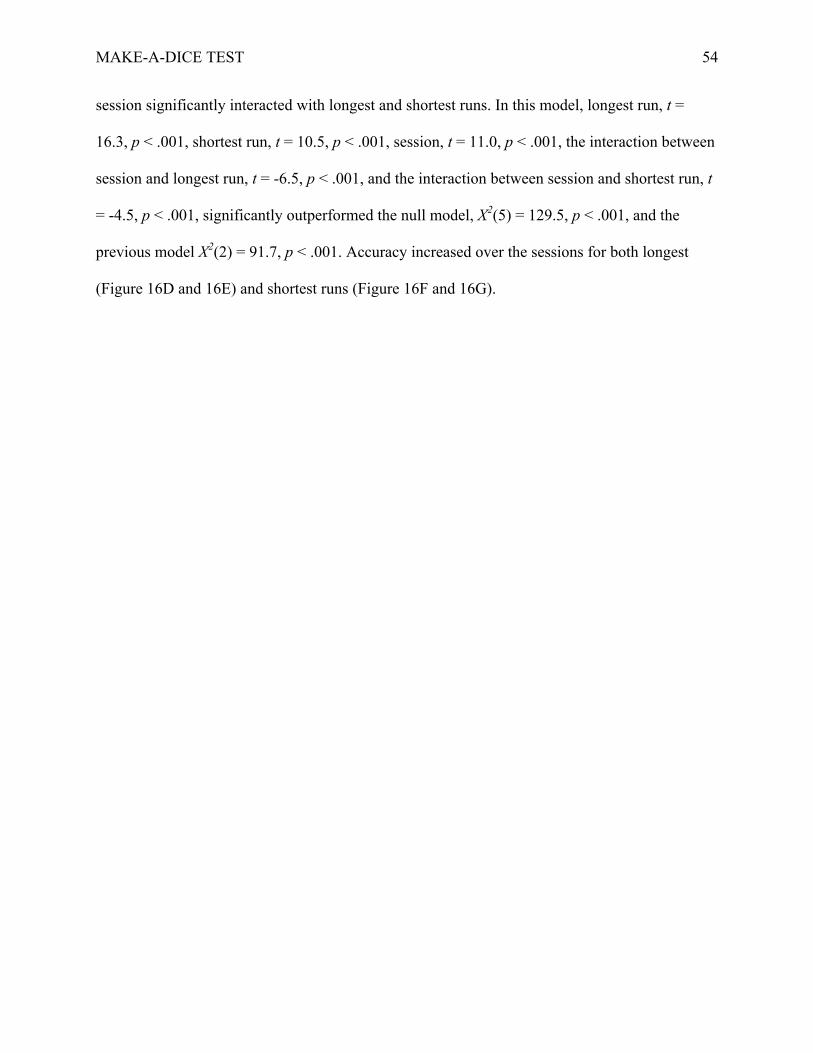
MAKE-A-DICE TEST 54
session significantly interacted with longest and shortest runs. In this model, longest run, t =
16.3, p < .001, shortest run, t = 10.5, p < .001, session, t = 11.0, p < .001, the interaction between
session and longest run, t = -6.5, p < .001, and the interaction between session and shortest run, t
= -4.5, p < .001, significantly outperformed the null model, X2(5) = 129.5, p < .001, and the
previous model X2(2) = 91.7, p < .001. Accuracy increased over the sessions for both longest
(Figure 16D and 16E) and shortest runs (Figure 16F and 16G).

MAKE-A-DICE TEST 55
Figure 16. Make-A-Dice accuracy predicted, on an item-by-item basis, by the longest run (A),
shortest run (B), session (C), the interaction of session with longest run (D and E), and the
interaction of session with the shortest run (F and G). Each graph includes regression lines.
Discussion
Study 3 provided evidence that Make-A-Dice is a reliable measure, age appropriate for
grades 3 through 6, and assesses the intersection between math and spatial thinking. Once again,
the Make-A-Dice test had both internal and test-retest reliability, as Cronbach’s alpha was
excellent and performance was highly correlated between the two sessions. Make-A-Dice
MAKE-A-DICE TEST 56
accuracy was predicted consistently by Common Core math, Mental Unfolding, and Purdue
Rotations accuracy, supporting our hypothesis that Make-A-Dice assesses the combination of
spatial and mathematical reasoning. In terms of age appropriateness, gains were found from
Session 1 to 2, grade was a significant predictor of accuracy in both sessions, and both runs
interacted with session. These results indicate that students improved overall in Make-A-Dice
performance (i.e., a re-testing effect), there was a developmental trend of older students
performing better than younger students, and the greatest improvements emerged on the most
difficult problems. There was one exception to this pattern. Grade 6 post-test performance was
much lower than expected given grade 5 performance, grade 6 pre-test performance, and grade 6
performance in study 2. However, this drop in performance was not limited to Make-A-Dice.
While not presented here, grade 6 students showed a similar drop in performance across all of
the measures. Grade 6 students may have either found the measures too easy in the pre-test or
learned that these measures were not graded, and so lost motivation for completing them. Future
work should investigate the appropriateness of the 8-item compared to the 11-item versions for
grade 6 students.
General Discussion
With rapid technology development, the importance of mathematics education continues
to increase. In a recent report, the Center for Educational Statistics (2016) compared the
mathematics literacy of 15-year olds across countries. Twenty-seven countries had higher
mathematics literacy than did the United States on average. While the multitude of explanations
behind this statistic are beyond the scope of this paper, the finding should serve as an impetus for
better understanding the cognitive underpinnings of mathematical thinking to improve math
literacy.

MAKE-A-DICE TEST 57
The relationship between spatial thinking and mathematics has garnered recent research
interest. Correlational studies find that individuals with better spatial thinking skills have greater
interest and perform better in STEM disciplines (e.g., Shea et al., 2001; Wai et al., 2009). Many
studies have also showed this relationship with specific STEM disciplines, such as mathematics
(e.g., Zhang & Lin, 2015). These findings suggest that one basic cognitive skill underlying
mathematics is spatial thinking (see also Uttal & Cohen, 2012). Promising in this suggestion are
studies showing that spatial training improves spatial thinking (Uttal et al., 2013). If spatial
thinking is a fundamental cognitive skill underlying mathematics understanding, teaching spatial
thinking early may be beneficial. While spatial thinking is not prominent in elementary education
(National Research Council, 2005), identifying individuals who may particularly benefit from
spatial training may be a fruitful approach. The current work presented an individual difference
assessment measure, Make-A-Dice, which links spatial thinking with mathematics. It also
engages working memory, a cognitive resource critical to both spatial and mathematical
thinking.
To examine how Make-A-Dice relates to spatial thinking, mathematics, and working
memory, adults (Study 1) and children (Study 2 and 3) completed two sessions of assessments
and questionnaires. Analyses focused on factors embedded in the Make-A-Dice test, designed to
alter its difficulty. These factors were similar to those identified in Shepard and Feng’s (1972)
Mental Paper Folding task. We also examined how Make-A-Dice performance related math and
spatial thinking assessments/self-reports in both adults and elementary-aged children.
Make-A-Dice and Item Difficulty
Make-A-Dice is a reliable instrument and the 8-item version is appropriate for use with
elementary aged students. Both the 11 and 8-item versions had high internal reliability

MAKE-A-DICE TEST 58
(Cronbach’s alpha between .91 to .95) and high test re-test reliability (correlation coefficients
ranging from .55 to .75). The 8-item version with an 8-minute time limit appeared to be age
appropriate for grades 3 through 6, although grade 6 students performed very well in study 2.
Age appropriateness for elementary students was supported by improvements in Make-A-Dice
performance (i.e., a re-testing effect), a developmental trend across grades, and improvements on
the most difficult problems. The 11-item version without a time limit is likely too easy for adults
as performance was at ceiling, and there was little improvement upon retake (except for
improvement on the most difficult problems).
The ceiling effects found in adult performance and, to a lesser extent, in elementary
students may have biased the results reported in these three studies. Future work is needed to
evaluate how timing and item difficulty can be altered to eliminate these ceiling effects and
verify these results. Adding an 11-minute time limit (1 minute per item when administered
online) might provide enough cognitive load to make the test appropriate for high-school
students and adults, although, developing and including more difficult items might also be
necessary. Future work should investigate the age appropriateness of the 11-item test with a 16-
minute time limit for junior high students and, given the ceiling effect for grade 6 students in
study 2, grade 6 students as well.
Make-A-Dice design factors influenced performance as expected, which supported our
item ordering by difficulty level. Make-A-Dice performance dropped with increasing cube net
difficulty (i.e., length of the shortest and longest runs), and accuracy improved across sessions
for the most difficult problems. We ordered the 11 possible cube nets by run lengths, because we
hypothesized that using a simple 2-over rule would be a widely-used strategy. Counting two
cube sides over to identify the opposite cube side would likely be quick and accurate, so the

MAKE-A-DICE TEST 59
more cube sides in a straight line (i.e., row) the more this strategy could be efficiently employed.
This hypothesis found support most clearly with adult reaction time data. Reaction times
increased with each new set of long and short row combinations (i.e., the first 4 by 2 problem
after completing 4 by 3 problems), and reaction times to a second item with the same long and
short row combinations often decreased.
In adults, strategy self-reports confirmed our predictions that individuals would utilize the
two types of cube sides: those opposite the given numbers (i.e., fixed sides) and those that could
be answered correctly with two numbers (i.e., interchangeable sides). The dominant strategy was
to utilize the difference between these two cube sides and complete the fixed sides before the
interchangeable sides. But some participants did the reverse. Some participants used spatial
visualization strategies (e.g., visualizing the cube net being folding), while others used strategies
that would not be allowed in a testing situation (e.g., using a real dice or a box). Despite this
range of strategies, the only strategy that predicted performance involved folding paper or
drawing a 3D cube – the use of which predicted poor performance. It seemed that performance
differences were not large enough to identify strategy differences that predicted performance.
Future work could investigate developmental trends in the strategies elementary through high
school students use in solving Make-A-Dice problems.
Relationship between Make-A-Dice and other cognitive tasks. All three studies
showed a positive relationship between Make-A-Dice and math performance. For adults (Study
1), VVCS and Common Core math were the only predictors of Session 1 Make-A-Dice
accuracy. Notably, increases in math accuracy related to increases in Make-A-Dice accuracy.
High school math grades and time spent on the Common Core math test predicted Session 1
Make-A-Dice reaction times, among other predictors (reverse digit span, education level).
MAKE-A-DICE TEST 60
Additionally, Make-A-Dice accuracy loaded with accuracy on the two math assessments (VVCS
and Common Core) in the principle components analysis. For kids, Common Core math
accuracy was among the predictors of Make-A-Dice accuracy in both sessions and both studies.
Although its relation to math performance was stronger, Make-A-Dice performance did
relate to spatial tasks/self-reports for adults and kids. Adults who performed better on a spatial
visualization task (Mental Unfolding task) solved Make-A-Dice problem more accurately, and
those who rated themselves as having a better sense of direction (SBSOD) solved Make-A-Dice
items faster. For kids, Purdue Rotation and Mental Unfolding accuracy predicted Make-A-Dice
accuracy. Individual differences in working memory also impacted Make-A-Dice performance.
Specifically, adults with higher reverse digit span scores solved Make-A-Dice items faster. In
summary, Make-A-Dice performance related to math performance for both age groups and
related more so than it did to spatial task performance/self-reports or working memory.
Implications
Make-A-Dice shows promise as an individual difference measure linking spatial and
mathematical thinking. The test engages spatial visualization (Shepard & Feng, 1972) with the
addition of simple math. Make-A-Dice carries a high working memory load via the way spatial
visualization and math are combined to follow the “opposite sides” rule of a playing dice.
Despite the simple math involved in Make-A-Dice, performance was related most robustly to
math performance. It also related to measures of spatial thinking and working memory.
The relationship between spatial thinking with STEM interest and outcomes, together
with evidence that spatial thinking is trainable, suggest that Make-A-Dice has educational utility.
It has the potential of identifying elementary-aged children who may benefit from spatial
training. Specifically, children who have low Make-A-Dice performance, but who have the
MAKE-A-DICE TEST 61
mathematical addition skills used in Make-A-Dice may benefit from such training. Early spatial
training may, in turn, expand students’ cognitive tool box for STEM learning. Currently spatial
thinking has not been broadly included in U.S. elementary education (National Research
Council, 2005). Make-A-Dice is not limited to use with children. Adult Make-A-Dice
performance also related to their math scores and self-reported spatial skills.
Wai and Worrell (2016) also propose identifying talented students for STEM through
their spatial skills, particularly from underrepresented groups. They note that spatial reasoning is
less correlated with socioeconomic status than are math and verbal reasoning. As such,
identifying talent via spatial thinking may tap students from underrepresented and disadvantaged
backgrounds. Make-A-Dice’s strong relationship to math performance while also linking to other
standard spatial measures suggest promise.
Acknowledgements
George Wolford for guidance on statistical models, and Aleksandra Kaszowska for
feedback on manuscript drafts. Ruchira Parikh, Maya Salcido White, and Tess Cotter for data
entry and analysis on Study 2. Avi Block, Logan Zhang, Jay Naborn, Maya Salcido White,
Meghan O’Brien, Myrna Lyncee, Olivia Nicholson, and Ruchira Parikh for data entry and
analysis on Study 3. This research was supported by the Institute of Education Sciences, U.S.
Department of Education, through Grant # R304A140151 to Tufts University. The opinions
expressed are those of the authors and do not represent views of the Institute or the U.S.
Department of Education.

Burte,Gardony,Taylor,&Hutton,2018 Version11-A Page1/3
Appendix A: 11-item Make-A-Dice Test Version 11-A

Burte,Gardony,Taylor,&Hutton,2018 Version11-A Page2/3
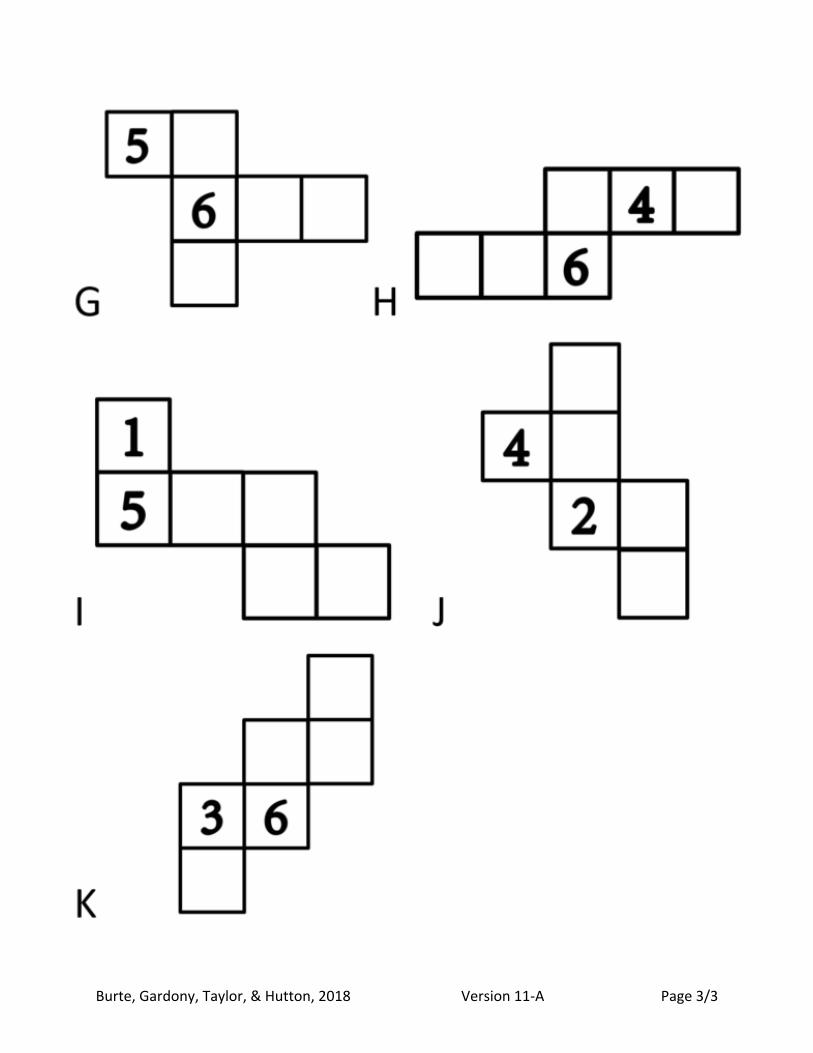
Burte,Gardony,Taylor,&Hutton,2018 Version11-A Page3/3

Burte,Gardony,Taylor,&Hutton,2018 Version11-B Page1/3
Appendix B: 11-item Make-A-Dice Test Version 11-B

Burte,Gardony,Taylor,&Hutton,2018 Version11-B Page2/3

Burte,Gardony,Taylor,&Hutton,2018 Version11-B Page3/3

Burte,Gardony,Taylor,&Hutton,2018 Version8-A Page1/2
Appendix C: 8-item Make-A-Dice Test Version 8-A

Burte,Gardony,Taylor,&Hutton,2018 Version8-A Page2/2

Burte,Gardony,Taylor,&Hutton,2018 Version8-B Page1/2
Appendix D: 8-item Make-A-Dice Test Version 8-B

Burte,Gardony,Taylor,&Hutton,2018 Version8-B Page2/2

MAKE-A-DICE TEST 72
References
Alexander, L., & Martray, C. R. (1989). The development of an abbreviated version of the Mathematics Anxiety Rating Scale. Measurement and Evaluation in Counseling and Development, 22(3), 143-150.
Ashcraft, M. H., & Krause, J. A. (2007). Working memory, math performance, and math anxiety. Psychonomic Bulletin & Review, 14(2), 243-248.
Baddeley, A. D., & Hitch, G. (1975). Working memory. Psychology of learning and motivation, 8, 47-89.
Bates, D., Mächler, M., Bolker, B. M., & Walker, S. C. (2015). Fitting linear mixed-effects models using lme4. Journal of Statistical Software, 67(1). doi:10.18637/jss.v067.i01
Bayliss, D. M., Jarrold, C., Baddeley, A. D., & Gunn, D. M. (2005). The relationship between short-term memory and working memory: Complex span made simple?. Memory, 13(3-4), 414-421.
Bennett, G. K., Seashore, H. G., & Wesman, A. G. (1973). Differential aptitude test: Forms S and T. New York, NY: The Psychological Corporation.
Berch, D. B., Foley, E. J., Hill, R. J., & Ryan, P. M. (1999). Extracting parity and magnitude from Arabic numerals: Developmental changes in number processing and mental representation. Journal of experimental child psychology, 74(4), 286-308.
Bull, R., Espy, K. A., & Wiebe, S. A. (2008). Short-term memory, working memory, and executive functioning in preschoolers: Longitudinal predictors of mathematical achievement at 7 years. . Developmental Neuropsychology, 33, 205-228.
Burte, H., Gardony, A. L., Hutton, A., & Taylor, H. A. (2017). Think3d!: Improving mathematics learning through embodied spatial training. Cognitive Research: Principles and Implications, 2(1), 13.
Burte, H., Taylor, H. A., & Hutton, A. (In prep). Mental Unfolding Task: Assessing reliability, relationship to other spatial measures, and predictors of item difficulty.
Casey, B. M., Nuttall, R. L., & Pezaris, E. (1997). Mediators of gender differences in mathematics college entrance test scores: A comparison of spatial skills with internalized beliefs and anxieties. Developmental psychology, 33(4), 669-680.
Casey, B. M., Pezaris, E., Fineman, B., Pollock, A., Demers, L., & Dearing, E. (2015). A longitudinal analysis of early spatial skills compared to arithmetic and verbal skills as predictors of fifth-grade girls' math reasoning. Learning and Individual Differences, 40, 90-100.
Cheng, Y. L., & Mix, K. S. (2014). Spatial trianing improves children's mathematics ability. Journal of Cognition and Development, 15(1), 2-11.
Clark, C. A., Pritchard, V. E., & Woodward, L. J. (2010). Preschool executive functioning abilities predict early mathematics achievement. Developmental Psychology, 46(5), 1176.
Coleman, S. L., & Gotch, A. J. (1998). Spatial perception skills of chemistry students. Journal of Chemical Education, 75(2), 206-209.
Conway, A. R., Kane, M. J., Bunting, M. F., Hambrick, D. Z., Wilhelm, O., & Engle, R. W. (2005). Working memory span tasks: A methodological review and user’s guide. Psychonomic Bulletin & Review, 12(5), 769-786.
Ekstrom, R. B., French, J. W., & Harmon, H. H. (1976). Manual for kit of factor-referenced cognitive tests. Princeton, NJ: Educational Testing Service.
Friso-van den Bos, I., van der Ven, S. H. G., Kroesbergen, E. H., & van Luit, J. E. H. (2013).

MAKE-A-DICE TEST 73
Working memory and mathematics in primary school children: A meta-analysis. Educational Research Review, 10, 29-44.
Gallistel, C. R., & Gelman, R. (1992). Preverbal and verbal counting and computation. Cognition, 44, 43-74.
Guay, R. (1977). Purdue Spatial Visualization Test-Visualization of Views. West Lafayette, IN: Purdue Research Foundation.
Gunderson, E. A., Ramirez, G., Beilock, S. L., & Levine, S. C. (2012). The relation between spatial skill and early number knowledge: The role of the linear number line. Developmental psychology, 48(5), 1229-1241.
Hannafin, R. D., Truxaw, M. P., Vermillion, J. R., & Liu, Y. (2008). Effects of spatial ability and instructional program on geometry achievement. The Journal of Educational Research, 101(3), 148-157.
Hegarty, M., Crookes, R. D., Dara-Abrams, D., & Shipley, T. F. (2010). Do all science disciplines rely on spatial abilities? preliminary evidence from self-report questionnaires. Paper presented at the Proceedings of the 7th International Conference on Spatial Cognition, Berlin, Germany.
Hegarty, M., Keehner, M., Khooshabeh, P., & Montello, D. R. (2009). How spatial abilities enhance, and are enhanced by, dental education. Learning and Individual Differences, 19(1), 61-70.
Hegarty, M., & Kozhevnikov, M. (1999). Types of visual–spatial representations and mathematical problem solving. . Journal of Educational Psychology, 91(4), 684-689.
Hegarty, M., Richardson, A. E., Montello, D. R., Lovelace, K., & Subbiah, I. (2002). Development of a self-report measure of environmental spatial ability. . Intelligence, 30(5), 425-447.
Hegarty, M., & Waller, D. (2005). Individual differences in spatial abilities. In P. Shah & A. Miyake (Eds.), The Cambridge Handbook of Visuospatial Thinking (pp. 121-169). New York, NY: Cambridge University Press.
Holmes, J., & Adams, J. W. (2006). Working memory and children's mathematical skills: Implications for mathematical development and mathematical curricula. Educational Psychology, 26, 339-366.
Keehner, M., Tendick, F., Meng, M. V., Anwar, H. P., Hegarty, M., Stoller, M. L., & Duh, Q. Y. (2004). Spatial ability, experience and skill in laparoscopic surgery. The American Journal of Surgery, 188(1), 71-75.
Kell, H. J., Lubinski, D., Benbow, C. P., & Steiger, J. H. (2013). Creativity and technical innovation: Spatial ability's unique role. Psychological Science, 24(9), 1831-1836.
Kozhevnikov, M., Hegarty, M., & Mayer, R. E. (2002). Revising the visualizer-verbalizer dimension: Evidence for two types of visualizers. Cognition and Instruction, 20(1), 47-77.
Kozhevnikov, M., Kosslyn, S., & Shephard, J. (2005). Spatial versus object visualizers: A new characterization of visual cognitive style. . Memory & Cognition, 33(4), 710-726.
Kozhevnikov, M., Motes, M. A., & Hegarty, M. (2007). Spatial visualization in physics problem solving. Cognitive Science, 31(4), 549-579.
Krutetskii, V. A. (1976). The psychology of mathematical abilities in schoolchildren. Chicago, IL: University of Chicago Press.
Laski, E. V., Casey, B. M., Yu, Q., Dulaney, A., Heyman, M., & Dearing, E. (2013). Spatial skills as a predictor of first grade girls' use of higher level arithmetic strategies. Learning

MAKE-A-DICE TEST 74
and Individual Differences, 23, 123-130. Lawton, C. A. (1994). Gender differences in way-finding strategies: Relationship to spatial
ability and spatial anxiety. Sex Roles, 30(11-12), 765-779. Lean, G., & Clements, M. K. (1981). Spatial ability, visual imagery, and mathematical
performance. . Educational Studies in Mathematics, 12(3), 267-299. LeFevre, J., Fast, L., Skwarchuk, S. L., Smith-Chant, B. L., Bisanz, J., Kamawar, D., & Penner-
Wilger, M. (2010). Pathways to mathematics: Longitudinal predictors of performance. Child Development, 81(6), 1753-1767.
Lehmann, J., Quaiser-Pohl, C., & Jansen, P. (2014). Correlation of motor skill, mental rotation, and working memory in 3-to-6-year-old children. . European Journal of Developmental Psychology, 11(5), 560-573.
Lowrie, T., Logan, T., & Ramful, A. (2017). Visuospatial training improves elementary students’ mathematics performance. British Journal of Educational Psychology, 87(2), 170-186.
Lubinski, D. (2010). Spatial ability and STEM: A sleeping giant for talent identification and development. Personality and Individual Differences, 49(4), 344-351.
Lubinski, D., & Benbow, C. P. (2006). Study of mathematically precocious youth after 35 years: Uncovering antecedents of the development of math-science expertise. Perspectives on psychological science, 1(4), 316-345.
Matthewson, J. H. (1999). Visual-spatial thinking: An aspect of science overlooked by educators. Science Education, 83(1), 33-54.
Mikaye, A., Friedman, N. P., Rettinger, D. A., Shah, P., & Hegarty, M. (2001). How are visuospatial working memory, executive functioning, and spatial abilities related? A latent-variable analysis. Journal of Experimentak Psychology: General, 130(4), 621-640.
Mix, K. S., Levine, S. C., Cheng, Y. L., Young, C., Hambrick, D. Z., Ping, R., & Konstantopoulos, S. (2016). Separate but correlated: The latent structure of space and mathematics across development. Journal of Experimental Psychology: General, 145(9), 1206-1227.
National Center for Education Statistics. (2016). The Condition of Education 2016 Washington, DC.
National Research Council. (2005). Learning to think spatially: GIS as a support system in the K-12 curriculum: National Academies Press.
Newcombe, N. S. (2010). Picture this: Increasing math and science learning by improving spatial thinking. American Educator, 34(2), 29-35.
Newcombe, N. S., & Shipley, T. F. (2015). Thinking about spatial thinking: New typology, new assessments. In Studying visual and spatial reasoning for design creativity (pp. 179-192). Springer, Dordrecht.
Ontario Ministry of Education. (2014). Paying Attention to Spatial Reasoning, K-12: Support Document for Paying Attention to Mathematics Education. Toronto, Ontario, Canada.
Orion, N., Ben-Chaim, D., & Kali, Y. (1997). Relationship between earth-science education and spatial visualization. Journal of Geoscience Education, 45(2), 129-132.
Peters, M., Chisholm, P., & Laeng, B. (1995). Spatial ability, student gender, and academic performance. Journal of Engineering Education, 84(1), 69-73.
Raghubar, K. P., Barnes, M. A., & Hecht, S. A. (2010). Working memory and mathematics: A review of developmental, individual difference, and cognitive approaches. Learing and Individual Differences, 20(2), 110-122.
Reilly, D., Neumann, D. L., & Andrews, G. (2015). Sex differences in mathematics and science

MAKE-A-DICE TEST 75
achievement: A meta-analysis of National Assessment of Educational Progress assessments. Journal of Educational Psychology, 107(3), 645-662.
Reuhkala, M. (2001). Mathematical skills in ninth-graders: Relationship with visuo-spatial abilities and working memory. Educational Psychology, 21(4), 387-399.
Shah, P., & Miyake, A. (1996). The separability of working memory resources for spatial thinking and language processing: An individual differences approach. Journal of Experimental Psychology: General, 125(1), 4-27.
Shea, D. L., Lubinski, D., & Benbow, C. P. (2001). Importance of assessing spatial ability in intellectually talented young adolescents: A 20-year longitudinal study. Journal of Educational Psychology, 93(3), 604-614.
Shepard, R. N., & Feng, C. (1972). A chronometric study of mental paper folding. Cognitive Psychology, 3(2), 228-243.
Sorby, S., Casey, B., Veurink, N., & Dulaney, A. (2013). The role of spatial training in improving spatial and calculus performance in engineering students. Learing and Individual Differences, 26, 20-29.
Stieff, M., & Uttal, D. H. (2015). How much can spatial training improve STEM achievement? . Educational Psychology Review, 27(4), 607-615.
Taylor, H. A., & Hutton, A. (2013). Think3d!: Training spatial thinking fundamental to STEM education. Cognition and Instruction, 31(4), 434-455.
Taylor, H. A., & Tenbrink, T. (2013). The spatial thinking of origami: Evidence from think-aloud protocols. Cognitive Processes, 14(2), 189-191.
Uttal, D. H., & Cohen, C. A. (2012). Spatial thinking and STEM education: When, why, and how? Psychology of learning and motivation, 57(147).
Uttal, D. H., Meadow, N. G., Tipton, E., Hand, L. L., Alden, A. R., Warren, C., & Newcombe, N. S. (2013). The malleability of spatial skills: A meta-analysis of training studies. Psychological Bulletin, 139(2), 352-402.
Verdine, B. N., Golinkoff, R. M., Hirsh-Pasek, K., Newcombe, N. S., Filipowicz, A. T., & Chang, A. (2014). Deconstructing building blocks: Preschoolers' spatial assembly performance relates to early mathematical skills. Child Development, 85(3), 1062-1076.
Wai, J., Lubinski, D., & Benbow, C. P. (2009). Spatial ability for STEM domains: Aligning over 50 years of cumulative psychological knowledge solidifies its importance. Journal of Educational Psychology, 101(4), 817-835.
Wai, J., & Worrell, F. C. (2016). Helping disadvantaged and spatially talented students fulfill their potential: Related and neglected national resources. . Policy Insights from the Behavioral and Brain Sciences, 3(1), 122-128.
Weschler, D. (1945). A standardized memory scale for clinical use. The Journal of Psychology, 19(1), 87-95.
Zhang, X., & Lin, D. (2015). Pathway to arithmetic: The role of visual-spatial and language skills in written arithmetic, word problems, and nonsymbolic arithmetic. Contemporary Educational Psychology, 41, 188-197.