in relation to whirling disease infection risk
TRANSCRIPT

Spawning and rearing ecology of Madison River rainbow trout in relation to whirling disease infectionriskby Daniel Charles Downing
A thesis submitted in partial fulfillment of the requirements for the degree of Master of Science in Fishand Wildlife ManagementMontana State University© Copyright by Daniel Charles Downing (2000)
Abstract:This study examined the relationship between rainbow trout Oncorhynchus mykiss spawning andrearing on whirling disease infection risk in the Madison River. Nearly 80% of the 1,705 observedredds and 59% (10 of 17) of the mainstem spawning radiotagged fish were concentrated in the upper 11km of the study area. Additionally, 4 of 21 (19%) radiotagged fish spawned in tributaries. Peakspawning occurred April 30 in 1998 and May 1 in 1999, but spawning was observed from late Marchto early June. Emergence in the mainstem occurred over 3 weeks during late June and early July. Age-0rainbow trout densities in September 1999 were positively correlated with redd densities (r2 = 0.91, P =0.01) suggesting no large scale migration during their first summer. Whirling disease severity,measured using sentinel cage fish, was highly spatially and temporally variable throughout the upperMadison River. Mean whirling disease severity grades of 0.11 and 3.48 were recorded in sites locatedon opposite sides of the river during the same sampling period. Additionally, mean severity gradesranged from 0.19 to 3.55 within a single site monitored between May and October. This study foundrainbow trout spawning and rearing concentrations were spatially diverse. This finding linked to theconcomitant finding that whirling disease infection risk was also spatially diverse and not apparentlyrelated to spawning site locations, suggests that spawning and rearing in low infection risk areas wouldlimit exposure to whirling disease.

SPAWNING AND REARING ECOLOGY OF MADISON RIVER RAINBOW TROUT
IN RELATION TO WHIRLING DISEASE INFECTION RISK
by
Daniel Charles Downing
A thesis submitted in partial fulfillment of the requirements for the degree
of
Master of Science
in
Fish and Wildlife Management
MONTANA STATE UNIVERSITY Bozeman, Montana
July, 2000

rtV*
APPROVAL
of a thesis submitted by
Daniel Charles Downing
This thesis has been read by each member of the thesis committee and has been found to be satisfactory regarding content, English usage, format, citations, bibliographic style, and consistency, and is ready for submission to the College of Graduate Studies.
Thomas E. McMahonDate 7
Jay J. Rotella
Bruce R. McLeod
Approved for Jhe Department of Ecology
_______7/^4st)Date
Approved for the College of Graduate Studies
X -z/-*^ Date

■V' ■. • r - ' V v - V '-S;:'?: -V.',- r- : .
iii
STATEMENT OF PERMISSION TO USE
In presenting this thesis in partial fulfillment of the requirements for a "master’s
degree at Montana State University, I agree that the Library shall make it available to
borrowers under rules of the Library.
IfI have indicated my intention to copyright this thesis by including a copyright,
notice page, copying is allowable only for scholarly purposes, consistent with “fair use”
as prescribed in the U.S. Copyright Law. Requests for permission for extended quotation
from or reproduction of this thesis in whole or parts may be granted only by the copyright
holder.
Signature

ACKNOWLEDGMENTS
Funding for this project was provided by the National Partnership on
Management of Wild and Native Coldwater Fisheries and Montana Fish, Wildlife and
Parks. Pat Clancey, Dick Vincent, Pat Byorth, Rob Jakubowski, and Grant Grisak
provided additional support and assistance throughout this project. In addition, I am
thankful for field assistance provided by technician Aemi Herrera and volunteers Ryen
Aashiem, Jill Downing, Mike Enk, Paul Hutchinson, Shane Keep, Rebecca Krueger,
Brad Liermann, Adam McMahon, Bill Mercer, Clint Sestrich, Stan Van Sickle, and Kris
Whitaker. A special thanks to Tom McMahon for his continual commitment and
guidance. I would like to recognize my committee members Billie Kerans, Brad
Shepard, and Al Zale provided many useful study design and editorial suggestions.
Lastly, thanks to Andrew Munro for his support and making our office "Productivity
iv
Central".

TABLE OF CONTENTS
LIST OF TABLES......................................................................................................... vii
LIST OF FIGURES....................................................................................................... viii
ABSTRACT.................................................................. ............................... ' ....................1
INTRODUCTION........................................................................................................ . •2
STUDY AREA.............................................•'....................................... ............................ 7
METHODS............................ ............................................................................................ 9
SPAWNING..................................................................................................................9Radiotelemetry.........................................................................................................^Redd Surveys ...........................................................................................................
EMERGENCE............................................................................................................ 14REARING...................................... ............................................................................. 15HABITAT CHARACTERISTICS....................... ....................................................... 16WHIRLING DISEASE SEVERITY............. ................................. ............................ 18
RESULTS........................................................................................................................ 19
SPAWNING...............................................................................................................19Radiotelemetry.........................................................................................................19Redd Surveys..........................................................................................................2I
EMERGENCE............................................................................................................30REARING...................................................................................................................30HABITAT CHARACTERISTICS............................................................ .................. 33WHIRLING DISEASE SEVERITY...................... ................................. ............. ......36
DISCUSSION.................................................................................................................. 39
REFERENCES................................................................................................................ 51
APPENDICES.......................... ...................... ................................................................. 58
APPENDIX A ........................................ ............................................... ................... 59Physical Characteristics, tagging Information, and Dates ofSpawning Related movements of All Radiotagged Rainbow Trout................... 60
APPENDIX B ..................................... ........................................................ -............ 61

vi
TABLE OF CONTENTS - CONTINUED
Thermal Units from Redd Formation to Emergence......... ...................................62APPENDIX C ....... ..:................................................................... :.......................... ..63
Whirling Disease Severity Grade and Percent Infectedfor Sentinel Cages During 1998........................................................................... 64Whirling Disease Severity Grade and Percent Infectedfor Sentinel Cages During 1999............................................................................65

LIST OF TABLESTable Page
1. Spawning Timing Attributes of Radiotagged Rainbow Trout...........................20
2. Study Reach and Rainbow Trout Spawning Attributes................... ................. 27
3. Scour and Fill Data for.Each Study Reach................................................ ........35
4. Bankfuir Width, Wetted Width Proportion of Bankfull Width,and Change in Wetted Width Percentage of Selected Side Channels............ 36
vii

LIST OF FIGURESFigure Page
1. Study Reaches and Radiotagged Rainbow Trout Spawning Locations...............8
2. Weekly Movement of Radiotagged Rainbow Trout........................................ -22
3. New Rainbow Trout Redds Observed Each Survey Period............................... 24
4. New Rainbow Trout Redds per Day for Each Study Reach................. 25
5. Flow and Mean Daily Temperature During Spawning and Emergence........... 26
6. Association of Redd Density and Side Channel Density................................... 29
7. Whirling Disease Severity in Relation to Rainbow Trout Emergence.............. 31
8. Thermal Units from Redd Formation to Emergence......................................... 32
9. Age-O Rainbow Trout Abundance by Study Reach and Sampling Period........ 34
10. Historical Mean Daily Discharge at Hebgen Dam............................................37
11. Whirling Disease Severity in Relation to Rainbow Trout Spawning..... ...........38
viii

I
a b s t r a c t
■

Introduction
Whirling disease outbreaks in premier salmonid fisheries of the intermountain
West ofthe United States have caught the attention of fishery managers and scientists of
the region (Vincent 1996; Nehring and Walker 1996). The disease has the ability to
cause severe population declines, but population level effects have not been observed in
all cases where the disease has been detected. Severe population declines have been
reported in some trout populations in the intermountain West, but little or no effects have
been documented in the Pacific Coast, Columbia River basin, and eastern and central
United States fisheries where whirling disease is present (Nehring and Walker 1996;
Modin 1998). Idaho, Colorado, and Montana have reported varying wild trout population
responses among whirling disease positive waters (Elle 1998; Nehring et al. 1998;
McMahon et al. 1999; Vincent and Byorth 1999). Idaho, for instance, has reported
significant rainbow trout Oncorhynchus mykiss population declines in the Big Lost River
while rainbow trout populations in the Big Wood River have remained stable in the
presence ofthe disease (Elle 1998).
Variation in disease severity among salmonid populations is partially a
consequence of the complex life cycle ofthe disease. The life cycle ofthe whirling
disease parasite Myxobolus cerebralis depends upon two alternate hosts, Tubifex tubifex,
an oligochaete worm, and salmonids, to complete its life cycle. Despite inhabiting a wide
range of habitats including sediments of mountain streams and highly polluted
environments (Hedrick et al. 1998), T. tubifex distribution and abundance varies spatially

and temporally (Lazim and Learner 1986, 1987; Zendt and Bergersen 2000). M.
cerebralis spores are ingested by the tubificid worms, which in turn produce the
waterborne stage of the parasite. The production of the waterborne stage is hypothesized
to vary spatially with worm density and temporally with water temperature (Hedrick et al.
1998; El-Matbouli et al. 1999). When exposed to the waterborne stage, which attaches
itself to the fish, fish become infected and serve as the host for the spore developmental
stage of the parasite. In this stage, the parasite migrates from the skin of the fish to
cartilage in the head region and digests the cartilage (Hedrick et al. 1999). Cartilage is
abundant in the developing young salmonids; therefore, they are extremely susceptible to
the effects of the disease, whereas older fish are not (Hedrick et al. 1998). Fish exposed
to the parasite during the early fry stage can suffer severe effects from whirling disease
infection including spinal and head deformation, "whirling" behavior, and mortality
(Markiw 1991). This “vulnerable period” or relatively narrow window of time (2 to 3
months after hatching depending on water temperature, E. Ryce, Montana State
University, personal communication) that fish are susceptible to whirling disease induced
mortality, coupled with the high temporal and spatial variability in infection from the
parasite (Vincent 2000), suggests many factors may contribute to variable salmonid
population responses to whirling disease.
Life history variation in the salmonid host has been proposed as a contributing
factor to observed variability in wild trout population responses (McMahon et al. 1999).
This hypothesis proposes that variation in life history traits that influence when and
where fish occur during their vulnerable period will affect the degree of exposure of
young fish to the disease. Timing and location of spawning and rearing in relation to

infection risk could therefore influence the severity of whirling disease infection. For
instance, fish whose vulnerable period occurs during periods or in areas of low infection
risk will have limited exposure to the disease. In contrast, fish whose vulnerable period
occurs during periods and in areas of high infection risk will likely show high incidence
of whirling disease related mortality, including population level responses. The timing
and location of life history events such as spawning, emergence, and rearing will thus
influence exposure to the disease.
There is wide variation among salmonids in the life history traits that may affect
their exposure to whirling disease. Salmonids have a high degree of variation in both
spawning timing and location both within and among populations (Heggberget 1988;
Quinn and Unwin 1993; Healey and Prince 1995). For example, Brown and Mackay
(1995) found that although a population of cutthroat trout O. clarki in the North Ram
River, Alberta share overwintering and summer habitat, one group spawned in tributaries
and the other spawned in the mainstem and side channels. Distances moved to spawning
areas and post spawning movements also differed between the two life histories.
Rainbow trout, Yellowstone cutthroat trout 0. clarki bouvieri, and rainbow trout x
cutthroat trout hybrids in the South Fork Snake River, Idaho also spawned in mainstem
side channels as well as in tributaries (Henderson 1999). Timing of spawning also
differed: tributary spawning cutthroat trout spawned slightly later than mainstem
spawning cutthroat trout, whereas rainbow trout showed the opposite trend (Henderson
1999). Additionally, Webb and McLay (1996) noted that Atlantic salmon Salmo solar
spawning began progressively later at downstream sites over 120 km of the
Aberdeenshire Dee, Scotland.
4

The most significant effect of spawning timing on the vulnerable period of young
trout is its influence on emergence timing. There is a link between water temperature and
spawning timing that results in hatching and emergence of fry at an optimal time for
survival (Heggberget 1988; Quinn and Unwin 1993). Water temperature is the principal
environmental variable regulating embryonic and larval development (Taylor 1991).
Webb and McLay (1996) suggest emergence is timed to coincide with favorable flow,
temperature, and food availability, thus maximizing length of the growth period. They
found multiple emergence times within the same river which suggests that optimal
conditions occur at different times among sites within a river system. Adaptive responses
to differing water temperature regimes result in differing larval survival and
developmental rate among salmonid populations (Murray et al. 1989; Taylor 1991).
In addition to the plasticity evident in timing and location of salmonid spawning
there is also considerable variation in life histories of juvenile salmonids after emergence.
Northcote (1992) reported high species and stock variability in the extent of migration
after emergence in stream-dwelling trout populations. For example, newly emerged
cutthroat trout fry from a tributary to Strawberry Reservoir, Utah, displayed two life
history strategies: one group migrated to the reservoir soon after emergence, whereas
another reared in the stream for I to 2 years (Knight et al. 1999). Rainbow trout fry from
Lake Taupo and Lake Alexandrina, New Zealand, showed similar variation in migration
and rearing (Rosenau 1991; Hayes 1995). Consequently, these wide ranging life history
variations could prove to have equally diverse effects on levels of exposure to whirling
disease and thus, disease severity within a population. For example, In a system with
high whirling disease infection risk in the mainstem but little risk in tributaries, a

6tributary rearing life history would limit exposure to whirling disease throughout the
vulnerable period, thus reducing the probability of a severe population decline caused by
whirling disease.
Rainbow trout in the Madison River, Montana, provide an example of severe
population effects that have been attributed to whirling disease. Since 1991, several
population monitoring sections of the upper Madison River have shown a severe decline
of rainbow trout populations compared with historic averages (Vincent 1996; Vincent
and Byorth 1999; Clancey 2000). Although the disease has had a severe effect, the
Madison River rainbow trout population appears to have stabilized near 25% of its
historic abundance. Because no rainbow trout strains have immunity (Vincent 1997), this
suggests that at least some fish in the population have life history characteristics enabling
them to elude the severe effects of whirling disease.
Study of the relationships between fish life history characteristics and whirling
disease infection risk may indicate the influence spawning and rearing life history have
on disease severity within a population. This knowledge could be used to develop
management strategies that encourage spawning and rearing in low infection risk
conditions. In addition, this information may allow-researchers to predict salmonid
population response to whirling disease infection based on the life history characteristics
of the population. Furthermore, such investigations may provide insight as to why some
salmonid populations show severe reductions in the face of whirling disease and others
do not.
The purpose of this study was to investigate why the rainbow trout population
response has been so severe in the Madison River and alternatively, what allows some

7fish to persist in this whirling disease infected system. Its overall goal was to test the
hypothesis that life history characteristics of rainbow trout influence whirling disease
infection risk in the Madison River. The approach was to determine rainbow trout
spawning timing and location, fry emergence, and juvenile rearing location, and relate
these life history variables to temporal and spatial variation in whirling disease infection
risk within the upper Madison River.
Study Area
The Madison River, encompassing a total drainage area of 6,475 km2, originates
in Yellowstone National Park and enters Montana in the southwestern portion of the
state. The river flows 195 km northward where it joins the Gallatin and Jefferson rivers
to form the Missouri River near the town of Three Forks.
This study was conducted on a 46 km section of the Madison River from Hebgen
Dam to McAtee Bridge (Figure I). This section of the river ranges from 1,995 m to
1,665 m in elevation. Flows peak in May and June and are generally stable the rest of the
year because of regulation by Hebgen Dam. Annual discharge at Madison (Ennis) Dam
averages 48 m3/s. Minimum and maximum flows at Kirby Ranch, 28 km downstream
from Hebgen Dam, are 17 and 99 m3/s respectively. The majority of the study section is
characterized by riffle habitat. Substrate is dominated by cobble in the main channel and
cobble and gravel in the side channels throughout the study area. Side channels are
common in the upper 35 km below Quake Lake, limited for the next 30 km, and
extensive throughout the remainder of the river to the inlet of Ennis Lake. The meadow
community type dominates the floodplain vegetation.

8
Madison Dam
Ennis Lake
Kirby Ranch USGS gauge
N
5 km■ Reach Boundary
Study reaches
1 Raynolds Pass2 Three Dollar3 Pine Butte4 Lyons5 Palisades
Squaw Creek
ebgen Dam
Figure I . Study reaches and radiotagged rainbow trout spawning locations in the upper Madison River, Montana. Spawning locations are shown for fish tagged upstream from West Fork Madison River (WF) (• ) , between Indian Creek and WF (A), anddownstream from Indian Creek (■). Study reach boundaries are delineated by solid lines (■).

Native fish species in the study area include westslope cutthroat trout 0. clarki
lewisi, mountain whitefish Prosopium williamsoni, Arctic grayling Thymallus arcticus,
white sucker Catastomus commersoni, longnose sucker C catastomus, mountain sucker
C. platyrhynchus, longnose dace Rhinichthys cataractai, and mottled sculpin Cottus
bairdi. Nonnative species include rainbow trout, brown trout S. trutta, brook trout
Salvelinus fontinalis, and Utah chub Gila atraria (FERC 1997). Rainbow and brown
trout were stocked extensively from 1948 to 1974 when stocking was discontinued as
studies suggested the wild trout populations increase in number and biomass in the
absence of stocked fish (Vincent 1987). Since the discontinuation of stocking, the
Madison River has been managed as a wild rainbow and brown trout fishery. The upper
Madison River has been designated a Class I fishery (outstanding fishery resource) in the
state (FERC 1997).
Methods
Spawning
Spawning timing and location were assessed using a combination of
radiotelemetry and redd surveys. Radiotelemetry data revealed spawning migration
patterns and location and timing of spawning not detected with redd surveys, which were
limited in periods of high flow and turbidity. Redd surveys indicated the duration of the
spawning period and allowed quantitative estimation of the relative importance of
spawning areas.

Radiotelemetrv. Radio transmitters were implanted into 32 adult rainbow trout in
an effort to describe spawning and migration behavior during the 1999 spawning season.
To ensure the monitoring period encompassed prespawning movements, 28 fish were
initially tagged in October 1998. Of these, four transmitters were reimplanted in March
1999 due to pre-spawning mortality. I captured fish by electrofishing, surgically
implanted the radio transmitters following procedures outlined by Hart and Summerfelt
(1975), Brown and Mackay (1995), and Garrett and Bennett (1995), and released the fish
within 0.5 km of their capture location. The size of radiotagged fish ranged from 343 to
460 mm (mean = 396 mm) and from 408 to 998 g (mean = 667 g; Appendix A). I
selected larger adults to increase the likelihood that radiotagged fish were sexually
mature fish and to ensure that transmitter weight would not exceed 2% body weight of
the fish (Winter 1996). On average, I tagged one fish for every 3 river km throughout the
section from Quake Lake outlet downstream to the inlet of Ennis Lake to ensure tha t.
adults distributed throughout the mainstem were represented (Figure I).
Each transmitter (model 10 - 28; Advanced Telemetry Systems Inc., Isanti, MN)
weighed between 8.13 and 8.28 g, had a 300 mm long external antenna, and a unique
frequency for identification ranging from 150.011 to 150,764 MHz. Transmitters had a
battery life of 275 d and were programmed to switch on for 4 d and off for 26 d from
September 21,1998 through February 19,1999, and every day thereafter until July 6,
1999. When switched on, the transmitters were on 9 h each day and off 15 h. This on/off
cycle was designed to maximize battery life and provide data through the entire spawning
10
season.

Radiotagged fish were relocated monthly from October 1998 through February
1999 and twice weekly from March 1999 through July 6,1999. Most fish were relocated
from roads paralleling the river by using a whip antenna mounted on a truck. On two
occasions (March 30 and May 8), an airplane was used to relocate tagged fish that could
not be found from the ground. Fish positions were obtained by triangulation from the
riverbank using a directional handheld H antenna (Niemela et al. 1993; Garrett and
Bennett 1995). To verify transmitter retention and condition of the fish, I disturbed fish
that harl remained stationary for 3 to 4 weeks. During this time, I observed fish could
easily be relocated to within 10 m using triangulation from distances up to about 30 m.
Locations of all tagged fish were recorded on 1:24,000 quadrangle maps to the nearest
0.1 river km, and mean monthly (October to early February) or mean weekly (late
February to July) movement of fish was calculated.
The timing and location of spawning were estimated based on a characteristic
movement pattern of a period of rapid movement in the spring, a I to 2 week period of
little movement, followed again by another period of more extensive movement.
Spawning was assumed to occur during the period of little movement (Swanberg 1997;
Henderson 1999). All radiotagged fish that moved from the main channel into a side
channel or migrated into a tributary where spawning habitat or redds were observed were
assumed to have spawned (Brown and Mackay 1995; Swanberg 1997; Henderson 1999).
Fish were categorized as either mainstem spawners or tributary spawners. Mainstem
spawners were further characterized by the reach where spawning occurred. Each
spawning location was defined based on the furthest extent of migration and as an area
where the fish remained for at least several days. The spawning timing was defined as

the duration from the time a fish entered its spawning location until it moved toward its
original tagging location. There were several days between relocations, so I defined the
initial migration date as midway between the date I first observed the fish migrating and
the date of the previous location. The same method was used to estimate the spawning
period, and the midpoint of the spawning period was used as the spawning date. Dates
(Julian days) of initial migration and spawning as well as duration of spawning period
were compared between mainstem spawners and tributary spawners with t-tests.
Redd surveys. The 46 km section of river between Quake Lake and McAtee
Bridge was hiked and floated in April 1998 to identify potential spawning sites by the
presence of suitable spawning gravel (Magee et al. 1996; Webb and McLay 1996;
Kondolf 2000). This section was then divided into five reaches ranging in length from
5.6 to 15.9 km. Reach boundaries were delineated by changes in gradient, side channel
development, or presence of tributary junctions (Figure I). Redd surveys were attempted
in tributaries during April 1998; however, high flows and turbidity made redd counts
difficult or impossible for much of the period between April and July. Consequently,
tributary redd count data were unavailable in this study.
Redd surveys were conducted every 4 to 9 din each mainstem reach from April
16 to June 9,1998 and February 21 to June 9,1999. The 1998 redd surveys were
conducted over a greater proportion of each reach to better investigate spawning
distribution, whereas in 1999 a smaller proportion of each reach was sampled but over a
longer period to better assess spawning timing. I conducted redd surveys by hiking the
riverbank and wading the river while wearing polarized sunglasses. Deep (>1 m), swift

areas of the main channel could not be effectively surveyed, but I observed that most of
these areas had large, embedded substrates that would make spawning difficult, thus I
believe the majority of redds were observed. Redds were identified by characteristic pit
(upstream depression) and tailspill (downstream mound of disturbed substrate) formation
and lighter color than the surrounding undisturbed substrate (Chapman 1988; Thurow and
King 1994; DeVries 1997). Each redd location was marked using painted rocks on the
riverbed and surveyor’s flags on the adjacent riverbank to avoid counting redds more
than once. To assess observer misidentification in redd detection and number of false
redds, about 10% of redds "were randomly chosen and partially excavated to check for the
presence of ova (Witzel and MacCrimmon 1983; Knapp and Vredenburg 1996).
Spawning timing was assessed by comparing the number of new redds between
each survey. The spawning rate for each interval and reach was expressed as the number
of new redds found per day since the last survey. The greatest new redds per day value
indicated the peak spawning period for each study reach. Since the large majority of
redds were observed in side channels, the total number of redds found in each reach was
divided by the side channel area surveyed to compute a mean redd density for each reach.
Redd density was then multiplied by the total side channel area for each reach to estimate
the proportion of spawning within each reach. The side channel area was calculated
using length of side channel and mean width, calculated from 2 to 70 equidistant
transects along each side channel. Simple linear regression was used to assess
associations between redd density and side channel density, which was defined as hectare
of side channel area per km of study reach length.
Emergence
Emergence timing was investigated using redd caps. The caps were I m by 2 m
nets tapered toward a perforated PVC pipe trap and secured over redds with pins at
upstream and downstream ends. The side edges were lined with cobble to seal possible
escape routes of emergent fry. Water flowing through the netting and over a redd carried
emergent fry into the detachable PVC trap.
Redd capping took place from early May through August in 1998 and 1999. I
selected redds that were not immediately adjacent to other redds, contained ova or sac
fry, and were accessible during high flows. The number of redds capped was
proportional to the number of redds found within each week of the spawning season and
each study reach. Caps were cleaned and checked for emergent fry at I to 7 d intervals.
Emergent fry were identified to species (Weisel 1966), counted, measured (total length in
mm), and released. Fry emergence was defined as the first in a succession of sampling
days in which a cumulative total of 10 fry were captured. After emergence, caps were
removed and placed on another redd of later construction. Thermal units (degree days)
from spawning to emergence were calculated by summing mean daily water temperatures
(0C) between the dates of redd construction and emergence. Mean daily temperatures
were calculated from water temperature data collected by seven Optic StowAway
thermographs that were placed 3 to 5 km apart throughout the study area. To account for
temperature differences between the redd and the water column caused by upwelling
(Hansen 1975; Ringler and Hall 1975; Beard and Carline 1991), thermograph data were
supplemented with temperature monitoring of each individual redd capped in 1999.
Temperature was recorded 10 cm below the water surface and 10 cm below the surface of

the redd substrate using an electronic probe. The mean difference between the water
column and redd temperatures was used to adjust the thermal units to emergence derived
from the thermograph data. Mean thermal units to emergence were compared between
years using a t-test and among reaches using analysis of variance (ANOVA).
Temperature differences between the water column and redd substrate were compared
among reaches using ANOVA.
Rearing
Trends in age-0 rainbow trout densities within and among reaches over time allow
insight into movement and relative abundance of juveniles during the vulnerable period
to whirling disease. Backpack electrofishing in a I m wide band along the banks of side
channels and the main channel was used to determine relative abundances of age-0
rainbow trout. Sites with shallow, low velocity stream margin habitat were selected for
age-0 sampling (Baltz et al. 1991; Bozek and Rahel 1991; Tabor and Wurtsbaugh 1991).
Age-O trout were identified to species, measured (total length in mm), and released. In
1998, seven monitoring sites between Quake Lake outlet and McAtee Bridge (Figure I)
were sampled once each in July and August. Relative abundances of age-0 rainbow trout
were determined using catch per unit effort (CPUE) values calculated as number caught
per 300 s of sampling. In 1999, eight monitoring sites, including four sites sampled in
1998, were sampled for a longer period and more intensively. Each site was sampled
four times every 2 to 3 weeks from July through September. Within each site, I randomly
chose four 15 m long sampling sections along the I m nearest the bank. Becausejuvenile
trout could have occupied most of the side channel area, sampling sections were indices
of juvenile abundance. Three pass depletion estimates were conducted for each section.
Population estimates and 95% confidence intervals were calculated using depletion
method procedures with MicroFish software (Van Deventer and Platts 1989; Griffith and
Smith 1993). The number offish caught per 300 s in the first pass of sampling allowed
comparison between years. CPUE was positively correlated with the estimated density of
each 15 m2 sampling section using three-pass depletion (CPUE = 3.30 + 0.114 density, r2
= 0.72, P < 0.001, n = 119), thus validating the use of the catch per unit effort method for
measuring relative abundance. Simple linear regression was used to assess association
between fry density and redd density.
Habitat Characteristics
Potential effects of varying flow releases from Hebgen Dam on egg survival and
age-0 trout rearing habitat were assessed using two methods. Scour chains (Nawa and
Frissell 1993) were used to measure the degree of scour and fill in spawning areas. Scour
chains were 42 cm long devices implanted vertically into the substrate with a pipe and a
post driver. The scour chains consisted of 40 cm of number 2 chain connected to a
weighted end constructed from galvanized pipe fittings and a 4 mm machine screw. The
weighted end consisted of a 75 mm long nipple screwed into a bell reducer with a 13 mm
plug. An access hole was drilled into the driver pipe flush with the upper extent of the
chain to allow parachute cord tied to the uppermost link of chain to exit the pipe. The
cord was secured to the pipe to ensure the chain remained elongated during the
implanting procedure. The pipe was driven into the substrate to the level of the access
hole ensuring the chain was implanted such that the uppermost link was flush with the

substrate surface. A total of 18 chains in 1998 and 14 chains in 1999 were installed
adjacent to aggregations of redds prior to peak flow in April and May. Scour chains were
placed in spawning areas of each study reach. Two pins driven into the riverbank
allowed triangulation of the chain location in the streambed. The chains were recovered
in October 1998 and August 1999 by carefully excavating the streambed. The depth of
substrate moved to uncover the chain was recorded as fill material, and the length of
chain laying horizontally was recorded as scour (Nawa and Frissell 1993). Scour and fill
measurements were compared between years using t-tests, and combined data from both
years were compared among reaches using ANOVA.
To assess effects of low flows on side channels important to spawning and
rearing, wetted widths of five side channels were monitored during late July and late
October 1999. Mean daily discharges recorded at the USGS gauging station near Hebgen
Dam during these periods were 25 m3/s and 37 m3/s, respectively. To determine how
frequently these flows occurred, I summarized the relative frequency of historical (1980
to 1999)-mean daily discharges during the summer rearing period (July I to September
30). I selected side channels that were surveyed for redds and age-0 abundance. Two of
the side channels were located in the Raynolds Pass study reach, two in Pine Butte, and
one in the Lyons study reach. In each side channel, I established a channel cross section
in a riffle with the highest streambed elevation, and therefore would reflect habitat
available to the entire side channel. I defined habitat availability as the proportion of
wetted width to bankfull width. Cross section profiles were determined by measuring the
vertical distance to the substrate from a level line to estimate bankfull width. The
distinguishing feature of the bankfull level was the abrupt change in bank slope from near
vertical to near horizontal (Parrett et al. 1983). Changes in wetted width were reported as
changes in proportion of wetted width to bankfull width in relation to discharge.
Whirling Disease Severity
Whirling disease infection risk was evaluated using juvenile rainbow trout in
sentinel cages following the protocol developed by Montana Fish, Wildlife and Parks
(Vincent 2000). These data were collected by Montana Fish, Wildlife and Parks,
reported by Vincent (2000), and described here to relate rainbow trout spawning and
rearing life history to risk of infection from whirling disease. A sentinel cage consisted
of a 0.5 m diameter by 0.6 m deep screen-covered cylinder containing 60 uninfected 35.
to 60 mm hatchery rainbow trout. Fish were held in cages for 10 d, then transported to a
laboratory, and held for 80 d to ensure full development of infection and spore formation
of the M. cerebralis parasite (Baldwin et al. 1998). At the end of this period, the fish
were sacrificed and their heads sent to Washington State University Animal Disease
Diagnostic Laboratory at Pullman, Washington, for histological examination. Infection
severity was scored for each fish using the MacConnell — Baldwin scale of 0 (no
infection) to 4 (extensive cartilage damage) (Vincent 2000). The mean infection grade
and percent of fish infected within a cage determined infection risk.
Eleven sites in 1998 and 18 sites in 1999 between Hebgen Dam and McAtee
Bridge were sampled to assess spatial variability of whirling disease severity among sites.
Cages were placed in stream margins along the stream bank in easily accessible locations
throughout the study section. There were three sampling periods in 1998, May 25 to June
4, July 8 to July 18, and September 28 to October 8, and two sampling periods in 1999,

May 25 to June 4 and June 24 to July 5. These periods corresponded to temperatures and
periods when peak infection has been observed in the Madison River and other systems
(D. Vincent, FWP Bozeman, personal communication). The periods best corresponding
to peak emergence timing were used for whirling disease severity comparison between
years. To evaluate infection risk in tributaries, two sentinel cages were also deployed in
the West Fork of the Madison River in 1998 during three sampling periods: June 14 to
24, July 9 to 17, and September 17 to 25. To assess temporal variation in whirling
disease infection, one site (Kirby Bridge) was used as a “time sequence” site for both
years. For this, 10-d infection tests were run consecutively from May 5 to July 25 and
from September 16 to October 18 in 1998 and from April 15 to July 15 in 1999.
Results
19
Spawning
Radiotelemetrv. A total of 818 relocations were made on 32 fish implanted with
radio transmitters from October 1998 until transmitter failure in July 1999. I obtained
spawning data on 21 radiotagged fish; the remainder were lost to predation (N = 9) and
transmitter malfunction or loss (N = 2).
Radiotagged fish generally remained near their initial tagging location prior to
prespawning movements which began in March. From October 1998 through February
1999, the average weekly movement for all radiotagged fish was < 0.5 km. Apparent
spawning migrations began in late March, when average weekly movement increased
markedly to 6.1 km per week. Spawning migrations ranged from 0 to 66.3 km for all

radiotagged fish. The direction of the spawning migration was upstream for all but one
radiotagged fish.
Fish that spawned in the mainstem initiated migration about 6 weeks earlier than
tributary spawners (March 23 versus May 6; P <0.01; Table I). Tributary spawning fish
averaged nearly 30 km greater migration distance than mainstem spawning fish (P = 0.03;
Table I). Five mainstem spawning fish showed no movement throughout the monitoring
period. These fish were assumed to have spawned in their respective locations, but
timing of spawning could not be determined and they were omitted from estimates of
spawning timing. Mainstem spawning fish entered their spawning area and spawned
about 30 d earlier than tributary spawning fish (P = 0.02, < 0.01, respectively) but the
length of the spawning period was similar (4 to 13 d; P= 0.11; Table I). Most fish
returned to locations near their initial tagging location after spawning.
Table I . Comparisons of spawning timing attributes between mainstem and tributary spawning radiotagged rainbow trout during the 1999 spawning season on the Madison River, Montana. The P values are from two sample t-tests. Bold type indicates significance at a = 0.05. Sample sizes differ among spawning attributes due to mortalityand loss of tagged f i s h . ________________________________ ________________
Mainstem Tributary
Variable N ■Mean Range N Mean Range P value
Initial migration 10 3/23 2/11-5/18 3 5/6 4/30-5/18 0.002
Enter spawning area 11 4/21 2/11-5/29 4 5/21 5/15-5/24 0.018
Spawning date 12 4/30 3/12 - 6/1 4 5/27 5/21-5/31 0.006
Leave spawning area 12 5/11 4/2-6/11 4 6/3 5/27-6/9 0.010
Spawning period (d) 11 23 4-58 4 13 10-17 0.110
Migration period (d) 9 63 7-117 3 41 27-51 0.130
Migration distance (km) 16 14.1 0-55 .0 3 43.2 13.0-66.3 0.027

21
Ofthe 12 radiotagged fish that survived and were relocated throughout the entire period
from October to July, 9 (75%) moved back to within 2 km of their original tagging
location after spawning (Figure 2). The majority (17 of 21 or 81%) of radiotagged fish
spawned in the mainstem while the remaining 19% spawned in tributaries of the Madison
River. Mainstem spawners spawned over an 82.1 km section of the mainstem, ranging
from 9.5 km upstream from the Quake Lake outlet to 72.6 km downstream from the
Quake Lake outlet (Figure I). However, nearly half (8 of 17 or 47%) spawned in the 3.3
km Raynolds Pass study reach, and 11 of 17 (65%) spawned in the upper 11 km of the
river. Fish tagged in all study reaches moved into this upper section to spawn. Of
tributary spawning fish, three of the four spawned in the West Fork Madison River
system, and one in Squaw Creek (Figure I).
Redd surveys. Redd surveys were conducted on 13.2 km of side channel habitat
in 1998 and 8.7 km in 1999 throughout the entire study area. Percentages of total side
channel area surveyed varied among study reaches (range 55 -100% in 1998 and 20 -
88% in 1999). Redd surveys were conducted 6 or 7 times in 1998 and 10 times in 1999.
Generally, conditions upstream from the West Fork Madison River were good for
visually identifying redds except for brief (I to 2 d) periods of high flow and turbidity.
Visibility was completely obscured in the lower two study reaches (Lyons and Palisades)
after May 11,1998 and May 24,1999 because of turbid runoff from the West Fork
Madison River; however, most spawning had occurred prior to these dates.
A total of 1,705 redds was observed during the two field seasons. Despite the
large number of redds found, incidence of superimposition, or multiple redds formed on

22
TributaryMainstem
11/9 11/30 12/21 1/11 2/1 2/22 3/15 4/5 4/26 5/17 6/7 6/28
Figure 2. The cumulative mean weekly movement for radiotagged rainbow trout spawning in tributaries or the mainstem Madison River, Montana, 1999 relative to the initial tagging location (horizontal line).
top of one another, was very low as only 9 and 15 observations were recorded in 1998
and 1999, respectively. Ova or sac fry were present in 86% (68 of 79) of the partially
excavated redds in 1998 and 100% (77 of 77) in 1999, thus the proportion of false redds
was also low. Ten of the 11 redds with no ova or sac fry were excavated after June 10,
1998 suggesting that fry.may have already emerged.
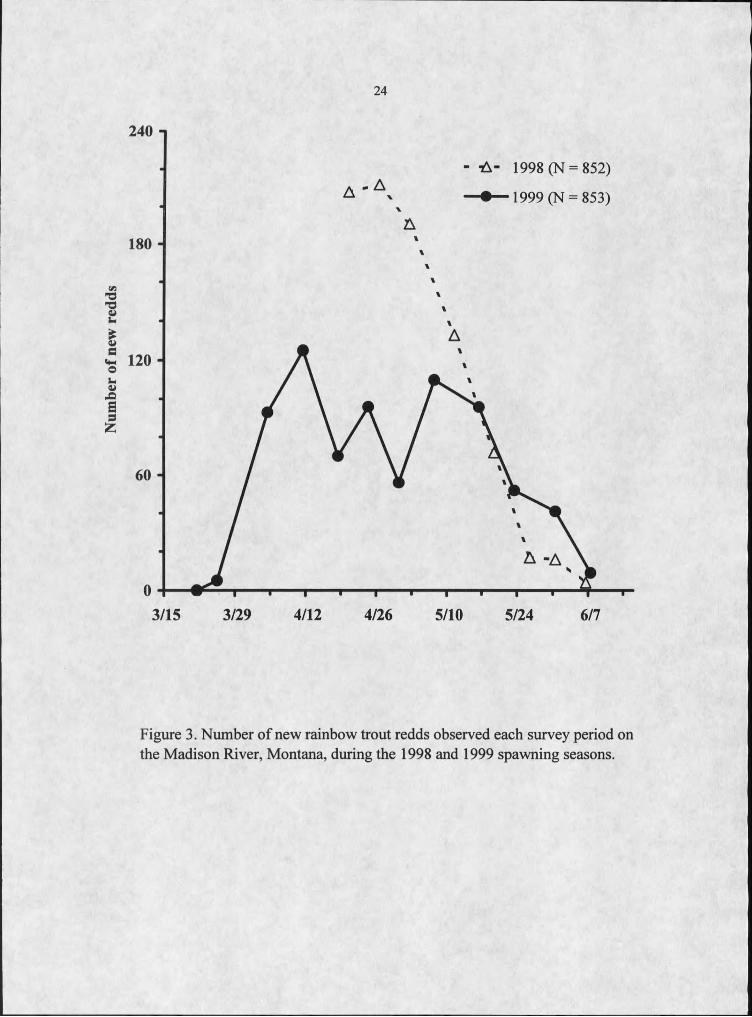
Rainbow trout exhibited extended spawning periods (about 2 months) in both
1998 and 1999. In 1998, 208 redds were found during the first week of redd surveys,
suggesting spawning had begun before this period (Figure 3). Peak spawning was
estimated to have occurred on April 30, but redds were found as late as June 9. In 1999,
surveys were conducted earlier than in 1998 to better characterize the initiation of
spawning. Spawning was observed from late March to early June, but most spawning
occurred from April through late May when spawning activity noticeably decreased,
similar to the observed pattern in 1998 (Figure 3). Spawning timing was also similar
among the study reaches (Figure 4).
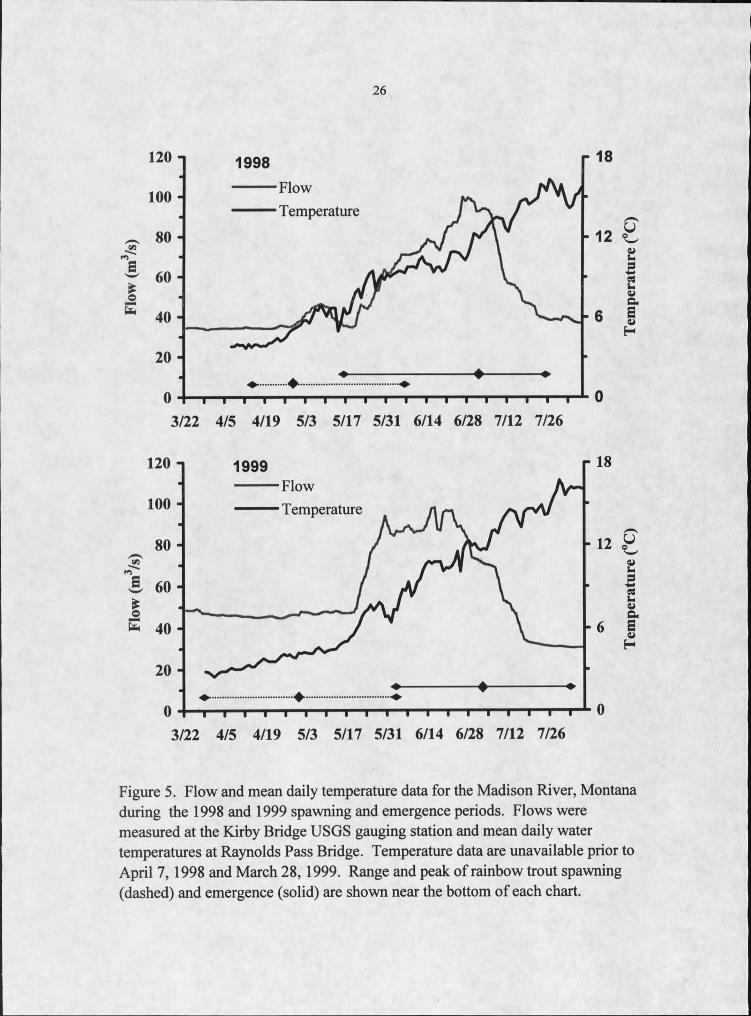
Mean daily water temperature at Raynolds Pass Bridge was similar during peak
spawning (median spawning dates) both years (Figure 5). Mean daily water temperature
during the median spawning dates in 1998 (April 30) and in 1999 (May I) was 4 0C and 5
0C, respectively. Mean daily water temperature ranged from 5 to 10 0C during the
spawning period in 1998 and from 4 to 9 0C in 1999. Most spawning occurred during the
relatively stable flow prior to the spring peak in the hydrograph (Figure 5). Discharge at
the Kirby Bridge gauging station during this period was much higher during 1999 than
1998. In 1998, average discharge during the majority of spawning was 37 m3/s but about
48 m3/s in 1999, a 29% increase.
24
240 -I
- ■A- 1998 (N = 852)
• 1999 (N = 853)
180 -
120 -
Figure 3. Number of new rainbow trout redds observed each survey period on the Madison River, Montana, during the 1998 and 1999 spawning seasons.
25
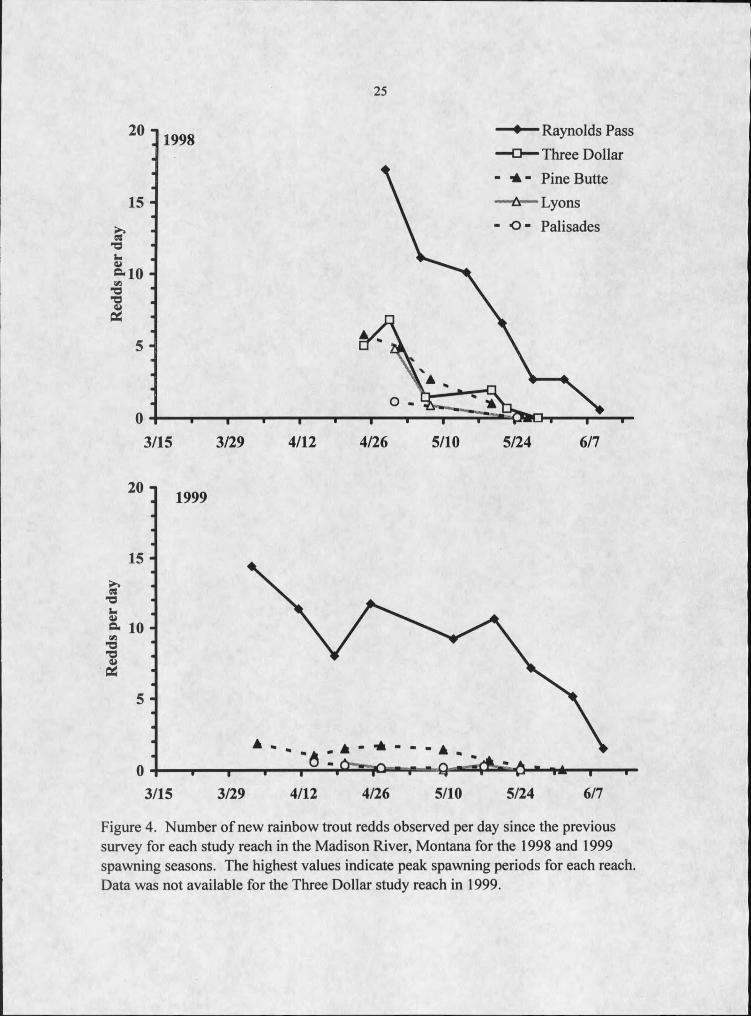
" ♦ Raynolds Pass —O— Three Dollar - Pine Butte — — Lyons - O - Palisades
Figure 4. Number of new rainbow trout redds observed per day since the previous survey for each study reach in the Madison River, Montana for the 1998 and 1999 spawning seasons. The highest values indicate peak spawning periods for each reach. Data was not available for the Three Dollar study reach in 1999.
Temperature
3/22 4/5 4/19 5/3 5/17 5/31 6/14 6/28 7/12 7/26
FlowTemperature
3/22 4/5 4/19 5/3 5/17 5/31 6/14 6/28 7/12 7/26
Figure 5. Flow and mean daily temperature data for the Madison River, Montana during the 1998 and 1999 spawning and emergence periods. Flows were measured at the Kirby Bridge USGS gauging station and mean daily water temperatures at Raynolds Pass Bridge. Temperature data are unavailable prior to April 7,1998 and March 28, 1999. Range and peak of rainbow trout spawning (dashed) and emergence (solid) are shown near the bottom of each chart.
Tem
pera
ture
(0C
) T
empe
ratu
re (0
C)

Table 2. Study reach and rainbow trout spawning attributes for 1998 and 1999 in the Madison River, Montana. The length, total side channel (SC) area, and number of redds observed are reported for each study reach. Redd densities are the mean number of redds observed per hectare of side channel surveyed for each study reach. The estimated total number of redds and proportion oftotal spawning are calculated by multiplying the mean redd density and total SC area available for each study reach.
Study reach .Length(km)
Total SC area (ha) Redds
SC area surveyed
(ha)
Redddensity(#/ha)
Estimated total redds
Proportion of total
spawning (%)
1998 1999 1998 1999 1998 1999 1998 1999 1998 1999
Raynolds Pass 5.3 5.3 495 649 4.7 4.7 106 138 564 734 58 59
Three Dollar 5.3 ■ 3.1 141 77 3.0 1.3 47 61 144 187 15 15
Pine Butte 7.6 6.5 126 89 5.4 2.8 23 32 149 207 15 17
Lyons 12.9 2.4 53 16 2.4 0.5 22 33 54 81 5 6
Palisades 15.1 3.1 38 21 1.7 1.5 22 14 69 44 7 3
Total 46.2 20.4 853 852 17.2 10.8 50 79 980 1253 100 100

28
Most spawning occurred in the upper study reaches, with redd density declining
sharply as distance downstream increased (Table 2; Figure 4). Redd density of the
uppermost study reach, Raynolds Pass, was over 4 times higher than in the three study
reaches furthest downstream (Pine Butte, Lyons, and Palisades) and 1.25 times higher
than in the Three Dollar study reach in both years. Combined, the two uppermost study
reaches, comprising 10.6 km or 23% of the total river km surveyed, were estimated to
contain nearly 75% of the redds throughout the entire study area.
Despite nearly identical total observed redds in each year (853 in 1998 and 852 in
1999), redd density increased in all but the lowest study reach from 1998 to 1999. The
estimated total number of redds increased 28% from 1998 to 1999, but the proportion of
total estimated spawning within each reach was very similar between years. The
Raynolds Pass study reach was estimated to contain 58% (564 of 980) of the total redds
in 1998 and 59% (734 of 1253) of the redds in 1999 (Table 2).
An estimated -95% of redds occurred in side channels. Redd density and side
channel area were not significantly correlated (r2 = 0.48, P = 0.19 in 1998 and r2 = 0.53, P
= 0.17 in 1999; Figure 6) when all study reaches were compared. However, when the
Pine Butte study reach was removed from the regression analysis, the two attributes were
highly positively correlated (r2 = 0.96, P = 0.02 in 1998 and r2= 0.95, P - 0.03 in 1999),
suggesting that redd density in the Pine Butte study reach was lower than expected.

29
150 i
A 1998
• 1999
120 -
MJS
%9 0 -
‘5§"O
-o-oVOC 6 0 -
A
TD
A
30 - LY PB
AAPA
A
0 - I I I I » I ' ' I > * I
0 0 .3 0 .6 0 .9 1.2
Side channel density (ha / km)
Figure 6. Association of rainbow trout redd density and side channel density for each study reach in the Madison River, Montana during 1998 and 1999. Redd density was calculated as the total number of redds observed per ha of side channel area surveyed. Side channel density was calculated as total ha of side channel per km of each study reach. Data for each study reach abbreviated: Raynolds Pass (RP), Three Dollar (TD), Pine Butte (PB), Lyons (LY), and Palisades (PA).

Emergence
Despite a wide variation in spawning timing (2 months), most rainbow trout
emergence occurred within a relatively narrow 3 week window from late June to early
July (Figure I). I collected emergent fry from 12 of 20 (60%) capped redds in 1998 and
31 of 45 (69%) capped redds in 1999. The median emergence date in 1998 was July 2
(range May 19 to July 21) and July 6 (range June 3 to August 3) in 1999. Emergence
peaked during the falling limb of the hydrograph in both 1998 and 1999 (Figure 5).
Water temperature at the time of emergence averaged 11.8 0C (range 7.5 to 13.7 0C) in
1998 and 12.5 0C (range 7.1 to 15.5 0C) in 1999. The mean number of thermal units from
redd formation to emergence was similar between years (P = 0.15; Figure 8) and among
reaches (P = 0.38), averaging 523 (SD = 193) thermal units in 1998 and 614 (SD = 115)
in 1999. In 1999, the water column temperature averaged 0.74 0C (N = 31; SD = 1.3;
Appendix B) higher than the intragravel temperature. The influence of upwelling was
highly variable among individual redds within reaches, and no significant differences
were found among reaches (P = 0.19).
Rearing
The relative abundance of age-0 rainbow trout varied widely among mainstem
study reaches, and was greatest in the two uppermost study reaches where the majority of
redds were located. In 1999, fry density in September and redd density were positively
correlated (r2 = 0.91, P = 0.01). In general, age-0 rainbow trout abundance decreased
with distance downstream from Quake Lake. In both years and throughout the sampling
periods, age-0 rainbow trout abundances in the two upper reaches (Raynolds Pass and

31
Emergence- WD
5/15 6/4 6/24 7/15 8/4 8/24 9/13 10/3 10/23
4/25 5/15 6/4 6/24 7/15 8/4 8/24 9/13 10/3 10/23
Figure 7. Mean whirling disease infection grade in relation to timing of rainbow trout emergence of 12 redds during 1998 and 31 redds during 1999 in the Madison River, Montana. Whirling disease infection grades are means of sentinel cage rainbow trout for the Kirby Bridge time sequence sampling. The dashed line indicates the critical mean whirling disease infection grade of 2.5 (Vincent 2000).
Mea
n gr
ade
Mea
n gr
ade

32
□ 1998 (N= 12)
■ 1999 (N = 31)
Thermal units (degree days)
Figure 8. The relative frequency of thermal units from redd formation to emergence for rainbow trout redds in the Madison River, Montana, during 1998 and 1999.
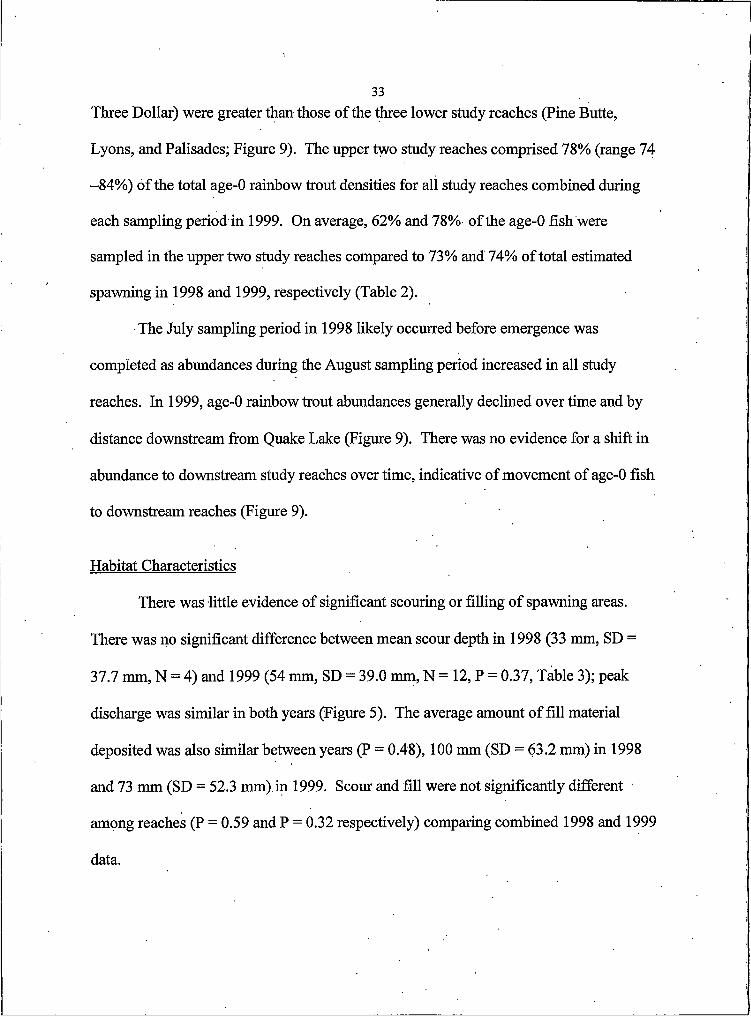
33Three Dollar) were greater than those of the three lower study reaches (Pine Butte,
Lyons, and Palisades; Figure 9). The upper two study reaches comprised 78% (range 74
-84%) of the total age-0 rainbow trout densities for all study reaches combined during
each sampling period in 1999. On average, 62% and 78% of the age-0 fish were
sampled in the upper two study reaches compared to 73% and 74% of total estimated
spawning in 1998 and 1999, respectively (Table 2).
The July sampling period in 1998 likely occurred before emergence was
completed as abundances during the August sampling period increased in all study
reaches. In 1999, age-0 rainbow trout abundances generally declined over time and by
distance downstream from Quake Lake (Figure 9). There was no evidence for a shift in
abundance to downstream study reaches over time, indicative of movement of age-0 fish
to downstream reaches (Figure 9).
Habitat Characteristics
There was little evidence of significant scouring or filling of spawning areas.
There was no significant difference between mean scour depth in 1998 (33 mm, SD =
37.7 mm, N = 4) and 1999 (54 mm, SD = 39.0 mm, N = 12, P = 0.37, Table 3); peak
discharge was similar in both years (Figure 5). The average amount of fill material
deposited was also similar between years (P = 0.48), 100 mm (SD = 63.2 mm) in 1998
and 73 mm (SD = 52.3 mm).in 1999. Scour and fill were not significantly different
among reaches (P = 0.59 and P = 0.32 respectively) comparing combined 1998 and 1999
data.

34
• Raynolds Pass - O - Three Dollar1.A Pine Butte—* ..Lyons- O - Palisades
Figure 9. Abundance of age-0 rainbow trout for each study reach and sampling period during 1998 and 1999 on the Madison River, Montana. Abundances were expressed as number of fish caught per 300 s of electrofishing.

35Table 3. Scour and fill data for each study, reach in the Madison River, Montana. Data for 1998 and 1999 were combined.
Raynolds Pass Three Dollar Pine Butte Lyons PalisadesScour (mm) Mean 50 - 38 75 34
SD 45 - 45 19 34N 6 0 4 3 ' 3
Fill (mm) Mean 73 _ 65 60 . 133SD 57 - 44 60 45N 6 0 4 3 3
Response to changes in main channel discharge varied widely among side
channels. (Table 4). One of the side channels within the Raynolds Pass study reach
showed a decrease in proportion of wetted width to bankfull width by 3% while the other
increased by 16% in response to increased discharge. The two side channels from the
Pine Butte study reach showed similar disparity as one increased 9% while the other
which was dry during the lower flow showed a 41% increase. The remaining side
channel showed no change in wetted width. Despite the dewatered cross section in the
Eagle Nest side channel, the lower discharge did not appear to limit side channel rearing
habitat availability. The proportion of wetted width to bankfull width was > 60% in most
side channels during the lower discharge. Historic (1980-1999) mean daily discharges
between July I and September 30 were lower than 25 m3/s 19% of the time, and higher
than 37 m3/s 22% of the time, thus the two discharges sampled were near the lower and
upper limits of summer discharge (Figure 10).
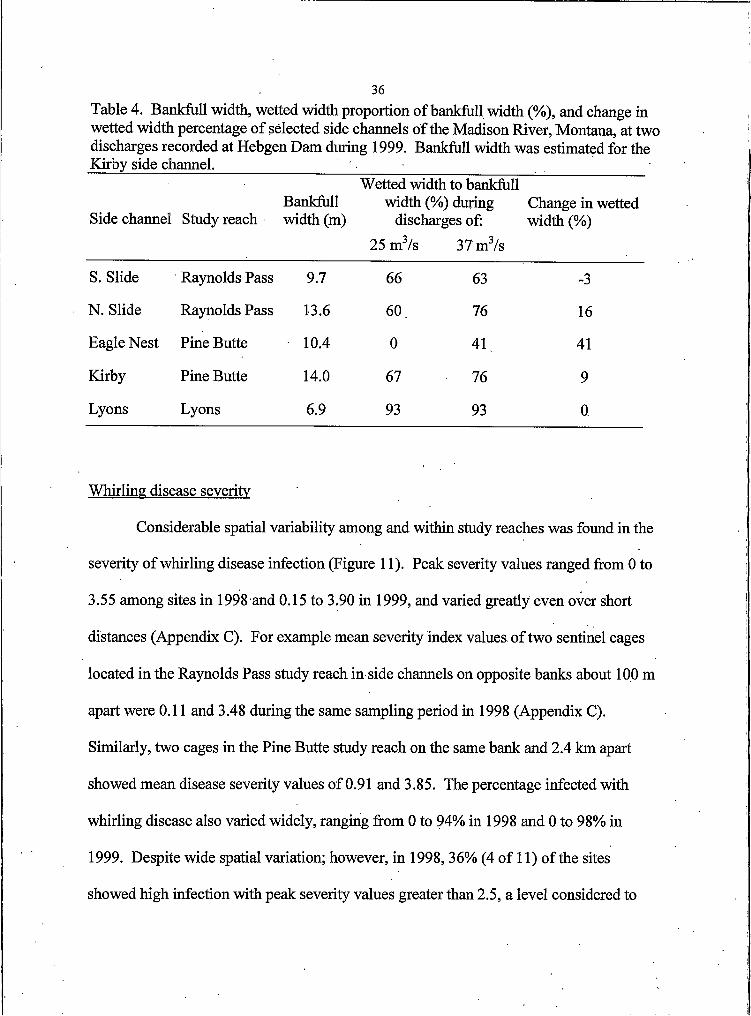
Table 4. Bankfull width, wetted width proportion of bankfull width (%), and change in wetted width percentage of selected side channels of the Madison River, Montana, at two discharges recorded at Hebgen Dam during 1999. Bankfull width was estimated for the Kirby side channel. _____________
36
Side channel Study reachBankfull width (m)
Wetted width to bankfull width (%) during
discharges of:25 m3/s 37 m3/s
Change in wetted width (%)
S. Slide Raynolds Pass 9.7 66 63 -3
N. Slide Raynolds Pass 13.6 60 76 16
Eagle Nest Pine Butte 10.4 0 41 41
Kirby Pine Butte 14.0 67 76 9
Lyons Lyons 6.9 93 93 0
Whirling disease severity
Considerable spatial variability among and within study reaches was found in the
severity of whirling disease infection (Figure 11). Peak severity values ranged from 0 to
3.55 among sites in 1998 and 0.15 to 3.90 in 1999, and varied greatly even over short
distances (Appendix C). For example mean severity index values of two sentinel cages
located in the Raynolds Pass study reach in side channels on opposite banks about 100 m
apart were 0.11 and 3.48 during the same sampling period in 1998 (Appendix C).
Similarly, two cages in the Pine Butte study reach on the same bank and 2.4 km apart
showed mean disease severity values of 0.91 and 3.85. The percentage infected with
whirling disease also varied widely, ranging from 0 to 94% in 1998 and 0 to 98% in
1999. Despite wide spatial variation; however, in 1998, 36% (4 of 11) of the sites
showed high infection with peak severity values greater than 2.5, a level considered to
37
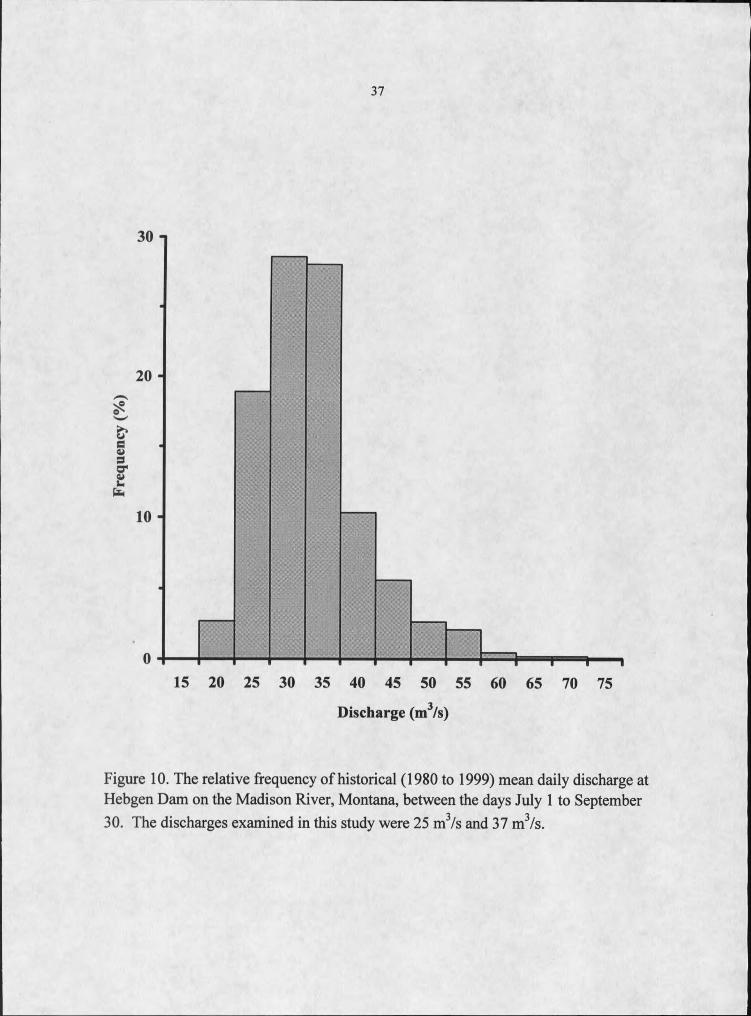
Discharge (m3/s)
Figure 10. The relative frequency of historical (1980 to 1999) mean daily discharge at Hebgen Dam on the Madison River, Montana, between the days July I to September 30. The discharges examined in this study were 25 m3/s and 37 m3/s.

38
ec-O-O
v£aSZ
2 4 6 8 10 12 14 16 18 20 22 24 26 28 30 32 34 36
4
3
2
I
0
1a2
2 4 6 8 10 12 14 16 18 20 22 24 26 28 30 32 34 36Distance below Quake Lake (km)
Figure 11. Mean whirling disease infection grade from sentinel cages (diamonds) and total redds observed in 2 km sections (bars) displayed as distance downstream from Quake Lake outlet in the Madison River, Montana. The whirling disease data are based on the July 8 to 18,1998 and June 24 to July 5,1999 sampling periods which best represent the timing of peak emergence. The dashed line indicates the critical mean whirling disease infection grade of 2.5 (Vincent 2000).
Mea
n gr
ade
39result in significant levels of mortality in wild salmonid populations (Vincent 2000). In
1999, 72% (13 of 18) of the sites exhibited peak severity values of 2.5 or greater. In
general, sites which showed the highest disease severity were located in the lower study
reaches, but upper study reaches also had localized sites of high infection (Figure 11).
No data on infection risk was available from a 9.3 km section of river including the Three
Dollar study reach. Whirling disease severity was very low in tributaries, averaging < I
in Squaw Creek and West Fork Madison River. No infection was recorded in the section
of river between Hebgen Dam and Quake Lake, where one radiotagged rainbow trout
spawned.
Considerable temporal variation in whirling disease severity also was observed
(Figure I). In 1998 at the time-sequence site at Kirby Bridge, severity ranged between
0.19 and 3.55 from May 15 to October 18 with peak severity occurring during the May
25 to June 4 sampling period, about 5 weeks prior to peak emergence. Infection severity
indices were > 2.5 for four consecutive IOd sampling periods from May 25 to June 24,
1998. The lowest severity occurred during the September 16 to 26 sampling period
(Figure 7). In 1999, the highest disease severity occurred during the June 24 to July 5
sampling period, which was coincident with the peak rainbow trout emergence period
(Figure 7), but about I month later than the peak infection period in 1998.
Discussion
The purpose of this study was to determine how rainbow trout spawning and
rearing timing and location related to the degree of exposure and hence potential
population response to whirling disease infection. Spawning and rearing life histories
were the focus as they likely have the greatest influence on the infection risk of the
vulnerable young fish.
Redd surveys and radio telemetry results indicated that rainbow trout migrated
long distances (up to 55 km) to spawn primarily in a relatively small portion of the upper
Madison River. The majority (81%, 17 of 21) of radiotagged rainbow trout migrated
upstream and spawned in side channels of the mainstem river. Similarly, nearly 75% of
observed redds were found in the upper 11 km of this 46 km section of river. In contrast,
only four (19%) radiotagged fish spawned in tributaries, migrating up to 65 km. After
spawning, fish from both groups returned to near their original prespawning location.
Similar post spawning site fidelity has been observed for bull trout in the Blackfoot
River, Montana (Swanberg 1996) and for cutthroat trout in the South Fork of the Shake
River, Idaho (Henderson 1999).
Salmonids inhabiting large rivers typically exhibit a fluvial-adfluvial life history,
migrating to small tributaries to spawn (Northcote 1997). In contrast, I found the
predominant strategy of fluvial-adfluvial Madison River rainbow trout was mainstem
spawning. Mainstem and tributary spawning ̂cutthroat trout also were found within the
North Ram River, Alberta (Brown and Mackay 1995). In that study, 56% of the
radiotagged trout spawned in the mainstem, and the rest spawned in tributaries.
Similarly, 69% (33 of 48) radiotagged rainbow trout, cutthroat trout, and rainbow x
cutthroat hybrid trout spawned in the mainstem of the South Fork Snake River
(Henderson 1999).
Within mainstem rivers, side channels are commonly used for spawning. In this
study, nearly all (estimated > 95%) mainstem spawning occurred in side channels.
Similarly, 85% (28 of 33) mainstem spawning fish used side channels in the South Fork
Snake River (Henderson 1999). Filer et al. (1992) reported 55% of mainstem sockeye
salmon O. nerka spawning occurred in side channels in the Taku River, Alaska.
Rainbow trout in the San Juan River, New Mexico were reported to use side channel
habitat in response to increased spring flow (Gido et al. 2000). Refuge from increased
velocity and availability of spawning habitat were postulated as explanations for use of
side channels. Side channels in the Madison River received little scour or fill suggesting
suitable conditions for spawning. The mean scour measure for both years combined was
< 5 cm, while DeVries (1997) reported rainbow trout egg pocket depths of 15 and 20 cm.
Because of lesser discharge compared to the main channel, side channels are typically
areas of deposit for spawning sized substrates, which are often limited downstream from
a reservoir (Allan 1995).
In contrast to the concentration of spawning locations, the duration of the
spawning period for mainstem spawners was protracted. Both redd surveys and
radiotelemetry data indicated that mainstem spawning occurred over an 8 week period
from April to May. The apparent peak in 1998 redds (Figure 3) is probably misleading
and more likely reflects the late start to redd surveys rather than actual spawning timing.
The large number of redds found during the initial survey likely represents redds formed
from late March through mid April as suggested by the 1999 data. The duration of
mainstem spawning was longer than most reported for spring spawning salmonids. In
general, duration of the spawning season extends from I to 5 weeks in unregulated rivers
(Brown and Mackay 1995; Magee et al. 1996; Knapp et al. 1998). Regulated rivers such
■42as the Madison River may allow more protracted period of spawning because of greater
flow and water temperature stability compared to unregulated tributaries.
Duration and timing of spawning also differed between mainstem and tributary
spawners. Tributary spawning occurred over a two week period in late May, nearly a
month later than the mainstem spawning. It should be noted, however, that the sample
size .of tributary spawning fish in this study was very small (N = 4), which limited the
ability to fully assess the extent of the spawning period. Similar differences were found
with cutthroat trout in the South Fork Snake River, Idaho as tributary spawners spawned
an average of 18 d later than mainstem spawning fish (Henderson 1999). In contrast,
Brown and Mackay (1995) noted no difference between timing of mainstem and tributary
spawning cutthroat trout in the North Ram River, Alberta.
Despite the protracted period of the mainstem spawning, most age-0 rainbow trout
in the mainstem emerged during a 3 weeks in late June and early July. The average
number of thermal units from redd formation to emergence was 589 for redds from both
years. The number of thermal units was about 25% lower than that reported for hatchery
steelhead trout (791; Chandler and Bjomn 1988). Knight (1963) reported a duration of
23 d to hatching and 39 d to “voracious free feeding” at a constant temperature of 12.2 0C
(476 thermal units) for rainbow trout in standard hatchery troughs. Differences in the
thermal units of incubation and rate of development likely reflect differences in
temperatures during incubation (Embody 1934; Kwain 1975; Piper et al. 1982). It is well
documented that stream temperatures often differ from redd substrate temperature
(Acomley 1999). In this study, the difference in temperature was highly variable among
individual redds (Appendix B). This temperature difference combined with wide

43variation in spawning timing may have interacted to result in the observed convergence
of emergence timing. Temperature of individual redds should be monitored to provide an
accurate measure of thermal units to emergence.
As a consequence of rainbow trout spawning location, age-0 fish were initially
concentrated in the side channels of the upper study reaches. Age-O trout abundance
decreased over time in all study reaches. The decline in abundance could be due to
mortality (Knight et al. 1999) or a shift into deeper, swifter water as fish grew (Chandler
and Bjomn 1988; Baltz et al. 1991). Though age-0 trout are known to undergo long
distance movements during their first summer after emergence (Rosenau 1991; Hayes
1995; Knight et al. 1999), I found no evidence of large scale downstream movement.
Age-O rainbow trout densities were positively correlated with redd densities in September
suggesting a lack of distribution shifts among study reaches during the vulnerable period
of age-0 rainbow trout. Similar correlation between age-0 trout and spawning areas have
been reported for brown trout (Beard and Carline 1991; Mesick 1995), golden trout 0. m.
aguabonita (Knapp et al. 1998), cutthroat trout (Bozek and Rahel 1991; Magee et al.
1996), and steelhead (House and Boehne 1985). These studies suggest that trout may not
disperse widely from natal areas and that proximity of spawning habitat appears to be a
primary determinant influencing age-0 trout distributions.
The importance of side channels as rearing habitat for age-0 trout has been
reported in previous studies (Berg 1981; House and Boehne 1985). Dewatering of side
channels would be deleterious to age-0 fish because of the resulting loss of rearing
habitat. I found that only one side channel monitored was completely dewatered at the
lower flow level (25 m3/s). In comparison to historic (1980 to 1999) mean daily flows .

during the summer rearing period (July I to September 30), mean daily flows less 25 m3/s
were experienced only 19% of the time. This indicates side channel dewatering likely
occurs relatively infrequently. The influence of changing flows had diverse effects on
side channel wetted width, and further study is needed to more completely describe the
effects of flow on side channel fearing habitat availability, especially during winter low
flows.
Unlike spawning and rearing distribution, whirling disease infection risk was
highly spatially variable throughout the mainstem. Areas with high whirling disease
infection severity were interspersed with areas of low whirling disease infection severity
among and within study reaches, thus providing high variation in infection risk. For
example, two side channels directly across from one another differed greatly in whirling
disease severity grade (0.11 and 3.48). Such high variation of whirling disease infection
risk throughout the fiver was greater than other river systems where similar data are
available. For example, in Little Prickly Pear Creek, Montana, all eight sites sampled
within a 30 km section of stream consistently exceed the critical whirling disease severity
grade (2.5) during peak severity periods (Vincent 2000). In addition, sampling of upper
Madison River tributaries, though limited, indicated that tributaries have low incidence of
infection. Such variability of infection risk in the Madison River may result from
variability in spore load (Zendt and Bergersen 2000) or availability of suitable habitat for
T. tubifex, the alternate host of the parasite (Hedrick et al. 1999). Such high variability in
disease severity within river systems has not been well documented, but could greatly
influence the degree of exposure to whirling disease in trout populations.
44

Considerable temporal variation in whirling disease infection risk was also
observed. For example, the whirling disease severity grade dropped from 3.48 to 0.02
over a 6 week period in the South Slide Lower site in 1998 (Appendix C). Similar
seasonal variation in the magnitude and duration of peak whirling disease severity within
sites has also been found in other rivers (Vincent 2000). Considerable interannual
variation in infection risk has also been found. In 1998, whirling disease severity peaked
in early June and generally declined through July, whereas in 1999, whirling disease
severity was higher and did not reach peak values until early July. Such interannual
differences in infection risk may be related to flow or thermal regime differences between
the two years or recruitment and turnover in the T. tubifex population (Zendt and
Bergersen 2000). Water temperature regimes were similar between the two sampling
years; however, differences in the flow regime were apparent. In 1999, the magnitude of
peak flow was similar to that in 1998, but base flow was nearly 25% greater and peak
discharge was earlier and more sustained (Figure 5). Zendt and Bergersen (2000) suggest
flushing flows likely affect T. tubifex densities, hence the rate of increase from base to
peak discharge may influence whirling disease severity indirectly. Vincent (2000)
hypothesized that dilution of the waterborne infective stage of the parasite may be a
possible mechanism for reduced whirling disease severity at higher flows.
High spatial and temporal variation in infection severity suggests that future
whirling disease related investigations should consider seasonal changes in discharge,
temperature, and T. tubifex population dynamics as well as the spatial scale most
appropriate for a particular river system. In the Madison River, an ongoing companion
study by R. Krueger and B. Kerans (Montana State University, Bozeman) is investigating
45

the spatial distribution of T. tubifex and potential spore loading in relation to infection
risk. The spatial scale used in my study, although appropriate for determining the
spawning and rearing distribution, may have been too broad for effective investigation of
whirling disease infection risk given the high spatial variation in infection risk observed
at even relatively small scales. Future investigations also need to incorporate time
sequence studies similar to those used in this study to determine the magnitude and
duration of peak whirling disease infection risk. Also, whirling disease severity should
be monitored at times that are biologically significant. Most effort should be expended to
determine infection risk at times when age-0 fish are vulnerable to the disease. For
example, studies of whirling disease severity during March or October may not
accurately represent conditions for fish whose vulnerable period occurs from June to
August. Thus, the temporal and spatial scales for whirling disease investigation need to
be appropriate for the. river system and life history traits of the fish of concern.
Spawning location, as it relates to whirling disease infection risk, is important
because it directly influences the initial location of rainbow trout fry during their
vulnerable period. Consequently, the variability in life history strategies would likely
have equally diverse implications on vulnerability to whirling disease within a river
system. On the broadest scale, high levels of spawning and whirling disease severity
were observed in the mainstem while low levels of each were observed in tributaries
(especially in the West Fork Madison River). Several differences in whirling disease
infection risk exist between mainstem and tributary spawned fish. Most tributary
spawning occurred in late May, nearly a month later than mainstem spawning. This
could have important ramifications depending on when age-0 fish from tributaries

47emerge and subsequently enter the mainstem. Although little spawning data and no
emergence and rearing data were collected for tributary spawned fish, it is likely that
since spawning occurred later in tributaries, emergence in tributaries would also occur
later than in the mainstem (Chandler and Bjomn 1988). Tributary spawned rainbow trout
fry in the Madison River system should experience low exposure to whirling disease and
may have higher survival rates for two reasons. First, the whirling disease severity in
West Fork Madison River is very low (Vincent 2000), allowing fish to rear with minimal
exposure to whirling disease. Second, since the onset of whirling disease within the
Madison River, competition and predation have been reduced in the mainstem due to
decreased numbers of juvenile and adult trout. Prior to the presence of whirling disease,
tributary reared fish were likely selected against due to later emergence, resulting in
competition with large numbers of larger mainstem cohorts (Hayes 1995) and increased
predation by large numbers of mainstem adults. Analogous situations exist in spawning
tributaries to New Zealand lakes where fry emigrate from inlet tributaries at differing
periods in their lives (Rosenau 1991, Hayes 1995). Some fry migrate immediately after
emergence from the tributaries to the lake, and others rear in the tributary stream until a
minimum size is reached and then migrate to the lake. Fish migrating to the lake
immediately suffer high mortality rates due to predation and from competition with other
species in the lake that are more efficient plankton feeders. Similar selection may take
place in the Madison River with the presence of whirling disease in the mainstem. For
instance, fish migrating from the tributaries to the mainstem immediately after emergence
would be exposed to whirling disease during their vulnerable period, whereas fish rearing
in tributaries until their vulnerable period has passed would avoid exposure to the disease.

48Spawning habitat in Madison River tributaries is thought to be limited, although it has not
been quantitatively measured in sections of streams accessible to Madison River rainbow
trout (P. Clancey, FWP Ennis, personal communication), and habitat enhancement,
therefore, could enhance recruitment.
Within the mainstem, vulnerability to whirling disease is also variable. Spawning
and rearing are spatially concentrated. If we assume fish home to spawn in natal areas
(Banks 1969; Taylor 1991; Northcote 1997), then spawning concentrations reflect
successful recruitment areas experienced by returning adults from 3 to 5 years prior to
current spawning. Based on this, successful reproduction is limited to the side channels
of the upper two study reaches and localized recruitment to the populations of the lower
three study reaches may be limited due to the high spatial overlap between spawning
areas and high infection risk areas (Figure 11).
I believe whirling disease led to the decline in the Madison River rainbow trout
population by one of two ways. First, if the pre-whirling disease spawning distribution
was similar to the present distribution, the high exposure risk to whirling disease further
downstream would have strongly selected against those age-0 fish dispersing downstream
after emergence. The location of the uppermost source of whirling disease would mark
the downstream limit that vulnerable fish could safely disperse to, thus limiting the
amount of low infection risk rearing habitat. In this scenario, recruitment, to the entire
study area would be limited by the amount of low infection risk rearing habitat available
in the upper reach. The alternative explanation assumes the pre-whirling disease
spawning distribution had similar spawning densities in side channel habitat throughout
the study area and that rainbow trout fry reared close to areas in which they were

49spawned. In this case, the presence of high whirling disease infection severity in the
lower reaches would have caused poor survival and recruitment of rainbow trout
juveniles spawned in this area, thereby resulting in lower than expected spawning and
rearing densities, as observed in the Pine Butte study reach. Which of these two
explanations is correct is unclear because pre-whirling disease spawning distribution is
unknown.
Despite the large decline in rainbow trout populations in the Pine Butte and Lyons
study reaches, the population has stabilized near 25% of its historic abundance (Vincent
1996). Several possible reasons for this exist. First, the spatial overlap of high infection
risk areas over spawning and rearing areas was incomplete and some spawning occurred,
in low infection risk areas, such as in the Raynolds Pass study reach. Similarly, some
fish spawned in the low infection risk tributaries. Finally, at least one fish radiotagged in
each study reach migrated to and spawned in side channels of the upper study reach
implying that at least some downstream dispersal from Raynolds Pass occurs. Thus, the
combination of several sources of limited recruitment could be contributing to the present
population.
Temporal variation in the timing of whirling disease infection severity and
emergence is also likely to play an important role. In this study, there was high overlap
in both the duration and peak of infection and fry emergence in 1999. In 1998, however,
the peak infection period occurred prior to the peak in emergence. The difference in
timing between peak disease severity and peak emergence may have contributed to an
increase in the yearling cohort population estimate in 1999 (Clancey 2000; D. Vincent,
FWP Bozeman, personal communication). Preliminary data shows the 1999 yearling

cohort abundance to be over 5 times greater than the mean post-whirling disease (1991
to1998) yearling abundance.
These results suggest that the relation of life history traits of rainbow trout to
spatial and temporal variation in whirling disease infection risk provides insight useful to
managing whirling disease positive waters. Potential management considerations in
systems with such variability in whirling disease infection risk could take advantage of
areas or periods of low infection risk. Increasing spawning and rearing habitat quality in
areas of low infection risk, or introduction of stocks that differ in timing of key life
history events could boost production within those areas and compensate for severe
population declines.
50

51
References
Acomley, R. M. 1999. Water temperatures within spawning beds in two chalk streams and implications for salmonid egg development. Hydrological Processes 13:439- 446.
Allan, I. D. 1995. Stream ecology: structure and function of running waters. Chapman and Hall, London.
Baldwin, T. J., and six coauthors. 1998. Distribution of Myxobolus cerebralis in salmonid fishes in Montana. Journal of Aquatic Animal Health 10:361-371.
Baltz, D. M., B. Vondracek, L. R. Brown, and P. B. Moyle. 1991. Seasonal changes in microhabitat selection by rainbow trout in a small stream. Transactions of the AmericanFisheries Society 120:166-176.
Banks, J. W. 1969. A review of the literature on the upstream migration of adult salmonids. Journal of Fish Biology 1:85-186.
Beard, T. D., and R. F. Carline. 1991. Influence of spawning and other stream habitat features on spatial variability of wild brown trout. Transactions of the American Fisheries Society 120: 711-722.
Berg, R. K. 1981. Fish populations of the wild and scenic Missouri River, Montana. Montana Fish, Wildlife, and Parks, Helena, MT.
Bozek, M. A., and F. J. Rahel. 1991. Assessing habitat requirements of young Colorado River cutthroat trout by use of macrohabitat and microhabitat analyses. Transactions of the American Fisheries Society 120:571-581.
Brown, R. S., and W. C. Mackay. 1995. Spawning ecology of cutthroat trout{Oncorhynchus clarki) in the Ram River, Alberta. Canadian Journal of Fisheries and Aquatic Sciences 52:983-992.
Chandler, G. L., and T. C. Bjomn. 1988. Abundance, growth, and interactions of juvenile steelhead relative to time of emergence. Transactions of the American Fisheries Society 117:432-443.
Chapman, D. W. 1988. Critical review of variables used to define effects of fines in redds of large salmonids. Transactions of the American Fisheries Society 117:1-21.
Clancey, P. 2000. Madison River / Ennis Reservoir fisheries and Madison River drainage westslope cutthroat trout conservation and restoration program. Montana Fish, Wildlife and Parks, Ennis, MT.
DeVries, P. 1997. Riverine salmonid egg burial depths: review of published data and implications for scour studies. Canadian Journal of Fisheries and Aquatic Sciences 54:1685-1698.
Eller, J. H., B. D. Nelson, and R. F. Bradshaw. 1992. Riverine spawning by sockeye salmon in the Taku River, Alaska and British Columbia. Transactions of the AmericanFisheries Society 121:701-708.
Elle, S. 1998. Comparisons of susceptibility of rainbow and cutthroat trout exposed as sentinel fish to Myxobolus cerebralis in three drainages in Idaho. Pages 81-84 in Proceedings of the Fourth Whirling Disease Symposium, Missoula, MT.
El-Matbouli, M., T. S. McDowell, D. B. Antonio, K. B. Andree, and R. P. Hedrick. 1999. Effect of water temperature on the development, release and survival of the triactinomyxon stage of Myxobolus cerebralis in its oligochaete host.International Journal for Parisitology 29:627-641.
Embody, G. C. 1934. Relation of temperature to the incubation periods of eggs of four species of trout. Transactions of the American Fisheries Society 64:281-289.
FERC (Federal Energy Regulatory Commission). 1997. Draft Environmental Impact Statement Missouri-Madison Hydroelectric Project. FERC Project No. 2188, Washington D.C.
Garrett, J. W., and D. H. Bennett. 1995. Seasonal movements of adult brown trout relative to temperature in a coolwater reservoir. North American Journal of Fisheries Management 15:480-487.
Gido, K. B., R. D. Larson, and L. A. Ahlm. 2000. Stream-channel position of adultrainbow trout downstream of Navajo Reservoir, New Mexico, following changes in reservoir release. North American Journal of Fisheries Management 20:250- 258.
Griffith, J. S., and R. W. Smith. 1993. Use of winter concealment cover by juvenile cutthroat and brown trout in the South Fork of the Snake River, Idaho. North American Journal of Fisheries Management 13:823-830.
Hansen, E. A. 1975. Some effects of groundwater on brown trout redds. Transactions of the American Fisheries Society 104:100-110.

Hart, L. G., and R. C. Summerfelt 1975. Surgical procedures for implanting ultrasonic transmitters into flathead catfish {Pylodictis olivaris). Transactions of the American Fisheries Society 104:56-59.
Hayes, J. W. 1995. Importance of stream versus early lake rearing for rainbow trout fry in Lake Alexandrina, South Island, New Zealand, determined from otolith daily growth patterns. New Zealand Journal of Marine and Freshwater Research 29:409-420.
Healey, M. C., and A. Prince. 1995. Scales of variation in life history tactics of Pacific salmon and the conservation of phenotype and genotype. Pages 176-184 in J. L. Nielsen, editor. Evolution and the Aquatic Ecosystem: Defining Unique Units in Population Conservation. American Fisheries Symposium 17:176-184.
Hedrick, R. P., M. El-Matbouli, M. A. Adkinson, and E. MacConnell, 1998. Whirling disease: re-emergence among wild trout. Immunological Reviews 166:365-376.
Hedrick, R. P., I . S. McDowell, K. Mukkatira, M. P Georgiadis, and E. MacConnell. 1999. Susceptibility of selected inland salmonids to experimentally induced infections with Myxobolus cerebralis, the causative agent of whirling disease. Journal of Aquatic Animal Health 11:330-339.
Heggberget, T. G. 1988. Timing of spawning in Norwegian Atlantic salmon (Salmo salaf). Canadian Journal of Fisheries and Aquatic Sciences 45:845-849.
Henderson, R. 1999. Spawning strategies and hybridization potential of cutthroat,rainbow, and hybrid trout in a large river. Master’s thesis. Utah State University, Logan.
House, R. A., and P. L. Boehne. 1985. Evaluation of instream enhancement structures for salmonid spawning and rearing in a coastal Oregon stream. North American Journal of Fisheries Management 5:283-295.
Knapp, R. A., and V. T. Vredenburg. 1996. Spawning by California golden trout:characteristics of spawning fish, seasonal and daily timing, redd characteristics, and microhabitat preferences. Transactions of the American Fisheries Society 125:519-531.
Knapp, R. A., V. T. Vredenburg, and K. R. Matthews. 1998. Effects of stream channel morphology on golden trout spawning habitat and recruitment. Ecological Applications 8:1104-1117.
Knight, A. E. 1963. The embryonic and larval development of the rainbow trout. Transactions of the American Fisheries Society 92:344-355.

Knight, C. A., R. W. Orme5 and D. A. Beauchamp. 1999. Growth, survival, andmigration patterns of juvenile adfluvial Bonneville cutthroat trout in tributaries of Strawberry Reservoir, Utah. Transactions of the American Fisheries Society 128:553-563.
Kondolf, G. M. 2000. Assessing salmonid spawning gravel quality. Transactions of the American Fisheries Society 129:262-281.
Kwain, W. 1975. Embryonic development, early growth, and meristic variation inrainbow trout (Salmo gairdneri) exposed to combinations of light intensity and temperature. Journal of the Fisheries Research Board of Canada 32:397-402.
Lazim, M. N. and M. A. Learner. 1986. The life-cycle and productivity of Tubifex tubifex (Oligochaeta; Tubificidae) in the Moat-Feeder Stream, Cardiff, South Wales. Holarctic Ecology 9:185-192.
Lazim, M. N. and M. A. Learner. 1987. The influence of sediment composition and leaf litter on the distribution of tubificid worms (Oligochaeta). Oecologia 72:131-136.
Magee, J. P., T. E. McMahon, and R. F. Thurow. 1996. Spatial variation in spawning habitat of cutthroat trout in a sediment-rich stream basin. Transactions of the American Fisheries Society 125:768-779.
Markiw, M. E. 1991. Whirling disease: earliest susceptible age of rainbow trout to the triactimomyxid of Myxobolus cerebralis. Aquaculture 92:1-6.
McMahon, T. E., and nine coauthors. 1999. Life history variation in rainbow trout in relation to whirling disease infection risk. Pages 109-111 in Proceedings of the Fifth Whirling Disease Symposium, Missoula, MT.
Mesick, C. F. 1995. Response of brown trout to streamflow, temperature, and habitat restoration in a degraded stream. Rivers 5:75-95.
Modin, J. 1998. Whirling disease in California: a review of its history, distribution, and impacts, 1965-1997. Journal of Aquatic Animal Health 10:132-142.
Murray, C. B., J. D. McPhail, and M. L. Rosenau. 1989. Reproductive and developmental biology of kokanee from Upper Arrow Lake, British Columbia. Transactions of the American Fisheries Society 118:503-509.
. Nawa, R. K., and C. A. Frissell. 1993. Measuring scour and fill of gravel streambedswith scour chains and sliding-bead monitors. North American Journal of Fisheries Management 13:634-639.
54

Nehring, R. B., K. G. Thompson, and S. Hebein. 1998. Impacts of whirling disease on wild trout populations in Colorado. Transactions of the North American Wildlife and Natural Resources Conference 63:82-94.
Nehring, R. B., and P. G. Walker. 1996. Whirling disease in the wild: the new reality in the intermountain West. Fisheries 21 (6) :28-30.
Niemela, S. L., J. B. Layzer, and J. A. Gore. 1993. An improved radiotelemetry method for determining use of microhabitats by fishes. Rivers 4:30-35.
Northcote, T. G. 1992. Migration and residency in stream salmonids - some ecological considerations and evolutionary consequences. Nordic Journal of Freshwater Research 67:5-17.
Northcote, T. G. 1997. Potamadromy in Salmonidae - living and moving in the fast lane. North American Journal of Fisheries Management 17:1029-1045.
Parrett, C., R. J. Omang, and J. A. Hull. 1983. Mean annual runoff and peak flow estimates based on channel geometry of streams in northeastern and western Montana. United States Geological Survey, Water Resources Investigations Report 83-4046, Helena, MT.
Piper, R. G., and five coauthors. 1982. Fish Hatchery Management. United States Department of the Interior, Washington, D.C.
Quinn, T. P. and M. J. Unwin. 1993. Variation in life history patterns among NewZealand chinook salmon (Oncorhynchus tshawytscha) populations. Canadian Journal of Fisheries and Aquatic Sciences 50:1411-1421.
Ringler, N. H., and J. D. Hall. 1975. Effects of logging on water temperature and dissolved oxygen in spawning beds. Transactions of the American Fisheries Society 104:111-121.
Rosenau, M. L. 1991. Natal-stream rearing in three populations of rainbow trout in Lake Taupo, New Zealand. New Zealand Journal of Marine and Freshwater Research. 25:81-91.
Swanberg, T. 1997. Movements of and habitat use by fluvial bull trout in the Blackfoot River, Montana. Transactions of the American Fisheries Society 126:735-746.
Tabor, R. A., and W. A. Wurtsbaugh. 1991. Predation risk and the importance of cover for juvenile rainbow trout in lentic systems. Transactions of the American Fisheries Society 120:728-738.
Taylor, E. B. 1991. A review of local adaptation in Salmonidae, with particular reference to Pacific and Atlantic salmon. Aquaculture 98:185-207.
56
Thurow, R. F., and J. G. King. 1994. Attributes of Yellowstone cutthroat trout redds in a tributary of the Snake River, Idaho. Transactions of the American Fisheries Society 123:37-50.
Van Deventer, J. S., and W. S. Platts. 1989. Microcomputer software system for generating population statistics from electrofishing data-user’s guide for MicroFish 3.0. U.S. Forest Service General Technical Report INT-254.
Vincent, E. R. 1987. Effects of stocking catchable-size hatchery rainbow trout on two wild trout species in the Madison River and O’Dell Creek, Montana. North American Journal of Fisheries Management 7:91-105.
Vincent, E. R. 1996. Whirling disease and wild trout: the Montana experience. Fisheries 21(6):32-33.
Vincent, E. R. 1997. The susceptibility of five fish species and strains to whirling disease. Pages 73-74 in Proceedings of the Third Whirling Disease Symposium, Logan, UT.
Vincent, E. R. 2000. Whirling Disease Report 1997-98. Montana Fish, Wildlife and Parks Report. Project 3860. Helena, MT.
Vincent, E. R., and P. Byorth. 1999. Chronology of the whirling disease epizootic in the Madison River. Pages 95-98 in Proceedings of the Fifth Whirling Disease Symposium, Missoula, MT.
Webb, J. H., arid H. A. McLay 1996. Variation in the time of spawning of Atlanticsalmon (Salmo solar) and its relationship to temperature in the Aberdeenshire Dee, Scotland. Canadian Journal of Fisheries and Aquatic Sciences 53:2739-2744.
Weisel, G. F. 1966. Young salmonid fishes of western Montana. Proceedings of the Montana Academy of Sciences 26:1-21.
Winter, J. 1996. Advances in underwater biotelemetry, pages 555-590 in B. R. Murphy and D. W. Willis editors. Fisheries techniques, second edition. American Fisheries Society, Bethesda, MD.
Witzel, L. D., and H. R. MacCrimmon. 1983. Redd-site selection by brook trout and brown trout in southwestern Ontario streams. Transactions of the American Fisheries Society 112:760-771.
Zendt, J. S. and E. P. Bergersen. 2000. Distribution and abundance of the aquatic oligochaete host Tubifex tubifex for the salmonid whirling disease parasite

57Myxobolus cerebralis in the Upper Colorado River Basin. North American Journal of Fisheries Management 20:502-512.

58
APPENDICES
APPENDIX A
PHYSICAL CHARACTERISTICS, TAGGING INFORMATION, AND DATES OF SPAWNING RELATED MOVEMENTS OF ALL RADIOTAGGED RAINBOW
TROUT

60
Physical characteristics, tagging information, and dates of spawning related movements of all radiotagged rainbow trout in the Madison River, Montana during 1998 and 1999. Abbreviations for spawning status are as follows: mainstem (MS), tributary (TR), pre-spawning mortality (PSM), transmitter malfunction (TM), and unknown (U). Spawning locations are river km downstream from Quake Lake outlet, and a negative value indicates upstream from Quake Lake outlet. Spawning locations in tributaries are abbreviated as follows: Freezeout Creek (PC), Gazelle Creek (GC), Squaw Creek (SC), and West Fork Madison River (WF) with distance (km) upstream from the mouth of the tributary in parentheses._____________________________Totallength Weight (mm) (g)
TaggingDate
Number of relocations
Tagginglocation
(km)Spawning
status
Spawninglocation
(km)
Initialmigration
dateSpawndate
Returndate
399 680 9/27/1998 41 9.7 MS -9.5 5/4 5/23 6/22394 771 9/27/1998 42 2.1 MS 1.6 4/8 ■ 4/11 4/15394 635 9/27/1998 43 5.3 MS 1.6 5/18 6/1 6/10460 916 3/27/1999 16 2.4 MS 2.4 - 3/30 MORT414 807 10/22/1998 44 20.4 MS 2.6 3/2 5/27 6/27450 880 10/22/1998 27 24.0 MS . 2.9 • 3/2 4/20 MORT368 508 10/24/1998 34 49.9 MS 4.2 3/26 5/10 6/7368 544 9/27/1998 43 5.3 MS 5.3 - - -
343 408 9/27/1998 37 8.2 MS 7.9 - - -
389 680 9/27/1998 35 . 9.7 MS 9.0 - - -445 953 10/24/1998 28 49.9 MS 11.7 2/26 4/19 N/A427 780 9/24/1998 • 31 68.1 MS 13.0 3/23 5/28 6/20358 608 10/22/1998 45 20.4 MS 20.4 - - -
366 454 .10/22/1998 .49 29.0 MS 29.1 - - -
348 454 10/24/1998 30 49.9 • MS 45.2 . 2/24 4/4 5/9457 998 10/1/1998 14 79.3 MS 67.3 2/11 3/12 4/22363 558 9/24/1998 25 66.0 MS 72.6 4/19 5/27 6/22356 522 9/27/1998 6 8.2 PSM - - - -389 594 3/27/1999 2 17.4 PSM - - - -406 726 9/27/1998 9 14.5 PSM . - - - - .366 417 10/24/1998 10 48.4 . PSM - - - -429 794 3/21/1999 15 13.7 PSM - - - -
396 644 10/22/1998 23 24.0 PSM - 4/19 - -
371 490 10/22/1998 6 48.4 PSM - - -
409 662 10/1/1998 10 80.9 PSM - - ■ -
432 762 10/1/1998 15 79.3 PSM - - - -
419 699 10/22/1998 8 20.4 TM - - - -
399 594 3/27/1999 28 17.4 TR WF (9.1) 5/18 5/29 MORT432 776 9/27/1998 44 13.0 TR SC (4.2) 5/18 5/31 6/14384 617 9/24/1998 21 68.1 TR FC (3.4) .. 4/30 5/30 6/20406 798 9/24/1998 20 68.1 TR GC (0.5) 5/1 5/21 6/14384 653 9/24/1998 17 66.0 U - 4/10 - 7/1

61
APPENDIX B
THERMAL UNITS FROM REDD FORMATION TO EMERGENCE
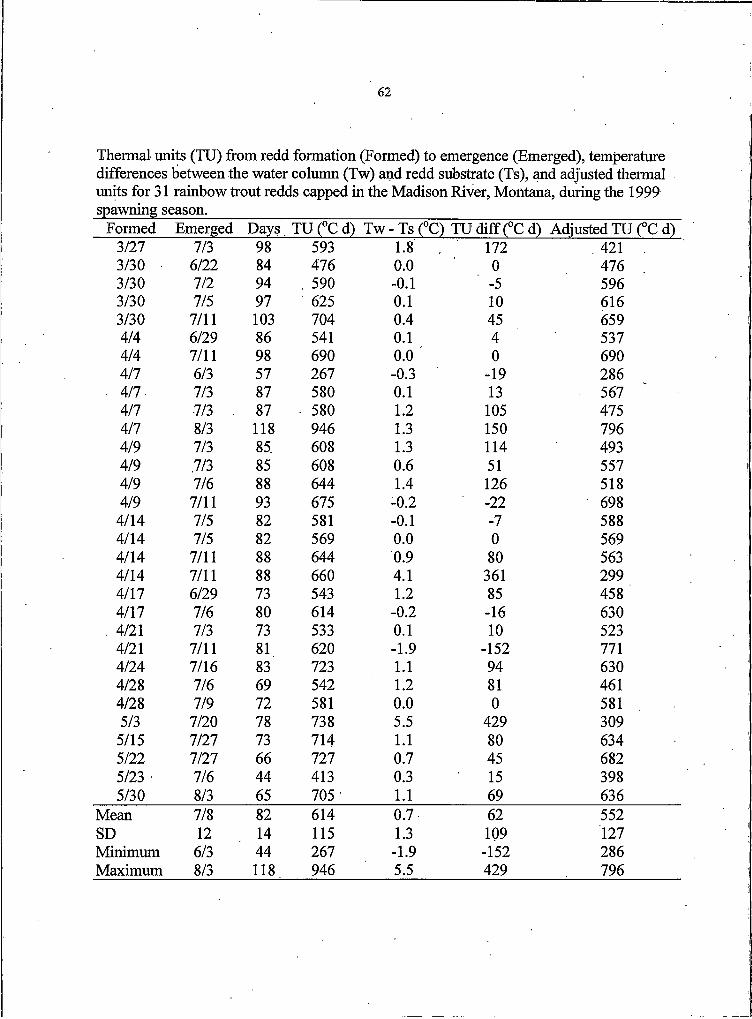
62
Thermal units (TU) from redd formation (Formed) to emergence (Emerged), temperature differences between the water column (Tw) and redd substrate (Ts), and adjusted thermal units for 31 rainbow trout redds capped in the Madison River, Montana, during the 1999 spawning season._________________________________________________________
Formed Emerged Days TU(0Cd) Tw -T s(0C) TUdiff (0C d) Adjusted TU (0C d)3/27 7/3 98 593 1.8 172 . 421 .3/30 ■ 6/22 84 476 0.0 0 4763/30 7/2 94 . 590 -0.1 ' -5 5963/30 7/5 97 625 0.1 10 6163/30 7/11 103 704 0.4 45 6594/4 6/29 86 541 0.1 4 5374/4 7/11 98 690 0.0 0 6904/7 6/3 57 267 -0.3 -19 286
■ 4/7 7/3 87 580 0.1 13 5674/7 7/3 . 87 580 1.2 105 4754/7 8/3 118 946 1.3 150 7964/9 7/3 85 608 1.3 114 4934/9 .7/3 85 608 0.6 51 5574/9 7/6 88 644 1.4 126 5184/9 7/11 93 675 -0.2 -22 6984/14 7/5 82 581 -0.1 -7 5884/14 7/5 82 569 0.0 0 5694/14 7/11 88 644 0.9 80 5634/14 7/11 88 660 4.1 361 2994/17 6/29 73 543 1.2 85 4584/17 7/6 80 614 -0.2 -16 630
. 4/21 7/3 73 533 0.1 10 5234/21 7/11 81 620 -1.9 -152 7714/24 7/16 83 723 LI 94 6304/28 7/6 69 542 1.2 81 4614/28 7/9 72 581 0.0 0 5815/3 7/20 78 738 5.5 429 3095/15 7/27 73 714 1.1 80 6345/22 7/27 66 727 0.7 45 6825/23 7/6 44 413 0.3 15 3985/30 8/3 65 705 1.1 69 636
Mean 7/8 82 614 0.7 62 552SD 12 14 115 1.3 109 127Minimum 6/3 44 267 -1.9 -152 286Maximum 8/3 118 946 5.5 429 796

63
APPENDIX C
WHIRLING DISEASE SEVERITY GRADE AND PERCENT INFECTED FOR SENTINEL CAGES DURING 1998 AND 1999. DATA SUMMARIZED FROM
VINCENT (2000).
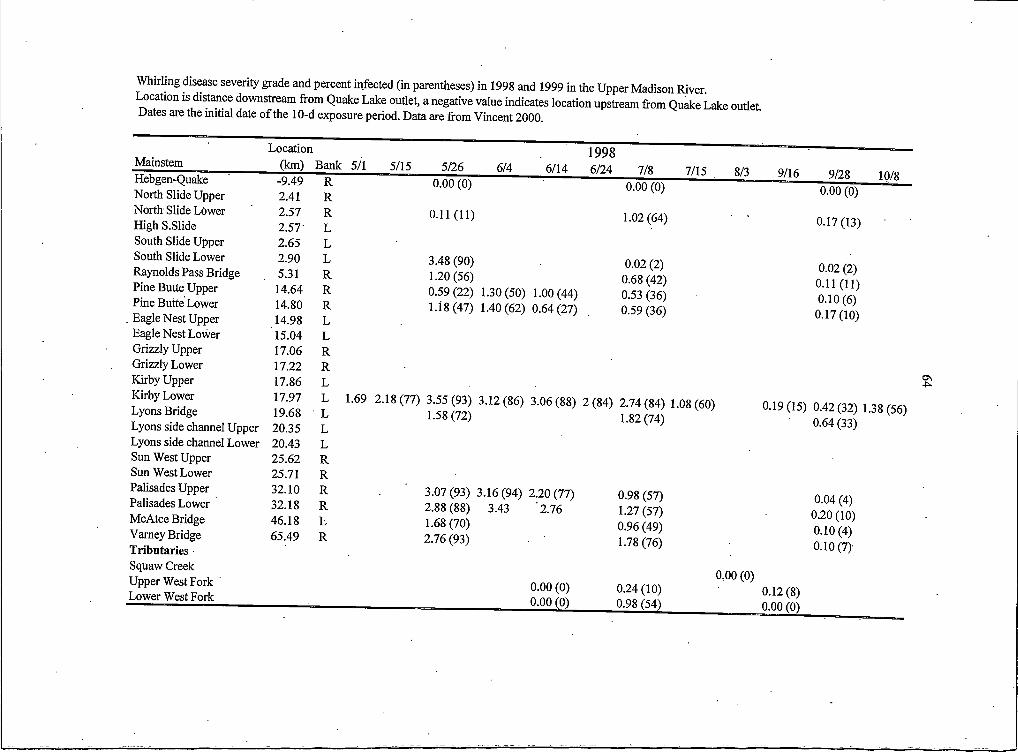
Whirling disease severity grade and percent infected (in parentheses) in 1998 and 1999 in the Upper Madison River.Location is distance downstream from Quake Lake outlet, a negative value indicates location upstream from Quake Lake outlet. Dates are the initial date o f the 10-d exposure period. Data are from Vincent 2000.
MainstemLocation 1998 -------------------------- --
(km) Bank 5/1 5/15 5/26 6/4 6/14 6/24 7/8 7/15 8/3 9/16 Q / 9 R i n / QHebgen-Quake North Slide Upper
-9.492.41
RR
0.00 (0) 0.00 (0) 0.00 (0)
North Slide Lower High S.Slide
2.572.57
RL
0.11(11) 1.02 (64) ' ' 0.17(13)
South Slide Upper 2.65 LSouth Slide Lower Raynolds Pass Bridge Pine Butte Upper Pine Butte Lower
. Eagle Nest Upper
2.90 . 5.31
14.64 14.80 14.98
LRRRL
3.48 (90)1.20 (56)0.59(22) 1.30(50) 1.00(44) 1.18(47) 1.40(62) 0.64(27)
0.02 (2) 0.68 (42) 0.53 (36) 0.59 (36)
0.02 (2) 0.11(11) 0.10(6)
0.17(10)Eagle Nest Lower 15.04 LGrizzly Upper 17.06 RGrizzly Lower 17.22 RKirby Upper 17.86 LKirby Lower Lyons Bridge Lyons side channel Upper
17.9719.6820.35
L 1.69LL
2.18(77) 3.55(93) 3.12(86) 3.06(88) 2(84) 2.74(84) 1.08(60) 1-58(72) 1.82(74)
0.19(15) 0.42(32) 1.38(56) 0.64(33)
Lyons side channel Lower 20.43 LSun West Upper 25.62 RSun West Lower 25.71 RPalisades Upper Palisades Lower McAtee Bridge Vamey BridgeTributaries
32.1032.1846.18 65.49
RRLR
3.07(93) 3.16(94) 2.20(77) 2.88(88) 3.43 2.761.68 (70)2.76 (93)
0.98 (57) 1.27(57) 0.96 (49) 1.78 (76)
0.04 (4) 0.20 (10) 0.10(4) 0.10(7)
Squaw Creek Upper West Fork Lower West Fork
0.00 (0) 0.00 (0)
0.00 (0)0.24(10)0.98 (54)
0.12(8) 0.00 (0)

1999
Mainstem__________ . Location (km) Bank 4/15 4/25 5/5 5/15 5/25 6/4Hebgen-Quake -9.49 RNorth Slide Upper 2.41 R 0.05 (5)North Slide Lower 2.57 R 0.09 (6)High S.Slide 2.57 LSouth Slide Upper 2.65 L 1.95 (77)South Slide Lower 2.90 L 1.63 (80)Raynolds Pass Bridge 5.31 RPine Butte Upper 14.64 R 0.91 (51)Pine Butte Lower . 14.80 R 1.11(55)Eagle Nest Upper 14.98 L 1.88 (78)Eagle Nest Lower 15.04 L 1.53 (82)Grizzly Upper 17.06 R 3.85 (98)Grizzly Lower 17.22 R 3.72 (97)Kirby Upper . 17.86 L . 2.25 (85)Kirby Lower 17.97 L 0.06(4) 0.12(8) 0.32 (22) 1.20 (70) 1.51 (78) 2.69(97)Lyons Bridge 19.68 LLyons side channel Upper 20.35 L 0.70 (55)Lyons side channel Lower 20.43 L 2.93 (93)Sun West Upper 25.62 R 2.71 (92)Sun West Lower 25.71 R 2.92 (98)Palisades Upper 32.10 R 2.37 (88)Palisades Lower 32.18 R 2.59 (91)McAtee Bridge 46.18 LVamey Bridge 65.49 RTributaries Squaw Creek Upper West Fork Lower West Fork
6/8 6/14 6/24 7/50.00 (0)
0.15 (15)1.66 (68)0.00 (0)
2.53 (91)2.50 (83)
0.62 (40)1.14(61)1.18 (68)2.50 (86) 1.80(74)3.66 (96)3.72 (98) 3.10(94)
1.96 3.02 2.181.14(72)
2.63(91)3.90(98)3.30 (95)2.88 (95)2.64 (89) 3.10(94)
1.42(86)1.88 (86)
O SUl

MONTANA STATE UNIVERSITY - BOZEMAN
W