in safe hands - the state of hand protection in australia 2016
TRANSCRIPT

In Safe Hands:The State of Hand Protection in Australia
2016
PLATINUM PARTNER 2016

2 The State of Hand Protection in Australia

2 The State of Hand Protection in Australia The State of Hand Protection in Australia 3
INTRODUCTION
Safety leaders in Australia have been asking for some time – what does best practice really look like?
While zero harm is the typical aspiration, what is often uncertain is how to arrive there. How do others go about it? How can safety leaders measure themselves against their peers, either within similar businesses, or across all industries?
To date, a comprehensive examination of best practice and benchmark metrics of hand protection in Australia has never been conducted.
In partnership with Australia’s leading safety body, the National Safety Council of Australia Foundation, Ansell commissioned independent research into hand injury rates, reporting and management practices in Australia. During September and October 2015, and January 2016, qualitative and quantitative research was conducted by leading independent research company AMR, with over 200 members of the OHS/WHS community.
Method
In September and October 2015, AMR conducted a quantitative survey with 201 managers and executives in safety, procurement and operational roles for mid to large size companies in Australia.
An additional 5 in-depth interviews were also conducted in January 2016 with members of organisations that were nominated as leaders in safety performance in Australia.
The aim of the research was to provide a snapshot of current safety practices and approaches used, as well as attitudes towards safety management and measurement.

4 The State of Hand Protection in Australia
WHO DID WE SPEAK TO?
QLD43%
NSW25%
SA5% ACT
4%VIC16%
NT1%
WA4%
TAS1%
Respondents were from Australia-wide with the majority operating in New South Wales, Queensland and Victoria, and were from a range of industries where safety is a key consideration, including construction, emergency service, manufacturing, mining, healthcare and utilities.
Business Location

4 The State of Hand Protection in Australia The State of Hand Protection in Australia 5
WHO DID WE SPEAK TO?
Respondent Level
Organisation Size - Employees
Industries
Construction/Demolition 14%Government/Emergency Service 13%Manufacturing 13%Mining 9%Health Care Services 7%Utilities and Power 5%Science/Research/Education 4%Transport/Logistics 4%Oil & Gas 3%
Machinery & Equipment 2%Agriculture 2%Entertainment & Hospitality 1%Retail 1%Tradesmen/Contractor 1%Food and Beverage Production 1%Information/Communications/Technology 1%Lifestyle/Leisure Services 1%Other 13%
6 The State of Hand Protection in Australia
TRENDS IN SAFETY PERFORMANCE
Safety Performance
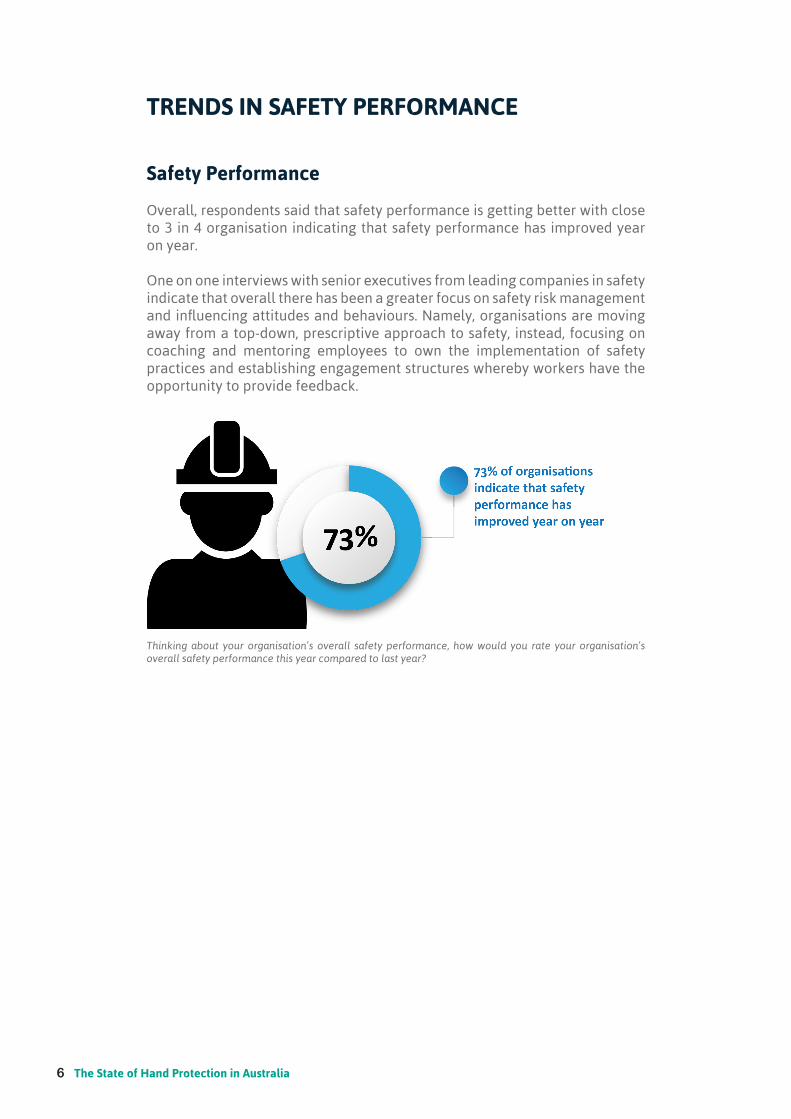
Overall, respondents said that safety performance is getting better with close to 3 in 4 organisation indicating that safety performance has improved year on year.
One on one interviews with senior executives from leading companies in safety indicate that overall there has been a greater focus on safety risk management and influencing attitudes and behaviours. Namely, organisations are moving away from a top-down, prescriptive approach to safety, instead, focusing on coaching and mentoring employees to own the implementation of safety practices and establishing engagement structures whereby workers have the opportunity to provide feedback.
Thinking about your organisation’s overall safety performance, how would you rate your organisation’s overall safety performance this year compared to last year?

6 The State of Hand Protection in Australia The State of Hand Protection in Australia 7
TRENDS IN SAFETY PERFORMANCE
)
Physical and technical components are important but culture is key. For most respondents, initiatives based in cultural change are the most effective, with employee engagement being viewed as the most favoured. However, the views were not universal. Many respondents cited mentoring, an emerging new practice as being less useful.
Interviews with industry leaders in safety reveal that more so than ever organisations are moving away from a top down, prescriptive approach to safety. Ensuring the culture of organisations empower employees to take responsibility for implementation of safety practices and are given the opportunity to provide feedback are key to driving positive safety outcomes.
Interestingly, one of the cornerstone parts of any safety program, employee training, was viewed as being less effective than many cultural initiatives, with 30% of respondents stating it was neutral or ineffective. Additionally, Safe Work Method Statements (SWMS), a prolific practice in industrial settings, was one of the lowest ranked by safety leaders. Almost 40% felt these were neutral to not effective, compared to the more highly favoured Risk Assessments.
Most effective safety initiatives implemented
What have been the most useful or successful safety management practices or initiatives you have implemented?
8 The State of Hand Protection in Australia
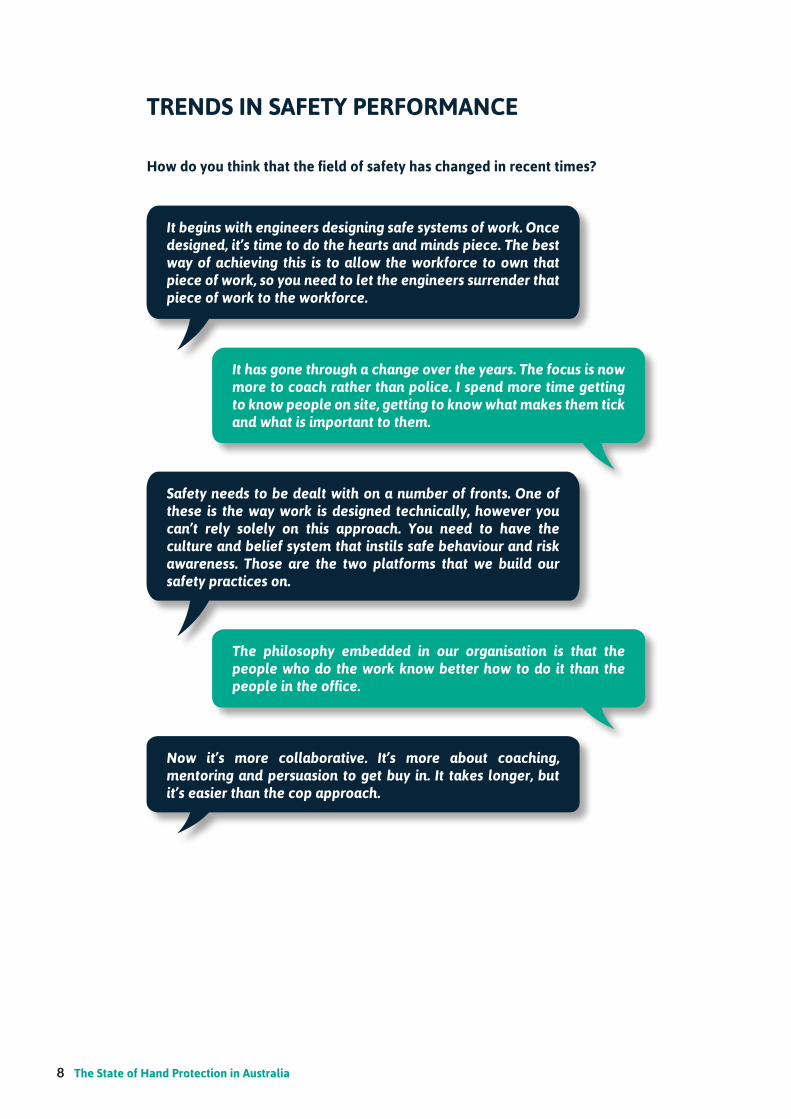
It begins with engineers designing safe systems of work. Once designed, it’s time to do the hearts and minds piece. The best way of achieving this is to allow the workforce to own that piece of work, so you need to let the engineers surrender that piece of work to the workforce.
Safety needs to be dealt with on a number of fronts. One of these is the way work is designed technically, however you can’t rely solely on this approach. You need to have the culture and belief system that instils safe behaviour and risk awareness. Those are the two platforms that we build our safety practices on.
Now it’s more collaborative. It’s more about coaching, mentoring and persuasion to get buy in. It takes longer, but it’s easier than the cop approach.
It has gone through a change over the years. The focus is now more to coach rather than police. I spend more time getting to know people on site, getting to know what makes them tick and what is important to them.
The philosophy embedded in our organisation is that the people who do the work know better how to do it than the people in the office.
TRENDS IN SAFETY PERFORMANCE
How do you think that the field of safety has changed in recent times?

8 The State of Hand Protection in Australia The State of Hand Protection in Australia 9
SAFETY MEASURES
Injury rates and benchmarks
Almost all organisations (94%) surveyed measure injury rates in some way, but the exact metrics vary considerably across organisations.
While both lagging (eg: injuries, fatalities) and leading (eg: near misses, risk assessments) indicators are utilised (an even proportion of organisations reported using leading and/or lagging indicators), the emphasis has traditionally been on lagging indicators as the main reporting metric driven by board or customer requirements.
75% of organisations use lagging indicators with 71% measuring injury frequency as the main indicator.
Beyond reporting the metrics, lagging indicators are cited as limited in their ability to drive changes that improve safety. Instead, lead indicators (especially examination of near misses) are found to be more effective in developing injury prevention strategies. While 73% of organisations also utilise leading indicators, (including workplace inspections, 54%; training/education, 17%; near misses, 10%) to date there is limited benchmark or best practice information for leading indicators despite being viewed as more effective in preventing injury.
Injury metrics vary considerably across organisations.
What have been the most useful or successful safety management practices or initiatives you have implemented?

10 The State of Hand Protection in Australia
Which metrics does your workplace use to measure safety performance?
SAFETY MEASURES
Both lagging and leading indicators are utilised
While lagging indicators are traditionally used for KPIs and reporting, there is an increased focus on also measuring lead indicators as they are more effective in development of safety prevention initiatives and strategies.
Lagging Indicators Leading Indicators
There is a move among industry leaders to increasingly use leading
indicators as they are more effective in developing prevention strategies... but are more difficult
to measure.
Used for reporting but limited effectiveness in developing injury
prevention initiatives.

10 The State of Hand Protection in Australia The State of Hand Protection in Australia 11
SAFETY MEASURES
Industry tends to look at lag indicators as shareholders want a single number of a bottom line and it is hard to do that with lead indicators.
To inform our risk management approach we use potential for major incidents (near misses), studying this data is more effective at managing risk.
My personal opinion is that the stats make a nice chart but that’s all they’re good for. They are a tool but alone they won’t drive change. Behind the numbers are a whole lot of causal factors you may never see.
Lagging data is useful but not in driving initiatives. If you examine potential for major injuries you can manage your critical risk. But it’s difficult to get people to report them.
Which do you view as more important, lagging or leading indicators?

12 The State of Hand Protection in Australia
FOCUS ON HAND INJURIES
Hand injuries are one of the most common injuries among many organisations with 93% of organisations surveyed experiencing injuries to hands. 6 in 10 of these organisations measure hand injury rates specifically. Cuts are the most common injury sustained with close to two third of companies likely to have employees sustain this type of injury.
On average, organisations provide their workforce seven different types of gloves and, while making PPE available to workers is important, a key challenge is ensuring workers wear the right glove for the right job.
A strong safety culture among workers creates working environments of low injury rates and costs which increases morale, delivers high quality products, on time and within budget. PPE to enhance hand safety is recognised as an accepted element supporting that safety culture among workers.
Hand injuries are common among many organisations. Cuts are the most common injury sustained with two thirds of organisations likely to have employees sustain this type of hand injury.
6 in 10 of these organisations measure hand injury rates specifically
3 in 10 calculate costs of hand injuries

12 The State of Hand Protection in Australia The State of Hand Protection in Australia 13
FOCUS ON HAND INJURIES
A key challenge for organisations is ensuring employees are wearing the right glove for the right job. Implementing effective hand safety strategies and providing quality PPE are central to addressing this. In particular, safety leaders that have to manage contractors, as well as their own staff, have their own set of challenges to overcome.
What are the types of hand injuries that are most likely in your organisation?
A bottomless supply of good PPE keeps the morale up with the boys. A lot of them come from smaller contractors and you get what you given once a month kind of thing.
A lot of the time we have to use contractors, so often the cheapest and not the safest glove is used. So we have conversations around the right types of gloves to use… it’s more about changing behaviour.

14 The State of Hand Protection in Australia
Across your organisation, how many different types of gloves do you provide your workers?
FOCUS ON HAND INJURIES
While PPE is recognised as one of the key elements to ensuring the safety of workers and employees, having a culture of workers that are motivated to protect their own personal safety and the safety of those around them is necessary if technical and physical initiatives are to be of maximum effect.
Top 6 most effective strategies to prevent hand injuries
What have been the most useful or successful safety management practices or initiatives you have implemented?

14 The State of Hand Protection in Australia The State of Hand Protection in Australia 15
However, as much as 37% of organisations do not calculate injury costs, while 1 in 10 (11%) only calculate partial costs (ie cost of lost time or cost of treatment, but not including insurance premiums, workers compensation, lost productivity etc).
And despite 93% of businesses experiencing injuries to hands, the vast majority of safety leaders do not have a complete picture of the cost implications of those incidents.
INJURY COSTS
Do you calculate injury costs? Do you calculate the cost of hand injuries specifically?
28% of organisations
calculate hand injury costs
Close to two thirds of organisations calculate injury costs...
52%
11%
Calculate total cost of injury
Only calculate partial costs
37% Calculate no costs
16 The State of Hand Protection in Australia
INJURY COSTS
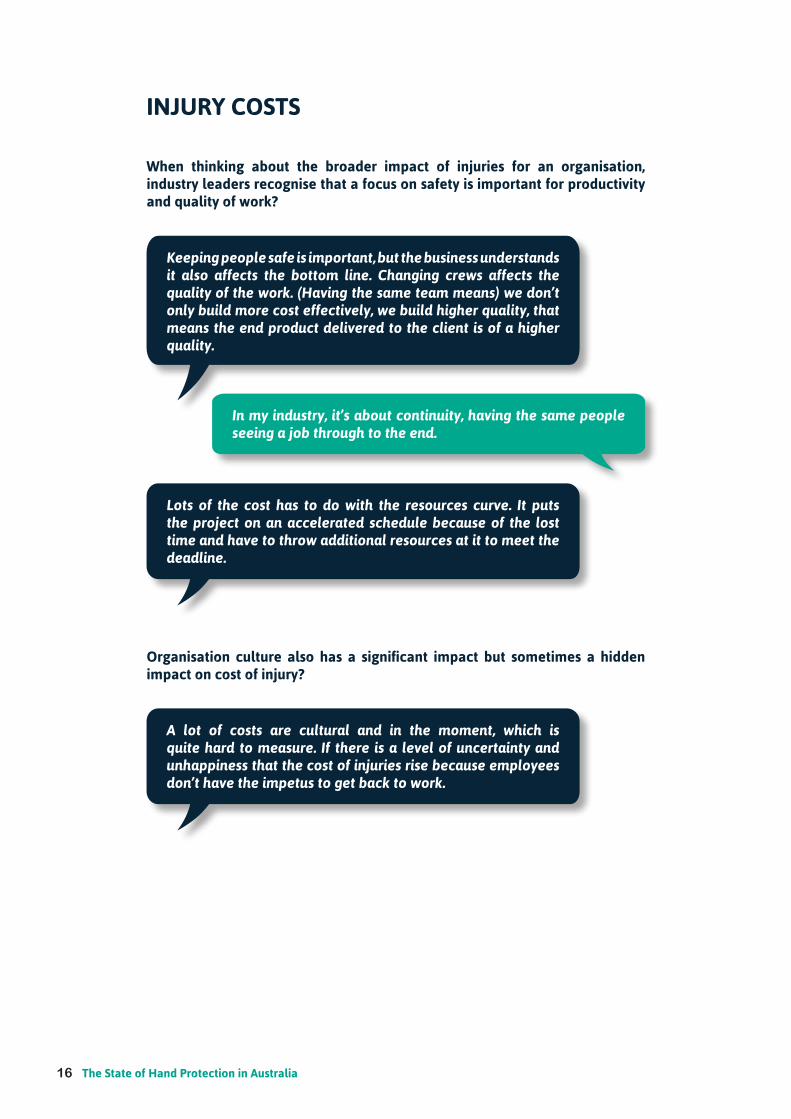
Keeping people safe is important, but the business understands it also affects the bottom line. Changing crews affects the quality of the work. (Having the same team means) we don’t only build more cost effectively, we build higher quality, that means the end product delivered to the client is of a higher quality.
Lots of the cost has to do with the resources curve. It puts the project on an accelerated schedule because of the lost time and have to throw additional resources at it to meet the deadline.
A lot of costs are cultural and in the moment, which is quite hard to measure. If there is a level of uncertainty and unhappiness that the cost of injuries rise because employees don’t have the impetus to get back to work.
In my industry, it’s about continuity, having the same people seeing a job through to the end.
When thinking about the broader impact of injuries for an organisation, industry leaders recognise that a focus on safety is important for productivity and quality of work?
Organisation culture also has a significant impact but sometimes a hidden impact on cost of injury?

16 The State of Hand Protection in Australia The State of Hand Protection in Australia 17
KEY CHALLENGES IN MANAGING SAFETY
Ensuring safe work practices are maintained in the face of time pressures is viewed as the main challenge for OHS and WHS professionals. This is closely followed by changing the culture/thought process in relation to safety practices and behaviour. In addition, managing complacency, encouraging collaboration within the safety sector, education and managing mental health are areas that OHS/WHS professionals will need to focus on in the future.
Main challenges in managing safety
In the future, what do you see as the main challenges facing the industry in terms of safety?

18 The State of Hand Protection in Australia
Mental health is by far the biggest challenge for the future workforce. When people are worried about their financial security they don’t focus on safety. Security of tenure, people living in fear they will lose their jobs at any time, pace of work.
It’s about industry forums and getting the community together to talk about safety issues - that’s the education piece I’d be looking for.
Education is the one thing we have to do well to make sure any of our systems work. It’s all good and well to have rules and processes in place but the individual must see the value in what you are trying to achieve and the value in protecting themselves.
We need to find out more about where these injuries come from. Nuances of investigation would be a really great tool to understand why things happen and once you understand that you can develop the ‘how’s’ to prevent.
We need to get to the point where we are facilitators rather than road blocks. 95% of the time a job gets done really well with no dramas, so what can we learn from that. There have been guys working in their trade longer than I have been alive. What we can learn from them is a potential gold mine.
Managing complacency - reminding workers on site of the potential dangers.
KEY CHALLENGES IN MANAGING SAFETY
What do you see as the drivers for change in the safety industry as you look towards the future?

18 The State of Hand Protection in Australia The State of Hand Protection in Australia 19
VIEW ON THE FUTURE
A paradigm shift.
Injury rates are decreasing, demonstrating the effectiveness of WH&S policy implementation. However the industry benchmark of lag indicators to measure the effectiveness of risk management processes does not paint an adequate picture. A greater emphasis on leading indicators, which measure the potential for injuries, is viewed as a more effective measurement of safety and would also pave the way for a more proactive approach to safety.
Culture is key.
Employee engagement is viewed as a critical ingredient in developing a successful safety culture. There is a shift away from enforcing safety culture to influencing behaviour; education and training initiatives are central to this process as is taking the time to get buy-in from the workforce. Coaching and mentoring, rather than policing, encourages collaboration and helps employees understand their contribution to workplace safety. Importantly, a collaborative approach to safety demonstrates a respect for the people who do the work and helps overcome “old habits”.
A holistic approach to workplace safety.
Health and wellbeing, specifically work-life balance and mental health awareness are identified as new challenges. Robust controls and quality PPE go part of the way to protecting the workforce, however, engaged employees who do the job well, who want to go home safely and are supported by their employer in prioritising their own safety and wellbeing, along with ongoing education and training, is key employee engagement in a holistic approach to workplace safety.

For more information please contact:
NSCA Foundation
Suite 901, Level 9418A Elizabeth Street, Surry Hills NSW 2010
T: 1800 655 510F: (02) 9213 6222
Ansell Limited
Level 3678 Victoria Street, Richmond VIC 3121
T: 1800 513 276F: 1800 803 [email protected]
ppe.ansell.com.au
PLATINUM PARTNER 2016