in-situ and laboratory determination of thermal properties ... · in-situ and laboratory...
TRANSCRIPT

IJRRAS 20 (1) ● July 2014 www.arpapress.com/Volumes/Vol20Issue1/IJRRAS_20_1_02.pdf
14
IN-SITU AND LABORATORY DETERMINATION OF THERMAL
PROPERTIES OF TAR SANDS IN EASTERN DAHOMEY BASIN
SOUTHWESTERN NIGERIA
Oladunjoye M.A.1, Adefehinti A.
2 & Sanuade O.A.
3
1Department of Geology, University of Ibadan, Nigeria, [email protected]
2Department of Geology, University of Ibadan, Nigeria, +2348032988197, [email protected]
3Department of Geology, University of Ibadan, Nigeria, [email protected]
ABSTRACT
In bitumen recovery from tar sand where heat transfer takes place through injection of thermal energy into the tar
sand formation, it is of great importance to estimate the thermal properties of such tar sand. The aims of this
research is to determine the thermal properties of tar sand in the Eastern Dahomey basin, Nigeria with a view to
having more information in planning for thermal recovery of the tar sand.
Twelve locations were established along the tar sand belt in order to measure its thermal properties. The thermal
properties of the tar sand were measured in-situ using KD2 Pro thermal analyzer. In laboratory, thermal properties of
samples from each location were measured and their physical properties that influenced them (such as grain size
distribution, percentage by weight of bitumen content, moisture content, bulk density, porosity and dry density of
the samples) were determined. Thermal conductivity, specific heat and bulk density were used to calculate the
thermal effusivity of the tar sands.
Positive correlations were observed between the values of the field and laboratory measurements of thermal
resistivity, thermal conductivity, thermal diffusivity, thermal effusivity and volumetric specific heat with R-values
0.86, 0.85, 0.81, 0.78 and 0.49 respectively. It was observed that the thermal properties of the tar sand determined
have close similarities with those reported on Athabasca tar sand of Canada. This implies that the thermal recovery
process used in the Athabasca basin could also be employed in the Eastern Dahomey basin, Nigeria.
Keywords: Thermal conductivity, Thermal diffusivity, Volumetric specific heat, Tar sands, Thermal Recovery,
Eastern Dahomey basin.
1. INTRODUCTION
As the world is becoming more and more energy conscious, much research has been done in devising the optimum
means to tap the vast hydrocarbon reserves buried underneath the earth crust. The recovery method for conventional
light oil is relatively simple compared to the methods used for recovering heavy oil, which is highly viscous and
immobile under ambient reservoirs’ conditions. To enhance the mobility of the heavy hydrocarbon, thermal
recovery methods are generally used. Reservoir temperature and pressure conditions may be drastically altered
during the thermal recovery process. Among many variables that characterize the reservoir are the thermal
properties of the hydrocarbon deposit and its adjacent formations (Scott and Seto, 1986). Properties of tar sand such
as thermal conductivity and thermal diffusivity have usually been measured on disturbed core material under
ambient laboratory conditions and the measured values are not representative of field conditions at in-situ thermally
stimulated production facilities. The major factors that control the thermal properties of the tar sand are the types of
mineral grains, the soil structure and its density (Scott and Seto, 1986). As recognized by many investigators, such
as Cervenan et al (1981) the degree of fluid saturation plays significant role in determining the thermal properties of
a material. Therefore, thermal properties of tar sand are of paramount importance in the design of commercial
recovery operation that involves heating of the tar sand as well as in the research activities that preceded field
applications.
Considerable efforts have been made in the past to develop techniques to determine important thermal properties;
namely, conductivity (K), diffusivity (α), and specific heat capacity (c) under field and laboratory conditions. This
led to investigations of the thermal properties of rocks and soils using various methods such as the steady-state
divided-bar technique, Beck, 1976, needle-probe method, Von Herzen and Maxwell, 1959, quick thermal
conductivity meter, Ito et al, 1977, and several other transient, steady-state, and modulated methods, Morabito,
1989.
Recently, Decagon Devices Inc. has developed the KD2-Pro meter logger with two specific sensors: the small dual-
needle sensor SH-1, use to measure the thermal properties which employs the dual needle heat pulse (DNHP)
method, and KS-1 thermal sensor that is a single needle which employs an infinite line heat source (ILHS) method.
In order to obtain reliable data, field and laboratory procedures to determine thermal properties with the KD2-Pro
IJRRAS 20 (1) ● July 2014 Oladunjoye et al. ● Thermal Properties of Tar Sands
15
need to be normalized, according to existing standards and manufacturer’s indications. The present work describes
the step towards the development of a field and laboratory procedure to obtain reliable, accurate, and rapid thermal
properties dataset in tar sand taking into account the current accepted standard.
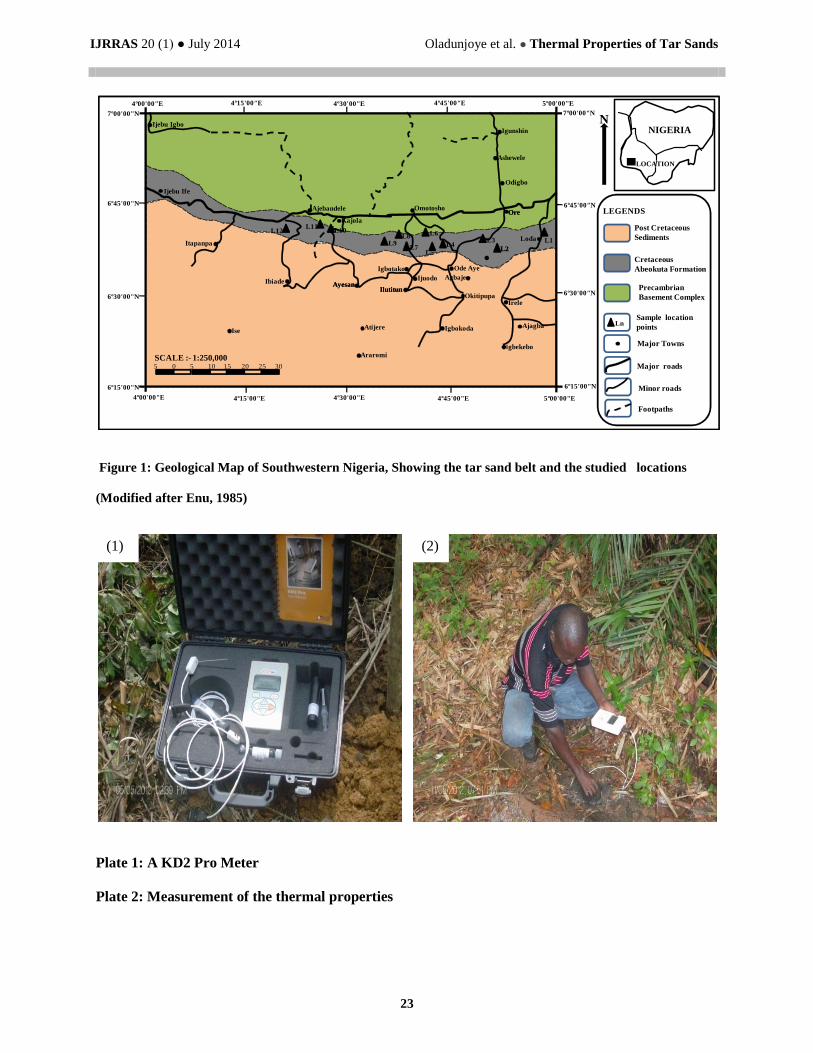
1.1 Study Location and Accessibility
The study area covers part of Ondo and Ogun states, Southwestern Nigeria. It is located within longitudes
04º00'00"E and 05º00'00"E and latitudes 06º15'00"N and 07º00'00". The major roads in the area are the Lagos-Ore-
Benin road that runs from the Western part of the area to the eastern part and the Ondo-Ore-Okitipupa road that runs
from the Northern part of the map and terminates at Igbokoda. The study area from east to west spans across
settlements like Gbeleju Loda, Agbabu, Ilubirin, Yegbata, Legbeda in Igorisha Camp, Lonto in Ladawo camp,
Mobolade, Idiopopo, Idobilayo, Gbegude, Paranta and Iwopin
1.2 Drainage Pattern and Geology of the Study Area
The area is generally well drained such that there are presence of streams and rivers that flow southward. Some
rivers in the area are perennial while some, and the streams are seasonal and got dried up during the dry season. Most of the rivers and their tributaries are flanked by relatively wide flood plains which have varying width and
occurrence of wide valley floors are common and almost all of these are ill-drained and swampy especially during
the rainy season. The tar sand belt of Southwestern Nigeria falls within the Eastern Dahomey (Benin) Basin which straddles the
basement-sediment contact (Figure 1). In geologic terms, the tarbelt straddles the Ilesha Spur or Okitipupa High, a
structural and slight topographic divide. To the west are plains and uplands of the Benin Basin; to the east are the
valley and delta of the Niger River system that is developed above the subsurface Anambra Basin.
The stratigraphic column by Ministry of Solid Minerals Development Nigeria (2004) identifies three divisions of
the Nigeria bitumen deposit; Araromi (Abeokuta formation), Afowo and the Ise formations in that order. The
ages are Maastrichtian, Campanian-Aptian and Barremian- Neocomian respectively in the cretaceous period. Two
main horizons generally referred to in reports as Horizon X and Y which have been encountered within depths of
100m, along latitude 6036'N.
Upper Bituminous Sediments - Horizon X has thickness ranges between 9m and 22m, comprising varying
lithofacies: coarse to medium to fine-grained sandstone with interbeds of sandy clays, (1-2m thick).
Lower Bituminous Sediments Horizon Y has thickness varying from 3m eastwards to about 23m westwards.
2. MATERIALS AND METHODS
The thermal properties of the tar sand was determined using a KD2 Pro (Plate 1) that complies fully with ASTM
D5334-08, IEEE 442 - 1981, and SSSA Standards. It is a portable, hand held field and laboratory thermal properties
analyzer that measures both the solid and fluid media thermal properties using transient heated needle. This
technique applied a heat pulse to the needle, and with time, the response in temperature is monitored during and
after the heat pulse at an adjacent needle or the heated needle.
To determine the thermal diffusivity and specific heat, a small dual-needle sensor (SH-1) was employed (Decagon
Devices Inc.). This kind of sensor uses the method of heat pulse that yield reliable soil thermal diffusivity (α) and
volumetric specific heat capacity (C) which uses non-linear least square procedure for estimation during both
processes. However, thermal admittance/effusivity was calculated as
√ ( ) ( )
√( )
2.1 Field Procedure The first step to develop a procedure to measure the thermal properties of tar sand begins with the location of the
seepages, exposure of the fresh tar sand surface and field sampling design.
2.2 In Situ Measurements
The measurement include the location of the tar sand (as seepages in farmlands, exposures along road cuts, cliff
faces, river sources, and river channels), verification and preparation of the thermal sensor (calibration) using
standard glycerol in order to check whether it was functioning properly (Krishanaiah, 2003) was done. The thermal
sensor to be used was then selected (TR-1 and SH-1). The exposed surface of the tar sand was then scrapped to
established a fresh surface that has not being oxidized. The needle was positioned with respect to the fresh surface

IJRRAS 20 (1) ● July 2014 Oladunjoye et al. ● Thermal Properties of Tar Sands
16
established and then inserted into the tar sand. Thermal properties were then measured by using the appropriate
sensor TR-1and SH-1.
Using KD2 Pro to take measurement, appropriate sensor was chosen and attached to the KD2 Pro meter, then the
meter was turned on. The sensor was properly inserted into the tar sand. After the measurement, the instrument is
allowed to rest for 25 minutes before taking the next reading for TR-1 and 15 minutes for SH-1 for equilibrum
position to be established. Masurements were taken at twelve different locations along the tar sands belt.
2.3 Collection of Samples
Samples were collected for laboratory analyses. Twelve samples were collected at different locations along the tar
belt from east at Loda (location 1) to west at Iwopin (location 12). The samples were taken in polythene bags and
stored in cool and dry place before the necessary tests were carried out on them.
2.4 Analytical Laboratory Procedure The samples were packed into a box of 1cm by 1cm and were allowed to settle so that it will form a
square shape. The box loaded with samples were kept in polythene bag and were stored in a cool and dry
place for two weeks. After two weeks, the samples were removed from the boxes and their thermal
properties were measured following the same procedure as it was done in the field. To characterize the
tar sands of eastern Dahomey Basin, variables such as, grain size distribution, dry density, specific
gravity, percentage by weight of bitumen content, porosity, and moisture content, were determined in the
laboratory.
Mechanical or sieve analysis was used for the grain size analysis after the tar sand has been soaked in
kerosine for twenty-four hours to remove the bitumen content. A pycnometer bottle was used to
determine the specific gravity while the porosity was determined using volumetric flask of known
volume.
3.0 Results And Discussion
3.1 Thermal Properties
3.1.1 Thermal Resistivity
The thermal resistivity of the tar sand in the study area (Table 1) ranges from 63.01- 362.4°C-cm/W with a mean of
153.13 °C-cm/W for field measurement and 81.17 - 296.9°C-cm/W with a mean of 143.32 °C-cm/W for laboratory
measurement. It is clearly shown in Figure 2 that there are variations in the thermal resistivity values measured for
the twelve locations which could be attributed to the difference in physical properties of the tar sand at each
location. The high values in locations 2, 4, 10 and 11 could be attributed to the increase in the percentage by weight
of bitumen saturation as result of high porosity due to decrease in the particle sizes of the sand that housed the
bitumen. The values of the thermal resistivity of the tar sand in the study locations has a close relationship with the
values of thermal resistivity values of tar sand of Athabasca oil sands, Kern River oil sands and Asphalt ridge oil
sand in Canada which were calculated from the values of the thermal conductivity that were measured by Clarke
(1944), and Lindberg et al (1985).
3.1.2 Thermal Conductivity
The thermal conductivity values in the study locations (Table 1) ranges from 0.276 – 1.587W/mK with an average
of 0.983 W/mK for the field measurement while the laboratory measurements ranges in values from 0.337 –
1.252W/mK with an average of 0.861 W/mK. Figure 3 showed the variations in the values of the thermal
conductivity of the tar sand in the study locations. They clearly showed the reverse of the thermal resistivity. The
thermal conductivity of the tar sand of the Eastern Dahomey, Nigeria have close values with those measured on
Athabasca oil sand by Clarke (1944), Kern River oil sand by Somerton et al (1974) and Asphalt oil Ridge by
Lindberg et al (1985). Also, it has a close values with those determined by Cervenan (1981) and Rajeshwar et al
(1982) from Athabasca oil sand.
3.1.3 Thermal Diffusivity
The thermal diffusivity values in the study area (Table 1) ranges from 0.170 – 0.774mm²/s with average of 0.516
mm2/s for the field measurements, while the laboratory values ranged between 0.206 – 0.817mm²/s with average of
0.443mm2/s. It can be observed from Figure 4 that the thermal diffusivity of the study locations varies from one
another. There was significant drop in values of thermal diffusivity at locations 2,4,10 and 11 which could be

IJRRAS 20 (1) ● July 2014 Oladunjoye et al. ● Thermal Properties of Tar Sands
17
attributed to the same reason that caused the decrease in the value of the thermal conductivity at these locations. The
thermal diffusivity value of the tar sand measured in Eastern Dahomey Basin, Nigeria has close agreement with that
of Athabasca oil sand, Canada measured by Scott and Seto (1986).
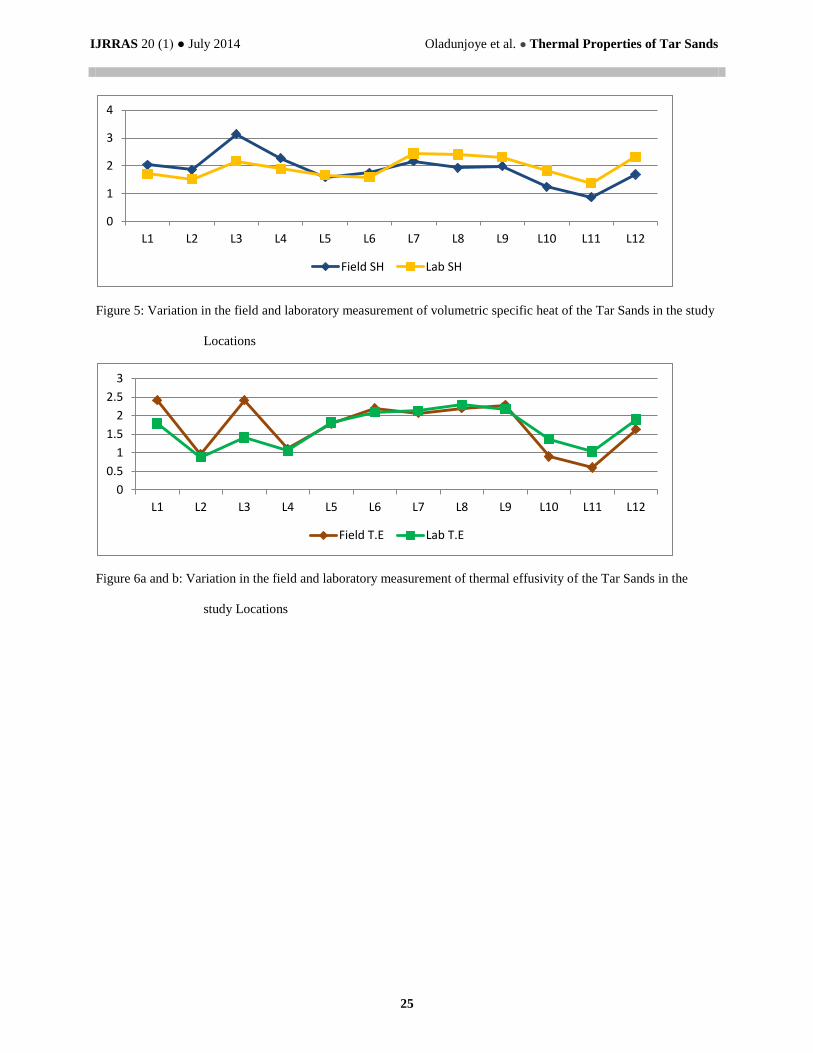
3.1.4 Volumetric Specific Heat
The values of the volumetric specific heat measured at each locations (Table 1) in the field ranges from 0.873 –
3.143mJ/m³K with an average of 1.877mJ/m³K and the measurement in the laboratory have their values ranging
from 1.381 – 2.44mJ/m³K with an average of 1.936mJ/m³K. Since the major constituents of the tar sand in the study
locations are quartz and the tar, the quartz could be said to have influenced the specific heat values obtained. The
specific heat of bitumen ranges from 1.85 – 3.9 mJ/m³K (Lindberg et al, 1985) and that of quartz is 0.170 – 0.190
mJ/m³K which is much lower. This showed that the specific heat (Figure 5) in the study location is being influenced
by the bitumen saturation rather than the quartz constituents. The volumetric specific heat values of the tar sand
measured in Eastern Dahomey Basin, Nigeria had close agreement with that of Athabasca oil sands, Canada
measured by Cervenan et al, (1981) and Scott and Seto (1986).
3.1.5 Thermal Effusivity Thermal admittance of tar sand in the study area for field and laboratory measurements is given in Table 2. Thermal
admittance or effusivity in the study locations for field measuremets ranges from 0.598 – 2.412 Jm-2
K-1
S-½
with a
mean of 1.711 Jm-2
K-1
S-½
while the laboratory measurement ranges from 0.877 – 2.293 Jm-2
K-1
S-½
with a mean of
1.658 Jm-2
K-1
S-½
. Figures 6 displayed the distribution of the thermal effusivity measured in the field and that
measured in the laboratory. The figure showed that there were much variations in the thermal admittance of the tar
sand in the locations studied. Acccording to Oyekan and Kamiyo (2011), materials with high thermal effusivity
cannot hold heat long enough because heat will quickly dissipitate from its surface as soon as surrounding
temperature drops. On the other hand, materials with low thermal effussivity will hold heat much longer. From the
figures, locations 2, 4,10 and 11 have lower thermal admittance compare to other locations and, based on Oyekan
and Kamiyo(2011) findings, they will hold heat much longer than tar sand of other loctions.
3.2 Correlating Field and Laboratory Data
The comparisons and variation in the value of thermal properties for both field and laboratory measurements are
shown in Figures 7a to f, where it can be seen that the values of field thermal resistivity, thermal conductivity,
thermal diffusivity, thermal effusivity, volumetric specific heat and temperature and those measured in the
laboratory have no significant variation from each other. They correlate positively with R-values of 0.68, 0.85, 0.81,
0.78, 0.49 and 0.73 respectively which shows that the values got from the field and the laboratory fit excellently
except the volumetric specific heat that has weak correlation. This showed that the result of the measurement made
is consistent and that the physical properties that impact much on the thermal properties are not being affected much
in moving the sample to the laboratory from the field.
3.3 Variation of Thermal Properties with Physical Properties of Tar Sands
Table 3. showed the results of the determined physical properties of the tar sands in the study locations
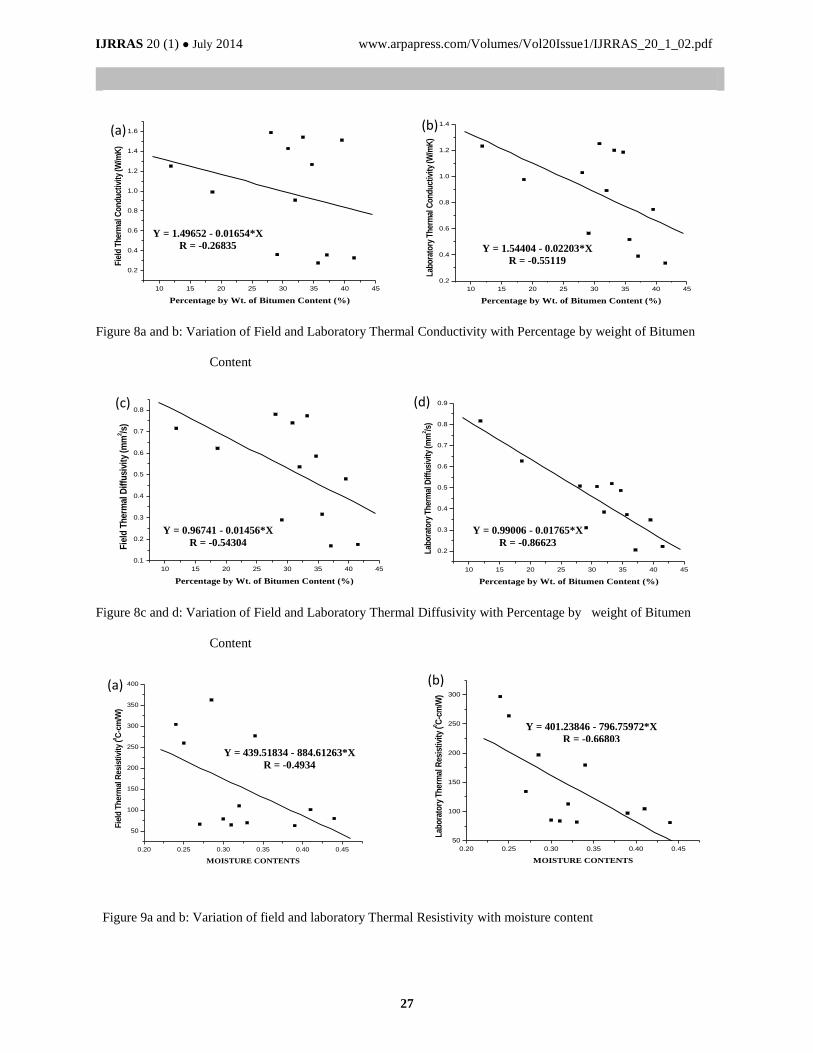
3.3.1 Percentage by Weight of Bitumen Content
The percentage by weight of bitumen content in the study locations ranges from 11.88 to 41.50% with an average of
31.02 %. Figure 8a and b showed negative correlation exists between thermal conductivity and percentage by weight
of bitumen content. This is in agreement with Somerton et al (1974), Cervenan et al, (1981) and Scott and Seto
(1986). Also in Figures 8c and d, there is a negative correlation between thermal diffusivity and percentage by
weight of bitumen content as reported in literatures (Scott and Seto, 1986).
3.3.2 Moisture Content The moisture contents of tar sand in the study locations range from 0.24 to 0.44% with an average of 0.32 %. In
Figures 9a and b, a negative correlation exists between thermal resistivity and moisture content and also in Figures
9c and d; there is positive correlation between moisture content and thermal conductivity and diffusivity. This agrees
with the work of past researchers such as Cervenan et al (1981), Scott and Seto (1986), IEEE (1998) and
Ramakrishnan, (2012).
3.3.3 Dry Density
The dry density in the study area ranges from 1202 to 2201Kg/m3 with a mean of 1629.25Kg/m
3. This result gives
rise to negative correlation between thermal resistivity and specific heat and dry density, so an increase in the dry
IJRRAS 20 (1) ● July 2014 Oladunjoye et al. ● Thermal Properties of Tar Sands
18
density will cause reduction in thermal resistivity value. The general trend as depicted in Figures 10a to d where
positive correlation exist between the dry density and thermal conductivity and thermal diffusivity respectively
which agrees with the work of Somerton et al (1974), Cervenan et al, (1981) and Scott and Seto (1986).
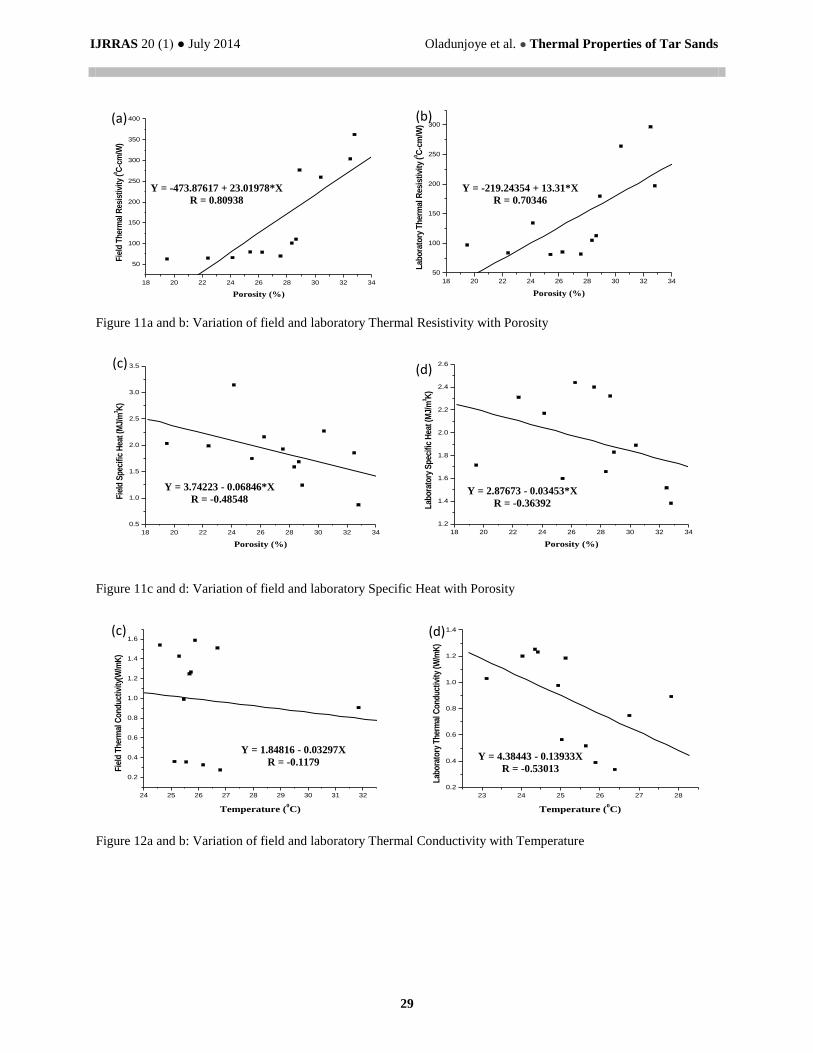
3.3.4 Porosity
The porosity of the tar sand which is shown in Table 2, was observed to affect its thermal properties as shown in
Figures 11a to d. Porosity of the tar sand varies from 19.5% to 32.8% with a mean of 27.2%. Figures 11a and b
showed positive correlation with R-value for the field measurement to be 0.81 and that of laboratory to be 0.70. The
variation of thermal resistivity with porosity was observed to agree with those reported in previous works (Tomar,
1999; Krishnaiah et al, 2004).
Thermal conductivity drops steadily with gradual increase in porosity which is consistent with previous
experimental investigations (Usowicz et al, 1996). In oil bearing formations, thermal conductivity plays important
role as it is used to indicate porosity of the formations (Zierfuss and Van der Vliet, 1956). Also, the negative
correlation between porosity and thermal diffusivity means increase in porosity will give rise to decrease in thermal
diffusivity which agrees with experimental investigation of Somerton et al (1974), Cervenan et al (1981) and Scott
and Seto (1986) on tar sands and Krishnaiah et al (2004) on soil. However, the relationship between porosity and
specific heat did not agree with reports in literatures that an increase in specific heat will lead to increase in porosity
but as observed in Figure 11c and d, it agrees with the work of Oladunjoye and Sanuade (2012b).
3.3.5 Temperature
The temperature in the study locations ranged from 24.59 to 31.840C with an average of 26.23
0C for the field
measurements while it ranged from 23.12 to 27.820C with a mean of 25.29
0C for laboratory measurements. The
variation in the temperature across the studied locations is shown in Figure 12. The thermal resistivity measured in
the laboratory with weak positive correlation (R= 0.44) agrees with observation of IEEE (1998), and Paasschens et
al (2004) but the field measurements with negative correlation (R= -0.03) differ from this. The drop in thermal
conductivity of tar sand in the studied locations with respect to increase in temperature (Figure 12a and b) was in
agreement with the observation of Somerton (1973) on tar sand and Dubow et al (1978) on oil shale. Thermal
diffusivity was found to decrease with increasing temperature with negative correlation value of -0.099 and -0.55 for
field and laboratory measurements respectively. It appears to certain extent, that the higher the bitumen saturation of
a location, the higher the percentage drops in diffusivity value with increasing temperature. The field temperature
has a negative correlation (R=-0.064) while the laboratory measurement gave positive correlation (R=0.102). The
field measurement do not agrees with Hans-Dieter and Rudiger (2003); who stated that specific heat increases with
temperature.
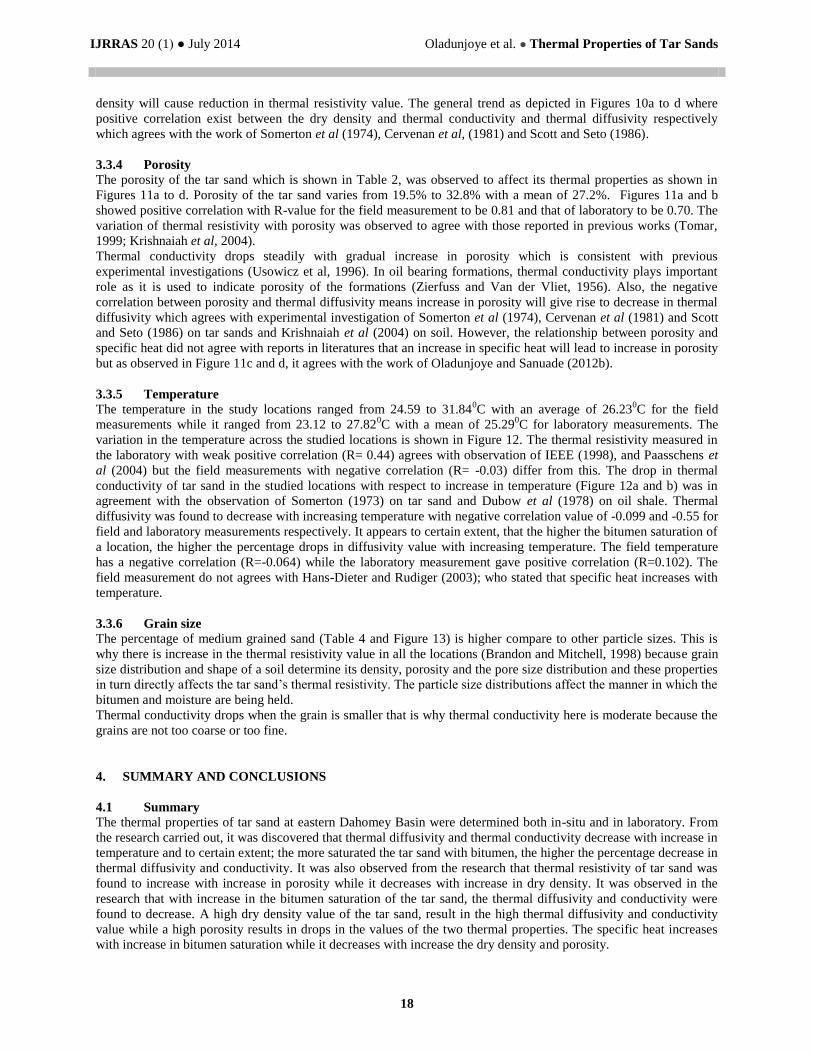
3.3.6 Grain size The percentage of medium grained sand (Table 4 and Figure 13) is higher compare to other particle sizes. This is
why there is increase in the thermal resistivity value in all the locations (Brandon and Mitchell, 1998) because grain
size distribution and shape of a soil determine its density, porosity and the pore size distribution and these properties
in turn directly affects the tar sand’s thermal resistivity. The particle size distributions affect the manner in which the
bitumen and moisture are being held.
Thermal conductivity drops when the grain is smaller that is why thermal conductivity here is moderate because the
grains are not too coarse or too fine.
4. SUMMARY AND CONCLUSIONS
4.1 Summary
The thermal properties of tar sand at eastern Dahomey Basin were determined both in-situ and in laboratory. From
the research carried out, it was discovered that thermal diffusivity and thermal conductivity decrease with increase in
temperature and to certain extent; the more saturated the tar sand with bitumen, the higher the percentage decrease in
thermal diffusivity and conductivity. It was also observed from the research that thermal resistivity of tar sand was
found to increase with increase in porosity while it decreases with increase in dry density. It was observed in the
research that with increase in the bitumen saturation of the tar sand, the thermal diffusivity and conductivity were
found to decrease. A high dry density value of the tar sand, result in the high thermal diffusivity and conductivity
value while a high porosity results in drops in the values of the two thermal properties. The specific heat increases
with increase in bitumen saturation while it decreases with increase the dry density and porosity.
IJRRAS 20 (1) ● July 2014 Oladunjoye et al. ● Thermal Properties of Tar Sands
19
4.2 Conclusions
The most important of the thermal properties in the thermal recovery process of tar sands are the thermal
conductivity and the specific heat because they help in calculating the cost of generating electrical energy that will
produce the quantity of heat needed for the recovery of bitumen from the tar sand. Therefore, the thermal properties
of tar sand are of paramount importance in the design of commercial recovery operation that involves heating of the
tar sand as well as in the research activities that preceded field applications.
It has been observed that the thermal properties of the tar sand in the study locations and the variation with their
physical properties matched well with the results reported in literature except their variation with thermal resistivity.
It can be concluded that, from the thermal properties and the physical properties determined and correlated, the tar
sand in Eastern Dahomey basin; Nigeria has close thermal properties as well as physical properties to that of
Athabasca oil sand in Canada. Therefore the thermal recovery process used in the Athabasca basin could also be
employed in recovering tar sand of Eastern Dahomey basin, Nigeria.
5. REFERENCES
ASTM, (2008a): Standard test method for determination of thermal conductivity of soil and soft rock by thermal
needle probe procedure: ASTM data series publication, D5334–08,1–8.
Beck, A.E., (1976): An Improved Method of Computing the Thermal Conductivity of Fluid-Filled Sedimentary
Rocks. Geophysics, Vol. 41, No.1, PP.133 -144.
Brandon, T. L., and Mitchell, J. K., (1989): Factors influencing thermal resistivity of sands, Journal of Geotechnical
Engineering, 115 (12) Paper No. 24119.
Cervenan, M.R., Vermeulen, F.E. and Chute, F.S., (1981): Thermal conductivity and Specific heat of Oil sands
samples. Canadian Journal of Earth Sciences, Vol. 18, No 5, pp 926-931.
Clark, K.A., (1944): Some Physical Properties of A sample of Alberta Bituminous Sand. Canadian Journal of
Research, 22F, pp.174-180.
Decagon Devices, Inc., (2011): KD2 Pro thermal properties analyzer operator’s manual version 4, Decagon Devices,
Inc., Pullman, WA.
Dubow, J., Notteburg, R., Rajeshwar, K. and Wang, Y., (1978): The Effects of Moisture and Organic Content on the
Thermophysical Properties of Green River Oil Shale. Proc. of the 11th Oil Shale Symposium, pp. 350-363.
Enu E.I., (1985): Textural characteristic of the Nigerian Tar Sands. Sedimentary Geology. Vol. 44, pp. 65-81.
IEEE Std. 442, (1998): IEEE Guide for Soil Thermal Resistivity Measurements, Institute of Electrical and
Electronics Engineers, New York, NY, USA.
Ito, Y., Saito, T. and Nagumeo, M. (1977): Shotherm QTM measurement of rock specimens: Shotherm Sales Info.
No.111, Showa Denko K.K., Tokyo. (Abstracted and translated from an original paper in Japanese:
Chinetsu, 14, 21
Krishanaiah, S., (2003): Centrifuge modelling of heat migration in geomaterials, Diss. Civil, Engineering, IIT
Bombay, India.
Lindberg R.W., Thomas R.R, Christensen R.J., (1985): Measurements of specific heat, thermal conductivity and
thermal diffusivity of Utah tar sands. Fuel Volume 64, Issue 1, Pages 80–85
Ministry of Solid Minerals Development, M. S. M. D., (2004): Bid Information Documentation and factual data for
the allocation of Nigeria Bitumen Tar Sands blocks (online) Available from
<http://msmd.gov.ng/Bitumen%20Bid%20Memo.pdf> Accessed July 2008.
Morabito, P., (1989): Thermal conductivity and diffusivity measurements by the transient two linear and parallel
probe method: Thermochimica Acta, 148, 513–520.
IJRRAS 20 (1) ● July 2014 Oladunjoye et al. ● Thermal Properties of Tar Sands
20
Oladunjoye, M.A. and Sanuade, O. A. (2012b): Thermal Diffusivity, Thermal Effusivity and Specific Heat of Soils
in Olorunsogo Powerplant, Southwestern Nigeria. IJRR in Appl Sci, Vol 13, Is 2, 15.
Oyekan, G. I., Kamiyo, M. O., (2011): A study on the engineering properties of sandcrete blocks produced with rice
husk ash blended cement. Journal of Engineering and Technology Research. 3:88-98.
Paasschens, J. C. J., Harmsma, S. and van der Toorn, R., (2004): “Dependence of thermal resistance on ambient and
actual temperature,” in Proceedings of the IEEE Bipolar/BiCMOS Circuits and Technology Meeting, pp.
96–99, September.
Ramakrishnan, D., Bharti, R., Nithya, M., Kusuma K. N. and Singh K. D., (2012): Measurement of thermal
properties of select intact and weathered granulites and their relationship to rock properties. Geophysics,
Vol. 77, No. 3, P. D63–D73.
Rajeshwar, K., Jones, D. B. and Dubow, J.B., (1982): Thermophysical Characterization of Oil Sands. 1. Specific
Heats. Fuel, Vol. 61, No. 3, pp. 237 – 239.
Scott, J. D. and Seto, A. C., (1986): Thermal Property Measurements on Oil Sands. Journal of Canadian Petroleum
Technology Volume 25, Number 6
Somerton, W.H., Keese, J.A and Chu, S.L., (1974): Thermal behavior of unconsolidated oil sands. Society of
Petroluem Engineers Journal, 14, pp. 513-521
Tomar, V. S., (1999): Soil thermal resistivity modeling [thesis], Civil Engineering, IIT Bombay, India.
Usowicz, B., Kossowski, J. and Baranowski, P. (1996): Spatial variability of soil thermal properties in cultivated
fields. Soil Tillage Res., 39, 85-100.
Zierfuss, H., and Van der Vliet, G.L., (1956): Laboratory Measurements of Heat Conductivity of Sedimentary
Rocks. Bulletin of America Association of Petroleum Geology, Vol. 40, pp. 2475-2488.

IJRRAS 20 (1) ● July 2014 Oladunjoye et al. ● Thermal Properties of Tar Sands
21
Table I: Thermal Properties of Tar Sands in the Afowo Formation of the Eastern Dahomey Basin,
Southwestern Nigeria
Locations Name
and Numbers
Thermal
Resistivity
(°C-cm/W)
Thermal
Conductivity
(W/°C-cm)
Thermal
Diffusivity
(mm²/s)
Volumetric
specific Heat
(mJ/m³K)
Temperature (°C)
Field Lab Field Lab Field Lab Field Lab Field Lab
Loda (1) 63.01 97.25 1.587 1.030 0.780 0.508 2.034 1.716 25.87 23.12
Agbabu (2) 304.1 296.9 0.328 0.337 0.176 0.222 1.859 1.518 26.17 26.38
Ilubirin (3) 66.16 134.4 1.511 0.748 0.481 0.348 3.143 2.170 26.69 26.75
Yegbata (4) 259.5 264.1 0.357 0.390 0.170 0.206 2.269 1.890 25.55 25.89
Legbeda (5) 101.0 104.8 0.990 0.977 0.622 0.627 1.591 1.660 25.46 24.94
Lonto (6) 79.97 81.17 1.250 1.232 0.715 0.817 1.749 1.599 25.67 24.42
Mobolade (7) 78.99 85.33 1.266 1.185 0.586 0.487 2.160 2.440 25.72 25.13
Idiopopo (8) 70.05 81.84 1.427 1.252 0.741 0.506 1.928 2.400 25.29 24.35
Idiobilayo (9) 64.92 83.96 1.540 1.200 0.774 0.520 1.989 2.310 24.59 24.03
Gbegude (10) 277.1 179.6 0.361 0.565 0.290 0.311 1.244 1.829 25.12 25.03
Paranta (11) 362.4 197.6 0.276 0.518 0.316 0.373 0.873 1.381 26.79 25.64
Iwopin (12) 110.3 112.9 0.907 0.893 0.537 0.385 1.690 2.322 31.84 27.82
Table II: Thermal Admittance/Effusivity of the Tar Sands in the study Locations
Locations Density,ρ(Kg/m3)
Thermal
conductivity,K
(W/Mk)
Volumetric Specific
Heat, C (mJ/m3K)
Therma Effusivity, β
(Jm-2
K-1
S-½
)
Field Lab Field Lab Field Lab
1 1803.00 1.587 1.030 2.034 1.716 2.412 1.785
2 1502.00 0.328 0.337 1.859 1.518 0.957 0.877
3 1225.00 1.511 0.748 3.143 2.170 2.411 1.410
4 1502.00 0.357 0.390 2.269 1.890 1.103 1.052
5 2017.50 0.990 0.977 1.591 1.660 1.782 1.809
6 2206.90 1.250 1.232 1.749 1.599 2.197 2.085
7 1566.50 1.266 1.185 2.160 2.440 2.070 2.129
8 1750.00 1.427 1.252 1.928 2.400 2.194 2.293
9 1704.50 1.540 1.200 1.989 2.310 2.285 2.174
10 1782.50 0.361 0.565 1.244 1.829 0.895 1.357
11 1486.00 0.276 0.518 0.873 1.381 0.598 1.031
12 1728.00 0.907 0.893 1.690 2.322 1.627 1.893

IJRRAS 20 (1) ● July 2014 Oladunjoye et al. ● Thermal Properties of Tar Sands
22
Table III: Phyical Properties of Tar Sands in the study locations
Locations
Percentage by Weight of
bitumen content (%) Dry Density (Kg/m3) Porosity (%)
Moisture content
(%) Specific Gravity
1 28.070 1797 19.50 0.390 1.8725
2 41.499 1125 32.50 0.240 1.7557
3 39.536 1221 24.15 0.270 1.8700
4 37.100 1202 30.40 0.250 1.5189
5 18.610 2011 28.35 0.410 2.0750
6 11.878 2201 25.40 0.440 2.2715
7 34.699 1563 26.25 0.300 1.8410
8 30.828 1746 27.55 0.330 1.8250
9 33.242 1700 22.40 0.310 1.7665
10 29.080 1777 28.90 0.340 1.8535
11 35.688 1480 32.80 0.285 1.4750
12 31.992 1728 28.65 0.320 1.7650
Table IV: Summary of the grain size distribution of the tar sands of the study locations
Locations Gravel (%) Coarse Sand (%) Medium Sand (%) Fine Sand (%)
LI 0.10 16.4 61.9 21.6
L2 0.00 11.80 63.60 24.60
L3 0.14 17.56 63.5 18.8
L4 0.20 15.6 65.6 18.6
L5 1.10 32.2 51.1 15.6
L6 1.40 23.2 58.2 17.2
L7 1.20 28.2 55.6 15.0
L8 0.20 27.1 57.8 14.9
L9 0.20 9.80 64.9 25.1
L10 3.50 28.4 46.6 9.50
L11 1.40 32.2 49.9 16.5
L12 1.20 31.7 49.4 17.7
IJRRAS 20 (1) ● July 2014 Oladunjoye et al. ● Thermal Properties of Tar Sands
23
Figure 1: Geological Map of Southwestern Nigeria, Showing the tar sand belt and the studied locations
(Modified after Enu, 1985)
Plate 1: A KD2 Pro Meter
Plate 2: Measurement of the thermal properties
Igunshin
Ashewele
Odigbo
Ore
Ibiade
IreleOkitipupa
Ode Aye
Agbaje
Igbokoda
Ijuodo
Ilutitun
Igbotako
Ajagba
Ayesan
Atijere
Itapanpa
Omotosho
Kajola
Ajebandele
Ijebu Ife
Ijebu Igbo
Igbekebo
Araromi
Ise
Loda
L2
L10
L2
L1L7
L5
L11
L9L8 L6
L4L3
L12
1555 0 10 2520 30
Ore
IlutitunAyesan
4º00'00"E 4º15'00"E 4º30'00"E 4º45'00"E 5º00'00"E
6º15'00"N
6º30'00"N
4º00'00"E 4º15'00"E 4º30'00"E 4º45'00"E 5º00'00"E
6º30'00"N
6º45'00"N
6º15'00"N
6º45'00"N
7º00'00"N7º00'00"N
Major Towns
Sample location
points
Major roads
Minor roads
Footpaths
Ln
LEGENDS
N
SCALE :- 1:250,000
Precambrian
Basement Complex
Cretaceous
Abeokuta Formation
Post Cretaceous
Sediments
NIGERIA
LOCATION
(1) (2)

IJRRAS 20 (1) ● July 2014 Oladunjoye et al. ● Thermal Properties of Tar Sands
24
Figure 2: Variation in the field and laboratory measurement of thermal resistivity of the Tar Sands in the study
Locations
Figure 3: Variation in the field and laboratory measurement of thermal conductivity of the Tar Sands in the study
Locations
Figure 4: Variation in the field and laboratory measurement of thermal diffusivity of the Tar Sands in the study
Locations
0
100
200
300
400
L1 L2 L3 L4 L5 L6 L7 L8 L9 L10 L11 L12
Field T.R Lab T.R
0
0.5
1
1.5
2
L1 L2 L3 L4 L5 L6 L7 L8 L9 L10 L11 L12
Field T.C Lab T.C
0
0.2
0.4
0.6
0.8
1
L1 L2 L3 L4 L5 L6 L7 L8 L9 L10 L11 L12
Field T.D Lab T.D
IJRRAS 20 (1) ● July 2014 Oladunjoye et al. ● Thermal Properties of Tar Sands
25
Figure 5: Variation in the field and laboratory measurement of volumetric specific heat of the Tar Sands in the study
Locations
Figure 6a and b: Variation in the field and laboratory measurement of thermal effusivity of the Tar Sands in the
study Locations
0
1
2
3
4
L1 L2 L3 L4 L5 L6 L7 L8 L9 L10 L11 L12
Field SH Lab SH
0
0.5
1
1.5
2
2.5
3
L1 L2 L3 L4 L5 L6 L7 L8 L9 L10 L11 L12
Field T.E Lab T.E

IJRRAS 20 (1) ● July 2014 Oladunjoye et al. ● Thermal Properties of Tar Sands
26
Figure 7: Variation in values of field and laboratory measured thermal properties of tar sand
(a) Thermal Resistivity (b) Thermal Conductivity (c) Thermal Diffusivity
(d) Volumetric Specific Heat (e) Thermal Effusivity (f) Temperature
50 100 150 200 250 300
50
100
150
200
250
300
350
400
Fiel
d T
herm
al R
esis
tivity
(0 C-c
m/W
)
Laboratory Thermal Resistivity(0C-cm/W))
0.2 0.4 0.6 0.8 1.0 1.2 1.4
0.2
0.4
0.6
0.8
1.0
1.2
1.4
1.6
Fiel
d T
herm
al C
ondu
ctiv
ity (W
/mK
)
Laboratory Thermal Conductivity (W/mK)
0.2 0.3 0.4 0.5 0.6 0.7 0.8 0.9
0.1
0.2
0.3
0.4
0.5
0.6
0.7
0.8
Fiel
d Th
erm
al D
iffus
ivity
mm
2 /S
Laboratory Thermal Diffusivity mm2/S
1.2 1.4 1.6 1.8 2.0 2.2 2.4 2.6
0.5
1.0
1.5
2.0
2.5
3.0
3.5
Fiel
d Vo
lum
etric
Spe
cific
Hea
t (M
J/m
3 K)
Laboratory Volumetric Specific Heat (MJ/m3K)
0.5 1.0 1.5 2.0 2.5
0.8
1.0
1.2
1.4
1.6
1.8
2.0
2.2
2.4
Fiel
d Th
erm
al E
ffus
ivity
(Jm
-2K
-1S
-½)
Laboratory Thermal Effusivity (Jm-2K
-1S
-½)
24 25 26 27 28
24
25
26
27
28
29
30
31
32
Fie
ld T
emp
erat
ure
(0 C)
Laboratory Temperature (0C)
Y = -31.3814 +1.28767* X
R = 0.85663
Y = -0.14246 + 1.30818 * X
R = 0.84822
Y = 0.04392 + 1.06609* X
R = 0.81009
Y = 0.45817 + 0.73299 * X
R = 0.49315
Y = 0.65715 + 0.58493*X
R = 0.7784
Y = -0.5633 + 1.05937*X
R = 0.73087
(a) (b)
(c) (d)
(e) (f)
IJRRAS 20 (1) ● July 2014 www.arpapress.com/Volumes/Vol20Issue1/IJRRAS_20_1_02.pdf
27
Figure 8a and b: Variation of Field and Laboratory Thermal Conductivity with Percentage by weight of Bitumen
Content
Figure 8c and d: Variation of Field and Laboratory Thermal Diffusivity with Percentage by weight of Bitumen
Content
Figure 9a and b: Variation of field and laboratory Thermal Resistivity with moisture content
10 15 20 25 30 35 40 45
0.2
0.4
0.6
0.8
1.0
1.2
1.4
1.6
Fie
ld T
her
mal
Co
nd
uct
ivit
y (W
/mK
)
Percentage by Wt. of Bitumen Content (%)
10 15 20 25 30 35 40 45
0.2
0.4
0.6
0.8
1.0
1.2
1.4
Lab
ora
tory
Th
erm
al C
on
du
ctiv
ity
(W/m
K)
Percentage by Wt. of Bitumen Content (%)
10 15 20 25 30 35 40 45
0.1
0.2
0.3
0.4
0.5
0.6
0.7
0.8
Fie
ld T
her
mal
Dif
fusi
vity
(m
m2 /s
)
Percentage by Wt. of Bitumen Content (%)
10 15 20 25 30 35 40 45
0.2
0.3
0.4
0.5
0.6
0.7
0.8
0.9
Lab
ora
tory
Th
erm
al D
iffu
sivi
ty (
mm
2 /s)
Percentage by Wt. of Bitumen Content (%)
0.20 0.25 0.30 0.35 0.40 0.45
50
100
150
200
250
300
350
400
Fie
ld T
her
mal
Res
isti
vity
(0 C
-cm
/W)
MOISTURE CONTENTS
0.20 0.25 0.30 0.35 0.40 0.45
50
100
150
200
250
300
Lab
ora
tory
Th
erm
al R
esis
tivi
ty (0 C
-cm
/W)
MOISTURE CONTENTS
Y = 1.54404 - 0.02203*X
R = -0.55119
Y = 1.49652 - 0.01654*X
R = -0.26835
(b) (a)
Y = 0.99006 - 0.01765*X
R = -0.86623
Y = 0.96741 - 0.01456*X
R = -0.54304
(d) (c)
Y = 401.23846 - 796.75972*X
R = -0.66803 Y = 439.51834 - 884.61263*X
R = -0.4934
(a) (b)

IJRRAS 20 (1) ● July 2014 Oladunjoye et al. ● Thermal Properties of Tar Sands
28
Figure 9c and d: Variation of field and laboratory Thermal Conductivity with moisture content
Figure 10a and b: Variation of Field and Laboratory Thermal Conductivity with Dry Den
Figure 10c and d: Variation of Field and Laboratory Thermal Diffusivity with Dry De
0.20 0.25 0.30 0.35 0.40 0.45
0.2
0.4
0.6
0.8
1.0
1.2
1.4
1.6F
ield
Th
erm
al C
on
du
cti
vit
y (W
/mK
)
MOISTURE CONTENTS
0.20 0.25 0.30 0.35 0.40 0.45
0.2
0.4
0.6
0.8
1.0
1.2
1.4
Lab
ora
tory
Th
erm
al C
on
du
ctiv
ity
(W/m
K)
MOISTURE CONTENTS
1000 1200 1400 1600 1800 2000 2200
0.2
0.4
0.6
0.8
1.0
1.2
1.4
1.6
Fie
ld T
her
mal
Co
nd
uct
ivit
y (W
/mK
)
Dry Density (Kg/m3)
1000 1200 1400 1600 1800 2000 2200
0.2
0.4
0.6
0.8
1.0
1.2
1.4
Lab
ora
tory
Th
erm
al C
on
du
ctiv
ity(
W/m
K)
Dry Density (Kg/m3)
1000 1200 1400 1600 1800 2000 2200
0.1
0.2
0.3
0.4
0.5
0.6
0.7
0.8
Fie
ld T
her
mal
Dif
fusi
vity
(m
m2 /s
)
Dry Density (Kg/m3)
1000 1200 1400 1600 1800 2000 2200
0.2
0.3
0.4
0.5
0.6
0.7
0.8
0.9
Labo
rtor
y Th
erm
al d
iffus
ivity
(m
m2 /s
)
Dry Density (Kg/m3)
(c) (d)
Y = -0.24318 + 3.40931*X
R = 0.62972
Y = -0.14136 + 3.47395 *X
R = 0.41605
(a) (b)
Y = -0.31898 + 7.23994E-4*X
R= 0.69878
Y = -0.00631 + 6.07423E-4*X
R = 0.38013
Y = -0.30454 + 4.58515E-4*X
R = 0.8681
Y = -0.27129 + 4.83019E-4*X
R = 0.69489
(d) (c)
IJRRAS 20 (1) ● July 2014 Oladunjoye et al. ● Thermal Properties of Tar Sands
29
Figure 11a and b: Variation of field and laboratory Thermal Resistivity with Porosity
Figure 11c and d: Variation of field and laboratory Specific Heat with Porosity
Figure 12a and b: Variation of field and laboratory Thermal Conductivity with Temperature
18 20 22 24 26 28 30 32 34
50
100
150
200
250
300
350
400F
ield
Th
erm
al R
esis
tivi
ty (0 C
-cm
/W)
Porosity (%)
18 20 22 24 26 28 30 32 34
50
100
150
200
250
300
Lab
ora
tory
Th
erm
al R
esis
tivi
ty (
0 C-c
m/W
)
Porosity (%)
18 20 22 24 26 28 30 32 34
0.5
1.0
1.5
2.0
2.5
3.0
3.5
Fie
ld S
pec
ific
Hea
t (M
J/m
3 K)
Porosity (%)
18 20 22 24 26 28 30 32 34
1.2
1.4
1.6
1.8
2.0
2.2
2.4
2.6
Lab
ora
tory
Sp
ecif
ic H
eat (
MJ/
m3 K
)
Porosity (%)
24 25 26 27 28 29 30 31 32
0.2
0.4
0.6
0.8
1.0
1.2
1.4
1.6
Fie
ld T
her
mal
Co
nd
uct
ivit
y(W
/mK
)
Temperature (0C)
23 24 25 26 27 28
0.2
0.4
0.6
0.8
1.0
1.2
1.4
Lab
ora
tory
Th
erm
al C
on
du
ctiv
ity
(W/m
K)
Temperature (0C)
Y = -219.24354 + 13.31*X
R = 0.70346
Y = -473.87617 + 23.01978*X
R = 0.80938
(b) (a)
Y = 2.87673 - 0.03453*X
R = -0.36392
Y = 3.74223 - 0.06846*X
R = -0.48548
(d) (c)
Y = 4.38443 - 0.13933X
R = -0.53013
Y = 1.84816 - 0.03297X
R = -0.1179
(d) (c)

IJRRAS 20 (1) ● July 2014 Oladunjoye et al. ● Thermal Properties of Tar Sands
30
Figure 12: Variation in the field and laboratory measurement of Temperaure of the Tar Sands in the study Location
Figure 13: Bar chart showing grain size distribution of the study locations.
0
10
20
30
40
L1 L2 L3 L4 L5 L6 L7 L8 L9 L10 L11 L12
Field Temp Lab Temp
0.00
10.00
20.00
30.00
40.00
50.00
60.00
70.00
LI L2 L3 L4 L5 L6 L7 L8 L9 L10 L11 L12
Gravel
Coarse
Medium
Fine