in-situ detection of astrobiologically interesting areas...
TRANSCRIPT
6-1
Chapter 6. Fluorescence Spectra of Titan Tholins:
in-situ Detection of Astrobiologically Interesting Areas
on Titan’s Surface
6.1. Abstract
We report the three-dimensional fluorescence spectra of Titan tholins in water and
acetonitrile, and separate some of the fluorescent components of tholins using two-
dimensional thin layer chromatography. In acetonitrile, tholins exhibit a broad
fluorescence with a maximum at 471 nm, and an excitation maximum at 410 nm. The
fluorescence spectrum of a water extraction displays a more complicated spectrum with
multiple peaks. TLC results indicate the presence of at least three distinct fluorescent
species. In addition, we obtained the two-dimensional fluorescence spectrum of tholins
in water ice at 77K, close to the surface temperature of Titan. The fluorescence of tholins
in a 77K ice matrix is red-shifted in comparison to a water solution, and undergoes a
further red-shift when the water solution is heated prior to freezing. These results suggest
that a simple fluorescence probe could be used on the surface of Titan to identify sites
where tholins have been mixed with water, and possibly reveal information about the
extent of heating the tholin-water mixture has undergone. This would be useful for a
future mission with the goal of examining the organic chemistry of Titan.
6-2
6.2. Introduction
Titan, the largest moon of Saturn, is one of the most astrobiologically interesting
targets in the Solar System. Photochemistry in the upper reaches of a thick N2/CH4
atmosphere produces a wealth of organic compounds that eventually fall to a surface
composed primarily of water ice. Once there, impacts or volcanism (Lorenz 1996) melt
the surface ice, mixing the organics with liquid water in melt pools that may last for
hundreds or thousands of years (Lorenz et al. 2001; Artemieva and Lunine 2003),
adequate time for a complex organic chemistry to develop. Titan’s frozen melt pools
represent a collection of individual experiments in prebiotic chemistry preserved by the
frigid temperatures of the surface.
With the arrival of the Cassini/Huygens mission in 2004, interest in the properties
of Titan’s tholins has experienced a resurgence. Analysis has naturally been limited to
laboratory analogs produced by electrical discharge or UV irradiation of N2/CH4 mixtures
(Coll et al. 1999). The products of these reactions are numerous, and vary from low
molecular weight alkanes, alkenes and nitriles (Coll et al. 1999) to a reddish-brown
polymeric material, the substance known as tholins. While a good deal of information on
the spectral properties and elemental composition of the tholins has been obtained (Khare
et al. 2002; Coll et al. 2001; Sarker et al. 2003), structural information is still lacking.
We report the first 3-D fluorescence spectra of Titan tholins, as well as the first low-
temperature observations of the fluorescence properties of tholins (cf. Sagan et al. 1993).
Three-dimensional fluorescence spectra like those obtained can be used as a “fingerprint”
of these complex mixtures. Of particular interest are the fluorescence spectra of tholins
extracted into water, and the fluorescence of tholins in a water ice matrix at temperatures

6-3
similar to those on the surface of Titan, approximately 94 K (Lorenz et al. 2001). We
discuss how these results might be applied to the future exploration of Titan’s surface and
chemistry.
6.3. Experimental
The tholin samples were produced in a plasma discharge reactor, the details of
which are given elsewhere (Sarker et al. 2003). The gas mixture used was 2% CH4 in
nitrogen at 7 torr, with the entire discharge cell cooled to 195 K in a dry ice-isopropanol
bath. The sample was recovered as a saturated solution in acetonitrile and contained a
tholin mixture the components of which ranged in mass between 100 and 500 amu as
determined by electrospray ionization-Fourier transform mass spectrometry. Samples
were isolated in a dry, oxygen free glove box, and stored in a dry, oxygen free
environment until needed.
Three-dimensional fluorescence spectra were obtained on a Hitachi F-4500 FL
spectrophotometer. The excitation and emission slits were set at 5 nm, and both
excitation and emission were scanned in 5 nm intervals at 12000 nm/min. The
acetonitrile sample was a ten-fold dilution of a saturated solution of tholins in
acetonitrile. To prepare the water sample, an aliquot of the saturated acetonitrile solution
was dried under vacuum to yield 17.6 mg of solid. This was extracted with 3 mL of
water, and then filtered through a 0.2 µm syringe filter. This solution was diluted ten-
fold for use in the spectrophotometer.
6-4
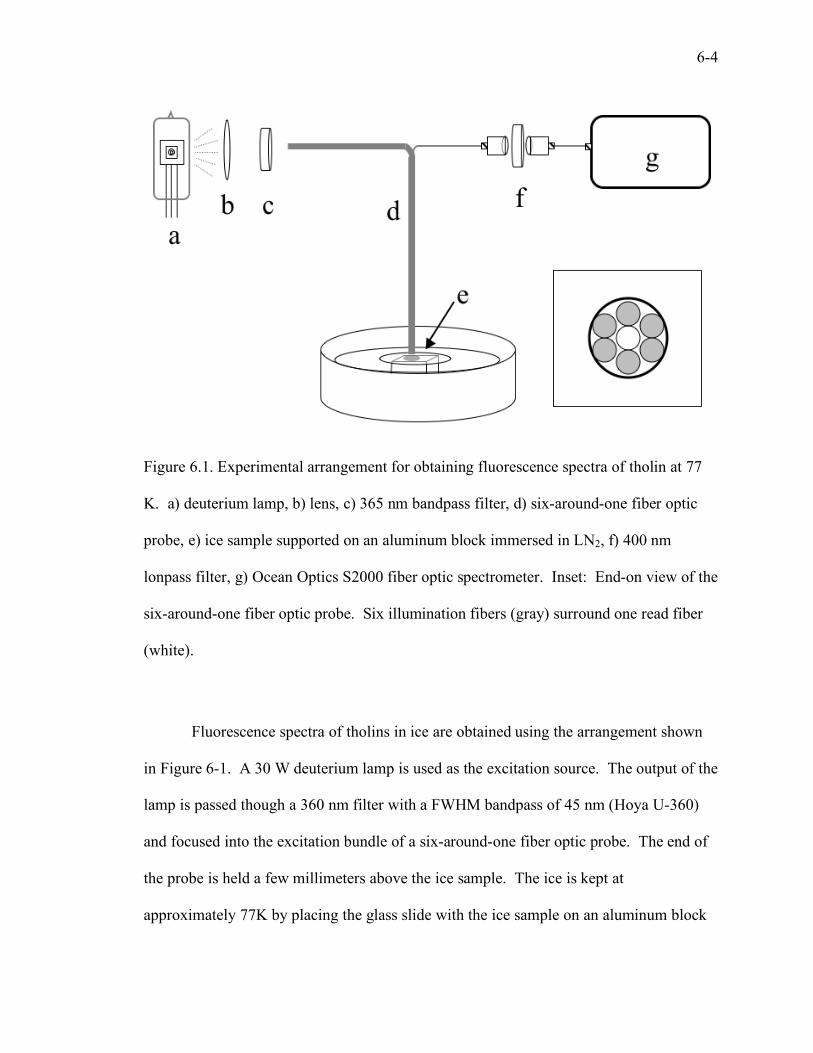
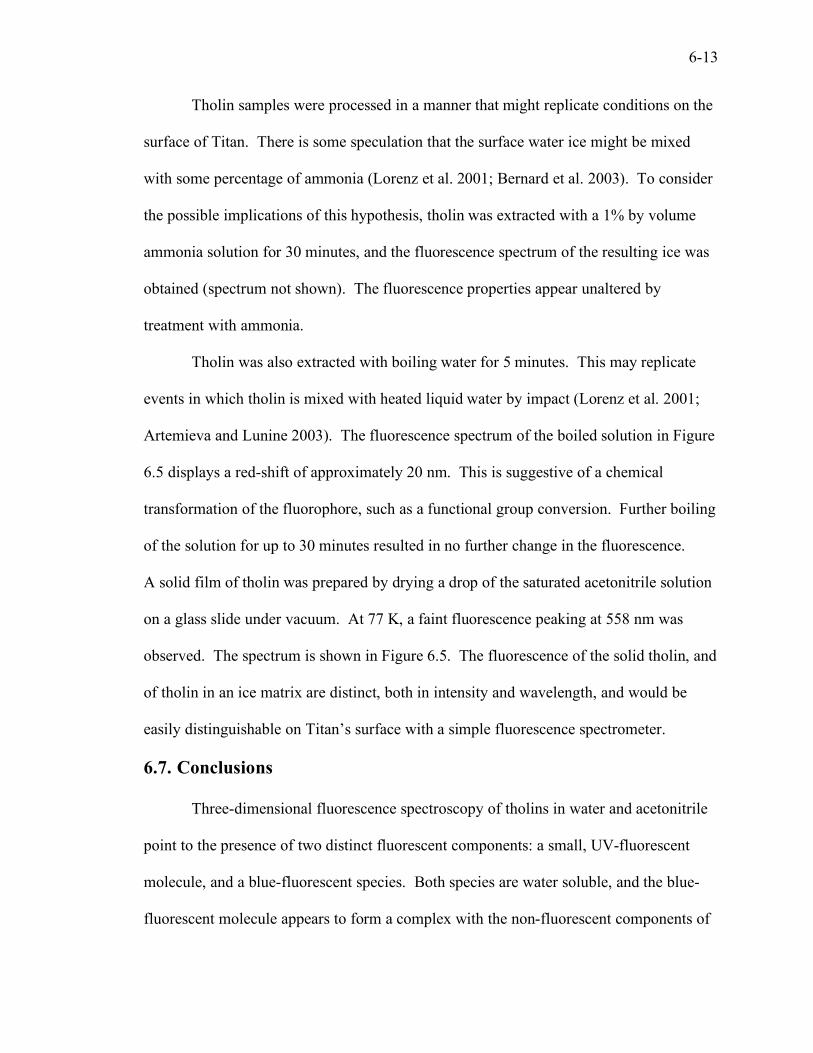
Figure 6.1. Experimental arrangement for obtaining fluorescence spectra of tholin at 77
K. a) deuterium lamp, b) lens, c) 365 nm bandpass filter, d) six-around-one fiber optic
probe, e) ice sample supported on an aluminum block immersed in LN2, f) 400 nm
lonpass filter, g) Ocean Optics S2000 fiber optic spectrometer. Inset: End-on view of the
six-around-one fiber optic probe. Six illumination fibers (gray) surround one read fiber
(white).
Fluorescence spectra of tholins in ice are obtained using the arrangement shown
in Figure 6-1. A 30 W deuterium lamp is used as the excitation source. The output of the
lamp is passed though a 360 nm filter with a FWHM bandpass of 45 nm (Hoya U-360)
and focused into the excitation bundle of a six-around-one fiber optic probe. The end of
the probe is held a few millimeters above the ice sample. The ice is kept at
approximately 77K by placing the glass slide with the ice sample on an aluminum block
6-5
immersed in LN2. Fluorescence collected by the read fiber of the probe is passed through
a 400 nm longpass filter (Schott GG400) to remove the excitation light, and is analyzed
with a fiber optic spectrometer (Ocean Optics S-2000). The inset of Figure 6.1 shows a
view of the end of the fiber optic probe facing the sample. Six illumination fibers
surround a single read fiber.
Two-dimensional thin-layer chromatography was performed on 60 µm silica gel
plates (Merck silica gel 60). Plates were prewashed with methanol:dichloromethane
overnight, and dried at 100 °C before use. Approximately 1 µL of tholin in acetonitrile
was spotted onto the plate for each chromatograph. Plates were developed with either
dimethylformamide and then methanol, or ethanol and then acetonitrile. Spots on the
plates were scraped off with a razor blade, and the silica gel was extracted with
acetonitrile for analysis with the Hitachi F-4500 FL spectrophotometer. Separate plates
were developed in an identical manner for staining. KMnO4 solution for staining was
prepared from 1 g KMnO4 and 2 g Na2CO3 dissolved in 100 mL water.
6.4. Results and discussion
6.4.1. Three-dimensional fluorescence spectra
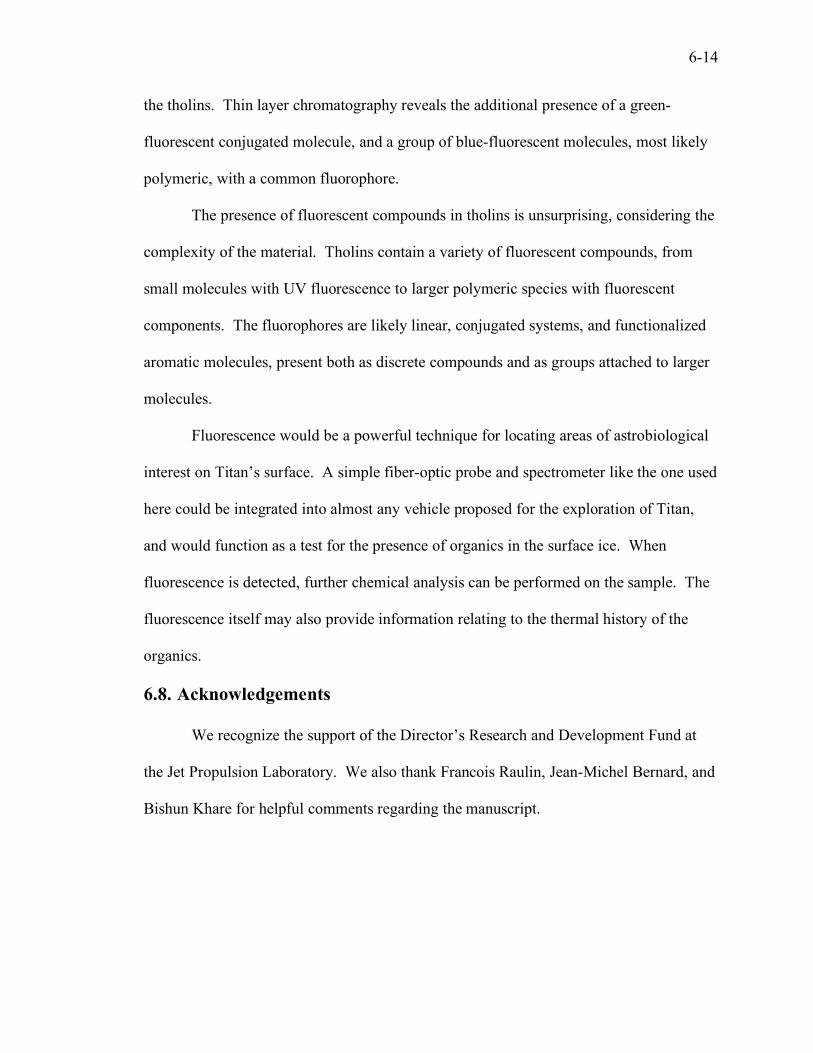
Three-dimensional fluorescence spectra of tholins in acetonitrile and water are
given in Figure 6.2. The acetonitrile solution spectrum is broad and featureless, with an
emission maximum at 471 nm, and an excitation maximum at 410 nm.
At least two distinct fluorophores are present in the water extraction. The emission is
blue-shifted relative to the acetonitrile spectrum, with a maximum at 397 nm. The
excitation maximum is also blue-shifted, peaking at 335 nm. Molecules with similar

6-6
600
500
400
300
200E
xcita
tio
n W
ave
len
gth
(n
m)
600500400300200
Emission Wavelength (nm)
471 nm, 410 nm
600
500
400
300
200
Excita
tio
n W
ave
len
gth
(n
m)
600500400300200
Emission Wavelength (nm)
397 nm, 335 nm
305 nm, 240 nm
600
500
400
300
200
Excita
tio
n W
ave
len
gth
(n
m)
600500400300200
Emission Wavelength (nm)
405 nm, 333 nm
300 nm, 240 nm
a
b
c
Figure 6.2. a) The 3-D fluorescence spectrum of tholin in acetonitrile. b) The 3-D
fluorescence spectrum of a water extract of tholin. c) The 3-D fluorescence spectrum of
the chromatographically separated fluorescent fraction of tholin. The prominent diagonal
lines in b and c are due to Rayleigh scatter from the sample.
6-7
fluorescence maxima include several polycyclic aromatic hydrocarbons (PAHs) with 4-5
rings, including pyrene, benzopyrene, and benzanthracene derivatives (Dean 1992).
Sagan et al. (1993) have previously detected PAHs in Titan tholins. Nitrogen containing
PAHs were detected in tholins as well (Imanaka et al. 2004), and should display
fluorescence properties similar to normal PAHs. Linear conjugated systems of 8-10
atoms, such as octatetraene, also have similar emission and excitation maxima (D’Amico
et al. 1980). The water spectrum displays a second, fainter peak, with an emission
maximum of 305 nm, and an excitation maximum of 240 nm. Fluorescence emission in
the UV is suggestive of a small molecule. Monocyclic aromatics such as benzene,
toluene, and aniline have emission maxima in this region (Berlman 1971).
Figure 6.2c is the spectrum of the fluorescent fraction of the saturated acetonitrile
solution, separated chromatographically on a silica gel column with acetonitrile. The
separation was followed with a UV lamp. The spectrum is strikingly similar to that of the
water sample (Figure 6.2b). The emission peak at 305 nm is more strongly represented,
however.
Solvent effects on fluorescence spectra are complex, but in general emission
maxima shift to longer wavelengths as solvent polarity increases (Lakowicz 1999). The
opposite apparent trend is observed in the tholin spectra in Figures 6.2a (in acetonitrile)
and 6.2b (in water). In addition, the spectrum of the chromatographically-separated
tholins in acetonitrile (Figure 6.2c) is essentially the same as that of the water extraction
(Figure 6.2b), despite the difference in solvent. This indicates that the differences in the
excitation and emission wavelengths between Figures 6.2a and 6.2b are probably not due
to solvent effects.
6-8
The chromatographic separation results indicate, rather, the presence of a fluorophore
that, when separated from other chemically distinct components of the bulk tholin
solution by silica gel chromatography, undergoes a shift to the blue in excitation and
emission maxima. This could be the result of intermolecular interactions between this
fluorophore and one or more non-fluorescent components of the bulk tholins. These
interactions could result in an intermolecular complex with lower-energy excited states,
and red-shifted fluorescence relative to the isolated fluorophore. The difference in
spectra between acetonitrile and water solutions would suggest that the non-fluorescent
component is essentially insoluble in water, but soluble in acetonitrile, or that water
prevents the formation of the complex.
While no structural information about the fluorophores can be gleaned from these
spectra, they are a fingerprint of the tholin sample. Producing laboratory tholins under
various conditions would establish a library of spectra useful as a reference for future
missions to Titan that may collect fluorescence data.
6.5. Thin-layer chromatography
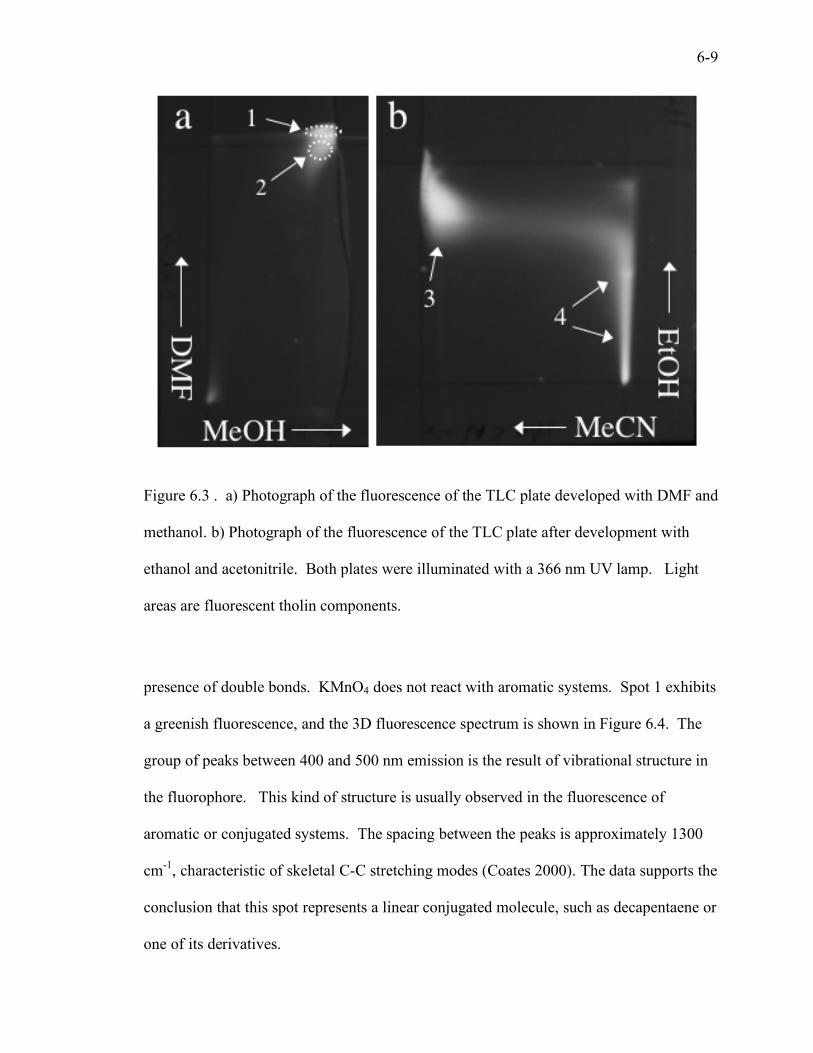
Figure 6.3a is a photograph of the native fluorescence of tholins, spotted from an
acetonitrile solution, separated on a TLC plate developed in the first dimension with
dimethylformamide, and in the second dimension with methanol. Development with
these solvents causes the majority of the fluorescent components to migrate to the upper
right corner of the plate. Polar solvents such as methanol and dimethylformamide are
necessary to move the tholins on the polar silica gel, indicating that the fluorescent
compounds are polar themselves. The spot labeled 1 reacts with KMnO4, indicating the
6-9
Figure 6.3 . a) Photograph of the fluorescence of the TLC plate developed with DMF and
methanol. b) Photograph of the fluorescence of the TLC plate after development with
ethanol and acetonitrile. Both plates were illuminated with a 366 nm UV lamp. Light
areas are fluorescent tholin components.
presence of double bonds. KMnO4 does not react with aromatic systems. Spot 1 exhibits
a greenish fluorescence, and the 3D fluorescence spectrum is shown in Figure 6.4. The
group of peaks between 400 and 500 nm emission is the result of vibrational structure in
the fluorophore. This kind of structure is usually observed in the fluorescence of
aromatic or conjugated systems. The spacing between the peaks is approximately 1300
cm-1, characteristic of skeletal C-C stretching modes (Coates 2000). The data supports the
conclusion that this spot represents a linear conjugated molecule, such as decapentaene or
one of its derivatives.

6-10
The spot labeled 2 exhibits a blue fluorescence, with a fluorescence excitation
maximum at 340 nm, and an emission maximum at 400 nm. This is the same
fluorescence seen in the water extraction of the tholins, and so we assume that the
fluorophore is the same.
Figure 6.4. 3-D fluorescence spectrum of the acetonitrile extract of spot 1. The inset
shows detail in the region between 410 and 550 nm emission, and 340 and 470 nm
excitation. The prominent diagonal lines are due to Rayleigh scatter.
Figure 6.3b is a photograph of the native fluorescence of tholins developed in the
first dimension with ethanol, and in the second dimension with acetonitrile. The
6-11
fluorescence is split into two major groups, a large, irregular spot labeled 3 and a long
streak labeled 4. The 3D fluorescence spectrum of spot 3 reveals an excitation maximum
at 340 nm, and an emission maximum at 400 nm, characteristic of the blue, water soluble
component. 3D fluorescence spectra of different regions of the streak labeled 4 all
showed similar fluorescence: an excitation maximum at 285 nm, and an emission
maximum at 340 nm. The emission displays a long tail to ~500 nm, explaining the blue
color visible to the naked eye.
Streak 4 in Figure 6.3b represents a class of compounds with blue fluorescence
distinct from the blue fluorophore of spot 3. These compounds are distinct in structure as
well; streak 4 is formed from components with varying affinity for silica gel relative to
ethanol, and a great affinity for silica gel relative to acetonitrile. This suggests a group of
polymers that share a common fluorescent moiety, perhaps a pendant polycyclic aromatic
structure. Spot 3 shows little affinity for silica relative to both ethanol and acetonitrile.
The thin-layer chromatography results indicate the presence of at least three distinct
fluorescent species: (1) a linear, conjugated molecule with a green fluorescence (spot 1 of
Figure 6.3), (2) the water soluble, blue-fluorescent compound that is the primary
fluorophore of the water extract, and (3) a blue-fluorescent class of polymeric compounds
with a common fluorescent group.
6.6. Fluorescence spectra of tholins at 77K
Figure 6.5 gives the fluorescence spectra of several different tholin samples
acquired at approximately 77K. Tholins in pure water ice at this temperature exhibit a
single fluorescence peak with a maximum at 520 nm. At the excitation wavelength used

6-12
in these experiments (~360 nm), the fluorescence of a water extract of tholin peaks at 430
nm. The fluorescence in ice is significantly red-shifted relative to the fluorescence in
liquid water. Further experiments in which the ice sample was allowed to melt and then
refrozen showed no changed in the fluorescence properties. This indicates that the
observed red-shift is the result of a change in the environment of the fluorophore, and not
the result of a chemical transformation.
2000
1500
1000
500
0
Inte
nsity (
Arb
.Units)
700650600550500450400
Wavelength (nm)
a
b
c
d
Figure 6.5. Fluorescence spectra of tholin. a) Cut through the plot in Fig. 6.2b at an
excitation wavelength of 360 nm. b) Fluorescence of tholin in ice at 77K.
c) Fluorescence of tholin in ice at 77K, after boiling for 5 minutes. d) Fluorescence of
solid tholin at 77K.
6-13
Tholin samples were processed in a manner that might replicate conditions on the
surface of Titan. There is some speculation that the surface water ice might be mixed
with some percentage of ammonia (Lorenz et al. 2001; Bernard et al. 2003). To consider
the possible implications of this hypothesis, tholin was extracted with a 1% by volume
ammonia solution for 30 minutes, and the fluorescence spectrum of the resulting ice was
obtained (spectrum not shown). The fluorescence properties appear unaltered by
treatment with ammonia.
Tholin was also extracted with boiling water for 5 minutes. This may replicate
events in which tholin is mixed with heated liquid water by impact (Lorenz et al. 2001;
Artemieva and Lunine 2003). The fluorescence spectrum of the boiled solution in Figure
6.5 displays a red-shift of approximately 20 nm. This is suggestive of a chemical
transformation of the fluorophore, such as a functional group conversion. Further boiling
of the solution for up to 30 minutes resulted in no further change in the fluorescence.
A solid film of tholin was prepared by drying a drop of the saturated acetonitrile solution
on a glass slide under vacuum. At 77 K, a faint fluorescence peaking at 558 nm was
observed. The spectrum is shown in Figure 6.5. The fluorescence of the solid tholin, and
of tholin in an ice matrix are distinct, both in intensity and wavelength, and would be
easily distinguishable on Titan’s surface with a simple fluorescence spectrometer.
6.7. Conclusions
Three-dimensional fluorescence spectroscopy of tholins in water and acetonitrile
point to the presence of two distinct fluorescent components: a small, UV-fluorescent
molecule, and a blue-fluorescent species. Both species are water soluble, and the blue-
fluorescent molecule appears to form a complex with the non-fluorescent components of
6-14
the tholins. Thin layer chromatography reveals the additional presence of a green-
fluorescent conjugated molecule, and a group of blue-fluorescent molecules, most likely
polymeric, with a common fluorophore.
The presence of fluorescent compounds in tholins is unsurprising, considering the
complexity of the material. Tholins contain a variety of fluorescent compounds, from
small molecules with UV fluorescence to larger polymeric species with fluorescent
components. The fluorophores are likely linear, conjugated systems, and functionalized
aromatic molecules, present both as discrete compounds and as groups attached to larger
molecules.
Fluorescence would be a powerful technique for locating areas of astrobiological
interest on Titan’s surface. A simple fiber-optic probe and spectrometer like the one used
here could be integrated into almost any vehicle proposed for the exploration of Titan,
and would function as a test for the presence of organics in the surface ice. When
fluorescence is detected, further chemical analysis can be performed on the sample. The
fluorescence itself may also provide information relating to the thermal history of the
organics.
6.8. Acknowledgements
We recognize the support of the Director’s Research and Development Fund at
the Jet Propulsion Laboratory. We also thank Francois Raulin, Jean-Michel Bernard, and
Bishun Khare for helpful comments regarding the manuscript.
6-15
6.9. References
Artemieva, N. and J. Lunine 2003. Cratering on Titan: impact melt, ejecta, and the fate of surface organics. Icarus 164, 471-480.
Bernard, J.-M., Coll, P., Coustenis, A., Raulin, F. 2003. Experimetnal Simulation of Titan’s Atmosphere: Detection of ammonia and ethylene oxide. Planetary and Space Science 51, 1003-1011.
Berlman, I.B. 1971. Handbook of Fluorescence Spectra of Aromatic Molecules, 2nd ed. Academic Press, New York pp. 108, 144, 251.
Coates, J. 2000. Interpretation of Infrared Spectra, A Practical Approach. In: Meyers, R.A. (Ed.), Encyclopedia of Analytical Chemistry, John Wiley and Sons Ltd., Chichester, pp. 10815-10837.
Coll, P., D. Coscia, N. Smith, M.-C. Gazeau, S.I. Ramirez, G. Cernogora, G. Israël, F. Raulin 1999. Experimental laboratory simulation of Titan’s atmosphere: aerosols and gas phase. Planetary and Space Science 47, 1331-1340.
Coll, P., S. I. Ramirez, R. Navarro-Gonzalez, F. Raulin 2001. Chemical and optical behavior of tholins, laboratory analogs of Titan aerosols. Advances in Space Research 27, 289-297.
D’Amico, K.L., C. Manos, R. L. Christensen 1980. Electronic Energy Levels in a Homologous Series of Unsubstituted Linear Polyenes. J. Am. Chem. Soc., 102, 1777-1782.
Dean, J. A. 1992. Lange’s Handbook of Chemistry, 14th ed. McGraw-Hill, New York, pp. 7.25-7.27.
Imanaka, H., Khare, B.N., Elsila, J.E., Bakes, E.L.O., McKay, C.P., Cruikshank, D.P., Sugita, S., Matsui, T., Zare, R.N. 2004. Laboratory experiments of Titan tholin formed in cold plasma at various pressures: implications for nitrogen-containing polycyclic aromatic compounds in Titan haze. Icarus 168, 344-366.
Khare, B.N., E.L.O. Bakes, H. Imanaka, C. P. McKay, D.P. Cruikshank, E.T. Arakawa 2002. Analysis of the Time-Dependent Chemical Evolution of Titan Haze Tholin. Icarus 160, 172-182.
Lakowicz, J. R. 1999. Principles of Fluorescence Spectroscopy, 2nd ed. Kluwer/Plenum, New York, pp. 185-210.
Lorenz, R.D. 1996. Pillow lava on titan: expectations and constraints on cryovolcanic processes. Planetary and Space Science 44, 1021-1028.
Lorenz, R.D., J.I. Lunine, C.P. McKay 2001. Geologic Setting for Aqueous Organic Synthesis on Titan Revisited. Enantiomer 6, 83-96.
Sagan, C., B. N. Khare, W. R. Thompson, G. D. McDonald, M. R. Wing, J. L. Bada, T. Vo-Dihn, and E. T. Arakawa 1993. Polycyclic aromatic hydrocarbons in the atmospheres of Titan and Jupiter. Astrophys. J. 414, 399-405.
Sarker, N., Somogyi, A., Lunine, J.I., Smith, M.A 2003. Titan Aerosol Analogues: Analysis of the Nonvolatile Tholins. Astrobiology 3, 719-726.