in situ fortification of vitamin b12 in wheat flour and
TRANSCRIPT

Accepted Manuscript
In situ fortification of vitamin B12 in wheat flour and wheat bran by fermentation with Propionibacterium freudenreichii
Chong Xie, Rossana Coda, Bhawani Chamlagain, Minnamari Edelmann, Paulina Deptula, Pekka Varmanen, Vieno Piironen, Kati Katina
PII: S0733-5210(18)30123-1
DOI: 10.1016/j.jcs.2018.05.002
Reference: YJCRS 2567
To appear in: Journal of Cereal Science
Received Date: 06 February 2018
Revised Date: 30 April 2018
Accepted Date: 03 May 2018
Please cite this article as: Chong Xie, Rossana Coda, Bhawani Chamlagain, Minnamari Edelmann, Paulina Deptula, Pekka Varmanen, Vieno Piironen, Kati Katina, fortification of vitamin B12 in In situwheat flour and wheat bran by fermentation with , Propionibacterium freudenreichii Journal of
(2018), doi: 10.1016/j.jcs.2018.05.002Cereal Science
This is a PDF file of an unedited manuscript that has been accepted for publication. As a service to our customers we are providing this early version of the manuscript. The manuscript will undergo copyediting, typesetting, and review of the resulting proof before it is published in its final form. Please note that during the production process errors may be discovered which could affect the content, and all legal disclaimers that apply to the journal pertain.

ACCEPTED MANUSCRIPT
1
1 In situ fortification of vitamin B12 in wheat flour and
2 wheat bran by fermentation with Propionibacterium
3 freudenreichii4 Chong Xie*, Rossana Coda, Bhawani Chamlagain, Minnamari Edelmann, Paulina 5 Deptula, Pekka Varmanen, Vieno Piironen, Kati Katina
6
7
8 Department of Food and Environmental Sciences, University of Helsinki, PO Box 66
9 FI-00014, Finland
10 *Corresponding author. Tel.: + 358 44 912 0811
11 E-mail address: [email protected]
12
13
14
15
16 Keywords: Propionibacterium freudenreichii; In situ fortification; Vitamin B12;
17 Wheat bran
18 1
19
1 Abbreviation: AA, Acetic Acid; CFU, Colony Forming Unit; DMBI, 5,6 -dimethylbenzimidazole; dw, dry weight; HPLC, High-Performance Liquid Chromatography; LA, Lactic Acid; LAB, Lactic Acid Bacteria; MRS, de Man, Rogosa and Sharpe; PA, Propionic Acid; PCA, Plate Count Agar; TTA, Total Titratable Acid; VRBGA, Violet Red Bile Glucose Agar; YEL, Yeast Extract Lactate; YM, Yeast Mold.

ACCEPTED MANUSCRIPT
2
20 Abstract
21 Vitamin B12 is a micronutrient naturally existing in animal products. A growing
22 interest and need to replace animal protein with plant protein sources have resulted in
23 increased attention to developing vitamin B12-fortified plant-based food. Natural
24 fortification by Propionibacterium freudenreichii is a promising alternative to
25 chemical fortification, as P. freudenreichii can synthesize active vitamin B12. In this
26 work, we studied vitamin B12 production in non-sterile matrices prepared from three
27 raw materials of wheat: durum flour, wholewheat flour and wheat bran. Viable cell
28 counts, pH, total titratable acidity and concentration of acids were determined. After
29 seven days of fermentation, vitamin B12 levels reached 33 ± 4, 87 ± 10 and 155 ± 17
30 ng/g dry weight in durum flour, wholewheat flour, and wheat bran, respectively.
31 While durum flour supported the growth of P. freudenreichii to higher cell densities
32 and more efficient propionic acid production compared with the other two matrices,
33 wholewheat flour and wheat bran were found to be the most promising of the three
34 matrices for in situ production of vitamin B12.
35
36
37
38
39
40
41
ACCEPTED MANUSCRIPT
3
42 1. Introduction
43 Vitamin B12, also known as cobalamin, has the most complex chemical structure
44 of all vitamins. Humans require it as a cofactor for two enzymes: cytoplasmic
45 methionine synthase, which is involved in nucleotide synthesis together with folate,
46 and for methylmalonyl–CoA mutase, which is important in the metabolism of odd-
47 chain fatty acids and branched amino acids (Nielsen et al., 2012). A vitamin B12
48 deficiency may result in health problems, such as megaloblastic anemia and various
49 neurological disorders (Nielsen et al., 2012). A vitamin B12 intake of 2.4 μg/day is
50 recommended for adults according to the Institute of Medicine (1998).
51 Vitamin B12 is known to be synthesized by only a few microorganisms, such as
52 Pseudomonas denitrificans, Bacillus megaterium, and Propionibacterium
53 freudenreichii (Martens et al., 2002). Foods of animal origin are still the main dietary
54 sources of vitamin B12, and without chemical supplementation or fortification due to
55 fermentation, it is not present in appreciable amounts in foods of plant-origin
56 (Watanabe, 2007). Vitamin B12 deficiency, mainly caused by inadequate dietary
57 intake or malabsorption, is reported to be a problem worldwide (Green et al., 2017).
58 Developing plant products fortified with vitamin B12 is a promising way to
59 ensure sufficient intake by people consuming limited amounts of animal products. As
60 wheat is one of the most produced and important cereals for human diet, wheat
61 products would be good candidates for delivering vitamin B12.
62 Specific strains of several Lactobacillus species have been reported to produce
63 vitamin B12 (Bhushan et al., 2017; Taranto et al., 2003). However, the few studies

ACCEPTED MANUSCRIPT
4
64 employing methods capable of distinguishing between the different B12 forms
65 indicate that Lactobacilli produce pseudovitamin B12 (Crofts et al., 2013; Santos et
66 al., 2007). Pseudovitamin B12 differs from the active B12 by the presence of adenine
67 in the place of 5, 6-dimethylbenzimidazole (DMBI) as the lower ligand and it is
68 inactive in humans (Stupperich and Nexo, 1991; Watanabe, 2007). The ability of
69 Lactobacillus strains to synthesize DMBI has not been addressed in detail yet. P.
70 freudenreichii, a bacterium with generally recognized as safe status, synthesizes
71 DMBI (Deptula et al., 2015) and produces the active form of vitamin B12 in
72 nutritionally relevant amounts, also under food-like conditions (Chamlagain et al.,
73 2016; Deptula et al., 2017a).
74 Some strains of P. freudenreichii have already been used in cereal-based food for
75 various functions, such as producing exopolysaccharides or antifungal compounds
76 (Denkova et al., 2014; Tinzl-Malang et al., 2015). Chamlagain et al. (2017) reported
77 the production of 37 ng/g (fresh weight) of active vitamin B12 by P. freudenreichii in
78 a sterilized barley-based matrix (33% w/v) after a 7-day fermentation period.
79 However, whether P. freudenreichii can produce physiologically significant amounts
80 of vitamin B12 in unsterilized cereal matrices with autochthonous microbiota is still
81 unknown. Moreover, to the best of our knowledge, there has been no published study
82 on the in situ fortification of vitamin B12 in wheat matrices.
83 The aim of this work was to study the influence of three types of wheat raw
84 materials (durum wheat flour, wholewheat flour, and wheat bran) on the in situ
85 production of vitamin B12 by P. freudenreichii. Vitamin B12 enriched cereal raw

ACCEPTED MANUSCRIPT
5
86 material could be used for several plant based foods such as bread or extruded
87 products. The acidification properties, microbial growth, and amounts of glucose and
88 riboflavin, a precursor of DMBI, were monitored to follow the metabolism of P.
89 freudenreichii during fermentation.
90 2. Materials and methods
91 2.1 Raw materials
92 Durum (Triticum durum) flour, obtained from Myllyn Paras (Hyvinkää, Finland),
93 contained 14 g protein, 69 g carbohydrates (4 g fibers), 0.7 g ash and 2 g lipids per
94 100 g. Wholewheat (Triticum aestivum) flour was obtained from Helsinki Mylly Oy
95 (Helsinki, Finland), and it contained 12 g protein, 72 g carbohydrates (12 g fibers),
96 2.1 g ash and 3 g lipids per 100 g. Wheat (T. aestivum) bran, supplied by Lantmännen
97 Cerealia AB (Malmö, Sweden), contained 14 g protein, 65 g carbohydrates (54 g
98 fibers), 7.1 g ash and 6 g lipids per 100 g.
99 2.2 Culture preparation
100 P. freudenreichii subsp. freudenreichii DSM 20271 that was cryopreserved (–
101 70C) in 15% glycerol was propagated anaerobically for 4 days on a yeast extract
102 lactate (YEL) agar (Malik et al., 1968). Three individual colonies were transferred
103 into 30 ml of YEL medium as three biological replicates and incubated at 30C. After
104 72 h, cultures were recovered by centrifugation (3,200 × g, 10 min), resuspended in
105 sterile water, and subsequently used for the inoculation of the doughs.
106 2.3 Dough preparation and fermentation
107 Three dough types were prepared by mixing MilliQ-water and flour according to

ACCEPTED MANUSCRIPT
6
108 the recipe given in Table 1. The proportions of flours were set so that the visually
109 estimated viscosity in doughs was similar. Doughs (30 g) were weighed in Falcon
110 tubes (50 ml), and triplicate tubes were prepared for each time point (days 0, 1, 3, and
111 7).
112 The doughs were inoculated with propagated cultures of P. freudenreichii, so that
113 the cell count was approximately 9.0 log colony forming units (CFU)/g of dough.
114 Since cobalt content in white flour is low in comparison to wholegrain or wheat bran
115 (Ekholm et al., 2007) and availability of cobalt is a potential limiting factor during in
116 situ production of vitamin B12, a durum dough enriched with 0.6 µg/g dry weight
117 (dw) of cobalt(II) chloride (Sigma-Aldrich, Steinheim, Germany) was also prepared.
118 In addition, control doughs of each dough type without inoculation were included in
119 the study. The tubes were incubated at 25C in shaking conditions (200 rpm;
120 Certomat) for up to 7 days. The tubes for day 7 were aseptically opened once on day 3
121 to allow air in and then closed because oxygen is required for the biosynthesis of
122 DMBI (Deptula et al., 2015). At each time point (days 0, 1, 3, and 7), an aliquot of the
123 samples was immediately taken out for the determination of viable cell counts and
124 acidification properties. The rest of the samples were stored (–20C) for vitamin B12,
125 total titratable acidity (TTA), riboflavin, glucose and acids analyses.
126 2.4 Microbial counts
127 Microbial counts were determined according to common plate count techniques
128 and using different substrates for monitoring of different microbial groups as
129 described by Coda et al. (2014) and Malik et al. (1968) with some modifications.

ACCEPTED MANUSCRIPT
7
130 Serial dilutions of doughs (10 g) were carried out in sterile saline solution (8.5 g/L of
131 NaCl) and appropriate dilutions were plated on the appropriate plate. P. freudenreichii
132 were determined on YEL plates incubated anaerobically (Anaerogen, Oxoid,
133 Basingstoke, UK) for 4 days at 30C and aerobically for at least 1 day, which leads
134 the P. freudenreichii colonies to turn brownish and distinguishable from colonies of
135 other bacteria. Presumptive LAB were enumerated on de Man, Rogosa and Sharpe
136 (MRS) agar (Lab M, Lancashire, UK) at 30°C for 48 h. Total aerobic bacteria were
137 counted on PCA agar (Lab M) incubated at 30°C for 48 h, and yeasts were cultivated
138 at 30°C for 48 h on YM agar composed of 3 g/l malt extract, 3 g/l yeast extract, 5 g/l
139 peptone, 10 g/l dextrose, and 0.01% chloramphenicol (Oxoid, Basingstoke, UK ) to
140 prevent bacterial growth. The cell counts of Enterobacteriaceae were determined on
141 VRBGA Agar (Lab M) after incubation at 37°C for 48 h. The results were expressed
142 in CFU/g of dough.
143 2.5 Acidification properties
144 The pH values were determined using a pH meter (Portamess 752 Calimatic,
145 Knick, Berlin, Germany). TTA was determined with a Mettler Toledo EasyPlus
146 Titrator (Schott, Germany). Ten grams of dough mixed in 90 ml of distilled water
147 were titrated against 0.1 M NaOH to a final pH of 8.5. TTA was expressed as the
148 volume of 0.1 M NaOH used (ml).
149 2.6 Determination of α-amylase, glucose and acids

ACCEPTED MANUSCRIPT
8
150 The activity of α-amylase in each flour was determined using an α-amylase kit
151 (Ceralpha, Megazyme Co., Ltd., Wicklow, Ireland), and the results were expressed in
152 Ceralpha units on a dry matter basis (Table 1). One unit of activity is defined as the
153 amount of enzyme required to release 1 µmol of glucose reducing-sugar equivalents
154 in 1 minute under defined conditions.
155 Doughs (1 g) were diluted 1:10 (w/v) in water and centrifuged (13,000 × g, 10
156 min). The supernatants were filtered (0.45 µm, Pall, USA) into vials. Glucose, lactic
157 acid (LA), acetic acid (AA), and propionic acid (PA) were determined using a high-
158 performance liquid chromatography (HPLC) method described in Chamlagain et al.
159 (2016), with following modifications. The analysis was performed on a Hi-Plex H
160 column (Agilent, CA, USA; 300 × 6.5 mm), with a Hi-Plex H guard column (Agilent,
161 CA, USA; 50 × 7.7 mm). The HPLC system was equipped with a Waters 515 pump,
162 autosampler, ultraviolet (UV) detector (Waters 717), and refractive index detector
163 (HP 1047A, HP, USA). The mobile phase was 10 mM H2SO4 and the flow rate was
164 set at 0.6 ml/min with the column temperature maintained at 65°C.
165 2.7 Determination of riboflavin
166 Content of riboflavin in doughs was determined with an ultra-HPLC (UHPLC)
167 method according to Chamlagain et al. (2016). In brief, doughs (1–2 g) were mixed
168 with 15 ml of 0.1 M hydrochloric acid and subjected to a boiling water extraction for
169 60 min. After cooling on ice, the pH of the extract was adjusted to 4.5 with 2.5 M
170 sodium acetate. Then, the extract was incubated (at 37C) with Taka-Diastase (50 mg;
171 Pfaltz and Bauer, CT, USA) and β-amylase (5 mg; Sigma-Aldrich) for 24 h. The
ACCEPTED MANUSCRIPT
9
172 extract was filtered (0.2 µm, Pall, USA) and analyzed on a Waters UPLC system with
173 an Acquity BEH C18 column (2.1 × 100 mm, 1.7 µm) and a Waters fluorescence
174 detector using aqueous methanol (30% v/v) containing 20 mM ammonium acetate as
175 an eluent (0.2 ml/min).
176 2.8 Determination of vitamin B12
177 Vitamin B12 was determined as cyanocobalamin in dough samples after
178 extraction and purification as presented by Chamlagain, Edelmann, Kariluoto,
179 Ollilainen and Piironen (2015) with minor modifications. In addition, the presence of
180 other corrinoids, especially pseudovitamin B12, was followed in chromatograms
181 based on the knowledge of their retention times and absorption spectra obtained in our
182 previous studies (Chamlagain et al., 2015; Chamlagain et al., 2017; Deptula et al.,
183 2017a; Deptula et al., 2015). Approximately 3 g of fermented doughs were mixed
184 with 15 ml of extraction buffer (8.3 mM sodium hydroxide and 20.7 mM acetic acid,
185 pH 4.5) containing 100 µl of sodium cyanide (1% w/v in water) and extracted in
186 boiling water for 30 min. After cooling, 300 µl of α-amylase (50 mg/ml; St Louis,
187 MO, USA) was added, and the samples were incubated in a water bath (30 min, 37C)
188 to allow the breakdown of starch before centrifugation (6,900 × g, 10 min). Residues
189 after centrifugation were suspended in 5 ml of extraction buffer and centrifuged again.
190 After combining the supernatants, the final volume was adjusted to 25 ml with the
191 extraction buffer.
192 After filtration (0.2 µm, Pall, USA), 10 ml of the extracts was purified through an
193 immunoaffinity column (Easi-Extract; R-Biopharma; Glasgow, Scotland) and

ACCEPTED MANUSCRIPT
10
194 analyzed with a Waters UHPLC system (Milford, MA, USA) equipped with a
195 photodiode array detector (at 361 nm) and an Acquity HSS T3 C18 column (2.1 × 100
196 mm, 1.8 µm). The mobile phase was a gradient flow of acetonitrile and MilliQ water
197 with 0.025% trifluoroacetic acid (0.32 ml/min) as explained by Chamlagain et al.
198 (2015). Each sample was injected twice (15 µl).
199 2.9 Reporting of results and statistical analysis
200 Contents of glucose, acids, riboflavin, and vitamin B12 were reported on a dry
201 matter basis. Statistical analysis was performed using SPSS 21.0 for Windows (IBM
202 Corporation, NY, USA). One-way analysis of variance (ANOVA) and Tukey’s post
203 hoc test were employed to determine significant differences among the samples. The
204 results were calculated based on three replicates, and the level of statistical
205 significance was defined at a p-value < 0.05.
206 3. Results
207 3.1 Acidification and microbial counts
208 Before fermentation, the pH value in the doughs ranged from 6.24 to 6.72 (Fig.
209 1A). In the first 3 days, the pH in all doughs decreased sharply. Generally, the pH in
210 the inoculated doughs were higher than those in the control doughs. On day 1, the pH
211 of the wholewheat flour dough was the highest (5.86 ± 0.02), while it was the lowest
212 in the durum flour control dough (4.63 ± 0.06). On day 3, only in wheat bran doughs
213 the pH was higher than 4.0. At the end of the fermentation, the pH of all doughs was
214 lower than 4.0; the lowest value of 3.5 was reached in the durum doughs.
215 The initial TTAs in durum flour, wholewheat flour, and wheat bran doughs were

ACCEPTED MANUSCRIPT
11
216 1.5 ± 0.2 ml, 2.7 ± 0.2 ml, and 2.9 ± 0.5 ml, respectively (Fig. 1B). During the
217 fermentation, the TTA increased, and the inoculated doughs had higher TTA levels
218 than the corresponding control doughs. The wheat bran dough had the highest TTA
219 levels, which reached 24.8 ± 0.2 ml in the inoculated dough and 23.4 ± 0.2 ml in the
220 control dough on day 7. In contrast, the durum flour control dough had the lowest
221 TTA (17.3 ± 0.1 ml) on day 7.
222 At the beginning of fermentation, the number of P. freudenreichii colony
223 forming units in the inoculated doughs ranged from 8.7 log CFU/g to 9.0 log CFU/g
224 (Table 2). After one day of fermentation the cell number of P. freudenreichii reached
225 9.6 ± 0.1 log and 9.4 ± 0.1 log CFU/g in durum flour dough and in wheat bran dough,
226 respectively, and remained approximately at the level until the end of fermentation
227 (day 7). In the wholewheat flour dough, the number of P. freudenreichii CFU
228 remained stable during the fermentation. The low initial number of LAB (< 3 log
229 CFU/g) increased to 8.6 ± 0.1 log CFU/g in wholewheat flour doughs and 9.2 log
230 CFU/g in other doughs after one day of fermentation. Similar LAB cell numbers were
231 counted in doughs with and without P. freudenreichii. In doughs of durum flour and
232 wheat bran the cell number of LAB remained stable after day 1. In wholewheat flour
233 dough with P. freudenreichii, the cell density of LAB further increased to 9.0 ± 0.1
234 log CFU/g on day 3 and remained stable after that.
235 The inoculation of P. freudenreichii had no influence on the cell numbers of
236 total aerobic bacteria, total Enterobacteriaceae, or yeasts. The cell density of the total
237 aerobic bacteria in all doughs increased from approximately 4 log CFU/g to 9 log

ACCEPTED MANUSCRIPT
12
238 CFU/g on the first day of fermentation and remained stable after that. The cell density
239 of total Enterobacteriaceae ranged from 4.5 ± 0.1 log CFU/g to 4.9 ± 0.1 log CFU/g
240 in all doughs before fermentation, and further, it grew 100-fold from days 0 to 1.
241 After day 1, the cell count of total Enterobacteriaceae decreased in all doughs, and
242 Enterobacteriaceae were not found on day 7. The initial cell density of yeasts was
243 approximately 3.8 log CFU/g in durum flour dough and less than 2 log CFU/g in the
244 other doughs. The cell count of yeasts in all doughs increased to approximately 5.0 on
245 day 1, but decreased after that and became undetectable on day 7.
246 3.2 Glucose, α-amylase activity and organic acids
247 The α-amylase activity in durum flour, wholewheat flour and wheat bran were
248 0.12 units/g, 0.19 units/g and 0.15 units/g, respectively.
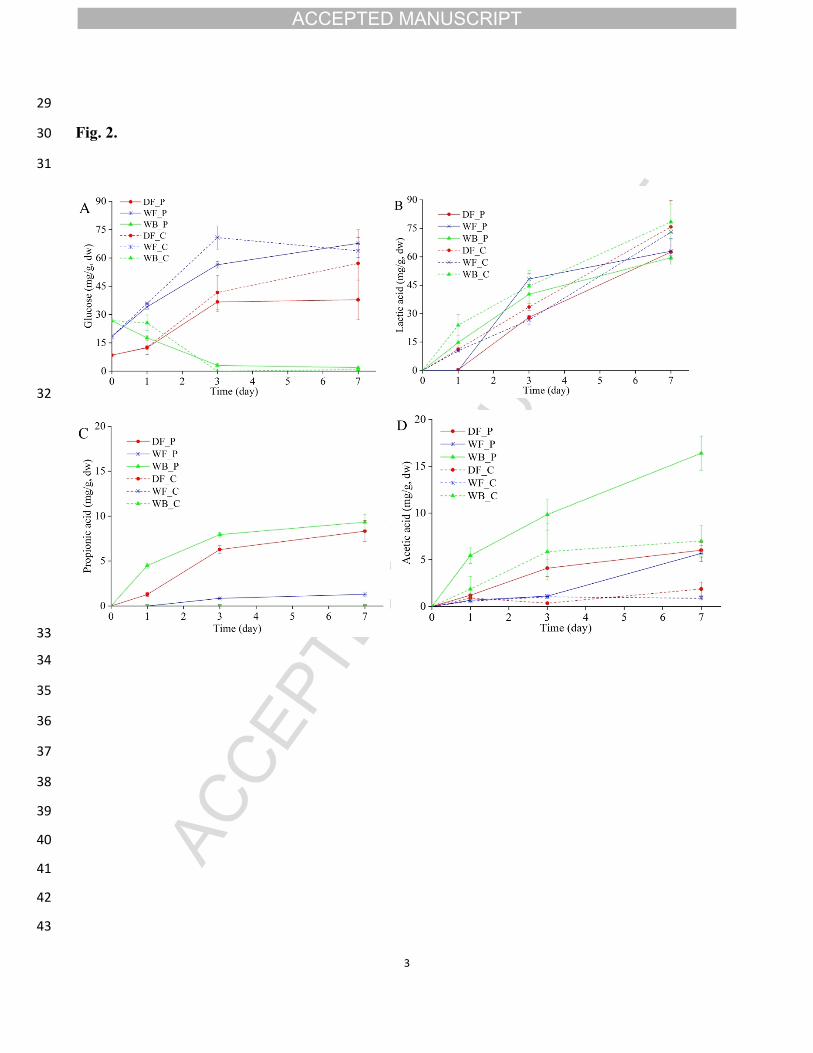
249 On day 0, the glucose contents in durum flour, wholewheat flour, and wheat bran
250 doughs were 8.5 ± 0.4 mg/g, 18.4 ± 1.2 mg/g, and 26.8 ± 1.1 mg/g dw, respectively
251 (Fig. 2A). In the bran doughs, the glucose concentrations decreased during the first 24
252 h and almost totally depleted by day 3. In contrast, the glucose level in the other
253 doughs increased considerably during fermentation. The wholewheat flour doughs
254 had a higher glucose concentration than the durum flour doughs. After fermentation,
255 67.7 ± 3.1 mg/g and 63.7 ± 3.5 mg/g dw of glucose were found in wholewheat
256 inoculated dough and wholewheat control dough, respectively.
257 Before the fermentation, no detectable levels of organic acids were found in any
258 of the doughs (Fig. 2B–D). On day 1, 11.2 ± 1.2 mg/g and 10.3 ± 0.3 mg/g dw of LA
259 were already measured in the durum and wholewheat flour control doughs,

ACCEPTED MANUSCRIPT
13
260 respectively. Notably, in the matching doughs inoculated with P. freudenreichii, the
261 LA level was < 0.5 mg/g dw. After day 1, the LA contents in these doughs increased,
262 ultimately reaching 62.5 ± 3.7 mg/g dw in durum flour and 62.9 ± 6.8 mg/g dw in
263 wholewheat flour, respectively. In the wheat bran doughs, the amounts of LA were
264 14.7 ± 1.7 mg/g and 23.8 ± 5.5 mg/g dw after 1 day, and on day 7, the levels reached
265 59.5 ± 1.2 mg/g and 78.3 ± 9.4 mg/g dw in inoculated dough and control dough,
266 respectively.
267 In the inoculated doughs, PA was detected on day 1 and increased to 8.3 ± 1.1
268 mg/g and 9.3 ± 0.9 mg/g dw in durum flour and wheat bran, respectively, by the end
269 of fermentation. In the inoculated wholewheat flour dough, PA was not detected on
270 day 1, but a level of 1.3 ± 0.2 mg/g dw was measured on day 7. AA was detected
271 from day 1 and further increased during the fermentation. Wheat bran doughs had the
272 highest concentrations of AA during fermentation, reaching up to 16.4 ± 1.8 mg/g dw
273 in the inoculated dough and 7.0 ± 1.6 mg/g dw in the control dough on day 7.
274 3.3 Riboflavin
275 At the start of fermentation, the amounts of riboflavin in the doughs of durum
276 flour and wholewheat flour were 0.18 ± 0.03 µg/g dw and 0.45 ± 0.05 µg/g dw,
277 respectively (Fig. 3). After 7-day fermentation, riboflavin concentration increased to
278 0.42 ± 0.02 µg/g dw in durum flour dough and 0.73 ± 0.03 µg/g dw in wholewheat
279 flour dough. In contrast, the riboflavin in the wheat bran dough was 1.93 ± 0.11 µg/g
280 dw at the beginning and decreased to 1.78 ± 0.07 µg/g dw on day 7.
281 3.4 Production of vitamin B12

ACCEPTED MANUSCRIPT
14
282 The UHPLC chromatograms showed that all the vitamin B12 detected in this
283 study was active B12, and no detectable level of pseudovitamin B12 was observed. In
284 the control doughs, no vitamin B12 was detected during fermentation (Table 3). In the
285 inoculated doughs, 17 ± 1 ng/g to 47 ± 6 ng/g dw of vitamin B12 was found on day 0,
286 contributed by the P. freudenreichii inoculum. By day 1, the vitamin B12 contents
287 significantly increased (p < 0.05) in the doughs inoculated with P. freudenreichii.
288 From day 1 to day 7, the vitamin B12 content in durum flour inoculated dough did not
289 increase, with a final level of 33 ± 4 ng/g dw. In inoculated durum flour dough with
290 cobalt chloride (0.6 µg/g dw) supplementation, 5.2-fold vitamin B12 (203 ± 24 ng/g
291 dw) was produced by the end of the 7-day fermentation period. On day 3, vitamin
292 B12 concentration in the inoculated wholewheat flour dough was significantly (p <
293 0.05) higher than in the inoculated durum flour dough, but without a significant (p >
294 0.05) increase afterwards (87 ± 10 ng/g dw on day 7). In inoculated wheat bran dough,
295 the concentration of vitamin B12 significantly (p < 0.05) increased from days 3 to 7
296 and reached 155 ± 17 ng/g dw at the end of fermentation.
297 4. Discussion
298 P. freudenreichii DSM 20271 was used as a starter in wheat flours and bran for a
299 7-day fermentation period to study the possibility of in situ fortification of vitamin
300 B12. The non-sterile cereal materials used in this study had various endogenous
301 microorganisms and enzymes activated during fermentation, which is required to
302 obtain full technological functionality of wheat-based raw materials but also leads to
303 rapid acidification by lactic acid bacteria. The differences in nutritional composition,

ACCEPTED MANUSCRIPT
15
304 endogenous microflora and enzyme activity among the three materials have led to
305 significantly different glucose content, microbiota, acidity, and vitamin B12 content
306 during fermentation.
307 The increase of glucose content in durum flour and wholewheat flour doughs in
308 the first 3 days was likely due to starch hydrolysis by endogenous amylases. Activities
309 of α-amylase in three matrices was measured to explain the difference of glucose
310 content among them during fermentation. A higher content of glucose was found in
311 wholewheat flour doughs than in durum flour doughs, which was not surprising given
312 its higher amylase activity (0.19 units/g vs. 0.12 units/g). However, the amylase
313 activities likely decreased in the later part of fermentation due to the drop in pH, since
314 the optimal pH of cereal amylases is in the range of 4.5–5.5 (Muralikrishna and
315 Nirmala, 2005). With a lower initial level of available carbohydrates (11 g/100g)
316 compared to the content in the other flours (60–65 g/100g), the glucose content in
317 wheat bran dough was already depleted by day 3.
318 Heterofermentative species of LAB play a central role in spontaneous
319 fermentation and dominate the microbial ecology of sourdough (De Vuyst and
320 Neysens, 2005). In the present study, a low level of endogenous LAB was detected
321 before fermentation; they already dominated after day 1 and caused intensive
322 acidification, resulting in the inhibition of yeast, total aerobic bacteria, and total
323 Enterobacteriaceae growth (Table 2). LAB are able to utilize a wide range of
324 substrates as carbon sources (Juturu and Wu, 2015). The LA content in wheat bran
325 still increased from days 3 to 7 in wheat bran doughs even though glucose was no

ACCEPTED MANUSCRIPT
16
326 longer detected.
327 Considering that P. freudenreichii exhibits a slow growth rate (Falentin et al.,
328 2010), an inoculation level of approximately 9.0 log CFU/g of P. freudenreichii DSM
329 20271 was used in this study. It has been suggested that growth of LAB could be
330 stimulated by propionic acid bacteria due to the consumption of LA and the
331 stimulatory effect of fatty acids produced by propionic acid bacteria (Smid and
332 Lacroix, 2013). In this study, a stimulatory effect of P. freudenreichii on LAB growth
333 was not observed in durum and wholewheat flour doughs. The stimulation of LAB
334 growth by P. freudenreichii, however, could be observed in the inoculated
335 wholewheat flour dough where the viable cell count of LAB was higher than in the
336 corresponding control dough on day 3 (ca. 9.0 log CFU/g and 8.5 log CFU/g,
337 respectively). Influence of the P. freudenreichii starter on the growth of other
338 microbial groups was not observed.
339 P. freudenreichii grew to higher cell densities in durum flour dough compared to
340 the other doughs in the first day of fermentation. However, the cell densities did not
341 increase from day 1 to 7, possibly due to the unfavorable pH for P. freudenreichii
342 (Deptula et al., 2017b). In the wholewheat flour dough, P. freudenreichii did not grow
343 despite a sufficient carbon source and favorable pH on day 1. In the wheat bran
344 dough, P. freudenreichii grew to lower cell density than in durum flour dough. No
345 growth of P. freudenreichii in wholewheat and growth to lower cell densities in wheat
346 bran doughs than in durum flour dough may be due to the presence of some P.
347 freudenreichii inhibiting components or endogenous microorganisms in the wheat

ACCEPTED MANUSCRIPT
17
348 bran layer. For instance, it has been shown that flavonoids in buckwheat bran had
349 antibacterial activities against Propionibacterium (Cutibacterium) acnes (Wang et al.,
350 2013). However, to the best of our knowledge, there is no published information
351 available about P. freudenreichii inhibiting factors from wheat.
352 P. freudenreichii metabolizes LA as the preferred carbon source in cheese
353 fermentation to produce PA and AA as the main metabolites (Lee et al., 1974). In this
354 study, LA contents were lower in inoculated doughs than they were in corresponding
355 control doughs, indicating that P. freudenreichii consumed LA produced during the
356 fermentation. Since in control doughs PA amounts remained below detection limit, P.
357 freudenreichii starter is the likely source of PA in inoculated doughs. In this study, the
358 production of PA did not increase after day 3, which was likely due to the formation
359 of an acidic environment (pH < 4). In contrast, the AA contents still increased from
360 day 3 to 7 in all inoculated dough types, potentially produced by both P.
361 freudenreichii and LAB.
362 No vitamin B12 was detected in the control doughs, showing that vitamin B12
363 was only synthesized by inoculated P. freudenreichii. In an optimized medium
364 supplemented with cobalt and DMBI, vitamin B12 production depended on cell yield
365 (Hugenschmidt et al., 2011). In the present study, the lowest production of vitamin
366 B12 and the highest cell yield of P. freudenreichii was observed in the durum flour
367 dough. In contrast, a more than 2-fold level of production of vitamin B12 was evident
368 in wholewheat flour doughs, while no increase in the cell number of P. freudenreichii
369 was observed. In wheat bran doughs, about a 5-fold level of vitamin B12 content was

ACCEPTED MANUSCRIPT
18
370 detected, with lower growth compared to those in durum flour dough. These results
371 can partly be explained by the higher content of cobalt in wheat bran: ca. 0.1 µg/g dw
372 compared to white flour ca.< 0.01 µg/g dw (Ekholm et al., 2007), since cobalt is a
373 limiting factor for vitamin B12 production by P. freudenreichii during fermentation
374 (Berry and Bullerman, 1966; Hugenschmidt et al., 2011). Notably, in durum flour
375 dough with added cobalt (0.6 µg/g, dw), more than 200 ng/g dw of vitamin B12 (vs.
376 ca. 33 ng/g dw without cobalt) was produced by P. freudenreichii.
377 In this study, the vitamin B12 produced during fermentation was composed of the
378 active form, with DMBI as a lower ligand (data not shown). Given that no
379 supplements were added, the DMBI in the biosynthesized vitamin was likely derived
380 from de novo biosynthesis by P. freudenreichii. Riboflavin has been demonstrated to
381 be the precursor for the de novo biosynthesis of DMBI in the presence of oxygen in P.
382 freudenreichii (Hollriegl et al., 1982). Furthermore, riboflavin could be used together
383 with nicotinamide to enhance production of vitamin B12 with some P. freudenreichii
384 strains and a significant positive correlation was observed when comparing riboflavin
385 consumption with B12 production (Chamlagain et al., 2016). The higher riboflavin
386 content in wheat bran (ca. 1.93 µg/g dw) and wholewheat flour (ca. 0.45 µg/g dw)
387 than in durum flour (ca. 0.18 µg/g dw) may partly explain the higher levels of vitamin
388 B12 produced in these matrices. In addition, riboflavin can be synthesized by P.
389 freudenreichii and certain LAB, such as Lactobacillus plantarum, Lactobacillus
390 lactis, Lactobacillus fermentum and Leuconostoc mesenteroides, commonly retrieved
391 from flour and sourdough microflora (Burgess et al., 2009; Capozzi et al., 2011;
ACCEPTED MANUSCRIPT
19
392 Russo et al., 2014). Moreover, some strains of LAB isolated from wheat sourdough
393 were used to enhance the riboflavin content of sourdough and pasta (Capozzi et al.,
394 2011; Russo et al., 2014). In our study, content of riboflavin significantly increased
395 during fermentation in doughs of durum flour and wholewheat flour but not in wheat
396 bran dough (Figure 3). This difference may be due to a distinct microbiota of the
397 flours and bran or riboflavin synthesized by the inoculated P. freudenreichii in each
398 dough types. Furthermore, whether riboflavin is a factor for enhancing the production
399 of vitamin B12 in non-sterile wheat materials should be confirmed in future studies.
400 Bran is the main byproduct of the milling process, which is underutilized for food
401 purposes due to its negative effect on the rheological or sensory quality of products
402 (Prückler et al., 2014). However, the use of bran in food products has been increasing
403 recently due to its high levels of dietary fiber, good quality proteins, and many other
404 beneficial substances. Furthermore, some promising bioprocessing techniques have
405 been proposed to improve the technological and nutritional quality of bran (Coda et
406 al., 2015). In the present study, bran and bran-containing flour were confirmed as
407 potential substrates for plant-based vitamin B12 fortification. These fermented
408 vitamin B12-containing matrices could be used, e.g., in bread baking or in other food
409 products. According to a recent study (Edelmann et al., 2016), in situ synthesized
410 vitamin B12 was as stable as cyanocobalamin, the most stable form of vitamin B12, in
411 baking processes. No significant loss was observed in straight/sponge-dough
412 processes, whereas a loss of only 23% was reported in sourdough baking (Edelmann
413 et al., 2016). In this study, around 150 ng/g dw of vitamin B12 was synthesized in

ACCEPTED MANUSCRIPT
20
414 fermented wheat bran dough by P. freudenreichii. If in straight-dough baking, 20% of
415 wheat flour was replaced with B12-rich wheat bran, four slices of bread (120 g)
416 would contain the recommended daily intake of vitamin B12 (2.4 µg). Furthermore,
417 process optimization measures, such as adjusting the pH and adding ingredients with
418 higher amounts of cobalt (e.g., yeast extract and buckwheat leaf flour; (Grembecka
419 and Szefer, 2006), could be studied to enhance the production of vitamin B12 in
420 wheat materials with P. freudenreichii.
421 5. Conclusion
422 In previous studies, vitamin B12 production in sterilized cereal matrices has been
423 reported. However, this study demonstrated that nutritionally significant amounts of
424 vitamin B12 can be produced in non-sterile wheat doughs by P. freudenreichii.
425 Different wheat ingredients are thus promising option for in situ fortification of plant-
426 based food with vitamin B12. The higher vitamin B12 production in bran and
427 wholewheat flour suggests that outer layers of wheat grain might contain more
428 potential precursors and other factors for vitamin B12 synthesis than white wheat
429 flour. However, a safe use of these wheat matrices for B12 production requires
430 controlling endogenous microbiota with appropriate co-culture fermentation.
431 Acknowledgements
432 Chong Xie acknowledges the China Scholarship Council for its financial support of
433 this work.
434 References435 Berry, E.C., Bullerman, L.B., 1966. Use of cheese whey for vitamin b12 436 production .2. Cobalt precursor and aeration levels. Applied Microbiol. 14, 356-357.437 Bhushan, B., Tomar, S.K., Chauhan, A., 2017. Techno-functional differentiation of

ACCEPTED MANUSCRIPT
21
438 two vitamin B12 producing Lactobacillus plantarum strains: an elucidation for 439 diverse future use. Appl. Microbiol. Biotechnol. 101, 697-709.440 Burgess, C.M., Smid, E.J., van Sinderen, D., 2009. Bacterial vitamin B2, B11 and 441 B12 overproduction: An overview. Int. J. Food Microbiol. 133, 1-7.442 Capozzi, V., Menga, V., Digesu, A.M., De Vita, P., van Sinderen, D., Cattivelli, L., 443 Fares, C., Spano, G., 2011. Biotechnological production of vitamin B2-enriched bread 444 and pasta. J. Agric. Food. Chem. 59, 8013-8020.445 Chamlagain, B., Deptula, P., Edelmann, M., Kariluoto, S., Grattepanche, F., Lacroix, 446 C., Varmanen, P., Piironen, V., 2016. Effect of the lower ligand precursors on vitamin 447 B12 production by food-grade Propionibacteria. LWT - Food Sci. Technol. 72, 117-448 124.449 Chamlagain, B., Edelmann, M., Kariluoto, S., Ollilainen, V., Piironen, V., 2015. 450 Ultra-high performance liquid chromatographic and mass spectrometric analysis of 451 active vitamin B12 in cells of Propionibacterium and fermented cereal matrices. Food 452 Chem. 166, 630-638.453 Chamlagain, B., Sugito, T., Deptula, P., Edelmann, M., Kariluoto, S., Varmanen, P., 454 Piironen, V., 2017. In situ production of active vitamin B12 in cereal matrices using 455 Propionibacterium freudenreichii. Food Sci. Nutr. 00, 1-10.456 Coda, R., Karki, I., Nordlund, E., Heinio, R.L., Poutanen, K., Katina, K., 2014. 457 Influence of particle size on bioprocess induced changes on technological 458 functionality of wheat bran. Food Microbiol. 37, 69-77.459 Coda, R., Katina, K., Rizzello, C.G., 2015. Bran bioprocessing for enhanced 460 functional properties. Curr. Opin. Food Sci 1, 50-55.461 Crofts, T.S., Seth, E.C., Hazra, A.B., Taga, M.E., 2013. Cobamide structure depends 462 on both lower ligand availability and CobT substrate specificity. Chem Biol 20, 1265-463 1274.464 De Vuyst, L., Neysens, P., 2005. The sourdough microflora: biodiversity and 465 metabolic interactions. Trends Food Sci. Technol. 16, 43-56.466 Denkova, R., Ilieva, S., Denkova, Z., Georgieva, L., Yordanova, M., Nikolova, D., 467 Evstatieva, Y., 2014. Production of wheat bread without preservatives using 468 sourdough starters. Biotechnol. Biotechnol. Equip. 28, 889-898.469 Deptula, P., Chamlagain, B., Edelmann, M., Sangsuwan, P., Nyman, T.A., Savijoki, 470 K., Piironen, V., Varmanen, P., 2017a. Food-Like Growth Conditions Support 471 Production of Active Vitamin B12 by Propionibacterium freudenreichii 2067 without 472 DMBI, the Lower Ligand Base, or Cobalt Supplementation. Frontiers in microbiology 473 8, 368.474 Deptula, P., Kylli, P., Chamlagain, B., Holm, L., Kostiainen, R., Piironen, V., 475 Savijoki, K., Varmanen, P., 2015. BluB/CobT2 fusion enzyme activity reveals 476 mechanisms responsible for production of active form of vitamin B12 by 477 Propionibacterium freudenreichii. Microbial Cell Factories 14, 186.478 Deptula, P., Laine, P.K., Roberts, R.J., Smolander, O.P., Vihinen, H., Piironen, V., 479 Paulin, L., Jokitalo, E., Savijoki, K., Auvinen, P., Varmanen, P., 2017b. De novo 480 assembly of genomes from long sequence reads reveals uncharted territories of 481 Propionibacterium freudenreichii. BMC Genomics 18, 790.
ACCEPTED MANUSCRIPT
22
482 Edelmann, M., Chamlagain, B., Santin, M., Kariluoto, S., Piironen, V., 2016. Stability 483 of added and in situ-produced vitamin B12 in breadmaking. Food Chem. 204, 21-28.484 Ekholm, P., Reinivuo, H., Mattila, P., Pakkala, H., Koponen, J., Happonen, A., 485 Hellström, J., Ovaskainen, M.-L., 2007. Changes in the mineral and trace element 486 contents of cereals, fruits and vegetables in Finland. J. Food Compos. Anal. 20, 487-487 495.488 Falentin, H., Deutsch, S.M., Jan, G., Loux, V., Thierry, A., Parayre, S., Maillard, 489 M.B., Dherbecourt, J., Cousin, F.J., Jardin, J., Siguier, P., Couloux, A., Barbe, V., 490 Vacherie, B., Wincker, P., Gibrat, J.F., Gaillardin, C., Lortal, S., 2010. The complete 491 genome of Propionibacterium freudenreichii CIRM-BIA1, a hardy actinobacterium 492 with food and probiotic applications. PLoS One 5, e11748.493 Green, R., Allen, L.H., Bjorke-Monsen, A.L., Brito, A., Gueant, J.L., Miller, J.W., 494 Molloy, A.M., Nexo, E., Stabler, S., Toh, B.H., Ueland, P.M., Yajnik, C., 2017. 495 Vitamin B12 deficiency. Nat. Rev. Disease Primers 3, 17040.496 Grembecka, M., Szefer, P., 2006. Mineral Components in Food Crops, Beverages, 497 Luxury Food, Spices, and Dietary Food, Mineral Components in Foods. CRC Press, 498 pp. 231-322.499 Hollriegl, V., Lamm, L., Rowold, J., Horig, J., Renz, P., 1982. Biosynthesis of 500 vitamin-b12 - different pathways in some aerobic and anaerobic microorganisms. 501 Arch. Microbiol. 132, 155-158.502 Hugenschmidt, S., Schwenninger, S.M., Lacroix, C., 2011. Concurrent high 503 production of natural folate and vitamin B12 using a co-culture process with 504 Lactobacillus plantarum SM39 and Propionibacterium freudenreichii DF13. Process 505 Biochem. 46, 1063-1070.506 Institute of Medicine, 1998. Dietary reference intakes for thiamin, riboflavin, niacin, 507 vitamin B6, folate, vitamin B12, pantothenic acid, biotin, and choline. . National 508 Academy Press, Washington, D.C.509 Juturu, V., Wu, J.C., 2015. Microbial production of lactic acid: the latest 510 development. Crit. Rev. Biotechnol. 36, 967-977.511 Lee, I.H., Fredrick.Ag, Tsuchiya, H.M., 1974. Diauxic growth of propionibacterium-512 shermanii. Applied Microbiol. 28, 831-835.513 Malik, A.C., Reinbold, G.W., Vedamuthu, E.R., 1968. An evaluation of taxonomy of 514 propionibacterium. Can. J. Microbiol. 14, 1185-1191.515 Martens, J.H., Barg, H., Warren, M.J., Jahn, D., 2002. Microbial production of 516 vitamin B12. Appl. Microbiol. Biotechnol. 58, 275-285.517 Muralikrishna, G., Nirmala, M., 2005. Cereal α-amylases—an overview. Carbohydr. 518 Polym. 60, 163-173.519 Nielsen, M.J., Rasmussen, M.R., Andersen, C.B., Nexo, E., Moestrup, S.K., 2012. 520 Vitamin B12 transport from food to the body's cells--a sophisticated, multistep 521 pathway. Nat. Rev. Gastroenterol. Hepatol. 9, 345-354.522 Prückler, M., Siebenhandl-Ehn, S., Apprich, S., Höltinger, S., Haas, C., Schmid, E., 523 Kneifel, W., 2014. Wheat bran-based biorefinery 1: Composition of wheat bran and 524 strategies of functionalization. LWT - Food Sci. Technol. 56, 211-221.525 Russo, P., Capozzi, V., Arena, M.P., Spadaccino, G., Dueñas, M.T., López, P.,

ACCEPTED MANUSCRIPT
23
526 Fiocco, D., Spano, G., 2014. Riboflavin-overproducing strains of Lactobacillus 527 fermentum for riboflavin-enriched bread. Appl. Microbiol. Biotechnol. 98, 3691-3700.528 Santos, F., Vera, J.L., Lamosa, P., de Valdez, G.F., de Vos, W.M., Santos, H., Sesma, 529 F., Hugenholtz, J., 2007. Pseudovitamin B(12) is the corrinoid produced by 530 Lactobacillus reuteri CRL1098 under anaerobic conditions. FEBS Lett. 581, 4865-531 4870.532 Smid, E.J., Lacroix, C., 2013. Microbe–microbe interactions in mixed culture food 533 fermentations. Curr. Opin. Biotechnol. 24, 148-154.534 Stupperich, E., Nexo, E., 1991. Effect of the cobalt-N coordination on the cobamide 535 recognition by the human vitamin B12 binding proteins intrinsic factor, 536 transcobalamin and haptocorrin. Eur. J. Biochem. 199, 299-303.537 Taranto, M.P., Vera, J.L., Hugenholtz, J., De Valdez, G.F., Sesma, F., 2003. 538 Lactobacillus reuteri CRL1098 Produces Cobalamin. J. Bacteriol. 185, 5643-5647.539 Tinzl-Malang, S.K., Rast, P., Grattepanche, F., Sych, J., Lacroix, C., 2015. 540 Exopolysaccharides from co-cultures of Weissella confusa 11GU-1 and 541 Propionibacterium freudenreichii JS15 act synergistically on wheat dough and bread 542 texture. Int. J. Food Microbiol. 214, 91-101.543 Wang, L., Yang, X., Qin, P., Shan, F., Ren, G., 2013. Flavonoid composition, 544 antibacterial and antioxidant properties of tartary buckwheat bran extract. Ind. Crops 545 Prod. 49, 312-317.546 Watanabe, F., 2007. Vitamin B12 sources and bioavailability. Exp. Biol. Med. 232, 547 1266-1274.548549550551552553554555556557558559560561562563564565566567568569

ACCEPTED MANUSCRIPT
24
570 Table 1 Ingredients and yields of doughs.
Sample
code
Substrate Flour
(g)
Water
(g)
Dough
yieldc
Starter
DF_Pa Durum flour 9 21 333 P. freudenreichii
DF_P+Cob Durum flour 9 21 333 P. freudenreichii
DF_C Durum flour 9 21 333 -
WF_P Wholewheat flour 9 21 333 P. freudenreichii
WF_C Wholewheat flour 9 21 333 -
WB_P Wheat bran 6 24 500 P. freudenreichii
WB_C Wheat bran 6 24 500 -
571 a P means doughs inoculated with Propionibacterium freudenreichii; C means control
572 doughs.
573 b DF_P +Co= durum flour dough with addition of P. freudenreichii and 0.6 µg/g dw
574 of cobalt chloride.
575 c Dough yield is represented as the amount of dough prepared from 100 parts of flour.
576
577
578
579
580
581
582

ACCEPTED MANUSCRIPT
25
583 Table 2. Microbial counts of Propionibacteria (PAB) on YEL plate, presumptive
584 lactic acid bacteria (LAB) on MRS plate, total aerobic bacteria on PCA plate, total
585 Enterobacteriaceae on VRBGA plate and yeasts on YM plate (log cfu/g). The results
586 are expressed as the mean ± standard deviation (n=3).
587 * “Inoculated” denotes doughs inoculated with Propionibacterium freudenreichii;
588 “Control” refers to doughs without inoculation.
589 ** nd = not detected.
590 DF = durum flour; WF = wholewheat flour; WB = wheat bran.
591 Values from the same day and microbial group bearing different superscripts (a–c) are
592 significantly different (p < 0.05).
Day 0 Day 1 Day 3 Day 7Inoculated* Control Inoculated Control Inoculated Control Inoculated Control
PABDF 8.7±0.0 a <2.0 9.6±0.1 c <2.0 9.6±0.1 c <2.0 9.5±0.1 c <2.0WF 8.7±0.1 a <2.0 8.7±0.1 a <2.0 8.7±0.0 a <2.0 8.6±0.1 a <2.0WB 9.0±0.0 b <2.0 9.4±0.1 b <2.0 9.2±0.1 b <2.0 9.2±0.1 b <2.0
Presumptive LABDF <3.0 <3.0 9.2±0.0 b 9.2±0.0b 8.8±0.0ab 8.7±0.1ab 8.4±0.1 a 8.5±0.2 a
WF <3.0 <3.0 8.6±0.1 a 8.6±0.2a 9.0±0.1 b 8.5±0.1 a 9.0±0.1 b 8.7±0.2ab
WB <3.0 <3.0 9.2±0.1 b 9.3±0.1b 9.2±0.1 c 9.1±0.1bc 9.0±0.1 b 9.0±0.1 b
Total aerobic bacteriaDF 3.6±0.1 b 3.6±0.1b 9.2±0.1 b 9.2±0.1b 8.9±0.2ab 9.1±0.1 b 8.5±0.1 a 8.3±0.1 a
WF 3.3±0.1a 3.3±0.1a 8.8±0.1 a 8.8±0.1a 8.9±0.1ab 8.6±0.3 a 9.0±0.1 b 8.8±0.2 b
WB 3.4±0.1 a 3.4±0.1a 9.3±0.1 b 9.2±0.1b 9.1±0.1 b 9.2±0.1 b 9.0±0.1 b 8.8±0.1 b
Total EnterobacteriaceaeDF 4.9±0.0 b 4.9±0.0b 6.8±0.1ab 6.6±0.1a <2.0 <2.0 nd** ndWF 4.5±0.1 a 4.5±0.1a 7.3±0.1 c 7.4±0.1c 5.3±0.1 b 5.2±0.2 b nd ndWB 4.5±0.1 a 4.5±0.1a 6.9±0.0 b 6.8±0.1ab 4.1±0.1 a 4.1±0.0 a nd nd
YeastsDF 3.8±0.0 3.8±0.0 4.3±0.1 a 4.3±0.0a <2.0 <2.0 nd ndWF <2.0 <2.0 4.8±0.1 b 4.9±0.2b <2.0 <2.0 nd ndWB <2.0 <2.0 5.3±0.0 c 5.3±0.1c <2.0 <2.0 nd nd

ACCEPTED MANUSCRIPT
26
593 Table 3. Vitamin B12 concentration (ng/g, dw) during fermentation. The results are
594 expressed as the mean ± standard deviation (n=3).
595 * “Inoculated” denotes doughs inoculated with Propionibacterium freudenreichii;
596 “Control” refers to doughs without inoculation.
597 ** Not studied.
598 *** nd = not detected.
599 DF = Durum flour; DF + Co = durum flour dough with addition of 0.6 µg/g dw cobalt
600 chloride; dw = dry weight; WF = wholewheat flour; WB = wheat bran.
601 Values in the same row (w–z) and same column (a–d) bearing different superscripts
602 are significantly different (p < 0.05).
603
604605606
Time(d) 0 1 3 7Inoculated*
DF 19±2aw 37±1 ax 40±3ax 33±4 ax
DF+Co 17±1aw -** - 203±24dx
WF 17±2aw 34±3 ax 78±8 by 87±10 by
WB 47±6bw 81±8 bx 114±5 cy 155±17cz
ControlDF nd*** nd nd ndWF nd nd nd ndWB nd nd nd nd

ACCEPTED MANUSCRIPT
1
1 Figure legends
2 Fig. 1. Changes in pH value (A) and total titratable acidity (TTA) (B) during fermentation. Values are
3 the means and standard deviations of three replicates. DF_P = durum flour dough with
4 Propionibacterium freudenreichii; WF_P = wholewheat flour dough with P. freudenreichii; WB_P =
5 wheat bran dough with P. freudenreichii. DF_C= durum flour control dough; WF_C = wholewheat flour
6 control dough; WB_C = wheat bran control dough.
7
8 Fig. 2. Concentration (mg/g, dry matter) of glucose (A), lactic acid (B), propionic acid (C) and acetic
9 acid (D) during fermentation. Values are means and standard deviations of 3 replicates. DF_P = durum
10 flour dough with P. freudenreichii; WF_P = wholewheat flour dough with P. freudenreichii; WB_P =
11 wheat bran dough with P. freudenreichii. DF_C = durum flour control dough; WF_C = wholewheat flour
12 control dough; WB_C = wheat bran control dough.
13
14 Fig. 3 Concentration (µg/g, dry matter) of riboflavin in inoculated doughs at day 0 and day 7. Values are
15 means and the error bar represents the range of the values from two biological replicates.
16
17
18
19
20
21
22
23

ACCEPTED MANUSCRIPT
2
24 Fig. 1.
25
26
27
28
ACCEPTED MANUSCRIPT
3
29
30 Fig. 2.
31
32
33
34
35
36
37
38
39
40
41
42
43

ACCEPTED MANUSCRIPT
4
44 Fig. 3.
45

ACCEPTED MANUSCRIPT
Highlights:
Non-sterile wheat matrices maybe used for in situ production of vitamin B12.
P. freudenreichii produced physiologically relevant amounts of vitamin B12.
Wheat bran allowed higher production of vitamin B12 than other flours.
Bran layer possibly contains precursors for vitamin B12 biosynthesis.