in-situ from large mainshock. - … · three large intraplate earthquakes near tennant creek, ......
TRANSCRIPT

BMR Journal of Australian Geology & Geophysics, 12,339- 343 © Commonwealth of Australia 1991
Three large intraplate earthquakes near Tennant Creek, Northern Territory, on 22 January 1988 T.D. Jones1,2, G. Gibson3, KF. McCue!, D. Denham!, P.J. Gregson4, & J.R. Bowman5
Following a yearlong series of fore shocks, extensive surface faulting accompanied an extraordinary sequence of earthquakes in the Precambrian shield of central Australia on 22 January 1988. The mainshock sequence included earthquakes of magnitude Ms 6.3, 6.4, and 6.7. Hundreds of aftershocks were recorded in the epicentral area in the first few days after the mainshocks, and the sequence continued into 1991 ; the largest aftershock occurred nearly 9 hours after the third large mainshock.
The three largest earthquakes were felt over more than one-quarter of the land surface of Australia, and in high-rise buildings up to 2000 km
Introduction The 1988 Bicentennial Australia Day holiday weekend will be long remembered by residents of Tennant Creek, in the North•ern Territory, for a series of strong earthquakes which began on Friday 22 January. Three mainshocks of magnitude Ms 6.3, 6.4, and 6.7 occurred on Friday at 10.06 a.m., 1.27 p.m., and 9.35 p.m. local time (or 0036, 0357, and 1205 UTC; Table 1). They were followed by a sequence of aftershocks, of which the largest - magnitude Ms 5.3 - happened at 6.24 a.m. local time the following day (or 2054 UTC on 22 January).
Table 1. Hypocentral details of the four largest earthquakes at Tennant Creek on 22 January 1988* Time (UTe) Latitude oS Longitude °E Depth (km) Ms/ML 0036 01.0 19.81 (± 0.02) 133.98 (± 0.06) 6 (± 4) 6.3 0357 28.5 19.83 (± 0.02) 133.98 (± 0.05) 4 (± 3) 6.4 1205 00.6 19.84 (± 0.02) 133.99 (± 0.03) 5 (± 3) 6.7 2054 05.6 19.89 (± 0.02) 134.08 (± 0.15). 3 (± 2) 5.3 * Hypocentres from the Australian Seismological Centre; magnitudes from the US Geological Survey.
There is no historical record of nearby activity before 11 February 1986, when an earthquake of magnitude ML 4.1 occurred. This was followed in January 1987 by a swarm of over 150 events, of which four caused minor damage in the town. The epicentres of the January 1987 events, located with a three•station field network and the Warramunga Seismic Array (WRA; only 40 km to the east), were about 35 km southwest of the town, in the same area as the 1988 events. Activity continued at a low level throughout 1987.
Surface faulting accompanying the 1988 earthquake sequence was evident on two main scarps trending east-southeast with a total length of about 32 km (Fig. 1). The southern block was
I Australian Seismological Centre, Bureau of Mineral Resources, Geology and Geophysics, GPO Box 378, Canberra, ACT 2601. 2 Current mailing address: Mineral Resources Department, Private Mail Bag, Suva, Fiji. 3 Seismology Research Centre, Phillip Institute of Technology, Bundoora, Victoria 3083. 4 Mundaring Geophysical Observatory, Mundaring, Western Aus•tralia 6073. 5 Australian Seismological Centre, Bureau of Mineral Resources, Geology and Geophysics, GPO Box 378, Canberra, ACT 2601 ; for•merly Research School of Earth Sciences, Australian National Univer•sity, Canberra, ACT.
from the epicentre. A buried natural-gas pipeline was shortened by 1 m at the surface rupture, and buildings in the town of Tennant Creek, 30 km to the north-northeast, sustained minor damage.
Focal mechanism solutions indicate thrusting for the first and third large earthquakes, and a combination of thrust and strike-slip motion for the second. Ground deformation and offsets along roads, fences , and the pipeline also indicate mainly thrust-faulting. The mean azi•muth of the P-axes for the first three focal mechanisms is N31°E, in close agreement with the maximum principal stress direction determined from in-situ stress measurements made in a nearby gold mine.
~ Dip-slip } fa~1ri~; . and -=. Strike-slip throw fm) •
--50- Bouguer lJravity anomaly (p.ms-2)
0
\ • 0-50 19°50'
~_IOO
• _150---• .~ • .' • • •• 4 • • ~ km
,T" • • • (a) " ..
A , Sca rp B C Scarp' D 0
\ • j j • • • • .. ••
.~
(bd , , I 10 Distallcet km) Di, 1allce (km ) 24/E53_14/1_1
Figure 1a. Map of surface faulting produced by the earthquakes of 22 January 1988. Selected hypocentres (those most accurately located) from 1987 are shown by white symbols, and from 1988 and 1989 by black symbols. Circles indicate depth less than 5 km, and diamonds depth greater than that. Small symbols are for magnitudes less than 4.5, and large symbols for magnitudes greater than or equal to 4.5 . Symbols for the four largest earthquakes on 22 January 1988 are represented by the numbers 1-4 (see Table 1). Figure lb. Projection of hypocentres onto vertical cross-sections AB and CD normal to the western and eastern limbs of the Lake Surprise scarp respectively.
thrust over the northern block, except in the area where the surface faulting was east-northeast; here the mechanism was reversed - that is, northern block over southern. Uplifts of the order of 1 m were common.
Within 24 hours of the mainshocks, three of the authors (GG, TJ, and JRB) began to deploy a ten-station field network of seismographs and accelerographs, and hundreds of aftershocks
340 T.D. JONES & OTHERS
were recorded. Surveyors mapped the scarps and associated structures, and relevelled along lines surveyed in the early 1970s for BMR's gravity and magnetic traverses (Hone, 1974; Bul•lock, 1977).
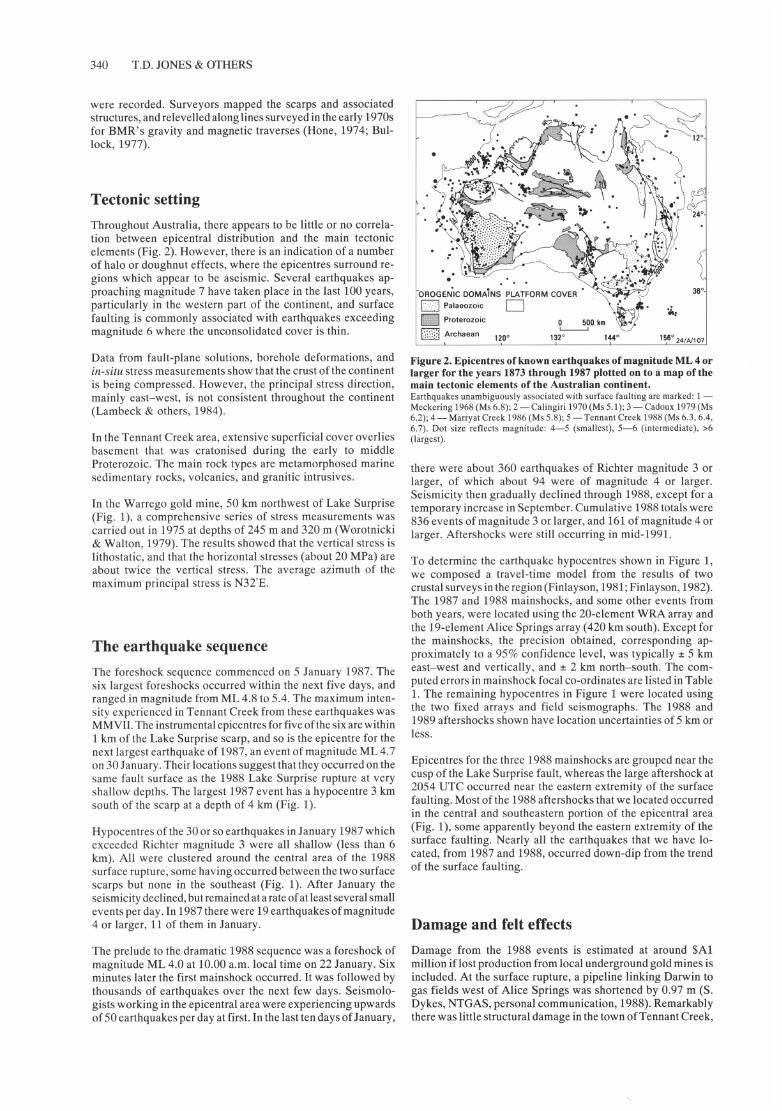
Tectonic setting Throughout Australia, there appears to be little or no correla•tion between epicentral distribution and the main tectonic elements (Fig. 2). However, there is an indication of a number of halo or doughnut effects, where the epicentres surround re•gions which appear to be aseismic. Several earthquakes ap•proaching magnitude 7 have taken place in the last 100 years, particularly in the western part of the continent, and surface faulting is commonly associated with earthquakes exceeding magnitude 6 where the unconsolidated cover is thin.
Data from fault-plane solutions, borehole deformations, and in-situ stress measurements show that the crust of the continent is being compressed. However, the principal stress direction, mainly east-west, is not consistent throughout the continent (Lambeck & others, 1984).
In the Tennant Creek area, extensive superficial cover overlies basement that was cratonised during the early to middle Proterozoic. The main rock types are metamorphosed marine sedimentary rocks, volcanics, and granitic intrusives.
In the Warrego gold mine, 50 km northwest of Lake Surprise (Fig. 1), a comprehensive series of stress measurements was carried out in 1975 at depths of 245 m and 320 m (Worotnicki & Walton, 1979). The results showed that the vertical stress is litho static, and that the horizontal stresses (about 20 MPa) are about twice the vertical stress. The average azimuth of the maximum principal stress is N32'E.
The earthquake sequence The foreshock sequence commenced on 5 January 1987. The six largest foreshocks occurred within the next five days, and ranged in magnitude from ML 4.8 to 5.4. The maximum inten•sity experienced in Tennant Creek from these earthquakes was MMVII. The instrumental epicentres for five of the six are within 1 km of the Lake Surprise scarp, and so is the epicentre for the next largest earthquake of 1987, an event of magnitude ML 4.7 on 30 January. Their locations suggest that they occurred on the same fault surface as the 1988 Lake Surprise rupture at very shallow depths. The largest 1987 event has a hypocentre 3 km south of the scarp at a depth of 4 km (Fig. 1).
Hypocentres of the 30 or so earthquakes in January 1987 which exceeded Richter magnitude 3 were all shallow (less than 6 km). All were clustered around the central area of the 1988 surface rupture, some having occurred between the two surface scarps but none in the southeast (Fig. 1). After January the seismicity declined, but remained at a rate of at least several small events per day. In 1987 there were 19 earthquakes of magnitude 4 or larger, 11 of them in January.
The prelude to the dramatic 1988 sequence was a foreshock of magnitude ML 4.0 at 10.00 a.m. local time on 22 January. Six minutes later the first mainshock occurred. It was followed by thousands of earthquakes over the next few days. Seismolo•gists working in the epicentral area were experiencing upwards of 50 earthquakes per day at first. In the last ten days of January,
'OROGEN'IC DOMAiNS PLATFORM COVER D Palaeozoic
D Proterozoic
Eill Archaean
D
120 0 132 0
A,
1440 156° 2' / A/I07
Figure 2. Epicentres of known earthquakes of magnitude ML 4 or larger for the years 1873 through 1987 plotted on to a map of the main tectonic elements of the Australian continent. Earlhquakes unambiguously associated with surface faulting are marked: 1-Meckering 1968 (Ms 6.8) ; 2-Calingiri 1970(Ms5.1); 3 - Cadoux 1979 (Ms 6.2); 4 - Marryat Creek 1986 (Ms 5.8); 5 - Tennant Creek 1988 (Ms 6.3, 6.4, 6.7). Dot size reflects magnitude: 4-5 (smallest), 5-6 (intermediate), >6 (largest).
there were about 360 earthquakes of Richter magnitude 3 or larger, of which about 94 were of magnitude 4 or larger. Seismicity then gradually declined through 1988, except for a temporary increase in September. Cumulative 1988 totals were 836 events of magnitude 3 or larger, and 161 of magnitude 4 or larger. Aftershocks were still occurring in mid-1991.
To determine the earthquake hypocentres shown in Figure 1, we composed a travel-time model from the results of two crustal surveys in the region (Finlayson, 1981; Finlayson, 1982). The 1987 and 1988 mainshocks, and some other events from both years, were located using the 20-element WRA array and the 19-element Alice Springs array (420 km south). Except for the mainshocks, the precision obtained, corresponding ap•proximately to a 95% confidence level, was typically ± 5 km east-west and vertically, and ± 2 km north-south. The com•puted errors in mainshock focal co-ordinates are listed in Table 1. The remaining hypocentres in Figure 1 were located using the two fixed arrays and field seismographs. The 1988 and 1989 aftershocks shown have location uncertainties of 5 km or less.
Epicentres for the three 1988 mainshocks are grouped near the cusp of the Lake Surprise fault, whereas the large aftershock at 2054 UTC occurred near the eastern extremity of the surface faulting. Most of the 1988 aftershocks that we located occurred in the central and southeastern portion of the epicentral area (Fig. 1), some apparently beyond the eastern extremity of the surface faulting. Nearly all the earthquakes that we have lo•cated, from 1987 and 1988, occurred down-dip from the trend of the surface faulting.
Damage and felt effects Damage from the 1988 events is estimated at around $A1 million if lost production from local underground gold mines is included. At the surface rupture, a pipeline linking Darwin to gas fields west of Alice Springs was shortened by 0.97 m (S. Dykes, NTGAS, personal communication, 1988). Remarkably there was little structural damage in the town of Tennant Creek,

INTRAPLATE EARTHQUAKES NEAR TENNANT CREEK, NT 341
30 km from the surface rupture; walls were cracked in well constructed buildings, objects fell off shelves, and furniture was shifted.
The three largest earthquakes were felt over a large area of the Australian continent. The first two, at 10.06 a.m. and 1.27 p.m. local time, were felt in high-rise buildings in Perth (2200 km to the west of the epicentre), Adelaide (1600 km to the south), and Cairns (1250 km to the east). They were so close together that a combined isoseismal map was prepared (Fig. 3). The highest intensity reported was MMVIII at the western end of the sur•face faulting, where a full 150 000 L water tank was destroyed by one of the events. The MMIII isoseismal encompasses an area of 1.8 million km2•
Unfortunately, responses for information on the third (largest) earthquake were not as numerous as for the first two, and its isoseismal map is not as well constrained. The radii of the isoseismals were significantly larger for the third event, 425 km and 625 km for the Vand IV isoseismals respectively. These radii are similar to those of the 1941 Meeberrie earthquake, Western Australia, the largest known onshore Australian earthquake.
Focal mechanisms Preliminary focal mechanisms (Fig. 4) were obtained from an inspection of regional long-period seismograms and from long•period P-wave arrivals listed in the Earthquake Data Report (USGS, 1988). We used the relative amplitude of the first P•wave arrival to indicate qualitatively which stations were near•nodal. Both the first and third earthquakes have simple thrust mechanisms with a southwest-dipping fault plane (chosen from field observations). The dip of this plane is constrained by the polarity of arrivals at MUN, NWAO, and ASP, and is greater for the first earthquake, 55°, than for the third, 36°. The second nodal plane for these earthquakes is poorly controlled, but is constrained for each one by the near-nodal arrival at CTAO.
125'
Kununurraz I ° / c3
o ! / !O "( I 4 3
Halls C,,,k3 i 4 4 30 (OC4 3\ ~ ~ I ! 3 4 (Tennant Creek:7 ... 4 5 i ! V1l8~j I \
\
~I VI q - V 4 If i 555 4 ; • 45 • 3
Mtl•a J I 54 /4 c 3 0
\ \ .'4 4 /V ~ 1311~3 ! 4 4~5 4 /IS /1
Gi/ .. "- L ~. Sprongs Ie ;3 II 'o~ 1c5 I 3 3 3 / 3
r.--.-....;:------ NT J.--: 0 _ 23---~~ L o SA - --C!.o---_
o 0 i o i
0 0 0 0 i 0° /
'" EPICENTRE ;
15"
25 '
IV ZONE INTENSITY DESIGNATION • EARTHOUAKE FELT(MM) 0 500 km o EARTHQUAKE NOT FELT
,--NsVr-•/ • 2'/ A/I03
Figure 3. Combined isoseismal map for the first and second mainshocks on 22 January 1988, at 0036 UTC and 0357 UTe.
Our mechanism for the second earthquake comprises approxi•mately equal elements ofthrust and lateral slip. The nodal plane striking N700E is well constrained by data which differ from those of the first and third earthquakes. The first motion at PMG was up and near-nodal, station LEM was near-nodal, and CTAO was not. This nodal plane corresponds with the surface faulting observed along the western limb of the Lake Surprise scarp, which is a combination of left-lateral strike-slip and north-over•south thrusting. Other authors differ in their analysis of the mechanism for this earthquake. The moment-tensor and fault•plane solutions of the USGS (1988) are similar to our solution, but the Harvard (in USGS, 1988) and McCaffrey (1989) solu•tions have nearly identical thrust mechanisms for all three earthquakes, and Choy & Bowman (1990) assign the dominant moment release to slip on a southeast-dipping fault plane .
A fault-plane solution for the largest aftershock (at 2054 UTC) was determined from short-period data. It indicates a strike-slip mechanism with the left-lateral nodal plane paralleling the trend of faulting.
The three largest earthquakes have an average principal stress direction of N31 'E, which is in close agreement with the meas•urements taken in 1975 at Warrego mine.
Crustal deformation and fault geometry The surface expression of faulting comprised two main scarps (Fig. 1). Relative vertical movement of blocks adjacent to the scarps was apparent over an area of more than 100 km2• Scarp morphology was typically a gradual step in the alluvium, ex•tending 100 m or more across strike.
General compression of the crust in a north-northeasterly direction was indicated by offsets along fences and roads, and tensional cracks in soil, at this azimuth along all portions of the scarps; these indicators of compression had an en echelon
3
N
(~';8' ) , " "
\ lEM ~ PMG o \ 1'/"..\ •• TpJB,13) \
-:>~, + \ " . , MAW CTAO MUN co ••• I
NWAO .......... ....... ,. I 0....... I ASP AOC----I-
P (22 0,091 I
N
P /031 ,10)
-----}- - " II1i.sBt ~ ..... I .. ' . \ . \ of + \ • /160,76) \ • ~ e. \.. ,. /"'''''<,., •• ~' ...... --
2
4
N
-::.\ ~\ . ';;',\ "i - • -- \. .... . . . . \ . ",/' \' + /."'0' \
/~,\~. '.. I / 0 \ ,
o \
o ~, ",
(203,04 )
N
I" I....~
o. //~
o ~o .......... ·eilT! .................. + fi-- __ _ ~/· o. • I •
I •• I I (158,00) ~T'
o o
•
24/A/ l 08
Figure 4. Focal mechanisms of the four largest earthquakes on 22 January 1988. Numbers 1-4 correlate with those in Table 1. Black circles = compression; white circles = dilatation; P and T are the principal and least stress axes; azimuth and dip of plane or axis are indicated in parentheses.
342 T.D. JONES & OTHERS
arrangement on the western limb of the Lake Surprise fault. Hence, most of the surface faulting (all of the faulting trending east-southeasterly) was almost pure thrusting, with some evi•dence of minor left-lateral strike-slip; along the eastern limb of the Lake Surprise fault, the southern block was high. In con•trast, along the east-northeasterly trending western limb of the Lake Surprise fault, the northern block was upthrust, and there was a much stronger left-lateral strike-slip component.
Two trenches, 3 m deep, were excavated across the scarp near the shortened pipeline, and the fault plane was clearly seen, apparently dipping south at 20-25'. In shallow trenches dug elsewhere (A. Camacho, US Geological Survey, personal com•munication, 1988), the Kunayungku fault segment was also seen to dip to the south-southwest. However, near the western end of the Lake Surprise fault, a trench showed a north-dipping fault plane.
Aftershock hypocentres confirm the fault geometry observed at the surface (Fig. 1; Bowman & others, 1990). We projected our best-located 1988 hypocentres (uncertainties less than 2 km and good azimuthal control) onto sections normal to the scarps: section AB with hypocentres between the two scarps, and sec•tion CD with hypocentres south of the Lake Surprise scarp. Section CD, in the east, depicts a fault surface dipping to the south-southwest at about 35° to a depth of 8 km. By contrast, section AB shows that the western limb has a fault surface with opposed dip direction, dipping to the north-northwest at 55-60' to about the same depth. Bowman & others (1990) identified a surface dipping to the south-southwest at up to 45° to a depth of about 6 km on the Kunayungku scarp.
The rupture at 0036 UTC appears to have begun near the cusp of the Lake Surprise fault, and propagated mainly northwest. The easterly extent of this propagation is limited by the account of Mr Kevin Holt of NTGAS, who observed no damage to the gas pipeline before the second mainshock. Therefore, the maximum length of rupture for this earthquake is the distance from the pipeline to the western end of the Kunayungku scarp, 22 km.
The second mainshock, at 0357 UTC, originated near the first at a preferred depth of 3 or 4 km, which is similar to that of the largest 1987 earthquake. We suggest that this second earth•quake fractured the western limb of the Lake Surprise fault, because its mechanism conforms with the observed faulting along this segment. We further suggest that the fracture was bilateral, extending to both limbs of the Lake Surprise fault and involving rupture on two fault surfaces of opposing dip - to the south-southwest and north-northwest. Therefore we regard the Lake Surprise scarp as essentially continuous, although com•plicated at its cusp . The complexity of this rupture would account for the variety of published focal mechanisms. It is not known if this fracture propagated across the pipeline.
The third (largest) event, at 1205 UTC, originated at a preferred depth of 5 km on the south-southwesterly dipping eastern limb near the first two earthquakes. We propose that the extent of its fracture included all of the southeastern fault surface; it almost certainly broke across the pipeline. If past Australian earth•quakes are any guide, this one was large enough to have frac•tured or refractured the entire fault trace of 32 km. The similar•size 1968 Meckering earthquake (Fig. 2) had a surface fault 37 km long.
The surface faulting parallels isogals which define a local positive gravity anomaly, whose peak is between the Kunayungku and western Lake Surprise scarps (Fig. 1). Bul-
lock (1977) postulated a dense body at a depth of 1.2 km to model the peak of the anomaly, but conceded that a body with a lesser density contrast could reach the surface. The body responsible for the anomaly is clearly shallow enough to have affected the style of faulting, and might reach the surface in places. One such place is the westernmost 4 km of the Lake Surprise fault, coinciding with an exposed quartz ridge, where the fracture has reactivated a dislocation surface of unknown age presumably contained within the anomalous body.
Implications for intraplate risk analysis Several attempts have been made to delineate earthquake risk in Australia (McEwin & others, 1976; others listed in Gaull & others, 1990). These were based on the location of past earth•quakes and on local geology to define the source zones. Two of the last six large-earthquake sequences since 1968 occurred outside recognised seismic zones: at Marryat Creek, South Australia, on 30 March 1986 (Ms 5.8; Fig. 2; McCue & others, 1987), and at Tennant Creek. When the whole continent is treated as a single-source zone, a statistical risk analysis results in negligibly small risk throughout. This is untenable, but, until the causes of intraplate seismicity are understood, it is impos•sible to predict whether the next large earthquake will also occur outside one of the mapped zones.
Acknowledgements We are indebted to Dennis Foran, John Grant, Alan Mainwaring, and Robert Pitman at the Warramunga Seismic Array; to NTGAS; to Tony Corke (Seismology Research Centre) and Harry Reith (BMR) for their valuable field support; and to Robyn Johnston, Christian Thun, and Malcolm Heath (BMR), who located many of the earthquakes. Bruce Presgrave (US Geo•logical Survey) provided the preliminary data for focal mecha•nisms. Larry Hollands and Natasha Kozin (BMR) drafted the figures. Arch Johnston (Memphis State University) and an anonymous reviewer helped improve the paper.
References Bowman, J.R. , Gibson, G. , & Jones, T.D., 1990 - Aftershocks of the
January 22,1988 Tennant Creek, Australia intraplate earthquakes: evidence for a complex thrust fault geometry. Geophysical Journal International, 100, 87-97.
Bullock, P.W.B., 1977 - Tennant Creek gravity and magnetic survey, Northern Territory, 1972. Bureau of Mineral Resources, Australia, Record 1977/30.
Choy, G.L., & Bowman, J.R., 1990 - Rupture process of a multiple main shock sequence: analysis of teleseismic, local, and field observations of the Tennant Creek, Australia, earthquakes of January 22, 1988.Journal of Geophysical Research, 95, B5, 6867-6882.
Finlayson, D.M., 1981 - Reconnaissance of upper crustal seismic velocities in the Tennant Creek Block, Northern Territory. BMR Journal of Australian Geology & Geophysics, 6, 245-252.
Finlayson, D.M., 1982 - Seismic crustal structure of the Proterozoic north Australian craton between Tennant Creek and Mount Isa. Journal of Geophysical Research, 87, B13, 10569-10578.
Gaull, B.A., Michael-Leiba, M.O., & Rynn, J.M.W., 1990 -Probabilistic earthquake risk maps of Australia. Australian Jour•nal of Earth Sciences, 35, 169-187.

INTRAPLATE EARTHQUAKES NEAR TENNANT CREEK, NT 343
Hone, I.G. , 1974 - Ground geophysical survey, Tennant Creek, Northern Territory, 1972. Bureau of Mineral Resources, Australia, Record 1974/171.
Lambeck, K. , McQueen, H.W.S., Stephenson, R.A., & Denham, D., 1984 - The state of stress within the Australian continent.Annales Geophysicae, 2, 723-74l.
McCaffrey, R., 1989 - Teleseismic investigations of the January 22, 1988 Tennant Creek, Australia, earthquakes. Geophysical Re•search Letters, 16(5),413-416.
McCue, K.F. , Barlow, B.C., Denham, D., Jones, T., Gibson, G., & Michael-Leiba, M., 1987 - Another chip off the old Australian
block. £OS, Transactions of the American Geophysical Union , 68(26), 609-612.
McEwin, A. , Underwood, R. , & Denham, D., 1976 - Earthquake risk in Australia. BMR Journal of Australian Geology & Geophysics, 1, 15-2l.
USGS (United States Geological Survey), 1988 - Earthquake Data Report, 1988 (2), pp. 154-160, 162-166, 168-169.
Worotnicki, G. , & Walton, R.I ., 1979 - Virgin rock stress measure•ments at the Warrego mine . CSIRO, Division of Applied Geomechanics, Technical Report 93 .