in situ measurements of aerosol mass concentration and ...zli/east-aire/east-aire_in_situ_zc.pdf ·...
TRANSCRIPT

1
2
3
4 5 6 7 8 9
10 11 12 13 14 15 16 17 18 19 20 21 22 23 24 25 26 27 28 29 30 31 32 33 34 35 36 37 38 39 40 41
In Situ Measurements of Aerosol Mass Concentration
and Radiative Properties in Xianghe, SE of Beijing
Zahra Chaudhry1,2, J. Vanderlei Martins3,4, Zhanqing Li1,2,5, Si-Chee Tsay4, Hongbin Chen5, Weidong Nan5, Tianxue Wen5, Can Li1, Russell R. Dickerson1
1) Department of Atmospheric and Oceanic Science University of Maryland
College Park, MD 2) Earth System Science Interdisciplinary Center
University of Maryland College Park, MD
3) Department of Physics and Joint Center for Earth Systems and Technology University of Maryland-Baltimore County
Baltimore, MD 4) NASA Goddard Space Flight Center
Greenbelt, MD 5) Institute of Atmospheric Physics
Chinese Academy of Sciences Beijing, China
Submitted to
Journal of Geophysical Research-Atmosphere
A special issue on
East Asian Study of Tropospheric Aerosols: An International Regional Experiment
(EAST-AIRE)

Abstract 42 43 44
45
46
47
48
49
50
51
52
53
54
55
56
57
58
59
60
61
62
As a part of the EAST-AIRE study, Nuclepore filters were collected in two size ranges
(coarse, 2.5µm<d<10µm, and fine, d<2.5µm) from January-May 2005 in Xianghe, about
70 km southeast of Beijing and analyzed for aerosol mass concentration, spectral
absorption efficiency and absorption coefficient. Twelve-hour aerosol mass
concentration measurements showed an average concentration of 120 µg/m3 in the coarse
mode, and an average concentration of 25 µg/m3 in the fine mode. To determine how
representative ground-based measurements are of the total column, the mass
concentration data was compared with AERONET AOT at 500nm and AERONET size
distribution data. The vertical distribution of the aerosols were studied with a micro-
pulse lidar and in the cases where the vertical column was found to be fairly
homogenous, the comparisons of the filter results with AERONET agreed favorably,
while in the cases of inhomogeneity, the comparisons have larger disagreement. For fine
mode aerosols, the spectral absorption efficiency compares favorably to a λ-1 model,
while the coarse mode shows a much flatter spectral dependence, consistent with large
particle models. The coarse mode absorption efficiency was compatible with that of the
fine mode in the NIR region, indicating the much stronger absorption of the coarse mode
due to its composition and sizeable mass. Single scattering albedo results are presented
from a combination between absorption coefficients derived from the filter
measurements, from a PSAP and from a three-wavelength Nephelometer.

63 64
65
66
67
68
69
70
71
72
73
74
75
76
77
78
79
80
81
82
83
84
85
86
1. Introduction
According to the IPCC [2001], our ability to quantify the direct effect of aerosols on the
global climate is hindered severely by large uncertainties in the measurements of aerosol
absorption. Both the sign and magnitude of the forcing at the top of the atmosphere is
dictated by aerosol absorption, loading and surface albedo [Coakley and Chylek, 1975].
Rarely are such pure aerosol types found in the atmosphere, as they are generally
mixtures of different types, which further increases the complexity of quantifying the
effect that aerosols have on local and regional climate [Jacobson, 2000]. Further
knowledge is needed on both aerosol composition and vertical distribution.
Various instruments such as the Integrating Plate [Lin et al., 1973], Particle/Soot
Absorption Photometer (PSAP, Radiance Research, Seattle, WA), Aethalometer [Hansen
et al., 1983] and other filter-based measurements have been used to gain data on aerosol
absorption. In cases where the vertical distribution of aerosols is fairly uniform, ground-
based measurements are able to represent the optical properties of aerosols in the total
column with little uncertainty. This is highly desirable as ground-based measurements
are relatively easy to acquire, cost-effective and can offer good spatial and temporal
resolution.
Remote sensing techniques such as satellites, lidar instruments and the Aerosol Robotic
Network, AERONET [Holben et al., 1998], are better at measuring the total column of
aerosols, and for gathering data on the vertical profile of aerosol optical properties.
Passive satellite remote sensing also offers excellent spatial coverage, but depending on

the vertical structure of the atmosphere, it has problems providing the aerosol
concentration near the ground. Lidar measurements from space provide good assessment
of the vertical distribution of aerosols and clouds but have significantly less spatial
coverage than the passive instruments (eg. CALIPSO, Winker et al. [2003], GLAS,
Zwally et al. [2002]). The drawback of column mean values is that they can mean very
little to near-surface absorption if large concentrations of aerosols are aloft in higher
layers. Besides, collecting aerosol samples on the ground level also has advantage of
studying their impact on health as aerosols are a known health risk.
87
88
89
90
91
92
93
94
95
96
97
98
99
100
101
102
103
104
105
106
107
108
109
The rapid population and economic growth seen in China over the last few decades has
had strong effects on the local and regional air quality and climate. The increase in
manufacturing and demand for products has led to serious air quality concerns. Several
intensive studies have been conducted recently to examine the transport of air masses
from the region over the Pacific such as ACE-Asia [Huebert et al., 2003] and INTEX-
NA. EAST-AIRE takes a closer look at the physical, optical and chemical properties of
aerosols across China through a series of ground-based observation stations [Z. Li et al.,
this issue]. One particular site, Xianghe, was chosen to host an Intensive Observation
Campaign (IOC) during March 2005, when many instruments measuring the same
parameters were run side-by-side to calibrate newer instruments against well-used and
well-characterized instruments, as well as to ensure accurate measurements across
various levels of resolution. The measurement site is detailed in C. Li et al. [this issue].
For aerosol absorption, six instruments were run during this time period: 2 PSAPs, 3
Aethalometers and one sampling apparatus for collecting Nuclepore filters. This study
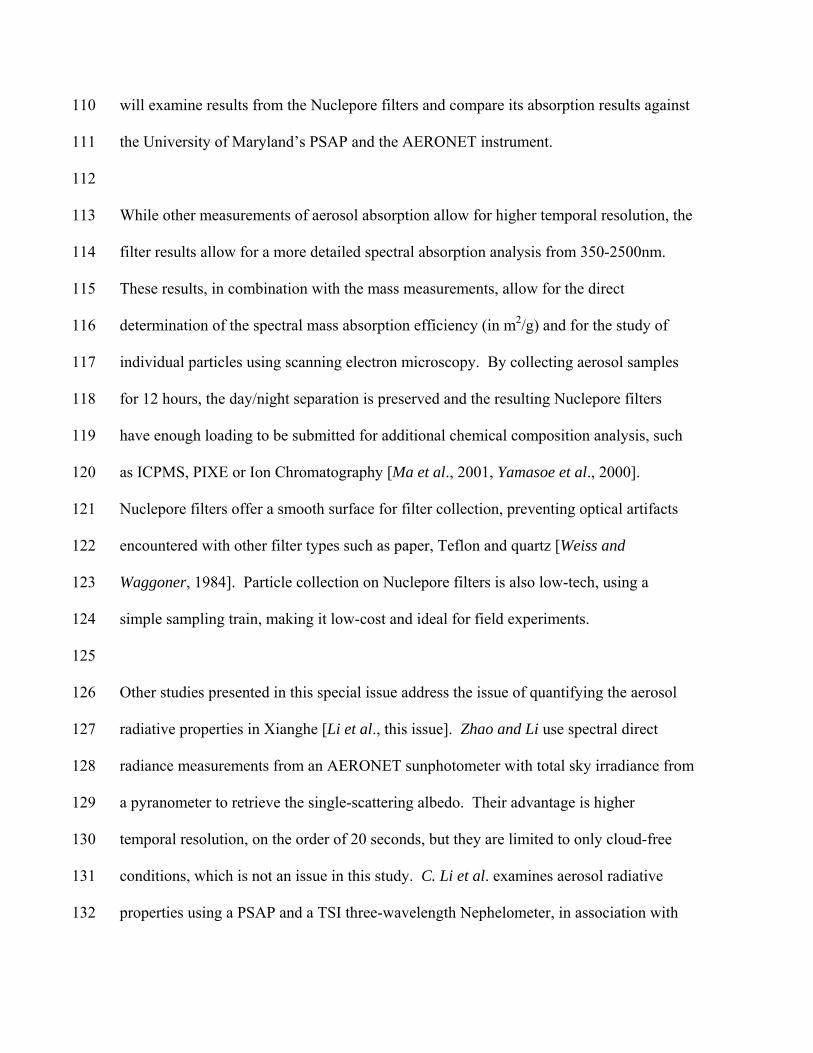
will examine results from the Nuclepore filters and compare its absorption results against
the University of Maryland’s PSAP and the AERONET instrument.
110
111
112
113
114
115
116
117
118
119
120
121
122
123
124
125
126
127
128
129
130
131
132
While other measurements of aerosol absorption allow for higher temporal resolution, the
filter results allow for a more detailed spectral absorption analysis from 350-2500nm.
These results, in combination with the mass measurements, allow for the direct
determination of the spectral mass absorption efficiency (in m2/g) and for the study of
individual particles using scanning electron microscopy. By collecting aerosol samples
for 12 hours, the day/night separation is preserved and the resulting Nuclepore filters
have enough loading to be submitted for additional chemical composition analysis, such
as ICPMS, PIXE or Ion Chromatography [Ma et al., 2001, Yamasoe et al., 2000].
Nuclepore filters offer a smooth surface for filter collection, preventing optical artifacts
encountered with other filter types such as paper, Teflon and quartz [Weiss and
Waggoner, 1984]. Particle collection on Nuclepore filters is also low-tech, using a
simple sampling train, making it low-cost and ideal for field experiments.
Other studies presented in this special issue address the issue of quantifying the aerosol
radiative properties in Xianghe [Li et al., this issue]. Zhao and Li use spectral direct
radiance measurements from an AERONET sunphotometer with total sky irradiance from
a pyranometer to retrieve the single-scattering albedo. Their advantage is higher
temporal resolution, on the order of 20 seconds, but they are limited to only cloud-free
conditions, which is not an issue in this study. C. Li et al. examines aerosol radiative
properties using a PSAP and a TSI three-wavelength Nephelometer, in association with

many precursor gases measurements. Data from C. Li et al. is used in this study as a
comparison with the filter measurements, and for the calculation of the average single
scattering albedo throughout the filter sampling period. While the PSAP provides higher
temporal resolution data than collecting filters, no upper-end cut-off was used, possibly
skewing the results with large particles.
133
134
135
136
137
138
139
140
141
142
143 144
145
146
147
148
149
150
151
152
153
154
155
In this study, we present results of five months of data sampling in Xianghe, China.
Mass concentration measurements are presented in two size categories (coarse and fine)
and compared with AERONET size distribution and AOT. The spectrally-dependent
absorption efficiency is measured and the absorption coefficient is calculated.
2. Methodology
A two-stage sampling apparatus was installed at Xianghe, China in January, 2005 to
collect aerosol particles on Nuclepore filters. The system has an impactor inlet ensuring
a 10µm aerodynamic diameter cut-off size and the impactor was coated with Apiezon
grease to reduce particle bounce. The first filter collected particles larger than 2.5µm
(hereafter referred to as the coarse mode) and the second filter collected particles less
than 2.5µm aerodynamic diameter (hereafter referred to as the fine mode). Size-resolved
filters were collected twice daily up to and through the IOC (January-March) and
collected once daily for the next two months (April and May), with a few breaks due to
instrument or supply-related problems. From January through March, the filters were
changed between 6-7am in the morning and between 7-8pm in the evening. The initial
flow through the filters was set at 18 lpm manually and only filters with a final flow of

greater than 8 lpm were analyzed. The instantaneous flow rate was recorded in a data
logger and utilized in data analysis to correct for flow changes during the sampling.
156
157
158
159
160
161
162
163
164
165
166
167
168
169
170
171
172
173
174
175
176
177
178
The filters were subjected to gravimetric analysis prior to and after field deployment.
Blank filters were sent to the field amongst the exposed filters and were treated similarly
to monitor the whole process. The filters were exposed to an ionizer for 24 hours prior to
weighing to remove static charge and to ensure an accurate weight measurement. The
humidity in the ionizing chamber was recorded for each cycle and maintained around
20%. The humidity of the weighing room was also recorded at around 40%. The
difference in humidity was determined not to affect the particles on the filters. Since the
particle were collected at a variety of humidity levels, but analyzed dry, the higher
humidity of the weighing room was not great enough to rehumidify the particles.
According to meteorological data at the measurement site in Xianghe, the local humidity
level stayed relatively low, averaging 36% during the IOC [C. Li et al., this issue].
After gravimetric analysis, the filters were subjected to an optical reflectance (OR)
technique previously applied in Martins et al. [1998], validated against an extinction cell
and Nephelometer measurements in Reid et al. [1998] and described in detail in Martins
et al. [2006]. Since the aerosol particles were collected on the surface of Nuclepore
filters, we expect less optical artifacts with this method than with particles collected
inside the fibers of quartz, Teflon or paper filters. The filter is placed on a diffusive
Spectralon panel and illuminated from above. The amount of light reflected is measured
from 350nm to 2500nm by an ASD (Analytical Spectral Devices) LabSpec Pro

spectrometer, with radiometric stability of 1% and precision of approximately 3% [Kindel
et al., 2001]. By passing light through the particles and reflecting the light off the filter
and the Lambertian surface below, we are essentially mimicking the same method used
by satellite sensors with the advantage that we can characterize well the bright surface
underneath the particles. Blank filters were also placed on top of the Spectralon panel
and measured as a reference for the reflectance method. A calibration curve using
artificial black carbon particles with known optical properties and a variety of mass
loading is presented in Martins et al. [2006].
179
180
181
182
183
184
185
186
187
188
189
190
191
192
193
194
195
196
197
198
199
200
201
The light attenuation by absorbing particles and the mass concentration are used to
determine the spectral absorption efficiency (m2/g). The spectral absorption efficiency
can be combined with the mass concentration measurement (µg/m3) to obtain the
absorption coefficient (m-1). The absorption coefficient was calculated from the filters by
utilizing the OR absorption efficiency at 550nm and was compare with PSAP results at
574nm, which was operated in parallel with the filter sampling apparatus. The 550nm
wavelength was chosen to compare with the three-wavelength Nephelometer used during
the IOP. Data from the University of Maryland’s PSAP was obtained corresponding to
the IOP at 5-minute intervals, corrected according to Bond et al. [1999], and extrapolated
to 550nm following Virkkula et al. [2005]. The University of Maryland’s instruments are
detailed in C. Li et al. [this issue]. Since the filters were collected over approximately 12-
hour intervals, the PSAP data was averaged over the same time period as the
corresponding filter. The PSAP average was also weighted according to the flow through
the filter to account for the decrease in flow throughout the sampling period. This

procedure ensured that both instruments sampled the aerosols similarly. This same
process of averaging and weighting was applied to data obtained from the University of
Maryland’s three-wavelength TSI Nephelometer. The Single Scattering Albedo (ω
202
203
204
205
206
207
208
209
210 211
212
213
214
215
216
217
218
219
220
221
222
223
224
225
0) was
calculated using the absorption coefficient from the PSAP and from the OR and the
scattering coefficient from the Nephelometer at 550nm. The PSAP and Nephelometer
were deployed on the same observatory tower as the filter sampling apparatus, but they
did not include an upper-limit cut-off size like the 10µm inlet used for the filters [C. Li et
al., this issue].
3. Results and Discussion
3.1 Mass concentration
The mass concentration of the particles was determined by gravimetric analysis and by
the measured air volume sampled in each filter. The mass concentration of the coarse
particles (2.5µm<d<10µm) from January 13-May 24, 2005 is shown in figure 1a. During
this time period, values ranged from 8 to 407 µg/m3 in the coarse mode with an average
concentration of 120 µg/m3. The mass concentration of the fine particles (d<2.5µm) is
shown in figure 1b, where the values ranged from 10 to 79 µg/m3 with an average
concentration of 25 µg/m3. Other studies to measure aerosol mass concentration in China
have found similar results. Bergen et al. [2001] measured daily mean PM2.5
concentrations of 136 µg/m3 with a standard deviation of 48 µg/m3 during one week in
June 1999 in Beijing, which expectedly shows higher concentrations than at Xianghe,
which is in a relatively rural location. Also in Beijing, Ning et al. [1996] measured total

suspended particle (TSP) concentrations of 320 µg/m3 in the summer and 680 µg/m3 in
the winter during two years of measurements in 1986 and 1987. In another Chinese city,
Shanghai, Ye et al. [2003] measured weekly PM2.5 mass concentrations ranging between
21 µg/m
226
227
228
229
230
231
232
233
234
235
236
237
238
239
240
241
242
243
244
245
246
247
3 and 147 µg/m3 at two locations, with an annual average of 57.9 µg/m3 and 61.4
µg/m3 at each site, from March 1999 through February 2000. Shi et al. [2003] chose a
suburban location, Nankou, a town 45km northwest of central Beijing to study mass
concentration, similar to this study. The authors measured PM2.5 mass concentrations of
177 ± 53 µg/m3 and PM10 mass concentrations of 334 ± 96 µg/m3 during one week in
March of 2001.
From the mass concentration data during the IOC, which were separated in 12 hour day
and night samples, a 24-hour average was calculated for PM2.5 and PM10. For the filter
results, PM10 is defined as the sum of the fine and coarse filter, which will account for
all particles of d< 10µm. The 24-hour IOC PM10 and PM2.5 results are shown in figure
2. To place the data in perspective, they are compared with the US EPA National
Ambient Air Quality Standards (NAAQS). The 24-hour average NAAQS limit for
PM2.5 (35 µg/m3) and for PM10 (150 µg/m3) are shown in the plot. The PM2.5 limit
was exceeded once during the IOC, at an average concentration of 35.4 µg/m3 on March
10, 2005. The PM10 limit, however, was breached on 67% of the days of the IOC, and
on those days, averaged 47% greater concentrations than the NAAQS limit. Over the
five-month sampling period, the PM2.5 limit was exceeded 13% of the days, and the
PM10 limit was exceeded 43% of the days. While PM10 is considered to be a lesser

health risk than PM2.5, the respiratory problems, the visibility reduction, and the weather
and climate impacts that arise from high concentrations of PM10 are still a valid concern.
248
249
250
251
252
253
254
255
256
257
258
259
260
261
262
263
264
265
266
267
268
269
270
In addressing the aerosol radiative forcing of the climate and health issues related to
aerosol pollution, a major challenge remains as to how well the total column-mean
properties of the aerosol retrieved from the ground (e.g. AERONET, Holben et al.
[1998], Smirnov et al. [2000], Smirnov et al. [2003]) or from satellites (e.g. MODIS,
Kaufman et al. [1997], Remer et al. [2002], Ichoku et al. [2002], Chu et al. [2002])
represent the mass concentration measurements or other observed aerosol properties at
the ground level, or vice versa. The answer to this question has very important
implications on the monitoring of aerosols from space and important practical
implications on the development of observation networks. The existence of aged versus
fresh aerosol particles, or long-range transport of different aerosol types (e.g. dust
transported over pollution aerosols), or any other source of inhomogeneity in the vertical
aerosol distribution throughout the atmospheric column can affect this relationship. This
possibility must be studied in different location and on a case by case basis.
One way to compare the ground-based filter measurements to total column remote
sensing is to look at AERONET-based retrievals of aerosol particle size distribution.
Note that the size distribution data from AERONET was derived from the almucantar and
principal plane scans, while the direct sun measurement lends a more confident quantity,
the Aerosol Optical Thickness (AOT). Due to the heavy aerosol loading at Xianghe,
many more direct sun measurements were recorded than almucantar and principal planes.

Since the filter samples were collected in two size ranges, fine and coarse, a direct
comparison between the Small Mode Ratio, SMR, can be performed between the filter
results and the AERONET total column almucantar retrievals. The filter SMR is
calculated by dividing the daytime fine mode mass concentration by the total (fine +
coarse) daytime mass concentration. The AERONET SMR comes from integrating the
AERONET volume size distributions up to 2.24µm diameter (the closest size bin
constraint to 2.5µm), and dividing by the total volume up to 10µm diameter. The
AERONET calculations assume the same mass density for the fine and coarse modes.
Figure 3 shows a comparison between the SMR results of the filter versus AERONET.
The 1:1 line indicated in the plot shows that there is one group of points with good
agreement between both techniques and a second group (circled) where the AERONET
results show consistently larger SMR, indicating smaller particles in the atmospheric
column than near the ground.
271
272
273
274
275
276
277
278
279
280
281
282
283
284
285
286
287
288
289
290
291
292
293
For the circled data points, one would assume that there was an external factor that did
not allow the ground-based measurements to accurately represent the total column,
usually in the case of aerosol layers aloft or diurnal changes within a relatively calm
boundary layer. To clarify this hypothesis, data was used from NASA’s MPLnet as a
micro-pulse lidar was located nearby. Lidar scans for the dates with good agreement
between the filter SMR and AERONET SMR showed relatively uniform aerosol
concentrations throughout the measurable vertical extent, as shown in figure 4a on March
13, 2005. The time-series of AOT from AERONET was laid over the corresponding scan
time period to determine if lidar backscatter variations were related to aerosol loading,

not cloud contamination or sampling biases in AERONET due to selective cloud cover
during portions of the day. Lidar scans for dates with poor agreement between the SMRs
usually showed heavy aerosol layers aloft, or very inhomogeneous aerosol concentrations
throughout the boundary layer, as seen in figure 4b for one case on March 15 2005.
Based on these results, we can say that the SMR data gathered by ground-based
measurements are accurate representations of the total column in those instances when
the total column is well-mixed.
294
295
296
297
298
299
300
301
302
303
304
305
306
307
308
309
310
311
312
313
314
315
316
Assuming a constant mass extinction efficiency (m2/g), one can determine how well the
AOT retrieved by an AERONET sunphotometer can represent the mass concentration
measured on the ground. Smirnov et al. [2000] offer a similar comparison from Barbados
studying transported Saharan dust. Only quality-assured AERONET level 2.0 daily
averages from the sunphotometer located in Xianghe were used for this comparison.
Since the sunphotometer computes AOT from its direct sun measurement, the daytime
filters were selected instead of 24-hour filters as the sunphotometer can only collect data
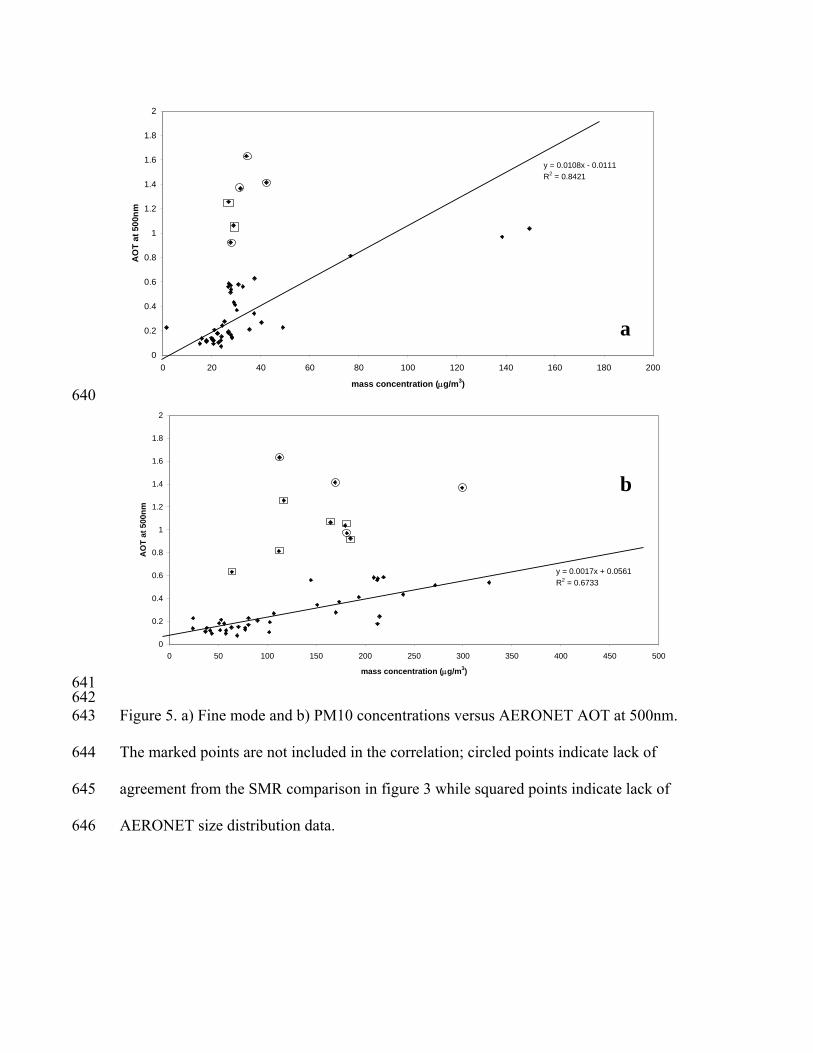
during daylight hours. In figure 5a, the fine mode mass concentration is compared to
AERONET AOT at 0.50 µm, while figure 5b shows a similar comparison with PM10
concentrations. This particular wavelength was chosen for consistency as it will be used
throughout this paper. With help from the SMR comparison, we can identify two distinct
paths taken by the data. The points surrounded by circles in figure 5a show cases where
the correlation in SMR were poor, while points in squares indicated dates when there is
no AERONET size distribution data available. This result serves as a guide to filter the
best cases in the intercomparison between AOT retrievals and mass measurements. The

resulting points (without the circled/squared points) present a better correlation between
the AOT versus PM2.5 mass and provide a correlation coefficient of R
317
318
319
320
321
322
323
324
325
326
327
328
329
330
331
332
333
334
335
336
337
338
339
2 = 0.84, slope =
0.011 and intercept = -0.011. For the PM10 comparison, we present a correlation
coefficient of R2 = 0.67, slope = 0.0017 and intercept = 0.056. Comparable to this PM10
correlation, Smirnov et al. [2000] reported a correlation coefficient of R2 = 0.71, slope =
0.0036 and intercept = 0.082 for daily filters from a high volume bulk sampler and daily
average AOT measurements at 870nm from AERONET of the Saharan dust. They were
able to improve the correlation to R2 = 0.93 by presenting their 2.5-year data set as one-
month averages.
3.2 Absorption efficiency
The absorption efficiency is an important variable connecting the aerosol absorption
properties and the aerosol particle mass concentration and can be used in chemical
transport models to connect chemistry and optical properties. The absorption efficiency
is measured from the exposed Nuclepore filter using an optical reflectance technique and
the mass measurements [Martins et al., 2006]. The spectral dependence data provides
important information on the average size of the absorbers, and some hints on the
imaginary refractive index [Martins et al., 1998]. In figure 6a, the absorption efficiency
of the coarse mode filters is shown as an average and one standard deviation of the 35
filters that were collected during the IOP. A second line is plotted showing a λ-1 spectral
dependence that is consistent with small absorbers, usually smaller than 0.2 µm diameter
and flat imaginary refractive index, like black carbon [Martins et al., 1998, Bergstrom et
al., 2002]. The absorption efficiency of the coarse mode has a much flatter spectral

dependence than the λ-1 line, which is consistent with larger particles with flat refractive
index possibly representing large black carbon cluster aggregates or combinations
between dust particles and black carbon [Martins et al., 1998]. However, the fine mode
filters absorption efficiency is very similar to the λ
340
341
342
343
344
345
346
347
348
349
350
351
352
353
354
355
356
357
358
359
360
361
362
-1 model, as shown in figure 6b.
Departures from the λ-1 curve for small absorbing particles can be related to relatively
fast changes in the imaginary component of the refractive index which is commonly
observed in the short visible and the UV for organic materials [Chang and
Charalampopoulos, 1990] or even dust.
The fine and coarse mode absorption efficiencies are compared side-by-side in figure 6c.
While the fine mode is a more efficient absorber in the UV and visible regions, the fact
that both modes are equally good absorbers, indicated by the overlapping error bars, in
the near-IR is very important. Much of the incoming solar radiation is absorbed in this
region of the spectrum, and since the coarse mode mass is much greater than that of the
fine (figure 1a, b), the large absorption by the coarse mode is significant and is rarely
taken into account in climate studies.
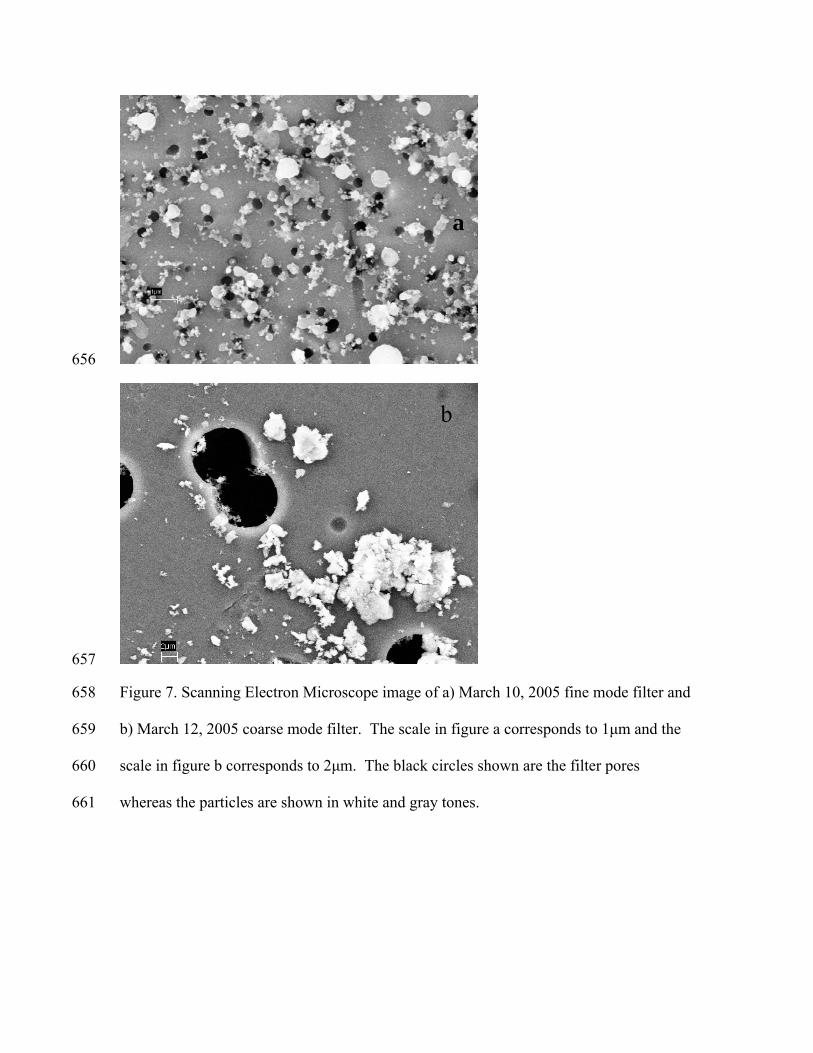
The typical fine and coarse particles collected in Xianghe during the IOP were observed
by the use of a Scanning Electron Microscope on sections of the filter. Pictures were
taken of several filters with the scanning electron microscope at the NASA Goddard
Space Flight Center in Greenbelt, MD. Figure 7a shows an example for the filter
collected on March 10th, where the fine-mode filter shows a combination of spherical
particles and aggregates of much smaller particles. The black circles represent the filter

pores while the particles are pictured in shades of white and gray. The 1µm scale on the
bottom left corner indicates that all particles are smaller than 2.5 µm. The coarse mode
filter SEM in Figure 7b shows large particles probably composed of a combination of
dust, black carbon, and organic material from March 12. The mixture between dust and
black carbon could justify some of the absorption efficiency spectral dependence
observed in figure 6a and discussed in more details in Martins et al. [2006].
363
364
365
366
367
368
369
370
371
372
373
374
375
376
377
378
379
380
381
382
383
384
The absorption coefficient calculated from a combination of the OR and the mass
concentration was compared to the University of Maryland’s PSAP instrument, which
was run in parallel with the filter sampling apparatus during the IOP. The comparison is
shown in figure 8. There is a better agreement between the two experimental techniques
at lower values of the absorption coefficient, while the disparity between the data points
widens at higher values probably due to biases of the PSAP corrections for higher
loading, and the excessive light attenuation allowed for those cases which could have
produced transmittances down to 60%. At seven points the difference between the two
measurements is greater than ±1E-05. The points where the OR measures a significantly
greater absorption coefficient (March 7th, March 14th, and March 19th) were all during the
night-time sampling period when the PSAP has difficulty taking continuous
measurements (see below for discussion). The largest difference of two points occurs
over the whole day of March 16th ending on March 17th when there was heavy
atmospheric loading based on Figure 2.

Using the scattering coefficient from The University of Maryland’s TSI three-wavelength
Nephelometer, the SSA (ω
385
386
387
388
389
390
391
392
393
394
395
396
397
398
399
400
401
402
403
404
405
406
407
0) was calculated for both the filter OR and the PSAP results.
While the absorption coefficient can be derived from the OR measurement at any
wavelength from 350-2500µm, the Nephelometer only measures at 450, 550 and 700 nm.
The ω0 was calculated at these three wavelengths and is shown in figure 9. The PSAP
only operates at one wavelength, 574nm. The filter OR ω0 calculation at 550nm is then
compared with that from the PSAP (extrapolated from 574nm to 550nm), and
AERONET at 441nm and 673nm in figure 10. The ω0 from AERONET is an inversion
product derived from almucantar and principle plane measurements, not direct sun
measurements, hence having fewer data points. To allow for some comparison, all data
points during this time period are shown, not just daily averages. The data shows that
AERONET’s ω0 is higher than that obtained from the ground-based measurements.
AERONET’s inversion-based calculation would be influenced by aerosol layers aloft or
possibly by hydration of the ambient aerosol particles, neither of which would affect the
dry filter samples collected at the surface and analyzed in the lab.
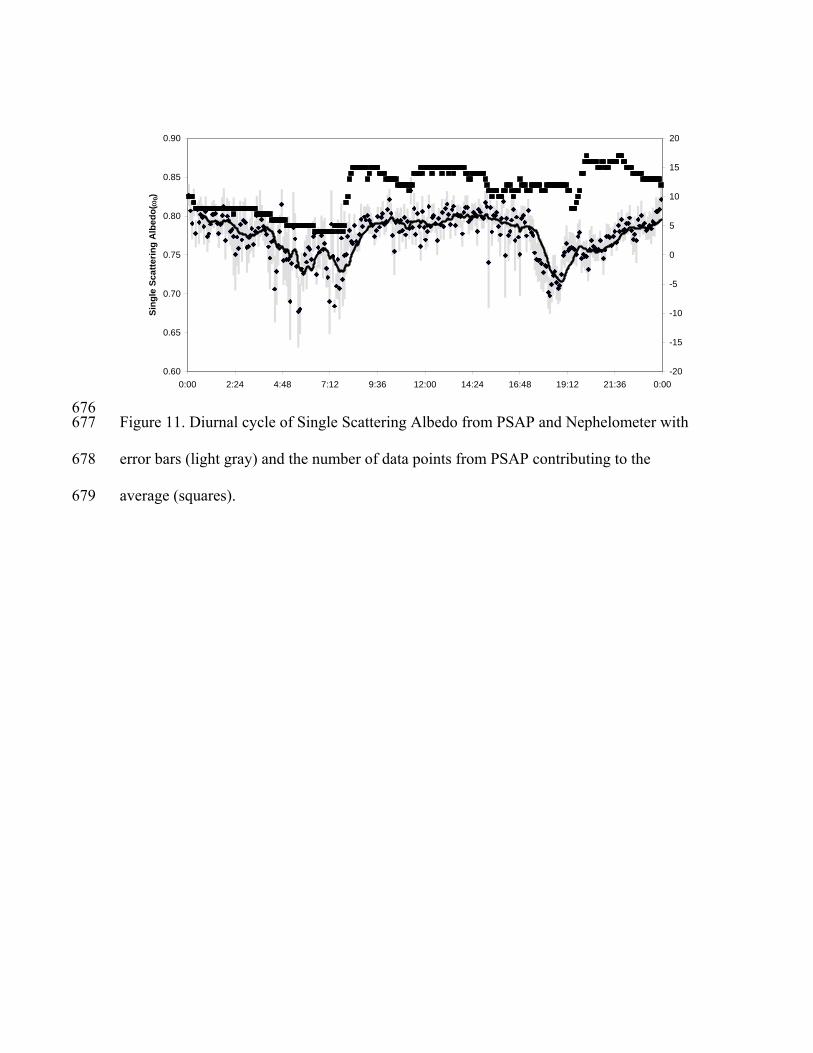
Since the PSAP and Nephelometer instruments offer higher temporal resolution than OR,
we examined the diurnal cycle of ω0 to determine whether or not the larger averaging
time would impact the findings. In figure 11, the daily cycle of ω0 is shown with one
standard deviation at each data point. Also plotted on the top is the number of data points
that contributed to each average from the PSAP instrument. Since the PSAP is a filter-
based instrument using paper filters, the absorption measurement is only valid until a
certain threshold of loading on the filter, at which time the filter must be replaced. In the

case when an operator was not able to change the filter and the threshold was breached,
that data removed from the data set. The number of data points that contributed to each
average point gives us an idea of certainty in the measurement. The diurnal cycle of ω
408
409
410
411
412
413 414
415
416
417
418
419
420
421
422
423
424
425
426
427
428
429
430
0
shows two minima values corresponding to the rush hours of the morning and evening.
4 Conclusions
Nuclepore filters were collected in Xianghe, China for the first 5 months of 2005. Mass
concentration measurements derived from the filters indicate substantial atmospheric
loading of both PM2.5 and PM10. The ground-based mass concentration measurements
compare favorably with AERONET AOT and size distribution retrievals in cases of
vertical homogeneity as observed by the lidar data, which allows for converting
remotely-sensed AOT to mass concentration. The spectral absorption efficiency was
measured for the coarse and fine mode filters using an optical reflectance technique. The
fine mode compared favorably to a λ-1 model while the coarse mode exhibited much
flatter spectral dependence, consistent with large particle models. The coarse mode
absorption efficiency in the NIR region was determined to be similar in strength to the
fine mode. This implies very strong absorption by the coarse mode, considering the
sizeable mass of coarse particles in the atmosphere, which is very important for the
energy balance of the atmosphere considering that much of the incoming solar radiation
is present in this region of the spectrum. The large absorption observed by the coarse
mode during this experiment is very significant and should be emphasized in future
studies as it is rarely taken into account in climate studies.

The absorption coefficient was calculated at 550nm from the OR technique and compared
to a co-located PSAP. At low to moderate levels of loading, the two measurement
techniques compared very well, while the disparity increased at higher loading levels,
probably due to the optical artifacts in the PSAP as well as few nighttime measurements.
The absorption coefficients were combined with the scattering coefficient from a co-
located Nephelometer to produce ω
431
432
433
434
435
436
437
438
439
440
441
442
443 444 445 446 447 448 449 450 451 452 453
0. Both ground-based measurements produced a
lower ω0 than AERONET, implying higher concentration of absorbers near the surface
than aloft, or other intrinsic differences between the dry filter samples and the ambient
measurements collected by AERONET. Such information is important to compute the
temperature profile due to adiabatic heating by the aerosols. In the future, we plan to
conduct more experiments using either airborne or balloon-borne instruments to better
resolve the vertical profile of ω0.
Acknowledgements: The EAST-AIRE project was supported by the NASA Radiation Science Program (NNG04GE79G), the National Science Foundation (ATM0412040, ATM425069), the National Science Foundation of China (40250120071), and the 973 Aerosol Initiative sponsored by the Chinese Ministry of Science and Technology. The absorption measurements were supported by the NASA Radiation Science Program. The authors would like to thank Jacob Kleidman for his filter/OR laboratory assistance, Debbie Thomas from NASA GSFC code 541.0 for her support on the SEM laboratory analysis.

5 References 454 455
456
457
458
459
460
461
462
463
464
465
466
467
468
469
470
471
472
473
474
475
476
Bergstrom, R.W, P.B. Russell, and P. Hignett (2002), Wavelength dependence of the
absorption of black carbon particles: predictions and results from the TARFOX
experiment and implications for the aerosol single scattering albedo, J. Atmos. Sci., 59,
567-577.
Bond, T.C., T.L. Anderson, and D. Campbell (1999), Calibration and intercomparison
of filter-based measurements of visible light absorption by aerosols, Aerosol Sci.
Technol., 30, 582-600.
Campbell, D., S. Copeland, T. Cahill, R. Eldred, C. Cahill, and J. Vesenka (1989),
The coefficient of optical absorption from particles deposited on filters: Integrating plate,
Integrating sphere, and coefficient of haze measurements, Presented at the Annual
Meeting of the AWMA.
Chang, H. and T.T. Charalampopoulos (1990), Determination of the wavelength
dependence of refractive indices of flame soot, Proceedings of The Royal Society of
London: Mathematical and Physical Sciences, 430, 577-591.
Chu, D.A., Y.J. Kaufman, C. Ichoku, L.A. Remer, D. Tanre, and B.N. Holben (2002),
Validation of MODIS aerosol optical depth retrieval over land, Geophys. Res. Lett., 29,
MOD2-1-4.
Coakley, J.A and P. Chylek (1975), The two-stream approximation in radiative
transfer: Including the angle of incident radiation, J. Atmos. Sci., 32(2).
Hansen, A.D.A, H. Rosen, and T. Novakov (1983), Aethalometer: An instrument for
the real-time measurement of optical absorption by aerosol particles, Presented at the 2nd

International Conference on Carbonaceous Particles in the Atmosphere, Linz, Austria,
Sept. 11-14.
477
478
479
480
481
482
483
484
485
486
487
488
489
490
491
492
493
494
495
496
497
498
499
Holben, B.N. et al. (1998), AERONET- A federated instrument network and data
archive for aerosol characterization, Remote Sens. Environ., 661(1), 1-16.
Huebert, B.J., T. Bates, P.B. Russell, G. Shi, Y.J. Kim, K. Kawamura, G. Carmichael,
and T. Nakajima (2003), An overview of ACE-Asia: Strategies for quantifying the
relationships between Asian aerosols and their climatic impacts, J. Geophys. Res.,
108(D23), ACE1-1.
Ichoku, C., D.A. Chu, S. Mattoo, Y.J. Kaufman, L.A. Remer, D. Tanre, I. Slutsker,
and B.N. Holben (2002), A spatio-temporal approach for global validation and analysis
of MODIS aerosol products, Geophys. Res. Lett., 29, MOD1-1-4.
Intergovernmental Panel on Climate Change (2001), Climate Change 2001: The
Scientific Basis, Edited by J.T. Houghton, 896 pp., Cambridge University Press, New
York.
Jacobson, M.Z. (2000), A physically-based treatment of elemental carbon optics:
Implications for global direct forcing of aerosols, Geophys. Res. Lett., 27, 217-220.
Kaufman, Y.J., D. Tanre, L.A. Remer, E.F. Vermote, D.A. Chu, and B.N. Holben
(1997), Operational remote sensing of tropospheric aerosol over land from EOS moderate
resolution imaging spectroradiometer, J. Geophys. Res., 102, 17051-17067.
Kindel, B.C., Z. Qu, and A.F.H. Goetz (2001), Direct solar spectral irradiance and
transmittance measurements from 350 to 2500nm, Appl. Opt., 40(21), 3483-3494.
Lin, C.I., M. Baker, and R.J. Charlson (1973), Absorption coefficient of atmospheric
aerosol: a method for measurement, Appl. Opt., 12(6), 1356-1363.

Ma, C.-J., M. Kasahara, R. Holler, and T. Kamiya (2001), Characteristics of single
particles sampled in Japan during the Asian dust-storm period, Atmos. Environ., 35,
2707-2714.
500
501
502
503
504
505
506
507
508
509
510
511
512
513
514
515
516
517
518
519
520
521
522
Martins, J.V., P. Artaxo, C. Liousse, J.S. Reid, P.V. Hobbs, and Y.J. Kaufman (1998),
Effects of black carbon content, particle size, and mixing on light absorption by aerosols
from biomass burning in Brazil, J. Geophys. Res., SCAR-B Special Issue, 103(D24),
32041-050.
Martins, J.V., P. Artaxo, Y. Kaufman, and A.D. Castanho (2006), Spectral absorption
properties of urban aerosol particles, In Preparation.
Ning, D., L. Zhong, and Y. Chung (1996), Aerosol size distribution and elemental
composition in urban areas of northern China, Atmos. Environ., 30, 2355-2362.
Reid, J.S., P.V. Hobbs, C. Liousse, J.V. Martins, R.E. Weiss, and T.F. Eck (1998),
Comparison of techniques for measuring shortwave absorption and black carbon content
of aerosols from biomass burning in Brazil, J. Geophys. Res., SCAR-B Special Issue,
103(D24), 32031-040.
Remer, L.A. et al. (2002), Validation of MODIS aerosol retrieval over ocean,
Geophys. Res. Lett., 29, MOD3-1-4.
Shi, Z., L. Shao, T.P. Jones, A.G. Whittaker, S. Lu, K.A. Berube, T. He, and R.J.
Richards (2003), Characterization of airborne individual particles collected in an urban
area, a satellite city and a clean air area in Beijing, 2001, Atmos. Environ., 37, 4097-4108.
Smirnov, A., B.N. Holben, D. Savoie, J.M. Prospero, Y.J. Kaufman, D. Tanre, T.F.
Eck, and I. Slutsker (2000), Relationship between column aerosol optical thickness and in
situ ground based dust concentrations over Barbados, Geophys. Res. Lett., 27, 1643-1646.

Virkkula, A., N.C. Ahlquist, D.S. Covert, W.P. Arnott, P.J. Sheridan, P.K. Quinn, and
D.J. Coffman (2005), Modification, calibration and a field test of an instrument for
measuring light absorption by particles, Aerosol Sci. Technol., 39, 68-83.
523
524
525
526
527
528
529
530
531
532
533
534
535
536
537
538
Weiss, R., and A. Waggoner (1984), Aerosol optical absorption: accuracy of filter
measurement by comparison with in-situ extinction, Aerosols, Edited by B. Liu, D. Pui,
and H. Fissan, pp 397.
Winker, D.M., J.R. Pelon, and M.P. McCormick (2003), The CALIPSO mission:
spaceborne lidar for observation of aerosols and clouds, Proceedings of SPIE, 4893, 1-11.
Yamasoe, M.A., P. Artaxo, A.H. Miguel, and A.G. Allen (2000), Chemical
composition of aerosol particles from direct emissions of vegetation fires in the Amazon
Basin: Water-soluble species and trace elements, Atmos. Environ., 34, 1641-1653.
Ye, B., X. Ji, H. Yang, X. Yao, C.K. Chan, S.H. Cadle, T. Chan, and P.A. Mulawa
(2003), Concentration and chemical composition of PM2.5 in Shanghai for a 1-year
period, Atmos. Environ., 37, 499-510.
Zwally, H.J. et al. (2002), ICESat’s laser measurements of polar ice, atmosphere,
ocean, and land, J. Geodynamics, 34, 405-445.

Figure Captions 539 540 541 542 543 544 545 546 547 548 549 550 551 552 553 554 555 556 557 558 559 560 561 562 563 564 565 566 567 568 569 570 571 572 573 574 575 576 577 578 579 580 581 582 583
Figure 1. Twelve-hour Mass Concentration of a) coarse mode particles with aerodynamic diameter 2.5µm<d<10µm, and b) fine mode particles with d<2.5µm for the period between January 13-May 24, 2005 in Xianghe, China. Figure 2. Twenty-four hour averages of PM2.5 (light gray) and PM10 (total column) during the Intensive Observation Campaign compared to the US NAAQS 24-hour limit for particulate matter. Figure 3. Comparison between calculated AERONET Small Mode Ratio versus the measured filter Small Mode Ratio for available data from January 13-May 24, 2005. AERONET results were calculated from the average of almucantar inversions performed throughout the day, whereas the filter data was sampled during the daylight hours. The 1:1 line is shown in the plot to indicate cases of good agreement between both results. Cases of poorer agreement are circled. Figure 4. Lidar scan and corresponding AOD time series from AERONET for a) March 13, 2005, representing one case when the calculated AERONET Small Mode Ratio (SMR) and the filter SMR were correlated. The panel shows a relatively well-mixed boundary layer during the AERONET data collection and the filter sampling period. Panel b) March 15, 2005, represents one case when the calculated AERONET SMR and the filter SMR did not correlate well and the lidar image shows significantly heterogeneous layers during the sampling period. Figure 5. a) Fine mode and b) PM10 concentrations versus AERONET AOT at 500nm. The marked points are not included in the correlation; circled points indicate lack of agreement from the SMR comparison in figure 3 while squared points indicate lack of AERONET size distribution data. Figure 6. Spectral Absorption Efficiency for aerosol particles of a) 2.5µm<d<10µm and b) d<2.5µm averaged from 35 filters from March 3-19, 2005 compared to a λ-1 model, then compared to each other in c. The gray area in each case represents the standard deviation of the measured cases. The error bars in figure c is equivalent to the gray areas in the figure a plot, but is shown as error bars for visual clarity. Figure 7. Scanning Electron Microscope image of a) March 10, 2005 fine mode filter and b) March 12, 2005 coarse mode filter. The scale in figure a corresponds to 1µm and the scale in figure b corresponds to 2µm. The black circles shown are the filter pores whereas the particles are shown in white and gray tones. Figure 8. Comparison of absorption coefficient from the Optical Reflectance (OR) technique applied to the Nuclepore filters and the corresponding average PSAP results during the IOP.

Figure 9. Single Scattering Albedo (ω0) from Optical Reflectance combined with the Nephelometer scattering coefficient at the three operating wavelengths: 450, 550, 700nm.
584 585 586 587 588 589 590 591 592 593
Figure 10. Single Scattering Albedo from AERONET and a combination of the scattering coefficient from the Nephelometer at 550nm with Optical Reflectance and PSAP results. Figure 11. Diurnal cycle of Single Scattering Albedo from PSAP and Nephelometer with error bars (light gray) and the number of data points from PSAP contributing to the average (squares).

0.00
50.00
100.00
150.00
200.00
250.00
300.00
350.00
400.00
450.00
1/13
mas
s co
ncen
trat
ion
( µg/
m3 )
594
0.00
10.00
20.00
30.00
40.00
50.00
60.00
70.00
80.00
90.00
1/13
mas
s co
ncen
trat
ion
( µg/
m3 )
595 596 597
598
599
Figure 1. Tw
diameter 2.5
between Jan
a
1/19 1/30 2/4 2/12 2/25 3/5 3/12 3/18 4/9 4/21 5/4 5/22
1/19 1/30 2/4 2/12 2/25 3/5 3/12 3/18 4/9 4/21 5/4 5/22
b
elve-hour Mass Concentration of a) coarse mode particles with aerodynamic
µm<d<10µm, and b) fine mode particles with d<2.5µm for the period
uary 13-May 24, 2005 in Xianghe, China.

0
50
100
150
200
250
300
350
400
3/7 3/8 3/9 3/10 3/11 3/12 3/13 3/14 3/15 3/16 3/17 3/18 3/19
Mas
s C
once
ntra
tion
( µg/
m3 )
35µg/m3
150µg/m3
600
601
602
603
604
Figure 2. Twenty-four hour averages of PM2.5 (light gray) and PM10 (total column)
during the Intensive Observation Campaign compared to the US NAAQS 24-hour limit
for particulate matter.

0
0.1
0.2
0.3
0.4
0.5
0.6
0.7
0.8
0.9
0 0.1 0.2 0.3 0.4 0.5 0.6 0.7 0.8 0.9
Aeronet Small Mode Ratio
Filte
r Sm
all M
ode
Rat
io1:1 line
605
606
607
608
609
610
611
Figure 3. Comparison between calculated AERONET Small Mode Ratio versus the
measured filter Small Mode Ratio for available data from January 13-May 24, 2005.
AERONET results were calculated from the average of almucantar inversions performed
throughout the day, whereas the filter data was sampled during the daylight hours. The
1:1 line is shown in the plot to indicate cases of good agreement between both results.
Cases of poorer agreement are circled.

a
b
612

Figure 4. Lidar scan and corresponding AOD time series from AERONET for a) March
13, 2005, representing one case when the calculated AERONET Small Mode Ratio
(SMR) and the filter SMR were correlated. The panel shows a relatively well-mixed
boundary layer during the AERONET data collection and the filter sampling period.
Panel b) March 15, 2005, represents one case when the calculated AERONET SMR and
the filter SMR did not correlate well and the lidar image shows significantly
heterogeneous layers during the sampling period.
613
614
615
616
617
618
619
620
621
622
623
624
625
626
627
628
629
630
631
632 633 634 635 636 637 638 639
0
0.2
0.4
0.6
0.8
1
1.2
1.4
1.6
1.8
2
0 20 40 60 80 100 120 140 160 180 200
mass concentration (µg/m3)
AO
T at
500
nm
y = 0.0108x - 0.0111R2 = 0.8421
a
640
0
0.2
0.4
0.6
0.8
1
1.2
1.4
1.6
1.8
2
0 50 100 150 200 250 300 350 400 450 500
mass concentration (µg/m3)
AO
T at
500
nm
y = 0.0017x + 0.0561R2 = 0.6733
b
641 642 643
644
645
646
Figure 5. a) Fine mode and b) PM10 concentrations versus AERONET AOT at 500nm.
The marked points are not included in the correlation; circled points indicate lack of
agreement from the SMR comparison in figure 3 while squared points indicate lack of
AERONET size distribution data.

0
0.1
0.2
0.3
0.4
0.5
0.6
0.7
0.8
0.9
1
350 850 1350 1850 2350
Wavelength (nm)
Aer
osol
Abs
orpt
ion
Effic
ienc
y (m
2 /g)
a
647
0
0.5
1
1.5
2
2.5
350 850 1350 1850 2350
Wavelength (nm)
Aer
osol
Abs
orpt
ion
Effic
ienc
y (m
2 /g)
a b
648
649

0
0.5
1
1.5
2
2.5
350 850 1350 1850 2350
Wavelength(nm)
Aer
osol
Abs
orpt
ion
Effic
ienc
y (m
2 /g)
c
650
651
652
653
654
655
Figure 6. Spectral Absorption Efficiency for aerosol particles of a) 2.5µm<d<10µm and
b) d<2.5µm averaged from 35 filters from March 3-19, 2005 compared to a λ-1 model,
then compared to each other in c. The gray area in each case represents the standard
deviation of the measured cases. The error bars in figure c is equivalent to the gray areas
in the figure a plot, but is shown as error bars for visual clarity.
a
656
657
658
659
660
661
Figure 7. Scanning Electron Microscope image o
b) March 12, 2005 coarse mode filter. The scale
scale in figure b corresponds to 2µm. The black c
whereas the particles are shown in white and gray
b
f a) March 10, 2005 fine mode filter and
in figure a corresponds to 1µm and the
ircles shown are the filter pores
tones.

0
0.00002
0.00004
0.00006
0.00008
0.0001
0.00012
0.00014
0.00016
0.00018
3/1 3/3 3/5 3/7 3/9 3/11 3/13 3/15 3/17 3/19 3/21
Abs
orpt
ion
Coe
ffici
ent (
m-1
)PSAP
OR
662
663
664
665
666
667
668
669
Figure 8. Comparison of absorption coefficient from the Optical Reflectance (OR)
technique applied to the Nuclepore filters and the corresponding average PSAP results
during the IOP.

0.65
0.7
0.75
0.8
0.85
0.9
0.95
3/3 3/5 3/7 3/9 3/11 3/13 3/15 3/17 3/19 3/21
Sing
le S
catte
ring
Alb
edo
( ω0)
450 ssa
550 ssa
700 ssa
670
671
672
Figure 9. Single Scattering Albedo (ω0) from Optical Reflectance combined with the
Nephelometer scattering coefficient at the three operating wavelengths: 450, 550, 700nm.

0.6
0.65
0.7
0.75
0.8
0.85
0.9
0.95
1
3/3 3/5 3/7 3/9 3/11 3/13 3/15 3/17 3/19 3/21
Sing
le S
catte
ring
Alb
edo
( ω0)
OR
PSAP
441nm-AERONET673nm-AERONET
673
674
675
Figure 10. Single Scattering Albedo from AERONET and a combination of the scattering
coefficient from the Nephelometer at 550nm with Optical Reflectance and PSAP results.
0.60
0.65
0.70
0.75
0.80
0.85
0.90
0:00 2:24 4:48 7:12 9:36 12:00 14:24 16:48 19:12 21:36 0:00
Sing
le S
catte
ring
Alb
edo(ω
0)
-20
-15
-10
-5
0
5
10
15
20
676 677
678
679
Figure 11. Diurnal cycle of Single Scattering Albedo from PSAP and Nephelometer with
error bars (light gray) and the number of data points from PSAP contributing to the
average (squares).