in-situ observation of bulk 3d grain evolution during...
TRANSCRIPT

International Journal of Plasticity 67 (2015) 217–234
Contents lists available at ScienceDirect
International Journal of Plasticity
journal homepage: www.elsevier .com/locate / i jp las
In-situ observation of bulk 3D grain evolution during plasticdeformation in polycrystalline Cu
http://dx.doi.org/10.1016/j.ijplas.2014.10.0130749-6419/� 2014 Elsevier Ltd. All rights reserved.
⇑ Corresponding author at: Materials Science and Technology Division, Los Alamos National Laboratory, Los Alamos, NM 87544, USA.E-mail address: [email protected] (R. Pokharel).
Reeju Pokharel a,c,⇑, Jonathan Lind a,b, Shiu Fai Li b, Peter Kenesei d, Ricardo A. Lebensohn c,Robert M. Suter a, Anthony D. Rollett a
a Carnegie Mellon University, 5000 Forbes Avenue, Pittsburgh, PA 15213, USAb Lawrence Livermore National Laboratory, 7000 East Avenue, CA 94550, USAc Materials Science and Technology Division, Los Alamos National Laboratory, Los Alamos, NM 87544, USAd Advanced Photon Source, Argonne National Laboratory, 9700 South Cass Avenue, Argonne, IL 60439, USA
a r t i c l e i n f o a b s t r a c t
Article history:Received 12 August 2014Received in final revised form 20 October2014Available online 7 November 2014
Keywords:A. MicrostructuresB. Crystal plasticityB. Polycrystalline materialC. Non-destructive evaluationHigh-energy X-ray diffraction microscopy
We present a non-destructive in-situ measurement of three-dimensional (3D) microstruc-ture evolution of 99.995% pure polycrystalline copper during tensile loading using synchro-tron radiation. Spatially resolved three-dimensional crystallographic orientation fields arereconstructed from the measured diffraction data obtained from a near-field high-energyX-ray diffraction microscopy (nf-HEDM), and the evolution of about 5000 3D bulk grainsis tracked through multiple stages of deformation. Spatially resolved observation of macro-scopic texture change, anisotropic deformation development, and the correspondence ofdifferent crystallographic parameters to defect accumulation are illustrated. Moreover,correlations between different crystallographic parameters, such as crystal rotationevolution, short- and long-range orientation gradient development, microstructuralfeatures, and grain size effects are investigated. The current state of data mining toolsavailable to analyze large and complicated diffraction data is presented and challengesassociated with extracting meaningful information from these datasets are discussed.
� 2014 Elsevier Ltd. All rights reserved.
1. Introduction
The mechanical behavior of polycrystalline materials is complex in general, due to neighborhood-specific interactionsbetween anisotropic crystalline grains. For each crystallite, its neighborhood’s microstructure determines the local elasticand plastic responses to thermomechanical loads applied at aggregate level. While computational models that combinephysics-based and heuristic rules are currently able to reproduce the evolution of averaged quantities such as stress–strainresponse and crystallographic texture, they are not able to fully reproduce the details of the various complex responses thatare observed locally (Zhao et al., 2008; Shade et al., 2011). A recent review (Pokharel et al., 2014) surveys this limited agree-ment. In order to gain a more fundamental understanding, measurements are required to track, inside of bulk samples, therelevant quantities at the relevant length scales as loading is applied. It is only with such data, along with input from thenanoscale on the properties and responses of defect ensembles in individual grains that the development of truly predictivemodels will be accomplished (Zeghadi et al., 2007).

218 R. Pokharel et al. / International Journal of Plasticity 67 (2015) 217–234
For example, the study of polycrystal deformation based on Taylor or self-consistent models is limited to considering homo-geneous strain and lattice rotation of the grains in an aggregate. The development of orientational broadening in X-raydiffraction (Joffe and Kirpitcheva, 1922) and the obvious spread in measured orientation maps, however, makes it clear thateach grain and each portion of a grain is affected by its neighbors (Pokharel et al., 2014; Li et al., 2012; Pouillier et al., 2012).
Dual and tri-beam microscopes have been developed that combine electron backscatter diffraction (EBSD) orientationmapping at surfaces (Schwartz et al., 2009) with automated serial sectioning by mechanical means (Rowenhorst andLewis, 2011), ion beams (Uchic et al., 2011) and/or laser ablation (McDonald et al., 2008). These systems measure a sequenceof layers that can then be assembled into three dimensional data sets, albeit with significant effort to align the sections inorder to compensate for drift and other limitations of this experimental technique. Thanks to the point-by-point electronbeam probe with a spatial resolution as small as 0.1 lm, it is possible to characterize local lattice orientations in a widevariety of deformation states (Schwartz et al., 2009; Quey et al., 2012; Cerreta et al., 2013). However, the destructive natureof sectioning means that only single states of a given sample can be studied and deformation must be studied after the fact.Data collection is laborious and time-consuming and this limits the number of data sets that have been obtained for system-atic studies. To capture the behavior of grains inside a bulk sample but still only characterizing a surface, experiments havebeen conducted on split samples; the results were similar, however, to those obtained on free surfaces or quasi-2Dmicrostructures (Quey et al., 2012).
As an alternative to surface measurements, a variety of non-destructive synchrotron based X-ray diffraction techniqueshave been developed which provide both statistical and spatially resolved characterizations. White microbeam methods(Larson et al., 2002; Barabash et al., 2009) have submicron spatial resolution and, similar to EBSD, they provide point-by-point measurements even in highly disordered material states. 3D resolution can be obtained to depths of the order of tensof microns in many materials with sensitivity to local crystal orientations and strain states. High energy (P40 keV) mono-chromatic X-ray methods have been developed with the aim of probing deep (1 mm) inside of bulk materials (Poulsen et al.,2004; Lienert et al., 2011; Ludwig et al., 2008). Implementations referred to as 3DXRD (primarily at the European Synchro-tron Radiation Facility) or HEDM (at the Advanced Photon Source) continue to be developed and new facilities are beingdeveloped at the Petra-III and the Cornell High Energy Synchrotron Source. Different experimental configurations(Poulsen et al., 2004; Poulsen, 2012) lead to sensitivity to lattice strains in individual grains (Bernier et al., 2011), or ensem-bles of grains (Bernier and Miller, 2006), or to spatially resolved orientations similar to EBSD but with 3D spatial resolution.These measurements can be combined with each other (Shade et al., 2013), with a variety of sample environments (Pokharelet al., 2014, 2012, 2013, 2014, 2012), and with additional X-ray or optical probes (Li et al., 2012; Shade et al., 2013).
Here, we present a fully three-dimensional measurement and analysis of a polycrystalline microstructure as it undergoesductile deformation under tensile loading. We use near-field HEDM (nf-HEDM) (Suter et al., 2006) to map lattice orientationsin and between roughly 7000 grains in a �0.3 mm3 volume of a copper polycrystal as the sample is pulled in tension up to21% true strain. The data provide local neighborhood information for each grain, both in the initial undeformed state and asdeformation proceeds. We demonstrate the feasibility of extracting both global and local statistical information as well asthe tracking of local regions between states. The data, only a portion of which are presented here (due to limited computa-tional resources for data reduction/reconstruction), are amenable to direct comparisons to plasticity models and suchcomparisons are currently underway.
2. Methods
2.1. Material & experimental set-up
The 99.995% pure copper sample and in-situ experimental geometry used here are similar to those of (Pokharel et al.,2014). In that measurement, we sampled a single layer in 12 relatively finely spaced strain increments up to 14%macroscopic strain whereas here, we perform volumetric measurements at each of five strain levels up to 21% macroscopicstrain. Fig. 1 shows a schematic of the sample and the tension apparatus (Pokharel et al., 2014; Lind et al., 2014) mounted ontranslation and rotation stages of the experimental facility at the 1-ID APS beamline. The stepping motor driven tensionapparatus pulled the sample in steps of 5 lm corresponding to strain steps of d� � 5� 10�3. Fig. 2 shows the resultantmacroscopic stress–strain curve.
2.2. nf-HEDM data acquisition
Table 1 shows characteristics of the five volumetric measurements that were collected in a single synchrotron run ofthree days. In all cases, the line focused, 64 lm � 1.3 mm X-ray beam illuminates a thin cross-section of the sample. Aftereach ‘‘layer measurement’’ the sample is translated 4 lm vertically to illuminate the next such layer, this process is repeatedat any given fixed strain state until the full desired 3D volume has been scanned. Following a full volumetric scan, the tensilestrain is increased, and additional layer measurements are added so as to span, as best as possible, the entire material vol-ume measured in the initial, S0, state, hence the total volume measured increases with strain. However, the S4 measurementwas truncated by the end of the beam time allocation and only part of the original volume was measured. In each volume,the measured layers were roughly centered at the middle of the 1 mm diameter gauge section of the sample. As in Pokharel

Imaging Detector
Beryllium Window
Copper Specimen
Load Cell
X-Ray
Loading System
Rotation Stage
Stainless Steel Tube
Bragg Peak
Grain
Translation Stage
Rotation Axis
Fig. 1. Schematic of the experimental apparatus for nf-HEDM measurements under in-situ tensile loading. The sample is held inside a cylindrical stainlesssteel tube with an X-ray transparent Beryllium window section. The bottom end of the sample is fastened to a load cell which is mounted on a translationstage. As the stage is lowered, it exerts tensile force on the sample. The loading apparatus is in turn fastened to translation stages that are used to center thesample on the rotation axis of an air bearing rotation stage. The X-ray sensing element of the high resolution imaging detector system is positioned at L ¼ 5to 15 mm downstream of the rotation axis. For each ‘‘layer measurement’’ images of diffraction patterns are collected as the sample is rotated about theindicated axis (referred to as x) through a succession of intervals of width dx ¼ 1� which span 180� . Two or three such image sets are collected at differentdetector positions, L, so as to encode the position of origin and the propagation direction of diffracted beams (Suter et al., 2006; Lienert et al., 2011).
R. Pokharel et al. / International Journal of Plasticity 67 (2015) 217–234 219
et al., 2014, the center of the volumes was shifted to account for the displacement of the upper end of the sample by thetensile deformation apparatus.
Recent advances in data acquisition are essential in making these large volume measurements feasible. Image data asdescribed in Fig. 1 are now collected ‘‘on-the-fly’’ as the air bearing rotation stage rotates continuously. The interline CCDcamera (Retiga 4000DC, which uses a Kodak KAI-4022 CCD with 2 k� 2 k with 7.4 lm pixels), is optically coupled through5� magnifying optics so as to image fluorescent light from a 18 lm thick, single crystal, Lutecium-Aluminum-garnetscintillator. On completion of an exposure, charge is rapidly transferred to readout wells associated with each pixel onthe CCD after which collection of the next image begins and the previous one is read out. At typical rotation speeds(� 0:3� 1�/second), only a negligible rotation interval (6 0:001�) is missed. Since the missed interval is less than the Darwinwidth of a typical perfect crystal Bragg peak (Warren, 1969), essentially no diffraction signal is lost. Previously, a start andstop sequence that cost 1.7 s was associated with each image; with� 36;000 images per volume measurement, the new pro-cedure saves 17 h per volume relative to past work (Pokharel et al., 2014; Li et al., 2012; Lind et al., 2014; Hefferan et al.,2012). The entire raw data set comprises roughly 1.6 terabytes of image data. This was one of the first data sets collectedwith this new protocol and, not surprisingly, some interfacing issues were encountered. In particular, the first, S0, dataset was mildly compromised as will be discussed in Section 2.3. However, as shown below, the data track � 5000 bulk grainsthrough four strain states, with a smaller number in the final, S4, data set. This is the largest data set collected to date withnf-HEDM at the APS that tracks the evolution of microstructure under plastic deformation (Pokharel et al., 2014; Li et al.,2012; Lind et al., 2014; Hefferan et al., 2012; Oddershede et al., 2011).
2.3. Forward modeling method (FMM) reconstructions of microstructure
Reconstruction of crystal orientations from the diffraction images is performed using the forward modeling method(FMM) (Suter et al., 2006; Li and Suter, 2013). Orientation maps presented in this paper have in plane resolution of2.8 lm and out of the plane resolution (perpendicular to the layers) is simply the layer spacing of 4 lm. Examples of layerreconstructions in the different strain states are given in Fig. 2. The confidence parameter, C, is defined as the fraction of sim-ulated Bragg peaks that overlap observed diffracted beams. In this work, the simulation included Bragg scattering up toQ max ¼ 2k sin hmax ¼ 8 Å
�1, with k ¼ 2p
k ¼ 33:11 Å�1
, which includes scattering up to the fhklg ¼ f420g family of peaks forcopper with lattice constant, a ¼ 3:61 Å. Over the 180� experimental rotation range, a typical orientation generates � 50peaks, with Q 6 Qmax, that will strike the detector. Note also that the S0 state maps in Fig. 2 contain scattered black linesindicating local orientation fluctuations greater than 5�. Part of this is due, however, to the above mentioned data collec-tion/interfacing problem: roughly 0.1� of each 1� integration interval is missing in each image frame. This resulted inincreased orientation noise in the S0 state, which was cleaned up in the post processing step. As shown in Li and Suter

0 0.1 0.2 0.3 0.4 0.5 0.6 0.7 0.80
50
100
150
200
250
300
350
400
True Strain
True
Stre
ss(M
Pa)
Initial (S0)(100 Layers)
3% Strain (S1)(110 Layers)
6% Strain (S2)(120 Layers)
12% Strain (S3)(140 Layers)
21% Strain (S4)(80 Layers)
1.0
0.9
0.8
0.7
0.6
0.5
0.8 mm
0.4
Fig. 2. Experimental stress–strain curve along with one layer of orientation and confidence maps from each of the five measured strain states. Load anddisplacement data are used to compute the true stress versus true strain curve shown by the red line. Square symbols show locations at which nf-HEDMmeasurements were taken; these extend from 0 to 21% tensile strain. The 2D maps plotted outside the stress–strain graph represent reconstructedorientation fields from each of the corresponding strain levels. Colors correspond to an RGB mapping of Rodrigues vector components specifying the localcrystal orientation. These cross-sections are the top-most layers of the respective measured volumes and are not necessarily from the same region in thesample. The 2D maps plotted inside the stress–strain graph are the confidence, C, maps for the reconstructed orientation fields. In all the maps, black linesare drawn between nearest neighbor voxels that have > 5� degree misorientation so as to outline grain boundaries. Note: High frequency noise in thestress–strain curve due to readout noise from the load cell. (For interpretation of the references to colour in this figure legend, the reader is referred to theweb version of this article.)
Table 1Measurement characterization. (a) Successive layer measurements are separated by 4 lm. (b) Data collection time.
State True strain (%) Layers (a) Volume (mm3) (b) Time (h)
S0 0 100 0.31 10S1 3 110 0.35 11S2 6 120 0.38 12S3 12 140 0.44 14S4 21 80 0.25 11.2
220 R. Pokharel et al. / International Journal of Plasticity 67 (2015) 217–234
(2013), the fidelity of forward model based orientation reconstructions degrades gracefully with increasing orientation var-iation within grains. All voxels considered here have orientations determined by overlap of simulated Bragg peaks with 20 ormore experimentally observed diffracted beams (that is, CP 0:4). Thus, we expect presented trends to be robust. More quan-titative error analysis and validation against deformed samples and simulated data sets is a substantial undertaking that iscurrently being pursued. Below, we make comparisons of trends to prior observations where they exist.
2.4. Verification of 3D grain tracking
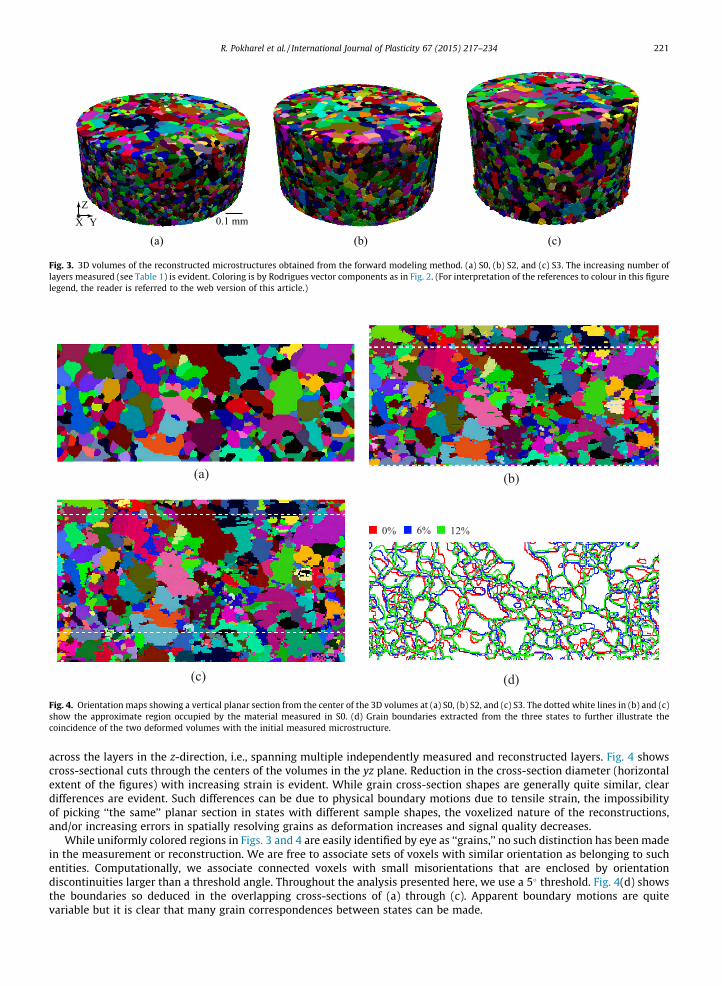
Before presenting detailed analysis in Section 3, we verify the extent to which the initial material volume measured in S0is tracked through states S2 and S3 and that the structures are sufficiently similar that individual grains can be followed.Fig. 3 shows the three entire reconstructed volumes. These images correspond to the same vertical section extracted froma stack of spatially resolved, reconstructed orientations; no smoothing or alignment procedures have been applied. Reason-ably smooth boundaries are observed both within the reconstruction planes (top surface; referred to as the xy-plane) and
X
ZY 0.1 mm
(a) (b) (c)
Fig. 3. 3D volumes of the reconstructed microstructures obtained from the forward modeling method. (a) S0, (b) S2, and (c) S3. The increasing number oflayers measured (see Table 1) is evident. Coloring is by Rodrigues vector components as in Fig. 2. (For interpretation of the references to colour in this figurelegend, the reader is referred to the web version of this article.)
0% 6% 12%
(a) (b)
(c) (d)
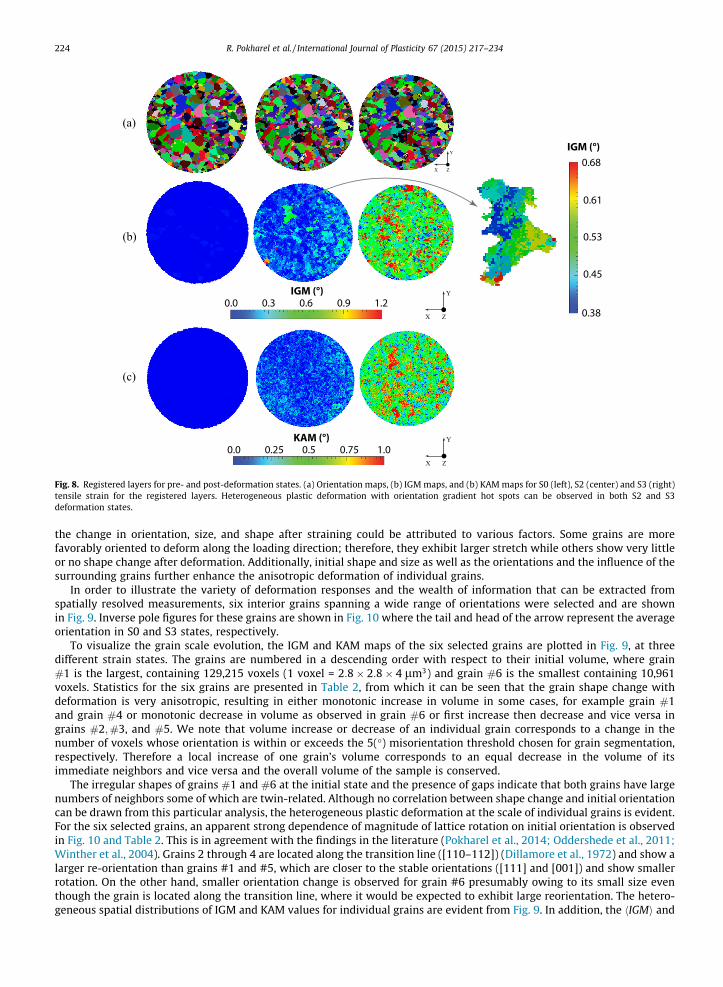
Fig. 4. Orientation maps showing a vertical planar section from the center of the 3D volumes at (a) S0, (b) S2, and (c) S3. The dotted white lines in (b) and (c)show the approximate region occupied by the material measured in S0. (d) Grain boundaries extracted from the three states to further illustrate thecoincidence of the two deformed volumes with the initial measured microstructure.
R. Pokharel et al. / International Journal of Plasticity 67 (2015) 217–234 221
across the layers in the z-direction, i.e., spanning multiple independently measured and reconstructed layers. Fig. 4 showscross-sectional cuts through the centers of the volumes in the yz plane. Reduction in the cross-section diameter (horizontalextent of the figures) with increasing strain is evident. While grain cross-section shapes are generally quite similar, cleardifferences are evident. Such differences can be due to physical boundary motions due to tensile strain, the impossibilityof picking ‘‘the same’’ planar section in states with different sample shapes, the voxelized nature of the reconstructions,and/or increasing errors in spatially resolving grains as deformation increases and signal quality decreases.
While uniformly colored regions in Figs. 3 and 4 are easily identified by eye as ‘‘grains,’’ no such distinction has been madein the measurement or reconstruction. We are free to associate sets of voxels with similar orientation as belonging to suchentities. Computationally, we associate connected voxels with small misorientations that are enclosed by orientationdiscontinuities larger than a threshold angle. Throughout the analysis presented here, we use a 5� threshold. Fig. 4(d) showsthe boundaries so deduced in the overlapping cross-sections of (a) through (c). Apparent boundary motions are quitevariable but it is clear that many grain correspondences between states can be made.

X
Z
Y
Fig. 5. Orientation maps for a single grain at S0 (left), S2 (center) and S3 (right). The average orientation of these voxels changes by 1:4� and 2:7� in passingfrom the initial to the deformed states; these small rotations do not produce distinguishable color changes on this scale which is normalized to span theentire cubic fundamental zone. (For interpretation of the references to colour in this figure legend, the reader is referred to the web version of this article.)
222 R. Pokharel et al. / International Journal of Plasticity 67 (2015) 217–234
To track grains in 3D at multiple strain levels, the grains in each state are initially sorted by volume, and only those thatcontain more than 100 voxels are tracked. For each grain in the initial state, all the grains in the deformed state are examinedand the misorientation between average orientations and distance between center of mass (COM) positions are computed inthree dimensions. The grain that gives the minimum misorientation angle and the smallest COM distance is considered to bethe same grain. To accept a correspondence, the misorientation must be 6 5� and the COM distance must be 6 50 voxels.Both threshold misorientation and COM have to be satisfied for it to be considered the same grain. One could also checkfor grain volumes but, owing to grain fragmentation during deformation, the number of grains that can be registereddecreases with strain. Therefore, out of �7000 grains, 4930 were registered between states and rest were not included intracked grain analyses. Fig. 5 shows a 3D projection of a tracked grain across the three strain states. While there is substantiallattice rotation (not discernible for moderate strains with this coarse color scale), the grain shape is largely the same in eachstate. This confirms that the tracking algorithm reliably maps grains between initial and deformed stages.
3. Results
3.1. Macroscopic texture evolution
As is well known, plastic deformation applied to a polycrystal along a constant strain path changes the texture. Fig. 6shows inverse pole figures computed using all measured voxels in each of states S0, S2, and S3. The orientations in the initialmicrostructure correspond to a nearly random texture with some weak peaks along h111i and h001i directions. As is knownexperimentally and can be understood by a simple Taylor analysis, lattice rotations strengthen the f111g fiber componentand, to a lesser extent the f100g component, while decreasing the frequency of orientations near f110g and f112g. Whilethese trends are clear in the figures, the sample would best be called weakly textured even after 12% tensile strain.
3.2. Anisotropic plastic deformation
By contrast to the well understood nature of grain orientation evolution shown in Fig. 6, the more challenging goal of thepresent study is to understand defect accumulation at a local level utilizing the full 3D measured volumes. It is obvious thatmacroscopic behavior is a manifestation of the collective behavior of ensembles of individual grains (Kalidindi et al., 2004)but many questions remain about how grains interact. Thus, making sense of the plastic response at the local, or grain andsubgrain scales is crucial for understanding emergent behavior at the macroscopic scale.
Given the limited spatial resolution (�2.8 lm) of the reconstructed orientation maps, micron and sub-micron structurescannot be directly observed or examined. However, if the dislocation structure is coarse enough, the high orientation accu-racy of the nf-HEDM measurements can potentially provide better information on orientation gradients, when compared toother orientation mapping techniques such as EBSD. Therefore, microstructure metrics such as intra-granular misorientation(IGM) and kernel average misorientation (KAM) fields (whose definitions are given below) are used to quantify orientationvariations (within the length scale of the measurement) for individual grains in the microstructure. KAM can be used toquantify lattice imperfections locally, while IGM can be seen as a parameter that quantifies a long-range order/disorderin terms of crystallographic orientation within a single grain. Dislocation (mainly geometrically necessary dislocation(GND)) structures are associated with local orientation gradient and lattice mismatch; therefore, IGM and KAM maps canbe associated with GND density or amount of plastic flow under deformation (Calcagnotto et al., 2010; Wright et al., 2011).
Intra-granular misorientation, or IGMðxÞ ¼ hðgðxÞ; ggrain averageÞ, values are calculated for each voxel within a grain as theminimum misorientation angle (h) between the orientation of each voxel (gðxÞ) and the grain’s average orientation(ggrain average) accounting for all crystal symmetries. KAM is defined as the average misorientation angle between each voxeland its 26 nearest neighbors (in 3D). At each voxel, misorientation is computed as KAMðxÞ ¼ hhðgðxÞ; gneighborÞ8h < wi, where

1.5
1.4
1.3
1.2
1.1
1.0
0.9
0.8
Max:1.34
Min:0.83
Max:1.65
Min:0.74
Max:2.02
Min:0.7
001
111
011 001
111
011001
111
011
(a) (b) (c)
311
211733
311
211733
311
211733
Fig. 6. Inverse pole figures showing the distribution of crystal poles that are parallel to the laboratory sample (001) axis which is the macroscopic tensileaxis. Left to right figures correspond to S0, S2 and S3 strain states. Colors show multiples of a random distribution for initial, 6% and 12% tensile strainstates. The color scale is the same for each map and minimum and maximum populations are noted for each state. (For interpretation of the references tocolour in this figure legend, the reader is referred to the web version of this article.)
0 0.5 1 1.5 2 2.50
0.5
1
1.5
2
2.5
3x 10
6
IGM (°)
Fre
quen
cy (
voxe
l)
S2 S3
μS2
= 0.21, σS2
= 0.12 μ
S3 = 0.69, σ
S3 = 0.54
0 0.5 1 1.50
2
4
6
8x 10
6
KAM (°)
Fre
quen
cy (
voxe
l)
S2 S3
μS2
= 0.13, σS2
= 0.07 μ
S3 = 0.48, σ
S3 = 0.28
(a) (b)
Fig. 7. Misorientation angle histograms of (a) IGM and (b) KAM for the two deformed states. The increase in the mean misorientation as well as thebroadening of the curve at S3 indicate defect accumulation with strain. l and r are the mean and standard deviation in degrees.
R. Pokharel et al. / International Journal of Plasticity 67 (2015) 217–234 223
values above a threshold angle w ¼ 5� are excluded from the averaging in order to suppress contributions from high anglegrain boundaries. Fig. 7(a) and (b) show distributions of IGM and KAM in S2 and S3 states generated from the entire measuredvolumes of material. Both long range (IGM) and short range (KAM) orientations increase in mean value, in the standarddeviation, and in the relative standard deviation. The fact that the standard deviation is comparable to the mean suggeststhat the deformation is highly heterogeneous. The broadening of the distributions due to plastic deformation in Cu isconsistent with EBSD results reported previously in Lebensohn et al., 2008.
The overall effect of deformation is shown qualitatively in Fig. 8(a) by plotting the orientation fields of matched 2Dcross-sections. Fig. 8(b) and (c) show IGM and KAM maps of the matched layers shown in Fig. 8(a) for three macroscopicstrains. Misorientation angles from IGM or KAM calculations are mapped to RGB colors at each point of the microstructure.In the fully annealed state, it is reasonable to consider that the orientation within each individual crystallite is uniform, towithin the measurement noise. In this case, the IGM values are mostly zero throughout the map. On the other hand, thepost-deformation grains show that each material point in a grain deviates in lattice orientation from the average. Note thatexpanded scale with 1.2� maximum IGM is used to see the details in majority of the grain. Additionally, grain averagecalculations are done in 3D, so in some cases, entire grain cross-sections have finite (even uniform) deviations from theaverage.
Similarly, KAM values at individual points were computed, where the expanded scale with the KAM ranging from 0 to 1degree was used to plot the spatial maps as shown in Fig. 8(c). The spatial distribution of KAM in the deformed states illus-trates large local orientation fluctuations in some grains, and less so in others. This clearly demonstrates the inhomogeneousnature of the plastic deformation and the importance of lattice orientation, grain size and shape, and local microstructuralneighborhoods. We probe correlations with a variety of these parameters below.
3.3. Microstructure evolution at the grain scale
Individual grains in a polycrystal are known (Poulsen, 2012) to exhibit heterogeneous and anisotropic deformationbehavior. Grains are irregularly shaped and deformation is non-uniform throughout the microstructure. The variability in
X Z
Y
X Z
YIGM (°)0.3 0.6 0.9 1.20.0
X Z
YKAM (°)0.25 0.5 0.75 1.00.0
IGM (°)
0.45
0.53
0.61
0.68
0.38
(a)
(b)
(c)
Fig. 8. Registered layers for pre- and post-deformation states. (a) Orientation maps, (b) IGM maps, and (b) KAM maps for S0 (left), S2 (center) and S3 (right)tensile strain for the registered layers. Heterogeneous plastic deformation with orientation gradient hot spots can be observed in both S2 and S3deformation states.
224 R. Pokharel et al. / International Journal of Plasticity 67 (2015) 217–234
the change in orientation, size, and shape after straining could be attributed to various factors. Some grains are morefavorably oriented to deform along the loading direction; therefore, they exhibit larger stretch while others show very littleor no shape change after deformation. Additionally, initial shape and size as well as the orientations and the influence of thesurrounding grains further enhance the anisotropic deformation of individual grains.
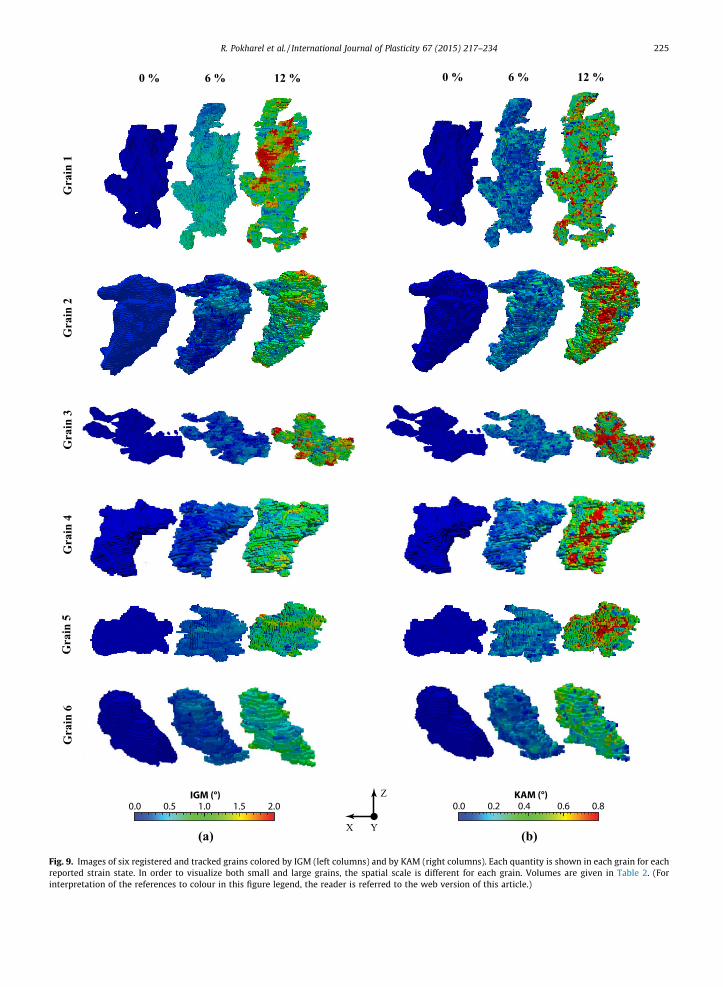
In order to illustrate the variety of deformation responses and the wealth of information that can be extracted fromspatially resolved measurements, six interior grains spanning a wide range of orientations were selected and are shownin Fig. 9. Inverse pole figures for these grains are shown in Fig. 10 where the tail and head of the arrow represent the averageorientation in S0 and S3 states, respectively.
To visualize the grain scale evolution, the IGM and KAM maps of the six selected grains are plotted in Fig. 9, at threedifferent strain states. The grains are numbered in a descending order with respect to their initial volume, where grain#1 is the largest, containing 129,215 voxels (1 voxel = 2:8� 2:8� 4 lm3) and grain #6 is the smallest containing 10,961voxels. Statistics for the six grains are presented in Table 2, from which it can be seen that the grain shape change withdeformation is very anisotropic, resulting in either monotonic increase in volume in some cases, for example grain #1and grain #4 or monotonic decrease in volume as observed in grain #6 or first increase then decrease and vice versa ingrains #2;#3, and #5. We note that volume increase or decrease of an individual grain corresponds to a change in thenumber of voxels whose orientation is within or exceeds the 5(�) misorientation threshold chosen for grain segmentation,respectively. Therefore a local increase of one grain’s volume corresponds to an equal decrease in the volume of itsimmediate neighbors and vice versa and the overall volume of the sample is conserved.
The irregular shapes of grains #1 and #6 at the initial state and the presence of gaps indicate that both grains have largenumbers of neighbors some of which are twin-related. Although no correlation between shape change and initial orientationcan be drawn from this particular analysis, the heterogeneous plastic deformation at the scale of individual grains is evident.For the six selected grains, an apparent strong dependence of magnitude of lattice rotation on initial orientation is observedin Fig. 10 and Table 2. This is in agreement with the findings in the literature (Pokharel et al., 2014; Oddershede et al., 2011;Winther et al., 2004). Grains 2 through 4 are located along the transition line ([110–112]) (Dillamore et al., 1972) and show alarger re-orientation than grains #1 and #5, which are closer to the stable orientations ([111] and [001]) and show smallerrotation. On the other hand, smaller orientation change is observed for grain #6 presumably owing to its small size eventhough the grain is located along the transition line, where it would be expected to exhibit large reorientation. The hetero-geneous spatial distributions of IGM and KAM values for individual grains are evident from Fig. 9. In addition, the hIGMi and
X
Z
Y
IGM (°)0.5 1.0 1.5 2.00.0
KAM (°)0.2 0.4 0.6 0.80.0
0 % 6 % 12 %0 % 6 % 12 %G
rain
1G
rain
2G
rain
3G
rain
4G
rain
5G
rain
6
(a) (b)
Fig. 9. Images of six registered and tracked grains colored by IGM (left columns) and by KAM (right columns). Each quantity is shown in each grain for eachreported strain state. In order to visualize both small and large grains, the spatial scale is different for each grain. Volumes are given in Table 2. (Forinterpretation of the references to colour in this figure legend, the reader is referred to the web version of this article.)
R. Pokharel et al. / International Journal of Plasticity 67 (2015) 217–234 225

001
111
101
1
2
5
4
6
3
Rotation (º)
1 1.5 2 2.5
S0
S3
0
Fig. 10. Lattice rotation between the S0 and S3 strain states for six selected bulk grains in Fig. 9. The gray arrows indicate the direction of rotation, startingat S0 and ending at S3 average orientations. The line connecting the two shapes is colored by magnitude of the rotation angle. (For interpretation of thereferences to colour in this figure legend, the reader is referred to the web version of this article.)
Table 2Measured quantities for the six registered grains between S0, S2 and S3 strain levels. At the initial state, the maximum volume (Vmax) � 0:0041 mm3 = 129,215volume elements (voxels). DV gives the percentage change in volume from S0 ! S2 and S2 ! S3. Change in average orientation between the initial and thedeformed states is given by h and hIGMi and hKAMi are the average accumulated misorientation in each volumetric grain after deformation.
Grain # V=Vmax DVS0!S2 (%) DVS2!S3 (%) hS0!S2 (�) hS0!S3 (�) hIGMiS2 (�) hIGMiS3 (�) hKAMiS2 (�) hKAMiS3 (�)
1 1.0 8.2 1.7 0.8 0.5 0.5 1.0 0.1 0.72 0.44 �13.9 8.1 1.4 2.7 0.1 0.8 0.1 0.73 0.36 20.2 �9.3 1.1 1.2 0.1 1.0 0.1 0.94 0.27 1.1 14.4 1.0 1.7 0.1 0.8 0.1 0.75 0.09 �9.8 19.5 0.8 0.6 0.2 0.7 0.1 0.66 0.08 �30.5 �11.7 0.9 0.7 0.2 0.7 0.1 0.4
226 R. Pokharel et al. / International Journal of Plasticity 67 (2015) 217–234
the hKAMi values given in Table 2 show positive correlation between the grain average misorientation development and thegrain size. A detailed statistical analysis based on large numbers of grains is presented in the following section to moredeeply examine these correlations.
3.4. Grain fragmentation
The segmentation of an orientation field into grains involves choosing a threshold misorientation angle, and the choice ofthe threshold angle is expected to determine the final grain size in a microstructure. During plastic deformation, some grainstend to subdivide into regions of high and low defect content, where sub-regions are separated by low angle boundaries. Thisphenomenon is termed grain fragmentation, which is commonly observed in plastic deformation to large strains (Quey et al.,2012), but for which no quantitative model exists.
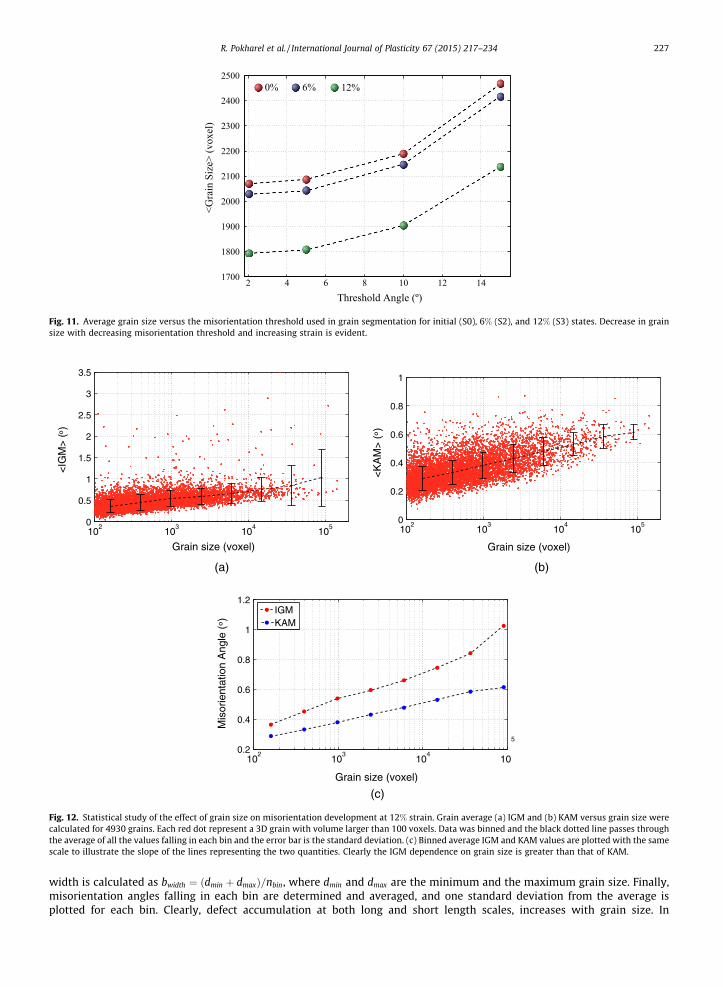
Choosing a low threshold angle to segment the grains in a deformed state results in categorizing each subgrain region asan individual grain, which reduces the average grain size of the entire microstructure. The probability plots for the distribu-tion of grain sizes at different threshold values and different strains were reported in (Pokharel, 2013), which exhibited littleor no effect of the choice of threshold on the general shape of the grain size distribution. In this paper, we have examined theaverage grain sizes resulting from 4 different choices of threshold angle at three different strain states. Fig. 11 shows theaverage grain size versus misorientation threshold angle at S0, S2 and S3 states. From the plot, it is evident that the averagegrain size increases with increasing threshold values, and as expected, the deformed material shows a lower average grainsize for a given threshold value.
3.5. Effect of grain size on defect accumulation
At a sub-micron length scale, mechanical properties of polycrystalline metals are known to be influenced by grain sizedistribution (Carroll et al., 2012). In this work, we have studied the origin of this dependency by examining the relationshipbetween grain size and defect accumulation.
A correlation plot of the effect of grain size on defect concentration is presented in Fig. 12. Red points in Fig. 12(a) and (b)show the grain average IGM and KAM for each grain over the entire range of grain sizes. For both quantities, large variationsare observed along with clustering of points displaying a positive trend, which is further confirmed by the trend line drawnthrough the average values. To better visualize the trend, grains are binned by grain size into eight equal bins, where the bin
2 4 6 8 10 12 141700
1800
1900
2000
2100
2200
2300
2400
2500
Threshold Angle (º)
<Gra
in S
ize>
(vox
el)
0% 6% 12%
Fig. 11. Average grain size versus the misorientation threshold used in grain segmentation for initial (S0), 6% (S2), and 12% (S3) states. Decrease in grainsize with decreasing misorientation threshold and increasing strain is evident.
102
103
104
1050
0.5
1
1.5
2
2.5
3
3.5
Grain size (voxel)
<IG
M>
( º)
102
103
104
1050
0.2
0.4
0.6
0.8
1
Grain size (voxel)
<K
AM
> (º)
102
103
104
10
5
0.2
0.4
0.6
0.8
1
1.2
Grain size (voxel)
Mis
orie
ntat
ion
Ang
le (º)
IGMKAM
(a) (b)
(c)
Fig. 12. Statistical study of the effect of grain size on misorientation development at 12% strain. Grain average (a) IGM and (b) KAM versus grain size werecalculated for 4930 grains. Each red dot represent a 3D grain with volume larger than 100 voxels. Data was binned and the black dotted line passes throughthe average of all the values falling in each bin and the error bar is the standard deviation. (c) Binned average IGM and KAM values are plotted with the samescale to illustrate the slope of the lines representing the two quantities. Clearly the IGM dependence on grain size is greater than that of KAM.
R. Pokharel et al. / International Journal of Plasticity 67 (2015) 217–234 227
width is calculated as bwidth ¼ ðdmin þ dmaxÞ=nbin, where dmin and dmax are the minimum and the maximum grain size. Finally,misorientation angles falling in each bin are determined and averaged, and one standard deviation from the average isplotted for each bin. Clearly, defect accumulation at both long and short length scales, increases with grain size. In

<IGM> (º)
(a) (b)
001 101
111
001 101
111
0.2
0.4
0.6
0.8
1.0
1.4
1.2
Fig. 13. Final orientation for 4930 tracked grains after 12% tensile strain, where (a) the radius of the circle is determined by the grain size and colored by thegrain averaged IGM angle. Same grains are illustrated in (b) where both the size and color of the open circles are varied by the IGM value.
228 R. Pokharel et al. / International Journal of Plasticity 67 (2015) 217–234
Fig. 12(c) the average IGM and KAM values are plotted; this shows that IGM has a stronger dependence on grains size thandoes KAM. This is not surprising since IGM is a measure of long-range orientation variation, which might intuitively beexpected to increase, on average, with grain size, whereas KAM pertains to local variation. This observed influence of grainsize is consistent with previous reports (Kamaya et al., 2005; Scheriau and Pippan, 2008). Furthermore, Valek et al., 2003reported the microdiffraction measurements of plastic deformation on Al(Cu) inter-connect, where diffraction peaks from4 neighboring grains were examined. Large streaking and rotation of diffraction peaks were observed for the largest grain,while smaller grains exhibited minimum peak distortion. This shape change was associated to the amount of defect contentwithin a grain; thus, further confirming the dependence of plastic deformation on grain size.
Fig. 13 shows the grain average orientation for all 4930 tracked grains, colored by the hIGMi value at the S3 state. InFig. 13(a), the grain size dependence is illustrated, where the marker (circle) size is normalized by the grain volume. Fromvisual inspection, an interesting trend can be observed in the center of the triangle where most of the largest grains arelocated. It is this region where the grain orientation gives a lower Taylor factor with respect to the tensile loading axis. Inaddition, most grains in this region also seem to have smaller hIGMi values. Although Fig. 12(a), shows an average trendof increasing IGM with grain size, the few largest grains with low IGM values seen in Fig. 13(a) may be associated to theoutliers visible in Fig. 12(a). The same information as shown in Fig. 13(a) is presented in Fig. 13(b), this time varyingthe marker size and coloring by its hIGMi value, and it can be seen that grains that have moved or are moving towardsthe h001i and h111i corners develop larger intragranular misorientation, indicating defect accumulation, than the restof the grains.
3.6. Plastic deformation evolution
During plastic deformation, some grains rotate as a unit, while others accumulate defects in the grain interior or nearboundaries as above. Multiple slip allows a grain to accommodate an imposed strain, and heterogeneities in slip allowgradients to develop. The formation of overall deformation texture, as shown by the inverse pole figures in Fig. 6(b) and(c), although not particularly sharp, illustrate the effect of plastic deformation. Additionally, Fig. 11 demonstrates grainfragmentation, which is in accord with results in the literature on subgrain structure formation within previously annealedgrains (Mishra et al., 2005). Previous work on plastic deformation has also explored the effect of initial grain size on latticerotation (Winther et al., 2004), and a similar correlation is hinted at by the lattice rotation plot for the six grains in Fig. 10.
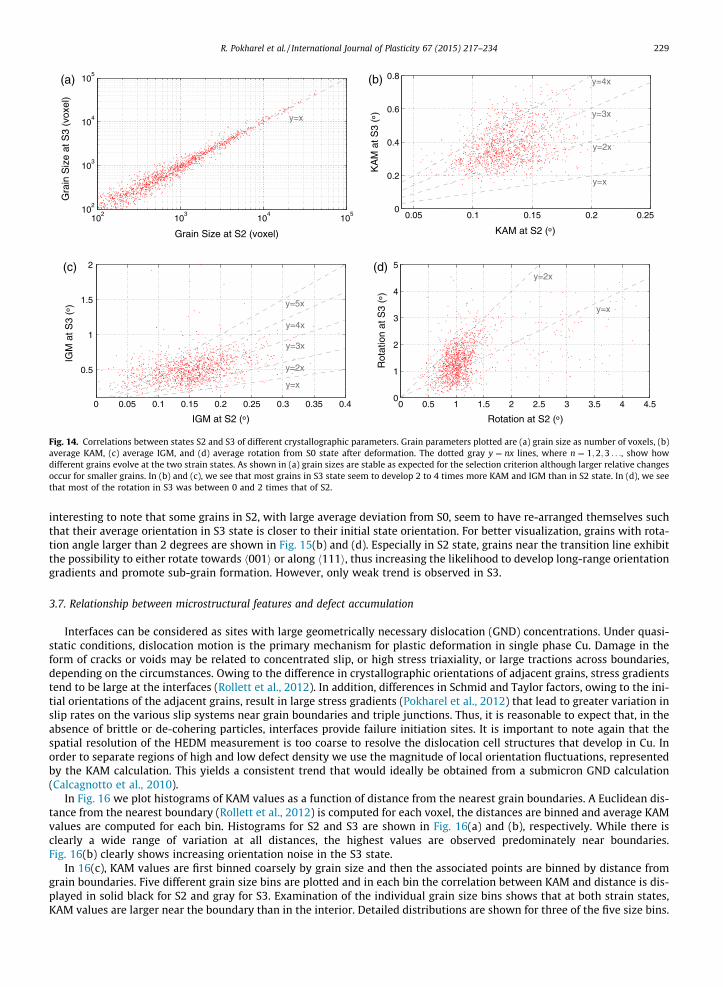
Out of the 4930 tracked 3D grains, statistical analyses were performed on 1366 grains. Only grains that retained at least60% of their initial volume are included so as to exclude fragmented grains, which would otherwise influence the latticerotation calculation. Fig. 14 presents different crystallographic parameters for the filtered grains and illustrates the correla-tion between S2 and S3 states. From the grain size plot in Fig. 14(a), we see that the volume of the chosen grains are similarat the two deformed levels, which was as intended. Correlation for KAM and IGM are displayed in Fig. 14(b) and (c), respec-tively, where the increase in both quantities after deformation is demonstrated. However, the spread in the data indicates aninhomogeneous accumulation with strain. A similar trend is seen for lattice rotation, where variability in the data points sug-gests the heterogenous nature of deformation.
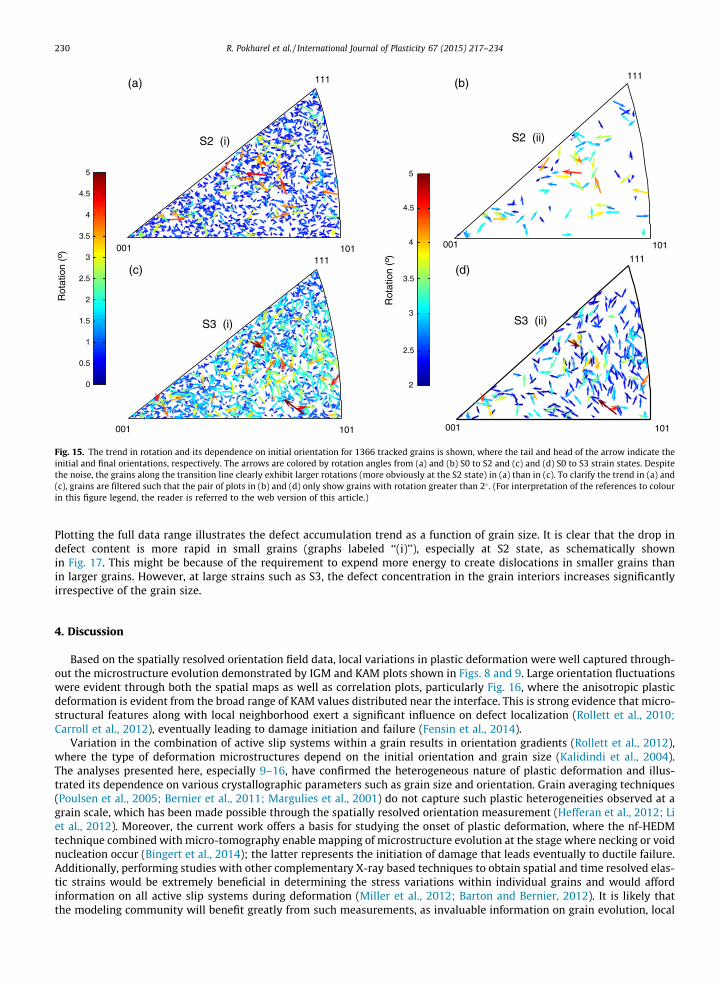
In Fig. 15, grain reorientation is illustrated by plotting the grain average orientations at pre- and post-deformed states.The coloring scheme is based on the lattice rotation angle at S2 and S3 states. As shown in Fig. 15(a), in S2 state, grainsin the center of the inverse pole figure seem to rotate more, while little or no rotation is observed in the rest of the grains.With further deformation, however, almost all grains exhibit some rotation at the S3 state, as seen in Fig. 15(c). It is also
102
103
104
10510
2
103
104
105
Grain Size at S2 (voxel)
Gra
in S
ize
at S
3 (v
oxel
)
0 0.5 1 1.5 2 2.5 3 3.5 4 4.50
1
2
3
4
5
Rotation at S2 (º)
Rot
atio
n at
S3
(º)
0.05 0.1 0.15 0.2 0.250
0.2
0.4
0.6
0.8
KAM at S2 (º)
KA
M a
t S3
(º)
0 0.05 0.1 0.15 0.2 0.25 0.3 0.35 0.4
0.5
1
1.5
2
IGM at S2 (º)
IGM
at S
3 (º
)(a)
(c)
(b)
(d)
y=4x
y=3x
y=2x
y=x
y=4x
y=3x
y=2x
y=x
y=5x
y=x
y=x
y=2x
Fig. 14. Correlations between states S2 and S3 of different crystallographic parameters. Grain parameters plotted are (a) grain size as number of voxels, (b)average KAM, (c) average IGM, and (d) average rotation from S0 state after deformation. The dotted gray y ¼ nx lines, where n ¼ 1;2;3 . . ., show howdifferent grains evolve at the two strain states. As shown in (a) grain sizes are stable as expected for the selection criterion although larger relative changesoccur for smaller grains. In (b) and (c), we see that most grains in S3 state seem to develop 2 to 4 times more KAM and IGM than in S2 state. In (d), we seethat most of the rotation in S3 was between 0 and 2 times that of S2.
R. Pokharel et al. / International Journal of Plasticity 67 (2015) 217–234 229
interesting to note that some grains in S2, with large average deviation from S0, seem to have re-arranged themselves suchthat their average orientation in S3 state is closer to their initial state orientation. For better visualization, grains with rota-tion angle larger than 2 degrees are shown in Fig. 15(b) and (d). Especially in S2 state, grains near the transition line exhibitthe possibility to either rotate towards h001i or along h111i, thus increasing the likelihood to develop long-range orientationgradients and promote sub-grain formation. However, only weak trend is observed in S3.
3.7. Relationship between microstructural features and defect accumulation
Interfaces can be considered as sites with large geometrically necessary dislocation (GND) concentrations. Under quasi-static conditions, dislocation motion is the primary mechanism for plastic deformation in single phase Cu. Damage in theform of cracks or voids may be related to concentrated slip, or high stress triaxiality, or large tractions across boundaries,depending on the circumstances. Owing to the difference in crystallographic orientations of adjacent grains, stress gradientstend to be large at the interfaces (Rollett et al., 2012). In addition, differences in Schmid and Taylor factors, owing to the ini-tial orientations of the adjacent grains, result in large stress gradients (Pokharel et al., 2012) that lead to greater variation inslip rates on the various slip systems near grain boundaries and triple junctions. Thus, it is reasonable to expect that, in theabsence of brittle or de-cohering particles, interfaces provide failure initiation sites. It is important to note again that thespatial resolution of the HEDM measurement is too coarse to resolve the dislocation cell structures that develop in Cu. Inorder to separate regions of high and low defect density we use the magnitude of local orientation fluctuations, representedby the KAM calculation. This yields a consistent trend that would ideally be obtained from a submicron GND calculation(Calcagnotto et al., 2010).
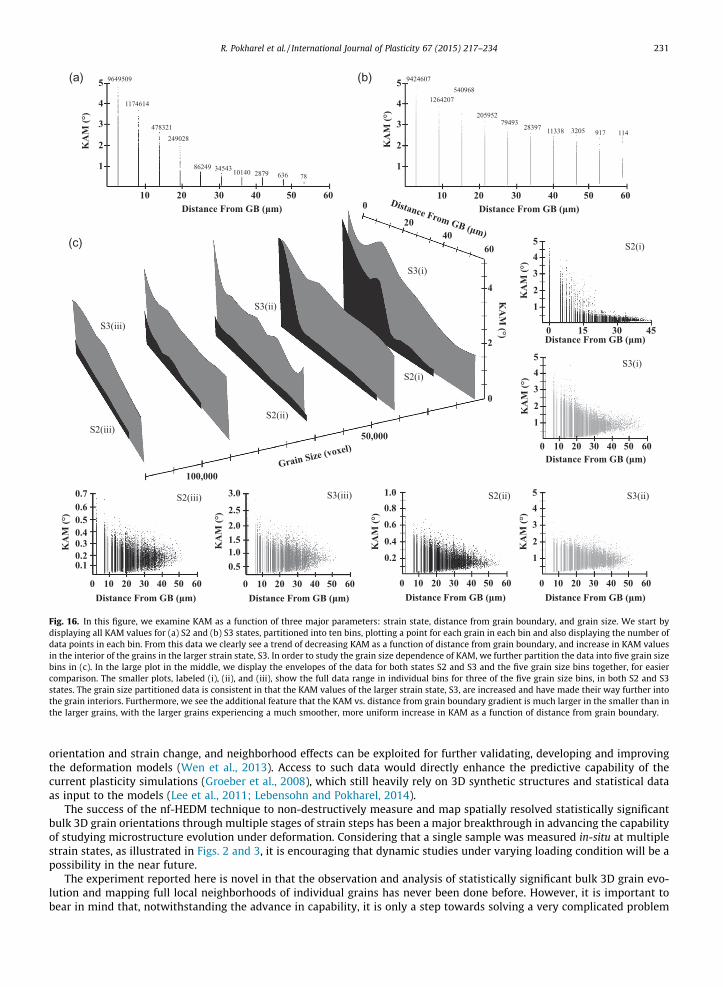
In Fig. 16 we plot histograms of KAM values as a function of distance from the nearest grain boundaries. A Euclidean dis-tance from the nearest boundary (Rollett et al., 2012) is computed for each voxel, the distances are binned and average KAMvalues are computed for each bin. Histograms for S2 and S3 are shown in Fig. 16(a) and (b), respectively. While there isclearly a wide range of variation at all distances, the highest values are observed predominately near boundaries.Fig. 16(b) clearly shows increasing orientation noise in the S3 state.
In 16(c), KAM values are first binned coarsely by grain size and then the associated points are binned by distance fromgrain boundaries. Five different grain size bins are plotted and in each bin the correlation between KAM and distance is dis-played in solid black for S2 and gray for S3. Examination of the individual grain size bins shows that at both strain states,KAM values are larger near the boundary than in the interior. Detailed distributions are shown for three of the five size bins.
Rot
atio
n (º )
0
0.5
1
1.5
2
2.5
3
3.5
4
4.5
5
S2 (i)
S3 (i)
001
111
101
001
111
101
S2 (ii)
001
111
101
Rot
atio
n (º)
2
3
4
5
2.5
3.5
4.5
S3 (ii)
001
111
101
(a) (b)
(c) (d)
Fig. 15. The trend in rotation and its dependence on initial orientation for 1366 tracked grains is shown, where the tail and head of the arrow indicate theinitial and final orientations, respectively. The arrows are colored by rotation angles from (a) and (b) S0 to S2 and (c) and (d) S0 to S3 strain states. Despitethe noise, the grains along the transition line clearly exhibit larger rotations (more obviously at the S2 state) in (a) than in (c). To clarify the trend in (a) and(c), grains are filtered such that the pair of plots in (b) and (d) only show grains with rotation greater than 2� . (For interpretation of the references to colourin this figure legend, the reader is referred to the web version of this article.)
230 R. Pokharel et al. / International Journal of Plasticity 67 (2015) 217–234
Plotting the full data range illustrates the defect accumulation trend as a function of grain size. It is clear that the drop indefect content is more rapid in small grains (graphs labeled ‘‘(i)’’), especially at S2 state, as schematically shownin Fig. 17. This might be because of the requirement to expend more energy to create dislocations in smaller grains thanin larger grains. However, at large strains such as S3, the defect concentration in the grain interiors increases significantlyirrespective of the grain size.
4. Discussion
Based on the spatially resolved orientation field data, local variations in plastic deformation were well captured through-out the microstructure evolution demonstrated by IGM and KAM plots shown in Figs. 8 and 9. Large orientation fluctuationswere evident through both the spatial maps as well as correlation plots, particularly Fig. 16, where the anisotropic plasticdeformation is evident from the broad range of KAM values distributed near the interface. This is strong evidence that micro-structural features along with local neighborhood exert a significant influence on defect localization (Rollett et al., 2010;Carroll et al., 2012), eventually leading to damage initiation and failure (Fensin et al., 2014).
Variation in the combination of active slip systems within a grain results in orientation gradients (Rollett et al., 2012),where the type of deformation microstructures depend on the initial orientation and grain size (Kalidindi et al., 2004).The analyses presented here, especially 9–16, have confirmed the heterogeneous nature of plastic deformation and illus-trated its dependence on various crystallographic parameters such as grain size and orientation. Grain averaging techniques(Poulsen et al., 2005; Bernier et al., 2011; Margulies et al., 2001) do not capture such plastic heterogeneities observed at agrain scale, which has been made possible through the spatially resolved orientation measurement (Hefferan et al., 2012; Liet al., 2012). Moreover, the current work offers a basis for studying the onset of plastic deformation, where the nf-HEDMtechnique combined with micro-tomography enable mapping of microstructure evolution at the stage where necking or voidnucleation occur (Bingert et al., 2014); the latter represents the initiation of damage that leads eventually to ductile failure.Additionally, performing studies with other complementary X-ray based techniques to obtain spatial and time resolved elas-tic strains would be extremely beneficial in determining the stress variations within individual grains and would affordinformation on all active slip systems during deformation (Miller et al., 2012; Barton and Bernier, 2012). It is likely thatthe modeling community will benefit greatly from such measurements, as invaluable information on grain evolution, local
0
2
4
100,000
50,000
KA
M (°)
Distance From GB (μm)
Grain Size (voxel)
10 20 30 40 50 60
1
2
3
4
5
Distance From GB (μm)
KA
M (°
)
10 20 30 40 50 60
1
2
3
4
5
Distance From GB (μm)
KA
M (°
)
1
2
3
45
KA
M (°
)
0 15 30 45Distance From GB (μm)
9424607
1264207540968
20595279493
28397 11338 3205 917 114
9649509
1174614
478321249028
86249 34543 10140 2879 636 78
1
2
3
45
KA
M (°
)
10 20 30 40 50 60Distance From GB (μm)
0
0.2
0.4
0.6
0.81.0
KA
M (°
)
10 20 30 40 50 60Distance From GB (μm)
0
1
2
3
45
KA
M (°
)
10 20 30 40 50 60Distance From GB (μm)
0
KA
M (°
)
10 20 30 40 50 60Distance From GB (μm)
0
0.20.1
0.40.3
0.60.5
0.7
KA
M (°
)
10 20 30 40 50 60Distance From GB (μm)
0
1.00.5
2.01.5
3.0
2.5
S2(i)
S3(i)
S2(ii) S3(ii)S2(iii) S3(iii)
S2(i)
S3(i)
S2(ii)
S3(ii)
S2(iii)
S3(iii)
(b)(a)
(c)
0
2040
60
Fig. 16. In this figure, we examine KAM as a function of three major parameters: strain state, distance from grain boundary, and grain size. We start bydisplaying all KAM values for (a) S2 and (b) S3 states, partitioned into ten bins, plotting a point for each grain in each bin and also displaying the number ofdata points in each bin. From this data we clearly see a trend of decreasing KAM as a function of distance from grain boundary, and increase in KAM valuesin the interior of the grains in the larger strain state, S3. In order to study the grain size dependence of KAM, we further partition the data into five grain sizebins in (c). In the large plot in the middle, we display the envelopes of the data for both states S2 and S3 and the five grain size bins together, for easiercomparison. The smaller plots, labeled (i), (ii), and (iii), show the full data range in individual bins for three of the five grain size bins, in both S2 and S3states. The grain size partitioned data is consistent in that the KAM values of the larger strain state, S3, are increased and have made their way further intothe grain interiors. Furthermore, we see the additional feature that the KAM vs. distance from grain boundary gradient is much larger in the smaller than inthe larger grains, with the larger grains experiencing a much smoother, more uniform increase in KAM as a function of distance from grain boundary.
R. Pokharel et al. / International Journal of Plasticity 67 (2015) 217–234 231
orientation and strain change, and neighborhood effects can be exploited for further validating, developing and improvingthe deformation models (Wen et al., 2013). Access to such data would directly enhance the predictive capability of thecurrent plasticity simulations (Groeber et al., 2008), which still heavily rely on 3D synthetic structures and statistical dataas input to the models (Lee et al., 2011; Lebensohn and Pokharel, 2014).
The success of the nf-HEDM technique to non-destructively measure and map spatially resolved statistically significantbulk 3D grain orientations through multiple stages of strain steps has been a major breakthrough in advancing the capabilityof studying microstructure evolution under deformation. Considering that a single sample was measured in-situ at multiplestrain states, as illustrated in Figs. 2 and 3, it is encouraging that dynamic studies under varying loading condition will be apossibility in the near future.
The experiment reported here is novel in that the observation and analysis of statistically significant bulk 3D grain evo-lution and mapping full local neighborhoods of individual grains has never been done before. However, it is important tobear in mind that, notwithstanding the advance in capability, it is only a step towards solving a very complicated problem

KA
M (°
)
μDistance From GB ( m)
Fig. 17. The data in Fig. 16(c) implies the possibility of the scenario depicted above, in which a dramatic difference in KAM versus distance to grainboundary is seen in two adjacent grains of different size. One possible explanation for this is that while the two grains experience a similar macroscopicstrain near the interface, in smaller grains the defect content accumulation is mostly because of incompatibilities near the boundary as dislocation pile-up isharder in the grain interior. In the case of larger grains, dislocation pile up and dislocation motion are easier in response to shear stresses and, as a result,more uniform defect accumulation is observed in the grain interior and near boundaries.
232 R. Pokharel et al. / International Journal of Plasticity 67 (2015) 217–234
of understanding the full mechanics of the deformation process. Further challenges will exist before this type of informationcan be applied to, for example, designing new materials.
5. Conclusions
A nf-HEDM experiment was performed and bulk 3D volumes of a Cu sample undergoing uniaxial strain were measured atdifferent stages of deformation. For each state, large data sets were obtained with � 7000 grains, which allowed for repre-sentative sampling of the defect accumulation and plastic deformation. Selected features and their evolution were extractedfrom the large data sets. The developed tools were tested, and the analyses were performed on the initial, 6% and 12%
deformed microstructures. Microstructural evolution was studied at both the macroscopic and local levels.The availability of large statistical data volumes indicated that the mechanisms involved in heterogeneous deformation
are more complex than the way they are currently being described. This has posed several challenges in terms of datahandling, mining and representation of various crystallographic parameters, and an ongoing effort is aimed at developingquantitative tools and appropriate metrics for extracting relevant information that would give broader insights on thephysical mechanisms involved in the deformation process. Along with the quantitative representation of the extractedinformation from the experimental data presented here, comparisons with numerical modeling based on crystal plasticitywill follow.
In summary, our results emphasize that deformation in copper is dominated by heterogeneity. While our results are inagreement with macroscopic observations such as texture evolution, distributions of multiple quantities related to defectcontent within individual grains show standard deviations of the same order as average values. The breadth of these distri-butions is presumably due to the fact that each grain experiences a unique anisotropic environment due to its specific neigh-borhood. Within these broad distributions, we observe a trend toward increased disorder in proximity to grain boundaries asis consistent with dislocation pile ups. These data raise the question as to whether computational plasticity models based onstandard constitutive relations can be tuned to track the observed heterogeneity. As is shown in a recent review (Pokharelet al., 2014), such efforts to date have not been successful.
It is only with the voxelized, forward model based reconstruction method applied to near-field HEDM data sets that thecharacterizations presented here become possible. Future work can be expected to yield even more comprehensive data setswith spatially resolved elastic strain information to complement the orientation maps presented here. Advances in datacollection technologies, in-situ sample environments, and analysis methods will combine to yield data sets that can be usedto test and constrain computational models.
Acknowledgements
This research was supported by the US Department of Energy, Office of Basic Energy Sciences, Division of MaterialsSciences and Engineering, under Award DESC0002001. Use of the Advanced Photon Source was supported by the USDepartment of Energy, Office of Science, Office of Basic Energy Sciences, under Contract No. DE-AC02-06CH11357. Partialsupport from Los Alamos National Laboratory’s Directed Research and Development (LDRD-DR Project 20140114DR) is alsoacknowledged. Part of this work was performed under the auspices of the US Department of Energy by Lawrence LivermoreNational Laboratory under Contract DE-AC52-07NA27344. This Research was also supported in part by the National ScienceFoundation through XSEDE resources provided by Texas Advanced Computing Center under Grant No. DMR080072, and inpart by the National Energy Research Scientific Computing Center, which is supported by the Office of Science of the USDepartment of Energy under Contract No. DE-AC02-05CH11231.

R. Pokharel et al. / International Journal of Plasticity 67 (2015) 217–234 233
References
Barabash, R., Ice, G., Liu, W., Barabash, O., 2009. Polychromatic microdiffraction characterization of defect gradients in severely deformed materials. Micron40 (1), 28–36.
Barton, N., Bernier, J., 2012. A method for intragranular orientation and lattice strain distribution determination. J. Appl. Crystallogr. 45 (6), 1145–1155.Bernier, J., Miller, M., 2006. A direct method for the determination of the mean orientation-dependent elastic strains and stresses in polycrystalline
materials from strain pole figures. J. Appl. Crystallogr. 39 (3), 358–368.Bernier, J., Barton, N., Lienert, U., Miller, M., 2011. Far-field high-energy diffraction microscopy: a tool for intergranular orientation and strain analysis. J.
Strain Anal. Eng. Des. 46 (7), 527–547.Bingert, J., Suter, R., Lind, J., Li, S., Pokharel, R., Trujillo, C., 2014. High-energy diffraction microscopy characterization of spall damage. Dynamic Behavior of
Materials, vol. 1. Springer, pp. 397–403.Calcagnotto, M., Ponge, D., Demir, E., Raabe, D., 2010. Orientation gradients and geometrically necessary dislocations in ultrafine grained dual-phase steels
studied by 2d and 3d ebsd. Mater. Sci. Eng.: A 527 (10), 2738–2746.Carroll, J., Brewer, L., Battaile, C., Boyce, B., Emery, J., 2012. The effect of grain size on local deformation near a void-like stress concentration. Int. J. Plast. 39,
46–60.Cerreta, E., Bingert, J., Gray III, G., Trujillo, C., Lopez, M., Bronkhorst, C., Hansen, B., 2013. Microstructural examination of quasi-static and dynamic shear in
high-purity iron. Int. J. Plast. 40, 23–38.Dillamore, I., Morris, P., Smith, C., Hutchinson, W., 1972. Transition bands and recrystallization in metals. Proc. Royal Soc. Lond.: A. Math. Phys. Sci. 329
(1579), 405–420.Fensin, S., Escobedo-Diaz, J., Brandl, C., Cerreta, E., Gray III, G., Germann, T., Valone, S., 2014. Effect of loading direction on grain boundary failure under shock
loading. Acta Mater. 64, 113–122.Groeber, M., Ghosh, S., Uchic, M., Dimiduk, D., 2008. A framework for automated analysis and simulation of 3d polycrystalline microstructures. Part 1:
Statistical characterization. Acta Mater. 56 (6), 1257–1273.Hefferan, C., Lind, J., Li, S., Lienert, U., Rollett, A., Suter, R., 2012. Observation of recovery and recrystallization in high-purity aluminum measured with
forward modeling analysis of high-energy diffraction microscopy. Acta Mater. 60 (10), 4311–4318.Joffe, A., Kirpitcheva, M., 1922. Rontgenograms of strained crystals. Philos. Mag. 43 (253), 204–206, 6th series.Kalidindi, S., Bhattacharyya, A., Doherty, R., 2004. Detailed analyses of grain–scale plastic deformation in columnar polycrystalline aluminium using
orientation image mapping and crystal plasticity models. Proc. Royal Soc. Lond. Ser. A: Math. Phys. Eng. Sci. 460 (2047), 1935–1956.Kamaya, M., Wilkinson, A.J., Titchmarsh, J.M., 2005. Measurement of plastic strain of polycrystalline material by electron backscatter diffraction. Nucl. Eng.
Des. 235 (6), 713–725.Larson, B., Yang, W., Ice, G., Budai, J., Tischler, J., 2002. Three-dimensional X-ray structural microscopy with submicrometre resolution. Nature 415 (6874),
887–890.Lebensohn, R., Pokharel, R., 2014. Interpretation of microstructural effects on porosity evolution using a combined dilatational/crystal plasticity
computational approach. JOM 66 (3), 443–537.Lebensohn, R., Brenner, R., Castelnau, O., Rollett, A., 2008. Orientation image-based micromechanical modelling of subgrain texture evolution in
polycrystalline copper. Acta Mater. 56 (15), 3914–3926.Lee, S.-B., Lebensohn, R., Rollett, A., 2011. Modeling the viscoplastic micromechanical response of two-phase materials using fast fourier transforms. Int. J.
Plast. 27 (5), 707–727.Li, S., Suter, R., 2013. Adaptive reconstruction method for three-dimensional orientation imaging. J. Appl. Crystallogr. 46 (2), 512–524.Lienert, U., Li, S.F., Hefferan, C.M., Lind, J., Suter, R.M., Bernier, J.V., Barton, N.R., Brandes, M.C., Mills, M.J., Miller, M.P., Jakobsen, B., Pantleon, W., 2011. High-
energy diffraction microscopy at the advanced photon source. JOM 63 (7), 70–77.Li, S., Lind, J., Hefferan, C., Pokharel, R., Lienert, U., Rollett, A., Suter, R., 2012. Three-dimensional plastic response in polycrystalline copper via near-field
high-energy X-ray diffraction microscopy. J. Appl. Crystallogr. 45 (6), 1098–1108.Lind, J., Li, S., Pokharel, R., Lienert, U., Rollett, A., Suter, R., 2014. Tensile twin nucleation events coupled to neighboring slip observed in 3d. Acta Mater. 76,
213–220.Ludwig, W., Schmidt, S., Lauridsen, E., Poulsen, H., 2008. X-ray diffraction contrast tomography: a novel technique for three-dimensional grain mapping of
polycrystals. i. Direct beam case. J. Appl. Crystallogr. 41 (2), 302–309.Margulies, L., Winther, G., Poulsen, H., 2001. In situ measurement of grain rotation during deformation of polycrystals. Science 291 (5512), 2392–2394.McDonald, J., Ma, S., Pollock, T., Yalisove, S., Nees, J., 2008. Femtosecond pulsed laser ablation dynamics and ablation morphology of nickel based superalloy
cmsx-4. J. Appl. Phys. 103 (9), 093111.Miller, M., Suter, R., Lienert, U., Beaudoin, A., Fontes, E., Almer, J., Schuren, J., 2012. High-energy needs and capabilities to study multiscale phenomena in
crystalline materials. Synchrotron Radiat. News 25 (6), 18–26.Mishra, A., Richard, V., Gregori, F., Asaro, R., Meyers, M., 2005. Microstructural evolution in copper processed by severe plastic deformation. Mater. Sci. Eng.:
A 410, 290–298.Oddershede, J., Schmidt, S., Poulsen, H., Margulies, L., Wright, J., Moscicki, M., Reimers, W., Winther, G., 2011. Grain-resolved elastic strains in deformed
copper measured by three-dimensional X-ray diffraction. Mater. Characteriz. 62 (7), 651–660.Pokharel, R., 2013. Spatially resolved in-situ study of plastic deformation in polycrystalline copper using high-energy x-rays and full-field simulations. Ph.D.
thesis, Carnegie Mellon University.Pokharel, R., Li, S., Lind, J., Hefferan, C., Lienert, U., Lebensohn, R., Suter, R., Rollett, A., 2012. Quantifying damage accumulation using state-of-the-art fft
method. Mater. Sci. Forum 702, 515–518.Pokharel, R., Lind, J., Kanjarla, A., Li, S., Lebensohn, R., Kenesei, P., Suter, R., Rollett, A., 2014. Polycrystal plasticity: comparison between grain scale
observations of deformation and simulations. Annu. Rev. Cond. Matter Phys. 5, 317–346.Pouillier, E., Gourgues, A.-F., Tanguy, D., Busso, E.P., 2012. A study of intergranular fracture in an aluminium alloy due to hydrogen embrittlement. Int. J.
Plast. 34, 139–153.Poulsen, H., 2012. An introduction to three-dimensional X-ray diffraction microscopy. J. Appl. Crystallogr. 45 (6), 1084–1097.Poulsen, H., Jensen, D., Vaughan, G., 2004. Three-dimensional X-ray diffraction microscopy using high-energy X-rays. MRS Bull. 29 (03), 166–169.Poulsen, H., Lienert, U., Pantleon, W., 2005. Characterisation of orientation distributions of individual grains within deformed metals. Mater. Sci. Technol. 21
(12), 1397–1400.Quey, R., Dawson, P., Driver, J., 2012. Grain orientation fragmentation in hot-deformed aluminium: experiment and simulation. J. Mech. Phys. Solids 60 (3),
509–524.Rollett, A., Lebensohn, R., Groeber, M., Choi, Y., Li, J., Rohrer, G., 2010. Stress hot spots in viscoplastic deformation of polycrystals. Modell. Simul. Mater. Sci.
Eng. 18 (7), 074005.Rollett, A., Wagner, F., Allain-Bonasso, N., Field, D., Lebensohn, R., 2012. Comparison of gradients in orientation and stress between experiment and
simulation. Mater. Sci. Forum 702–703, 463–468.Rowenhorst, D., Lewis, A., 2011. Image processing and analysis of 3-d microscopy data. JOM 63 (3), 53–57.Scheriau, S., Pippan, R., 2008. Influence of grain size on orientation changes during plastic deformation. Mater. Sci. Eng.: A 493 (1), 48–52.Schwartz, A., Kumar, M., Adams, B., Field, D., 2009. Electron Backscatter Diffraction in Materials Science, second ed. Springer, New York.Shade, P.A., Groeber, M.A., Uchic, M.D., Turner, T.J., Dimiduk, D.M., Woodward, C., Choi, Y.-S., Wheeler, R., 2011. Micro-tensile testing and 3d-ebsd
characterization of pure nickel multi-crystals (preprint). Tech. rep., DTIC Document.

234 R. Pokharel et al. / International Journal of Plasticity 67 (2015) 217–234
Shade, P., Groeber, M., Schuren, J., Uchic, M., 2013. Experimental measurement of surface strains and local lattice rotations combined with 3dmicrostructure reconstruction from deformed polycrystalline ensembles at the micro-scale. Integrat. Mater. Manuf. Innovat. 2 (1), 5.
Suter, R., Hennessy, D., Xiao, C., Lienert, U., 2006. Forward modeling method for microstructure reconstruction using X-ray diffraction microscopy: single-crystal verification. Rev. Sci. Instrum. 77 (12), 123905.
Uchic, M., Groeber, M., Rollett, A., 2011. Automated serial sectioning methods for rapid collection of 3-d microstructure data. JOM 63 (3), 25–29.Valek, B., Tamura, N., Spolenak, R., Caldwell, W., MacDowell, A., Celestre, R., Padmore, H., Bravman, J., Batterman, B., Nix, W., et al, 2003. Early stage of plastic
deformation in thin films undergoing electromigration. J. Appl. Phys. 94 (6), 3757–3761.Warren, B., 1969. X-ray Diffraction. Courier Dover Publications.Wen, W., M’Guil, S., Ahzi, S., Gracio, J., 2013. Coupled effects of the lattice rotation definition, twinning and interaction strength on the fcc rolling texture
evolution using the viscoplastic /-model. Int. J. Plast. 46, 23–36.Winther, G., Margulies, L., Schmidt, S., Poulsen, H., 2004. Lattice rotations of individual bulk grains. part ii: Correlation with initial orientation and model
comparison. Acta Mater. 52 (10), 2863–2872.Wright, S.I., Nowell, M.M., Field, D.P., 2011. A review of strain analysis using electron backscatter diffraction. Microsc. Microanal. 17 (03), 316–329.Zeghadi, A., N’guyen, F., Forest, S., Gourgues, A.-F., Bouaziz, O., 2007. Ensemble averaging stress–strain fields in polycrystalline aggregates with a constrained
surface microstructure–part 1: Anisotropic elastic behaviour. Philos. Mag. 87 (8–9), 1401–1424.Zhao, Z., Ramesh, M., Raabe, D., Cuitino, A., Radovitzky, R., 2008. Investigation of three-dimensional aspects of grain-scale plastic surface deformation of an
aluminum oligocrystal. Int. J. Plast. 24 (12), 2278–2297.