in-state tuition for undocumented immigrants and its ...ftp.iza.org/dp6857.pdf · in-state tuition...
TRANSCRIPT

DI
SC
US
SI
ON
P
AP
ER
S
ER
IE
S
Forschungsinstitut zur Zukunft der ArbeitInstitute for the Study of Labor
In-State Tuition for Undocumented Immigrants and its Impact on College Enrollment, Tuition Costs,Student Financial Aid, and Indebtedness
IZA DP No. 6857
September 2012
Catalina Amuedo-DorantesChad Sparber
In-State Tuition for Undocumented
Immigrants and its Impact on College Enrollment, Tuition Costs,
Student Financial Aid, and Indebtedness
Catalina Amuedo-Dorantes San Diego State University
and IZA
Chad Sparber Colgate University
Discussion Paper No. 6857 September 2012
IZA
P.O. Box 7240 53072 Bonn
Germany
Phone: +49-228-3894-0 Fax: +49-228-3894-180
E-mail: [email protected]
Any opinions expressed here are those of the author(s) and not those of IZA. Research published in this series may include views on policy, but the institute itself takes no institutional policy positions. The IZA research network is committed to the IZA Guiding Principles of Research Integrity. The Institute for the Study of Labor (IZA) in Bonn is a local and virtual international research center and a place of communication between science, politics and business. IZA is an independent nonprofit organization supported by Deutsche Post Foundation. The center is associated with the University of Bonn and offers a stimulating research environment through its international network, workshops and conferences, data service, project support, research visits and doctoral program. IZA engages in (i) original and internationally competitive research in all fields of labor economics, (ii) development of policy concepts, and (iii) dissemination of research results and concepts to the interested public. IZA Discussion Papers often represent preliminary work and are circulated to encourage discussion. Citation of such a paper should account for its provisional character. A revised version may be available directly from the author.

IZA Discussion Paper No. 6857 September 2012
ABSTRACT
In-State Tuition for Undocumented Immigrants and its Impact on College Enrollment, Tuition Costs,
Student Financial Aid, and Indebtedness* The 1996 Immigration Reform and Responsibility Act barred states from giving unlawful residents postsecondary education benefits that states do not offer to U.S. citizens. In contrast to this federal law, several states have passed legislation explicitly allowing undocumented immigrants to pay in-state tuition rates. We use a difference-in-difference estimation methodology to assess intended and unintended consequences of this tuition policy. First, we find evidence consistent with past studies that postsecondary enrollment rates of Hispanic non-citizens have increased in treatment states relative to control states without negatively impacting the enrollment rates of native-born Americans. Second, state policies benefiting undocumented immigrants have not increased tuition and fees at comprehensive and community colleges attended by the vast majority of students, though rates have risen at flagship universities. Finally, despite some weak association with increased indebtedness among Hispanic natives, resident tuition subsidies for undocumented immigrants do not appear to have reduced financial aid or increased indebtedness for other demographic groups. JEL Classification: F22, J15, I23, I28 Keywords: immigration, college tuition, DREAM Act Corresponding author: Catalina Amuedo-Dorantes Department of Economics San Diego State University 5500 Campanile Drive San Diego, CA 92182 USA E-mail: [email protected]
* The authors thank Ethan Lewis and Phani Wunnava for helpful comments and suggestions.

1
1. Introduction
The Deferred Action for Childhood Arrivals (DACA) executive order signed by
President Obama on June 15, 2012, which grants two-year deportation deferrals and work
permits to unauthorized immigrants brought to the United States as children, has
reinvigorated the contentious debate over policies pertaining to undocumented immigrant
youth. An important aspect of this debate left unaddressed by the program is the state-level
variability in policy regarding postsecondary tuition rates charged to undocumented
immigrants. The Illegal Immigration Reform and Immigrant Responsibility Act (IIRIRA) of
1996 effectively prohibits unauthorized immigrants from paying in-state (or resident) tuition
rates for tertiary education by barring states from giving undocumented residents
postsecondary education benefits that they do not offer to all U.S. citizens. Despite those
IIRIRA regulations, however, thirteen states between 2001 and 2011 enacted legislation
allowing undocumented students to pay resident tuition rates at public colleges and
universities. We perform difference-in-difference estimation exploiting cross-state variation
to examine some of the intended and unintended effects of this policy.
Our analysis begins by assessing whether policy granting resident tuition for
undocumented immigrants (hereinafter, “policy”) has affected college enrollment rates. This
issue has been explored by Kaushal (2008) and Chin and Juhn (2010), but those studies arrive
at opposing conclusions with the former arguing that likely-illegal immigrants experience
large enrollment gains and the latter finding no effect. Our results are consistent with those
of Kaushal (2008). Likely-undocumented college-aged individuals are 3 to 6 percentage
points more likely to enroll in college when they reside in states offering in-state tuition to
undocumented immigrants. Additionally, we find no evidence of resident tuition subsidies
for undocumented immigrants crowding-out other students from enrolling in college. In fact,
Hispanic natives have also experienced enrollment gains, perhaps suggesting a cohort effect.
2
Next, we examine the potential for unintended consequences previously unexplored
by the literature. We first investigate whether resident tuition subsidies for undocumented
immigrants have caused states and public institutions to compensate for lost revenues by
charging higher tuition and fees. We find that the granting of resident tuition rates to
undocumented immigrants is associated with increased tuition and fees for both resident and
nonresident students at flagship universities. However, prices at comprehensive colleges are
unaffected, while community colleges experience small declines in resident tuition rates.
Given that about 50 percent of public school enrollees attend community colleges and only
7.4 percent attend flagship institutions, we can conclude that the majority of students have not
experienced a direct increase in tuition cost.
Note, however, that college tuition and fees represent advertised state-level “sticker-
prices” that might not reflect the actual costs of college paid by individual students if they
receive grants and other forms of financial aid. In addition to higher tuition and fees, another
potential unintended consequence of the policy at hand could be a reduction in aid provided
by states and schools in order to capture lost funds. Alternatively, the increased enrollment
of undocumented immigrants could have a reallocation effect, pushing other student groups
toward more expensive schools offering less aid and, as a result, raising indebtedness levels.
To test these predictions, we assess the effect of policy granting resident tuition subsidies for
undocumented immigrants on the aid and indebtedness of college enrollees. We find that
such a policy is marginally associated with increased indebtedness only for Hispanic natives
– a group that also experiences increased enrollment from policy. Grants and aid rise for
Hispanic non-citizens, but not for other demographic groups. We caution, however, that
results from this analysis could be encumbered by selection biases if the policy
simultaneously alters the type of individual who enrolls in college.
3
Nonetheless, the collective evidence in this paper endorses the long-run effectiveness
of in-state tuition subsidies in raising college enrollment rates among eligible undocumented
immigrants without imposing large negative effects on the majority of college students.
2. Undocumented Youth and Postsecondary Education
Using data from the March 2010 Current Population Survey (CPS) and a residual
method technique, Passel and Cohn (2011) estimate that 11.2 million unauthorized
immigrants live in the United States, accounting for 3.7 percent of the population.
Unauthorized workers represent 5.2 percent of the labor force. Children of undocumented
immigrants comprise a much larger 8 percent share of the newborn population. Eighty-two
percent of the 5.5 million children born to unauthorized immigrants are American citizens by
birth. The remaining 18 percent – approximately 1 million children – are residing in the U.S.
illegally.
The Supreme Court’s 1982 Plyler versus Doe decision ruled that undocumented
immigrant children have a legal right to attend public school. Tertiary education policy is
less clear. Federal-level legislation (IIRIRA) effectively prohibits undocumented immigrants
from paying resident tuition rates – a law affecting an estimated 50,000-65,000 unauthorized
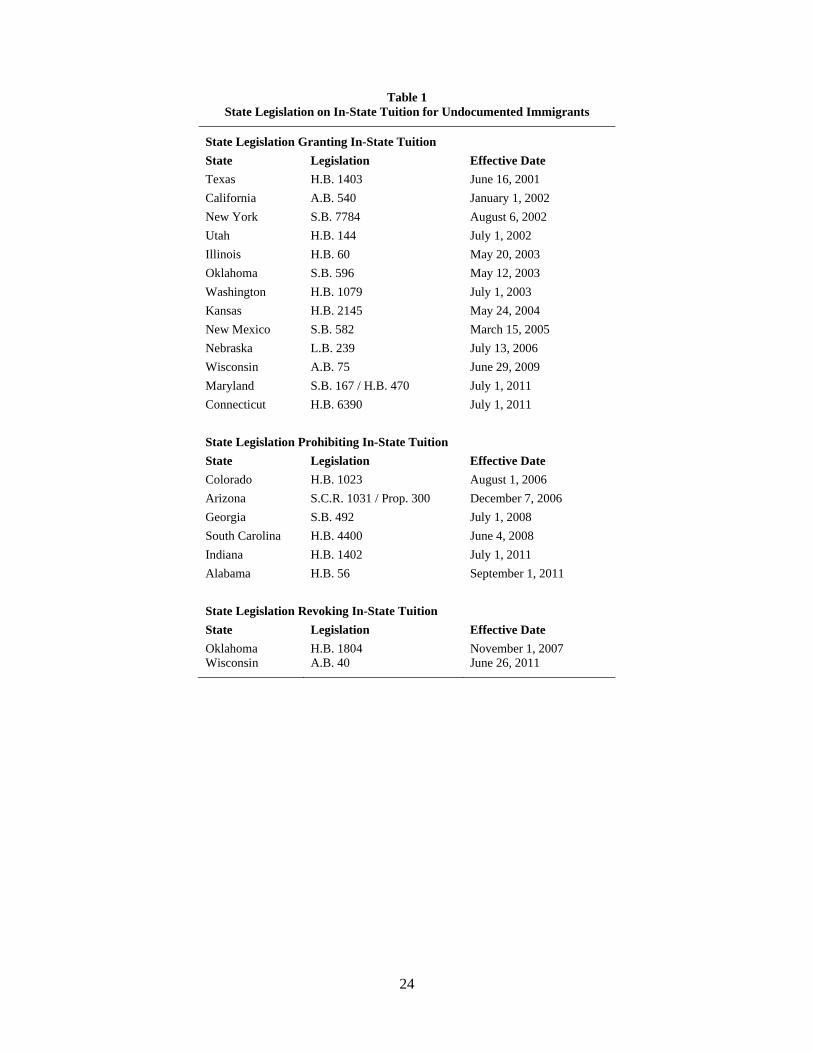
immigrant students annually.1 In seeming opposition to federal law, thirteen states have
passed legislation that permits resident tuition rates for undocumented college and university
students who have met specific criteria. Though the requirements vary from state to state,
qualified students usually need to have 1) lived in the state and attended high-school for a
particular time period, 2) obtained a high-school diploma or equivalent degree from the state,
3) been accepted to a public college or university, and 4) signed an affidavit of their intention
to file for legal immigration status.2 Texas and California were the first to pass this type of
1 Estimates from The National Conference of State Legislatures, http://www.ncsl.org/default.aspx?tabid=13100 2 Nine of the twelve states with this legislation do not allow undocumented students to receive state financial aid. The only exceptions are California, New Mexico and Texas.

4
legislation in 2001, followed by New York (2002), Utah (2002), Washington (2003),
Oklahoma (2003), Illinois (2003), Kansas (2004), New Mexico (2005), Nebraska (2006),
Wisconsin (2009), Maryland (2011), and Connecticut (2011). Dates in which the policies
became effective are displayed in Table 1. Oklahoma later revoked statewide support in
2008, leaving tuition decisions up to the Oklahoma Board of Regents, whereas Wisconsin
reversed its policy in its 2011 state budget.3
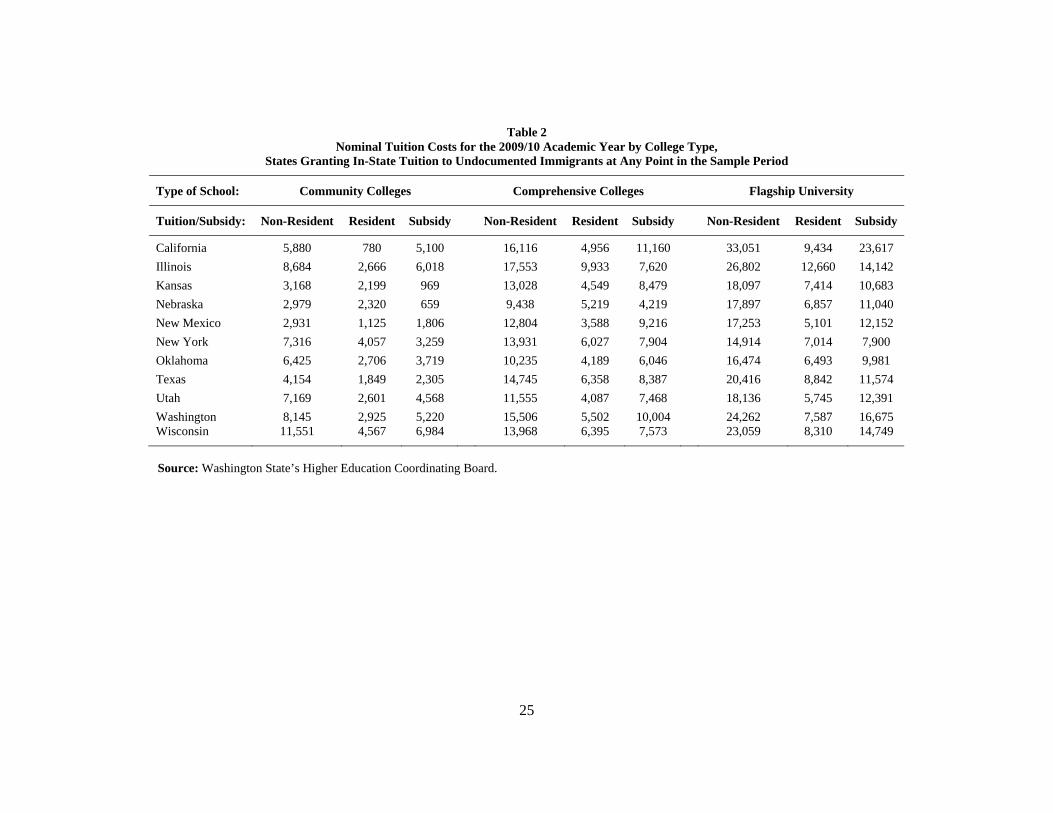
The potential cost savings to undocumented students in states adopting the policy are
substantial. Table 2 summarizes tuition costs and in-state tuition subsidies (the difference
between resident and nonresident tuition rates) in the 2009/10 academic year for all states that
have ever granted in-state tuition to undocumented immigrants in our sample.4 Gaps at
flagship universities in Texas and California exceed $15,000 per year. Differences in
community college costs exceed $4,000 in Wisconsin, Illinois, Washington, California, and
Utah. Regression estimates that control for state fixed effects, national trends,
macroeconomic features, and demographic characteristics (not shown) reveal that resident
subsidies have resulted in advertised tuition savings at public institutions of more than
$12,000 at flagship universities, $8,700 at comprehensive colleges, and nearly $5,000 at
community colleges.
State-level actions were partly responsible for motivating federal-level proposals in
the Development, Relief, and Education for Alien Minors Act of 2011 (the DREAM Act, H
1842) – a failed bipartisan legislation that would have explicitly restored states’ ability to
determine residency for the purpose of establishing higher education benefits. DREAM Act
proponents argued that the United States was effectively the home country for children who
3 During this same period, Colorado (2006), Arizona (2006), Georgia (2008), South Carolina (2008), and Alabama (2011) passed legislation – redundant given federal law – that banned undocumented immigrants from receiving in-state tuition rates. 4 Data is from Washington State’s Higher Education Coordinating Board.
5
had immigrated illegally. 5 Since these individuals often stay in their adopted states
permanently, states have a vested interest in their educational attainment. Though
undocumented immigrant children have the right to public primary and secondary education,
undocumented immigrants have a substantially lower educational attainment than legal
immigrants and natives. Access to more affordable education could lead to higher college
enrollment rates, higher tax contributions, and better citizenship in the long-run. DREAM
Act opponents argued that the policy would increase competition with natives wishing to go
to college (Camarota 2010). If the number of college seats is relatively fixed in the short run,
an increase in enrollment among undocumented immigrants could reduce the enrollment of
natives and legal immigrants. Additionally, the rise in students qualifying for tuition
subsidies could also imply a loss of available funds for colleges and universities. If states and
schools respond by increasing tuition rates and/or reducing financial aid, native and legal
immigrant students could experience growing financial need and overall indebtedness levels.
Though the DREAM Act failed to pass, efforts to embrace elements of the legislation
persist. In April 2012, Senator Marco Rubio pressed lawmakers to support his alternative
DREAM Act proposals and, in June 2012, President Obama issued an executive order to
defer the deportation of undocumented immigrants who arrived as children. These actions
have been met with similar supporting and opposing arguments in the popular press. 6
Nonetheless, significant state-level variability in postsecondary tuition policy for
undocumented immigrants remains, which could contribute to variation in overall college
costs and/or different enrollment rates across state borders.
An important limitation of studying the effects of granting resident tuition to
undocumented immigrants on that group of students is that no large representative dataset
5 For a list of arguments in favor and against in-state tuition for undocumented immigrants, visit http://www.ncsl.org/issues-research/educ/undocumented-student-tuition-overview.aspx 6 See popular press articles in Gabriel (2011), Weisman (2012), Constable (2012), Preston (2012), Caldwell and Gonzalez (2012), Rose (2012), and Crawford and Niquette (2012). Other objections to current policy relate to increased labor market competition with native workers, which we do not examine.
6
identifies the legal status of immigrants. Instead, researchers (e.g. Kaushal 2008, Chin and
Juhn 2010 or Lofstrom et al. 2011) have to examine population groups that have traits
predictive of immigrants’ undocumented status, such as Hispanic ethnicity and lack of
citizenship (Passel and Cohn 2009, 2011). Therefore, we use information on the citizenship
status and ethnicity of immigrants surveyed in the Current Population Survey (CPS) to
identify Hispanic non-citizens as “likely undocumented immigrants.”
Summary statistics in Table 3 attest to the importance of granting resident tuition to
undocumented immigrants in facilitating access to tertiary education for that demographic
group. Monthly CPS data from 2000-2010 indicates that the enrollment rate of Hispanic non-
citizens 17 to 24 years of age in California and Texas – two states that were among the first to
allow in-state tuition for undocumented youth – reached 27 and 23 percent, respectively.
Those rates were above the national average enrollment rates for Hispanic non-citizens living
outside California and Texas (20 percent). While those figures could be suggestive of the
importance of tuition savings in promoting college enrollment, enrollment rates were also
high in states that charge undocumented immigrants nonresident tuition, such as Florida and
New Jersey (31 and 25 percent, respectively). Hence, the enrollment effects of allowing
undocumented immigrants to pay in-state tuition rates require more formal investigation.
The analysis of college enrollment implications of policy granting resident tuition to
undocumented immigrants is related to a much broader literature that has used difference-in-
difference (or quasi-experimental) evidence to estimate the elasticity of demand for college.
Examples of that literature include studies evaluating state-level programs – such as
Dynarski’s (2000) analysis of Georgia’s merit-based HOPE program and Kane’s (2007)
study of the DC Tuition Assistance Program, as well as national-level policy – for example,
Seftor and Turner’s (2002) appraisal of Pell grants, and Bednar and Gicheva’s (2012)
examination of tax-exempt tuition assistance from employers. Dynarski (2002) provides a

7
brief survey of quasi-experimental results, citing a “remarkably consistent” finding that a
$1,000 tuition subsidy (roughly in 2000 dollars) is associated with a 4 percentage-point
increase in enrollment probability. Kane (2007) calls this a “consensus estimate,” while
noting that it is also found in non-quasi-experimental literature (such as Leslie and Brinkman
(1998)).7
In addition to this literature, two previous analyses have assessed whether resident
tuition subsidies increase enrollment of likely undocumented students in particular. Using
data from the American Community Survey (ACS) spanning between 2001 and 2005, Chin
and Juhn (2011) are unable to find statistically significant results. As these authors note, the
impact may be muted for a variety of reasons. First, to take advantage of the offered tuition
subsidy, applicants must reveal their undocumented status to government authorities – a
requirement that may deter many eligible students from applying. Second, the cost of college
might remain prohibitive for many undocumented immigrants and their families even after
the subsidy. Finally, because undocumented immigrants are unlikely to earn the full return to
college education if employers require evidence of legal status upon hiring, many of them
might not be able to take full advantage of their college education. In contrast, using data
from the Current Population Survey monthly outgoing rotation group (CPS-ORG) files for
1997-2005, Kaushal (2008) finds that policy granting resident tuition for undocumented
immigrants is associated with a 2.5 percentage point (31 percent) increase in college
enrollment of likely undocumented students. The conflicting results may be due to
differences in data sources and/or the time period being examined. Chin and Juhn (2011), for
example, argue that it can take time for migrants to find out about new laws and place
themselves in a position to take advantage of the tuition savings. Their analysis might
examine a period that is too short for uncovering any significant impacts.
7 More recent sources on the costs of college and college attendance include Turner (2011), Cellini (2010), Dynarski (2008), Abraham and Clark (2006), and Cornwell, Mustard, and Sridhar (2006).

8
We address such data limitations by using the larger monthly CPS over a longer
period of time spanning from January 2000 through December 2010 to re-examine the impact
that state tuition policy has had on the college enrollment rates of likely unauthorized
immigrant students across the entire United States over the past decade. We then extend the
analysis to explore concerns regarding the enrollment, cost, aid, and indebtedness of natives
and other groups claimed by opponents of in-state tuition for undocumented immigrants.
3. Data
To evaluate the effects of policy granting resident tuition for undocumented
immigrants, we use three datasets. First, to gauge the enrollment impacts of the policy, we
combine individual micro-level data from the monthly Current Population Survey (CPS)
spanning from January 2000 through December 2010 with state-level data on the enactment
dates of resident tuition subsidies for unauthorized youth. The CPS provides information on
college enrollment – our outcome of interest – as well as demographic characteristics such as
gender, age, race, and marital status. Though comparable datasets (such as the American
Community Survey or the CPS October supplement) sometimes offer a greater variety of
secondary schooling variables, the monthly CPS data has the advantage of providing a
reasonably large sample with monthly time variation in school enrollment data.
Unfortunately, like most large-scale surveys, the CPS does not include sensitive information
regarding individuals’ legal status. As noted earlier, we follow the literature on this topic and
focus our attention on a group of individuals previously shown to be a very good
representation of people who are most likely unauthorized – Hispanic non-citizens.
Additionally, since the beneficiaries of state-level policies are undocumented youth who have
graduated from high school or completed a GED in the state, we restrict our attention to
individuals between the ages of 17 and 24 with a high school education.

9
Table 4 provides weighted summary statistics of the sample used in our baseline
regressions. There is a substantial gap in college enrollment rates between Hispanic non-
citizens and other groups, making it worth exploring whether tuition subsidies are able to
induce them to attend college. Enrollment rates among Hispanic non-citizens are
approximately half of those exhibited by non-Hispanic natives (22 percent vs. 44 percent),
and a similar gap is found with regard to Hispanic natives (whose enrollment rates average 40
percent). Additionally, Table 4 reveals that 45 percent of young Hispanic non-citizens reside
in treatment states granting in-state tuition for undocumented immigrants, but those states
account for just 23 percent of non-Hispanic natives. This suggests that Hispanic non-citizens
might value residing in states with such educational benefits. Yet, treatment states also
maintain an even larger share of Hispanic natives (57 percent). These figures might be
attributable to the fact that nearly 1 in 10 U.S. families with children is a mixed-status family,
that is to say, a family in which one or more parent is a noncitizen and one or more child is a
citizen (Fix and Zimmermann 1999).
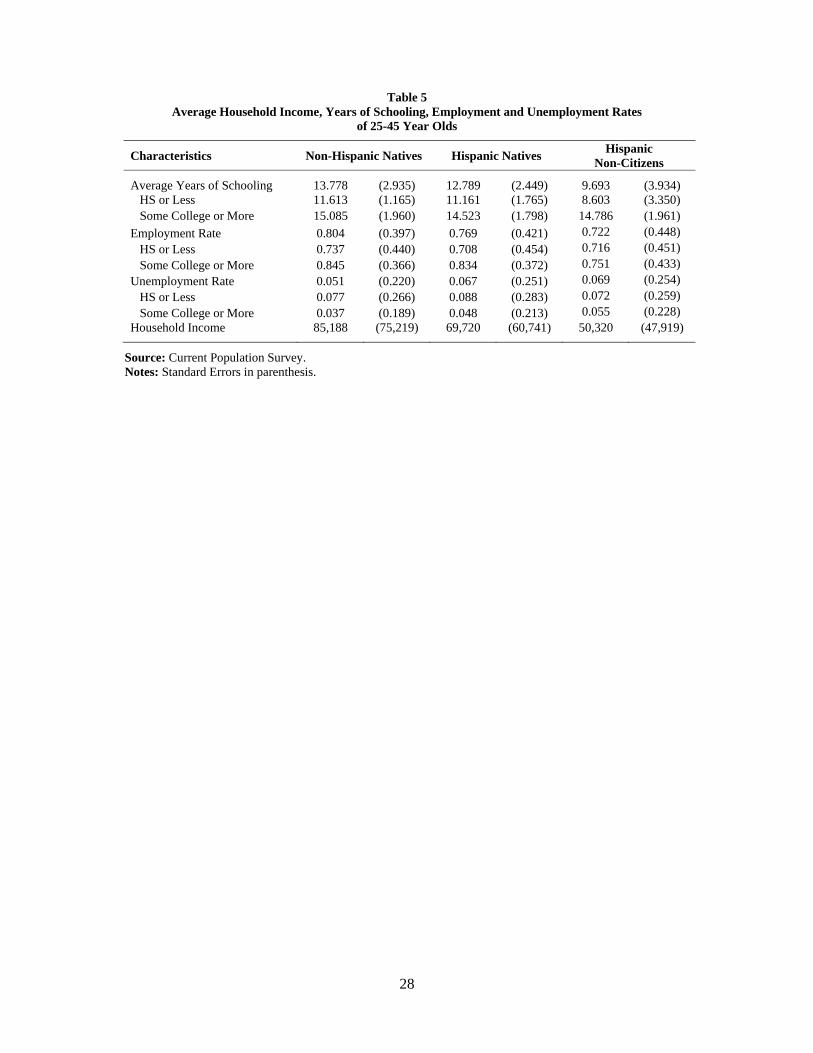
Table 5 provides a sense of the potential long-term relevance of tuition subsidies for
Hispanic non-citizen youth by providing summary statistics on the educational attainment,
employment, and unemployment rates of 25 to 45 year-olds. Hispanic non-citizens display
the lowest educational attainment with an average 9.7 years of schooling compared to 13.8
years of schooling for non-Hispanic natives and 12.8 for Hispanic natives. Educational
attainment matters; in part, because the employment rate of individuals with some college or
more educational attainment is significantly higher than that of individuals with a high school
education or less, regardless of nativity and ethnicity. More importantly from the policy
perspective is the fact that differences in educational attainment could be due to severe
financial constraints and the household’s inability to finance their children’s college
education. The final row of Table 5 provides a sense of household income disparities across
10
citizenship groups. Since Hispanic non-citizens generally belong to families with lower
average household incomes, being eligible for in-state tuition could significantly help
economically constrained youth raise their college enrollment rates.
After examining the impact that resident tuition for undocumented immigrants might
have on the college enrollment rates of various demographic groups, we investigate whether
the policy affects the official sticker-price cost of college. This could occur if states and
public schools raise resident and/or nonresident tuition and fees to offset the increased
proportion of residents among the student body. For this second part of the analysis, we rely
on state-level data on the average tuition and fees of public flagship universities,
comprehensive schools, and community colleges for both resident and nonresident students.
The data are made available by the Washington State’s Higher Education Coordinating Board
(HECB). We use data for the academic years 1999/2000 through 2009/2010. Table 6
summarizes this panel dataset. Although it provides tuition and fees for the full set of 550
state-by-year flagship university observations, only 506 comprehensive school and 537
community college observations are available.8 On average, residents pay approximately
$12,000 less for flagship universities, about $8,000 less for comprehensive schools, and over
$4,000 less for community colleges across the sample (figures expressed in 2010 dollars).
We conclude the analysis by exploring a related point – whether offering resident
tuition to undocumented students affects the financial aid and indebtedness levels of
enrollees. This could occur if governments or schools cut aid, or if the policy of granting of
resident tuition for undocumented immigrants has displacement effects, pushing some
students into higher-cost schools. Data for testing these possibilities come from the National
Postsecondary Student Aid Study (NPSAS), which conducts individual-level surveys on
school costs and funding every four years. We use information on the variables in Table 7
8 The analysis also loses additional observations due to our definition of the policy variable discussed in the next section.
11
for the academic years 1999/2000, 2003/04, and 2007/08. Cumulative student debt averages
$6,867 per student, but exhibits tremendous variation with a standard deviation of $11,767
and a maximum debt of almost $200,000. Financial aid offered by states and schools average
roughly $416 and $1,013 per student, respectively. Though aid can come in many forms,
including loans and work-study opportunities, grants – which do not require a form of
repayment or reciprocity from recipients – constitute the bulk of aid from these sources.
4. Methodology
We use a quasi-experimental research design to examine intended and unintended
consequences of in-state tuition for undocumented immigrants. Treatment and control groups
are defined according to the time when the policy was enacted and the individual’s state of
residence. In the enrollment and aid regressions, individuals with a high-school degree
residing in states that grant resident tuition subsidies to undocumented immigrants constitute
the treatment group, whereas similar individuals in states without such subsidies are included
in the control group. Regressions are performed for specific demographic groups defined by
citizenship and Hispanic ethnicity.
Equation (1) displays our basic difference-in-difference model, which is identified by
policy changes across states and time:
(1) iststsstiststist tZXPolicyY
Observations refer to individuals (i) living in state s at time t. When examining the likelihood
of being enrolled in college, Y is a dummy variable indicating whether the individual is
enrolled in college and t refers to the month and year of observation. When exploring the
impact of tuition subsidies on financial aid and overall indebtedness of college students, Y is a
continuous variable capturing the dollar amount in question and t represents an academic
year. The regressions examining the impact of the policy on college costs are defined
similarly, but are performed at the state level and do not differ across demographic groups.

12
Our main explanatory variable of interest, Policy, is a dichotomous variable set to one
for individuals residing in states offering in-state tuition to undocumented immigrants.
Coding of the Policy variable is summarized in Table 8. Because the effects of the policy are
unlikely to be immediate, we drop all of a state’s observations for a full year after a policy is
enacted in our CPS college-enrollment dataset.9 For example, consider the case of Texas. As
described in Table 8, the variable takes a value of zero from the beginning of the period
considered, is dropped (recorded as missing) from June 2001 (when in-state tuition policy
became effective) through May 2002, and then takes a value of one from June 2002 and
beyond. For our exploration of tuition costs, financial aid, and indebtedness using HECB and
NPSAS data, we give the variable Policy a value of 1 if a state had granted resident tuition
for undocumented immigrants prior to fall of the academic year in the survey, and zero
otherwise. Additionally, we drop observations from two states – New York and Oklahoma –
over certain time periods. Specifically, we drop New York observations from 1998 through
November 2001 because the State University of New York (SUNY) and City University of
New York (CUNY) had differing policies on tuition rates for undocumented immigrants
during this period (see Kobach 2007). We also drop Oklahoma observations from November
2007 onward due to its ambiguous tuition policy for undocumented immigrants. Oklahoma
House Bill 1804 (the Oklahoma Taxpayer and Citizen Protection Act 2007) imposed severe
restrictions on immigration, but section 13 of the bill allowed the Board of Regents to make
in-state tuition policy decisions.
Equation (1) also includes a vector X that controls for a variety of individual-level
characteristics such as gender, age, race, and marital status, as well as age of entry into the
United States in the case of immigrants. To address omitted variables biases emanating from
a wide range of regional and macroeconomic factors potentially correlated with state-level
9 Results are reasonably robust to the inclusion of all observations immediately after the passage of the policy.

13
policy and our outcome variables, the vector Z includes information on native unemployment
rates and the native college/high-school graduation ratio. We also include a battery of state
fixed-effects, time fixed-effects, and state-level time trends intended to capture a range of
idiosyncratic state-level characteristics, economy-wide shocks, and time-varying economic
conditions at the state level including underlying trends in educational attainment, college
costs, and indebtedness. The error term is captured by ~ , , and standard errors are
clustered at the state level.
5. Impacts of In-state Tuition for Undocumented Immigrants
A) College Enrollment Rates
Table 9 displays the results from estimating equation (1) for the sample of Hispanic
non-citizens between 17 and 24 years of age with a high school degree or equivalent.
Column (1) shows the results from a baseline regression with only state and time fixed effects
and without any individual-level controls. The inclusion of fixed effects allows us to
estimate the enrollment impact of the policy after accounting for national trends and time-
invariant features specific to states. We find that Hispanic non-citizen youth were 3.6
percentage-points more likely to be enrolled in college in states granting resident tuition rates
for undocumented immigrants. This suggests that the policy has been effective in achieving
its goal – namely raising college enrollment among likely undocumented immigrants.
Columns (2) through (4) progressively add individual-level characteristics and other
controls to the regression, but estimates remain robust. The largest impact is found in our
most complete specification (Column 4), which accounts for state-level time trends.
According to that specification, young Hispanic non-citizens are 5.8 percentage-points more
likely to be enrolled in college in states offering resident tuition subsidies for undocumented
immigrants. Given that the average enrollment rate of Hispanic non-citizen youth in the
sample is approximately 22 percent (Table 4), such a policy could effectively raise this

14
group’s enrollment rate by roughly 25 percent. Therefore, access to in-state tuition rates
appears to serve as an effective means of increasing the educational attainment of likely
undocumented immigrant youth.
The remaining estimates in Table 9 have the expected signs and magnitudes. For
instance, women are roughly 7.4 percentage-points more likely than their male counterparts
to enroll in college. In contrast, married individuals are 14 percentage-points less likely to be
enrolled in college. Results for the quadratic in age also indicate that older individuals are
less likely to be enrolled in college.
Our next series of regressions takes two further steps. First, we introduce controls for
the native unemployment rate and college/high-school graduation ratio to account for
macroeconomic labor market characteristics that might vary across states and time. We also
control for age of entry into the United States to better account for individual-level
heterogeneity. Second, we estimate equation (1) for other demographic groups as well.
These regressions should identify whether the policy has had negative unintended
consequences by deterring other demographic groups from attending college.
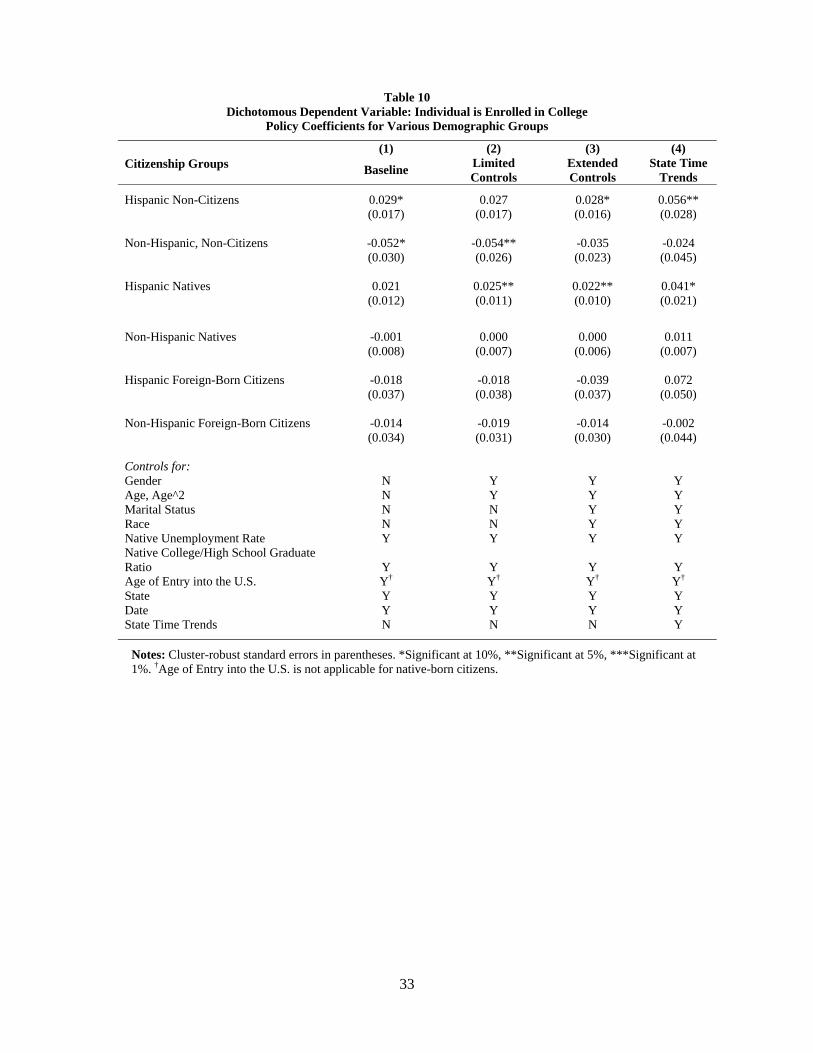
Results are in Table 10. As in Table 9, columns (1) through (4) progressively add
controls. The first row displays the effects for Hispanic non-citizens. The point estimates are
similar in size to those of Table 9, though significance levels decrease. The enactment of
policy granting resident tuition rates for undocumented immigrants is associated with an
increase in the college enrollment likelihood of Hispanic non-citizens that ranges between 3
and 5.6 percentage points. Evidence suggesting that this policy is crowding out other
students from attending college is, in contrast, rather scant. Non-Hispanic non-citizens (Row
2) are the only group to exhibit a significantly negative coefficient on Policy, but the
coefficient becomes insignificant after controlling for marital status and race. Rather, the
policy appears to have had a positive enrollment effect on Hispanic natives (Row 3). Perhaps

15
some undocumented immigrants responding to the CPS (a survey administered by the federal
government) claim to be U.S.-born. Alternatively, we may be capturing peer effects; in
particular, Hispanic natives might become more likely to attend college when their
undocumented peers choose to attend in increasing numbers. Fear of increased labor market
pressure also could be inducing Hispanic natives to attend college. In any case, the granting
of in-state tuition to undocumented students does not negatively affect the enrollment rates of
any demographic group.
B) College Costs
As stated earlier, opponents of in-state tuition subsidies for undocumented immigrants
worry that such a policy could increase the need by states and schools to raise their prices in
order to make up for lost tuition revenues. Such actions could contribute to the rising sticker-
price cost of college. To assess whether this occurs, we use a state-level panel dataset on
average resident and nonresident undergraduate tuition and fees at public postsecondary
institutions from Washington State’s Higher Education Coordinating Board’s (HECB). Our
data covers academic years 1999/2000 through 2009/2010. Figures are available for three
types of institutions. 10 First, HECB records the tuition and fees from each state’s top public
“flagship” research university. For example, in California, flagship costs represent tuition
and fees charged by the University of California–Berkeley. Only 7.4 percent of
undergraduates at public institutions are enrolled in the 50 HECB flagship universities,
though 27.6 percent of public university students attend research institutions.11 Second,
HECB records average prices from “public institutions in the Carnegie classification
Comprehensive Colleges and Universities category I. These institutions typically offer a
wide range of baccalaureate programs and are committed to graduate education through the 10 A full list of colleges included can be found at http://www.wsac.wa.gov/sites/default/files/TuitionandFees2009-10Report-Final.pdf. 11 Estimates come from combining enrollment information provided by the Carnegie Foundation for the Advancement of Teaching (http://classifications.carnegiefoundation.org/summary/) and National Center for Education Statistics (http://nces.ed.gov/globallocator/) in academic years 2010/11 and 2011/12.

16
master’s degree.” In California, this includes many colleges in the California State
University system, but omits schools with extensive Ph.D. programs, such as San Diego State
University and all University of California schools. Institutions without extensive masters
programs, such as California State University–East Bay, are similarly excluded. Finally,
HECB also provides average tuition and fees for community colleges, which account for
roughly 50 percent of all public institutions’ enrollment. The panel is not balanced, as HECB
did not record resident and nonresident costs for all types of institutions in every state and
year.12
To perform the analysis, we modify the regression specification in equation (1) so that
it is defined at the state-level. The vector X includes variables measuring the percentage of
the state’s youth population that is female, married, Asian, Black, Hispanic, and from another
non-White race, as well as average age and average age squared. Macroeconomic controls
include the native unemployment rate and the native college/high-school graduation ratio.
The policy variable varies across states and academic year, taking the values indicated in
Table 8. All regressions include state and year fixed effects, and standard errors are clustered
at the state level. The dependent variables are measured in 2010 dollars.
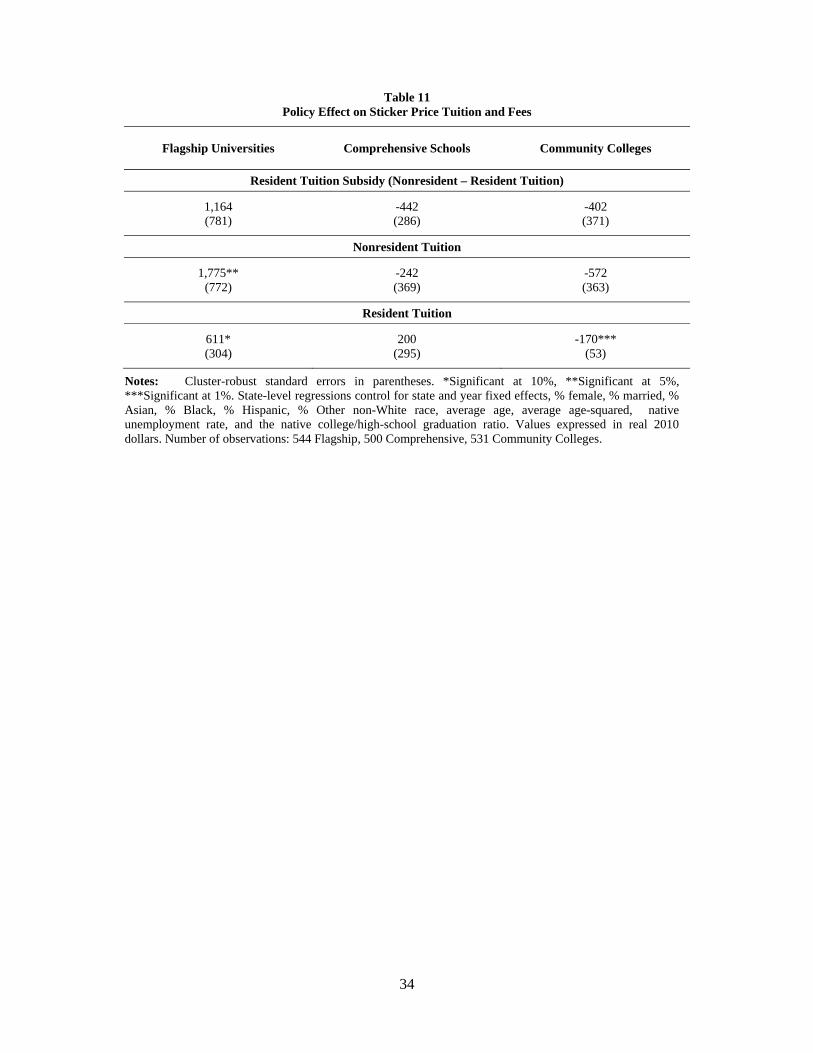
The results displayed in the first panel of Table 11 show the impact of policy granting
resident tuition for undocumented immigrants on the overall difference in tuition and fees
charged to nonresident versus resident undergraduate students. The policy does not seem to
be simultaneously associated with changes in resident subsidies. The next two panels
decompose the price differential into its two components. Here, we find that costs at flagship
universities have risen by $1,775 for nonresidents, and a marginally significant $611 for
resident students in states that have adopted the policy. These figures represent 4% to 5% of
the average tuition and fees charged by flagship universities. It is important to recall that in
12 For example, HECB does not recognize any comprehensive college in Delaware, or any community college in South Dakota.

17
the context of our difference-in-difference model, these estimates reflect values beyond those
associated with the nationwide trend in increased education costs. It remains unclear,
however, whether the increased costs represent intentional efforts of states and schools to
recoup lost revenues or, rather, are part of broader efforts to reform education funding
associated with changes in the treatment of undocumented students.
The story is much different for comprehensive schools and community colleges.
Policy granting resident tuition to undocumented students has no significant association with
tuition costs at comprehensive colleges, whereas it appears to reduce resident tuition and fees
at community colleges by a small but statistically significant $170 (2.7% of the average
community college cost). The sticker-price consequences of the policy, therefore, vary
across schools and students. Given the smaller proportion of students at flagship universities
compared to comprehensive and community colleges, as well as the results in Table 11, the
tuition costs of policy granting resident tuition for undocumented immigrants appear to affect
relatively few students, and may be most burdensome for nonresident students at flagship
universities.
C) Aid and Indebtedness
Another mechanism for states and schools to make up for lost tuition revenues would
be for them to reduce grants and other forms of financial aid offered to students. Such
actions could contribute to the growing costs and debt load of college students and graduates.
To explore whether that has been the case, we turn to 1999/2000, 2003/04, and 2007/08
NPSAS survey data. Like the CPS, the NPSAS dataset provides individual-level information
on students enrolled in college. Unlike the CPS, the NPSAS recognizes enrollees of all ages,
and it provides college finance and date information. Unfortunately, the NPSAS presents two
important limitations. First, it is only available every four years; therefore, we lack some of
the time variation from the enrollment and tuition cost regressions. Second, the dataset only

18
covers enrollees.13 We have argued that resident tuition policy for undocumented immigrants
affects the probability of enrollment for Hispanic non-citizens and native-born Hispanics. If
policy granting resident tuition for undocumented immigrants similarly affects the
composition of students within these and other demographic groups, regressions of
individual-level aid and indebtedness on policy could exhibit a selection bias. Hence, the
results should be interpreted with this caveat in mind.
Our regression specifications remain consistent with equation (1). Our new outcomes
are the five continuous quantitative variables previously summarized in Table 7. Our first
variable, Borrowed Amount, measures the cumulative undergraduate college debt incurred
throughout the college experience. The next two variables, State Aid and Institution Aid, sum
all forms of aid including grants, loans, and work-study that states and schools (respectively)
offered during a single academic year. Our final two variables, State Grants and Institution
Grants, represent the amount of state and school funding available without requiring a form
of reciprocity from the individual. All variables are expressed in 2010 dollars.
Table 12 presents the estimated financial aid and indebtedness effects of policy
granting resident tuition rates for undocumented students. Each regression includes the usual
set of demographic control variables such as age, age squared, indicators for gender, race, and
marital status, plus macroeconomic controls for the native unemployment rate and skill ratio.
The regressions also introduce a variable measuring total income (personal and parental), as
well as indicators for the type of institutions that individuals attend. The latter include
whether the school is publicly or privately funded, whether it is located in the student’s state
of permanent legal residence, whether it is a doctoral (research) institution, and whether it is a
community college (or a school offering two or fewer years of instruction).
13 We focus on individuals enrolled in one and only one undergraduate academic institution for the academic year. Nearly 90 percent of students in the NPSAS attend only one college. We focus our attention on this group because many of our variables of interest – including student budget and college characteristics – are undefined for students who attend more than one institution.

19
Interestingly, we find evidence that not only does the policy itself improve college
accessibility for Hispanic non-citizens, but schools themselves have also responded by
offering these students more aid in the form of grants. Importantly, this additional grant
money appears to be coming from private schools. Since states can provide aid directly to
students or indirectly through aid at public schools, we also perform regressions (not shown)
that use combined state and public institution grants as the dependent variable. Those
regressions find no evidence for increased aid or grants for Hispanic non-citizens.
Overall, however, the policy of granting resident-tuition rates to undocumented
immigrants appears to have limited effect on student financial aid and indebtedness levels.
For example, the financial aid and indebtedness levels of non-Hispanic natives – who account
for 79 percent of the enrollees in our sample – are unaffected by the policy. Conversely,
Hispanic natives – who like Hispanic non-citizens also increase their college enrollment –
appear to experience a greater debt burden. Their cumulative debt increased by $1,411.
Though it is possible that native Hispanics are responding to the policy by choosing public
flagship universities that have become more expensive and effectively require debt financing,
we find no evidence of such movements actually taking place (regressions available upon
request). Instead, it might be the case that new Hispanic enrollees simply accrue more debt.
In any case, the effect is only marginally significant and no group suffers from diminished aid
from states and institutions. Thus, policy granting resident tuition to undocumented
immigrants appears to have had little detrimental effect, if any, on the debt and aid levels of
college enrollees.
6. Summary and Conclusions
Several states allow undocumented immigrants to pay resident tuition rates at colleges
and universities despite federal legislation prohibiting this practice. We use a quasi-
experimental research design to examine both intended and unintended consequences of the
20
policy by exploiting variation across states and time. Altogether, the decision to provide in-
state tuition subsidies to undocumented students appears to have successfully attained its
main goal of raising college enrollment rates among eligible undocumented immigrants,
without imposing large negative effects on the majority of college-aged students.
The first part of our analysis mirrors work by Kaushal (2008) and Chin and Juhn
(2011). Like Kaushal (2008), we use Current Population Survey data to explore whether
policy has increased the probability of college enrollment among undocumented immigrants
and/or decreased the probability of enrollment among other demographic groups. We also
follow the convention in the literature of adopting Hispanic non-citizens as a proxy for
individuals who are likely to be undocumented. Using the time period spanning from 2000
through 2010, we find that the policy of granting in-state tuition to undocumented students
does attain its intended goal and increases Hispanic non-citizen college enrollment rates by 3
to 6 percentage points. However, we find no evidence that policy reduces enrollment rates of
other groups.
The second part of our analysis examines whether the policy of granting in-state
tuition to undocumented students has raised the advertised tuition and fee costs of colleges
and universities. We find that tuition at flagship universities in states with such policies has
increased relative to those costs in control states for both resident and nonresident students.
Although point estimates suggest a larger price increase for nonresidents, the difference
between nonresident and resident tuition and fees has not changed significantly.
Furthermore, the experience of flagship universities differs from other types of schools.
Tuition rates at comprehensive colleges have remained unaffected by the enactment of the
policy in treated states, while resident tuition at community colleges has exhibited a small
price decline.

21
Finally, we investigate whether policy granting resident tuition for undocumented
immigrants has affected the financial aid and indebtedness levels of students of various
demographic groups. Although the results from this analysis should be interpreted with
caution owing to potential selection bias concerns, we find that policy granting resident
tuition to undocumented immigrants might be associated with increased indebtedness among
Hispanic natives. However, it has not detrimentally affected the financial aid or debt burden
of other demographic groups.
22
References
Abraham, Katherine G. and Melissa A. Clark. 2006. “Financial Aid and Students’ College Decisions: Evidence from the District of Columbia Tuition Assistance Grant Program” Journal of Human Resources, 41(3): 578-610.
Bednar, Steven and Dora Gicheva. 2012. “Tax Benefits for Graduate Education: Incentives for Whom?” Mimeo. University of NorthCarolina at Greensboro.
Caldwell, Alicia A. and Andres Gonzalez. 2012. “U.S. Government Launches New Immigration Program” Associated Press, August 15, 2012.
Camarota, Steven A. 2010. “Estimating the Impact of the DREAM Act” Memorandum. Center for Immigration Studies, Washington, D.C. Available at: http://www.cis.org/dream-act-costs Cellini, Stephanie Riegg. 2010. “Financial Aid and For-Profit Colleges: Does Aid Encourage Entry?” Journal of Policy Analysis and Management, 29(3): 526-52. Chin, Aimee and Chinhui Juhn. 2011. “Does Reducing College Costs Improve Educational Outcomes for Undocumented Immigrants? Evidence from State Laws Permitting Undocumented Immigrants to Pay In-State Tuition at State Colleges and Universities.” in Latinos and the Economy, Integration and Impact in Schools, Labor Markets, and Beyond. Ed. David L. Leal and Stephen J. Trejo, Part II, pp. 63-94. Constable, Pamela. 2012. “Young Illegal Immigrants’ Amnesty Could Tighten Competition for Jobs, College” The Washington Post, June 15, 2012. Cornwell, Christopher, David B. Mustard, and Deepa J. Sridhar. 2006. “The Enrollment Effects of Merit-Based Financial Aid: Evidence from Georgia’s HOPE Program,” Journal of Labor Economics, 24(6): 761-786. Crawford, Amanda J. and Mark Niquette. 2012. “States Split on Immigrant Licenses as U.S. Lets Them Work” Businessweek, August 15, 2012. Dynarski, Susan. 2000. “Hope for Whom? Financial Aid for the Middle Class and Its Impact on College Attendance” NBER Working Paper 7756. Dynarski, Susan. 2002. “The Behavioral and Distributional Implications of Aid for College” The American Economic Review, 92(2), 279-285. Dynarski, Susan. 2008. “Building the Stock of College-Educated Labor” The Journal of Human Resources, 63(3): 576-610. Gabriel, Trip. 2011. “Stance on Immigration May Hurt Perry Early On” The New York Times, September 23, 2011. Fix, Michael and Wendy Zimmermann. 1999. “All under One Roof: Mixed-Status Families in an Era of Reform”, Mimeo. Paper presented at the 1999 Annual Meeting of the Population Association of America.
23
Immigration Policy Center. 2010. The DREAM Act: Creating Opportunities for Immigrant Students and Supporting the U.S. Economy. Available at: http://www.immigrationpolicy.org/just-facts/dream-act
Kane, Thomas J. 2007. “Evaluating the Impact of the D.C. Tuition Assistance Grant Program” The Journal of Human Resources, 42(3): 555-582. Kaushal, Neeraj. 2008. “In-state tuition for the undocumented: Education effects on Mexican young adults” Journal of Policy Analysis and Management, 27(4): 771-792. Kobach, Kris W. (2007). “Immigration Nullification: In-State Tuition and Lawmakers Who Disregard the Law” N.Y.U. Journal of Legislation & Public Policy, 10, 473–523. Leslie, Larry and Paul Brinkman. 1988. The Economic Value of Higher Education. New York: Macmillan. Lofstrom, Magnus, Sarah Bohn and Steven Raphael. 2011. “Lessons from the 2007 Legal Arizona Workers Act” Public Policy Institute, California. Martin, Andrew and Ron Lieber. 2012. “Fed Study of Student Debt Outlines a Growing Burden” The New York Times, Tuesday, March 6. National Conference of State Legislatures. 2006. “College tuition and undocumented immigrants.” A National Conference of State Legislatures Report. Washington, DC. Newberger, Robin, Anna Paulson and Shirley Chiu. 2004. “Financial access for immigrants: Highlights from the national conference” Chicago Fed Letter, (July): No. 204, The Federal Reserve Bank of Chicago. Passel, Jeffrey S. and D’Vera Cohn. 2009. A Portrait of Unauthorized Immigrants in the United States. Pew Hispanic Center, Washington DC.
Passel, Jeffrey and D’Vera Cohn. 2011. ”Unauthorized Immigrant Population: National and State Trends, 2010” Washington, DC: Pew Hispanic Center (February 1, 2011). Preston, Julia. 2012. “Young Immigrants, in America Illegally, Line Up for Reprieve” The New York Times, August 13, 2012. Rose, Joel. 2012. “For Undocumented Youth, New Policy Carries Risks” National Public Radio, August 15, 2012. Seftor, Neil and Sarah Turner. (2002). “Back to School: Federal Student Aid Policy and Adult College Enrollment” Journal of Human Resources, 37(2): 336-352. Turner, Nicholas. (2011). “The Effect of Tax-Based Federal Student Aid on College Enrollment” National Tax Journal, 64(3): 336-352. Weisman, Jonathan. 2012. “Rubio, in Appeal to G.O.P.’s Conscience, Urges Compromise on Dream Act” The New York Times, April 19, 2012.
24
Table 1 State Legislation on In-State Tuition for Undocumented Immigrants
State Legislation Granting In-State Tuition
State Legislation Effective Date
Texas H.B. 1403 June 16, 2001
California A.B. 540 January 1, 2002
New York S.B. 7784 August 6, 2002
Utah H.B. 144 July 1, 2002
Illinois H.B. 60 May 20, 2003
Oklahoma S.B. 596 May 12, 2003
Washington H.B. 1079 July 1, 2003
Kansas H.B. 2145 May 24, 2004
New Mexico S.B. 582 March 15, 2005
Nebraska L.B. 239 July 13, 2006
Wisconsin A.B. 75 June 29, 2009
Maryland S.B. 167 / H.B. 470 July 1, 2011
Connecticut H.B. 6390 July 1, 2011
State Legislation Prohibiting In-State Tuition
State Legislation Effective Date
Colorado H.B. 1023 August 1, 2006
Arizona S.C.R. 1031 / Prop. 300 December 7, 2006
Georgia S.B. 492 July 1, 2008
South Carolina H.B. 4400 June 4, 2008
Indiana H.B. 1402 July 1, 2011
Alabama H.B. 56 September 1, 2011
State Legislation Revoking In-State Tuition
State Legislation Effective Date
Oklahoma H.B. 1804 November 1, 2007Wisconsin A.B. 40 June 26, 2011
25
Table 2 Nominal Tuition Costs for the 2009/10 Academic Year by College Type,
States Granting In-State Tuition to Undocumented Immigrants at Any Point in the Sample Period
Type of School: Community Colleges Comprehensive Colleges Flagship University
Tuition/Subsidy: Non-Resident Resident Subsidy Non-Resident Resident Subsidy Non-Resident Resident Subsidy
California 5,880 780 5,100 16,116 4,956 11,160 33,051 9,434 23,617
Illinois 8,684 2,666 6,018 17,553 9,933 7,620 26,802 12,660 14,142
Kansas 3,168 2,199 969 13,028 4,549 8,479 18,097 7,414 10,683
Nebraska 2,979 2,320 659 9,438 5,219 4,219 17,897 6,857 11,040
New Mexico 2,931 1,125 1,806 12,804 3,588 9,216 17,253 5,101 12,152
New York 7,316 4,057 3,259 13,931 6,027 7,904 14,914 7,014 7,900
Oklahoma 6,425 2,706 3,719 10,235 4,189 6,046 16,474 6,493 9,981
Texas 4,154 1,849 2,305 14,745 6,358 8,387 20,416 8,842 11,574
Utah 7,169 2,601 4,568 11,555 4,087 7,468 18,136 5,745 12,391
Washington 8,145 2,925 5,220 15,506 5,502 10,004 24,262 7,587 16,675Wisconsin 11,551 4,567 6,984 13,968 6,395 7,573 23,059 8,310 14,749
Source: Washington State’s Higher Education Coordinating Board.

26
Table 3 Hispanic Non-Citizen Population Share and College Enrollment Rate of 17-24 Year Olds, 2000-2010
State Pop Share Enrollment
Rate State Pop Share
Enrollment Rate
State Pop Share Enrollment
Rate
Alabama 0.016 0.123 Kentucky 0.010 0.116 North Dakota 0.001 0.079
Alaska 0.006 0.242 Louisiana 0.009 0.093 Ohio 0.005 0.175
Arizona 0.085 0.171 Maine 0.001 0.349 Oklahoma 0.012 0.149
Arkansas 0.017 0.072 Maryland 0.035 0.238 Oregon 0.036 0.175
California 0.085 0.272 Massachusetts 0.021 0.199 Pennsylvania 0.006 0.155
Colorado 0.043 0.106 Michigan 0.004 0.146 Rhode Island 0.028 0.301
Connecticut 0.027 0.241 Minnesota 0.013 0.122 South Carolina 0.012 0.141
Delaware 0.020 0.070 Mississippi 0.014 0.084 South Dakota 0.003 0.087
District of Columbia 0.042 0.238 Missouri 0.008 0.119 Tennessee 0.018 0.080
Florida 0.068 0.312 Montana 0.001 0.315 Texas 0.067 0.233
Georgia 0.038 0.094 Nebraska 0.022 0.185 Utah 0.028 0.112
Hawaii 0.003 0.154 Nevada 0.070 0.122 Vermont 0.001 0.743
Idaho 0.018 0.162 New Hampshire 0.003 0.304 Virginia 0.021 0.179
Illinois 0.038 0.211 New Jersey 0.065 0.246 Washington 0.024 0.176
Indiana 0.012 0.104 New Mexico 0.037 0.228 West Virginia 0.003 0.179
Iowa 0.014 0.175 New York 0.043 0.279 Wisconsin 0.019 0.097 Kansas 0.017 0.136 North Carolina 0.040 0.086 Wyoming 0.008 0.073
Source: Current Population Survey. Observations = 1,124,893.

27
Table 4 Weighted Descriptive Characteristics of Observations Used in Baseline Enrollment Regressions
Individuals 17 to 24 Years of Age, 2000-2010
Hispanic Non-Citizens (Obs = 36,051) Characteristics Mean Std. Dev.
Enrollment Rate 0.224 0.417
Share Living in Treatment States 0.451 0.498
Female Share 0.455 0.498
Average Age 21.394 1.916
Married Share 0.231 0.421
Asian Share 0.005 0.070
Black Share 0.026 0.160
White Share 0.944 0.229 Other Race Share 0.024 0.154
Non-Hispanic Natives (Obs = 890,295) Characteristics Mean Std. Dev.
Enrollment Rate 0.435 0.496
Share Living in Treatment States 0.225 0.418
Female Share 0.504 0.500
Average Age 20.912 1.900
Married Share 0.101 0.301
Asian Share 0.027 0.163
Black Share 0.162 0.369
White Share 0.786 0.410 Other Race Share 0.025 0.155
Hispanic Natives (Obs = 97,849) Characteristics Mean Std. Dev.
Enrollment Rate 0.401 0.490
Share Living in Treatment States 0.570 0.495
Female Share 0.525 0.499
Average Age 20.870 1.949
Married Share 0.124 0.330
Asian Share 0.012 0.108
Black Share 0.038 0.190
White Share 0.911 0.285 Other Race Share 0.040 0.196
28
Table 5 Average Household Income, Years of Schooling, Employment and Unemployment Rates
of 25-45 Year Olds
Characteristics Non-Hispanic Natives Hispanic Natives Hispanic
Non-Citizens
Average Years of Schooling 13.778 (2.935) 12.789 (2.449) 9.693 (3.934) HS or Less 11.613 (1.165) 11.161 (1.765) 8.603 (3.350) Some College or More 15.085 (1.960) 14.523 (1.798) 14.786 (1.961)
Employment Rate 0.804 (0.397) 0.769 (0.421) 0.722 (0.448)
HS or Less 0.737 (0.440) 0.708 (0.454) 0.716 (0.451)
Some College or More 0.845 (0.366) 0.834 (0.372) 0.751 (0.433)
Unemployment Rate 0.051 (0.220) 0.067 (0.251) 0.069 (0.254)
HS or Less 0.077 (0.266) 0.088 (0.283) 0.072 (0.259)
Some College or More 0.037 (0.189) 0.048 (0.213) 0.055 (0.228) Household Income 85,188 (75,219) 69,720 (60,741) 50,320 (47,919)
Source: Current Population Survey. Notes: Standard Errors in parenthesis.

29
Table 6 Official Tuition and Fees Charged by Public Colleges and Universities
Variable Observations Mean Std. Dev. Min Max
Flagship Universities
Resident Tuition 550 6,751 2,348 2,716 14,416
Nonresident Tuition 550 18,948 5,497 6,589 34,937 Difference between Resident and Non-Resident Tuition 550 12,197 4,298 1,253 23,617 Comprehensive Schools
Resident Tuition 506 4,981 1,741 2,231 11,133 Nonresident Tuition 506 13,040 2,561 5,525 19,411
Difference between Resident and Non-Resident Tuition 506 8,059 2,238 1,253 13,883
Community Colleges
Resident Tuition 537 2,275 1,013 391 6,262 Nonresident Tuition 537 6,536 2,193 2,047 14,413
Difference between Resident and Non-Resident Tuition 537 4,261 1,934 0 10,310
Source: Washington State’s Higher Education Coordinating Board (HECB).

30
Table 7 Weighted Statistics of Observations Used in Collage Aid and Indebtedness Regressions
(Real 2010 Dollars)
Variable NPSAS Label Mean Std. Dev. Min Max
Borrowed Amount BORAMT1 6,867 11,767 0 192,644
State Aid STATEAMT 416 1,307 0 27,307
Institution Aid INSTAMT 1,013 3,315 0 57,048
State Grants STGTAMT 370 1,182 0 20,200
Institution Grants INGRTAMT 951 3,198 0 57,048
Source: National Postsecondary Student Aid Study (NPSAS) 2000, 2004, 2008. Note: Number of Observations = 188,539.

31
Table 8 Values for the Policy Variable
Values equal zero for all dates and states, except in the cases below
Dataset CPS Data HECB Data NPSAS Data
State Policy Recorded as
Missing Policy Recorded as 1
Policy Recorded as Missing
Policy Recorded as 1 Policy Recorded
as Missing Policy Recorded as 1
California Jan 2002 - Dec 2002 Jan 2003 - Dec 2010 N/A 2002/03 - 2009/10 N/A 2003/2004; 2007/2008
Illinois May 2003 - Apr 2004 May 2004 - Dec 2010 N/A 2003/04 - 2009/10 N/A 2003/2004; 2007/2008
Kansas May 2004 - Apr 2005 May 2005 - Dec 2010 N/A 2004/05 - 2009/10 N/A 2007/2008
Nebraska Jul 2006 - Jun 2007 Jul 2007 - Dec 2010 N/A 2006/07 - 2009/10 N/A 2007/2008
New Mexico Mar 2005 - Feb 2006 Mar 2006 - Dec 2010 N/A 2005/06 - 2009/10 N/A 2007/2008
New York Jan 2000 - Nov 2001 Aug 2003 - Dec 2010 1999/2000 - 2001/02 2002/03 - 2009/10 1999/2000 2003/2004; 2007/2008
Oklahoma May 2003 - Apr 2004; Nov 2007 - Dec 2010
May 2004 - Oct 2007 2007/08 - 2009/10 2003/04 - 2006/07 2007/2008 2003/2004
Texas Jun 2001 - May 2002 Jun 2002 - Dec 2010 N/A 2001/02 - 2009/10 N/A 2003/2004; 2007/2008
Utah Jul 2002 - Jun 2003 Jul 2003 - Dec 2010 N/A 2002/03 - 2009/10 N/A 2003/2004; 2007/2008
Washington Jul 2003 - Jun 2004 Jul 2004 - Dec 2010 N/A 2003/04 - 2009/10 N/A 2003/2004; 2007/2008 Wisconsin Jun 2009 - May 2010 Jun 2010 - Dec 2010 N/A 2009/10 N/A N/A

32
Table 9 Dichotomous Dependent Variable: Individual is Enrolled in College
Results for Hispanic Non-Citizens
Model Specification (1) (2) (3) (4)
Baseline Baseline with Controls
Extended Controls
State Time Trends
Policy 0.036** 0.031* 0.032* 0.058** (0.017) (0.017) (0.016) (0.026) Female 0.050*** 0.075*** 0.074*** (0.009) (0.009) (0.009) Age -0.127*** -0.142*** -0.148*** (0.038) (0.036) (0.035) Age^2 0.002** 0.002*** 0.002*** (0.001) (0.001) (0.001) Married -0.144*** -0.143*** (0.011) (0.011) Asian 0.078 0.075 (0.062) (0.061) Black 0.031 0.025 (0.020) (0.020) Other Non-White -0.056*** -0.053*** (0.017) (0.016) Constant 0.262*** 2.139*** 2.220*** 2.263*** (0.033) (0.400) (0.375) (0.367) Observations 36,051 36,051 36,051 36,051 R-squared 0.039 0.098 0.118 0.121
Notes: Cluster-robust standard errors in parentheses. *Significant at 10%, **Significant at 5%, ***Significant at 1%. All regressions control for state and date fixed effects.
33
Table 10 Dichotomous Dependent Variable: Individual is Enrolled in College
Policy Coefficients for Various Demographic Groups
Citizenship Groups (1) (2) (3) (4)
Baseline Limited Controls
Extended Controls
State Time Trends
Hispanic Non-Citizens 0.029* 0.027 0.028* 0.056** (0.017) (0.017) (0.016) (0.028) Non-Hispanic, Non-Citizens -0.052* -0.054** -0.035 -0.024 (0.030) (0.026) (0.023) (0.045) Hispanic Natives 0.021 0.025** 0.022** 0.041* (0.012) (0.011) (0.010) (0.021)
Non-Hispanic Natives -0.001 0.000 0.000 0.011 (0.008) (0.007) (0.006) (0.007) Hispanic Foreign-Born Citizens -0.018 -0.018 -0.039 0.072 (0.037) (0.038) (0.037) (0.050) Non-Hispanic Foreign-Born Citizens -0.014 -0.019 -0.014 -0.002 (0.034) (0.031) (0.030) (0.044) Controls for: Gender N Y Y Y Age, Age^2 N Y Y Y Marital Status N N Y Y Race N N Y Y Native Unemployment Rate Y Y Y Y Native College/High School Graduate Ratio Y Y Y YAge of Entry into the U.S. Y† Y† Y† Y† State Y Y Y Y Date Y Y Y YState Time Trends N N N Y
Notes: Cluster-robust standard errors in parentheses. *Significant at 10%, **Significant at 5%, ***Significant at 1%. †Age of Entry into the U.S. is not applicable for native-born citizens.
34
Table 11 Policy Effect on Sticker Price Tuition and Fees
Flagship Universities Comprehensive Schools Community Colleges
Resident Tuition Subsidy (Nonresident – Resident Tuition)
1,164 -442 -402 (781) (286) (371)
Nonresident Tuition
1,775** -242 -572 (772) (369) (363)
Resident Tuition
611* 200 -170*** (304) (295) (53)
Notes: Cluster-robust standard errors in parentheses. *Significant at 10%, **Significant at 5%, ***Significant at 1%. State-level regressions control for state and year fixed effects, % female, % married, % Asian, % Black, % Hispanic, % Other non-White race, average age, average age-squared, native unemployment rate, and the native college/high-school graduation ratio. Values expressed in real 2010 dollars. Number of observations: 544 Flagship, 500 Comprehensive, 531 Community Colleges.

35
Table 12 Policy Coefficients for College Aid and Student Indebtedness Regressions – Various Demographic Groups
(1) (2) (3) (4) (5)
Borrowed Amount
State Aid Institution
Aid State Grants
Institution Grants
Observations
Hispanic Non-Citizens 569 -48 445** -79 471** 3,326(924) (103) (209) (101) (209)
Non-Hispanic, Non-Citizens 679 -11 15 -25 -20 9,171(859) (74) (217) (69) (209)
Hispanic Natives 1,411* 69 128 66 87 16,624 (832) (97) (199) (86) (194)
Non-Hispanic Natives -441 -16 78 -22 57 149,024 (478) (45) (71) (43) (72)
Hispanic Foreign-Born Citizens -220 -130 -23 -131 -107 2,173 (1,642) (166) (344) (153) (322)
Non-Hispanic Foreign-Born Citizens -360 -104 279 -21 282 8,221 (1,057) (69) (201) (63) (205)
Notes: Cluster-robust standard errors in parentheses. *Significant at 10%, **Significant at 5%, ***Significant at 1%. Table reports policy coefficient (and standard error) from regressions of the dependent variable in the column header. Regressions are specific to the demographic group listed in each row. All regressions include year and state fixed effects, plus demographic, macroeconomic, institutional, and income controls.