in systems neuroscience - robots.ox.ac.ukirezek/outgoing/papers/executive_frontiers11.pdf · 2003;...
TRANSCRIPT

IN SYSTEMS NEUROSCIENCE
Executive Functions and Pre-Frontal Cortex: A Matter of Persistence?
Gareth Ball, Paul R Stokes, Rebecca A Rhodes, Subrata K Bose, Iead Rezek, Alle-meije Wink, Louis-david Lord, Mitul A Mehta, Paul M Grasby and Federico E Turkheimer
Journal Name: Frontiers in Systems Neuroscience
ISSN: 1662-5137
Article type: Original Research Article
Received on: 18 Oct 2010
Accepted on: 07 Jan 2011
Provisional PDF published on: 07 Jan 2011
Frontiers website link: www.frontiersin.org
Citation: Ball G, Stokes PR, Rhodes RA, Bose SK, Rezek I, Wink A, Lord L, Mehta MA, Grasby PM and Turkheimer FE (2011) Executive Functions and Pre-Frontal Cortex: A Matter of Persistence?. Front. Syst. Neurosci. 5:3. doi:10.3389/fnsys.2011.00003
Article URL: http://www.frontiersin.org/Journal/Abstract.aspx?s=1091&name=systems%20neuroscience&ART_DOI=10.3389/fnsys.2011.00003
(If clicking on the link doesn't work, try copying and pasting it into your browser.)
Copyright statement: © 2011 Ball, Stokes, Rhodes, Bose, Rezek, Wink, Lord, Mehta, Grasby and Turkheimer. This is an open-access article subject to an exclusive license agreement between the authors and the Frontiers Research Foundation, which permits unrestricted use, distribution, and reproduction in any medium, provided the original authors and source are credited.
This Provisional PDF corresponds to the article as it appeared upon acceptance, after rigorous peer-
review. Fully formatted PDF and full text (HTML) versions will be made available soon.

Executive Functions and Pre-Frontal Cortex: A Matter of
Persistence?
Gareth Ball1, Paul R. Stokes1, Rebecca A. Rhodes1, Subrata K. Bose1, Iead Rezek2,
Alle-Meije Wink1, Louis-David Lord2, Mitul A. Mehta3, Paul Grasby1,2
and Federico E. Turkheimer1,2 *
1MRC Clinical Sciences Centre, Hammersmith Hospital, London, UK2Division of Neuroscience and Mental Health, Imperial College London, UK3Institute of Psychiatry, King’s College London, UK
*Corresponding author
Address for correspondence:
Dr. Federico E. Turkheimer
Department of Clinical Neuroscience
Division of Neuroscience and Mental Health
Cyclotron Building, Room 236
Hammersmith Hospital
DuCane Road
London W12 0NN, UK
Tel: +44 20 8383 3726
Fax: +44 20 8383 2029
Email: [email protected]
Running Title
fMRI Persistence in the PFC
1
Abstract
Executive function is thought to originate in the dynamics of frontal cortical networks. We examined the dynamic properties of the blood oxygen level-dependent (BOLD) time-series measured with fMRI within the prefrontal cortex (PFC) to test the hypothesis that temporally persistent neural activity underlies performance in three tasks of executive function. A numerical estimate of signal persistence, the Hurst exponent, postulated to represent the coherent firing of cortical networks, was determined and correlated with task performance. Increasing persistence in the lateral PFC was shown to correlate with improved performance during an n-back task. Conversely, we observed a correlation between persistence and increasing commission error – indicating a failure to inhibit a prepotent response - during a Go / No-Go task. We propose that persistence within the PFC reflects dynamic network formation and these findings underline the importance of frequency analysis of fMRI time-series in the study of executive functions.
Keywords:
Executive function; Prefrontal cortex; Persistence; BOLD, Hurst exponent,
Networks, Functional MRI

2
Introduction
High level cognitive functions have traditionally been localised to the anterior frontal association cortex, commonly referred to as the PFC. Numerous studies have expanded upon this static view of executive localisation, identifying functional networks activated by complex executive processes and served by extensive reciprocal connections between the PFC, posterior parietal cortex and various cortical and limbic regions (Selemon and Goldman-Rakic 1988; Ongur and Price 2000; Halgren et al., 2002; Honey et al., 2002; Schall et al., 2003; Perianez et al., 2004; Owen et al., 2005; Simmonds et al., 2008). The abundance of connectivity between the PFC and the rest of the brain suggests that a definition of executive function can be obtained from the dynamics of converging networks into the cortical layers of the lateral PFC (Fuster 2001; Stevens 2009). The persistence of these signals through time is a fundamental neurobiological substrate that enables the organisation of executive actions (Durstewitz et al., 2000b; Curtis and D'Esposito 2003).
Coherent PFC neuronal firing in the gamma frequency band (30 – 70 Hz) has been associated with behavioural measures of executive function in humans and appears altered in pathological states (Gonzalez Andino et al., 2005; Ferrarelli et al., 2008; Haenschel et al., 2009). Although gamma frequencies are not measurable with fMRI, it has been demonstrated that BOLD activation is tightly correlated to the power of local-field potential oscillations in the gamma range in the cat visual cortex (Niessing et al., 2005). In humans, this relationship may be more complex (Winterer et al., 2007), but Lachaux et al. (Lachaux et al. 2007) has shown experimentally that modulation of the gamma bandwidth of EEG recordings maps to BOLD signal measured with fMRI, demonstrating that the time-envelope of these signals, convoluted with the hemodynamic response, translate in slower dynamics to which the fMRI is sensitive. The dynamic BOLD signal therefore contains frequency information that reflects coherent neuronal activity and is amenable to analysis. Indeed, a recent, simultaneous EEG-fMRI study revealed specific, load-dependent correlations between gamma band signals and BOLD activity in the dorsolateral PFC during a working memory task (Michels et al., 2010).
We postulate that persistent BOLD properties, defined as long memory processes with higher energy at low frequencies, represent synchronous neuronal firing that translate into smoother BOLD signals over time. Such properties have been investigated previously and have proven sensitive to pharmacological challenge, normal aging and pathological states of cognitive dysfunction (Maxim et al., 2005; Anderson et al., 2006; Wink et al., 2006; Suckling et al, 2008; Wink et al, 2008).
BOLD time-series have an inherent fractal nature where the self-similarity of brain activity reflects into the frequency content of the auto-correlation function that declines according to a power-law (Kitzblichler et al., 2009; Expert et al., 2010). Concurrently,
3
the frequency properties of BOLD time-series can be quantified by the Hurst exponent (H) (Wink et al., 2006). The Hurst exponent is a measure of autocorrelation, or self-similarity, of a time-series within the 0-1 range describing the 1/f rate of energy distribution, where f indicates the frequency of the signal. Values of H between 0.5 and 1 indicate greater low-frequency content, e.g. greater persistence over time, a smoother time-series and longer memory. Values between 0 and 0.5 indicate greater high-frequency content and a value of 0.5 indicates a true random walk. Higher values of H and persistence have come to indicate more complex and coordinated dynamics in the underlying network activities and degradation of fractal complexity has come to indicate the desynchronization of the biological system and reflect malfunction, aging or disease (Lipsitz and Goldberger, 1992; Goldberger et al., 2002; DeKosky and Marek, 2003; Salkovic-Petrisic et al., 2009).
The frequency analysis of fMRI time-series has reported interesting although sometimes discordant results. Wink et al. (Wink et al., 2006) demonstrated a direct association between ageing and scopolamine administration with the Hurst exponent in resting fMRI but subsequently demonstrated an association between higher persistence and faster response in a prior encoding task (Wink et al., 2008). The paradoxical results were explained by a complex multifractal analysis of the previous data, although the original result of increased H, equivalent to the persistence in the time-series, was confirmed. Aging, disease and pharmacological agents, however, alter brain vascular reactivity and perfusion (Estrada et al., 1983; Fukuyama et al., 1996; Farkas and Luiten, 2001) that will act as confounder in the BOLD frequency response.
The general aim of this work was to build on the evidence described above and examine in detail the association between coherence in neuronal firing in the frontal cortices, as reflected in the average frequency content of fMRI signal and direct behavioural measures of executive function tasks in normal volunteers.
Our primary hypothesis was that estimates of the Hurst exponent from BOLD activity, obtained using standard wavelet scalograms (Bullmore et al., 2004) from within the lateral PFC were associated with performance in three tasks of executive function (n-back, Go / No-Go and Tower of London). Additionally, we investigated persistence in a number of associated cortical regions, commonly activated as part of an ‘executive’network during these tasks.

4
Materials and Methods
Participants
Forty-six healthy, right-handed participants aged 19-59 (18 male; mean age = 35.1 years, SD = 11.6) were included. All participants were free of physical illness and had no history of psychiatric or neurological disorder as assessed using a physical examination, medical history and a structured interview (First and Pincus 2002). The study was conducted with ethical approval from Hammersmith Hospital Research Ethics Committee, and all participants gave written, informed consent.
Task Design
The tasks performed in the fMRI scanner were all programmed with E-Prime v1.1 (Psychology Software Tools, Inc., Pittsburgh, PA, USA), presented using the Integrated Functional Imaging System (IFIS-SA, Invivo, Orlando, FL, USA), and completed during the same fMRI session, in a counter-balanced order.
N-Back
During this working memory task, a dot was presented in one of four spatial locations,corresponding to a particular button on a response pad and arranged horizontally across the screen (Gevins and Cutillo 1993). Participants were required to either press the button that corresponded to where the dot was currently appearing (0-back), where the dot had appeared one trial previously (1-back) or where the dot had appeared two trials previously (2-back). Dots were presented for 500ms followed by a blank screen for 1500ms, with 12 dots per block. Three 0-back blocks, three 1-back blocks and three 2-back blocks, each lasting 24 seconds, were presented in a pseudo-random order, interspersed with two blocks of a low-level rest condition (fixation). Instructions were presented for 3 seconds prior to the start of each block. Each subject underwent two sets of n-back blocks during the imaging session to test the robustness of any findings. One subject failed to complete the second set of blocks and was included in the analysis using data from the first set only. Response accuracy (proportion of correct responses) and response time were used as measures of performance.
Go / No-Go
This task of response inhibition consisted of ten 36 second blocks of two conditions: ‘Go’, requiring a response to every stimulus and ‘No-Go’, requiring a response to all but the ‘stop’ stimulus. Five Go blocks and five No-Go blocks were presented in a pseudo-random order, interspersed with two blocks of a rest condition (fixation) after the third and seventh blocks. Go stimuli (the letters F, H, K, P and S) were presented every 3 seconds for 500 ms during the blocks. The No-Go stimulus (the letter V) was substituted for a Go stimulus in 45% of trials in the No-Go blocks. Number of

5
commission (responses to a No-Go signal) and omission (no response to a Go signal) errors and response time to Go signals were used as a measure of performance.
Tower of London
This planning task required participants to determine the minimum number of moves to re-arrange three coloured balls from a start position to a target position (Owen et al., 1996). Participants were presented with a display containing an upper ‘target’ section that indicated the final position of the coloured balls, and a lower ‘start’ section that indicated the start position of the coloured balls and were then asked to indicate the minimum number of moves via a single finger keypad response. During the ‘Control’ block participants were requested to count the number of balls in both the start and target pockets. Four ‘Easy’ blocks (comprising two and three move problems), four ‘Difficult’ blocks (comprising four to six moves), and four ‘Control’ blocks were presented in a pseudo-random order, interspersed with three blocks of a rest condition (fixation). Each block lasted 30 seconds and each trial was self-paced. Instructions were presented for 3 seconds prior to commencement of each block. Response accuracy (proportion of correct responses) and response time to correctly solved problems were used as measures of performance.
Imaging Parameters
Functional MRI was performed with a Philips Intera 3 Tesla MRI scanner. Functional T2*-weighted images were acquired using gradient-echo echoplanar imaging, with an automated higher order shim procedure (SENSE factor 2; TE 30 ms; TR 3000 ms; flip angle 90º; FOV 280 mm; voxel dimensions 2.2 x 2.2 x 2.75 mm). Images were acquired in 48 contiguous 2.75 mm axial slices per brain volume. The total number of brain volumes acquired for each of these tasks was 218, 154, and 169. The first 5 volumes of each scan were discarded to account for T1 equilibration effects. Functional images were acquired during two runs of 5 minutes 27 seconds (n-back), a single run of 7 min 42 s (Go / No-Go) and one of 8 min 27 s (Tower of London). A high resolution T1-weighted TFE structural scan was also acquired for each participant for subsequent high-resolution image registration (TE 4.6 ms; TR 9.7 ms; Flip angle 8º; FOV 240 mm; voxel dimensions 0.94 x 0.94 x 1.2 mm).
Image Analysis
Initial processing of functional data sets was carried out using FSL (FMRIB’s Software Library, http://www.fmrib.ox.ac.uk/fsl; Smith et al., 2004). Each 4D functional volume was motion corrected, brain-extracted, spatially smoothed with a Gaussian kernel ofFWHM 5 mm and grand-mean intensity normalised.
Given the importance of the prefrontal cortex to executive function, mean BOLD time-series collected during each task were extracted from three bilateral regions-of-interest (ROI), defined by the Harvard-Oxford Cortical Structural Atlas and chosen to represent

6
the lateral PFC (middle frontal gyrus; inferior frontal gyrus pars opercularis, and pars triangularis; Table 1, shown in Figure 1A) to test the primary hypothesis that executive function task performance is associated with persistence in the BOLD activity within the lateral PFC.
[ FIGURE 1 ]
Many studies have described functionally connected networks comprising several common structures and engaged by executive task demands regardless of the specific task involved (Menon et al., 2001; Schall et al., 2003; Owen et al., 2005; Seeley et al., 2007; Stevens et al., 2007; Simmonds et al., 2008; Stevens et al., 2009). In addition to the primary ROI defined above, BOLD time-series were also extracted from several ROI previously identified as part of the executive networks (anterior and posterior cingulate cortex, cuneus, precuneus, medial frontal cortex, parahippocampal gyrus, insula and superior parietal cortex, Figure 1B and Table 1) to investigate BOLD signal persistence outside of the PFC.
[ TABLE 1 ]
Regional time-series were obtained by registering standard space ROI masks to the filtered functional datasets via individual high-resolution T1-weighted structural images with a 12 degrees-of-freedom affine registration using FSL’s Linear Registration Tool (FLIRT) and then averaging the pixel time-data within the native-space masks. In addition, group average BOLD activation maps were generated using FSL’s FEAT. After pre-processing, data were entered into a GLM to determine where BOLD activation occurred during each task condition (Contrasts: n-back: 0-back > Rest; 1-back > Rest; 2-back > Rest; Go / No-Go: Go > Rest; No-Go > Rest; Tower of London: Easy > Rest; Difficult > Rest) on average across the group. Z-statistic images were thresholded at Z = 2.3 and cluster-corrected across the whole brain using Family-Wise Error (FWE) with a significance threshold of p < 0.05 (see Figure 2). To investigate region-specific changes in BOLD in ROI where persistence correlated significantly with executive task performance, the mean BOLD signal change (%) associated with parameter estimates from the modelled experimental paradigm within each ROI was estimated using FSL’s FEATquery.
[ FIGURE 2 ]

7
Numerical Estimates of Persistence
For some class of models, persistence (P) of a time-series can be defined as the ratio between the energy at low vs. high frequencies. By this definition, a signal that persists longer has longer memory and displays a larger numerical ratio than a signal with lower persistence. The non-linear and complex organization of the human brain and its internal dynamics are reflected in output signals at the microscopic, mesoscopic and macroscopic level that are generally fractal and exhibit decay in energy that is proportional to 1/f. For a complete review on the topic see (Werner, 2010).
Numerical estimates of persistence in fractal time-series can be determined using the Hurst exponent (H), a number defined in the [0-1] range where values of H=0.5 indicate a purely random process, values in the [0-0.5] interval indicate antipersistent, mean-reverting behaviour and values in the [0.5-1] range indicate persistent/long-memory processes. The estimation of H is far from trivial and requires an understanding of the generating process (see review in Eke et al., 2002). Most estimators available are tailored to two classes of signals that may generate fractal signatures, fractional Gaussian processes (fGn) or fractional Brownian processes (fBn) that are, respectively,stationary and non-stationary processes with 1/f behaviour (Eke et al., 2002). Physiological signals are generally non-stationary but the class of ownership of a signal must be determined so that the proper estimator can be used. This can be tested by plotting its power spectrum and measuring its rate of decay. 1/f noises with –1 < β < 1 and 1 < β < 3 are almost identical to fGn and fBm signals, respectively (Beran 1994).Figure 3 shows the plotted power spectrum of a typical regional fMRI BOLD time-course that demonstrates a rate of decay (~2) that assigns the signal to the fBm class. For this class, time-frequency estimators of H based on the wavelet transform are optimal (Eke et al., 2002). In this work, estimates of H were obtained using standard wavelet scalograms (Bullmore et al., 2004), in the simple implementation of Jones and colleagues (Jones et al., 1996) and robust within the sampling rate available. In detail, for each time-series, the wavelet transform uses a sequential bank of filters to extract the energy of sequential frequency bands, from the high- to the low. The wavelet scalogram then plots the log of the square of the average of the wavelet coefficients for each band against the log of ordinal number of each band (an integer N=1, 2, 3, … , indexing the bands from the highest frequency band). The Hurst exponent (H) is calculated as H= (S-1)/2 where S is the slope of the scalogram. Here, the algorithm to calculate H was written in Matlab (The MathWorks Inc., Natick, MA, USA), version R2008b, where the scalogram was obtained using wavelet packets and the Haar wavelet as described in Jones et al. (1996). Six wavelet bands were used covering the 0.1667 - 0.005 Hz frequency range. An example of wavelet scalogram for the same regional time-series is illustrated in Figure 3.
[ FIGURE 3 ]

8
Statistical Analysis
Statistical analysis was performed with SPSS (SPSS Inc., Chicago, IL, USA) version 16.0. Repeated measures analyses of covariance were implemented where appropriate, with reaction time or response accuracy during the n-back or Tower of London tasks as a 3-level within-subject factor and H in each ROI as between-subject covariate. Post-hoc analysis was performed on significant effects, after correction for multiple testing. For the Go / No-Go task pairwise analyses of correlation between H and commission error, omission error and ‘Go’ response time were performed using the Spearman rank correlation coefficient due to non-normally distributed behavioural data (Shapiro-Wilk test). Only correlations within the PFC that survived correction for multiple comparisons were considered. Multiple testing corrections were implemented with the P-plot method with Hochberg correction (Turkheimer et al., 2001) used to control for the family-wise error rate.

9
Results
N-Back
Behaviour
Forty-six participants completed the first n-back set of blocks and scored 89.7 ± 8.9 %, 88.3 ± 10.1 % and 70.4 ± 20.3 % correct for the 0-, 1- and 2-back tasks respectively. Increasing task difficulty had a significant effect on response accuracy (ANOVA, p < 0.001) and response latency (p < 0.05). Mean response time was 640 ± 157 ms, 532.9 ± 232 ms and 542 ± 254 ms for each difficulty level. Forty-five participants successfully completed a second set of n-back blocks, response accuracy (0-back: 92.4 ± 6.4 %; 1-back: 86.7 ± 12.4 %; 2-back: 70.7 ± 20.4 %) and response time (0-back: 642 ± 158 ms; 1-back: 553 ± 253 ms; 2-back: 534 ± 300 ms) did not differ significantly between the first and second sets.
Imaging
Faster response time during the first n-back set was correlated with higher H across the lateral PFC. Repeated measures ANOVA revealed a main effect of H on response time (Table 2) in the left inferior frontal gyrus pars opercularis, pars triangularis and middle frontal gyrus and in the right pars triangularis and middle frontal gyrus (all p < 0.05). Response accuracy did not significantly correlate with H in the lateral PFC.
[ TABLE 2 ]
[ TABLE 3 ]
Post-hoc analysis (Table 3) revealed significant correlations between H during the whole n-back set and individual response times during 0-back blocks in the left inferior frontal gyrus pars opercularis and middle frontal gyrus and the right middle frontal gyrus (all p < 0.05), during the 1-back blocks in the left pars opercularis (p < 0.01), pars triangularis (p < 0.05) and middle frontal gyrus (p < 0.01) and in the right pars triangularis (p < 0.05) and middle frontal gyrus (p < 0.01) and during the 2-back blocks in the left pars triangularis and middle frontal gyrus (both p < 0.05).
[ FIGURE 4 ]

10
During the second n-back set, the overall pattern of correlations between H and response time was similar, particularly in the left PFC (Figure 4), although fewer statistically significant correlations were observed (Table 4). A main effect of H on response time was present at a trend level in the left pars opercularis and pars triangularis (both p = 0.07) and significant in the left middle frontal gyrus (p = 0.05). No significant main effects were observed in the right hemisphere and no significant correlations were observed between H and response accuracy. Post-hoc analysis revealed significant correlations between H in the left middle frontal gyrus and response time during the 0-back (t = -2.38, p = 0.022) and 1-back (t = -2.08, p = 0.044) but not 2-back blocks (Figure 4).
[ TABLE 4 ]
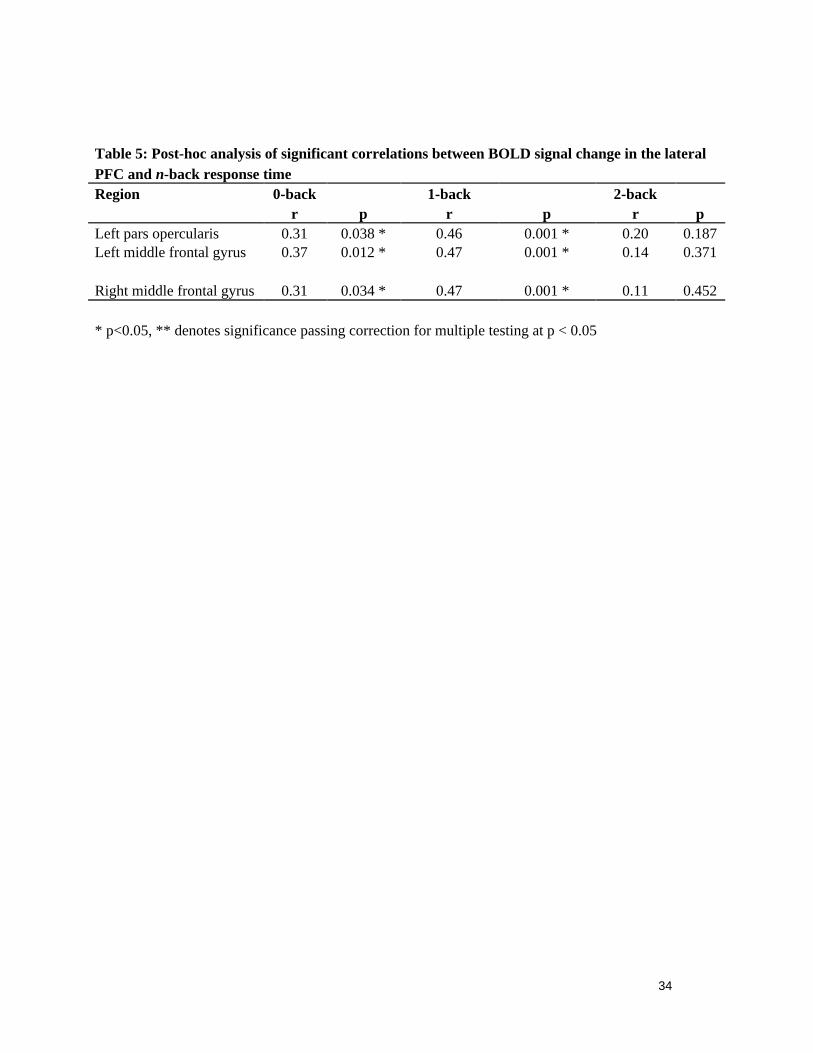
BOLD signal change was examined where significant correlations between H and n-back performance were observed i.e: bilaterally in the middle frontal gyrus and in the left inferior frontal gyrus pars opercularis. Group average BOLD activations during the 2-back condition (2 > Rest contrast; Z > 2.3, FWE-corrected p < 0.05) are shown in Figure 2. Positive significant correlations between BOLD signal change and n-back response time were observed in the left pars opercularis, and middle frontal gyrus during the 0-back (both p < 0.05) and 1-back (both p < 0.01) but not 2-back blocks. In the right hemisphere significant correlations were observed in the middle frontal gyrus during the 0-back blocks (p < 0.05) and the 1-back blocks (p < 0.01). Table 5 shows BOLD and response time correlations within the PFC, notably, the observed significant correlations were all opposite in direction to the correlations with H. During the second n-back set, BOLD signal change in the left middle frontal gyrus did not correlate with response time during any block (0-back: r = 0.28, p = 0.063; 1-back: r = 0.16, p = 0.302; 2-back: r = 0.05, p = 0.752).
[ TABLE 5 ]
Outside of the PFC, no correlations between H and response time during the first or second n-back sets were observed. A significant main effect of H on response accuracy during the first but not the second n-back task was seen in the posterior cingulate (F(1,44)
= 5.09, p = 0.029) and bilaterally in the anterior parahippocampal gyri (Left: F(1,44) = 7.89, p = 0.007; Right: F(1,44) = 5.29, p = 0.026) but these effects did not pass correction for multiple testing.

11
Go / No-Go
Behaviour
Forty-three participants successfully completed the Go / No-Go task; of these, thirty-four made commission errors (responded to a STOP signal). Within this group, the median number of commission errors (range) was 3 (1 – 8). Errors of omission (failing to respond to a Go signal) were committed a median (range) of 2 (0 – 8) times across the whole group. Mean response time to Go signals was 447.3 ± 97.9 ms.
Imaging
High H in the lateral PFC correlated with increased commission errors made during the Go / No-Go task. Pairwise correlations between H in each PFC region over the course of the task and the number of commission errors committed during the No-Go blocks revealed significant associations bilaterally in the pars opercularis (Left: p < 0.05; Right: p < 0.01) and middle frontal gyrus (Left: p < 0.05; Right: p < 0.01) and in the left pars triangularis (p < 0.05; Table 6). Figure 5 illustrates this association in the left and right middle frontal gyri. Omission error and response time to Go signals were not significantly correlated with H in any region of the lateral PFC. BOLD signal change during No-Go blocks in the lateral PFC did not correlate with commission error, group activations are shown in Figure 2 (Contrast: No Go > Rest, Z > 2.3, FWE-corrected p < 0.05). Outside of the PFC, increasing commission error was only correlated with H in the precuneus (Spearmans’ rho = 0.375, p = 0.013) but this effect did not survive multiple comparison correction.
[ TABLE 6 ]
[ FIGURE 5 ]
Tower of London
Behaviour
Forty-five participants completed the Tower of London task successfully. As expected increasing task difficulty was associated with decreasing response accuracy and increasing response latency (ANOVA, p < 0.001). Participants scored (mean ± S.D) 91.1 ± 6.3 %, 62.4 ± 15.4 % and 29.5 ± 17.4 % correct for the control, easy (two and three moves) and difficult (four to six moves) tasks, respectively. Mean response time was 1647 ± 379 ms, 5957 ± 1868 ms and 11611 ± 4165 ms, respectively.

12
Imaging
No significant correlations between H in the lateral PFC and response time during the Tower of London task were observed. A main effect of H on response accuracy only approached significance in the left middle frontal gyrus (F(1,43) = 3.01, p = 0.09) and the right pars opercularis (F(1,43) = 3.36, p = 0.074).
Outside of the lateral PFC, a single significant correlation between H and response accuracy was observed in the right insula (F(1,43) = 4.79, p = 0.034) but this effect did not pass correction for multiple testing.
Persistence across tasks
We observed that H within the middle frontal gyri correlated with performance duringboth the n-back and Go / No-Go tasks and achieved trend-level significance during the Tower of London task. We investigated if H within the middle frontal gyri remainedconsistent across each task.
The correlations between H within the middle frontal gyri during each task are shown in Tables 7 and 8. In the left hemisphere (Table 7) H during the Tower of London task correlated with H during the first (p < 0.01) and second (p < 0.05) n-back sets and the Go / No-Go task (p < 0.05). Only H during the first n-back set and the Go / No-Go task did not significantly correlate. In the right hemisphere (Table 8), significant correlations were observed between H during the Tower of London task and the first (p < 0.01) and second (p < 0.01) n-back sets and between H during the second n-back set and the Go / No-Go task (p < 0.01). Correlations between H during the first and second n-back setsand between the Tower of London and Go / No-Go tasks approached significance (p = 0.064 and p = 0.083, respectively).
[ TABLE 7 ]
[ TABLE 8 ]

13
Discussion
Using fMRI, we have demonstrated a correlation between performance of executive function tasks and the dynamic properties of their underlying BOLD time-series within the lateral PFC. Traditionally, the study of behavioural correlates have focused on transient events, here we demonstrate that BOLD signals sustained across time are also functionally relevant. Increasing persistence, H, postulated to represent the translation of temporally persistent and coherent firing of cortical neurons into a smoother BOLD signal, correlated with improved performance during n-back tasks. Conversely, and perhaps surprisingly, we also observed a correlation between H and increasing commission error – indicating a failure to inhibit a prepotent response - during a Go / No-Go task. Importantly, H was consistent across tasks suggesting that persistence may reflect a hard-wired property of neuronal networks projecting into the PFC.
N-Back
The n-back task requires sustained attention with increasing working memory load at the most difficult levels. An extensive working memory network comprising the dorsolateral and mid-ventrolateral PFC, parietal cortex, medial cerebellum and anterior and dorsal cingulate cortex has been well documented (Owen 1997; Owen et al., 2005). Here we confirm the presence of this network and present significant correlations between increasing H and faster response time in the n-back task across the lateral PFC. Specifically, we observed correlations between H in the left and right middle frontal gyri and the left inferior frontal gyrus pars opercularis and performance during the 0-and 1-back conditions and in the left middle frontal gyrus and performance during the 2-back condition of the first n-back set. In the second set, during which task blocks were presented in a different order, these observations were not repeated to the same extent, reaching only trend-level significance in the left hemisphere only, specifically thebetween H in middle frontal gyrus and performance during the 0- and 1-back conditions.
The PFC is involved in various cognitive functions relevant to executive working memory including recollective monitoring and rehearsal (Dobbins et al., 2002) and, importantly online maintenance of information (Funahashi and Kubota 1994). The idea that the PFC sustains executive working memory has been investigated using a number of fMRI paradigms. Cue-delay paradigms have been used to investigate maintenance signals in the PFC (Sakai and Passingham 2003; Sakai and Passingham 2006) while mixed blocked/event-related designs have been developed for the extraction of task set-related signals from fMRI experiments (Braver et al., 2003; Dosenbach et al., 2006; Cole and Schneider 2007). The middle frontal gyrus, in particular, has been reliably and repeatedly associated with performance in n-back, delayed-matching and delayed-response tasks (Cohen et al., 1997; Courtney et al., 1997; Postle and D'Esposito 1999). However, when both n-back sets are taken together, our observations suggest that H, specifically in the left middle frontal gyrus (Figure 4) and pars triangularis, is most

14
relevant to performance during the 0- and 1-back task conditions, at which the n-back task can be described as essentially perceptual with little working memory demand and, in this respect, is best viewed as a task of attention. Indeed, it has been proposed that the majority of delay-period activity in the PFC may relate to attentional monitoring and selection (Petrides 2000; Rowe et al., 2000; Lebedev et al., 2004; Postle 2006). In the present study, the fact that that the relationships between performance and H were dominant at the lower difficulty levels and that the correlations were with response time, suggests that H is related to sustained attentional processes mediated by the prefrontal components of the executive working memory network (Hopfinger et al.,2000).
Go / No-Go
Surprisingly, H correlated with increased commission error during the Go / No-Go task. Correlations were observed bilaterally in the middle frontal gyrus, inferior frontal gyrus pars opercularis and pars triangularis with the strongest found in the right middle frontal gyrus and right pars opercularis. The right prefrontal cortex is commonly associated with response inhibition, activating as part of a right-lateralised network during No-Go trials (Simmonds et al., 2008), although a similar role has also been demonstrated in the left hemisphere (Swick et al., 2008).
Ettinger et al. (2008) recently described how the successful inhibition of a reflexive rapid eye movement (saccade) in favour of a volitional response (antisaccade) relates to the inferred ‘plasticity’ of the cognitive process hypothesised to underlie it. Both the saccade / antisaccade and Go / No-Go task require the inhibition of an unwanted response and the PFC - predominantly the right inferior frontal gyrus – is part of a network active during response inhibition, independent of modality (Chikazoe et al., 2007; Leung and Cai 2007). Electrophysiological evidence suggests that coherent firing of groups of neurons across both spatial and temporal domains within the PFC occurs in the gamma frequency range and this synchrony is thought to underlie performance in tasks of executive performance (Howard et al., 2003; Sederberg et al., 2003; Gregoriou et al., 2009). Our observations support this hypothesis and further evidence indicates that a transient suppression of gamma band synchronisation occurs within the ventrolateral PFC during a high-level cognitive task (Lachaux et al., 2007) and more specifically, selective desynchronisation in the gamma band has been observed during the No-Go condition of a Go / No-Go task (Harmony et al., 2009). While these observations may seem at odds with the common observation of BOLD activation in the PFC during both Go and No-Go trials, and occur at a frequency above that detectable using fMRI, it is possible that suppression of neuronal synchrony is itself an active process with concurrent metabolic demand that is reflected in the temporal properties of the BOLD signal. Our result suggest that, in contrast to the n-back tasks, a decrease in persistent neuronal firing within the lateral PFC is associated with improved performance during the Go / No-Go task.

15
Tower of London
The Tower of London task requires complex visuospatial planning that, at the highest level of difficulty, demands significant working memory, selective attention and preparatory set resources in order to manipulate information across both spatial and temporal domains and achieve a preset goal (Shallice 1982). Previous studies have highlighted a widespread network of regions, including the left and right middle frontal gyri, anterior cingulate gyrus, cuneus and parietal cortex, activated during planning tasks and have attempted to delineate structures underlying the cognitive subprocesses involved (Lazeron et al., 2000; Rowe et al., 2001; Newman et al., 2003; Schall et al., 2003). Overall, they concluded that PFC regions were primarily involved in the generating, selecting and remembering appropriate moves over the evaluation of specific solutions.
We confirm this widespread network of activation during the Tower of London task but were not able to determine if H in the PFC was associated with task performance. It is possible that we were not able to dissociate this relationship due to the complexity and self-paced nature of the task, compared to the relatively simple n-back and Go / No-Go tasks. The Tower of London is a multifaceted task and it has been suggested that classifying task difficulty based on the minimum number of moves to solve each problem is inadequate to capture the full cognitive load of doing so correctly (Berg et al., 2010). Variation in goal hierarchy, search depth and solution paths betweenproblems of the same difficulty can potentially influence performance and task-related PFC BOLD activation during the Tower of London task, potentially confounding our observations (Unterrainer et al., 2006; McKinlay et al., 2008; Newman et al., 2009;). Therefore, while the dynamics of BOLD signalling in the PFC may be a marker of the underlying processes that result in successful planning, the present study design may not have been appropriate to capture the necessary information.
Network States
Connectivity analysis of fMRI data has been used to construe and test the hypothesis that persistent neuronal activity sustaining executive programmes is enacted not just by specific properties of the PFC but is an emerging property of complex brain networks (Dosenbach et al., 2008; Cole et al., 2010; Duncan 2010). As such, persistence should be intrinsic to the brain and therefore measureable by fMRI paradigms not just in case of executive paradigms but also at rest (Dosenbach et al., 2007; Seeley et al., 2007).
Other investigators have examined the same ideas with mixed blocked/event-related methods designed to extract sustained signals (Chawla et al., 1999; Braver et al., 2003; Dosenbach et al., 2006; Cole and Schneider 2007). In addition, meta-analytic and moretheoretical approaches have also been brought to bear on these ideas (Dosenbach et al., 2008; Cole et al., 2010; Duncan 2010) and the idea of trade-offs between sustained and momentary executive signals has been brought to bear on such network analyses byDosenbach et al. (Dosenbach et al., 2007) and Seeley et al. (Seeley et al., 2007). Here,

16
we have demonstrated that H in the lateral PFC remains relatively consistent across three tasks of executive function and may mirror a stable dynamic network conformation and represent, at least in part, an aspect of ‘hard-wired’ cortical dynamics in individuals.
It was interesting and surprising to note that the linear correlation observed between H and performance was positive in the N-back task and negative in the Go / No-Go. This could be interpreted as persistence benefiting tasks requiring sustained attention to the detriment of tasks requiring rapid adaptive changes in behaviour. Converging electrophysiological (Funahashi et al., 1989), neurochemical (Goldman-Rakic et al.,2000), computational (Durstewitz et al., 2000a; Durstewitz et al., 2000b) and functional (Nolan et al., 2004; Winterer et al., 2006; Muller et al., 2007) evidence suggests dopamine-mediated fluctuations in PFC neuronal activity connote a stable or flexible network state that benefit task requiring sustained attention and adaptive changes in behavioural set, respectively (Bilder et al., 2004). Indeed, performance in both the n-back and Tower of London tasks is sensitive to endogenous dopamine levels (Mehta et al., 2005; Reeves et al., 2005; Apud et al., 2007). By contrast, stable network formation may prove detrimental to tasks that require flexible changes in behavioural set, such as the Go / No-Go. This apparently antagonistic nature of PFC activity on executive performance has been described elsewhere (Durstewitz and Seamans 2008) and previous studies have demonstrated the role of dopamine in performance in tasks requiring cognitive stability at a cost to attentional set-shifting and response flexibility (Mehta et al., 2004; Nolan et al., 2004; Dreisbach et al., 2005; Stefanis et al., 2005). Additionally, recent EEG findings have demonstrated associations between opposing dynamics of frontal networks and intelligence (Thatcher et al., 2005; Thatcher et al.,2008). However, it is important to consider that these conclusions are limited to a cohort of normal controls, and to the performance range measured. It is known that in pathological conditions, poor performance in the N-back task is usually associated with poor performance in the Go / No-Go task (Verdejo et al., 2006), so it is possible that optimal performance in executive tasks is associated with persistence in a non-linear relation, possibly U-Shaped, where both signal content at low and high frequency combine (Arnsten, J., 1997; Zahrt et al., 1997; Williams and Castner, 2005). Further investigations, possibly combined with measures of the underlying receptor systems are thus warranted.
Methodological Considerations
No correlations with H were seen outside of the PFC during the tasks after correction for multiple testing. Abundant connections exist between the PFC and the rest of the cortex, and delay-period neuronal firing is not unique to PFC neurons (Miller et al., 1993; Constantinidis and Steinmetz 1996). The process is, however, most prominent and robust in lateral PFC neurons which may explain our observations outside of the PFC (Quintana and Fuster 1999). It must also be considered that the lack of observed

17
correlations outside of the PFC may be due to low sensitivity and anatomical specificity of the current method and not an intrinsic property of non-PFC regions.
We also tried to determine if the observed relationships between H and performance were influenced by changes in BOLD activity. BOLD activation patterns can be characterised by a higher persistence and previous studies have demonstrated task-specific increases in cerebral blood flow and BOLD activation in the PFC (Beauchamp et al., 2003; Schall et al., 2003; Thurner et al., 2003). Our results demonstrate that H is not directly associated with mean BOLD signal change associated with each task block. In the Go / No-Go task, the % change of BOLD signal did not predict performance in regions where H appeared to do so. In the first n-back tasks, BOLD and H in the lateral PFC predicted performance. However, while H had a direct correlation with performance (i.e.: a negative correlation with response time), BOLD signal change was inversely correlated with performance (i.e.: a positive correlation with response time). We postulate that this aligns with previous suggestions that BOLD activity in the PFC during this task indexes neuronal tuning, with greater activity thus being associated with less efficient processing and slower or poorer performance (Mattay et al., 2006; Mier et al., 2009). However, due to fundamental differences in the nature of the two analyses, it is difficult to provide a direct comparison between them. In order to achieve parity, BOLD signal change was calculated within the atlas-defined ROI used to estimate H, and not from GLM-based activations. This may have resulted in an under-estimation of the BOLD response in these regions and confounded our observations. Note, however, that this information can be captured more robustly from H rather than BOLD signal change, in this instance. The results observed are also in line with the observed negative correlation of the latency of response in a fame decision/facial encoding task with the Hurst exponent of resting state data acquired after task performance that was reported by Wink and colleagues (Wink et al., 2008).
Finally, the sensitivity of the estimator of H limited the application of the analysis of large regions with potential loss of anatomical specificity. An extended effort will be undertaken in the future to code novel and more robust H estimators with lower noise sensitivity to allow the pixel-by-pixel mapping of H.
Conclusions
We present correlations between H, postulated to represent long memory processes of persistent, coherent neuronal firing within the lateral PFC, and performance in tasks of executive function. The finding, obtained from the frequency analysis of BOLD signals, underlines the importance of dynamical analysis of fMRI time-series in the study of brain-mind relations. Future work will consider the determination of H in resting-state fMRI paradigms and extend the measurements from controls to cohorts with executive impairments.

18
Funding
This work was supported in part by the UK Engineering and Physical Sciences Research Council (grant no. EP/E049451/1) and by core funding from the Medical Research Council (UK).

19
Reference List
Anderson, C.M., Lowen, S.B., and Renshaw, P.F. (2006). Emotional task-dependent low-frequency fluctuations and methylphenidate: Wavelet scaling analysis of 1/f-type fluctuations in fMRI of the cerebellar vermis. J. Neurosci. Methods 151, 52-61.
Apud, J.A., Mattay, V., Chen, J., Kolachana, B.S., Callicott, J.H., Rasetti, R., Alce, G., Iudicello, J.E., Akbar, N., Egan, M.F., Goldberg, T.E., and Weinberger, D.R. (2007). Tolcapone improves cognition and cortical information processing in normal human subjects. Neuropsychopharmacology 32, 1011-1020.
Arnsten, A.F. (1997). Catecholamine regulation of the prefrontal cortex. J. Psychopharmacol.11(2), 151-162.
Beauchamp, M.H., Dagher, A., Aston, J.A., and Doyon, J. (2003). Dynamic functional changes associated with cognitive skill learning of an adapted version of the Tower of London task. Neuroimage 20, 1649-1660.
Beran, J. (1994). Statistics for long-memory processes. New York: Chapman & Hall.
Berg, W.K., Byrd, D.L., McNamara, J.P., and Case, K. (2010). Deconstructing the tower: parameters and predictors of problem difficulty on the Tower of London task. Brain Cogn. 72, 472-482.
Bilder, R.M., Volavka, J., Lachman, H.M., and Grace, A.A. (2004). The catechol-O-methyltransferase polymorphism: relations to the tonic-phasic dopamine hypothesis and neuropsychiatric phenotypes. Neuropsychopharmacology 29, 1943-1961.
Braver, T.S., Reynolds, J.R., and Donaldson, D.I. (2003). Neural mechanisms of transient and sustained cognitive control during task switching. Neuron 39, 713-726.
Bullmore, E., Fadili, J., Maxim, V., Sendur, L., Whitcher, B., Suckling, J., Brammer, M., and Breakspear, M. (2004). Wavelets and functional magnetic resonance imaging of the human brain. Neuroimage 23 Suppl 1, S234-49.
Chawla, D., Rees, G., and Friston, K.J. (1999). The physiological basis of attentional modulation in extrastriate visual areas. Nat. Neurosci. 2, 671-676.
Chikazoe, J., Konishi, S., Asari, T., Jimura, K., and Miyashita, Y. (2007). Activation of right inferior frontal gyrus during response inhibition across response modalities. J. Cogn. Neurosci. 19, 69-80.
Cohen, J.D., Perlstein, W.M., Braver, T.S., Nystrom, L.E., Noll, D.C., Jonides, J., and Smith, E.E. (1997). Temporal dynamics of brain activation during a working memory task. Nature 386, 604-608.
Cole, M.W., Pathak, S., and Schneider, W. (2010). Identifying the brain's most globally connected regions. Neuroimage 49, 3132-3148.

20
Cole, M.W., and Schneider, W. (2007). The cognitive control network: Integrated cortical regions with dissociable functions. Neuroimage 37, 343-360.
Constantinidis, C., and Steinmetz, M.A. (1996). Neuronal activity in posterior parietal area 7a during the delay periods of a spatial memory task. J. Neurophysiol. 76, 1352-1355.
Courtney, S.M., Ungerleider, L.G., Keil, K., and Haxby, J.V. (1997). Transient and sustained activity in a distributed neural system for human working memory. Nature 386, 608-611.
Curtis, C.E., and D'Esposito, M. (2003). Persistent activity in the prefrontal cortex during working memory. Trends Cogn. Sci. 7, 415-423.
DeKosky, S.T., and Marek, K. (2003). Looking backward to move forward: early detection of neurodegenerative disorders. Science 302, 830-834.
Dobbins, I.G., Foley, H., Schacter, D.L., and Wagner, A.D. (2002). Executive control during episodic retrieval: multiple prefrontal processes subserve source memory. Neuron 35, 989-996.
Dosenbach, N.U., Fair, D.A., Cohen, A.L., Schlaggar, B.L., and Petersen, S.E. (2008). A dual-networks architecture of top-down control. Trends Cogn. Sci. 12, 99-105.
Dosenbach, N.U., Fair, D.A., Miezin, F.M., Cohen, A.L., Wenger, K.K., Dosenbach, R.A., Fox, M.D., Snyder, A.Z., Vincent, J.L., Raichle, M.E., Schlaggar, B.L., and Petersen, S.E. (2007). Distinct brain networks for adaptive and stable task control in humans. Proc. Natl. Acad. Sci. U. S. A. 104, 11073-11078.
Dosenbach, N.U., Visscher, K.M., Palmer, E.D., Miezin, F.M., Wenger, K.K., Kang, H.C., Burgund, E.D., Grimes, A.L., Schlaggar, B.L., and Petersen, S.E. (2006). A core system for the implementation of task sets. Neuron 50, 799-812.
Dreisbach, G., Muller, J., Goschke, T., Strobel, A., Schulze, K., Lesch, K.P., and Brocke, B. (2005). Dopamine and cognitive control: the influence of spontaneous eyeblink rate and dopamine gene polymorphisms on perseveration and distractibility. Behav. Neurosci. 119, 483-490.
Duncan, J. (2010). The multiple-demand (MD) system of the primate brain: mental programs for intelligent behaviour. Trends Cogn. Sci. 14, 172-179.
Durstewitz, D., and Seamans, J.K. (2008). The dual-state theory of prefrontal cortex dopamine function with relevance to catechol-o-methyltransferase genotypes and schizophrenia. Biol. Psychiatry 64, 739-749.
Durstewitz, D., Seamans, J.K., and Sejnowski, T.J. (2000a). Dopamine-mediated stabilization of delay-period activity in a network model of prefrontal cortex. J. Neurophysiol. 83, 1733-1750.
Durstewitz, D., Seamans, J.K., and Sejnowski, T.J. (2000b). Neurocomputational models of working memory. Nat. Neurosci. 3 Suppl, 1184-1191.

21
Eke, A., Herman, P., Kocsis, L., and Kozak, L.R. (2002). Fractal characterization of complexity in temporal physiological signals. Physiol. Meas. 23, R1-38.
Estrada, C., Hamel, E., and Krause, D.N. (1983). Biochemical evidence for cholinergic innervation of intracerebral blood vessels. Brain Res. 266, 261-270.
Ettinger, U., Kumari, V., Collier, D.A., Powell, J., Luzi, S., Michel, T.M., Zedomi, O., and Williams, S.C. (2008). Catechol-O-methyltransferase (COMT) val158met genotype is associated with BOLD response as a function of task characteristic. Neuropsychopharmacology 33, 3046-3057.
Expert, P., Lambiotte, R., Chialvo, D.R., Christensen, K., Jensen, H.J., Sharp, D.J., and Turkheimer, F. (2010). Self-similar correlation function in brain resting-state functional magnetic resonance imaging. J. R. Soc. Interface
Farkas, E., and Luiten, P.G. (2001). Cerebral microvascular pathology in aging and Alzheimer's disease. Prog. Neurobiol. 64, 575-611.
Ferrarelli, F., Massimini, M., Peterson, M.J., Riedner, B.A., Lazar, M., Murphy, M.J., Huber, R., Rosanova, M., Alexander, A.L., Kalin, N., and Tononi, G. (2008). Reduced evoked gamma oscillations in the frontal cortex in schizophrenia patients: a TMS/EEG study. Am. J. Psychiatry 165, 996-1005.
First, M.B., and Pincus, H.A. (2002). The DSM-IV Text Revision: rationale and potential impact on clinical practice. Psychiatr. Serv. 53, 288-292.
Fukuyama, H., Ouchi, Y., Matsuzaki, S., Ogawa, M., Yamauchi, H., Nagahama, Y., Kimura, J., Yonekura, Y., Shibasaki, H., and Tsukada, H. (1996). Focal cortical blood flow activation is regulated by intrinsic cortical cholinergic neurons. Neuroimage 3, 195-201.
Funahashi, S., Bruce, C.J., and Goldman-Rakic, P.S. (1989). Mnemonic coding of visual space in the monkey's dorsolateral prefrontal cortex. J. Neurophysiol. 61, 331-349.
Funahashi, S., and Kubota, K. (1994). Working memory and prefrontal cortex. Neurosci. Res. 21, 1-11.
Fuster, J.M. (2001). The prefrontal cortex--an update: time is of the essence. Neuron 30, 319-333.
Gevins, A., and Cutillo, B. (1993). Spatiotemporal dynamics of component processes in human working memory. Electroencephalogr. Clin. Neurophysiol. 87, 128-143.
Goldberger, A.L., Amaral, L.A., Hausdorff, J.M., Ivanov, P.C., Peng, C.K., and Stanley, H.E. (2002). Fractal dynamics in physiology: alterations with disease and aging. Proc. Natl. Acad. Sci. U. S. A. 99 Suppl 1, 2466-2472.
Goldman-Rakic, P.S., Muly, E.C.,3rd, and Williams, G.V. (2000). D(1) receptors in prefrontal cells and circuits. Brain Res. Brain Res. Rev. 31, 295-301.

22
Gonzalez Andino, S.L., Michel, C.M., Thut, G., Landis, T., and Grave de Peralta, R. (2005). Prediction of response speed by anticipatory high-frequency (gamma band) oscillations in the human brain. Hum. Brain Mapp. 24, 50-58.
Gregoriou, G.G., Gotts, S.J., Zhou, H., and Desimone, R. (2009). High-frequency, long-range coupling between prefrontal and visual cortex during attention. Science 324, 1207-1210.
Haenschel, C., Bittner, R.A., Waltz, J., Haertling, F., Wibral, M., Singer, W., Linden, D.E., and Rodriguez, E. (2009). Cortical oscillatory activity is critical for working memory as revealed by deficits in early-onset schizophrenia. J. Neurosci. 29, 9481-9489.
Halgren, E., Boujon, C., Clarke, J., Wang, C., and Chauvel, P. (2002). Rapid distributed fronto-parieto-occipital processing stages during working memory in humans. Cereb. Cortex 12, 710-728.
Harmony, T., Alba, A., Marroquin, J.L., and Gonzalez-Frankenberger, B. (2009). Time-frequency-topographic analysis of induced power and synchrony of EEG signals during a Go/No-Go task. Int. J. Psychophysiol. 71, 9-16.
Honey, G.D., Fu, C.H., Kim, J., Brammer, M.J., Croudace, T.J., Suckling, J., Pich, E.M., Williams, S.C., and Bullmore, E.T. (2002). Effects of verbal working memory load on corticocortical connectivity modeled by path analysis of functional magnetic resonance imaging data. Neuroimage 17, 573-582.
Hopfinger, J.B., Buonocore, M.H., and Mangun, G.R. (2000). The neural mechanisms of top-down attentional control. Nat. Neurosci. 3, 284-291.
Howard, M.W., Rizzuto, D.S., Caplan, J.B., Madsen, J.R., Lisman, J., Aschenbrenner-Scheibe, R., Schulze-Bonhage, A., and Kahana, M.J. (2003). Gamma oscillations correlate with working memory load in humans. Cereb. Cortex 13, 1369-1374.
Jones, C.,L., Lonergan, G.,T., and Mainwaring, D.,E. (1996). Wavelet packet computation of the Hurst exponent. J. Phys. A: Math. Gen. 29, 2509-2527.
Kitzbichler, M.G., Smith, M.L., Christensen, S.R., and Bullmore, E. (2009). Broadband criticality of human brain network synchronization. PLoS Comput. Biol. 5, e1000314.
Lachaux, J.P., Fonlupt, P., Kahane, P., Minotti, L., Hoffmann, D., Bertrand, O., and Baciu, M. (2007). Relationship between task-related gamma oscillations and BOLD signal: new insights from combined fMRI and intracranial EEG. Hum. Brain Mapp. 28, 1368-1375.
Lazeron, R.H., Rombouts, S.A., Machielsen, W.C., Scheltens, P., Witter, M.P., Uylings, H.B., and Barkhof, F. (2000). Visualizing brain activation during planning: the tower of London test adapted for functional MR imaging. AJNR Am. J. Neuroradiol. 21, 1407-1414.
Lebedev, M.A., Messinger, A., Kralik, J.D., and Wise, S.P. (2004). Representation of attended versus remembered locations in prefrontal cortex. PLoS Biol. 2, e365.
23
Leung, H.C., and Cai, W. (2007). Common and differential ventrolateral prefrontal activity during inhibition of hand and eye movements. J. Neurosci. 27, 9893-9900.
Lipsitz, L.A., and Goldberger, A.L. (1992). Loss of 'complexity' and aging. Potential applications of fractals and chaos theory to senescence. JAMA 267, 1806-1809.
Mattay, V.S., Fera, F., Tessitore, A., Hariri, A.R., Berman, K.F., Das, S., Meyer-Lindenberg, A., Goldberg, T.E., Callicott, J.H., and Weinberger, D.R. (2006). Neurophysiological correlates of age-related changes in working memory capacity. Neurosci. Lett. 392, 32-37.
Maxim, V., Sendur, L., Fadili, J., Suckling, J., Gould, R., Howard, R., and Bullmore, E. (2005). Fractional Gaussian noise, functional MRI and Alzheimer's disease. Neuroimage 25, 141-158.
McKinlay, A., Kaller, C.P., Grace, R.C., Dalrymple-Alford, J.C., Anderson, T.J., Fink, J., and Roger, D. (2008). Planning in Parkinson's disease: a matter of problem structure? Neuropsychologia 46, 384-389.
Mehta, M.A., Gumaste, D., Montgomery, A.J., McTavish, S.F., and Grasby, P.M. (2005). The effects of acute tyrosine and phenylalanine depletion on spatial working memory and planning in healthy volunteers are predicted by changes in striatal dopamine levels. Psychopharmacology (Berl) 180, 654-663.
Mehta, M.A., Manes, F.F., Magnolfi, G., Sahakian, B.J., and Robbins, T.W. (2004). Impaired set-shifting and dissociable effects on tests of spatial working memory following the dopamine D2 receptor antagonist sulpiride in human volunteers. Psychopharmacology (Berl) 176, 331-342.
Menon, V., Adleman, N.E., White, C.D., Glover, G.H., and Reiss, A.L. (2001). Error-related brain activation during a Go/NoGo response inhibition task. Hum. Brain Mapp. 12, 131-143.
Michels, L., Bucher, K., Luchinger, R., Klaver, P., Martin, E., Jeanmonod, D., and Brandeis, D. (2010). Simultaneous EEG-fMRI during a working memory task: modulations in low and high frequency bands. PLoS One 5, e10298.
Mier, D., Kirsch, P., and Meyer-Lindenberg, A. (2009). Neural substrates of pleiotropic action of genetic variation in COMT: a meta-analysis. Mol. Psychiatry
Miller, E.K., Li, L., and Desimone, R. (1993). Activity of neurons in anterior inferior temporal cortex during a short-term memory task. J. Neurosci. 13, 1460-1478.
Muller, J., Dreisbach, G., Goschke, T., Hensch, T., Lesch, K.P., and Brocke, B. (2007). Dopamine and cognitive control: the prospect of monetary gains influences the balance between flexibility and stability in a set-shifting paradigm. Eur. J. Neurosci. 26, 3661-3668.

24
Newman, S.D., Carpenter, P.A., Varma, S., and Just, M.A. (2003). Frontal and parietal participation in problem solving in the Tower of London: fMRI and computational modeling of planning and high-level perception. Neuropsychologia 41, 1668-1682.
Newman, S.D., Greco, J.A., and Lee, D. (2009). An fMRI study of the Tower of London: a look at problem structure differences. Brain Res. 1286, 123-132.
Niessing, J., Ebisch, B., Schmidt, K.E., Niessing, M., Singer, W., and Galuske, R.A. (2005). Hemodynamic signals correlate tightly with synchronized gamma oscillations. Science 309, 948-951.
Nolan, K.A., Bilder, R.M., Lachman, H.M., and Volavka, J. (2004). Catechol O-methyltransferase Val158Met polymorphism in schizophrenia: differential effects of Val and Met alleles on cognitive stability and flexibility. Am. J. Psychiatry 161, 359-361.
Ongur, D., and Price, J.L. (2000). The organization of networks within the orbital and medial prefrontal cortex of rats, monkeys and humans. Cereb. Cortex 10, 206-219.
Owen, A.M. (1997). The functional organization of working memory processes within human lateral frontal cortex: the contribution of functional neuroimaging. Eur. J. Neurosci. 9, 1329-1339.
Owen, A.M., Doyon, J., Petrides, M., and Evans, A.C. (1996). Planning and spatial working memory: a positron emission tomography study in humans. Eur. J. Neurosci. 8, 353-364.
Owen, A.M., McMillan, K.M., Laird, A.R., and Bullmore, E. (2005). N-back working memory paradigm: a meta-analysis of normative functional neuroimaging studies. Hum. Brain Mapp. 25, 46-59.
Perianez, J.A., Maestu, F., Barcelo, F., Fernandez, A., Amo, C., and Ortiz Alonso, T. (2004). Spatiotemporal brain dynamics during preparatory set shifting: MEG evidence. Neuroimage 21, 687-695.
Petrides, M. (2000). Dissociable roles of mid-dorsolateral prefrontal and anterior inferotemporal cortex in visual working memory. J. Neurosci. 20, 7496-7503.
Postle, B.R. (2006). Working memory as an emergent property of the mind and brain. Neuroscience 139, 23-38.
Postle, B.R., and D'Esposito, M. (1999). "What"-Then-Where" in visual working memory: an event-related fMRI study. J. Cogn. Neurosci. 11, 585-597.
Quintana, J., and Fuster, J.M. (1999). From perception to action: temporal integrative functions of prefrontal and parietal neurons. Cereb. Cortex 9, 213-221.
Reeves, S.J., Grasby, P.M., Howard, R.J., Bantick, R.A., Asselin, M.C., and Mehta, M.A. (2005). A positron emission tomography (PET) investigation of the role of striatal dopamine (D2) receptor availability in spatial cognition. Neuroimage 28, 216-226.

25
Rowe, J.B., Owen, A.M., Johnsrude, I.S., and Passingham, R.E. (2001). Imaging the mental components of a planning task. Neuropsychologia 39, 315-327.
Rowe, J.B., Toni, I., Josephs, O., Frackowiak, R.S., and Passingham, R.E. (2000). The prefrontal cortex: response selection or maintenance within working memory? Science 288, 1656-1660.
Sakai, K., and Passingham, R.E. (2006). Prefrontal set activity predicts rule-specific neural processing during subsequent cognitive performance. J. Neurosci. 26, 1211-1218.
Sakai, K., and Passingham, R.E. (2003). Prefrontal interactions reflect future task operations. Nat. Neurosci. 6, 75-81.
Salkovic-Petrisic, M., Osmanovic, J., Grunblatt, E., Riederer, P., and Hoyer, S. (2009). Modeling sporadic Alzheimer's disease: the insulin resistant brain state generates multiple long-term morphobiological abnormalities including hyperphosphorylated tau protein and amyloid-beta. J. Alzheimers Dis. 18, 729-750.
Schall, U., Johnston, P., Lagopoulos, J., Juptner, M., Jentzen, W., Thienel, R., Dittmann-Balcar, A., Bender, S., and Ward, P.B. (2003). Functional brain maps of Tower of London performance: a positron emission tomography and functional magnetic resonanceimaging study. Neuroimage 20, 1154-1161.
Sederberg, P.B., Kahana, M.J., Howard, M.W., Donner, E.J., and Madsen, J.R. (2003). Theta and gamma oscillations during encoding predict subsequent recall. J. Neurosci. 23, 10809-10814.
Seeley, W.W., Menon, V., Schatzberg, A.F., Keller, J., Glover, G.H., Kenna, H., Reiss, A.L., and Greicius, M.D. (2007). Dissociable intrinsic connectivity networks for salience processing and executive control. J. Neurosci. 27, 2349-2356.
Selemon, L.D., and Goldman-Rakic, P.S. (1988). Common cortical and subcortical targets of the dorsolateral prefrontal and posterior parietal cortices in the rhesus monkey: evidence for a distributed neural network subserving spatially guided behavior. J. Neurosci. 8, 4049-4068.
Shallice, T. (1982). Specific impairments of planning. Philos. Trans. R. Soc. Lond. B. Biol. Sci. 298, 199-209.
Simmonds, D.J., Pekar, J.J., and Mostofsky, S.H. (2008). Meta-analysis of Go/No-go tasks demonstrating that fMRI activation associated with response inhibition is task-dependent. Neuropsychologia 46, 224-232.
Smith, S.M., Jenkinson, M., Woolrich, M.W., Beckmann, C.F., Behrens, T.E., Johansen-Berg, H., Bannister, P.R., De Luca, M., Drobnjak, I., Flitney, D.E., et al. (2004). Advances in functional and structural MR image analysis and implementation as FSL. Neuroimage 23 Suppl 1, S208-19.

26
Stefanis, N.C., van Os, J., Avramopoulos, D., Smyrnis, N., Evdokimidis, I., and Stefanis, C.N. (2005). Effect of COMT Val158Met polymorphism on the Continuous Performance Test, Identical Pairs Version: tuning rather than improving performance. Am. J. Psychiatry 162, 1752-1754.
Stevens, M.C., Kiehl, K.A., Pearlson, G.D., and Calhoun, V.D. (2009). Brain network dynamics during error commission. Hum. Brain Mapp. 30, 24-37.
Stevens, M.C., Kiehl, K.A., Pearlson, G.D., and Calhoun, V.D. (2007). Functional neural networks underlying response inhibition in adolescents and adults. Behav. Brain Res. 181, 12-22.
Stevens, M.C. (2009). The developmental cognitive neuroscience of functional connectivity. Brain Cogn. 70, 1-12.
Suckling, J., Wink, A.M., Bernard, F.A., Barnes, A., and Bullmore, E. (2008). Endogenous multifractal brain dynamics are modulated by age, cholinergic blockade and cognitive performance. J. Neurosci. Methods 174, 292-300.
Swick, D., Ashley, V., and Turken, A.U. (2008). Left inferior frontal gyrus is critical for response inhibition. BMC Neurosci. 9, 102.
Thatcher, R.W., North, D., and Biver, C. (2005). EEG and intelligence: relations between EEG coherence, EEG phase delay and power. Clin. Neurophysiol. 116, 2129-2141.
Thatcher, R.W., North, D.M., and Biver, C.J. (2008). Intelligence and EEG phase reset: a two compartmental model of phase shift and lock. Neuroimage 42, 1639-1653.
Thurner, S., Windischberger, C., Moser, E., Walla, P., and Barth, M. (2003). Scaling laws and persistence in human brain activity. Physica A: Statistical Mechanics and its Applications 326, 511-521.
Turkheimer, F.E., Smith, C.B., and Schmidt, K. (2001). Estimation of the number of "true" null hypotheses in multivariate analysis of neuroimaging data. Neuroimage 13, 920-930.
Unterrainer, J.M., Kaller, C.P., Halsband, U., and Rahm, B. (2006). Planning abilities and chess: a comparison of chess and non-chess players on the Tower of London task. Br. J. Psychol. 97, 299-311.
Verdejo-Garcia, A., Bechara, A., Recknor, E.C., and Perez-Garcia, M. (2006). Executive dysfunction in substance dependent individuals during drug use and abstinence: An examination of the behavioral, cognitive and emotional correlates of addiction. J. Int.Neuropsychol. Soc.12(3), 405-415.
Werner G (2010) Fractals in the nervous system: conceptual implications for theoretical neuroscience. Front. Physio. 1:15. doi: 10.3389/fphys.2010.00015
Williams, G.V. and Castner, S.A. (2006). Under the curve: Critical issues for elucidating D1 receptor function in working memory. Neuroscience 139(1), 263-276.
27
Wink, A.M., Bernard, F., Salvador, R., Bullmore, E., and Suckling, J. (2006). Age and cholinergic effects on hemodynamics and functional coherence of human hippocampus. Neurobiol. Aging 27, 1395-1404.
Wink, A.M., Bullmore, E., Barnes, A., Bernard, F., and Suckling, J. (2008). Monofractal and multifractal dynamics of low frequency endogenous brain oscillations in functional MRI. Hum. Brain Mapp. 29, 791-801.
Winterer, G., Carver, F.W., Musso, F., Mattay, V., Weinberger, D.R., and Coppola, R. (2007). Complex relationship between BOLD signal and synchronization/desynchronization of human brain MEG oscillations. Hum. Brain Mapp. 28, 805-816.

28
Figures
Figure 1: Regions-of-interest for analysis.Regions were selected to represent the lateral PFC (A: Red, middle frontal gyrus; Green, inferior frontal gyrus pars opercularis; Blue, inferior frontal gyrus pars triangularis) and cortical regions identified as part of an ‘executive’ network (B: Red, anterior cingulate cortex; Green, posterior cingulate cortex; Blue, insula; Yellow, precuneus; Light Blue, cuneus; Pink, superior parietal cortex; Not shown: parahippocampal gyrus, medial frontal cortex). PFC and associated cortical regions-of-interest are shown on the surface of the MNI152 brain.
Figure 2: Group BOLD activation during each task of executive function. Group average BOLD activations during the difficult condition (Difficult > Rest) of the Tower of London task, the 2-back (2-back > Rest) condition of both n-back sets and the No-Go (No-Go > Rest) condition of the Go / No-Go task are shown in MNI152 standard space in radiological convention (whole-brain cluster corrected, Z=2.3, p<0.05).
Figure 3: Demonstrative plots of Hurst calculation.The figure illustrates the process for the calculation of the Hurst exponent (H) for an exemplar of time-series (A). The power spectrum of the series is calculated to assess its class. The rate of decay of energy β is within the [1-3] range and therefore the signal is well within the fractional Brownian class (fBn) The time-series is filtered with the wavelet transform with 6 levels, highest frequency at level 1, lowest frequency level 6 (C). The semilog-plot of the 6 wavelet energies is fitted to obtain the Hurst exponent from the slope of the line (D).
Figure 4: Correlations between H and n-back response time in the left middle frontal gyrus.During the first (left column) and second (right column) n-back sets, correlations between H in the left middle frontal gyrus and response time during the 0-back (A) and 1-back (B) and 2-back (C) task condition blocks were similar, despite only reaching significance in the first set. The estimate of H in Subject 27 during the first n-back task was identified as a possible outlier (H = 0.82, Z = 3.6). After removing this data point, the observed correlations remained (0-back: r = -0.35; 1-back: r = -0.40; 2-back: r = -0.28).
Figure 5: H estimated from individual BOLD time-series in the middle frontal gyrus during the Go / No-Go task is associated with increasing number of commission errors during No-Go trials.

29
Tables
Table 1: Centre of gravity (COG) in MNI coordinates of cortical regions-of-
interest
Table 2: Main effects of H on response time during the first n-back set
Table 3: Post-hoc analysis of significant correlations between H in the lateral PFC
and n-back response time
Table 4: Main effects of H on response time during the second n-back set
Table 5: Post-hoc analysis of significant correlations between BOLD signal
change in the lateral PFC and n-back response time
Table 6: Correlation between number of commission errors and H in the PFC
during the Go / No-Go task
Table 7: Correlations between H during each task in the left middle frontal gyri
Table 8: Correlations between H during each task in the right middle frontal gyri

30
Table 1: Centre of gravity (COG) in MNI coordinates of cortical regions-of-interest
COGLateral prefronal cortex x y zMiddle frontal gyrus Left -38.0 19.0 41.4
Right 38.8 19.2 42.1Inferior frontal gyrus pars opercularis Left -50.1 14.4 16.5
Right 51.3 15.5 16.5Inferior frontal gyrus pars triangularis Left -48.1 28.4 9.0
Right 50.0 28.3 8.2
Other regionsInsula Left -36.7 1.7 -0.1
Right 37.7 3.2 -0.6Parahippocampal gyrus Left -23.1 -8.9 -30.2
Right 23.3 -7.7 -30.5Superior parietal cortex Left -29.2 -48.9 57.5
Right 29.2 -47.6 58.8Anterior cingulate cortex 0.7 19.3 24.4Posterior cingulate cortex 0.8 -37.1 30.1Cuneus 1.5 -78.2 27.4Precuneus 0.9 -58.7 38.1Medial frontal cortex 0.1 43.7 -17.0

31
Table 2: Main effects of H on response time during the first n-back set
Region F (1,44) p
Left pars opercularis 5.86 0.020 **Left pars triangularis 5.38 0.025 *Left middle frontal gyrus 6.57 0.014 **
Right pars opercularis 1.34 0.253Right pars triangularis 4.61 0.037 *Right middle frontal gyrus 6.12 0.017 **
* p<0.05, ** denotes significance passing correction for multiple testing at p < 0.05

32
Table 3: Post-hoc analysis of significant correlations between H in the lateral PFC and n-back response time
Region 0-back 1-back 2-backt p t p t p
Left pars opercularis -2.32 0.025 * -2.93 0.005 ** -1.53 0.134Left middle frontal gyrus -2.15 0.037 * -2.72 0.009 ** -2.1 0.042 *
Right middle frontal gyrus -2.06 0.045 * -2.93 0.005 ** -1.79 0.080
* p<0.05, ** denotes significance passing correction for multiple testing at p < 0.05

33
Table 4: Main effects of H on response time during the second n-back set
Region F (1,44) p
Left pars opercularis 3.40 0.072Left pars triangularis 3.58 0.065Left middle frontal gyrus 4.06 0.050*
Right pars opercularis 0.01 0.932Right pars triangularis 0.47 0.499Right middle frontal gyrus 0.54 0.047
* p<0.05, ** denotes significance passing correction for multiple testing at p < 0.05
34
Table 5: Post-hoc analysis of significant correlations between BOLD signal change in the lateral PFC and n-back response timeRegion 0-back 1-back 2-back
r p r p r pLeft pars opercularis 0.31 0.038 * 0.46 0.001 * 0.20 0.187Left middle frontal gyrus 0.37 0.012 * 0.47 0.001 * 0.14 0.371
Right middle frontal gyrus 0.31 0.034 * 0.47 0.001 * 0.11 0.452
* p<0.05, ** denotes significance passing correction for multiple testing at p < 0.05

35
Table 6: Correlation between number of commission errors and H in the PFC during the Go / No-Go task
Correlation with Commission ErrorsRegion rho† p
Left pars opercularis 0.32 0.036 *Left pars triangularis 0.35 0.022 **Left middle frontal gyrus 0.35 0.021 **
Right pars opercularis 0.49 0.001 **Right pars triangularis 0.20 0.210Right middle frontal gyrus 0.44 0.003 **
† indicates that Spearmans' rank correlation was used due to non-normally distributed behavioural data* p<0.05, ** denotes significance passing correction for multiple testing at p <0.05

36
Table 7: Correlations between H during each task in the left middle frontal gyri
* indicates p < 0.05, ** indicates p < 0.01.
Left Middle Frontal Gyrus
Go / No-Go
Tower of London
N-back (2)
N-back (1) 0.038 0.415** 0.442**
N-back (2) 0.572** 0.383*
Tower of London
0.336*

37
Table 8: Correlations between H during each task in the right middle frontal gyri
Right Middle Frontal Gyrus
Go / No-Go
Tower of London
N-back (2)
N-back (1) 0.224 0.578** 0.279
N-back (2) 0.422** 0.408**
Tower of London
0.271
* indicates p < 0.05, ** indicates p < 0.01.

Figure 1.TIF

Figure 2.TIF

Figure 3.TIF
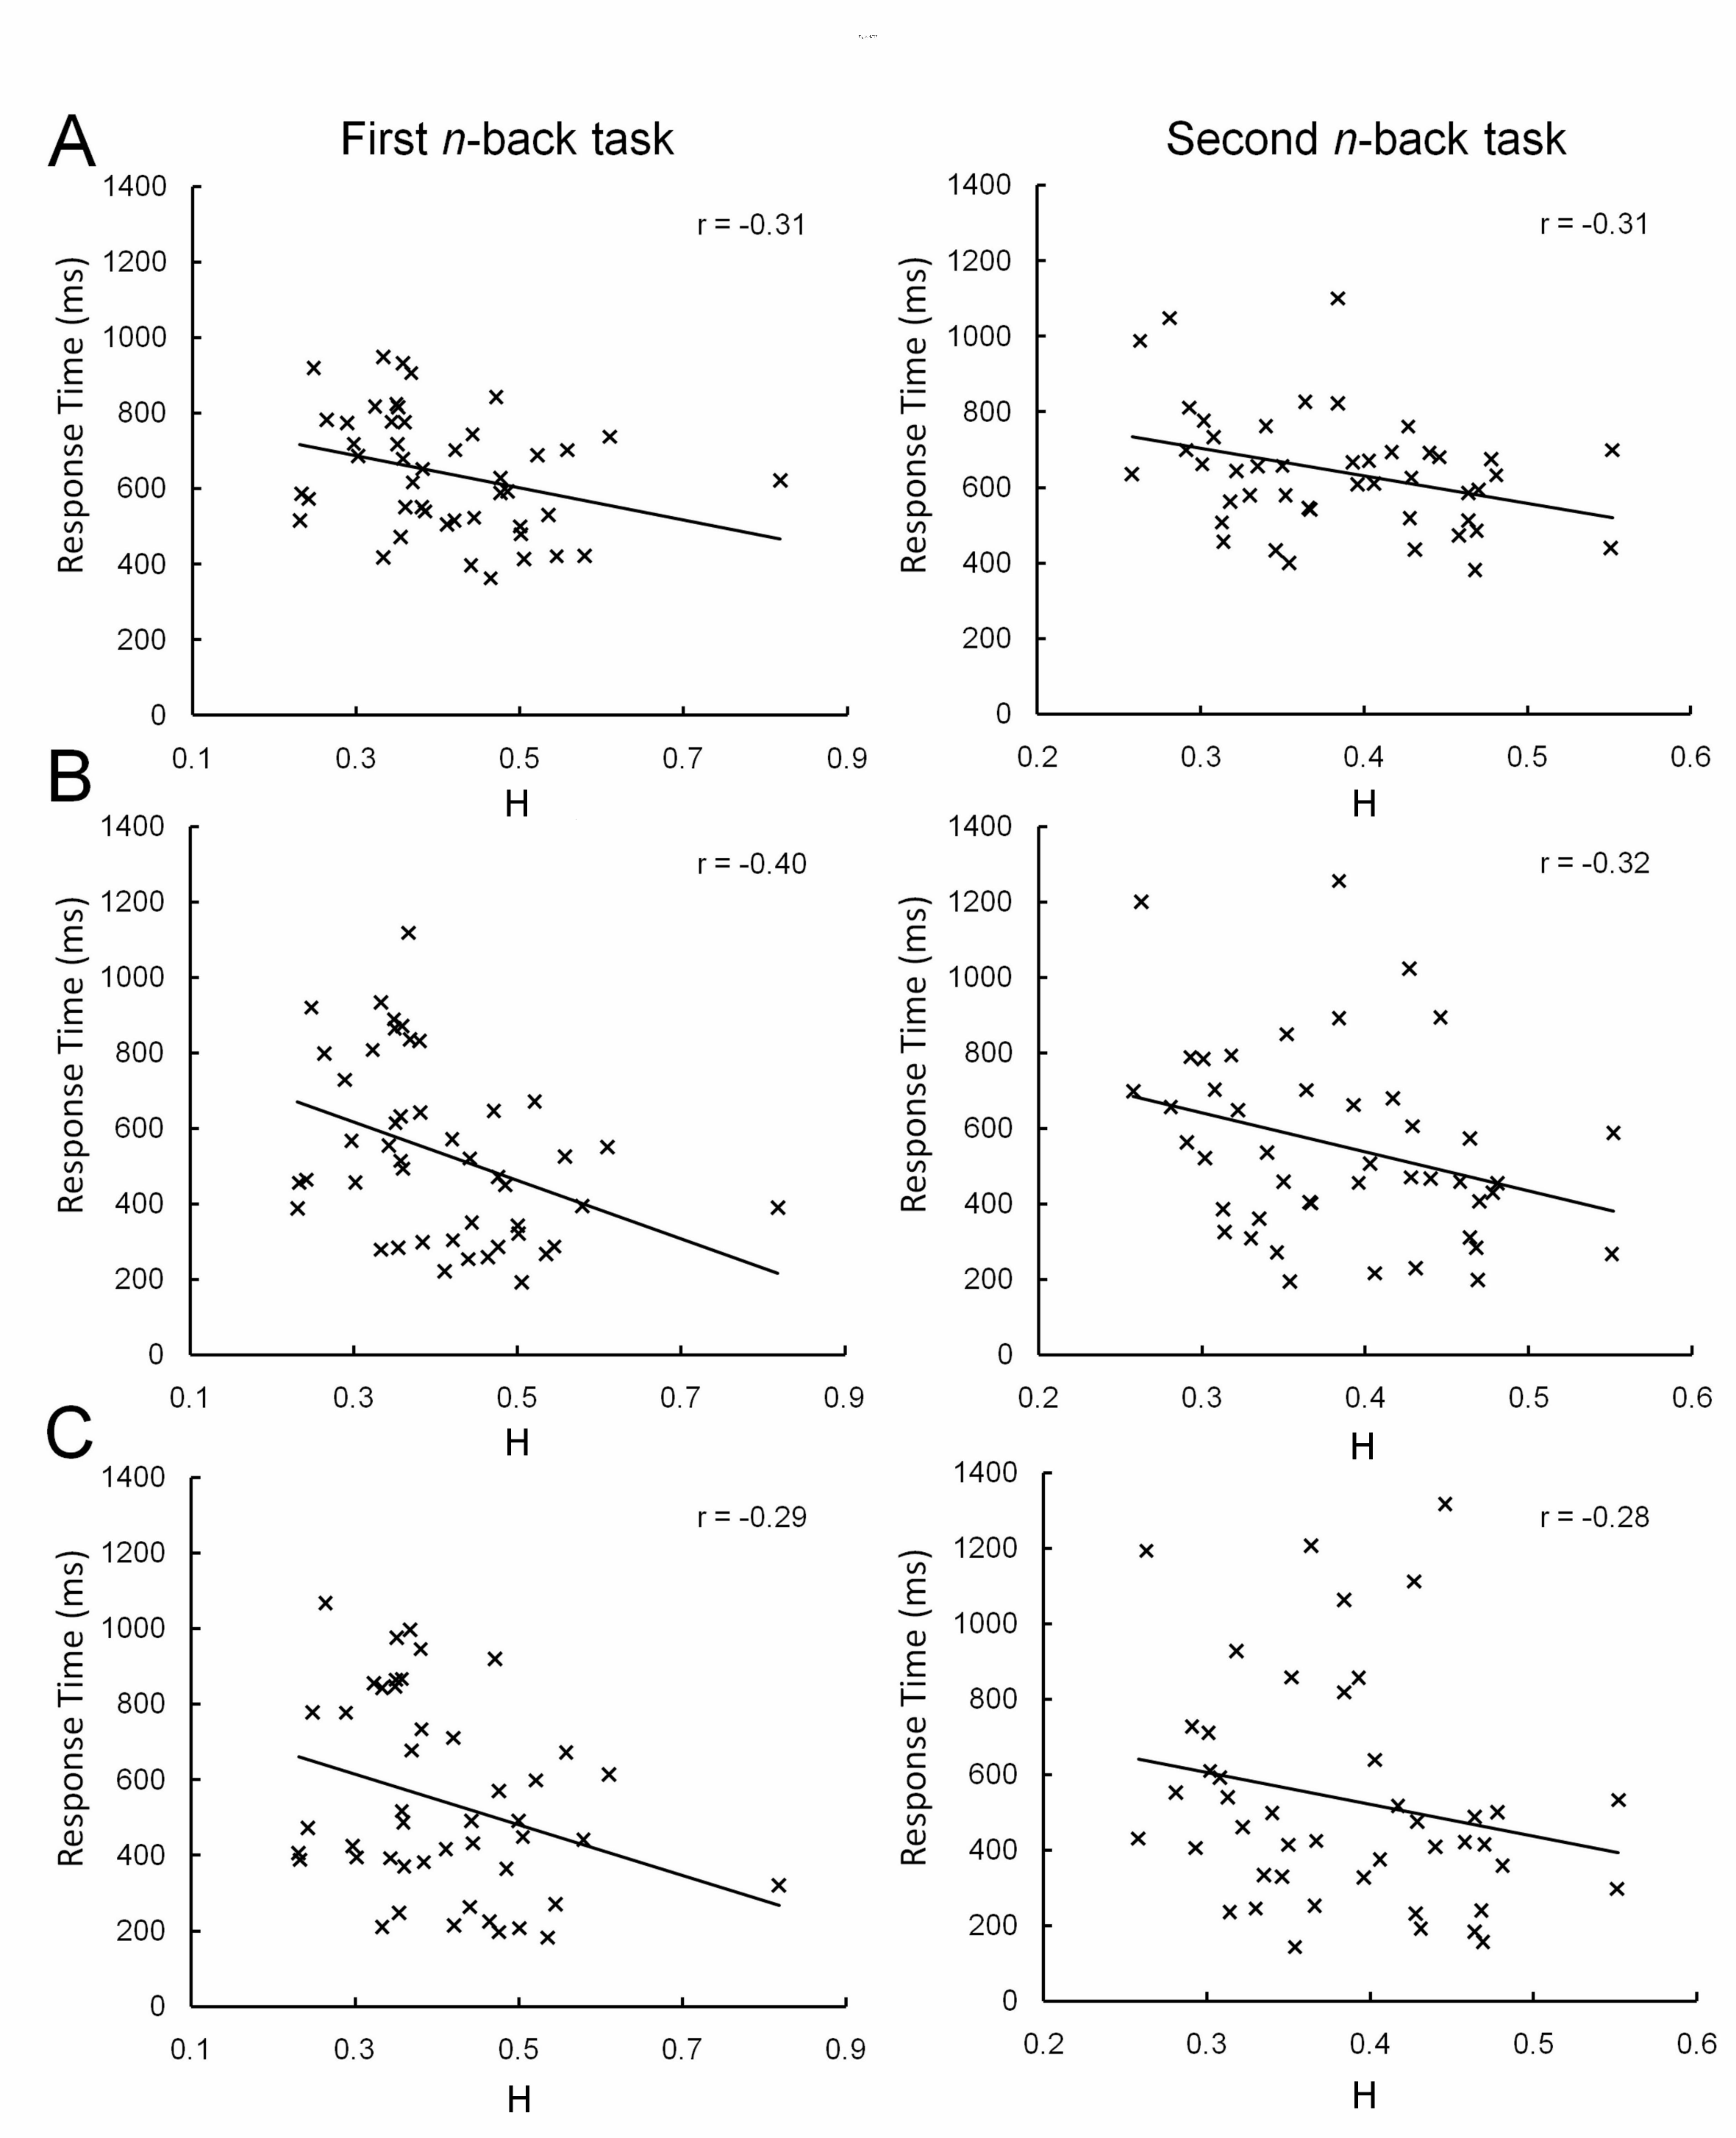
Figure 4.TIF
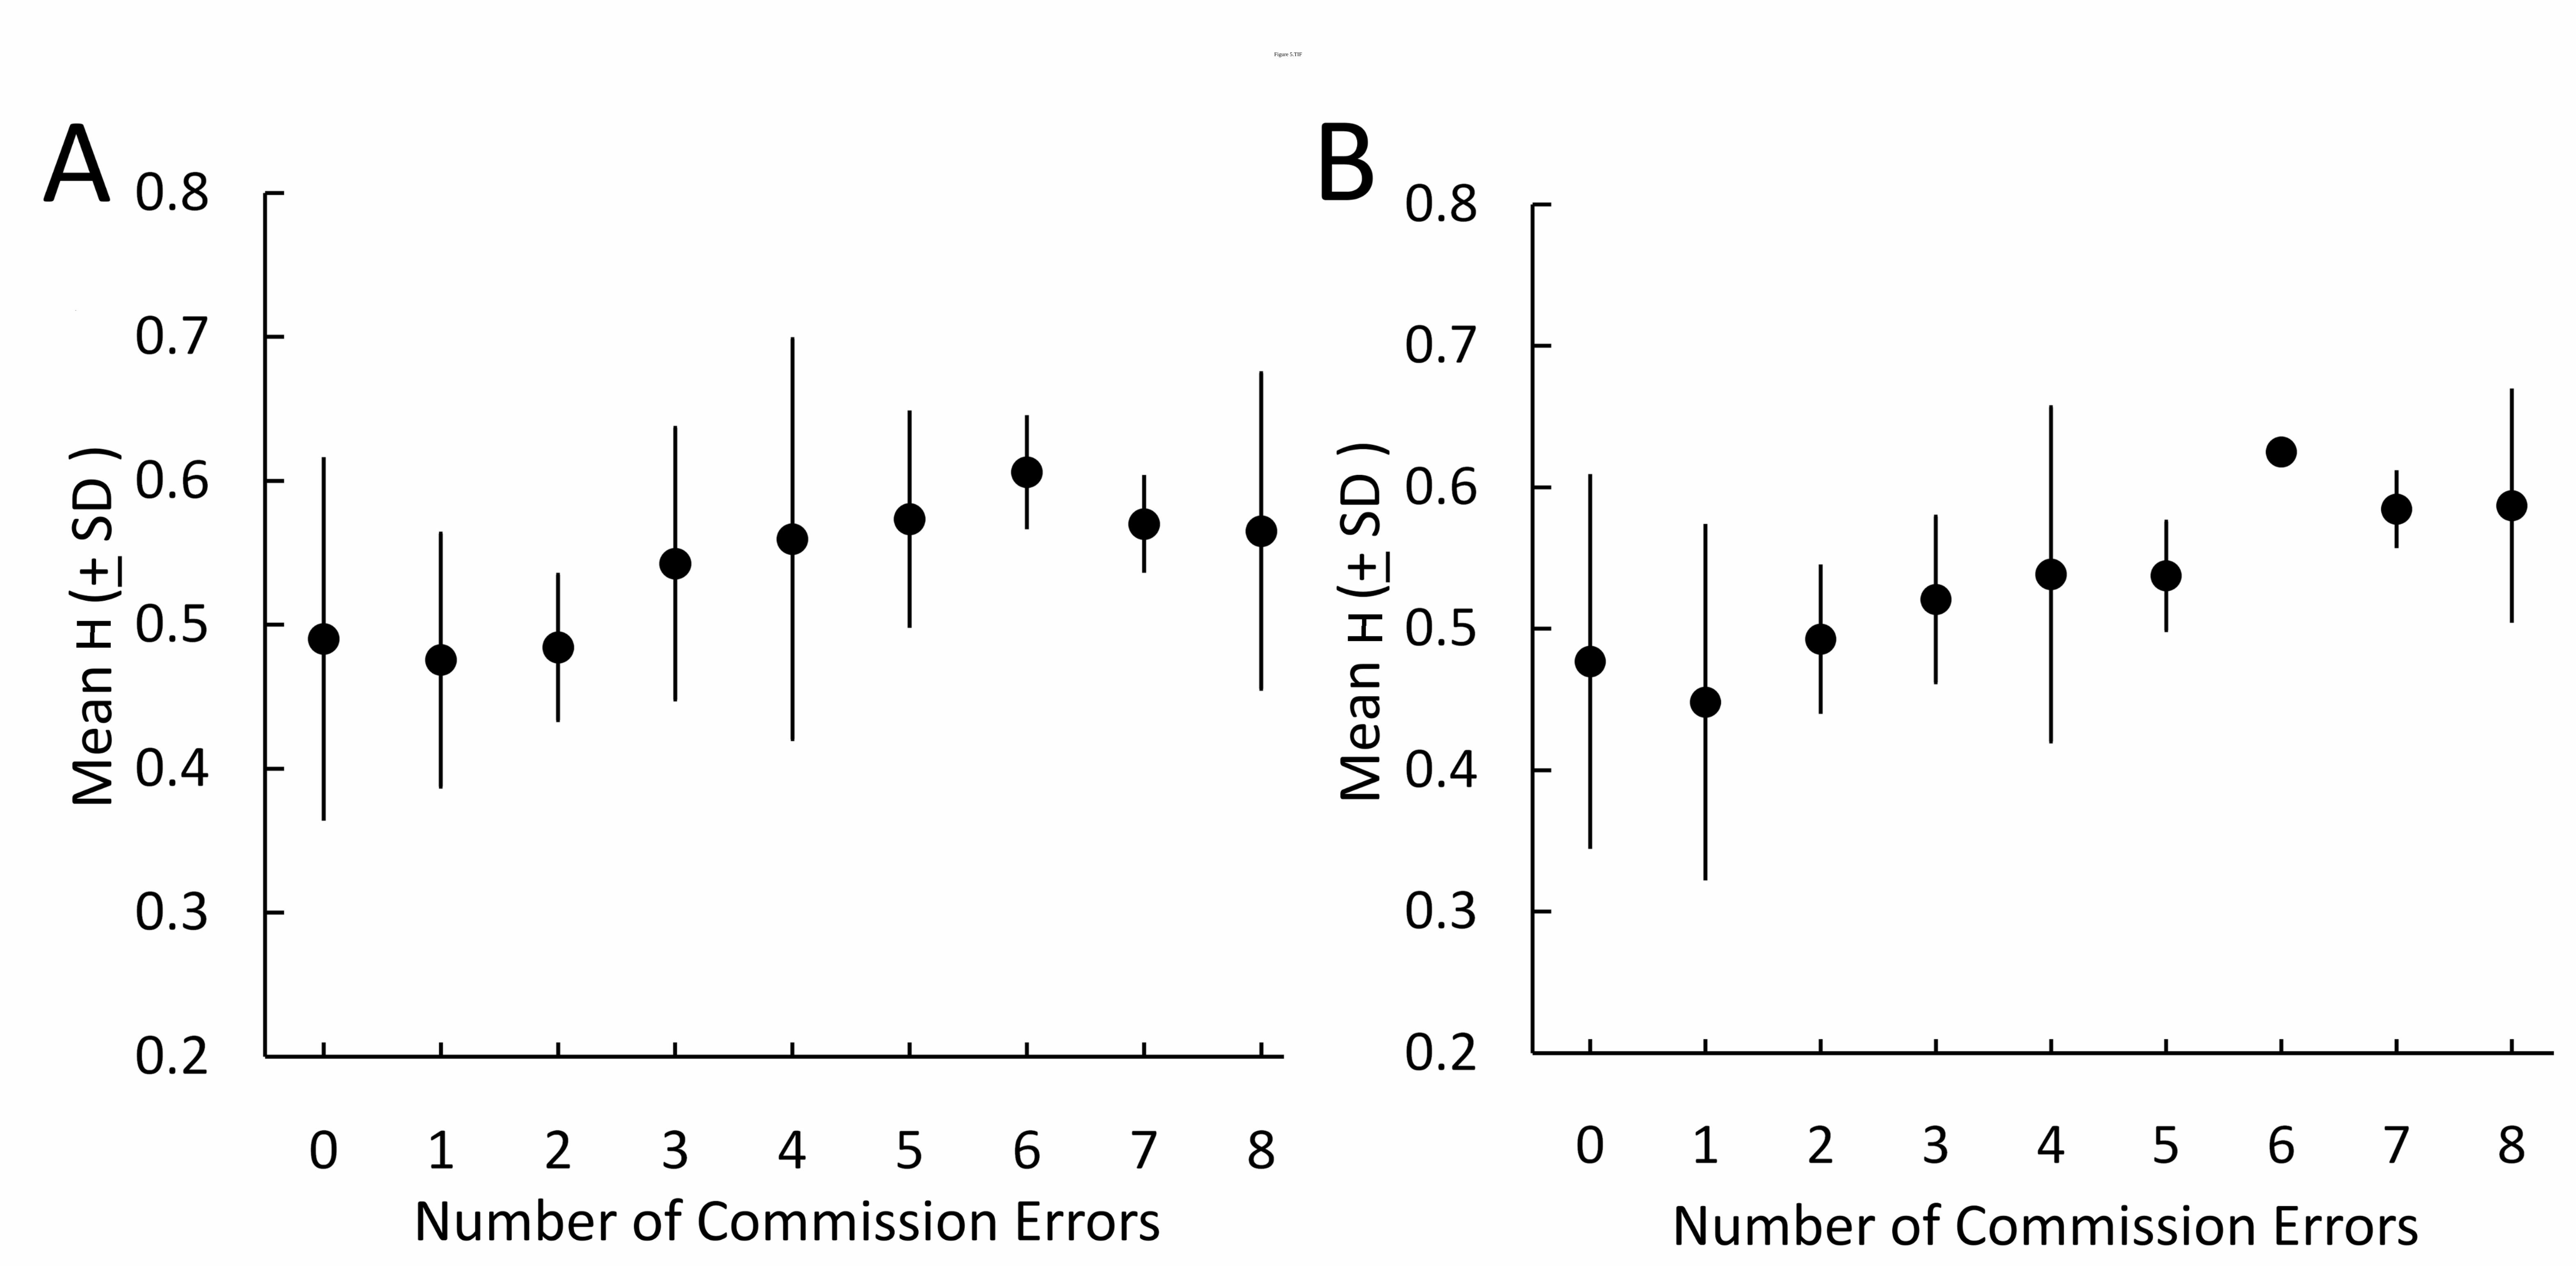
Figure 5.TIF