in the united states district court for …redistricting.lls.edu/files/ga naacp 20171222...
TRANSCRIPT

IN THE UNITED STATES DISTRICT COURT
FOR THE NORTHERN DISTRICT OF GEORGIA
ATLANTA DIVISION
AUSTIN THOMPSON, et al., Plaintiffs, v. Civil Case No. 1:17-cv-01427 BRIAN KEMP, et al.,
Defendants.
DECLARATION OF WILLIAM S. COOPER
WILLIAM S. COOPER, acting in accordance with 28 U.S.C. § 1746,
Federal Rules of Civil Procedure 26(a)(2)(B) and 26(e), and Federal Rules of
Evidence 702 and 703, does hereby declare and say:
I. INTROUDUCTION
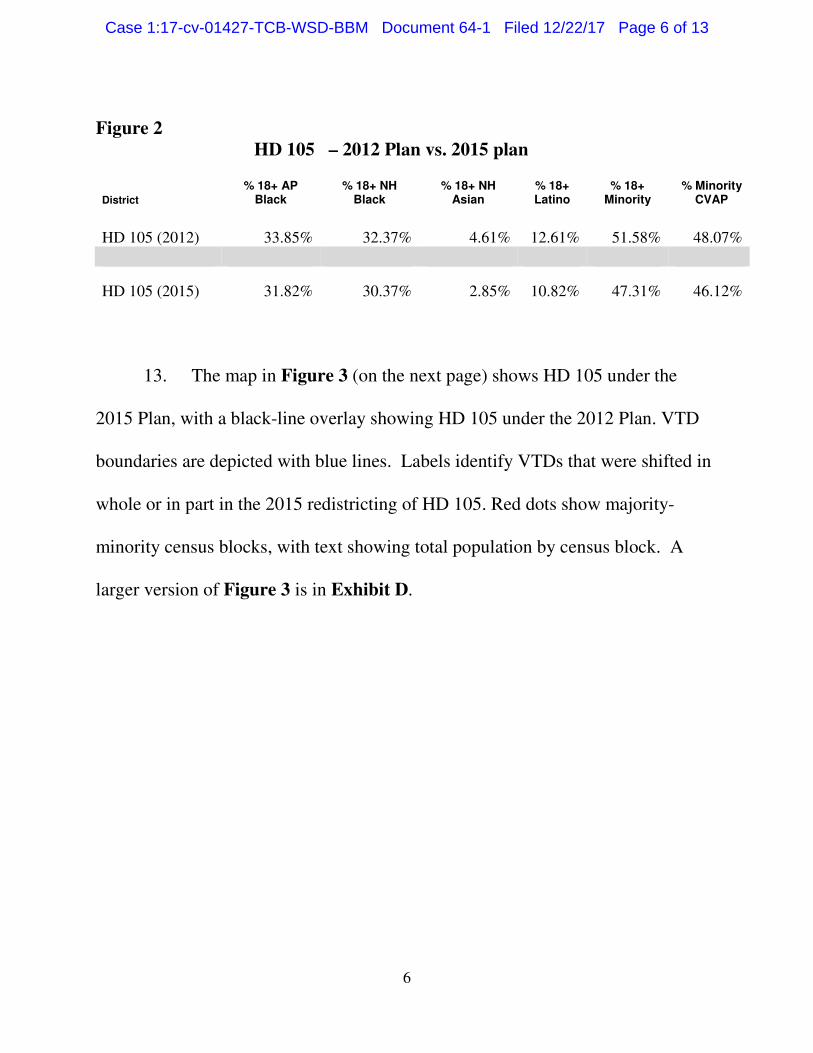
1. My name is William S. Cooper. I have a B.A. in Economics from
Davidson College. As a private consultant, I currently serve as a demographic and
redistricting expert for the Plaintiffs. I am compensated at a rate of $150 per hour.
(a) Redistricting Experience
2. I have testified at trial as an expert witness on redistricting and
demographics in federal courts in about 36 voting rights cases since the late 1980s.
Four of these lawsuits resulted in changes to statewide legislative boundaries: Rural
Case 1:17-cv-01427-TCB-WSD-BBM Document 64-1 Filed 12/22/17 Page 1 of 13

2
West Tennessee African-American Affairs v. McWherter, Old Person v. Cooney,
Bone Shirt v. Hazeltine, and Alabama Legislative Black Caucus v Alabama.
Approximately 25 of the cases led to changes in local election district plans.
3. During the 2010 redistricting cycle, four plans that I developed for
local government clients were adopted – Bolivar County, Mississippi; Claiborne
County, Mississippi; the City of Grenada, Mississippi; and Sussex County,
Virginia. In addition, I served as a redistricting consultant in 2011 to the Miami-
Dade County Commission and Board of Education.
4. Since 2011, based in part on my testimony, four federal courts have
granted summary judgment on the first prerequisite (Gingles 1) of a Section 2 claim
pursuant to Thornburg v. Gingles, 478 U.S. 30 (1986): Montes v. City of Yakima,
Washington (E.D. Wash. Aug. 22, 2014); Pope v. Albany County, New York
(N.D.N.Y. Jan. 28, 2014; N.D.N.Y. Mar. 24, 2015); NAACP v. Ferguson-Florissant
School District, Missouri (E. D. Mo. August 22, 2016); and Terrebonne Parish
Branch NAACP et al. v. Jindal et al. (M.D. La. July 27, 2017). In addition, based in
part on my testimony, a Utah federal court ruled that election plans for the San Juan
County School Board and the San Juan County Commission are unconstitutional –
Navajo Nation v. San Juan County, Utah (C.D. Utah. February 19, 2016), (C.D.
Utah. July 14, 2017), (C.D. Utah. December 21, 2017).
Case 1:17-cv-01427-TCB-WSD-BBM Document 64-1 Filed 12/22/17 Page 2 of 13

3
5. In 2016, two redistricting plans that I developed on behalf of the
plaintiffs for consent decrees in Section 2 lawsuits in Georgia were adopted –
NAACP v. Fayette County, Georgia and NAACP v. Emanuel County, Georgia.
6. For additional historical information on my testimony as an expert
witness and experience preparing and assessing proposed redistricting maps for
Section 2 litigation and other efforts to promote compliance with the Voting Rights
Act, see a summary of my redistricting work attached as Exhibit A.
(b) Purpose of Declaration
7. The attorneys for the Plaintiffs in this case asked me to examine the
demographic impact of modifications to State House District (“HD”) 105 in
Gwinnett County and HD 111 in Henry County under the current Georgia House
Plan as redrawn in 2015 (“2015 Plan”), compared to the 2012 Georgia House Plan
(“2012 Plan”).
8. Exhibit B describes the sources and methodology I have employed in
the preparation of this declaration.
II. 2015 REDISTRICTING
(a) Population – Gwinnett County and Henry County
9. Gwinnett County (see Exhibit C-1) and Henry County (see Exhibit
C-2) have experienced dramatic population growth since 1990, with sharp increases
in the percentage of the minority population in both counties. According to the 2010
Case 1:17-cv-01427-TCB-WSD-BBM Document 64-1 Filed 12/22/17 Page 3 of 13

4
Census, Gwinnett County (pop. 805,321) is 25.03% Any Part Black (“AP Black”),
22.86% Non-Hispanic Black (“NH Black”), and 20.12% Latino, with an overall
minority population of 56.0%. Henry County (pop. 203,922) is 38.4% AP Black,
36.32% NH Black, and 5.79% Latino, with an overall minority population of
47.49%.1
10. Census Bureau population estimates as of July 2016 show significant
increases in the minority population since 2010 in both counties. According to the
2016 estimates, Gwinnett County is 29.87% AP Black, 26.53% NH Black, and
20.84% Latino, with an overall minority population of 61.47%. Henry County is
45.22% % AP Black, 42.38% NH Black, and 6.58% Latino, with an overall
minority population of 54.57%.
(b) 2015 House Districts – Gwinnett County
11. As shown in Figure 1 (on the next page), under the 2015 Plan, 18
House districts (identified by labels) are contained in whole or in part in Gwinnett
County.
1 In this declaration “Latino” and “Hispanic” are synonymous, as are “White” and “NH White”. “Minority” is defined as all persons who are not NH White. “NH Black” means non-Hispanic single-race Black. “NH Asian” means non-Hispanic single-race Asian. “AP Black” means all persons who self-identify as single-race Black or dual race and some part Black, including Black Hispanics.
Case 1:17-cv-01427-TCB-WSD-BBM Document 64-1 Filed 12/22/17 Page 4 of 13

5
Figure 1
2015 Plan – Gwinnett County and Vicinity
12. The table in Figure 2 (on the next page) shows summary population
statistics for HD 105 under the 2012 Plan and 2015 Plan. HD 104 and HD 105 are
the only districts in Gwinnett County that changed under the 2015 redistricting.
Case 1:17-cv-01427-TCB-WSD-BBM Document 64-1 Filed 12/22/17 Page 5 of 13
6
Figure 2
HD 105 – 2012 Plan vs. 2015 plan
District
% 18+ AP Black
% 18+ NH Black
% 18+ NH Asian
% 18+ Latino
% 18+ Minority
% Minority CVAP
HD 105 (2012) 33.85% 32.37% 4.61% 12.61% 51.58% 48.07%
HD 105 (2015)
31.82% 30.37% 2.85% 10.82% 47.31% 46.12%
13. The map in Figure 3 (on the next page) shows HD 105 under the
2015 Plan, with a black-line overlay showing HD 105 under the 2012 Plan. VTD
boundaries are depicted with blue lines. Labels identify VTDs that were shifted in
whole or in part in the 2015 redistricting of HD 105. Red dots show majority-
minority census blocks, with text showing total population by census block. A
larger version of Figure 3 is in Exhibit D.
Case 1:17-cv-01427-TCB-WSD-BBM Document 64-1 Filed 12/22/17 Page 6 of 13

7
Figure 3
HD 105 -- Comparison of 2012 Plan (Black Line) and 2015 Plan
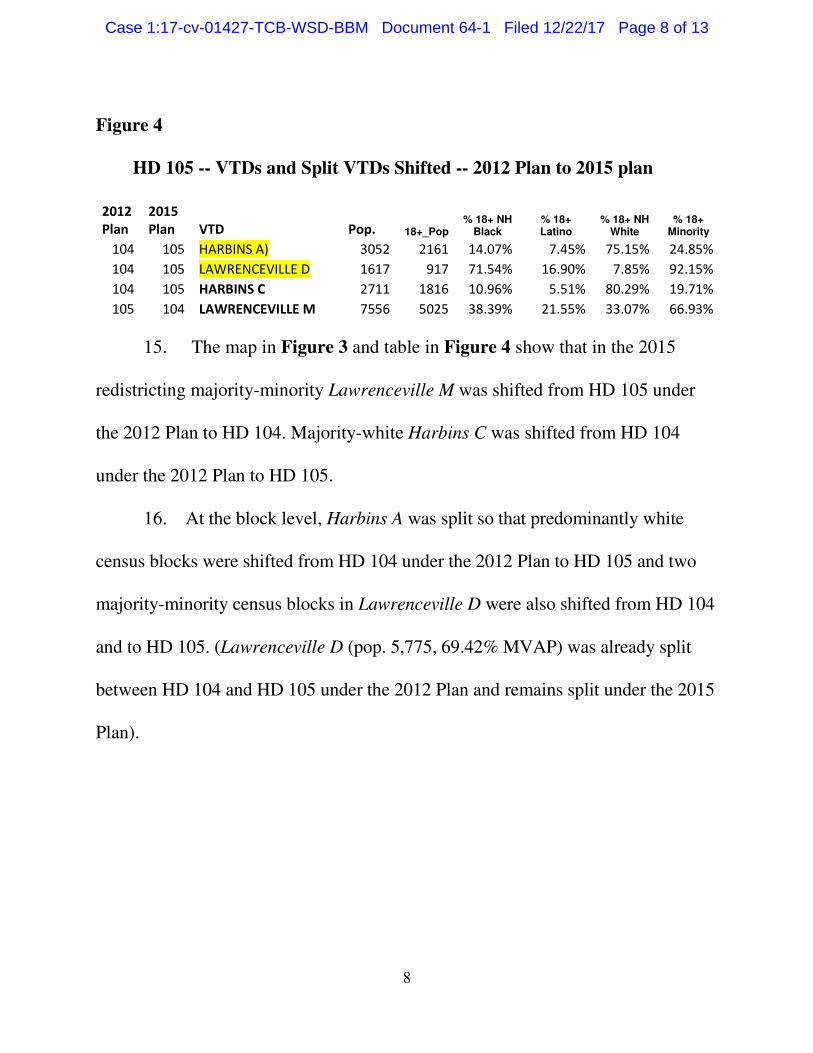
14. The table in Figure 4 (on the next page) shows the VTD shifts and
splits that reconfigured HD 105 from the black-line 2012 Plan to the color-coded
green area under the 2015 Plan. Yellow highlights in the table depict shifts
involving VTD splits. The net effect is that under the 2015 Plan, the minority voting
age population (“MVAP”) in HD 105 drops to 47.31% from 51.58% under the 2012
Plan.
Case 1:17-cv-01427-TCB-WSD-BBM Document 64-1 Filed 12/22/17 Page 7 of 13
8
Figure 4
HD 105 -- VTDs and Split VTDs Shifted -- 2012 Plan to 2015 plan
2012
Plan
2015
Plan VTD Pop. 18+_Pop % 18+ NH
Black % 18+ Latino
% 18+ NH White
% 18+ Minority
104 105 HARBINS A) 3052 2161 14.07% 7.45% 75.15% 24.85%
104 105 LAWRENCEVILLE D 1617 917 71.54% 16.90% 7.85% 92.15%
104 105 HARBINS C 2711 1816 10.96% 5.51% 80.29% 19.71%
105 104 LAWRENCEVILLE M 7556 5025 38.39% 21.55% 33.07% 66.93%
15. The map in Figure 3 and table in Figure 4 show that in the 2015
redistricting majority-minority Lawrenceville M was shifted from HD 105 under
the 2012 Plan to HD 104. Majority-white Harbins C was shifted from HD 104
under the 2012 Plan to HD 105.
16. At the block level, Harbins A was split so that predominantly white
census blocks were shifted from HD 104 under the 2012 Plan to HD 105 and two
majority-minority census blocks in Lawrenceville D were also shifted from HD 104
and to HD 105. (Lawrenceville D (pop. 5,775, 69.42% MVAP) was already split
between HD 104 and HD 105 under the 2012 Plan and remains split under the 2015
Plan).
Case 1:17-cv-01427-TCB-WSD-BBM Document 64-1 Filed 12/22/17 Page 8 of 13
9
(c) 2015 House Districts – Henry County
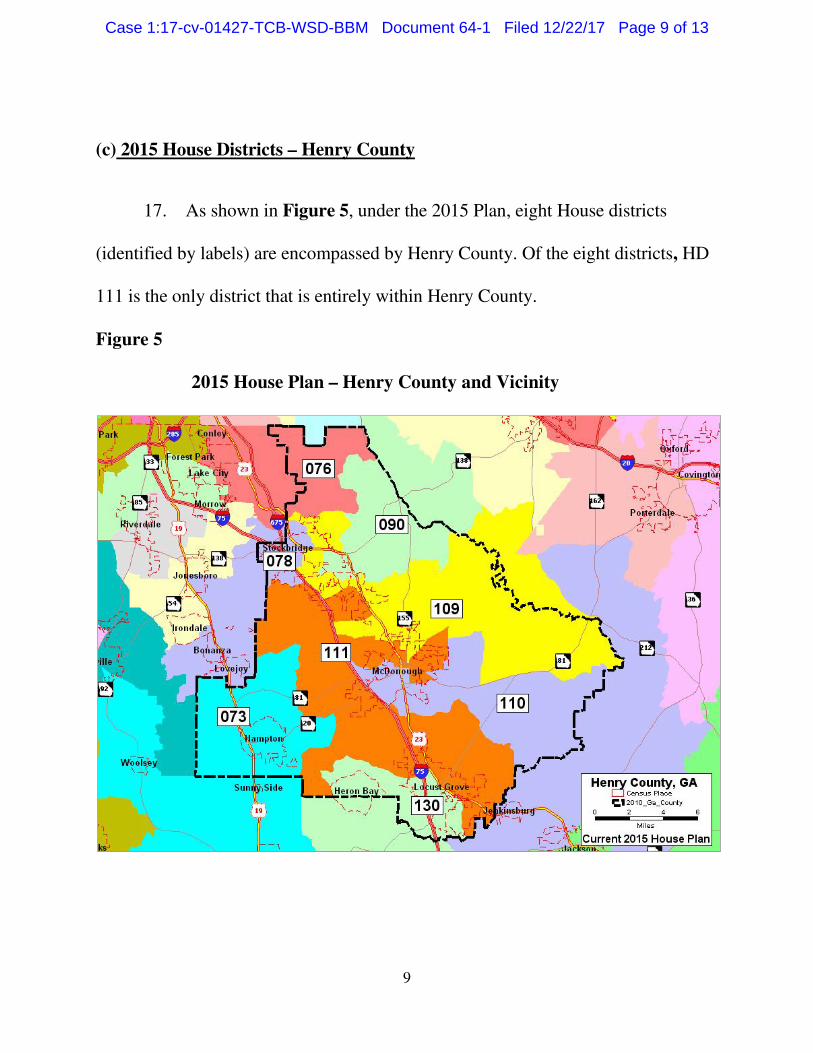
17. As shown in Figure 5, under the 2015 Plan, eight House districts
(identified by labels) are encompassed by Henry County. Of the eight districts, HD
111 is the only district that is entirely within Henry County.
Figure 5
2015 House Plan – Henry County and Vicinity
Case 1:17-cv-01427-TCB-WSD-BBM Document 64-1 Filed 12/22/17 Page 9 of 13

10
18. The table in Figure 6 shows summary population statistics for HD
111 under the 2012 Plan and 2015 Plan. The 2015 redistricting of Henry County
was complex and affected all House districts.
Figure 6
HD 111 – 2012 Plan vs. 2015 plan
District
% 18+ AP Black
% 18+ NH Black
% 18+ NH Asian
% 18+ Latino
% 18+ Minority
% Minority CVAP
HD 111 (2012) 34.55% 33.20% 3.26% 5.60% 43.86% 48.08%
HD 111 (2015) 32.31% 31.00% 2.63% 5.24% 41.86% 43.32%
19. The map in Figure 7 (on the next page) shows HD 111 and portions
of adjacent districts under the 2015 Plan, with a black-line overlay showing HD
111 under the 2012 Plan. VTD boundaries are depicted with blue lines. Labels
identify VTDs that were shifted in whole or in part in the 2015 redistricting of HD
111. Red dots show majority-minority census blocks. A larger version of Figure
7, with text showing total population by census block is in Exhibit E-1 (north) and
Exhibit E-2 (south).
Case 1:17-cv-01427-TCB-WSD-BBM Document 64-1 Filed 12/22/17 Page 10 of 13

11
Figure 7
HD 111-- Comparison of 2012 Plan (Black Line) and 2015 Plan
20. The table in Figure 8 (on the next page) shows the VTD shifts and
splits that reconfigured HD 111 from the black-line 2012 Plan to the color-coded
orange area under the 2015 Plan. Yellow highlights in the table depict shifts
involving VTD splits. The net effect is that under the 2015 plan, the MVAP in HD
111 drops to 41.86% from 43.86% under the 2012 Plan.
Case 1:17-cv-01427-TCB-WSD-BBM Document 64-1 Filed 12/22/17 Page 11 of 13

12
Figure 8
HD 111 -- VTDs and Split VTDs Shifted -- 2012 Plan to 2015 plan
2012
Plan
2015
Plan VTD Pop. 18+_Pop % 18+ NH
Black % 18+ Latino
% 18+ NH White
% 18+ Minority
109 111 HICKORY FLAT 2978 1967 49.42% 6.51% 33.55% 66.45%
109 111 FLIPPEN 3509 2478 38.34% 4.24% 42.05% 57.95%
110 111 TUSSAHAW 1151 789 4.56% 2.41% 90.11% 9.89%
110 111 MCDONOUGH 2884 2093 43.96% 4.49% 48.59% 51.41%
110 111 MCDONOUGH CENTRAL 2733 1902 46.32% 5.05% 45.79% 54.21%
130 111 GROVE PARK 4936 3407 20.87% 3.76% 72.76% 27.24%
111 73 NORTH HAMPTON 3556 2542 28.17% 4.80% 64.40% 35.60%
111 73 MOUNT CARMEL 1201 842 43.82% 3.68% 40.97% 59.03%
111 109 STOCKBRIDGE WEST 5753 4102 58.65% 7.26% 27.89% 72.11%
111 109 STAGECOACH 4901 3565 27.85% 6.00% 62.38% 37.62%
111 109 MCDONOUGH CENTRAL 334 290 36.21% 1.38% 58.62% 41.38%
21. The map in Figure 7 and table in Figure 8 show that in the 2015
redistricting of HD 111, four whole VTDs were shifted. From north to south:
Majority-white Stagecoach was shifted from HD 111 to HD 109. Major-minority
Stockbridge West was shifted from HD 111 to HD 109. Majority-white North
Hampton was shifted from HD 111 to HD 73. Majority-white Grove Park was
shifted from HD 130 to HD 111.
22. At the block level, majority-minority areas of Hickory Flat and Flippen
in HD 109 were shifted to HD 111. A 90% white area in Tussahaw was shifted
from HD 110 to HD 111. Majority-minority areas of McDonough and McDonough
Central were shifted from HD 110 to HD 111. A predominantly minority area of
Mount Carmel was shifted from HD 111 to HD 073. Finally, a majority-white area
of McDonough Central was shifted from HD 111 to HD 109.
Case 1:17-cv-01427-TCB-WSD-BBM Document 64-1 Filed 12/22/17 Page 12 of 13

13
# # #
I reserve the right to continue to supplement my declarations in light of additional
facts, testimony and/or materials that may come to light.
Pursuant to 28 U.S.C. § 1746, I declare under penalty of perjury of the laws
of the United States that the foregoing is true and correct according to the best of
my knowledge, information and belief.
Executed on: December 22, 2017
WILLIAM S. COOPER
Case 1:17-cv-01427-TCB-WSD-BBM Document 64-1 Filed 12/22/17 Page 13 of 13