in touch - s1.q4cdn.com · to do that, we keep in touch with developments in our changing world. we...
TRANSCRIPT

IN TOUCH
INTACT FINANCIAL CORPORATION2014 ANNUAL REPORT
INTA
CT FIN
AN
CIA
L CO
RP
OR
ATIO
N 2
01
4 A
NN
UA
L RE
PO
RT
2014 2013 2012 2011 2010
Consolidated Performance
Written insured risks (thousands) 7,062 7,115 6,729 5,084 4,614
Direct premiums written 7,349 7,319 6,868 5,099 4,498
Net premiums earned 7,207 7,014 6,571 4,880 4,231
Combined ratio 92.8% 98.0% 93.1% 94.4% 95.4%
Underwriting income 519 142 451 273 193
Net investment income 427 406 389 326 294
Net operating income 767 500 675 460 402
Net investment gains (losses) 174 (83) 37 204 182
Net income 782 431 571 465 498
Net operating income per share ($) 5.67 3.62 5.00 3.91 3.49
Earnings per share ($) 5.79 3.10 4.20 3.96 4.32
Book value per share ($) 37.75 33.94 33.03 29.73 26.47
Operating return on equity 16.3% 11.2% 16.8% 15.3% 15.1%
Adjusted return on equity 16.8% 10.3% 16.1% 17.4% 17.1%
FINANCIAL HIGHLIGHTS (Excluding MYA, in millions of Canadian dollars, except as noted)
We are the largest provider of property and casualty (“P&C”) insurance in Canada with $7.3 billion in
annual direct premiums written (“DPW”) and an estimated market share of 17%. We insure more than
five million individuals and businesses through our insurance subsidiaries and are the largest private
sector provider of P&C insurance in British Columbia, Alberta, Ontario, Québec and Nova Scotia. We
distribute insurance under the Intact Insurance brand through a wide network of brokers and our wholly
owned subsidiary, BrokerLink, and directly to consumers through belairdirect. We internally manage our
investments totalling approximately $13.4 billion.
ONLINE ANNUAL REPORT
Please visit our online annual
report to view videos, interactive
features and additional information
on how we stayed “in touch” with
our stakeholders in 2014.
It can be accessed by scanning
this QR code or visiting
reports.intactfc.com/2014

IN TOUCHAt Intact Financial, we believe that insurance is not about things, it’s about people. We are here to help people, businesses and society prosper in good times and be resilient in bad times. To do that, we keep in touch with developments in our changing world. We make it easy to get in touch with us, by phone, online or in person. Most importantly, we keep our promises and stay in touch with our stakeholders, so we can meet their needs.
TABLE OF CONTENTS
Financial highlights 2 • What does being “in touch” mean? 4 • CEO’s letter 6 • Chairman’s letter 9 • MD&A and Financial Statements 10
This annual report contains forward-looking statements. We caution readers not to place undue reliance on these forward-looking statements as a number of factors could cause the Company’s actual results, performance or achievements, or future events or developments to differ materially from those expressed or implied by the forward-looking statements. Additional information about our forward-looking statements and risk factors can be found under the Cautionary note regarding forward-looking statements and the Risk Management sections of our Management’s Discussion and Analysis.
2 INTACT FINANCIAL CORPORATION 2014 ANNUAL REPORT
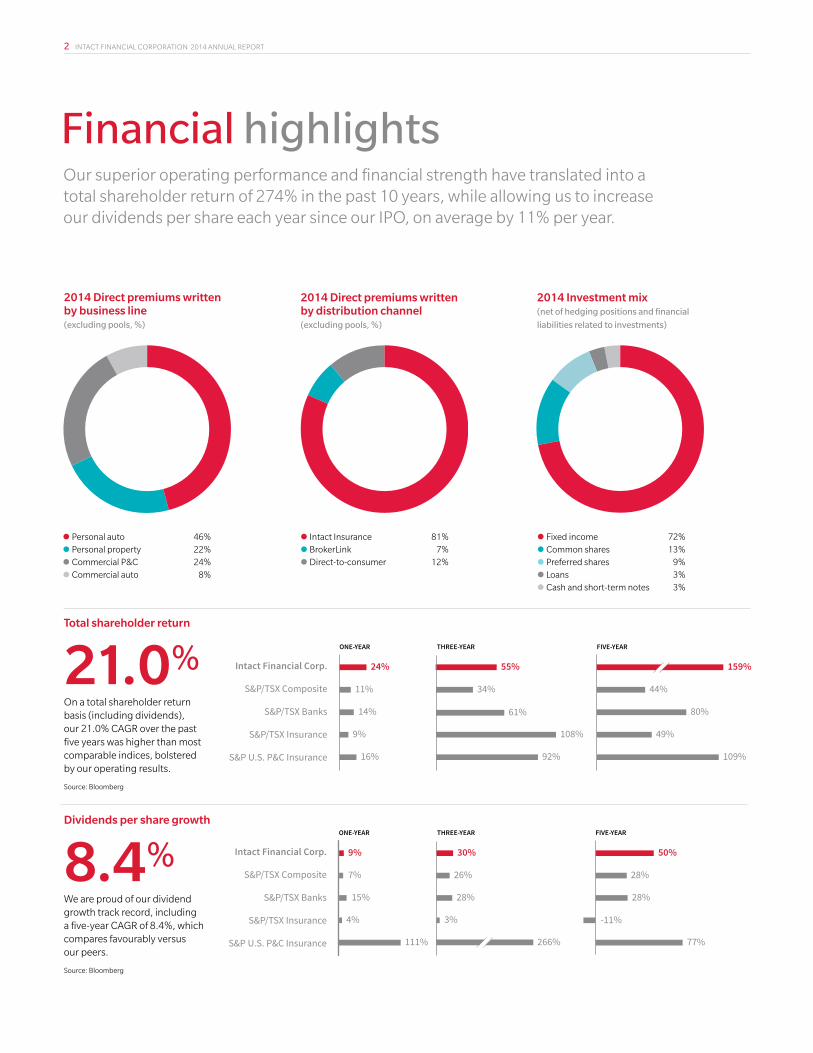
Financial highlightsOur superior operating performance and financial strength have translated into a total shareholder return of 274% in the past 10 years, while allowing us to increase our dividends per share each year since our IPO, on average by 11% per year.
Total shareholder return
21.0%On a total shareholder return basis (including dividends), our 21.0% CAGR over the past five years was higher than most comparable indices, bolstered by our operating results.
Source: Bloomberg
Dividends per share growth
8.4%We are proud of our dividend growth track record, including a five-year CAGR of 8.4%, which compares favourably versus our peers.
Source: Bloomberg
Intact Financial Corp.
S&P/TSX Composite
S&P/TSX Banks
S&P/TSX Insurance
S&P U.S. P&C Insurance
24%
11%
14%
9%
16%
55%
34%
61%
108%
92%
159%
44%
80%
49%
109%
ONE-YEAR THREE-YEAR FIVE-YEAR
Intact Financial Corp.
S&P/TSX Composite
S&P/TSX Banks
S&P/TSX Insurance
S&P U.S. P&C Insurance
9%
7%
15%
4%
111%
30%
26%
28%
3%
266%
50%
28%
28%
-11%
77%
ONE-YEAR THREE-YEAR FIVE-YEAR
Intact Financial Corp.
S&P/TSX Composite
S&P/TSX Banks
S&P/TSX Insurance
S&P U.S. P&C Insurance
24%
11%
14%
9%
16%
55%
34%
61%
108%
92%
159%
44%
80%
49%
109%
ONE-YEAR THREE-YEAR FIVE-YEAR
Intact Financial Corp.
S&P/TSX Composite
S&P/TSX Banks
S&P/TSX Insurance
S&P U.S. P&C Insurance
9%
7%
15%
4%
111%
30%
26%
28%
3%
266%
50%
28%
28%
-11%
77%
ONE-YEAR THREE-YEAR FIVE-YEAR
2014 Direct premiums written by business line (excluding pools, %)
2014 Direct premiums written by distribution channel (excluding pools, %)
2014 Investment mix (net of hedging positions and financial
liabilities related to investments)
•Personal auto 46%
•Personal property 22%
•Commercial P&C 24%
•Commercial auto 8%
•Intact Insurance 81%
•BrokerLink 7%
•Direct-to-consumer 12%
•Fixed income 72%
•Common shares 13%
•Preferred shares 9%
•Loans 3%
•Cash and short-term notes 3%
INTACT FINANCIAL CORPORATION 2014 ANNUAL REPORT 3
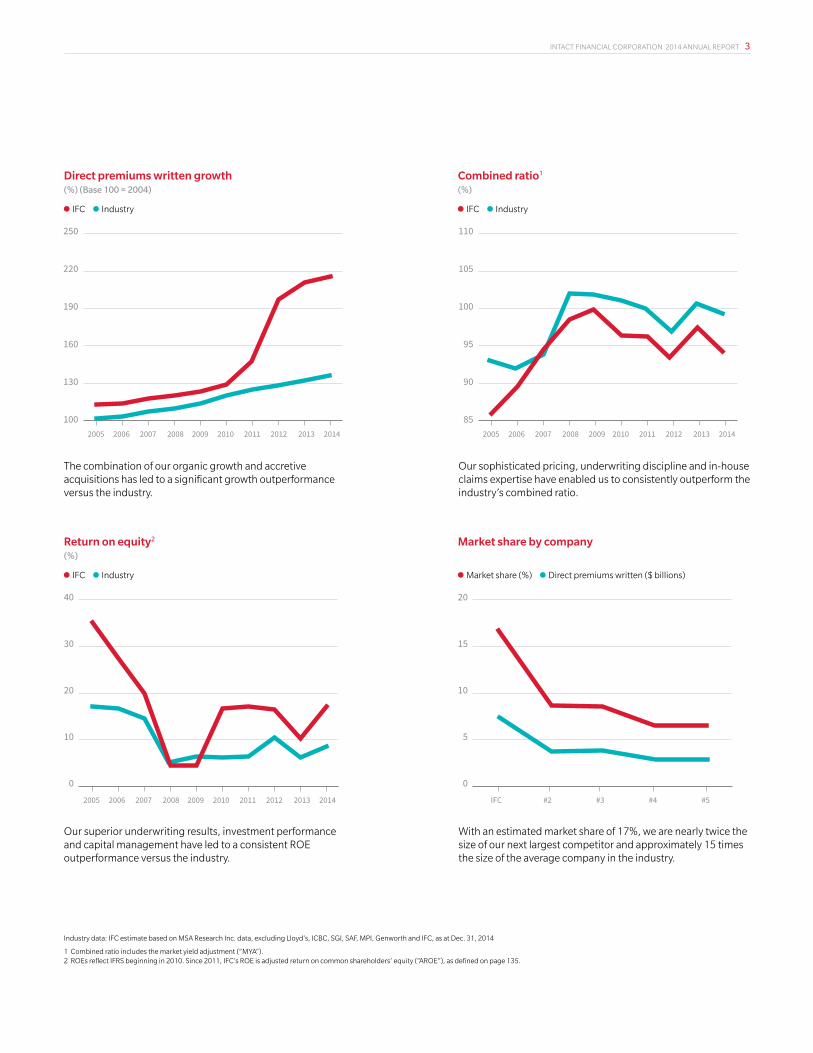
Direct premiums written growth (%) (Base 100 = 2004)
Return on equity2 (%)
Combined ratio1 (%)
Market share by company
•IFC •Industry
•IFC •Industry
•IFC •Industry
•Market share (%) •Direct premiums written ($ billions)
250
220
190
160
130
1002005 2006 2007 2008 2009 2010 2011 2012 2013 2014
110
105
100
95
90
852005 2006 2007 2008 2009 2010 2011 2012 2013 2014
40
30
20
10
0
2005 2006 2007 2008 2009 2010 2011 2012 2013 2014
20
15
10
5
0
IFC #2 #3 #4 #5
250
220
190
160
130
1002005 2006 2007 2008 2009 2010 2011 2012 2013 2014
110
105
100
95
90
852005 2006 2007 2008 2009 2010 2011 2012 2013 2014
40
30
20
10
0
2005 2006 2007 2008 2009 2010 2011 2012 2013 2014
20
15
10
5
0
IFC #2 #3 #4 #5
250
220
190
160
130
1002005 2006 2007 2008 2009 2010 2011 2012 2013 2014
110
105
100
95
90
852005 2006 2007 2008 2009 2010 2011 2012 2013 2014
40
30
20
10
0
2005 2006 2007 2008 2009 2010 2011 2012 2013 2014
20
15
10
5
0
IFC #2 #3 #4 #5
250
220
190
160
130
1002005 2006 2007 2008 2009 2010 2011 2012 2013 2014
110
105
100
95
90
852005 2006 2007 2008 2009 2010 2011 2012 2013 2014
40
30
20
10
0
2005 2006 2007 2008 2009 2010 2011 2012 2013 2014
20
15
10
5
0
IFC #2 #3 #4 #5
The combination of our organic growth and accretive acquisitions has led to a significant growth outperformance versus the industry.
Our superior underwriting results, investment performance and capital management have led to a consistent ROE outperformance versus the industry.
Our sophisticated pricing, underwriting discipline and in-house claims expertise have enabled us to consistently outperform the industry’s combined ratio.
With an estimated market share of 17%, we are nearly twice the size of our next largest competitor and approximately 15 times the size of the average company in the industry.
Industry data: IFC estimate based on MSA Research Inc. data, excluding Lloyd’s, ICBC, SGI, SAF, MPI, Genworth and IFC, as at Dec. 31, 2014
1 Combined ratio includes the market yield adjustment (“MYA”).2 ROEs reflect IFRS beginning in 2010. Since 2011, IFC’s ROE is adjusted return on common shareholders’ equity (“AROE”), as defined on page 135.

4 INTACT FINANCIAL CORPORATION 2014 ANNUAL REPORT
In touch online Please visit our online annual report (reports.intactfc.com/2014) to view videos, interactive features and additional information on how we stayed “in touch” with our stakeholders in 2014.
People We know that insurance is not about things, it’s about people. Our employees live our values every day, enabling us to keep our promise to the people we serve. These values of integrity, respect, being customer driven, striving for excellence and being socially responsible allow us to deliver an experience for customers and brokers that is second to none. For customers, we go beyond a top-notch claims experience by helping them try to avoid having to endure a loss in the first place. For employees, when we asked them what they liked about working at Intact Financial Corporation (“IFC”), they named our values, career opportunities, inspiring teams and financial rewards as areas that are important to them. For brokers, surveys say that ease of doing business with us remains a key factor. We are listening to feedback, responding to needs and are ready to help people succeed in the years ahead.
What does being “in touch” mean?It means keeping in touch with developments in our changing world and responding effectively; making it easy to get in touch with us, by phone, online or in person; and, most importantly, staying in touch with our stakeholders so we can meet their needs.
4
POINT improvement in employee engagement

INTACT FINANCIAL CORPORATION 2014 ANNUAL REPORT 5
14% compound annual total return to shareholders over the last 10 years
Communities
Our core value of being socially responsible speaks to our commitment to make the communities in which we operate safer, happier and healthier, and encourages our employees to get involved. It also serves as the mandate of the Intact Foundation, which donates to organizations that are committed to climate change adaptation and the improvement of the lives of at-risk youth. Since 2010, Intact Financial has been a proud National Partner of Raising the Roof’s annual Toque Campaign, aimed at finding long-term solutions to homelessness and providing shelter to youth at risk. Since 2012, we have helped support the Climate Change Adaptation Project (“CCAP”) in its efforts to find meaningful and cost-effective solutions to help Canadians adapt to the impacts of climate change. Last year, employees and brokers participated in a number of projects from coast to coast aimed at reducing the impact of torrential precipitation, promoting measures to prevent basement flooding and deploying green infrastructure.
Strategy We bring energy and passion to our work, we stay true to our values and we want our customers to know that what matters to them, matters to us. We therefore made it our objective to deliver an outstanding customer experience, have an engaged workforce, and be one of the most respected companies in Canada. In 2014, our customer satisfaction scores remained among the best in the industry, employee engagement improved by 4 points and we outperformed the industry return on equity by more than 8 points. But we are not standing still. Consumer expectations are evolving, the competitive environment is changing and we are responding. We are bolstering our manufacturing advantage by leveraging our scale in segmentation and claims, employing agile technology, and making the experience for customers and brokers even simpler and more enriched than it was before.
$3.7 MILLION invested in our communities

6 INTACT FINANCIAL CORPORATION 2014 ANNUAL REPORT
WATCH THE CEO’S VIDEO MESSAGE ONLINE reports.intactfc.com/2014
In touch with a changing landscape Across Intact Financial, we may have different jobs but we share the same goal. We are here to help people, businesses and society prosper in good times and be resilient in bad times. Making a difference is important to us; it is our purpose.
“We made a promise to our employeesin 2014. We promise to hold true to our values of integrity and respect, because they matter as much as results. We also promise to support our employees in developing their careers, to surround them with inspiring teams and to offer a comprehensive financial rewards program that recognizes their success.”
We bring energy and passion to our work, we stay true to our values and we want our customers to know that what matters to them, matters to us. To achieve this, we need to create an offer and service proposition that is second to none. We want our customers to become our advocates by exceeding their expectations and serving them in their times of need. Great progress was made in 2014 as our customer satisfaction scores were among the best in the industry and belairdirect is currently ranked “Highest in Customer Satisfaction among Auto Insurers in Ontario” by J.D. Power.1
We also know that in order to be truly customer driven, we need to continue to invest in our people. Our goal is to be recognized as one of the best employers in Canada. Employee engagement is the benchmark by which we measure our success – and our 4-point improvement in 2014 confirms we are on the right track.
Year in reviewFrom an underwriting perspective, we ended 2014 with a full-year combined ratio of 92.8%, with balanced contributions from Personal Lines and Commercial Lines. 2014 was a productive year, where our hard work and, at times, difficult decisions began to pay off. Our profitability initiatives, particularly in personal property, proved successful, while we also benefited from catastrophe losses that were closer to our expected level – about half the level of 2013. Overall, we generated an operating return on equity (“OROE”) of 16.3%, much improved from the 11.2% we reported a year ago.
Charles Brindamour Chief Executive Officer
CEO’S LETTER
INTACT FINANCIAL CORPORATION 2014 ANNUAL REPORT 7
The rebound in our earnings further strengthened our financial position. We entered 2015 with excess capital of $681 million and a debt-to-capital ratio below our target level of 20%. We remain optimistic about our prospects and earlier this year we announced a 10% dividend increase, marking the 10th consecutive year that the dividend has been raised.
An industry leader is expected to provide an outstanding performance, coupled with strong values guiding our actions. Looking at our two primary financial objectives, 2014’s significant rebound in net operating income per share (“NOIPS”) returns us to our historical trend, with a 13% compound annual growth since 2010, above our target of 10% per year growth over time. From a return on equity (“ROE”) perspective, we target to outperform the industry by at least 5 points every year. Our outperformance amounted to 8 points in 2014, in line with our average outperformance in the past five years.
Our financial results enabled us to deliver excellent value to shareholders with a total return of more than 24% in 2014. This is slightly above our 21% compound annual total return over the last five years, which was well in excess of the S&P/TSX and Canadian financial peers.
Industry outlookIn the near term, we foresee low single-digit growth in personal auto while we expect upper single-digit growth in personal property from continued hard market conditions. Commercial P&C has firmed in the past year. The low interest rate environment and minimal profits at the industry level give us comfort in projecting a mid single-digit level of growth for the industry in 2015 in Commercial Lines.
We expect the industry’s combined ratio to continue to improve in 2015 from the recent peak above 100% in 2013, though the level of investment income is unlikely to improve. Overall, we expect the industry’s ROE to trend back towards its long-term average of 10% in 2015. Looking specifically at IFC, we expect to outperform the industry’s ROE by at least 500 basis points in 2015.
In touch with a changing landscapeConsumer expectations are changing and they are leading companies to adapt. Technology has also impacted shopping and buying behaviours and consumers therefore expect 24/7 service and accessibility. Companies must be able to identify how consumer needs are evolving and provide solutions to satisfy them. Our competitive environment is also changing. We anticipate new entrants could challenge the way insurance is currently distributed, new consolidators could enter the market and existing competition could move across channels.
To succeed in this changing landscape requires the right response. Here is where our focus will be in the coming years:
• Bolstering our manufacturing advantage – strengthening our profitability advantage by furthering our pricing and underwriting sophistication and by leveraging our scale in claims
• Creating customer advocates by improving their experience – accelerating concrete improvements and achieving leadership in digital and behavioural analytics
• Employing agile technology – investing in a renewal of our core technology platforms to enable us to be responsive to competitive threats and to be more agile in meeting evolving customer expectations
• Strengthening distribution – building strong brands, namely Intact Insurance and belairdirect, supporting broker consolidation, and doubling our direct capabilities and operated distribution
Early progress
Our announced acquisition of Canadian Direct Insurance (“CDI”) in early 2015 achieves several objectives of our strategic plan. It will broaden our direct-to-consumer platform from coast to coast and facilitate our goal of doubling our direct capabilities in the coming years, all while providing immediate earnings accretion and surpassing our target of a 15% internal rate of return.
1 belairdirect received the highest numerical score among auto insurance providers in Ontario in theproprietary J.D. Power 2014 Canadian Auto Insurance Customer Satisfaction StudySM. Study based on 9,910 total responses measuring 18 providers in Ontario and measures consumer satisfaction with auto insurance providers. Proprietary study results are based on experiences and perceptions of consumers surveyed in January–February 2014. Your experiences may vary. Visit jdpower.com.
16.3% operating return on equity in 2014

8 INTACT FINANCIAL CORPORATION 2014 ANNUAL REPORT
Supporting our broker partnersWith the acquisitions of AXA Canada and Jevco, we have one of the broadest product offerings in the market. Our increased scale and financial strength make us an even stronger ally for our broker partners. As before, we stand ready to invest in brokers’ businesses to help them grow and prosper. As always, we maintain our commitment to providing a customer and broker experience second to none.
A promise to our peopleWe made a promise to our employees in 2014. We promise to hold true to our values of integrity and respect, because they matter as much as results. We also promise to support our employees in developing their careers, to surround them with inspiring teams and to offer a comprehensive financial rewards program that recognizes their success.
Delivering on our promise requires building a strong group of leaders within the organization. Our leaders play an important role as they exemplify behaviours that engage their teams and contribute to the achievement of our purpose as a company. We ask that our leaders live our values, care for people, be open and honest, take accountability, and embrace change.
We will succeed as an organization only if our people are engaged and energized to contribute their very best every day. I want to thank them for their hard work and for making 2014 such a success, and I look forward to how far we can take the Company in 2015 and beyond.
In closing, I would like to thank our Board of Directors, whose insight and guidance have helped us to make decisions critical to the success of our organization. Finally, to our shareholders, thank you for your continued support. We will work to maintain your confidence and look forward to many successful years to come as we strive to maintain our track record of value creation.
Charles Brindamour
Chief Executive Officer
FACTORS OF INDUSTRY OUTPERFORMANCE
SOPHISTICATED PRICING AND UNDERWRITING
SCALE
IN-HOUSE CLAIMS EXPERTISE
BROKER RELATIONSHIPS
MULTI-CHANNEL DISTRIBUTION
PROVEN ACQUISITION STRATEGY
SOLID INVESTMENT RETURNS
CEO’S LETTER

INTACT FINANCIAL CORPORATION 2014 ANNUAL REPORT 9
Such achievements would not have been possible without the numerous initiatives the Company has launched in response to our changing climate and the unprecedented natural disasters of recent years.
As both consumers’ expectations and the competitive environment of our industry continued to evolve, your Board devoted much of our time and energies to honing the strategic direction of your Company. Chief among our thoughts was the diversification of its distribution platforms, the strengthening of its brands and the digital experience it will offer consumers in the years to come.
We also pursued your Company’s growth ambitions. The acquisition of Metro General last year and CDI this February will advance its development in the Atlantic and Western provinces while its investment in an online brokerage in Brazil will provide a window for an eventual international expansion.
Your Board also continued to review your Company’s exposure to the various risks it may encounter in its activities. Special attention was devoted to the implementation of the recent ORSA requirements regarding the solvency of the Company. Attention was also devoted to the issue of cyber-risk.
We also reviewed governance best practices among Canadian companies and, as a result, adopted a new Statement of Corporate Governance Practices, which includes a new Board policy on diversity. This policy recognizes the benefits of promoting diversity both within the Company and among its Board and builds upon our signature of the Catalyst Accord in 2012.
We also adopted a new term of office and Board tenure policy, which will ensure ongoing director renewal and create an effective balance between the perspectives brought by new members and those of experienced directors.
I am very proud of the achievements of your Company and its people over the past year and I would like to thank them. Together, they delivered a superb performance and created significant value for all our stakeholders. In doing so, they made considerable progress in their efforts to make your Company one of the most respected and successful in Canada.
Claude Dussault Chairman of the Board
Responsible governance 2014 has been most rewarding for your Company. Significant profitability improvements allowed it to pursue its growth ambitions and outperform its peers by a wide margin.
“I am very proud of the achievementsof your Company and its people over the past year and I would like to thank them. Together, they delivered a superb performance and created significant value for all our stakeholders.”
Claude Dussault Chairman of the Board
CHAIRMAN’S LETTER

MD&A and Financial StatementsPlease note that the following “MD&A” and “Financial Statements” are provided as distinct sections with individual pagination: MD&A – pages 1 to 56 andFinancial Statements – pages 1 to 62.
Intact Financial Corporation Management’s Discussion and Analysis
For the year ended December 31, 2014

INTACT FINANCIAL CORPORATION
Management’s Discussion and Analysis for the year ended December 31, 2014 (in millions of dollars, except as otherwise noted)
INTACT FINANCIAL CORPORATION 1
Table of contents
Section 1 – Profile ................................................................................................................................. 3
Section 2 – Key performance indicators ............................................................................................... 4
Section 3 – Overview of our consolidated performance ....................................................................... 6
Section 4 – Operating results ............................................................................................................... 8
Section 5 – Non-operating results ...................................................................................................... 13
Section 6 – Non-IFRS financial measures .......................................................................................... 14
Section 7 – Business developments and operating environment ...................................................... 16
Section 8 – Strategy and outlook ........................................................................................................ 19
Section 9 – Financial condition ........................................................................................................... 21
Section 10 – Liquidity and capital resources ...................................................................................... 28
Section 11 – Capital management ..................................................................................................... 30
Section 12 – Risk management .......................................................................................................... 32
Section 13 – Off-balance sheet arrangements ................................................................................... 50
Section 14 – Accounting and disclosure matters ............................................................................... 50
Section 15 – Investor information ....................................................................................................... 54
Section 16 – Selected annual and quarterly information .................................................................... 55
INTACT FINANCIAL CORPORATION
Management’s Discussion and Analysis for the year ended December 31, 2014 (in millions of dollars, except as otherwise noted)
2 INTACT FINANCIAL CORPORATION
February 3, 2015
The following MD&A is the responsibility of management and has been reviewed and approved by the Board of Directors (or
“Board”) for the year ended December 31, 2014. This MD&A is intended to enable the reader to assess our results of operations
and financial condition for the three- and twelve-month periods ended December 31, 2014, compared to the corresponding periods
in 2013. It should be read in conjunction with our Consolidated financial statements for our fiscal year ended December 31, 2014.
All amounts herein are expressed in Canadian dollars.
We use both IFRS and non-IFRS measures to assess performance. Non-IFRS measures do not have any standardized meaning
prescribed by IFRS and are unlikely to be comparable to any similar measures presented by other companies. See Section 6 –
Non-IFRS financial measures for the definition and reconciliation to the most comparable IFRS measures. Management analyzes
performance based on underwriting ratios such as combined, expense, loss and claims ratios, MCT, and debt-to-capital, as well as
other non-IFRS financial measures, namely AEPS, NOIPS, ROE, AROE, OROE, NOI, Non-operating results, Underlying current
year loss ratio, Cash flow available for investment activities, and Market-based yield. These measures and other insurance-related
terms used in this MD&A are defined in the glossary available in the “Investor Relations” section of our web site at
www.intactfc.com. Further information about Intact Financial Corporation, including the Annual Information Form, may be found
online on SEDAR at www.sedar.com.
Cautionary note regarding forward-looking statements
Certain of the statements included in this MD&A about the Company’s current and future plans, expectations and intentions, results,
levels of activity, performance, goals or achievements or any other future events or developments constitute forward-looking
statements. The words “may”, “will”, “would”, “should”, “could”, “expects”, “plans”, “intends”, “trends”, “indications”, “ant icipates”,
“believes”, “estimates”, “predicts”, “likely”, “potential” or the negative or other variations of these words or other similar or
comparable words or phrases, are intended to identify forward-looking statements.
Forward-looking statements are based on estimates and assumptions made by management based on management’s experience
and perception of historical trends, current conditions and expected future developments, as well as other factors that management
believes are appropriate in the circumstances. Many factors could cause the Company’s actual results, performance or
achievements or future events or developments to differ materially from those expressed or implied by the forward-looking
statements, including, without limitation, the following factors: the Company’s ability to implement its strategy or operate its business
as management currently expects; its ability to accurately assess the risks associated with the insurance policies that the Company
writes; unfavourable capital market developments or other factors which may affect the Company’s investments and funding
obligations under its pension plans; the cyclical nature of the P&C insurance industry; management’s ability to accurately predict
future claims frequency; government regulations designed to protect policyholders and creditors rather than investors; litigation and
regulatory actions; periodic negative publicity regarding the insurance industry; intense competition; the Company’s reliance on
brokers and third parties to sell its products to clients; the Company’s ability to successfully pursue its acquisition strategy; the
Company’s ability to execute its business strategy; the Company’s ability to achieve synergies arising from successful integration
plans relating to acquisitions, as well as management's estimates and expectations in relation to resulting accretion, internal rate of
return and debt-to-capital ratio; the Company’s participation in the Facility Association (a mandatory pooling arrangement among all
industry participants) and similar mandated risk-sharing pools; terrorist attacks and ensuing events; the occurrence of catastrophic
events; the Company’s ability to maintain its financial strength and issuer credit ratings; access to debt financing and the Company's
ability to compete for large commercial business; the Company’s ability to alleviate risk through reinsurance; the Company’s ability
to successfully manage credit risk (including credit risk related to the financial health of reinsurers); the Company’s reliance on
information technology and telecommunications systems; the Company’s dependence on key employees; changes in laws or
regulations; general economic, financial and political conditions; the Company’s dependence on the results of operations of i ts
subsidiaries; the volatility of the stock market and other factors affecting the Company’s share price; and future sales of a
substantial number of its common shares.
All of the forward-looking statements included in this MD&A are qualified by these cautionary statements and those made in
Section 12 - Risk management, hereafter. These factors are not intended to represent a complete list of the factors that could affect
the Company. These factors should, however, be considered carefully. Although the forward-looking statements are based upon
what management believes to be reasonable assumptions, the Company cannot assure investors that actual results will be
consistent with these forward-looking statements. When relying on forward-looking statements to make decisions, investors should
ensure the preceding information is carefully considered. Undue reliance should not be placed on forward-looking statements made
herein. The Company and management have no intention and undertake no obligation to update or revise any forward-looking
statements, whether as a result of new information, future events or otherwise, except as required by law.
INTACT FINANCIAL CORPORATION
Management’s Discussion and Analysis for the year ended December 31, 2014 (in millions of dollars, except as otherwise noted)
INTACT FINANCIAL CORPORATION 3
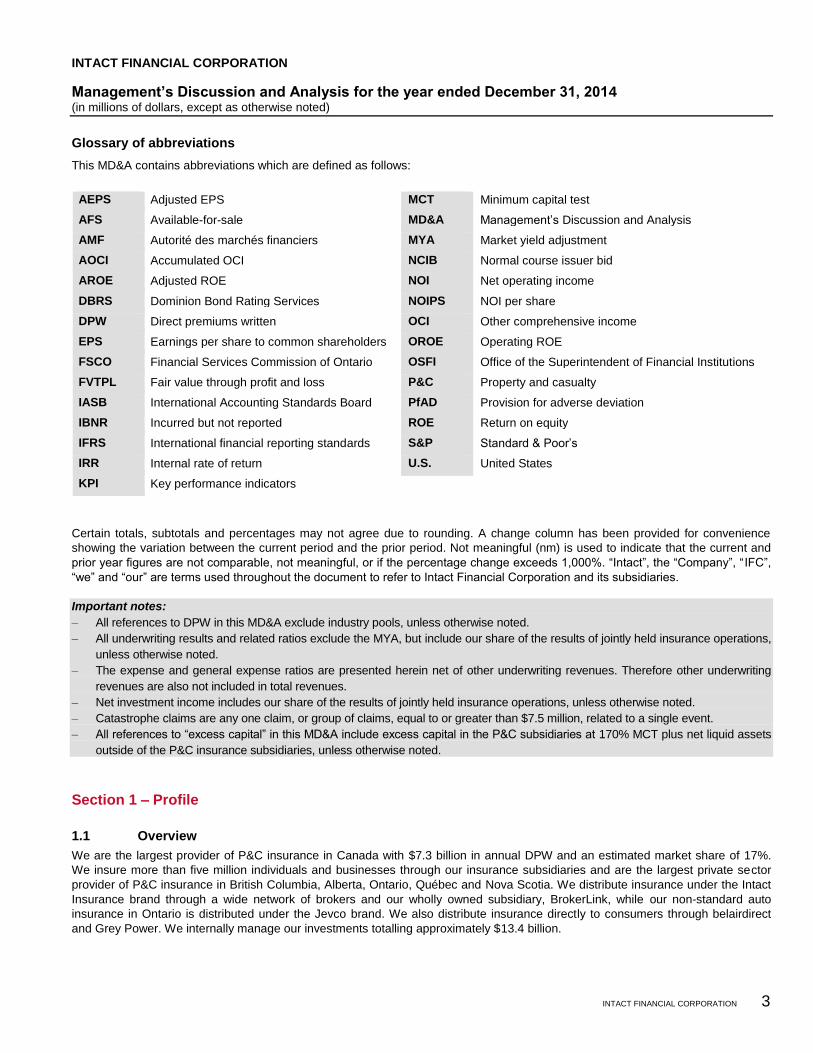
Glossary of abbreviations
This MD&A contains abbreviations which are defined as follows:
AEPS Adjusted EPS MCT Minimum capital test
AFS Available-for-sale MD&A Management’s Discussion and Analysis
AMF Autorité des marchés financiers MYA Market yield adjustment
AOCI Accumulated OCI NCIB Normal course issuer bid
AROE Adjusted ROE NOI Net operating income
DBRS Dominion Bond Rating Services NOIPS NOI per share
DPW Direct premiums written OCI Other comprehensive income
EPS Earnings per share to common shareholders OROE Operating ROE
FSCO Financial Services Commission of Ontario OSFI Office of the Superintendent of Financial Institutions
FVTPL Fair value through profit and loss P&C Property and casualty
IASB International Accounting Standards Board PfAD Provision for adverse deviation
IBNR Incurred but not reported ROE Return on equity
IFRS International financial reporting standards S&P Standard & Poor’s
IRR Internal rate of return U.S. United States
KPI Key performance indicators
Certain totals, subtotals and percentages may not agree due to rounding. A change column has been provided for convenience
showing the variation between the current period and the prior period. Not meaningful (nm) is used to indicate that the current and
prior year figures are not comparable, not meaningful, or if the percentage change exceeds 1,000%. “Intact”, the “Company”, “IFC”,
“we” and “our” are terms used throughout the document to refer to Intact Financial Corporation and its subsidiaries.
Important notes:
— All references to DPW in this MD&A exclude industry pools, unless otherwise noted.
— All underwriting results and related ratios exclude the MYA, but include our share of the results of jointly held insurance operations,
unless otherwise noted.
— The expense and general expense ratios are presented herein net of other underwriting revenues. Therefore other underwriting
revenues are also not included in total revenues.
— Net investment income includes our share of the results of jointly held insurance operations, unless otherwise noted.
— Catastrophe claims are any one claim, or group of claims, equal to or greater than $7.5 million, related to a single event.
— All references to “excess capital” in this MD&A include excess capital in the P&C subsidiaries at 170% MCT plus net liquid assets
outside of the P&C insurance subsidiaries, unless otherwise noted.
Section 1 – Profile
1.1 Overview
We are the largest provider of P&C insurance in Canada with $7.3 billion in annual DPW and an estimated market share of 17%.
We insure more than five million individuals and businesses through our insurance subsidiaries and are the largest private sector
provider of P&C insurance in British Columbia, Alberta, Ontario, Québec and Nova Scotia. We distribute insurance under the Intact
Insurance brand through a wide network of brokers and our wholly owned subsidiary, BrokerLink, while our non-standard auto
insurance in Ontario is distributed under the Jevco brand. We also distribute insurance directly to consumers through belairdirect
and Grey Power. We internally manage our investments totalling approximately $13.4 billion.
INTACT FINANCIAL CORPORATION
Management’s Discussion and Analysis for the year ended December 31, 2014 (in millions of dollars, except as otherwise noted)
4 INTACT FINANCIAL CORPORATION
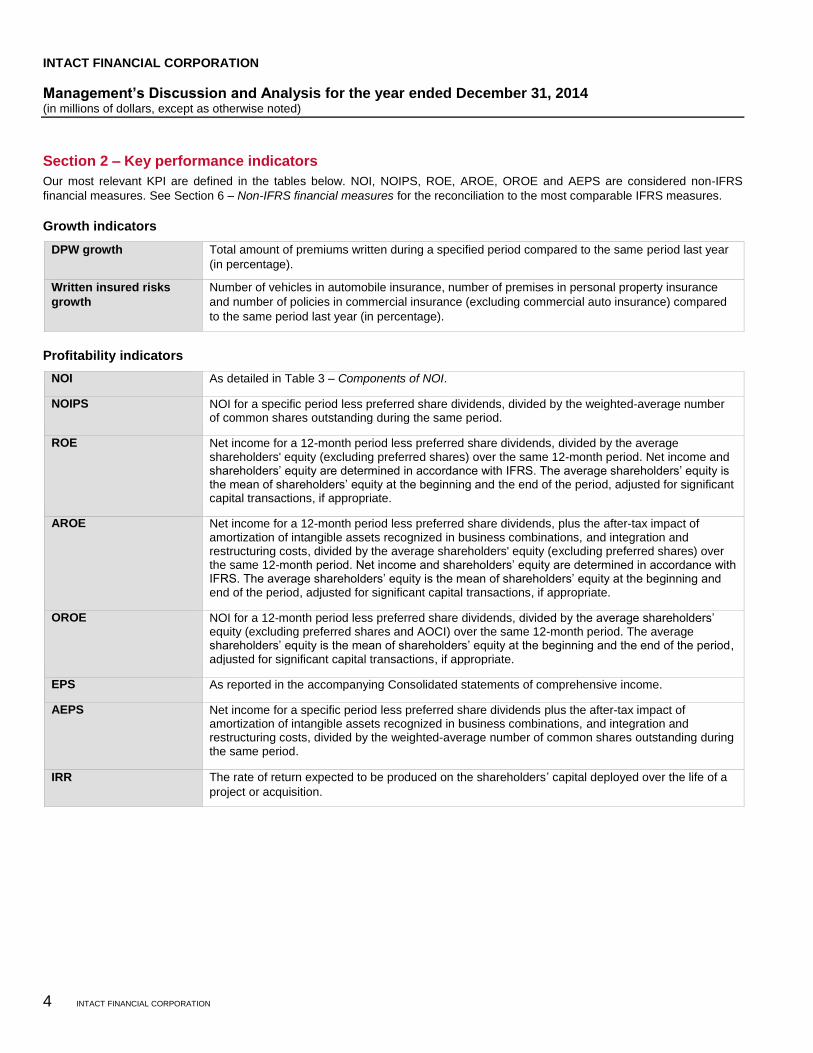
Section 2 – Key performance indicators
Our most relevant KPI are defined in the tables below. NOI, NOIPS, ROE, AROE, OROE and AEPS are considered non-IFRS
financial measures. See Section 6 – Non-IFRS financial measures for the reconciliation to the most comparable IFRS measures.
Growth indicators
DPW growth Total amount of premiums written during a specified period compared to the same period last year
(in percentage).
Written insured risks
growth
Number of vehicles in automobile insurance, number of premises in personal property insurance
and number of policies in commercial insurance (excluding commercial auto insurance) compared
to the same period last year (in percentage).
Profitability indicators
NOI As detailed in Table 3 – Components of NOI.
NOIPS NOI for a specific period less preferred share dividends, divided by the weighted-average number of common shares outstanding during the same period.
ROE Net income for a 12-month period less preferred share dividends, divided by the average shareholders' equity (excluding preferred shares) over the same 12-month period. Net income and shareholders’ equity are determined in accordance with IFRS. The average shareholders’ equity is the mean of shareholders’ equity at the beginning and the end of the period, adjusted for significant capital transactions, if appropriate.
AROE Net income for a 12-month period less preferred share dividends, plus the after-tax impact of amortization of intangible assets recognized in business combinations, and integration and restructuring costs, divided by the average shareholders' equity (excluding preferred shares) over the same 12-month period. Net income and shareholders’ equity are determined in accordance with IFRS. The average shareholders’ equity is the mean of shareholders’ equity at the beginning and end of the period, adjusted for significant capital transactions, if appropriate.
OROE NOI for a 12-month period less preferred share dividends, divided by the average shareholders’ equity (excluding preferred shares and AOCI) over the same 12-month period. The average shareholders’ equity is the mean of shareholders’ equity at the beginning and the end of the period, adjusted for significant capital transactions, if appropriate.
EPS As reported in the accompanying Consolidated statements of comprehensive income.
AEPS Net income for a specific period less preferred share dividends plus the after-tax impact of amortization of intangible assets recognized in business combinations, and integration and restructuring costs, divided by the weighted-average number of common shares outstanding during the same period.
IRR The rate of return expected to be produced on the shareholders’ capital deployed over the life of a
project or acquisition.
INTACT FINANCIAL CORPORATION
Management’s Discussion and Analysis for the year ended December 31, 2014 (in millions of dollars, except as otherwise noted)
INTACT FINANCIAL CORPORATION 5
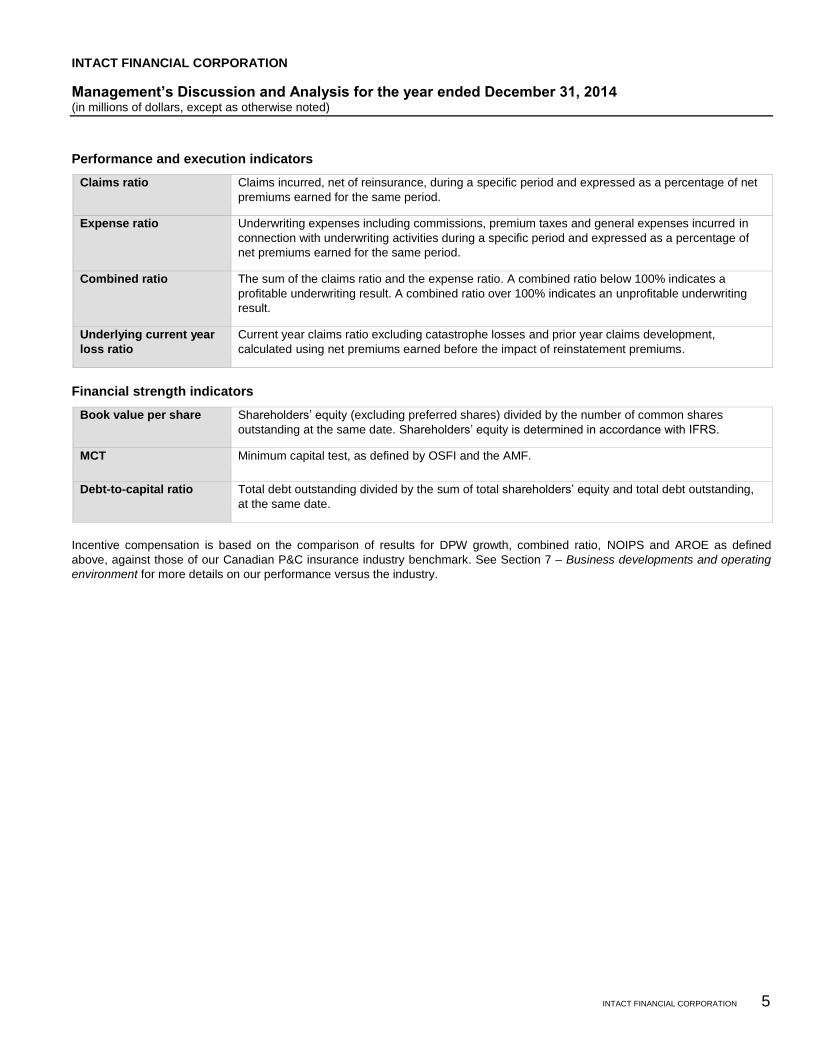
Performance and execution indicators
Claims ratio Claims incurred, net of reinsurance, during a specific period and expressed as a percentage of net
premiums earned for the same period.
Expense ratio Underwriting expenses including commissions, premium taxes and general expenses incurred in
connection with underwriting activities during a specific period and expressed as a percentage of
net premiums earned for the same period.
Combined ratio The sum of the claims ratio and the expense ratio. A combined ratio below 100% indicates a
profitable underwriting result. A combined ratio over 100% indicates an unprofitable underwriting
result.
Underlying current year
loss ratio
Current year claims ratio excluding catastrophe losses and prior year claims development,
calculated using net premiums earned before the impact of reinstatement premiums.
Financial strength indicators
Book value per share Shareholders’ equity (excluding preferred shares) divided by the number of common shares
outstanding at the same date. Shareholders’ equity is determined in accordance with IFRS.
MCT Minimum capital test, as defined by OSFI and the AMF.
Debt-to-capital ratio Total debt outstanding divided by the sum of total shareholders’ equity and total debt outstanding,
at the same date.
Incentive compensation is based on the comparison of results for DPW growth, combined ratio, NOIPS and AROE as defined
above, against those of our Canadian P&C insurance industry benchmark. See Section 7 – Business developments and operating
environment for more details on our performance versus the industry.
INTACT FINANCIAL CORPORATION
Management’s Discussion and Analysis for the year ended December 31, 2014 (in millions of dollars, except as otherwise noted)
6 INTACT FINANCIAL CORPORATION
Section 3 – Overview of our consolidated performance
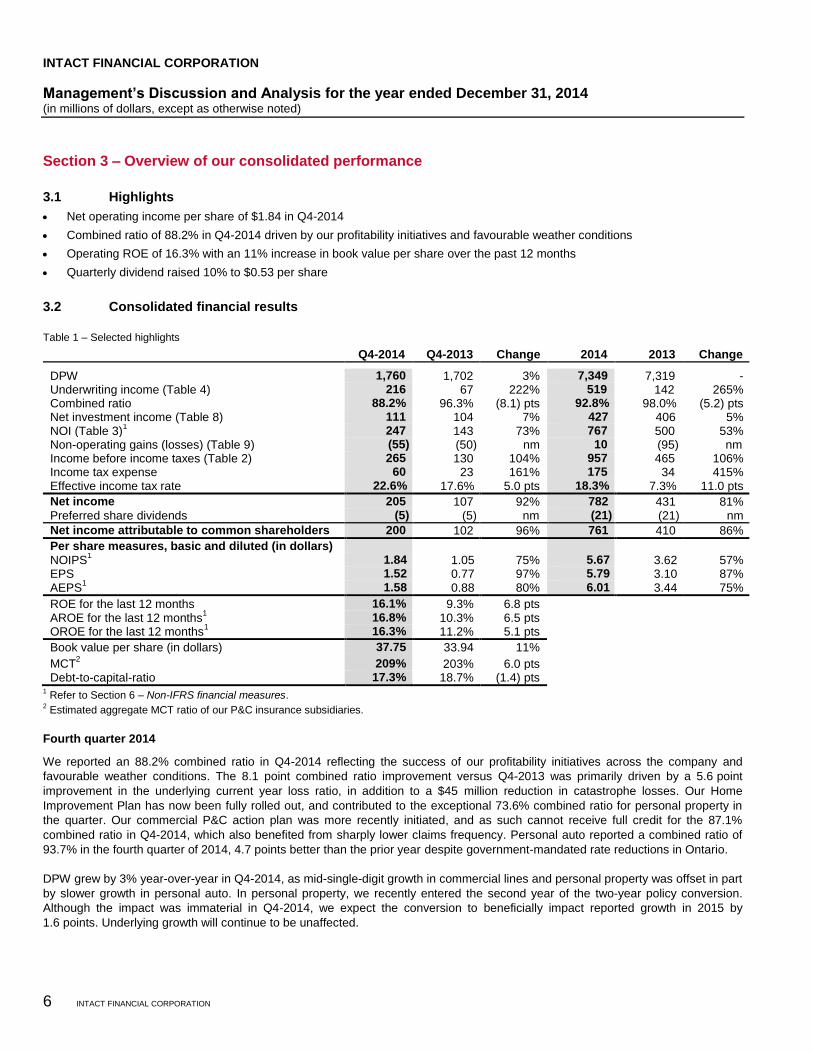
3.1 Highlights
Net operating income per share of $1.84 in Q4-2014
Combined ratio of 88.2% in Q4-2014 driven by our profitability initiatives and favourable weather conditions
Operating ROE of 16.3% with an 11% increase in book value per share over the past 12 months
Quarterly dividend raised 10% to $0.53 per share
3.2 Consolidated financial results
Table 1 – Selected highlights
Q4-2014 Q4-2013 Change 2014 2013 Change
DPW 1,760 1,702 3% 7,349 7,319 - Underwriting income (Table 4) 216 67 222% 519 142 265% Combined ratio 88.2% 96.3% (8.1) pts 92.8% 98.0% (5.2) pts Net investment income (Table 8) 111 104 7% 427 406 5% NOI (Table 3)
1 247 143 73% 767 500 53%
Non-operating gains (losses) (Table 9) (55) (50) nm 10 (95) nm Income before income taxes (Table 2) 265 130 104% 957 465 106% Income tax expense 60 23 161% 175 34 415% Effective income tax rate 22.6% 17.6% 5.0 pts 18.3% 7.3% 11.0 pts
Net income 205 107 92% 782 431 81% Preferred share dividends (5) (5) nm (21) (21) nm
Net income attributable to common shareholders 200 102 96% 761 410 86%
Per share measures, basic and diluted (in dollars) NOIPS
1 1.84 1.05 75% 5.67 3.62 57%
EPS 1.52 0.77 97% 5.79 3.10 87% AEPS
1 1.58 0.88 80% 6.01 3.44 75%
ROE for the last 12 months 16.1% 9.3% 6.8 pts AROE for the last 12 months
1 16.8% 10.3% 6.5 pts
OROE for the last 12 months1 16.3% 11.2% 5.1 pts
Book value per share (in dollars) 37.75 33.94 11%
MCT2 209% 203% 6.0 pts
Debt-to-capital-ratio 17.3% 18.7% (1.4) pts 1 Refer to Section 6 – Non-IFRS financial measures.
2 Estimated aggregate MCT ratio of our P&C insurance subsidiaries.
Fourth quarter 2014
We reported an 88.2% combined ratio in Q4-2014 reflecting the success of our profitability initiatives across the company and
favourable weather conditions. The 8.1 point combined ratio improvement versus Q4-2013 was primarily driven by a 5.6 point
improvement in the underlying current year loss ratio, in addition to a $45 million reduction in catastrophe losses. Our Home
Improvement Plan has now been fully rolled out, and contributed to the exceptional 73.6% combined ratio for personal property in
the quarter. Our commercial P&C action plan was more recently initiated, and as such cannot receive full credit for the 87.1%
combined ratio in Q4-2014, which also benefited from sharply lower claims frequency. Personal auto reported a combined ratio of
93.7% in the fourth quarter of 2014, 4.7 points better than the prior year despite government-mandated rate reductions in Ontario.
DPW grew by 3% year-over-year in Q4-2014, as mid-single-digit growth in commercial lines and personal property was offset in part
by slower growth in personal auto. In personal property, we recently entered the second year of the two-year policy conversion.
Although the impact was immaterial in Q4-2014, we expect the conversion to beneficially impact reported growth in 2015 by
1.6 points. Underlying growth will continue to be unaffected.
INTACT FINANCIAL CORPORATION
Management’s Discussion and Analysis for the year ended December 31, 2014 (in millions of dollars, except as otherwise noted)
INTACT FINANCIAL CORPORATION 7
Net investment income of $111 million in the fourth quarter of 2014 was up 7% from Q4-2013. The unusually high level of income
was the result of higher average investments and favourable timing of expenses, partly offset by the decline in yields. Investments
amounted to $13.4 billion and were up $1.1 billion, or 10%, from a year ago and up $0.2 billion from Q3-2014.
Our financial position remained strong at the end of Q4-2014, with an estimated MCT of 209% and book value per share of $37.75,
11% higher than a year ago. Our debt-to-capital ratio at the end of the quarter was 17.3%, better than our internal target level of
20%. We reported an operating ROE of 16.3% in 2014, while maintaining significant levels of excess capital throughout the year
($681 million at year end).
Full year 2014
Underwriting income grew significantly from $142 million in 2013 to $519 million in 2014, driven by a $243 million decline in
catastrophe losses and an improved underlying current year loss ratio, resulting in a combined ratio of 92.8% versus 98.0% in 2013.
We generated underlying DPW growth of 1.6% in 2014 despite corrective actions taken to improve profitability, reductions in our
earthquake exposure and the impact of government-mandated rate reductions in Ontario personal auto.
Net investment income of $427 million in 2014 was up 5% from a year ago due to the growth in investments.
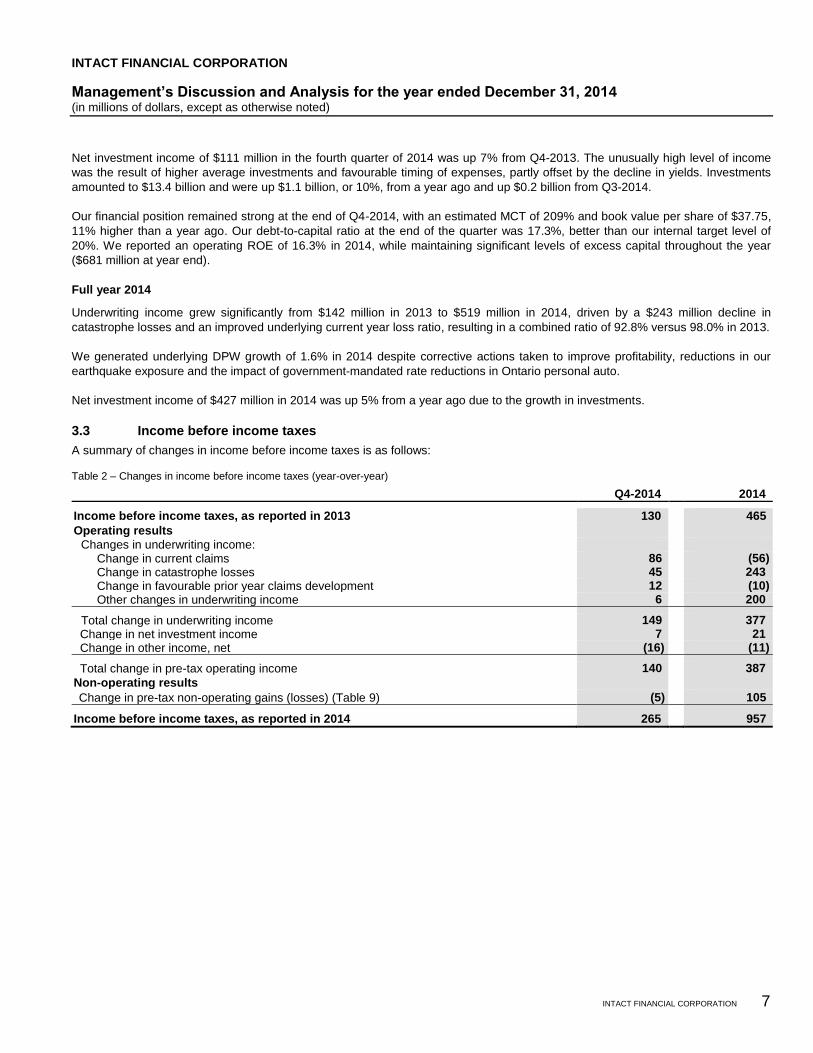
3.3 Income before income taxes
A summary of changes in income before income taxes is as follows:
Table 2 – Changes in income before income taxes (year-over-year)
Q4-2014 2014
Income before income taxes, as reported in 2013 130 465
Operating results
Changes in underwriting income:
Change in current claims 86 (56)
Change in catastrophe losses 45 243
Change in favourable prior year claims development 12 (10)
Other changes in underwriting income 6 200
Total change in underwriting income 149 377
Change in net investment income 7 21
Change in other income, net (16) (11)
Total change in pre-tax operating income 140 387
Non-operating results
Change in pre-tax non-operating gains (losses) (Table 9) (5) 105
Income before income taxes, as reported in 2014 265 957
INTACT FINANCIAL CORPORATION
Management’s Discussion and Analysis for the year ended December 31, 2014 (in millions of dollars, except as otherwise noted)
8 INTACT FINANCIAL CORPORATION
Section 4 – Operating results
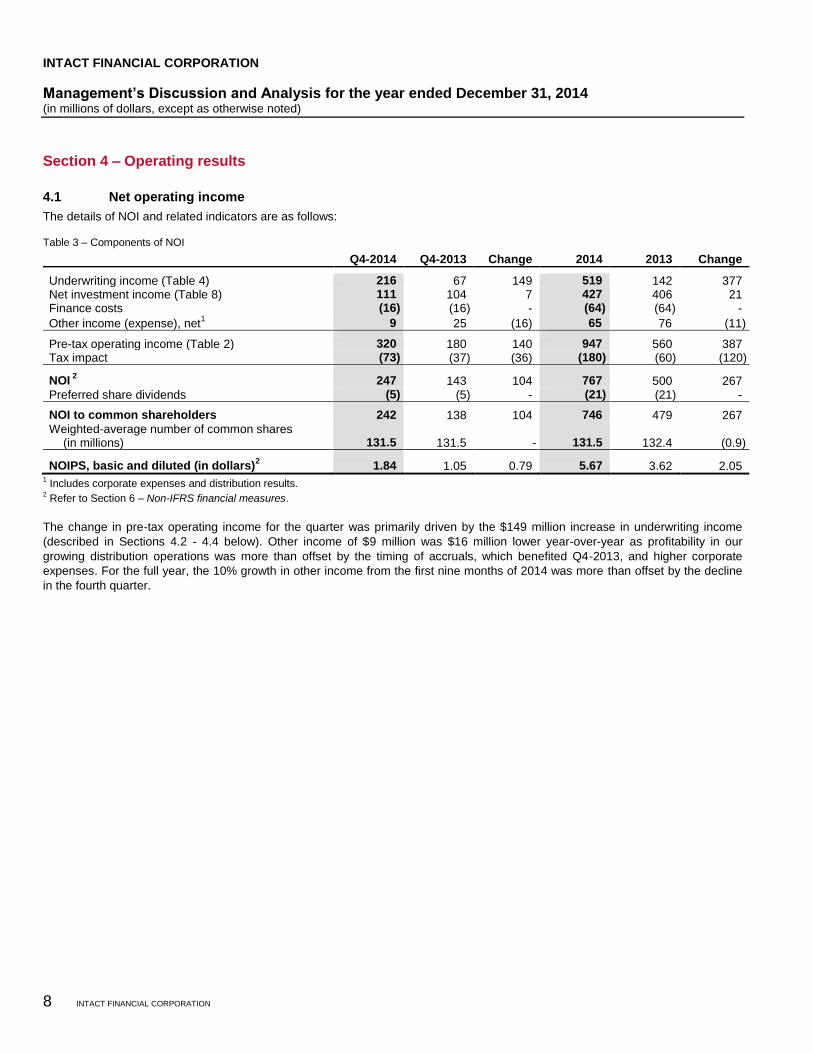
4.1 Net operating income
The details of NOI and related indicators are as follows:
Table 3 – Components of NOI
Q4-2014 Q4-2013 Change 2014 2013 Change
Underwriting income (Table 4) 216 67 149 519 142 377 Net investment income (Table 8) 111 104 7 427 406 21 Finance costs (16) (16) - (64) (64) -
Other income (expense), net1 9 25 (16) 65 76 (11)
Pre-tax operating income (Table 2) 320 180 140 947 560 387 Tax impact (73) (37) (36) (180) (60) (120)
NOI 2
247 143 104 767 500 267 Preferred share dividends (5) (5) - (21) (21) -
NOI to common shareholders 242 138 104 746 479 267 Weighted-average number of common shares
(in millions) 131.5 131.5 - 131.5 132.4 (0.9)
NOIPS, basic and diluted (in dollars)2 1.84 1.05 0.79 5.67 3.62 2.05
1 Includes corporate expenses and distribution results.
2 Refer to Section 6 – Non-IFRS financial measures.
The change in pre-tax operating income for the quarter was primarily driven by the $149 million increase in underwriting income
(described in Sections 4.2 - 4.4 below). Other income of $9 million was $16 million lower year-over-year as profitability in our
growing distribution operations was more than offset by the timing of accruals, which benefited Q4-2013, and higher corporate
expenses. For the full year, the 10% growth in other income from the first nine months of 2014 was more than offset by the decline
in the fourth quarter.
INTACT FINANCIAL CORPORATION
Management’s Discussion and Analysis for the year ended December 31, 2014 (in millions of dollars, except as otherwise noted)
INTACT FINANCIAL CORPORATION 9
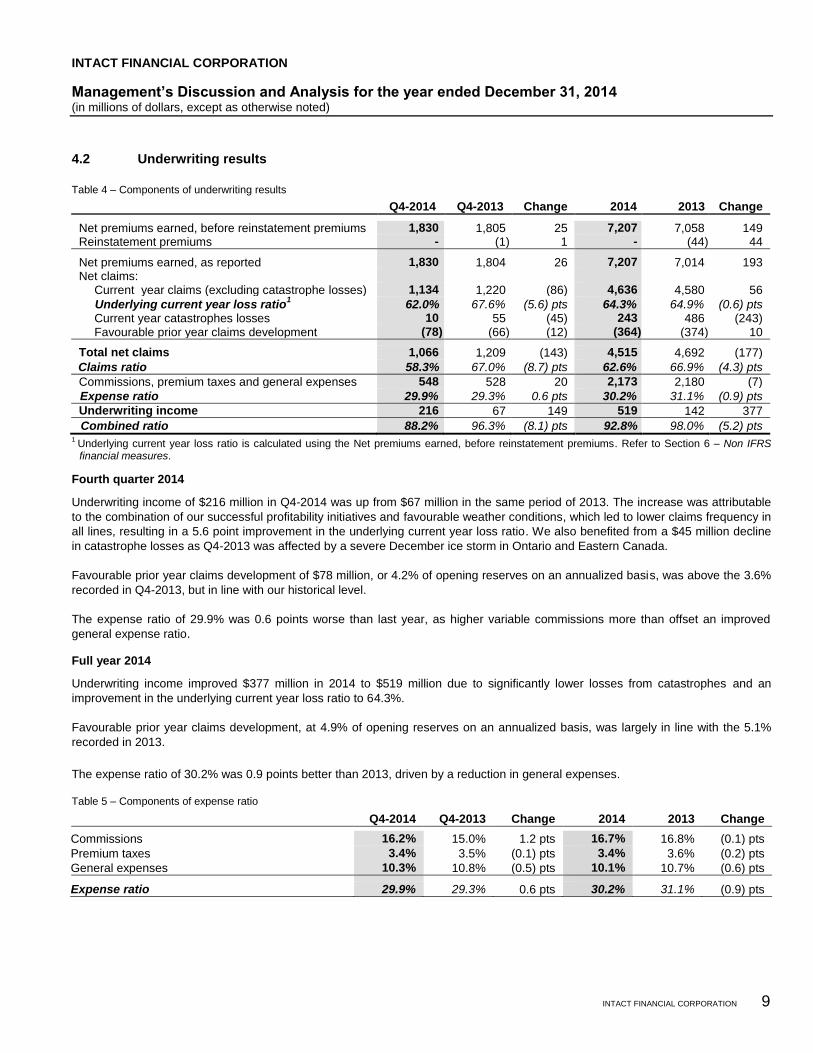
4.2 Underwriting results
Table 4 – Components of underwriting results
Q4-2014 Q4-2013 Change 2014 2013 Change
Net premiums earned, before reinstatement premiums 1,830 1,805 25 7,207 7,058 149 Reinstatement premiums - (1) 1 - (44) 44
Net premiums earned, as reported 1,830 1,804 26 7,207 7,014 193 Net claims: Current year claims (excluding catastrophe losses) 1,134 1,220 (86) 4,636 4,580 56
Underlying current year loss ratio1 62.0% 67.6% (5.6) pts 64.3% 64.9% (0.6) pts
Current year catastrophes losses 10 55 (45) 243 486 (243) Favourable prior year claims development (78) (66) (12) (364) (374) 10
Total net claims 1,066 1,209 (143) 4,515 4,692 (177)
Claims ratio 58.3% 67.0% (8.7) pts 62.6% 66.9% (4.3) pts
Commissions, premium taxes and general expenses 548 528 20 2,173 2,180 (7)
Expense ratio 29.9% 29.3% 0.6 pts 30.2% 31.1% (0.9) pts
Underwriting income 216 67 149 519 142 377
Combined ratio 88.2% 96.3% (8.1) pts 92.8% 98.0% (5.2) pts 1 Underlying current year loss ratio is calculated using the Net premiums earned, before reinstatement premiums. Refer to Section 6 – Non IFRS financial measures.
Fourth quarter 2014
Underwriting income of $216 million in Q4-2014 was up from $67 million in the same period of 2013. The increase was attributable
to the combination of our successful profitability initiatives and favourable weather conditions, which led to lower claims frequency in
all lines, resulting in a 5.6 point improvement in the underlying current year loss ratio. We also benefited from a $45 million decline
in catastrophe losses as Q4-2013 was affected by a severe December ice storm in Ontario and Eastern Canada.
Favourable prior year claims development of $78 million, or 4.2% of opening reserves on an annualized basis, was above the 3.6%
recorded in Q4-2013, but in line with our historical level.
The expense ratio of 29.9% was 0.6 points worse than last year, as higher variable commissions more than offset an improved
general expense ratio.
Full year 2014
Underwriting income improved $377 million in 2014 to $519 million due to significantly lower losses from catastrophes and an
improvement in the underlying current year loss ratio to 64.3%.
Favourable prior year claims development, at 4.9% of opening reserves on an annualized basis, was largely in line with the 5.1%
recorded in 2013.
The expense ratio of 30.2% was 0.9 points better than 2013, driven by a reduction in general expenses.
Table 5 – Components of expense ratio
Q4-2014 Q4-2013 Change 2014 2013 Change
p Commissions 16.2% 15.0% 1.2 pts 16.7% 16.8% (0.1) pts
Premium taxes 3.4% 3.5% (0.1) pts 3.4% 3.6% (0.2) pts
General expenses 10.3% 10.8% (0.5) pts 10.1% 10.7% (0.6) pts
Expense ratio 29.9% 29.3% 0.6 pts 30.2% 31.1% (0.9) pts
INTACT FINANCIAL CORPORATION
Management’s Discussion and Analysis for the year ended December 31, 2014 (in millions of dollars, except as otherwise noted)
10 INTACT FINANCIAL CORPORATION
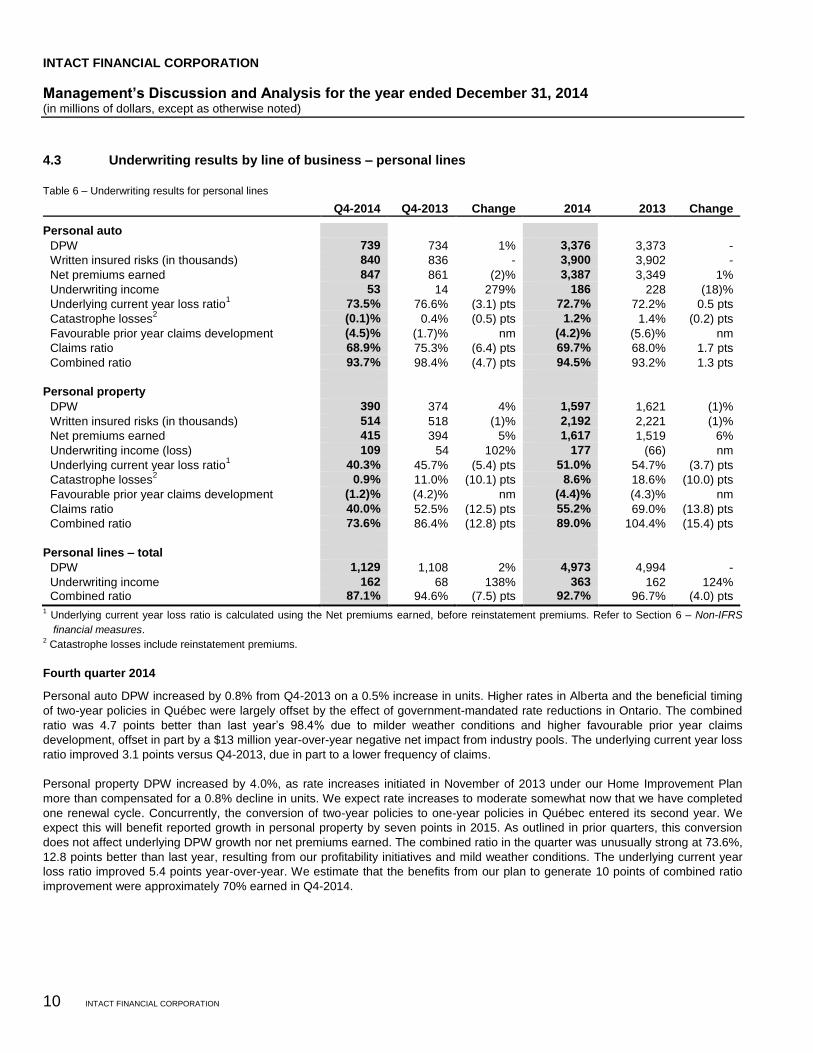
4.3 Underwriting results by line of business – personal lines
Table 6 – Underwriting results for personal lines
Q4-2014 Q4-2013 Change 2014 2013 Change
Personal auto
DPW 739 734 1% 3,376 3,373 -
Written insured risks (in thousands) 840 836 - 3,900 3,902 -
Net premiums earned 847 861 (2)% 3,387 3,349 1%
Underwriting income 53 14 279% 186 228 (18)%
Underlying current year loss ratio1 73.5% 76.6% (3.1) pts 72.7% 72.2% 0.5 pts
Catastrophe losses2 (0.1)% 0.4% (0.5) pts 1.2% 1.4% (0.2) pts
Favourable prior year claims development (4.5)% (1.7)% nm (4.2)% (5.6)% nm
Claims ratio 68.9% 75.3% (6.4) pts 69.7% 68.0% 1.7 pts
Combined ratio 93.7% 98.4% (4.7) pts 94.5% 93.2% 1.3 pts
Personal property
DPW 390 374 4% 1,597 1,621 (1)%
Written insured risks (in thousands) 514 518 (1)% 2,192 2,221 (1)%
Net premiums earned 415 394 5% 1,617 1,519 6%
Underwriting income (loss) 109 54 102% 177 (66) nm
Underlying current year loss ratio1 40.3% 45.7% (5.4) pts 51.0% 54.7% (3.7) pts
Catastrophe losses2 0.9% 11.0% (10.1) pts 8.6% 18.6% (10.0) pts
Favourable prior year claims development (1.2)% (4.2)% nm (4.4)% (4.3)% nm
Claims ratio 40.0% 52.5% (12.5) pts 55.2% 69.0% (13.8) pts
Combined ratio 73.6% 86.4% (12.8) pts 89.0% 104.4% (15.4) pts
Personal lines – total
DPW 1,129 1,108 2% 4,973 4,994 -
Underwriting income 162 68 138% 363 162 124% Combined ratio 87.1% 94.6% (7.5) pts 92.7% 96.7% (4.0) pts 1 Underlying current year loss ratio is calculated using the Net premiums earned, before reinstatement premiums. Refer to Section 6 – Non-IFRS
financial measures. 2 Catastrophe losses include reinstatement premiums.
Fourth quarter 2014
Personal auto DPW increased by 0.8% from Q4-2013 on a 0.5% increase in units. Higher rates in Alberta and the beneficial timing
of two-year policies in Québec were largely offset by the effect of government-mandated rate reductions in Ontario. The combined
ratio was 4.7 points better than last year’s 98.4% due to milder weather conditions and higher favourable prior year claims
development, offset in part by a $13 million year-over-year negative net impact from industry pools. The underlying current year loss
ratio improved 3.1 points versus Q4-2013, due in part to a lower frequency of claims.
Personal property DPW increased by 4.0%, as rate increases initiated in November of 2013 under our Home Improvement Plan
more than compensated for a 0.8% decline in units. We expect rate increases to moderate somewhat now that we have completed
one renewal cycle. Concurrently, the conversion of two-year policies to one-year policies in Québec entered its second year. We
expect this will benefit reported growth in personal property by seven points in 2015. As outlined in prior quarters, this conversion
does not affect underlying DPW growth nor net premiums earned. The combined ratio in the quarter was unusually strong at 73.6%,
12.8 points better than last year, resulting from our profitability initiatives and mild weather conditions. The underlying current year
loss ratio improved 5.4 points year-over-year. We estimate that the benefits from our plan to generate 10 points of combined ratio
improvement were approximately 70% earned in Q4-2014.
INTACT FINANCIAL CORPORATION
Management’s Discussion and Analysis for the year ended December 31, 2014 (in millions of dollars, except as otherwise noted)
INTACT FINANCIAL CORPORATION 11
Full year 2014
Personal auto DPW was unchanged from 2013, as continued growth in our direct-to-consumer business was offset by the impact of
government-mandated rate reductions in Ontario. Through both our own and government-facilitated cost reduction initiatives, we
were able to protect our margins in Ontario, resulting in a personal auto combined ratio of 94.5% across all regions for the full year
2014. Compared to 2013, our combined ratio was 1.3 points worse, affected by difficult winter conditions in Q1-2014 and a
$28 million year-over-year negative net impact from industry pools.
Personal property reported DPW declined 1.5%, negatively impacted by the conversion of two-year policies to one-year policies,
while underlying growth was 4.9%. Underwriting results of 89.0% represent an impressive 15.4 point improvement from 2013,
largely the result of significantly higher catastrophe losses in 2013 and the positive impact of our Home Improvement Plan on 2014
results.
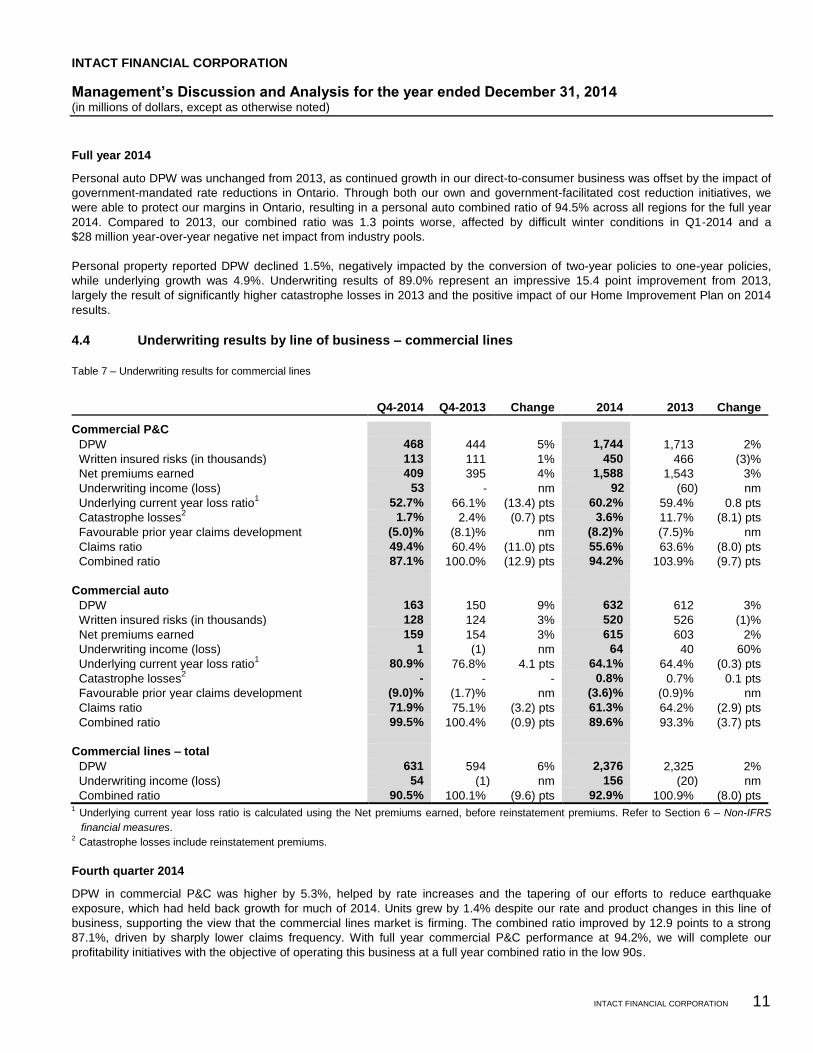
4.4 Underwriting results by line of business – commercial lines
Table 7 – Underwriting results for commercial lines
Q4-2014 Q4-2013 Change 2014 2013 Change
Commercial P&C
DPW 468 444 5% 1,744 1,713 2%
Written insured risks (in thousands) 113 111 1% 450 466 (3)%
Net premiums earned 409 395 4% 1,588 1,543 3%
Underwriting income (loss) 53 - nm 92 (60) nm
Underlying current year loss ratio1 52.7% 66.1% (13.4) pts 60.2% 59.4% 0.8 pts
Catastrophe losses2 1.7% 2.4% (0.7) pts 3.6% 11.7% (8.1) pts
Favourable prior year claims development (5.0)% (8.1)% nm (8.2)% (7.5)% nm
Claims ratio 49.4% 60.4% (11.0) pts 55.6% 63.6% (8.0) pts
Combined ratio 87.1% 100.0% (12.9) pts 94.2% 103.9% (9.7) pts
Commercial auto
DPW 163 150 9% 632 612 3%
Written insured risks (in thousands) 128 124 3% 520 526 (1)%
Net premiums earned 159 154 3% 615 603 2%
Underwriting income (loss) 1 (1) nm 64 40 60%
Underlying current year loss ratio1 80.9% 76.8% 4.1 pts 64.1% 64.4% (0.3) pts
Catastrophe losses2 - - - 0.8% 0.7% 0.1 pts
Favourable prior year claims development (9.0)% (1.7)% nm (3.6)% (0.9)% nm
Claims ratio 71.9% 75.1% (3.2) pts 61.3% 64.2% (2.9) pts
Combined ratio 99.5% 100.4% (0.9) pts 89.6% 93.3% (3.7) pts
Commercial lines – total
DPW 631 594 6% 2,376 2,325 2%
Underwriting income (loss) 54 (1) nm 156 (20) nm
Combined ratio 90.5% 100.1% (9.6) pts 92.9% 100.9% (8.0) pts 1 Underlying current year loss ratio is calculated using the Net premiums earned, before reinstatement premiums. Refer to Section 6 – Non-IFRS
financial measures. 2
Catastrophe losses include reinstatement premiums.
Fourth quarter 2014
DPW in commercial P&C was higher by 5.3%, helped by rate increases and the tapering of our efforts to reduce earthquake
exposure, which had held back growth for much of 2014. Units grew by 1.4% despite our rate and product changes in this line of
business, supporting the view that the commercial lines market is firming. The combined ratio improved by 12.9 points to a strong
87.1%, driven by sharply lower claims frequency. With full year commercial P&C performance at 94.2%, we will complete our
profitability initiatives with the objective of operating this business at a full year combined ratio in the low 90s.
INTACT FINANCIAL CORPORATION
Management’s Discussion and Analysis for the year ended December 31, 2014 (in millions of dollars, except as otherwise noted)
12 INTACT FINANCIAL CORPORATION
Commercial auto DPW was up 8.8% from a year ago, despite competitive market conditions, as we benefited from strong growth in
trucking fleets. The combined ratio of 99.5% was 0.9 points better than Q4-2013, as favourable weather conditions were offset by
an increase in claims severity.
Full year 2014
Commercial P&C DPW grew by 2%, as continued rate increases more than offset the effect on growth from our actions to improve
profitability. The combined ratio improved by 9.7 points in 2014 to 94.2%, primarily due to an 8.1 point reduction in catastrophe
losses.
Despite competitive market conditions in commercial auto, DPW increased by 3% in 2014 versus 2013. We generated a combined
ratio of 89.6% in 2014, nearly four points better than 2013, largely due to higher favourable prior year claims development. The
underlying current year loss ratio was relatively unchanged at 64.1%, versus 64.4% in 2013.
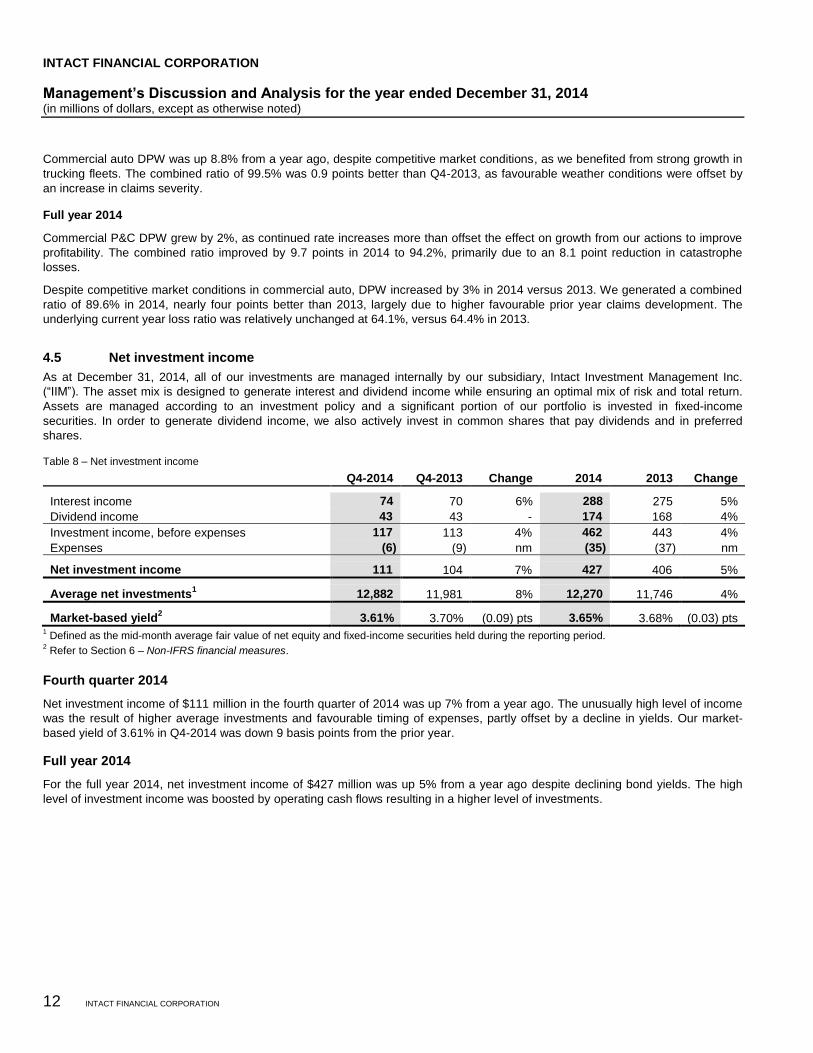
4.5 Net investment income
As at December 31, 2014, all of our investments are managed internally by our subsidiary, Intact Investment Management Inc.
(“IIM”). The asset mix is designed to generate interest and dividend income while ensuring an optimal mix of risk and total return.
Assets are managed according to an investment policy and a significant portion of our portfolio is invested in fixed-income
securities. In order to generate dividend income, we also actively invest in common shares that pay dividends and in preferred
shares.
Table 8 – Net investment income
Q4-2014 Q4-2013 Change 2014 2013 Change
Interest income 74 70 6% 288 275 5%
Dividend income 43 43 - 174 168 4%
Investment income, before expenses 117 113 4% 462 443 4%
Expenses (6) (9) nm (35) (37) nm
Net investment income 111 104 7% 427 406 5%
Average net investments1 12,882 11,981 8% 12,270 11,746 4%
Market-based yield2 3.61% 3.70% (0.09) pts 3.65% 3.68% (0.03) pts
1 Defined as the mid-month average fair value of net equity and fixed-income securities held during the reporting period.
2 Refer to Section 6 – Non-IFRS financial measures.
Fourth quarter 2014
Net investment income of $111 million in the fourth quarter of 2014 was up 7% from a year ago. The unusually high level of income
was the result of higher average investments and favourable timing of expenses, partly offset by a decline in yields. Our market-
based yield of 3.61% in Q4-2014 was down 9 basis points from the prior year.
Full year 2014
For the full year 2014, net investment income of $427 million was up 5% from a year ago despite declining bond yields. The high
level of investment income was boosted by operating cash flows resulting in a higher level of investments.
INTACT FINANCIAL CORPORATION
Management’s Discussion and Analysis for the year ended December 31, 2014 (in millions of dollars, except as otherwise noted)
INTACT FINANCIAL CORPORATION 13
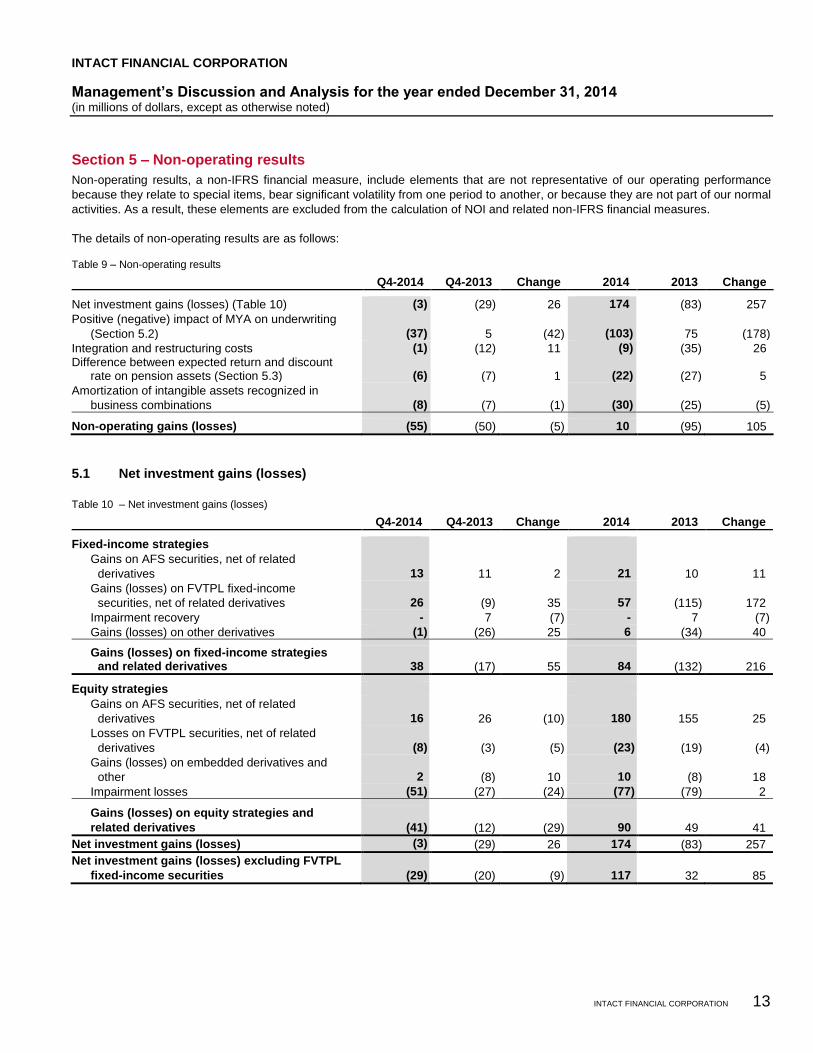
Section 5 – Non-operating results
Non-operating results, a non-IFRS financial measure, include elements that are not representative of our operating performance
because they relate to special items, bear significant volatility from one period to another, or because they are not part of our normal
activities. As a result, these elements are excluded from the calculation of NOI and related non-IFRS financial measures.
The details of non-operating results are as follows:
Table 9 – Non-operating results
Q4-2014 Q4-2013 Change 2014 2013 Change
Net investment gains (losses) (Table 10) (3) (29) 26 174 (83) 257
Positive (negative) impact of MYA on underwriting
(Section 5.2) (37) 5 (42) (103) 75 (178)
Integration and restructuring costs (1) (12) 11 (9) (35) 26 Difference between expected return and discount
rate on pension assets (Section 5.3) (6) (7) 1 (22) (27) 5
Amortization of intangible assets recognized in
business combinations (8) (7) (1) (30) (25) (5)
Non-operating gains (losses) (55) (50) (5) 10 (95) 105
5.1 Net investment gains (losses)
Table 10 – Net investment gains (losses)
Q4-2014 Q4-2013 Change 2014 2013 Change
Fixed-income strategies
Gains on AFS securities, net of related
derivatives 13 11 2 21 10 11
Gains (losses) on FVTPL fixed-income
securities, net of related derivatives 26 (9) 35 57 (115) 172
Impairment recovery - 7 (7) - 7 (7)
Gains (losses) on other derivatives (1) (26) 25 6 (34) 40
Gains (losses) on fixed-income strategies and related derivatives 38 (17) 55 84 (132) 216
Equity strategies
Gains on AFS securities, net of related
derivatives 16 26 (10) 180 155 25
Losses on FVTPL securities, net of related
derivatives (8) (3) (5) (23) (19) (4)
Gains (losses) on embedded derivatives and
other 2 (8) 10 10 (8) 18
Impairment losses (51) (27) (24) (77) (79) 2
Gains (losses) on equity strategies and
related derivatives (41) (12) (29) 90 49 41
Net investment gains (losses) (3) (29) 26 174 (83) 257
Net investment gains (losses) excluding FVTPL
fixed-income securities (29) (20) (9) 117 32 85
INTACT FINANCIAL CORPORATION
Management’s Discussion and Analysis for the year ended December 31, 2014 (in millions of dollars, except as otherwise noted)
14 INTACT FINANCIAL CORPORATION
Fourth quarter 2014
Higher bond prices in Q4-2014 helped offset some losses from lower equity markets, resulting in a net investment loss of $3 million
in Q4-2014. In contrast, Q4-2013 experienced rising interest rates and lower bond prices, resulting in a net investment loss of
$29 million. Excluding FVTPL fixed-income securities, net investment losses were $29 million in Q4-2014, driven by lower equity
prices and an impairment charge of $51 million.
Full year 2014
Net investment gains of $174 million in 2014 compared to losses of $83 million in 2013. Much of the variance from the prior year
relates to the prevailing bond yield environment, which led to gains on FVTPL fixed-income securities in 2014 of $57 million, versus
losses of $115 million in 2013. Excluding gains on FVTPL fixed-income securities, net investment gains were $117 million in 2014,
compared to gains of $32 million in 2013.
5.2 Impact of MYA on underwriting
Claims liabilities are discounted at the estimated market yield of the assets backing these liabilities. The impact of changes in the
discount rate used to discount claims liabilities based on the change in the market-based yield of the underlying assets is referred to
as MYA. The MYA to claims liabilities is partly offset by gains and losses on FVTPL fixed-income securities with the objective that
these items offset each other with a minimal overall impact to net income.
5.3 Difference between expected return and discount rate on pension assets
We continue to manage our pension asset investment portfolio with a target asset return based on a target asset allocation. We
continue to measure NOI using a pension expense based on the expected return on plan assets to better reflect our operating
performance. Any difference between the expected return on pension assets and the return based on the discount rate determined
at the beginning of the year is treated as a non-operating item.
Section 6 – Non-IFRS financial measures
Non-IFRS financial measures do not have standardized meanings prescribed by IFRS and may not be comparable to similar
measures used by other companies in our industry. These non-IFRS financial measures are used by management and financial
analysts to assess our performance. Further, they provide users with an enhanced understanding of our results and related trends
and increase transparency and clarity into the core results of the business.
— AEPS and AROE exclude the impact of amortization of intangible assets recognized in business combinations, integration and
restructuring costs, all on an after tax basis. We believe that these excluded items are not appropriate in assessing our underlying
performance.
— NOI, NOIPS and OROE exclude the impact of net investment gains (losses), the positive (negative) effect of MYA on underwriting,
the difference between expected return and discount rate on pension assets, the amortization of intangible assets recognized in
business combinations, and integration and restructuring costs. Investment gains and losses as well as the effect of MYA on
underwriting arise mostly from changes in market conditions, which can be volatile to earnings. We also exclude the difference
between expected return and discount rate on pension assets, as we believe the gap in these measures is not reflective of our
internal investment management expertise and management of our pension investment asset portfolio.
— The market-based yield represents the annualized total pre-tax investment income (before expenses), divided by the average fair
values of net equity and fixed-income securities held during the reporting period. This calculation provides users with a consistent
measure of our relative investment performance.
— The underlying current year loss ratio is our current year claims ratio excluding catastrophe losses, reinstatement premiums, and
prior year claims development. Catastrophe events are beyond our control, and as such, excluding them provides clearer insight
into our analysis of current year performance. See Section 4.2 – Underwriting results for a reconciliation of this non-IFRS financial
measure.
INTACT FINANCIAL CORPORATION
Management’s Discussion and Analysis for the year ended December 31, 2014 (in millions of dollars, except as otherwise noted)
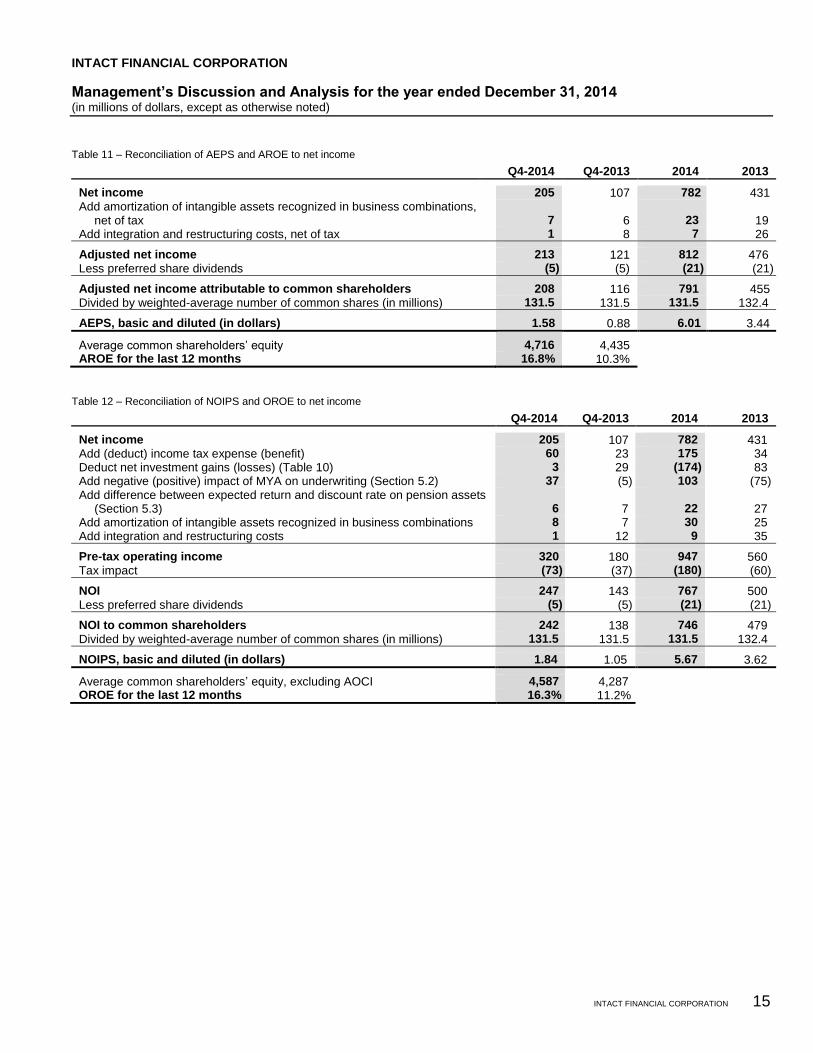
INTACT FINANCIAL CORPORATION 15
Table 11 – Reconciliation of AEPS and AROE to net income
Q4-2014 Q4-2013 2014 2013
Net income 205 107 782 431 Add amortization of intangible assets recognized in business combinations,
net of tax 7 6 23 19 Add integration and restructuring costs, net of tax 1 8 7 26
Adjusted net income 213 121 812 476 Less preferred share dividends (5) (5) (21) (21)
Adjusted net income attributable to common shareholders 208 116 791 455 Divided by weighted-average number of common shares (in millions) 131.5 131.5 131.5 132.4
AEPS, basic and diluted (in dollars) 1.58 0.88 6.01 3.44
Average common shareholders’ equity 4,716 4,435 AROE for the last 12 months 16.8% 10.3%
Table 12 – Reconciliation of NOIPS and OROE to net income
Q4-2014 Q4-2013 2014 2013
Net income 205 107 782 431 Add (deduct) income tax expense (benefit) 60 23 175 34 Deduct net investment gains (losses) (Table 10) 3 29 (174) 83 Add negative (positive) impact of MYA on underwriting (Section 5.2) 37 (5) 103 (75) Add difference between expected return and discount rate on pension assets
(Section 5.3) 6 7 22 27 Add amortization of intangible assets recognized in business combinations 8 7 30 25 Add integration and restructuring costs 1 12 9 35
Pre-tax operating income 320 180 947 560 Tax impact (73) (37) (180) (60)
NOI 247 143 767 500 Less preferred share dividends (5) (5) (21) (21)
NOI to common shareholders 242 138 746 479 Divided by weighted-average number of common shares (in millions) 131.5 131.5 131.5 132.4
NOIPS, basic and diluted (in dollars) 1.84 1.05 5.67 3.62
Average common shareholders’ equity, excluding AOCI 4,587 4,287 OROE for the last 12 months 16.3% 11.2%
INTACT FINANCIAL CORPORATION
Management’s Discussion and Analysis for the year ended December 31, 2014 (in millions of dollars, except as otherwise noted)
16 INTACT FINANCIAL CORPORATION
Section 7 – Business developments and operating environment
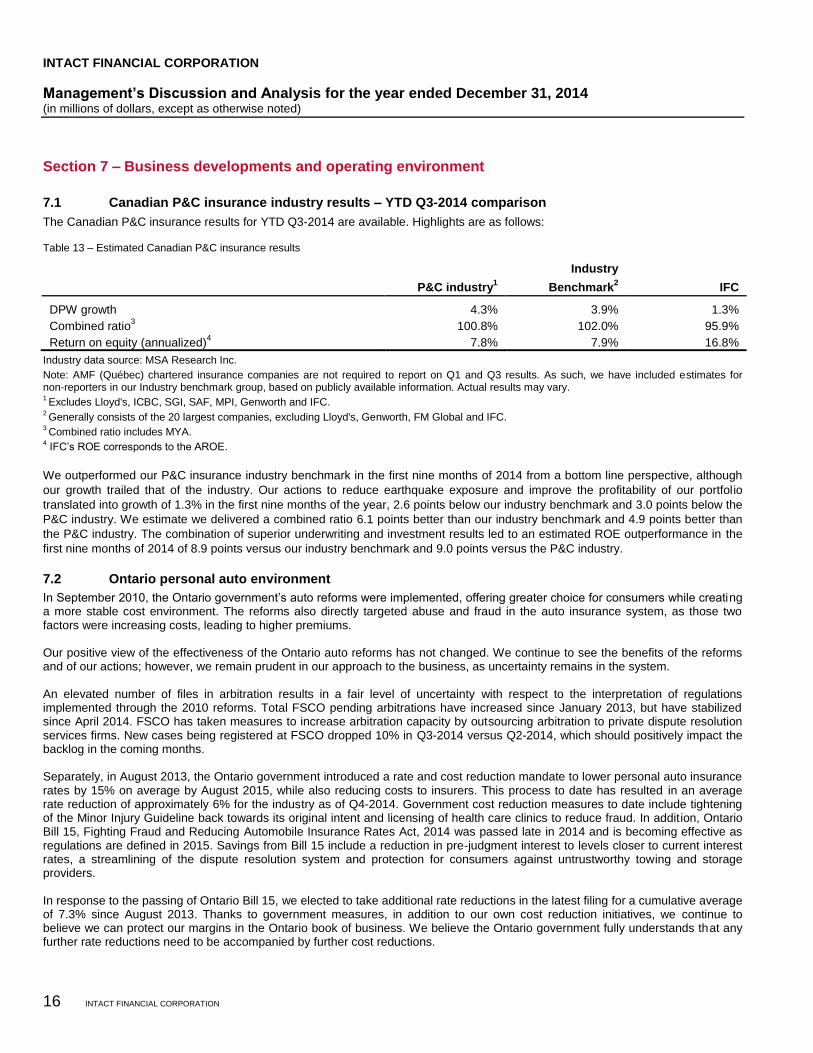
7.1 Canadian P&C insurance industry results – YTD Q3-2014 comparison
The Canadian P&C insurance results for YTD Q3-2014 are available. Highlights are as follows:
Table 13 – Estimated Canadian P&C insurance results
P&C industry1
Industry
Benchmark2 IFC
DPW growth 4.3% 3.9% 1.3%
Combined ratio3 100.8% 102.0% 95.9%
Return on equity (annualized)4 7.8% 7.9% 16.8%
Industry data source: MSA Research Inc.
Note: AMF (Québec) chartered insurance companies are not required to report on Q1 and Q3 results. As such, we have included estimates for non-reporters in our Industry benchmark group, based on publicly available information. Actual results may vary. 1 Excludes Lloyd's, ICBC, SGI, SAF, MPI, Genworth and IFC.
2 Generally consists of the 20 largest companies, excluding Lloyd's, Genworth, FM Global and IFC.
3 Combined ratio includes MYA.
4 IFC’s ROE corresponds to the AROE.
We outperformed our P&C insurance industry benchmark in the first nine months of 2014 from a bottom line perspective, although
our growth trailed that of the industry. Our actions to reduce earthquake exposure and improve the profitability of our portfolio
translated into growth of 1.3% in the first nine months of the year, 2.6 points below our industry benchmark and 3.0 points below the
P&C industry. We estimate we delivered a combined ratio 6.1 points better than our industry benchmark and 4.9 points better than
the P&C industry. The combination of superior underwriting and investment results led to an estimated ROE outperformance in the
first nine months of 2014 of 8.9 points versus our industry benchmark and 9.0 points versus the P&C industry.
7.2 Ontario personal auto environment
In September 2010, the Ontario government’s auto reforms were implemented, offering greater choice for consumers while creating a more stable cost environment. The reforms also directly targeted abuse and fraud in the auto insurance system, as those two factors were increasing costs, leading to higher premiums. Our positive view of the effectiveness of the Ontario auto reforms has not changed. We continue to see the benefits of the reforms and of our actions; however, we remain prudent in our approach to the business, as uncertainty remains in the system. An elevated number of files in arbitration results in a fair level of uncertainty with respect to the interpretation of regulations implemented through the 2010 reforms. Total FSCO pending arbitrations have increased since January 2013, but have stabilized since April 2014. FSCO has taken measures to increase arbitration capacity by outsourcing arbitration to private dispute resolution services firms. New cases being registered at FSCO dropped 10% in Q3-2014 versus Q2-2014, which should positively impact the backlog in the coming months. Separately, in August 2013, the Ontario government introduced a rate and cost reduction mandate to lower personal auto insurance rates by 15% on average by August 2015, while also reducing costs to insurers. This process to date has resulted in an average rate reduction of approximately 6% for the industry as of Q4-2014. Government cost reduction measures to date include tightening of the Minor Injury Guideline back towards its original intent and licensing of health care clinics to reduce fraud. In addition, Ontario Bill 15, Fighting Fraud and Reducing Automobile Insurance Rates Act, 2014 was passed late in 2014 and is becoming effective as regulations are defined in 2015. Savings from Bill 15 include a reduction in pre-judgment interest to levels closer to current interest rates, a streamlining of the dispute resolution system and protection for consumers against untrustworthy towing and storage providers. In response to the passing of Ontario Bill 15, we elected to take additional rate reductions in the latest filing for a cumulative average of 7.3% since August 2013. Thanks to government measures, in addition to our own cost reduction initiatives, we continue to believe we can protect our margins in the Ontario book of business. We believe the Ontario government fully understands that any further rate reductions need to be accompanied by further cost reductions.
INTACT FINANCIAL CORPORATION
Management’s Discussion and Analysis for the year ended December 31, 2014 (in millions of dollars, except as otherwise noted)
INTACT FINANCIAL CORPORATION 17
According to industry results, the claims ratio in Ontario personal auto for the first nine months of 2014 was 77.7%, improved significantly from 2010, but still reflective of an industry combined ratio above 100%. This indicates that a number of industry players continue to be in an underwriting loss position, such that further rate reductions in the absence of reforms would likely lead to availability issues for drivers.
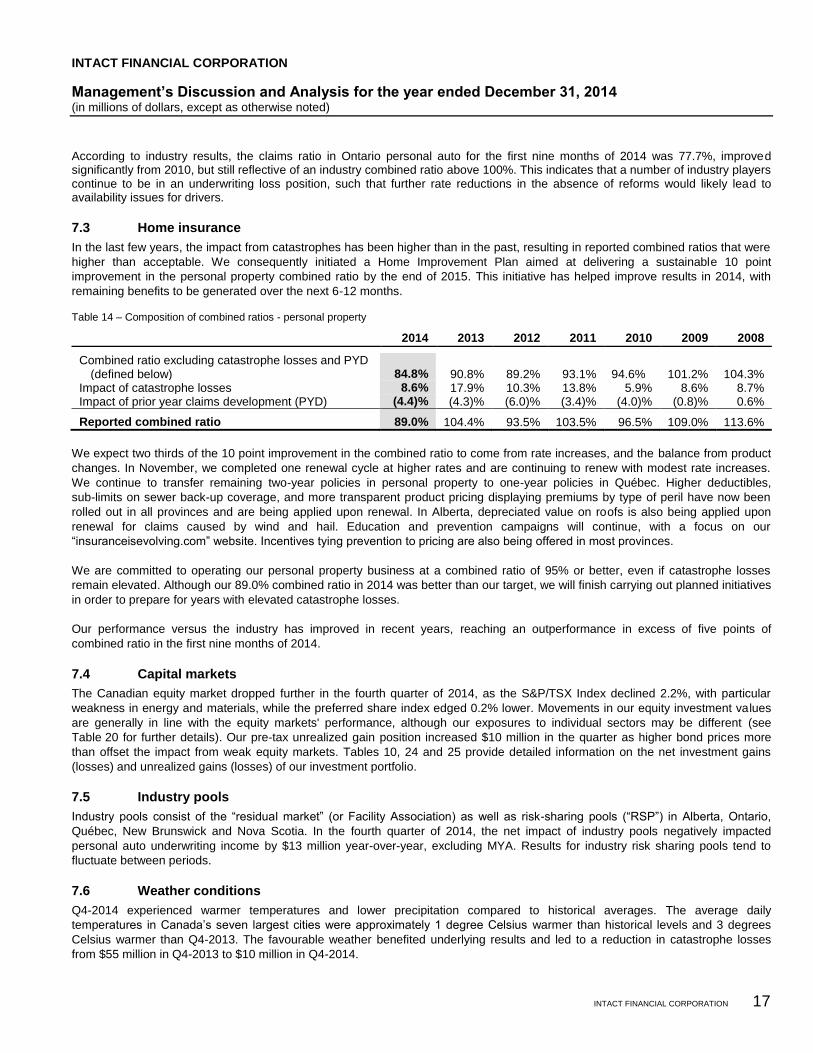
7.3 Home insurance
In the last few years, the impact from catastrophes has been higher than in the past, resulting in reported combined ratios that were
higher than acceptable. We consequently initiated a Home Improvement Plan aimed at delivering a sustainable 10 point
improvement in the personal property combined ratio by the end of 2015. This initiative has helped improve results in 2014, with
remaining benefits to be generated over the next 6-12 months.
Table 14 – Composition of combined ratios - personal property
2014 2013 2012 2011 2010 2009 2008
Combined ratio excluding catastrophe losses and PYD (defined below) 84.8% 90.8% 89.2% 93.1%
94.6% 101.2% 104.3%
Impact of catastrophe losses 8.6% 17.9% 10.3% 13.8% 5.9% 8.6% 8.7% Impact of prior year claims development (PYD) (4.4)% (4.3)% (6.0)% (3.4)% (4.0)% (0.8)% 0.6%
Reported combined ratio 89.0% 104.4% 93.5% 103.5% 96.5% 109.0% 113.6%
We expect two thirds of the 10 point improvement in the combined ratio to come from rate increases, and the balance from product
changes. In November, we completed one renewal cycle at higher rates and are continuing to renew with modest rate increases.
We continue to transfer remaining two-year policies in personal property to one-year policies in Québec. Higher deductibles,
sub-limits on sewer back-up coverage, and more transparent product pricing displaying premiums by type of peril have now been
rolled out in all provinces and are being applied upon renewal. In Alberta, depreciated value on roofs is also being applied upon
renewal for claims caused by wind and hail. Education and prevention campaigns will continue, with a focus on our
“insuranceisevolving.com” website. Incentives tying prevention to pricing are also being offered in most provinces.
We are committed to operating our personal property business at a combined ratio of 95% or better, even if catastrophe losses
remain elevated. Although our 89.0% combined ratio in 2014 was better than our target, we will finish carrying out planned initiatives
in order to prepare for years with elevated catastrophe losses.
Our performance versus the industry has improved in recent years, reaching an outperformance in excess of five points of
combined ratio in the first nine months of 2014.
7.4 Capital markets
The Canadian equity market dropped further in the fourth quarter of 2014, as the S&P/TSX Index declined 2.2%, with particular
weakness in energy and materials, while the preferred share index edged 0.2% lower. Movements in our equity investment values
are generally in line with the equity markets' performance, although our exposures to individual sectors may be different (see
Table 20 for further details). Our pre-tax unrealized gain position increased $10 million in the quarter as higher bond prices more
than offset the impact from weak equity markets. Tables 10, 24 and 25 provide detailed information on the net investment gains
(losses) and unrealized gains (losses) of our investment portfolio.
7.5 Industry pools
Industry pools consist of the “residual market” (or Facility Association) as well as risk-sharing pools (“RSP”) in Alberta, Ontario,
Québec, New Brunswick and Nova Scotia. In the fourth quarter of 2014, the net impact of industry pools negatively impacted
personal auto underwriting income by $13 million year-over-year, excluding MYA. Results for industry risk sharing pools tend to
fluctuate between periods.
7.6 Weather conditions
Q4-2014 experienced warmer temperatures and lower precipitation compared to historical averages. The average daily
temperatures in Canada’s seven largest cities were approximately 1 degree Celsius warmer than historical levels and 3 degrees
Celsius warmer than Q4-2013. The favourable weather benefited underlying results and led to a reduction in catastrophe losses
from $55 million in Q4-2013 to $10 million in Q4-2014.
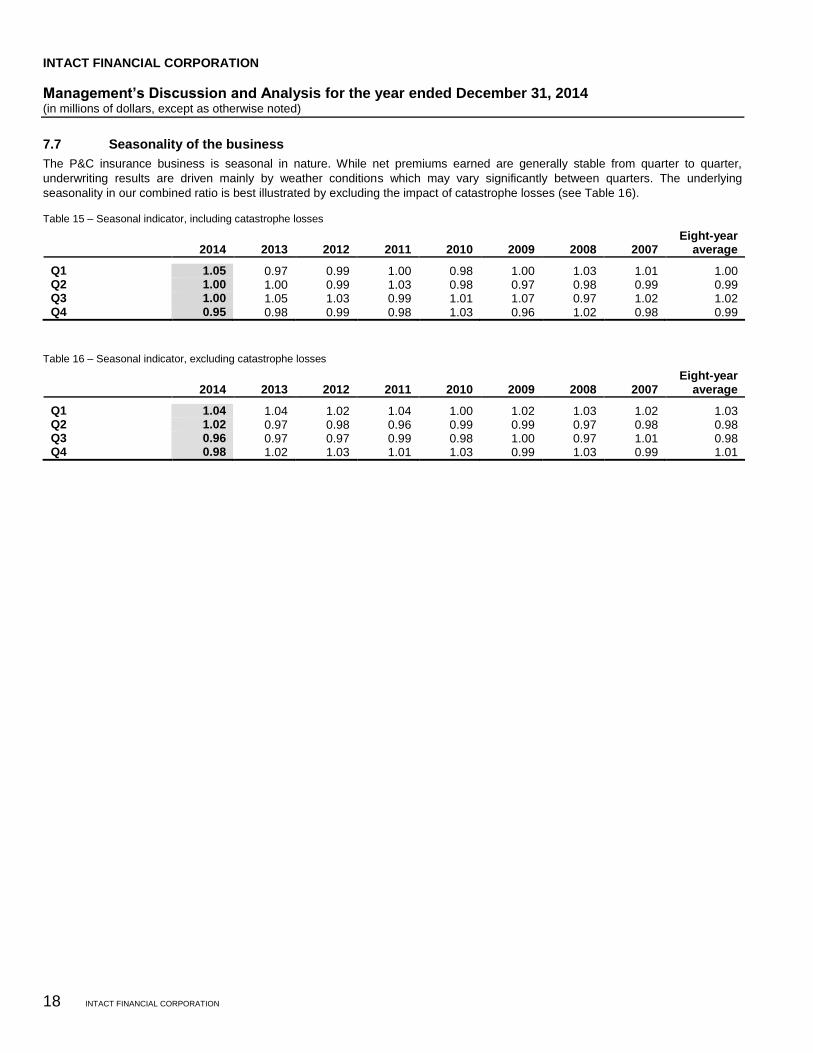
INTACT FINANCIAL CORPORATION
Management’s Discussion and Analysis for the year ended December 31, 2014 (in millions of dollars, except as otherwise noted)
18 INTACT FINANCIAL CORPORATION
7.7 Seasonality of the business
The P&C insurance business is seasonal in nature. While net premiums earned are generally stable from quarter to quarter,
underwriting results are driven mainly by weather conditions which may vary significantly between quarters. The underlying
seasonality in our combined ratio is best illustrated by excluding the impact of catastrophe losses (see Table 16).
Table 15 – Seasonal indicator, including catastrophe losses
2014 2013 2012 2011 2010 2009 2008 2007 Eight-year
average
Q1 1.05 0.97 0.99 1.00 0.98 1.00 1.03 1.01 1.00 Q2 1.00 1.00 0.99 1.03 0.98 0.97 0.98 0.99 0.99 Q3 1.00 1.05 1.03 0.99 1.01 1.07 0.97 1.02 1.02 Q4 0.95 0.98 0.99 0.98 1.03 0.96 1.02 0.98 0.99
Table 16 – Seasonal indicator, excluding catastrophe losses
2014 2013 2012 2011 2010 2009 2008 2007 Eight-year
average
Q1 1.04 1.04 1.02 1.04 1.00 1.02 1.03 1.02 1.03 Q2 1.02 0.97 0.98 0.96 0.99 0.99 0.97 0.98 0.98 Q3 0.96 0.97 0.97 0.99 0.98 1.00 0.97 1.01 0.98 Q4 0.98 1.02 1.03 1.01 1.03 0.99 1.03 0.99 1.01
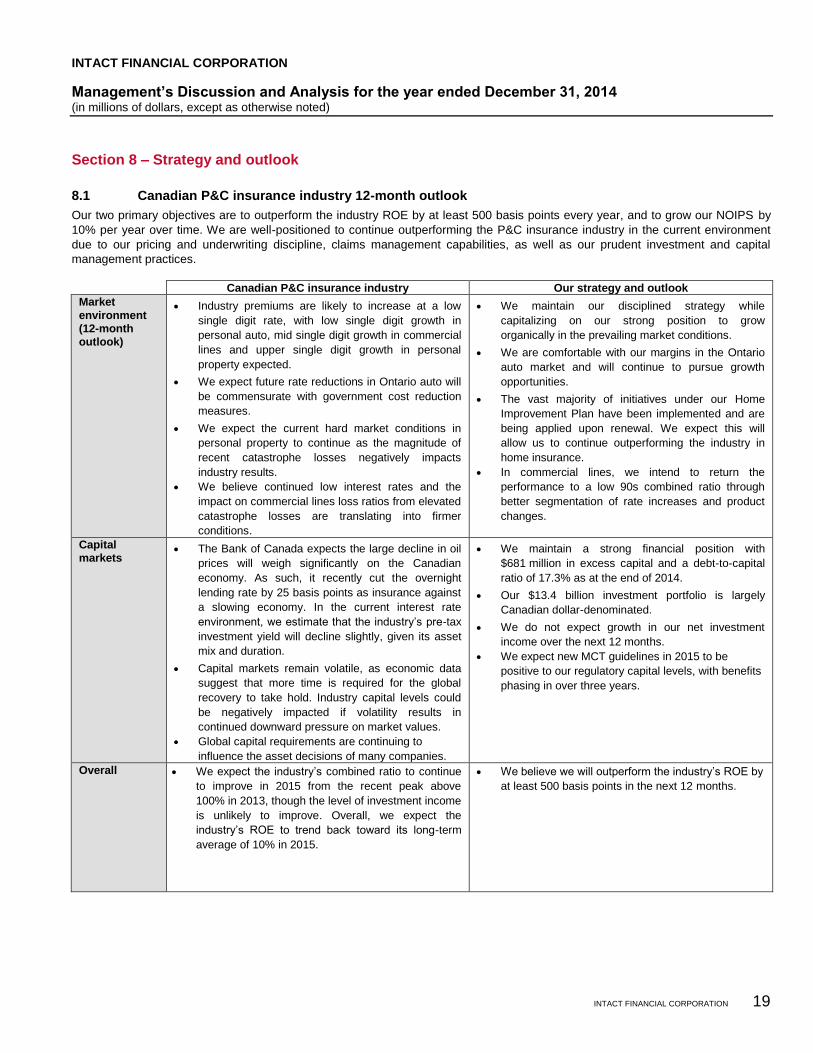
INTACT FINANCIAL CORPORATION
Management’s Discussion and Analysis for the year ended December 31, 2014 (in millions of dollars, except as otherwise noted)
INTACT FINANCIAL CORPORATION 19
Section 8 – Strategy and outlook
8.1 Canadian P&C insurance industry 12-month outlook
Our two primary objectives are to outperform the industry ROE by at least 500 basis points every year, and to grow our NOIPS by
10% per year over time. We are well-positioned to continue outperforming the P&C insurance industry in the current environment
due to our pricing and underwriting discipline, claims management capabilities, as well as our prudent investment and capital
management practices.
Canadian P&C insurance industry Our strategy and outlook
Market
environment (12-month
outlook)
Industry premiums are likely to increase at a low
single digit rate, with low single digit growth in
personal auto, mid single digit growth in commercial
lines and upper single digit growth in personal
property expected.
We expect future rate reductions in Ontario auto will
be commensurate with government cost reduction
measures.
We expect the current hard market conditions in
personal property to continue as the magnitude of
recent catastrophe losses negatively impacts
industry results.
We believe continued low interest rates and the
impact on commercial lines loss ratios from elevated
catastrophe losses are translating into firmer
conditions.
We maintain our disciplined strategy while
capitalizing on our strong position to grow
organically in the prevailing market conditions.
We are comfortable with our margins in the Ontario
auto market and will continue to pursue growth
opportunities.
The vast majority of initiatives under our Home
Improvement Plan have been implemented and are
being applied upon renewal. We expect this will
allow us to continue outperforming the industry in
home insurance.
In commercial lines, we intend to return the
performance to a low 90s combined ratio through
better segmentation of rate increases and product
changes.
Capital markets
The Bank of Canada expects the large decline in oil
prices will weigh significantly on the Canadian
economy. As such, it recently cut the overnight
lending rate by 25 basis points as insurance against
a slowing economy. In the current interest rate
environment, we estimate that the industry’s pre-tax
investment yield will decline slightly, given its asset
mix and duration.
Capital markets remain volatile, as economic data
suggest that more time is required for the global
recovery to take hold. Industry capital levels could
be negatively impacted if volatility results in
continued downward pressure on market values.
Global capital requirements are continuing to
influence the asset decisions of many companies.
We maintain a strong financial position with
$681 million in excess capital and a debt-to-capital
ratio of 17.3% as at the end of 2014.
Our $13.4 billion investment portfolio is largely
Canadian dollar-denominated.
We do not expect growth in our net investment
income over the next 12 months.
We expect new MCT guidelines in 2015 to be
positive to our regulatory capital levels, with benefits
phasing in over three years.
Overall We expect the industry’s combined ratio to continue
to improve in 2015 from the recent peak above
100% in 2013, though the level of investment income
is unlikely to improve. Overall, we expect the
industry’s ROE to trend back toward its long-term
average of 10% in 2015.
We believe we will outperform the industry’s ROE by
at least 500 basis points in the next 12 months.
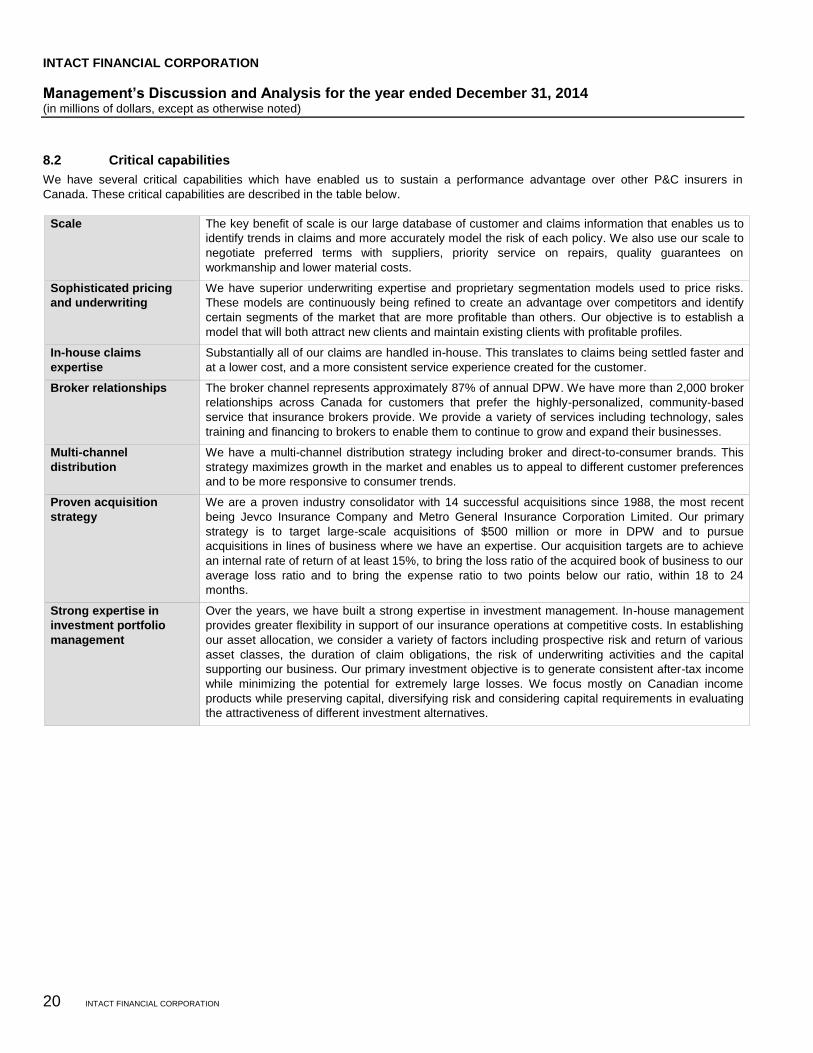
INTACT FINANCIAL CORPORATION
Management’s Discussion and Analysis for the year ended December 31, 2014 (in millions of dollars, except as otherwise noted)
20 INTACT FINANCIAL CORPORATION
8.2 Critical capabilities
We have several critical capabilities which have enabled us to sustain a performance advantage over other P&C insurers in
Canada. These critical capabilities are described in the table below.
Scale The key benefit of scale is our large database of customer and claims information that enables us to
identify trends in claims and more accurately model the risk of each policy. We also use our scale to
negotiate preferred terms with suppliers, priority service on repairs, quality guarantees on
workmanship and lower material costs.
Sophisticated pricing
and underwriting
We have superior underwriting expertise and proprietary segmentation models used to price risks.
These models are continuously being refined to create an advantage over competitors and identify
certain segments of the market that are more profitable than others. Our objective is to establish a
model that will both attract new clients and maintain existing clients with profitable profiles.
In-house claims
expertise
Substantially all of our claims are handled in-house. This translates to claims being settled faster and
at a lower cost, and a more consistent service experience created for the customer.
Broker relationships The broker channel represents approximately 87% of annual DPW. We have more than 2,000 broker
relationships across Canada for customers that prefer the highly-personalized, community-based
service that insurance brokers provide. We provide a variety of services including technology, sales
training and financing to brokers to enable them to continue to grow and expand their businesses.
Multi-channel
distribution
We have a multi-channel distribution strategy including broker and direct-to-consumer brands. This
strategy maximizes growth in the market and enables us to appeal to different customer preferences
and to be more responsive to consumer trends.
Proven acquisition
strategy
We are a proven industry consolidator with 14 successful acquisitions since 1988, the most recent
being Jevco Insurance Company and Metro General Insurance Corporation Limited. Our primary
strategy is to target large-scale acquisitions of $500 million or more in DPW and to pursue
acquisitions in lines of business where we have an expertise. Our acquisition targets are to achieve
an internal rate of return of at least 15%, to bring the loss ratio of the acquired book of business to our
average loss ratio and to bring the expense ratio to two points below our ratio, within 18 to 24
months.
Strong expertise in
investment portfolio
management
Over the years, we have built a strong expertise in investment management. In-house management
provides greater flexibility in support of our insurance operations at competitive costs. In establishing
our asset allocation, we consider a variety of factors including prospective risk and return of various
asset classes, the duration of claim obligations, the risk of underwriting activities and the capital
supporting our business. Our primary investment objective is to generate consistent after-tax income
while minimizing the potential for extremely large losses. We focus mostly on Canadian income
products while preserving capital, diversifying risk and considering capital requirements in evaluating
the attractiveness of different investment alternatives.
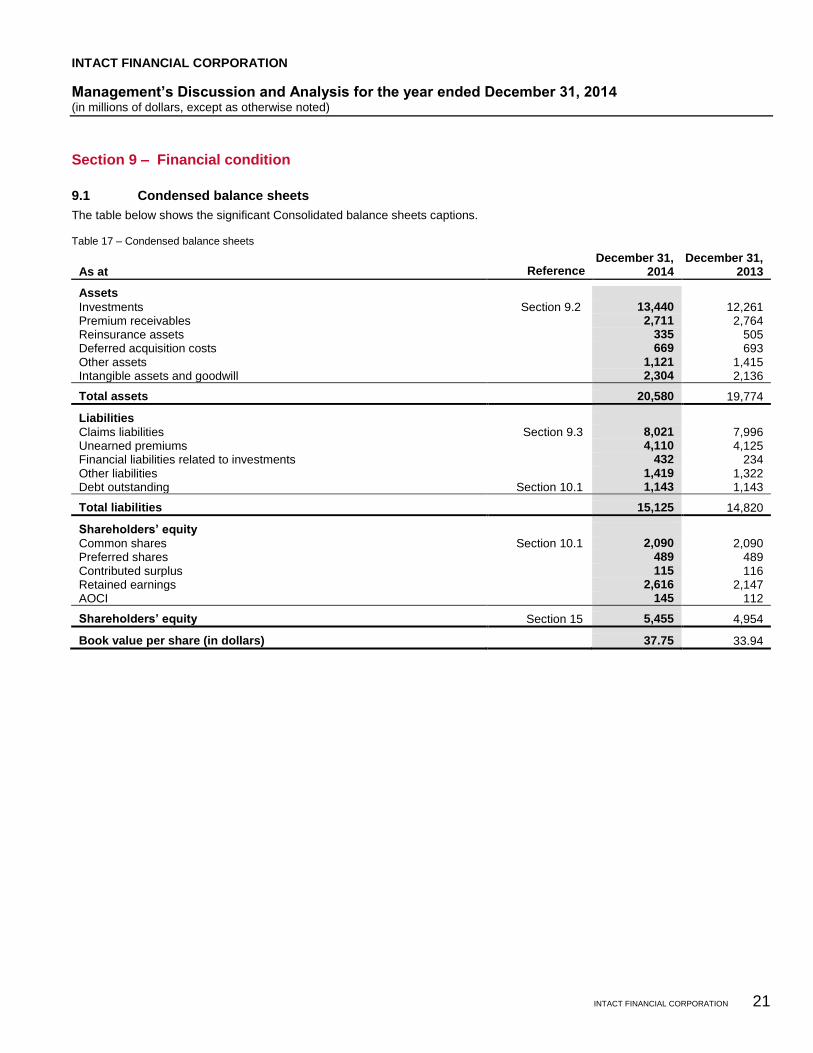
INTACT FINANCIAL CORPORATION
Management’s Discussion and Analysis for the year ended December 31, 2014 (in millions of dollars, except as otherwise noted)
INTACT FINANCIAL CORPORATION 21
Section 9 – Financial condition
9.1 Condensed balance sheets
The table below shows the significant Consolidated balance sheets captions.
Table 17 – Condensed balance sheets
As at Reference December 31,
2014 December 31,
2013
Assets Investments Section 9.2 13,440 12,261 Premium receivables 2,711 2,764 Reinsurance assets 335 505 Deferred acquisition costs 669 693 Other assets 1,121 1,415 Intangible assets and goodwill 2,304 2,136
Total assets 20,580 19,774
Liabilities Claims liabilities Section 9.3 8,021 7,996 Unearned premiums 4,110 4,125 Financial liabilities related to investments 432 234 Other liabilities 1,419 1,322 Debt outstanding Section 10.1 1,143 1,143
Total liabilities 15,125 14,820
Shareholders’ equity Common shares Section 10.1 2,090 2,090 Preferred shares 489 489 Contributed surplus 115 116 Retained earnings 2,616 2,147 AOCI 145 112
Shareholders’ equity Section 15 5,455 4,954
Book value per share (in dollars) 37.75 33.94
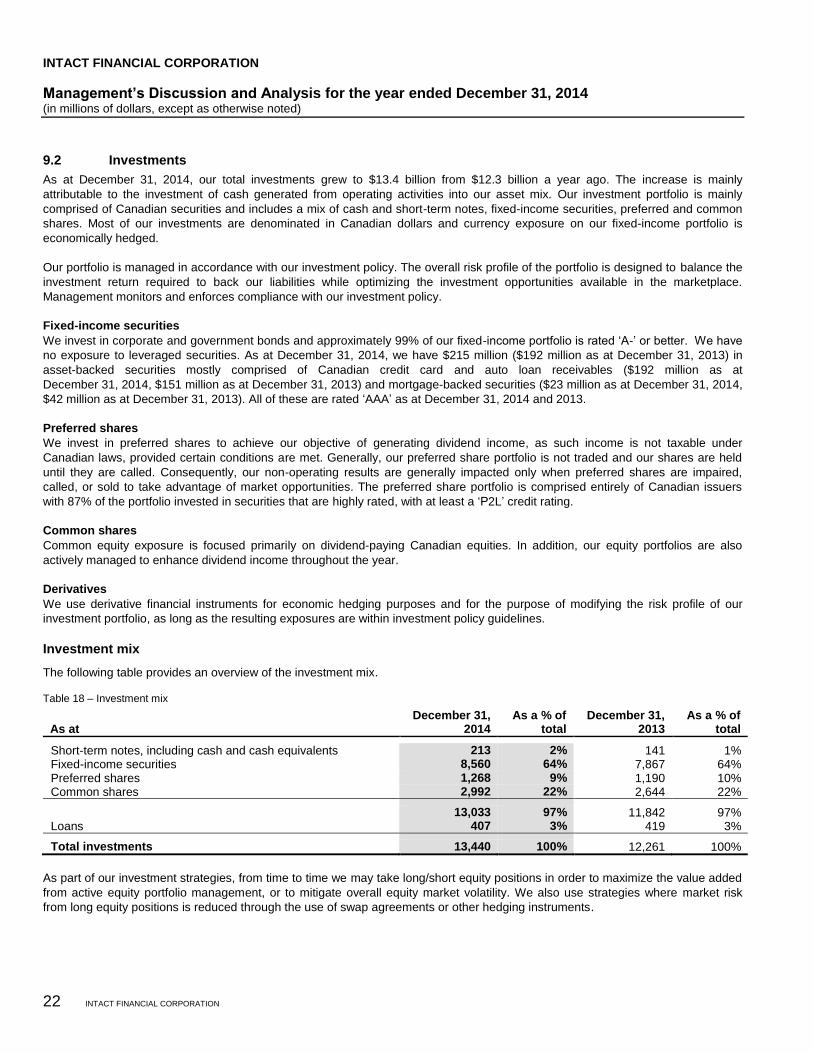
INTACT FINANCIAL CORPORATION
Management’s Discussion and Analysis for the year ended December 31, 2014 (in millions of dollars, except as otherwise noted)
22 INTACT FINANCIAL CORPORATION
9.2 Investments
As at December 31, 2014, our total investments grew to $13.4 billion from $12.3 billion a year ago. The increase is mainly
attributable to the investment of cash generated from operating activities into our asset mix. Our investment portfolio is mainly
comprised of Canadian securities and includes a mix of cash and short-term notes, fixed-income securities, preferred and common
shares. Most of our investments are denominated in Canadian dollars and currency exposure on our fixed-income portfolio is
economically hedged.
Our portfolio is managed in accordance with our investment policy. The overall risk profile of the portfolio is designed to balance the
investment return required to back our liabilities while optimizing the investment opportunities available in the marketplace.
Management monitors and enforces compliance with our investment policy.
Fixed-income securities
We invest in corporate and government bonds and approximately 99% of our fixed-income portfolio is rated ‘A-’ or better. We have
no exposure to leveraged securities. As at December 31, 2014, we have $215 million ($192 million as at December 31, 2013) in
asset-backed securities mostly comprised of Canadian credit card and auto loan receivables ($192 million as at
December 31, 2014, $151 million as at December 31, 2013) and mortgage-backed securities ($23 million as at December 31, 2014,
$42 million as at December 31, 2013). All of these are rated ‘AAA’ as at December 31, 2014 and 2013.
Preferred shares
We invest in preferred shares to achieve our objective of generating dividend income, as such income is not taxable under
Canadian laws, provided certain conditions are met. Generally, our preferred share portfolio is not traded and our shares are held
until they are called. Consequently, our non-operating results are generally impacted only when preferred shares are impaired,
called, or sold to take advantage of market opportunities. The preferred share portfolio is comprised entirely of Canadian issuers
with 87% of the portfolio invested in securities that are highly rated, with at least a ‘P2L’ credit rating.
Common shares
Common equity exposure is focused primarily on dividend-paying Canadian equities. In addition, our equity portfolios are also
actively managed to enhance dividend income throughout the year.
Derivatives
We use derivative financial instruments for economic hedging purposes and for the purpose of modifying the risk profile of our
investment portfolio, as long as the resulting exposures are within investment policy guidelines.
Investment mix
The following table provides an overview of the investment mix.
Table 18 – Investment mix
As at December 31,
2014 As a % of
total December 31,
2013 As a % of
total
Short-term notes, including cash and cash equivalents 213 2% 141 1% Fixed-income securities 8,560 64% 7,867 64% Preferred shares 1,268 9% 1,190 10% Common shares 2,992 22% 2,644 22%
13,033 97% 11,842 97% Loans 407 3% 419 3%
Total investments 13,440 100% 12,261 100%
As part of our investment strategies, from time to time we may take long/short equity positions in order to maximize the value added
from active equity portfolio management, or to mitigate overall equity market volatility. We also use strategies where market risk
from long equity positions is reduced through the use of swap agreements or other hedging instruments.
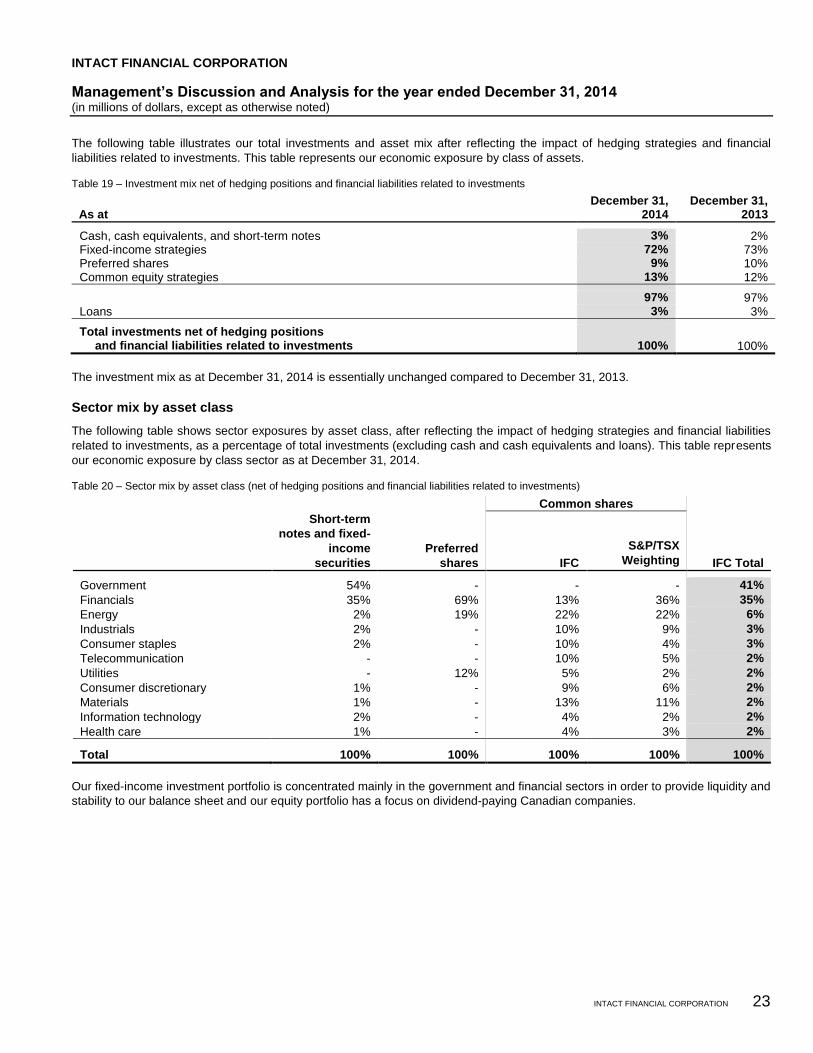
INTACT FINANCIAL CORPORATION
Management’s Discussion and Analysis for the year ended December 31, 2014 (in millions of dollars, except as otherwise noted)
INTACT FINANCIAL CORPORATION 23
The following table illustrates our total investments and asset mix after reflecting the impact of hedging strategies and financial
liabilities related to investments. This table represents our economic exposure by class of assets.
Table 19 – Investment mix net of hedging positions and financial liabilities related to investments
As at December 31,
2014 December 31,
2013
Cash, cash equivalents, and short-term notes 3% 2% Fixed-income strategies 72% 73% Preferred shares 9% 10% Common equity strategies 13% 12%
97% 97% Loans 3% 3%
Total investments net of hedging positions and financial liabilities related to investments 100% 100%
The investment mix as at December 31, 2014 is essentially unchanged compared to December 31, 2013.
Sector mix by asset class
The following table shows sector exposures by asset class, after reflecting the impact of hedging strategies and financial liabilities
related to investments, as a percentage of total investments (excluding cash and cash equivalents and loans). This table represents
our economic exposure by class sector as at December 31, 2014.
Table 20 – Sector mix by asset class (net of hedging positions and financial liabilities related to investments)
Common shares
Short-term
notes and fixed-
income
securities
Preferred
shares IFC
S&P/TSX
Weighting IFC Total
Government 54% - - - 41%
Financials 35% 69% 13% 36% 35%
Energy 2% 19% 22% 22% 6%
Industrials 2% - 10% 9% 3%
Consumer staples 2% - 10% 4% 3%
Telecommunication - - 10% 5% 2%
Utilities - 12% 5% 2% 2%
Consumer discretionary 1% - 9% 6% 2%
Materials 1% - 13% 11% 2%
Information technology 2% - 4% 2% 2%
Health care 1% - 4% 3% 2%
Total 100% 100% 100% 100% 100%
Our fixed-income investment portfolio is concentrated mainly in the government and financial sectors in order to provide liquidity and
stability to our balance sheet and our equity portfolio has a focus on dividend-paying Canadian companies.
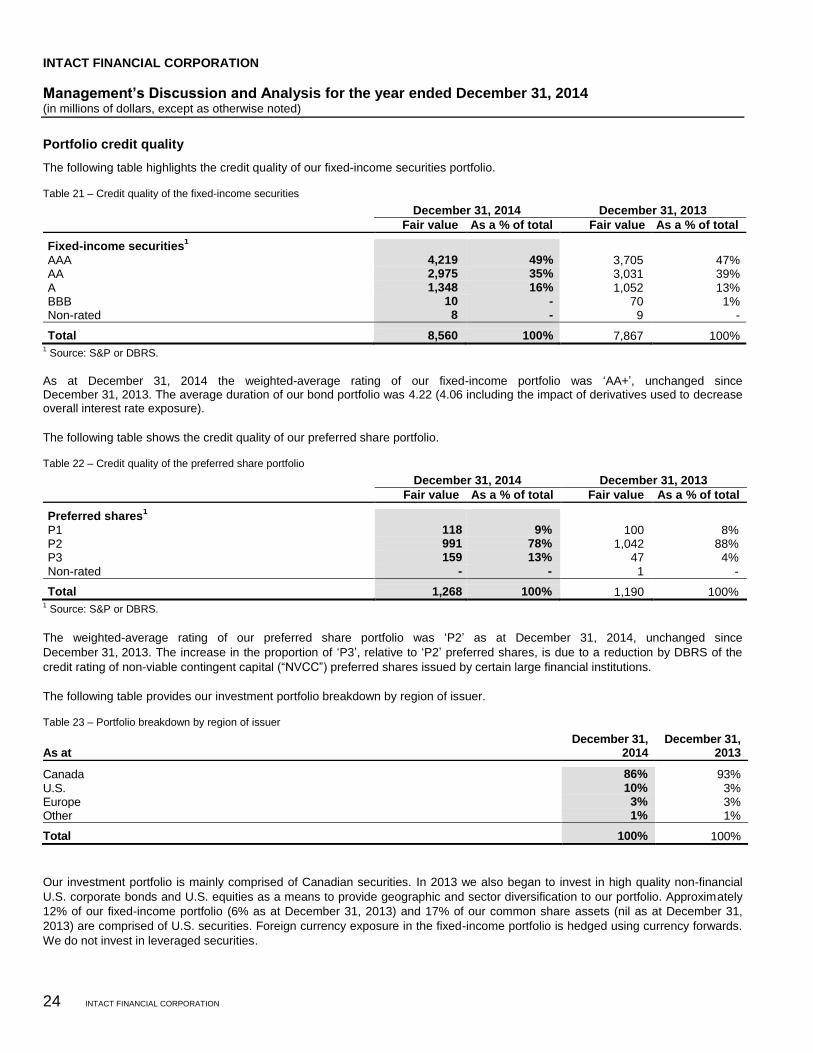
INTACT FINANCIAL CORPORATION
Management’s Discussion and Analysis for the year ended December 31, 2014 (in millions of dollars, except as otherwise noted)
24 INTACT FINANCIAL CORPORATION
Portfolio credit quality
The following table highlights the credit quality of our fixed-income securities portfolio.
Table 21 – Credit quality of the fixed-income securities
December 31, 2014 December 31, 2013
Fair value As a % of total Fair value As a % of total
Fixed-income securities1
AAA 4,219 49% 3,705 47% AA 2,975 35% 3,031 39% A 1,348 16% 1,052 13% BBB 10 - 70 1% Non-rated 8 - 9 -
Total 8,560 100% 7,867 100% 1 Source: S&P or DBRS.
As at December 31, 2014 the weighted-average rating of our fixed-income portfolio was ‘AA+’, unchanged since December 31, 2013. The average duration of our bond portfolio was 4.22 (4.06 including the impact of derivatives used to decrease overall interest rate exposure).
The following table shows the credit quality of our preferred share portfolio.
Table 22 – Credit quality of the preferred share portfolio
December 31, 2014 December 31, 2013
Fair value As a % of total Fair value As a % of total
Preferred shares1
P1 118 9% 100 8% P2 991 78% 1,042 88% P3 159 13% 47 4% Non-rated - - 1 -
Total 1,268 100% 1,190 100% 1 Source: S&P or DBRS.
The weighted-average rating of our preferred share portfolio was ‘P2’ as at December 31, 2014, unchanged since
December 31, 2013. The increase in the proportion of ‘P3’, relative to ‘P2’ preferred shares, is due to a reduction by DBRS of the
credit rating of non-viable contingent capital (“NVCC”) preferred shares issued by certain large financial institutions.
The following table provides our investment portfolio breakdown by region of issuer.
Table 23 – Portfolio breakdown by region of issuer
As at December 31,
2014 December 31,
2013
Canada 86% 93% U.S. 10% 3% Europe 3% 3% Other 1% 1%
Total 100% 100%
Our investment portfolio is mainly comprised of Canadian securities. In 2013 we also began to invest in high quality non-financial
U.S. corporate bonds and U.S. equities as a means to provide geographic and sector diversification to our portfolio. Approximately
12% of our fixed-income portfolio (6% as at December 31, 2013) and 17% of our common share assets (nil as at December 31,
2013) are comprised of U.S. securities. Foreign currency exposure in the fixed-income portfolio is hedged using currency forwards.
We do not invest in leveraged securities.
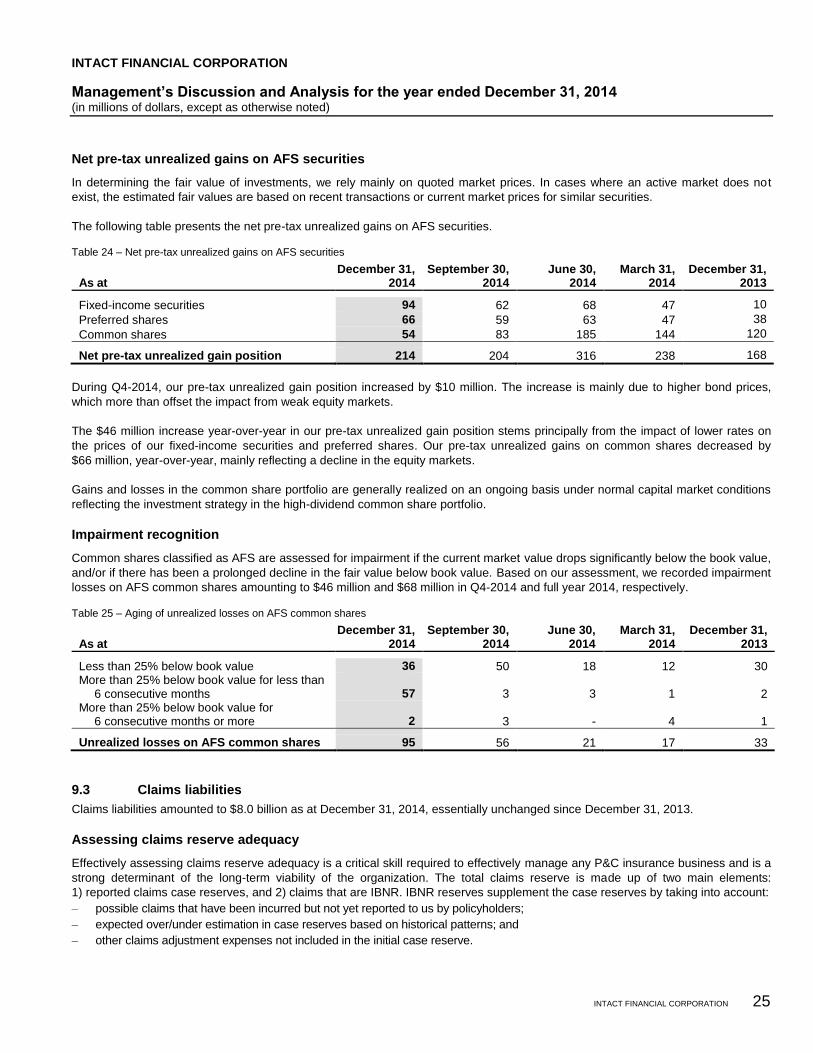
INTACT FINANCIAL CORPORATION
Management’s Discussion and Analysis for the year ended December 31, 2014 (in millions of dollars, except as otherwise noted)
INTACT FINANCIAL CORPORATION 25
Net pre-tax unrealized gains on AFS securities
In determining the fair value of investments, we rely mainly on quoted market prices. In cases where an active market does not
exist, the estimated fair values are based on recent transactions or current market prices for similar securities.
The following table presents the net pre-tax unrealized gains on AFS securities.
Table 24 – Net pre-tax unrealized gains on AFS securities
As at December 31,
2014 September 30,
2014 June 30,
2014 March 31,
2014 December 31,
2013
Fixed-income securities 94 62 68 47 10
Preferred shares 66 59 63 47 38
Common shares 54 83 185 144 120
Net pre-tax unrealized gain position 214 204 316 238 168
During Q4-2014, our pre-tax unrealized gain position increased by $10 million. The increase is mainly due to higher bond prices,
which more than offset the impact from weak equity markets.
The $46 million increase year-over-year in our pre-tax unrealized gain position stems principally from the impact of lower rates on
the prices of our fixed-income securities and preferred shares. Our pre-tax unrealized gains on common shares decreased by
$66 million, year-over-year, mainly reflecting a decline in the equity markets.
Gains and losses in the common share portfolio are generally realized on an ongoing basis under normal capital market conditions
reflecting the investment strategy in the high-dividend common share portfolio.
Impairment recognition
Common shares classified as AFS are assessed for impairment if the current market value drops significantly below the book value,
and/or if there has been a prolonged decline in the fair value below book value. Based on our assessment, we recorded impairment
losses on AFS common shares amounting to $46 million and $68 million in Q4-2014 and full year 2014, respectively.
Table 25 – Aging of unrealized losses on AFS common shares
As at December 31,
2014 September 30,
2014 June 30,
2014 March 31,
2014 December 31,
2013
Less than 25% below book value 36 50 18 12 30 More than 25% below book value for less than
6 consecutive months 57 3 3 1 2 More than 25% below book value for
6 consecutive months or more 2 3 - 4 1
Unrealized losses on AFS common shares 95 56 21 17 33
9.3 Claims liabilities
Claims liabilities amounted to $8.0 billion as at December 31, 2014, essentially unchanged since December 31, 2013.
Assessing claims reserve adequacy
Effectively assessing claims reserve adequacy is a critical skill required to effectively manage any P&C insurance business and is a
strong determinant of the long-term viability of the organization. The total claims reserve is made up of two main elements:
1) reported claims case reserves, and 2) claims that are IBNR. IBNR reserves supplement the case reserves by taking into account:
— possible claims that have been incurred but not yet reported to us by policyholders;
— expected over/under estimation in case reserves based on historical patterns; and
— other claims adjustment expenses not included in the initial case reserve.
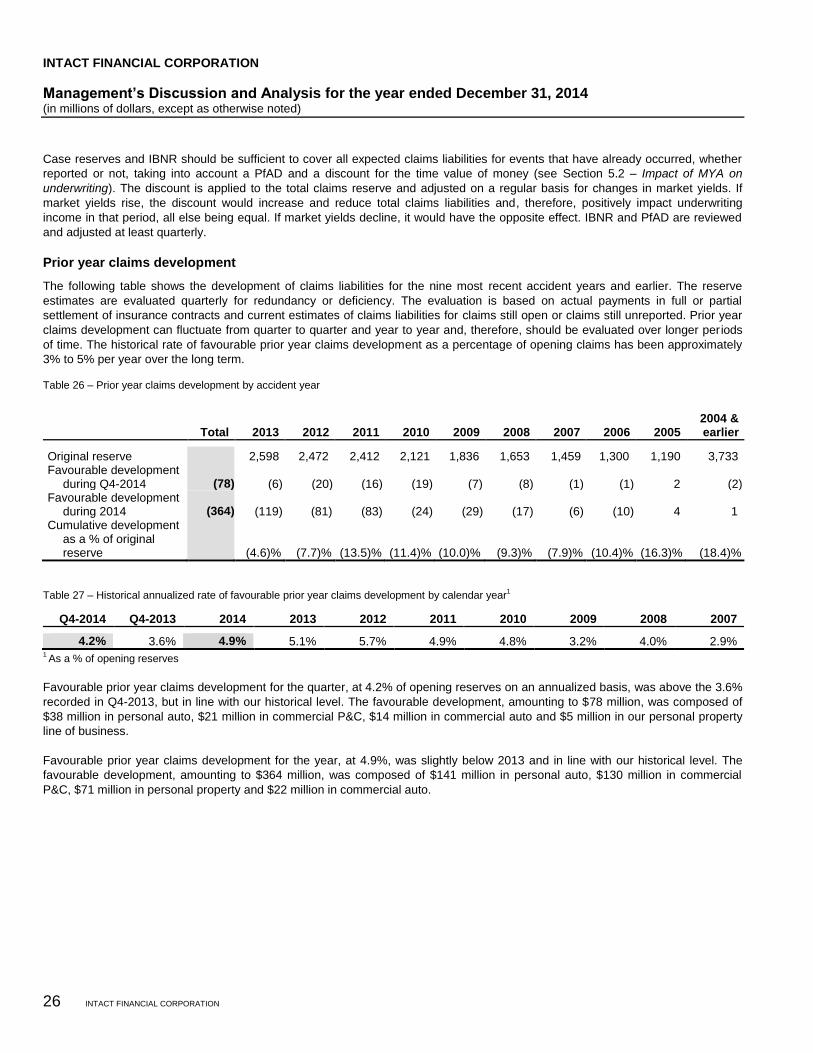
INTACT FINANCIAL CORPORATION
Management’s Discussion and Analysis for the year ended December 31, 2014 (in millions of dollars, except as otherwise noted)
26 INTACT FINANCIAL CORPORATION
Case reserves and IBNR should be sufficient to cover all expected claims liabilities for events that have already occurred, whether
reported or not, taking into account a PfAD and a discount for the time value of money (see Section 5.2 – Impact of MYA on
underwriting). The discount is applied to the total claims reserve and adjusted on a regular basis for changes in market yields. If
market yields rise, the discount would increase and reduce total claims liabilities and, therefore, positively impact underwriting
income in that period, all else being equal. If market yields decline, it would have the opposite effect. IBNR and PfAD are reviewed
and adjusted at least quarterly.
Prior year claims development
The following table shows the development of claims liabilities for the nine most recent accident years and earlier. The reserve
estimates are evaluated quarterly for redundancy or deficiency. The evaluation is based on actual payments in full or partial
settlement of insurance contracts and current estimates of claims liabilities for claims still open or claims still unreported. Prior year
claims development can fluctuate from quarter to quarter and year to year and, therefore, should be evaluated over longer periods
of time. The historical rate of favourable prior year claims development as a percentage of opening claims has been approximately
3% to 5% per year over the long term.
Table 26 – Prior year claims development by accident year
Total 2013 2012 2011 2010 2009 2008 2007 2006 2005
2004 & earlier
Original reserve 2,598 2,472 2,412 2,121 1,836 1,653 1,459 1,300 1,190 3,733 Favourable development
during Q4-2014
(78) (6) (20) (16) (19) (7) (8) (1) (1) 2 (2) Favourable development
during 2014 (364) (119) (81) (83) (24) (29) (17) (6) (10) 4 1 Cumulative development
as a % of original reserve (4.6)% (7.7)% (13.5)% (11.4)% (10.0)% (9.3)% (7.9)% (10.4)% (16.3)% (18.4)%
Table 27 – Historical annualized rate of favourable prior year claims development by calendar year1
Q4-2014 Q4-2013 2014 2013 2012 2011 2010 2009 2008 2007
4.2% 3.6% 4.9% 5.1% 5.7% 4.9% 4.8% 3.2% 4.0% 2.9% 1 As a % of opening reserves
Favourable prior year claims development for the quarter, at 4.2% of opening reserves on an annualized basis, was above the 3.6%
recorded in Q4-2013, but in line with our historical level. The favourable development, amounting to $78 million, was composed of
$38 million in personal auto, $21 million in commercial P&C, $14 million in commercial auto and $5 million in our personal property
line of business.
Favourable prior year claims development for the year, at 4.9%, was slightly below 2013 and in line with our historical level. The
favourable development, amounting to $364 million, was composed of $141 million in personal auto, $130 million in commercial
P&C, $71 million in personal property and $22 million in commercial auto.
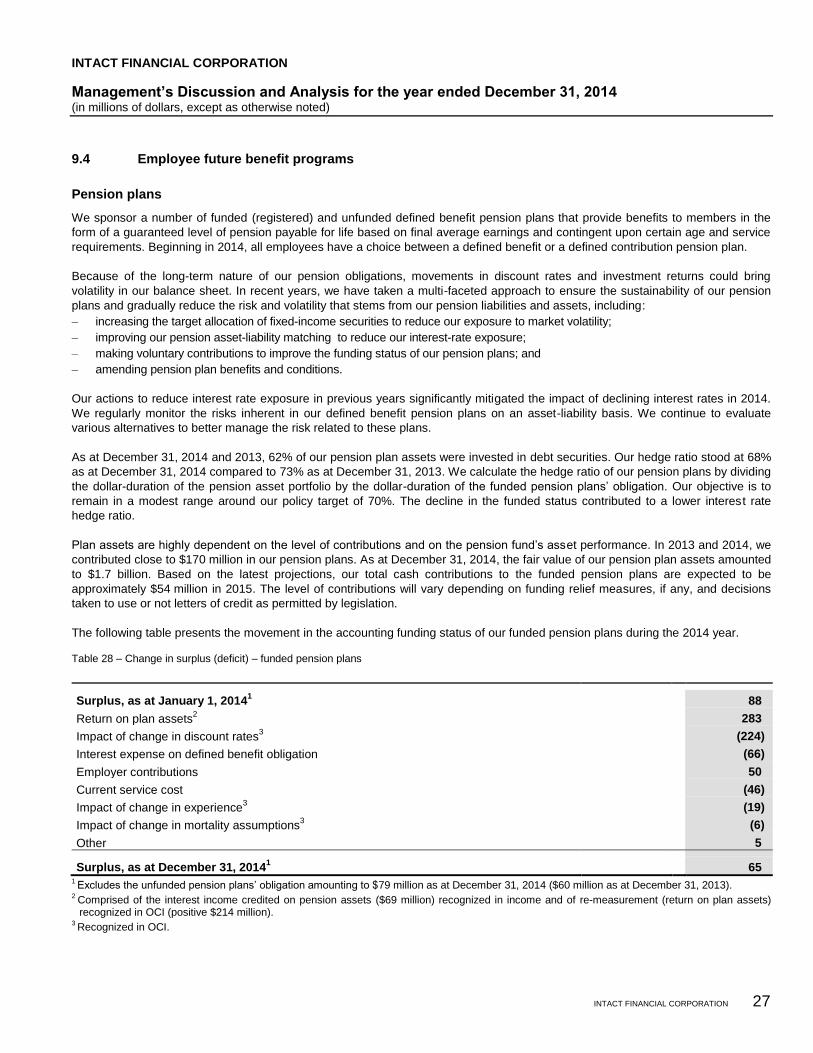
INTACT FINANCIAL CORPORATION
Management’s Discussion and Analysis for the year ended December 31, 2014 (in millions of dollars, except as otherwise noted)
INTACT FINANCIAL CORPORATION 27
9.4 Employee future benefit programs
Pension plans
We sponsor a number of funded (registered) and unfunded defined benefit pension plans that provide benefits to members in the
form of a guaranteed level of pension payable for life based on final average earnings and contingent upon certain age and service
requirements. Beginning in 2014, all employees have a choice between a defined benefit or a defined contribution pension plan.
Because of the long-term nature of our pension obligations, movements in discount rates and investment returns could bring
volatility in our balance sheet. In recent years, we have taken a multi-faceted approach to ensure the sustainability of our pension
plans and gradually reduce the risk and volatility that stems from our pension liabilities and assets, including:
— increasing the target allocation of fixed-income securities to reduce our exposure to market volatility;
— improving our pension asset-liability matching to reduce our interest-rate exposure;
— making voluntary contributions to improve the funding status of our pension plans; and
— amending pension plan benefits and conditions.
Our actions to reduce interest rate exposure in previous years significantly mitigated the impact of declining interest rates in 2014.
We regularly monitor the risks inherent in our defined benefit pension plans on an asset-liability basis. We continue to evaluate
various alternatives to better manage the risk related to these plans.
As at December 31, 2014 and 2013, 62% of our pension plan assets were invested in debt securities. Our hedge ratio stood at 68%
as at December 31, 2014 compared to 73% as at December 31, 2013. We calculate the hedge ratio of our pension plans by dividing
the dollar-duration of the pension asset portfolio by the dollar-duration of the funded pension plans’ obligation. Our objective is to
remain in a modest range around our policy target of 70%. The decline in the funded status contributed to a lower interest rate
hedge ratio.
Plan assets are highly dependent on the level of contributions and on the pension fund’s asset performance. In 2013 and 2014, we
contributed close to $170 million in our pension plans. As at December 31, 2014, the fair value of our pension plan assets amounted
to $1.7 billion. Based on the latest projections, our total cash contributions to the funded pension plans are expected to be
approximately $54 million in 2015. The level of contributions will vary depending on funding relief measures, if any, and decisions
taken to use or not letters of credit as permitted by legislation.
The following table presents the movement in the accounting funding status of our funded pension plans during the 2014 year.
Table 28 – Change in surplus (deficit) – funded pension plans
Surplus, as at January 1, 20141 88
Return on plan assets2 283
Impact of change in discount rates3 (224)
Interest expense on defined benefit obligation (66)
Employer contributions 50
Current service cost (46)
Impact of change in experience3 (19)
Impact of change in mortality assumptions3 (6)
Other
5
Surplus, as at December 31, 20141 65
1 Excludes the unfunded pension plans’ obligation amounting to $79 million as at December 31, 2014 ($60 million as at December 31, 2013).
2 Comprised of the interest income credited on pension assets ($69 million) recognized in income and of re-measurement (return on plan assets) recognized in OCI (positive $214 million).
3 Recognized in OCI.
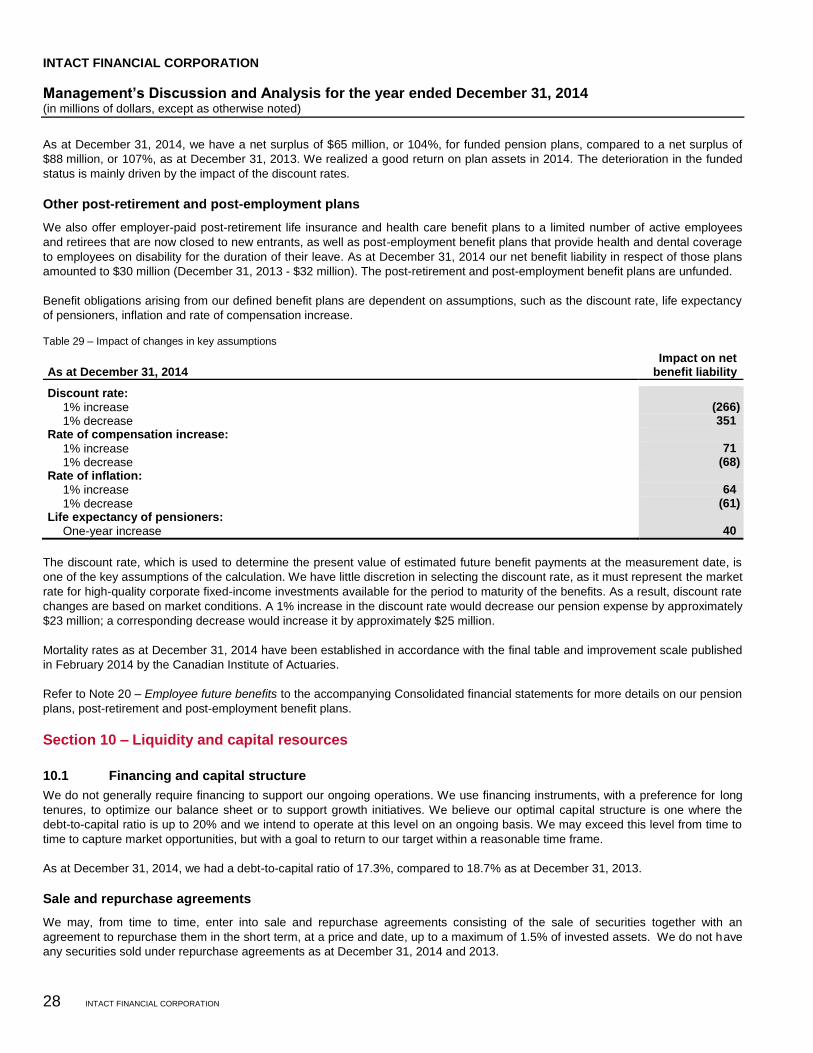
INTACT FINANCIAL CORPORATION
Management’s Discussion and Analysis for the year ended December 31, 2014 (in millions of dollars, except as otherwise noted)
28 INTACT FINANCIAL CORPORATION
As at December 31, 2014, we have a net surplus of $65 million, or 104%, for funded pension plans, compared to a net surplus of
$88 million, or 107%, as at December 31, 2013. We realized a good return on plan assets in 2014. The deterioration in the funded
status is mainly driven by the impact of the discount rates.
Other post-retirement and post-employment plans
We also offer employer-paid post-retirement life insurance and health care benefit plans to a limited number of active employees
and retirees that are now closed to new entrants, as well as post-employment benefit plans that provide health and dental coverage
to employees on disability for the duration of their leave. As at December 31, 2014 our net benefit liability in respect of those plans
amounted to $30 million (December 31, 2013 - $32 million). The post-retirement and post-employment benefit plans are unfunded.
Benefit obligations arising from our defined benefit plans are dependent on assumptions, such as the discount rate, life expectancy
of pensioners, inflation and rate of compensation increase.
Table 29 – Impact of changes in key assumptions
As at December 31, 2014 Impact on net
benefit liability
Discount rate:
1% increase (266)
1% decrease 351 Rate of compensation increase:
1% increase 71
1% decrease (68) Rate of inflation:
1% increase 64
1% decrease (61) Life expectancy of pensioners:
One-year increase 40
The discount rate, which is used to determine the present value of estimated future benefit payments at the measurement date, is
one of the key assumptions of the calculation. We have little discretion in selecting the discount rate, as it must represent the market
rate for high-quality corporate fixed-income investments available for the period to maturity of the benefits. As a result, discount rate
changes are based on market conditions. A 1% increase in the discount rate would decrease our pension expense by approximately
$23 million; a corresponding decrease would increase it by approximately $25 million.
Mortality rates as at December 31, 2014 have been established in accordance with the final table and improvement scale published
in February 2014 by the Canadian Institute of Actuaries.
Refer to Note 20 – Employee future benefits to the accompanying Consolidated financial statements for more details on our pension
plans, post-retirement and post-employment benefit plans.
Section 10 – Liquidity and capital resources
10.1 Financing and capital structure
We do not generally require financing to support our ongoing operations. We use financing instruments, with a preference for long
tenures, to optimize our balance sheet or to support growth initiatives. We believe our optimal capital structure is one where the
debt-to-capital ratio is up to 20% and we intend to operate at this level on an ongoing basis. We may exceed this level from time to
time to capture market opportunities, but with a goal to return to our target within a reasonable time frame.
As at December 31, 2014, we had a debt-to-capital ratio of 17.3%, compared to 18.7% as at December 31, 2013.
Sale and repurchase agreements
We may, from time to time, enter into sale and repurchase agreements consisting of the sale of securities together with an
agreement to repurchase them in the short term, at a price and date, up to a maximum of 1.5% of invested assets. We do not have
any securities sold under repurchase agreements as at December 31, 2014 and 2013.
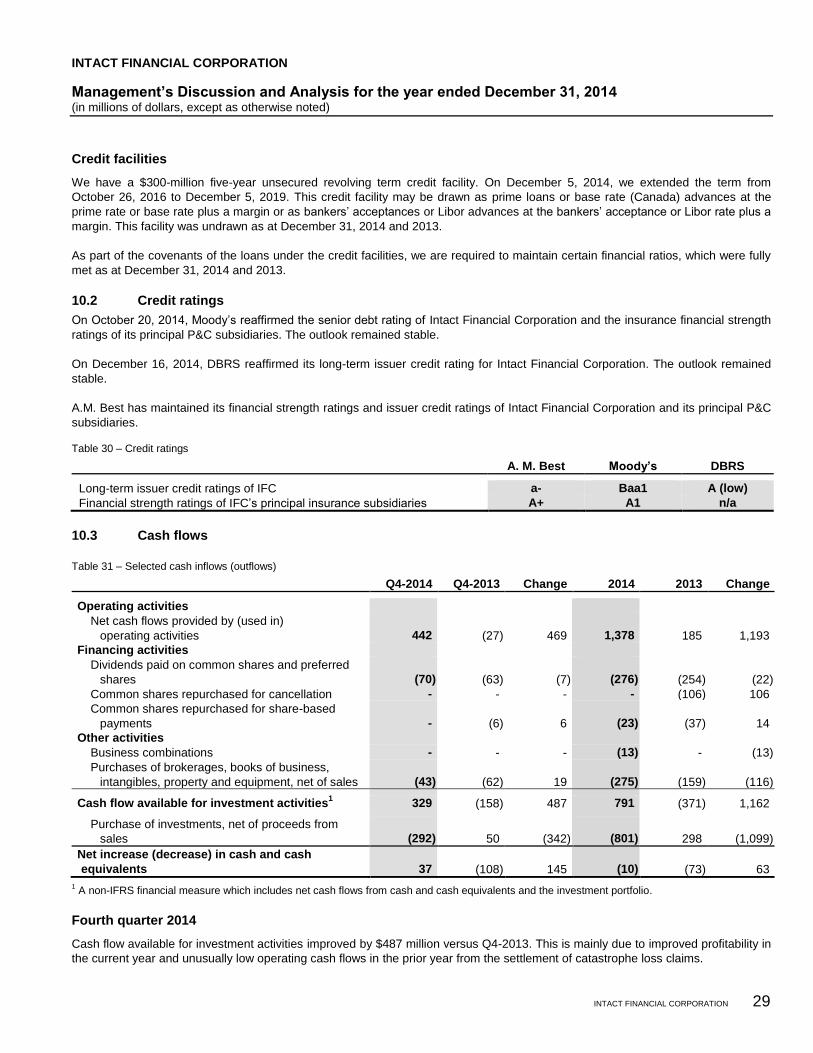
INTACT FINANCIAL CORPORATION
Management’s Discussion and Analysis for the year ended December 31, 2014 (in millions of dollars, except as otherwise noted)
INTACT FINANCIAL CORPORATION 29
Credit facilities
We have a $300-million five-year unsecured revolving term credit facility. On December 5, 2014, we extended the term from
October 26, 2016 to December 5, 2019. This credit facility may be drawn as prime loans or base rate (Canada) advances at the
prime rate or base rate plus a margin or as bankers’ acceptances or Libor advances at the bankers’ acceptance or Libor rate plus a
margin. This facility was undrawn as at December 31, 2014 and 2013.
As part of the covenants of the loans under the credit facilities, we are required to maintain certain financial ratios, which were fully
met as at December 31, 2014 and 2013.
10.2 Credit ratings
On October 20, 2014, Moody’s reaffirmed the senior debt rating of Intact Financial Corporation and the insurance financial strength
ratings of its principal P&C subsidiaries. The outlook remained stable.
On December 16, 2014, DBRS reaffirmed its long-term issuer credit rating for Intact Financial Corporation. The outlook remained
stable.
A.M. Best has maintained its financial strength ratings and issuer credit ratings of Intact Financial Corporation and its principal P&C
subsidiaries.
Table 30 – Credit ratings
A. M. Best Moody’s DBRS
Long-term issuer credit ratings of IFC a- Baa1 A (low)
Financial strength ratings of IFC’s principal insurance subsidiaries A+ A1 n/a
10.3 Cash flows
Table 31 – Selected cash inflows (outflows)
Q4-2014 Q4-2013 Change 2014 2013 Change
Operating activities
Net cash flows provided by (used in)
operating activities 442 (27) 469 1,378 185 1,193
Financing activities
Dividends paid on common shares and preferred
shares (70) (63) (7) (276) (254) (22)
Common shares repurchased for cancellation - - - - (106) 106
Common shares repurchased for share-based
payments - (6) 6 (23) (37) 14
Other activities
Business combinations - - - (13) - (13)
Purchases of brokerages, books of business,
intangibles, property and equipment, net of sales (43) (62) 19 (275) (159) (116)
Cash flow available for investment activities1 329 (158) 487 791 (371) 1,162
Purchase of investments, net of proceeds from
sales (292) 50 (342) (801) 298 (1,099)
Net increase (decrease) in cash and cash
equivalents 37 (108) 145 (10) (73) 63
1 A non-IFRS financial measure which includes net cash flows from cash and cash equivalents and the investment portfolio.
Fourth quarter 2014
Cash flow available for investment activities improved by $487 million versus Q4-2013. This is mainly due to improved profitability in
the current year and unusually low operating cash flows in the prior year from the settlement of catastrophe loss claims.
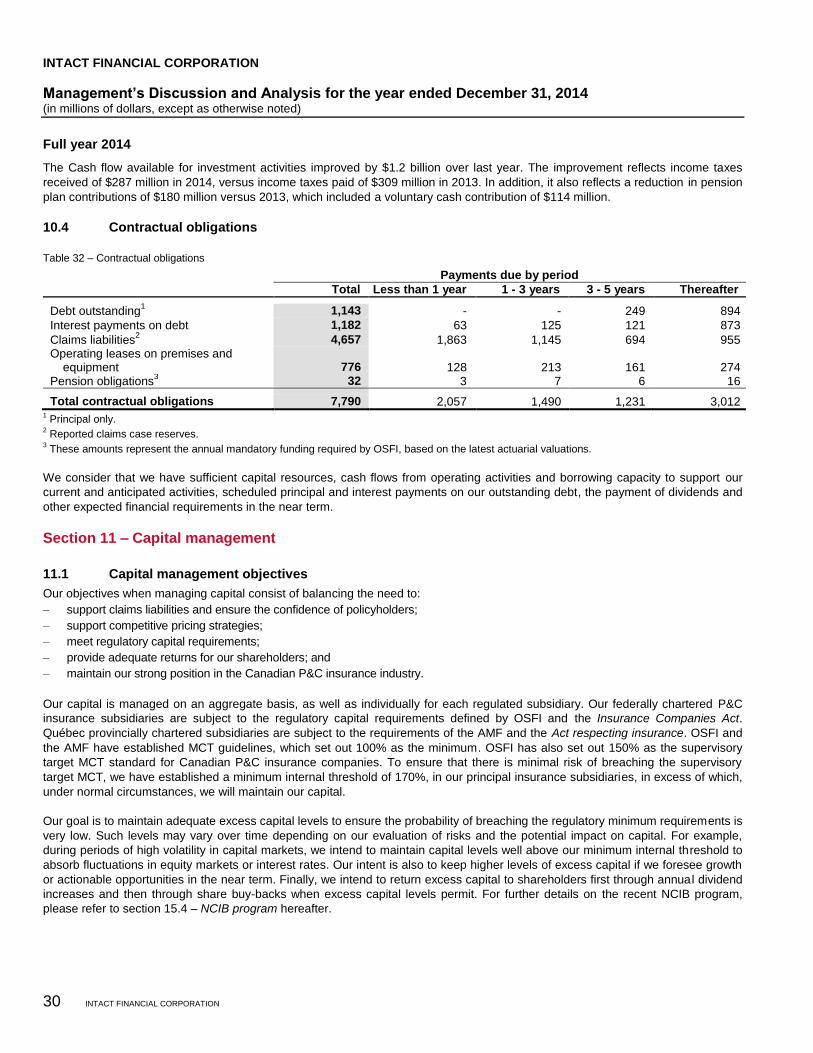
INTACT FINANCIAL CORPORATION
Management’s Discussion and Analysis for the year ended December 31, 2014 (in millions of dollars, except as otherwise noted)
30 INTACT FINANCIAL CORPORATION
Full year 2014
The Cash flow available for investment activities improved by $1.2 billion over last year. The improvement reflects income taxes
received of $287 million in 2014, versus income taxes paid of $309 million in 2013. In addition, it also reflects a reduction in pension
plan contributions of $180 million versus 2013, which included a voluntary cash contribution of $114 million.
10.4 Contractual obligations
Table 32 – Contractual obligations
Payments due by period
Total Less than 1 year 1 - 3 years 3 - 5 years Thereafter
Debt outstanding1 1,143 - - 249 894
Interest payments on debt 1,182 63 125 121 873
Claims liabilities2 4,657 1,863 1,145 694 955
Operating leases on premises and equipment 776 128 213 161 274
Pension obligations3 32 3 7 6 16
Total contractual obligations 7,790 2,057 1,490 1,231 3,012 1 Principal only.
2 Reported claims case reserves.
3 These amounts represent the annual mandatory funding required by OSFI, based on the latest actuarial valuations.
We consider that we have sufficient capital resources, cash flows from operating activities and borrowing capacity to support our
current and anticipated activities, scheduled principal and interest payments on our outstanding debt, the payment of dividends and
other expected financial requirements in the near term.
Section 11 – Capital management
11.1 Capital management objectives
Our objectives when managing capital consist of balancing the need to:
— support claims liabilities and ensure the confidence of policyholders;
— support competitive pricing strategies;
— meet regulatory capital requirements;
— provide adequate returns for our shareholders; and
— maintain our strong position in the Canadian P&C insurance industry.
Our capital is managed on an aggregate basis, as well as individually for each regulated subsidiary. Our federally chartered P&C
insurance subsidiaries are subject to the regulatory capital requirements defined by OSFI and the Insurance Companies Act.
Québec provincially chartered subsidiaries are subject to the requirements of the AMF and the Act respecting insurance. OSFI and
the AMF have established MCT guidelines, which set out 100% as the minimum. OSFI has also set out 150% as the supervisory
target MCT standard for Canadian P&C insurance companies. To ensure that there is minimal risk of breaching the supervisory
target MCT, we have established a minimum internal threshold of 170%, in our principal insurance subsidiaries, in excess of which,
under normal circumstances, we will maintain our capital.
Our goal is to maintain adequate excess capital levels to ensure the probability of breaching the regulatory minimum requirements is
very low. Such levels may vary over time depending on our evaluation of risks and the potential impact on capital. For example,
during periods of high volatility in capital markets, we intend to maintain capital levels well above our minimum internal threshold to
absorb fluctuations in equity markets or interest rates. Our intent is also to keep higher levels of excess capital if we foresee growth
or actionable opportunities in the near term. Finally, we intend to return excess capital to shareholders first through annual dividend
increases and then through share buy-backs when excess capital levels permit. For further details on the recent NCIB program,
please refer to section 15.4 – NCIB program hereafter.
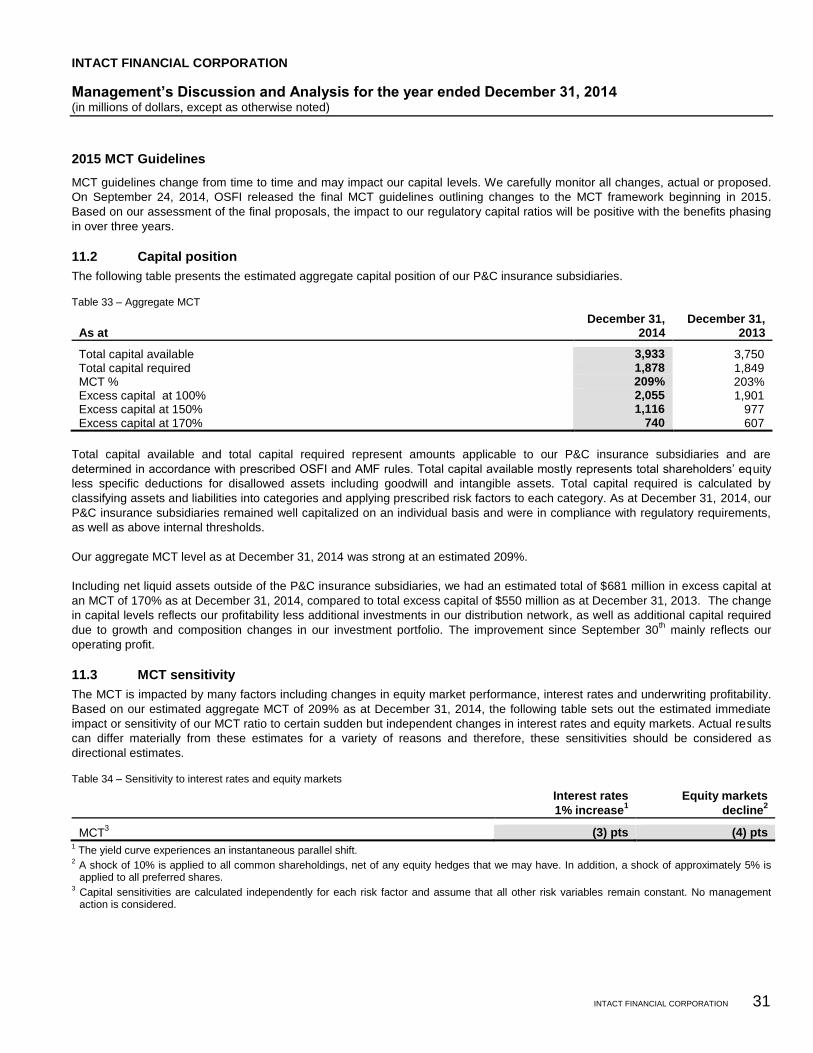
INTACT FINANCIAL CORPORATION
Management’s Discussion and Analysis for the year ended December 31, 2014 (in millions of dollars, except as otherwise noted)
INTACT FINANCIAL CORPORATION 31
2015 MCT Guidelines
MCT guidelines change from time to time and may impact our capital levels. We carefully monitor all changes, actual or proposed.
On September 24, 2014, OSFI released the final MCT guidelines outlining changes to the MCT framework beginning in 2015.
Based on our assessment of the final proposals, the impact to our regulatory capital ratios will be positive with the benefits phasing
in over three years.
11.2 Capital position
The following table presents the estimated aggregate capital position of our P&C insurance subsidiaries.
Table 33 – Aggregate MCT
As at December 31,
2014 December 31,
2013
Total capital available 3,933 3,750 Total capital required 1,878 1,849 MCT % 209% 203% Excess capital at 100% 2,055 1,901 Excess capital at 150% 1,116 977 Excess capital at 170% 740 607
Total capital available and total capital required represent amounts applicable to our P&C insurance subsidiaries and are
determined in accordance with prescribed OSFI and AMF rules. Total capital available mostly represents total shareholders’ equity
less specific deductions for disallowed assets including goodwill and intangible assets. Total capital required is calculated by
classifying assets and liabilities into categories and applying prescribed risk factors to each category. As at December 31, 2014, our
P&C insurance subsidiaries remained well capitalized on an individual basis and were in compliance with regulatory requirements,
as well as above internal thresholds.
Our aggregate MCT level as at December 31, 2014 was strong at an estimated 209%.
Including net liquid assets outside of the P&C insurance subsidiaries, we had an estimated total of $681 million in excess capital at
an MCT of 170% as at December 31, 2014, compared to total excess capital of $550 million as at December 31, 2013. The change
in capital levels reflects our profitability less additional investments in our distribution network, as well as additional capital required
due to growth and composition changes in our investment portfolio. The improvement since September 30th mainly reflects our
operating profit.
11.3 MCT sensitivity
The MCT is impacted by many factors including changes in equity market performance, interest rates and underwriting profitability.
Based on our estimated aggregate MCT of 209% as at December 31, 2014, the following table sets out the estimated immediate
impact or sensitivity of our MCT ratio to certain sudden but independent changes in interest rates and equity markets. Actual results
can differ materially from these estimates for a variety of reasons and therefore, these sensitivities should be considered as
directional estimates.
Table 34 – Sensitivity to interest rates and equity markets
Interest rates
1% increase1
Equity markets
decline2
MCT3 (3) pts (4) pts
1 The yield curve experiences an instantaneous parallel shift.
2 A shock of 10% is applied to all common shareholdings, net of any equity hedges that we may have. In addition, a shock of approximately 5% is applied to all preferred shares.
3 Capital sensitivities are calculated independently for each risk factor and assume that all other risk variables remain constant. No management action is considered.
INTACT FINANCIAL CORPORATION
Management’s Discussion and Analysis for the year ended December 31, 2014 (in millions of dollars, except as otherwise noted)
32 INTACT FINANCIAL CORPORATION
Annually, we perform Dynamic Capital Adequacy Testing on the MCT to ensure that we have sufficient capital to withstand
significant adverse event scenarios. We review these scenarios each year to ensure appropriate risks are included in the testing
process. The 2014 results indicated that our capital position is strong. In addition, our target, actual and forecasted capital position is
subject to ongoing monitoring by management using stress tests and scenario analysis to ensure its adequacy.
Section 12 – Risk management
12.1 Introduction
We have a comprehensive risk management framework and internal control procedures designed to manage and monitor various
risks in order to protect our business, clients, shareholders and employees. Our risk management programs aim at avoiding risks
that could materially impair our financial position, accepting risks that contribute to sustainable earnings and growth and disclosing
these risks in a full and complete manner.
Effective risk management rests on identifying, understanding and communicating all material risks we are exposed to in the course
of our operations. In order to make sound business decisions, both strategically and operationally, management must have
continual direct access to the most timely and accurate information possible. Either directly or through its committees, the Board of
Directors ensures that our management has put appropriate risk management programs in place. The Board of Directors, directly
and in particular through its Risk Management Committee oversees our risk management programs, procedures and controls and,
in this regard, receives periodic reports from, among others, the Risk Management Department through the Chief Risk Officer,
internal auditors and the independent auditors. A summary of our key risks and the processes for managing and mitigating them is
outlined below.
The risks described below and all other information contained in our public documents, including our Consolidated financial
statements, should be considered carefully. The risks and uncertainties described below are those we currently believe to be
material but they are not the only risks and uncertainties we face. If any of these risks, or any other risks and uncertainties that we
have not yet identified, or that we currently consider to be not material, actually occur or become material risks, our business
prospects, financial condition, results of operations and cash flows could be materially adversely affected.
While we employ a broad and diversified set of risk mitigation techniques, those techniques and the judgments that accompany their
application cannot anticipate every economic and financial outcome in all market environments or the specifics and timing of such
outcomes.
INTACT FINANCIAL CORPORATION
Management’s Discussion and Analysis for the year ended December 31, 2014 (in millions of dollars, except as otherwise noted)
INTACT FINANCIAL CORPORATION 33
12.2 Risk management structure
The Board of Directors is responsible for the oversight of risk management to ensure that risks are properly measured, monitored
and reported. In this regard, the Board is supported by its Risk Management Committee that covers enterprise wide risks. In
addition, we have an internal Enterprise Risk Committee composed of senior executives.
The Board and Committee structures are reviewed periodically to be aligned with best practices, the applicable laws and regulatory
guidelines on corporate governance. The following structure is in place and remains unchanged from 2013:
— Board of Directors: The main responsibility of the Board is to oversee our management of business and affairs, including our
pension funds. In this regard, the Board establishes policies, reporting mechanisms and procedures in view of safeguarding our
assets and ensuring our long-term viability, profitability and development.
— Audit Committee: The Audit Committee is a committee that is responsible for reviewing our Financial Statements and financial
information including our pension funds. The Audit Committee is responsible for overseeing our accounting and financial reporting
process and, in this regard, reviews, evaluates and oversees such processes; it is also responsible for evaluating the integrity of
our financial statements and for overseeing the quality and integrity of internal controls.
— Human Resources and Compensation Committee: The Human Resources and Compensation Committee is a committee of the
Board of the Company the primary function of which is to assist the Board in fulfilling its supervisory responsibilities for strategic
oversight of our human capital, including organization effectiveness, succession planning and compensation, and the alignment of
compensation with our philosophy and programs.
— Compliance Review and Corporate Governance Committee: The Compliance Review and Corporate Governance Committee
(“CRCG Committee”) is responsible for ensuring a high standard of governance, compliance and ethics in our company, including
our pension funds. In this regard, the CRCG Committee is responsible for overseeing our governance framework, it is also
responsible for overseeing our compliance framework as well as our compliance programs including related party transactions
(“RPT”), our market conduct programs and policies, as well as the governance framework of our pension plans and the
implementation of corporate compliance initiatives.
— Risk Management Committee: The Risk Management Committee is a committee of the Board of Directors whose primary
function is to assist the Board with its oversight role with respect to our management in order to build a sustainable competitive
advantage, by fully integrating the Enterprise Risk Management Strategy into all our business activities and strategic planning and
our subsidiaries and operations, including our pension funds.
— Enterprise Risk Committee (refer to figure 1): This committee is composed of senior officers and is chaired by the Chief Risk
Officer designated by the Board of Directors. It meets regularly and oversees our risk management priorities, assesses the
effectiveness of risk management programs, policies and actions of each key function of our business and reports on a quarterly
basis to the Risk Management Committee. The Enterprise Risk Committee evaluates our overall risk profile, aiming for a balance
between risk, return, and capital, and approves risk policies. The Enterprise Risk Committee is mandated to: (i) identify risks that
could materially affect our business; (ii) measure risks from a financial or other impact standpoint, such as reputation; (iii) monitor
risks; and (iv) manages risk in accordance with the risk tolerance level determined by the Board of Directors. Periodically, this
committee may establish sub-committees to review specific subjects in greater detail and report back on its findings and
recommendations. This allows the Enterprise Risk Committee to access the expertise throughout our company and to operate
more efficiently in addressing key risks.
In addition, we have other committees responsible for managing, monitoring and reviewing specific aspects of risk related to our
operations, investments, profitability, insurance operations, security and business continuity. Further details follow on how these
committees operate, ensure compliance with laws and regulations and report to the Enterprise Risk Committee.
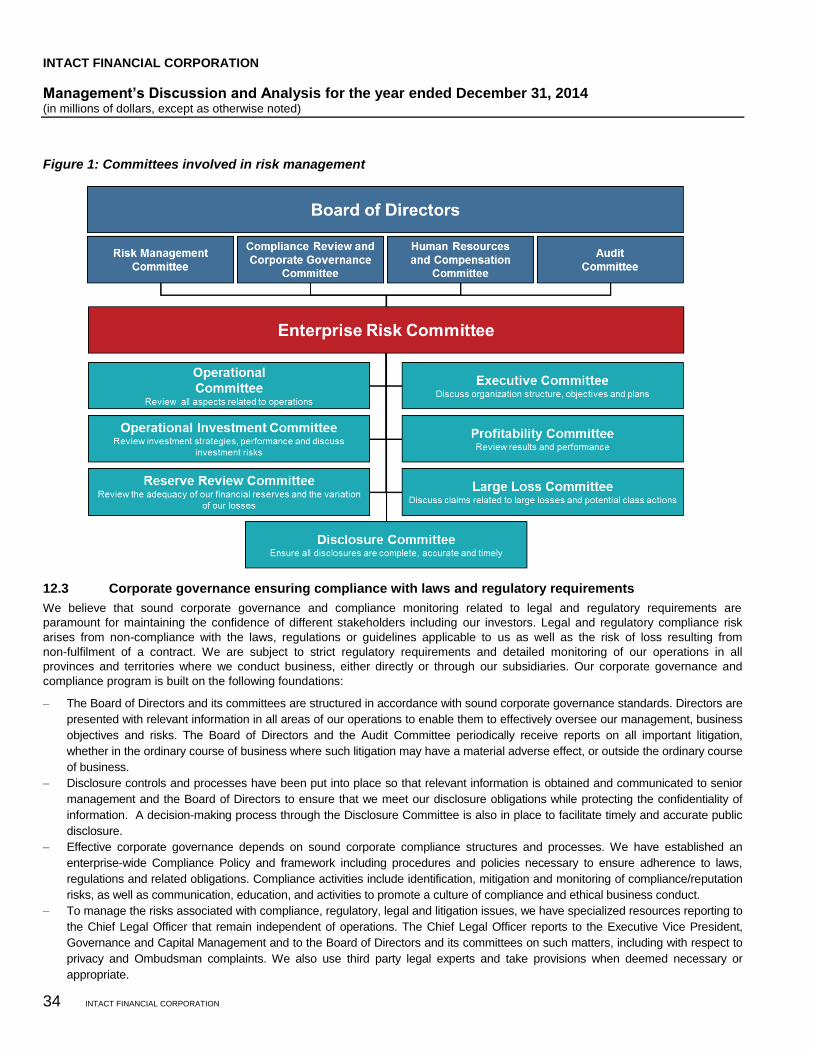
INTACT FINANCIAL CORPORATION
Management’s Discussion and Analysis for the year ended December 31, 2014 (in millions of dollars, except as otherwise noted)
34 INTACT FINANCIAL CORPORATION
Figure 1: Committees involved in risk management
12.3 Corporate governance ensuring compliance with laws and regulatory requirements
We believe that sound corporate governance and compliance monitoring related to legal and regulatory requirements are
paramount for maintaining the confidence of different stakeholders including our investors. Legal and regulatory compliance risk
arises from non-compliance with the laws, regulations or guidelines applicable to us as well as the risk of loss resulting from
non-fulfilment of a contract. We are subject to strict regulatory requirements and detailed monitoring of our operations in all
provinces and territories where we conduct business, either directly or through our subsidiaries. Our corporate governance and
compliance program is built on the following foundations:
— The Board of Directors and its committees are structured in accordance with sound corporate governance standards. Directors are
presented with relevant information in all areas of our operations to enable them to effectively oversee our management, business
objectives and risks. The Board of Directors and the Audit Committee periodically receive reports on all important litigation,
whether in the ordinary course of business where such litigation may have a material adverse effect, or outside the ordinary course
of business.
— Disclosure controls and processes have been put into place so that relevant information is obtained and communicated to senior
management and the Board of Directors to ensure that we meet our disclosure obligations while protecting the confidentiality of
information. A decision-making process through the Disclosure Committee is also in place to facilitate timely and accurate public
disclosure.
— Effective corporate governance depends on sound corporate compliance structures and processes. We have established an
enterprise-wide Compliance Policy and framework including procedures and policies necessary to ensure adherence to laws,
regulations and related obligations. Compliance activities include identification, mitigation and monitoring of compliance/reputation
risks, as well as communication, education, and activities to promote a culture of compliance and ethical business conduct.
— To manage the risks associated with compliance, regulatory, legal and litigation issues, we have specialized resources reporting to
the Chief Legal Officer that remain independent of operations. The Chief Legal Officer reports to the Executive Vice President,
Governance and Capital Management and to the Board of Directors and its committees on such matters, including with respect to
privacy and Ombudsman complaints. We also use third party legal experts and take provisions when deemed necessary or
appropriate.
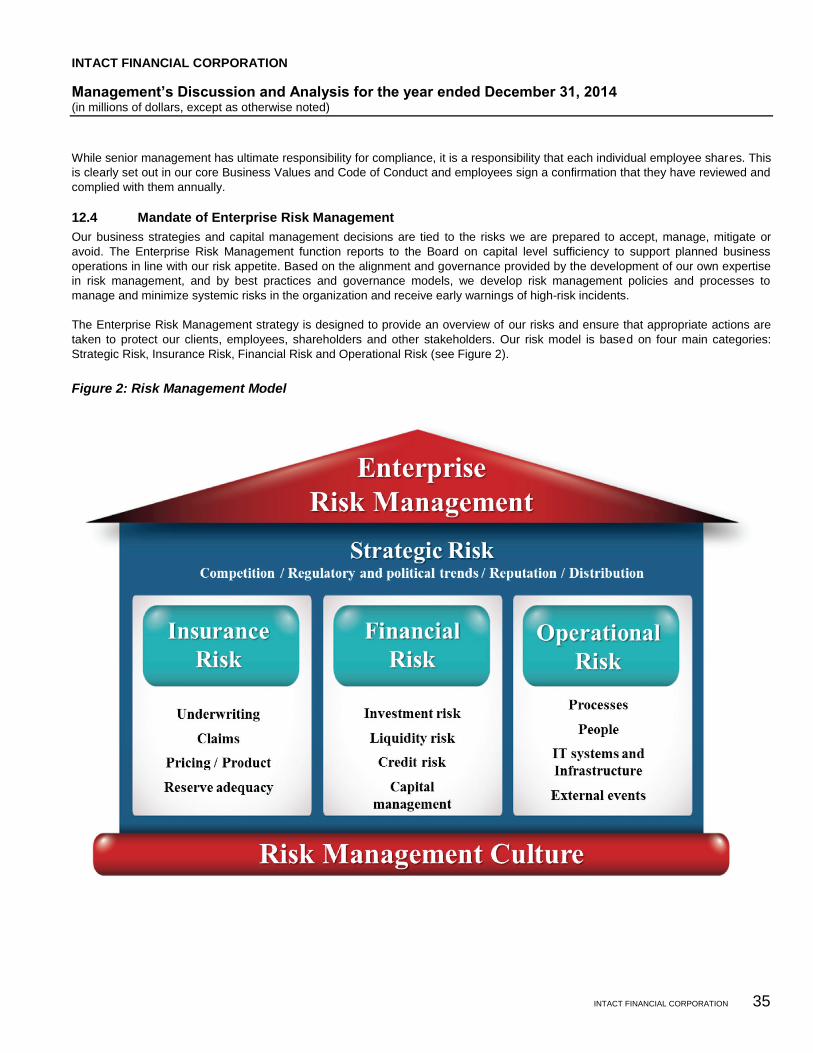
INTACT FINANCIAL CORPORATION
Management’s Discussion and Analysis for the year ended December 31, 2014 (in millions of dollars, except as otherwise noted)
INTACT FINANCIAL CORPORATION 35
While senior management has ultimate responsibility for compliance, it is a responsibility that each individual employee shares. This
is clearly set out in our core Business Values and Code of Conduct and employees sign a confirmation that they have reviewed and
complied with them annually.
12.4 Mandate of Enterprise Risk Management
Our business strategies and capital management decisions are tied to the risks we are prepared to accept, manage, mitigate or
avoid. The Enterprise Risk Management function reports to the Board on capital level sufficiency to support planned business
operations in line with our risk appetite. Based on the alignment and governance provided by the development of our own expertise
in risk management, and by best practices and governance models, we develop risk management policies and processes to
manage and minimize systemic risks in the organization and receive early warnings of high-risk incidents.
The Enterprise Risk Management strategy is designed to provide an overview of our risks and ensure that appropriate actions are
taken to protect our clients, employees, shareholders and other stakeholders. Our risk model is based on four main categories:
Strategic Risk, Insurance Risk, Financial Risk and Operational Risk (see Figure 2).
Figure 2: Risk Management Model
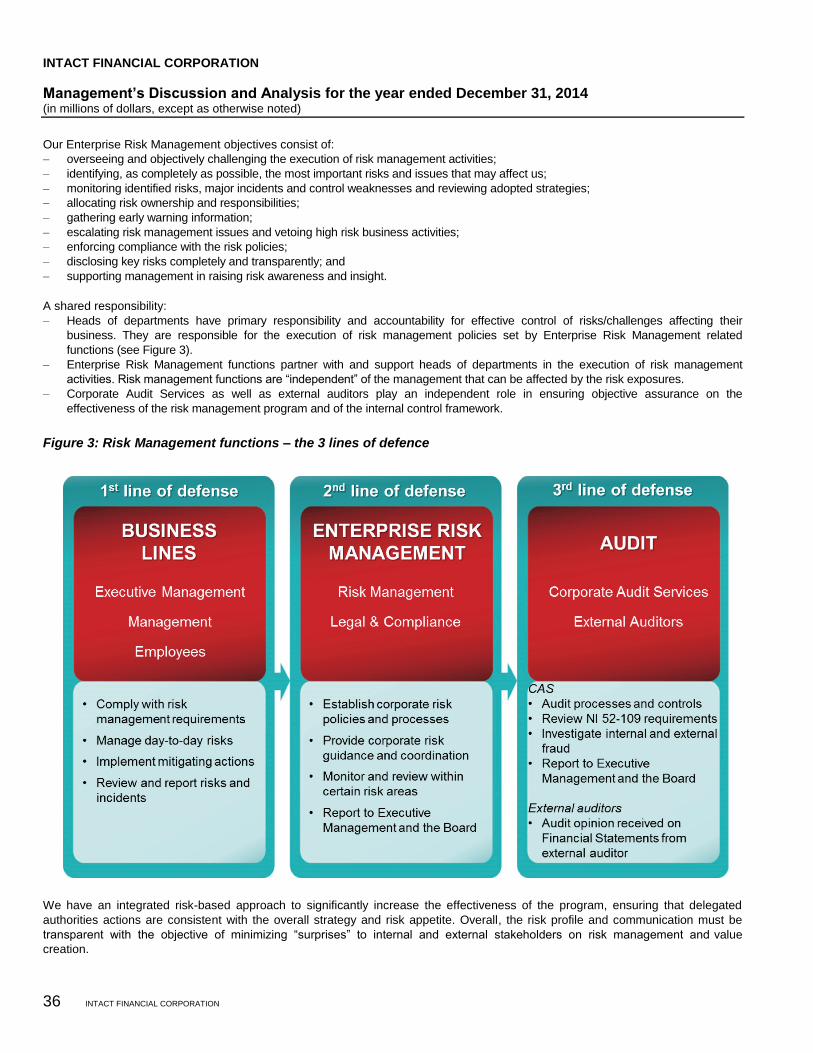
INTACT FINANCIAL CORPORATION
Management’s Discussion and Analysis for the year ended December 31, 2014 (in millions of dollars, except as otherwise noted)
36 INTACT FINANCIAL CORPORATION
Our Enterprise Risk Management objectives consist of:
— overseeing and objectively challenging the execution of risk management activities;
— identifying, as completely as possible, the most important risks and issues that may affect us;
— monitoring identified risks, major incidents and control weaknesses and reviewing adopted strategies;
— allocating risk ownership and responsibilities;
— gathering early warning information;
— escalating risk management issues and vetoing high risk business activities;
— enforcing compliance with the risk policies;
— disclosing key risks completely and transparently; and
— supporting management in raising risk awareness and insight.
A shared responsibility:
— Heads of departments have primary responsibility and accountability for effective control of risks/challenges affecting their
business. They are responsible for the execution of risk management policies set by Enterprise Risk Management related
functions (see Figure 3).
— Enterprise Risk Management functions partner with and support heads of departments in the execution of risk management
activities. Risk management functions are “independent” of the management that can be affected by the risk exposures.
— Corporate Audit Services as well as external auditors play an independent role in ensuring objective assurance on the
effectiveness of the risk management program and of the internal control framework.
Figure 3: Risk Management functions – the 3 lines of defence
We have an integrated risk-based approach to significantly increase the effectiveness of the program, ensuring that delegated
authorities actions are consistent with the overall strategy and risk appetite. Overall, the risk profile and communication must be
transparent with the objective of minimizing “surprises” to internal and external stakeholders on risk management and value
creation.
INTACT FINANCIAL CORPORATION
Management’s Discussion and Analysis for the year ended December 31, 2014 (in millions of dollars, except as otherwise noted)
INTACT FINANCIAL CORPORATION 37
12.5 Risk Appetite
How do we manage corporate risk?
From a risk management perspective, our objective is to protect the sustainability of our activities while delivering on our promises
to our stakeholders. To do so, we strive to maintain our financial strength, even in unpredictable environments or under extreme
stress. We take a prudent approach to managing risk, and the following principles help us establish the nature and scope of risks we
are willing to assume:
— we focus on our core competencies;
— we keep our overall risk profile in check;
— we protect ourselves against extreme events;
— we promote a strong risk management culture; and
— we maintain our ability to access capital markets at reasonable costs.
Please consult our website for a more detailed discussion on our Risk Appetite under the Corporate Governance section.
12.6 Main risk factors and mitigating actions
Our main risk factors together with our risk management practices used to mitigate these risks are explained below. Our practice is
to regularly identify our top risks, assess the likelihood of occurrence and evaluate the potential impacts should they materialize both
in terms of financial resources and reputation. We also consider potential emerging risks that are newly developing or changing
risks which are inherently more difficult to quantify. We then determine mitigation plans and assign accountability for each risk if
deemed appropriate given our overall assessment, our risk appetite, and our business objectives.
Insurance risk
Catastrophic events risk
The occurrence and severity of natural disasters may be affected by climate change and may take different forms, including but not
limited to hurricanes, wind storms, earthquakes, hailstorms, rainstorms, ice storms, floods, severe winter weather and fires.
Unnatural catastrophe events include but are not limited to hostilities, terrorist acts, riots, explosions, crashes and derailments.
Despite the use of sophisticated models, the incidence and severity of catastrophe events are inherently unpredictable. The extent
of losses from a catastrophic event is a function of both the total amount of insured exposure in the area affected by the event and
the severity of the event. Most catastrophic events are restricted to small geographic areas; however, hurricanes, windstorms and
earthquakes may produce significant damage in large, heavily populated areas. Catastrophic events can cause losses in a variety of
P&C insurance lines. For example, the ice storm in Eastern Canada in 1998 or more recently the Alberta Flood in June 2013 caused
P&C insurance losses in several lines of business, including business interruption, personal property, automobile and commercial
property. Although we have significantly reduced our earthquake exposure in Western Canada, the occurrence of a major
earthquake in Canada could have a significant impact on our profitability and financial condition and that of the entire property and
casualty insurance industry in Canada. Depending on the magnitude of the earthquake, its epicentre, and on the extent of the
damages, the losses could be substantial even after significant reinsurance recoveries. There could also be significant additional
costs to find the required reinsurance capacity upon further renewals. In addition, we could be subject to increased assessments
from the Property and Casualty Insurance Compensation Corporation (PACCIC) leading to further costs.
Claims resulting from natural or unnatural catastrophe events could cause substantial volatility in our financial results and could
materially reduce our profitability or harm our financial condition.
Our risk management strategy involves monitoring insured value accumulation and concentration of risks, catastrophe scenario
modeling, and the use of reinsurance. Consequently, the diversification of risk among an appropriate number of reinsurers is vital for
us. See Section 12.7 – Reinsurance for more details on our reinsurance program.
INTACT FINANCIAL CORPORATION
Management’s Discussion and Analysis for the year ended December 31, 2014 (in millions of dollars, except as otherwise noted)
38 INTACT FINANCIAL CORPORATION
Reserve adequacy risk
Our success depends upon our ability to accurately assess the risks associated with the insurance policies that we write. We
establish reserves to cover our estimated liability for the payment of all losses and loss adjustment expenses incurred with respect
to premiums collected or due on the insurance policies that we write. Reserves do not represent an exact calculation of liability.
Rather, reserves are our estimates of what we expect to be the ultimate cost of resolution and administration of claims. These
estimates are based upon various factors, including:
— actuarial projections of the cost of settlement and administration of claims reflecting facts and circumstances then known;
— estimates of trends in claims severity and frequency;
— judicial theories of liability;
— variables in claims handling procedures;
— economic factors (such as inflation);
— judicial and legislative trends, and actions such as class action lawsuits and judicial interpretation of coverage or policy exclusions;
and
— the level of insurance fraud.
Most or all of these factors are not directly quantifiable, particularly on a prospective basis, and the effects of these and unforeseen
factors could negatively impact our ability to accurately assess the risks of the policies that we write. In addition, there may be
significant reporting lags between the occurrence of the insured event and the time it is actually reported to the insurer and
additional lags between the time of reporting and final settlement of claims.
We continually refine our reserve estimates in an ongoing process as claims are reported and settled. Establishing an appropriate
level of reserves is an inherently uncertain process. The following factors may have a substantial impact on our future actual losses
and loss adjustment expenses experience:
— amounts of claims payments;
— expenses that we incur in resolving claims;
— legislative and judicial developments; and
— changes in economic variables such as interest rates and/or inflation.
To the extent that actual losses and loss adjustment expenses exceed our expectations and the reserves reflected in our
Consolidated financial statements, we will be required to reflect those changes by increasing our reserves. In addition, government
regulators could require that we increase our reserves if they determine that our reserves were understated in the past. When we
increase reserves, our income before income taxes for the period in which we do so will decrease by a corresponding amount. In
addition, increasing or strengthening reserves causes a reduction in our insurance subsidiaries’ capital and could cause a
downgrading of the financial strength ratings of our insurance subsidiaries. Any such downgrade could, in turn, adversely affect our
ability to sell insurance policies. See Section 9.3 – Claims liabilities for more details on the claims reserve and prior year claims
development.
Business cycle risk
The P&C insurance industry is cyclical, and we may witness changes in the appetite and underwriting capacity of our competitors,
depending on their own loss experience and results. This would have different impacts on pricing and our ability to write new
business. The industry’s profitability can be affected significantly by:
— competition;
— availability of capital to support the assumption of new business;
— rising levels of actual costs that are unforeseen by companies at the time they price their products;
— volatile and unpredictable developments, including unnatural, weather-related and other natural catastrophe events or terrorists’
attacks;
— changes in loss reserves resulting from the general claims and legal environments as different types of claims arise and judicial
interpretations relating to the scope of insurers’ liability develop;
— changes in insurance and tax laws and regulations as well as new legislative initiatives;
— general economic conditions, such as fluctuations in interest rates, inflation and other changes in the investment environment,
which affect returns on invested capital and may impact the ultimate payout of loss amounts; and
— general industry practices.
INTACT FINANCIAL CORPORATION
Management’s Discussion and Analysis for the year ended December 31, 2014 (in millions of dollars, except as otherwise noted)
INTACT FINANCIAL CORPORATION 39
The financial performance of the P&C insurance industry has historically tended to fluctuate in cyclical patterns of soft markets
generally characterized by increased competition resulting in lower premium rates and underwriting standards followed by hard
markets generally characterized by lessening competition, stricter underwriting standards and increasing premiums rates. Our
profitability tends to follow this cyclical market pattern with profitability generally increasing in hard markets and decreasing in soft
markets. These fluctuations in demand and competition could produce underwriting results that would have a negative impact on
our results of operations and financial condition.
Climate change risk
Climate change is a challenge faced by the entire P&C insurance industry. In particular, our home insurance business has been
affected due to changing climate patterns and an increase in the number and cost of claims associated with severe storms. Water
damages now make up more than half of our home insurance claims.
Over the last few years, we have witnessed a continued increase in the number and severity of weather events. Heavy wind, hail,
and rain in various parts of the country during 2013 and 2014 resulted in significant claims, particularly in our property insurance
portfolio. The trend in climate change poses a meaningful risk to our ability to meet our business objectives.
To address this issue, we have launched several initiatives including pricing and product changes to reflect new climate realities, a
Home Improvement Plan, a review of claims processes and a greater focus on consumer loss prevention and education. Many
initiatives were implemented in 2014 and are continuing in 2015. For example, the expanded use of deductibles and sub-limits in
personal property insurance across Canada should help mitigate, to some extent, P&C insurance losses resulting from water
damage. However, these initiatives may not be sufficient to mitigate this risk and maintain adequate profitability in the exposed lines
of business.
Reinsurance risk
We use reinsurance to help manage our exposure to insurance risk. The availability and cost of reinsurance is subject to prevailing
market conditions, both in terms of price and available capacity, which can affect our premium volume and profitability. 2011 was
particularly difficult for reinsurers, who faced many catastrophe losses around the world. It began with two earthquakes in New
Zealand and another one in Japan followed by a tsunami, but they were also heavily impacted by other events such as wind storms
in the U.S. and floods in Thailand. Consequently, there was an upward shift in reinsurance market conditions for earthquake
exposure in Canada in 2012. This clearly shows the impact worldwide catastrophe events can have on the reinsurers’ situation and,
therefore, on the conditions and support provided to us. Although worldwide catastrophe losses were lower in 2013 than in the
previous year, Canada has experienced an exceptionally high number of catastrophe events. Thus, the cost of catastrophe
reinsurance protection in Canada increased in 2014 as a result of this experience. In 2014, we witnessed a decrease in the overall
level of catastrophe losses in Canada. In addition, the demand for reinsurance capital has remained stable. Consequently, our
reinsurance rates are expected to be lower in 2015.
Reinsurance companies may exclude some coverage from the policies that we purchase from them or may alter the terms of such
policies from time to time. For example, following the terrorist attacks of September 11, 2001, some reinsurers excluded coverage
for terrorist acts or priced such coverage at prohibitively high rates. These gaps in reinsurance protection expose us to greater risks
and greater potential losses and could adversely affect our ability to write future business. We may not be able to successfully
mitigate risks through reinsurance arrangements, which could cause us to reduce our premiums written in certain lines or could
result in losses. We align the insurance and reinsurance terms and conditions as closely as possible to minimize these gaps. Other
details regarding reinsurance are also included at Section 12.7 – Reinsurance.
Underwriting ability risk
Our performance depends on our ability to reduce financial losses resulting from the selection of risks to be insured and
management of contract clauses. Unfavourable results in these areas can lead to deviations from the estimates based on actuarial
assumptions. We have adopted policies which specify our retention limits and risk tolerance and our application depends on training
and the discipline of our underwriting teams. Once the retention limits have been reached, we use reinsurance to cover the excess
risk. Moreover, our profitability and ability to grow may also be adversely affected by our mandatory participation in the Facility
Association in several automobile insurance markets including Ontario, Alberta, and the Maritimes.
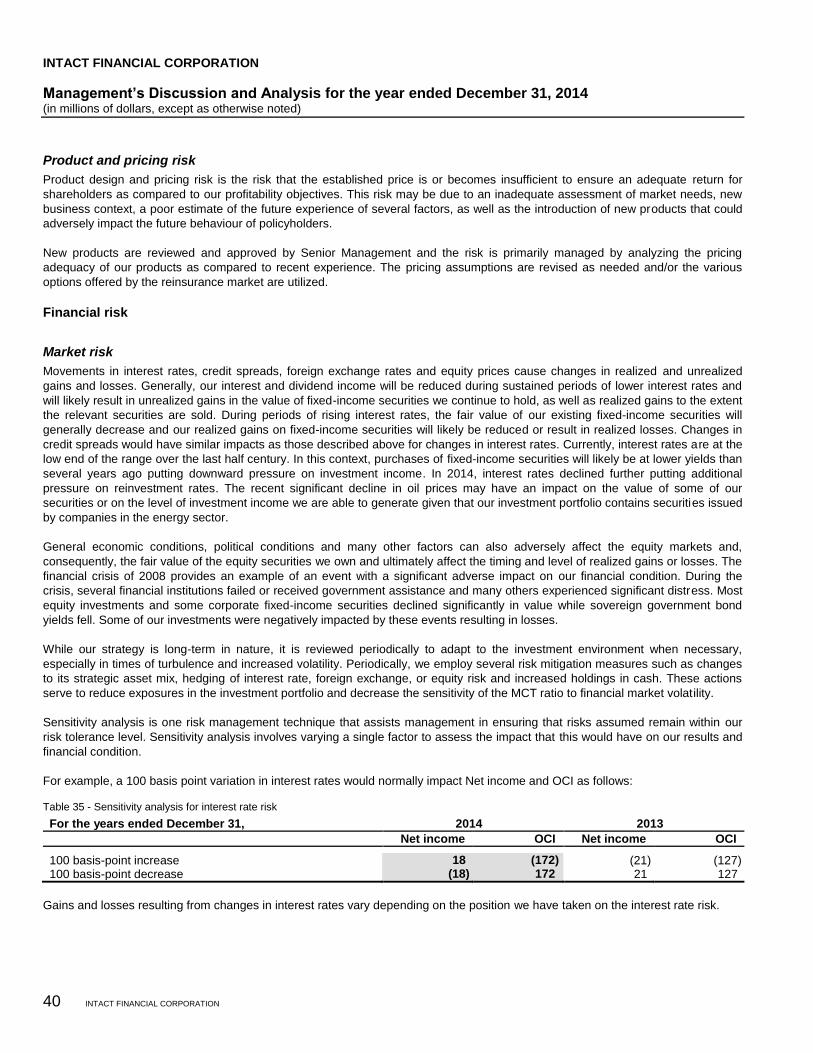
INTACT FINANCIAL CORPORATION
Management’s Discussion and Analysis for the year ended December 31, 2014 (in millions of dollars, except as otherwise noted)
40 INTACT FINANCIAL CORPORATION
Product and pricing risk
Product design and pricing risk is the risk that the established price is or becomes insufficient to ensure an adequate return for
shareholders as compared to our profitability objectives. This risk may be due to an inadequate assessment of market needs, new
business context, a poor estimate of the future experience of several factors, as well as the introduction of new products that could
adversely impact the future behaviour of policyholders.
New products are reviewed and approved by Senior Management and the risk is primarily managed by analyzing the pricing
adequacy of our products as compared to recent experience. The pricing assumptions are revised as needed and/or the various
options offered by the reinsurance market are utilized.
Financial risk
Market risk
Movements in interest rates, credit spreads, foreign exchange rates and equity prices cause changes in realized and unrealized
gains and losses. Generally, our interest and dividend income will be reduced during sustained periods of lower interest rates and
will likely result in unrealized gains in the value of fixed-income securities we continue to hold, as well as realized gains to the extent
the relevant securities are sold. During periods of rising interest rates, the fair value of our existing fixed-income securities will
generally decrease and our realized gains on fixed-income securities will likely be reduced or result in realized losses. Changes in
credit spreads would have similar impacts as those described above for changes in interest rates. Currently, interest rates are at the
low end of the range over the last half century. In this context, purchases of fixed-income securities will likely be at lower yields than
several years ago putting downward pressure on investment income. In 2014, interest rates declined further putting additional
pressure on reinvestment rates. The recent significant decline in oil prices may have an impact on the value of some of our
securities or on the level of investment income we are able to generate given that our investment portfolio contains securities issued
by companies in the energy sector.
General economic conditions, political conditions and many other factors can also adversely affect the equity markets and,
consequently, the fair value of the equity securities we own and ultimately affect the timing and level of realized gains or losses. The
financial crisis of 2008 provides an example of an event with a significant adverse impact on our financial condition. During the
crisis, several financial institutions failed or received government assistance and many others experienced significant distress. Most
equity investments and some corporate fixed-income securities declined significantly in value while sovereign government bond
yields fell. Some of our investments were negatively impacted by these events resulting in losses.
While our strategy is long-term in nature, it is reviewed periodically to adapt to the investment environment when necessary,
especially in times of turbulence and increased volatility. Periodically, we employ several risk mitigation measures such as changes
to its strategic asset mix, hedging of interest rate, foreign exchange, or equity risk and increased holdings in cash. These actions
serve to reduce exposures in the investment portfolio and decrease the sensitivity of the MCT ratio to financial market volatility.
Sensitivity analysis is one risk management technique that assists management in ensuring that risks assumed remain within our
risk tolerance level. Sensitivity analysis involves varying a single factor to assess the impact that this would have on our results and
financial condition.
For example, a 100 basis point variation in interest rates would normally impact Net income and OCI as follows:
Table 35 - Sensitivity analysis for interest rate risk
For the years ended December 31, 2014 2013
Net income OCI Net income OCI
100 basis-point increase 18 (172) (21) (127) 100 basis-point decrease (18) 172 21 127
Gains and losses resulting from changes in interest rates vary depending on the position we have taken on the interest rate risk.
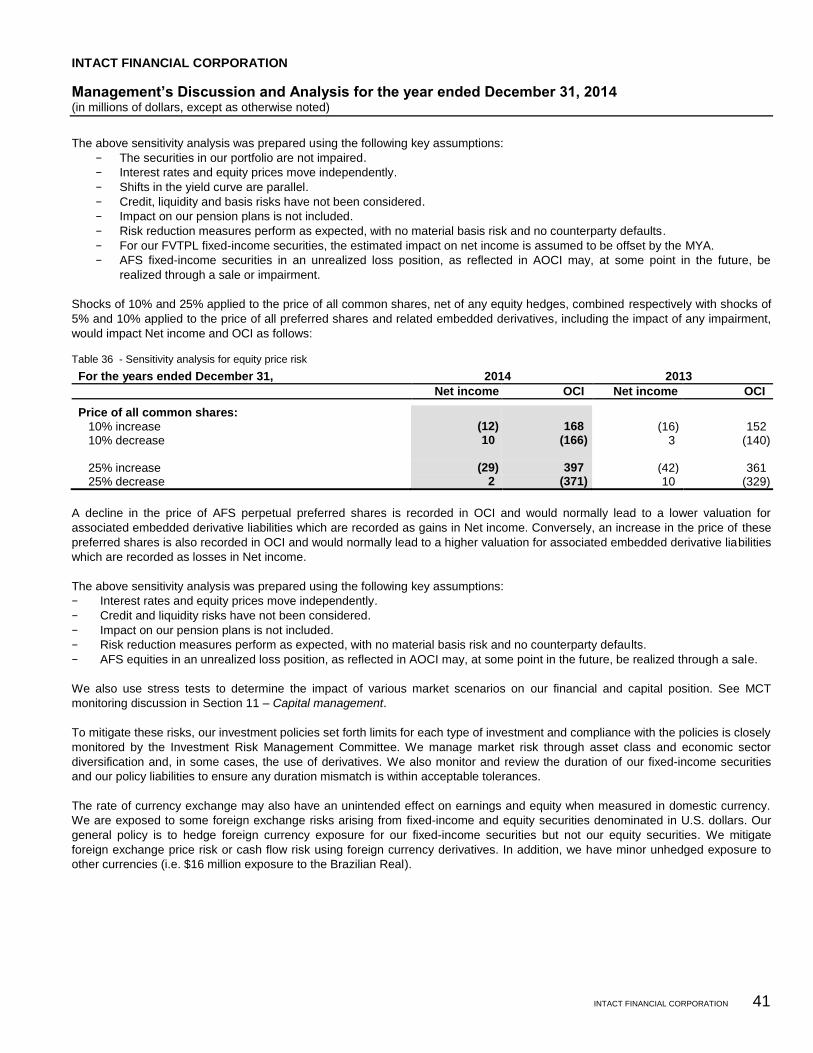
INTACT FINANCIAL CORPORATION
Management’s Discussion and Analysis for the year ended December 31, 2014 (in millions of dollars, except as otherwise noted)
INTACT FINANCIAL CORPORATION 41
The above sensitivity analysis was prepared using the following key assumptions:
− The securities in our portfolio are not impaired.
− Interest rates and equity prices move independently.
− Shifts in the yield curve are parallel.
− Credit, liquidity and basis risks have not been considered.
− Impact on our pension plans is not included.
− Risk reduction measures perform as expected, with no material basis risk and no counterparty defaults.
− For our FVTPL fixed-income securities, the estimated impact on net income is assumed to be offset by the MYA.
− AFS fixed-income securities in an unrealized loss position, as reflected in AOCI may, at some point in the future, be
realized through a sale or impairment.
Shocks of 10% and 25% applied to the price of all common shares, net of any equity hedges, combined respectively with shocks of
5% and 10% applied to the price of all preferred shares and related embedded derivatives, including the impact of any impairment,
would impact Net income and OCI as follows:
Table 36 - Sensitivity analysis for equity price risk
For the years ended December 31, 2014 2013
Net income OCI Net income OCI
Price of all common shares: 10% increase (12) 168 (16) 152 10% decrease 10 (166) 3 (140) 25% increase (29) 397 (42) 361 25% decrease 2 (371) 10 (329)
A decline in the price of AFS perpetual preferred shares is recorded in OCI and would normally lead to a lower valuation for
associated embedded derivative liabilities which are recorded as gains in Net income. Conversely, an increase in the price of these
preferred shares is also recorded in OCI and would normally lead to a higher valuation for associated embedded derivative liabilities
which are recorded as losses in Net income.
The above sensitivity analysis was prepared using the following key assumptions:
− Interest rates and equity prices move independently.
− Credit and liquidity risks have not been considered.
− Impact on our pension plans is not included.
− Risk reduction measures perform as expected, with no material basis risk and no counterparty defaults.
− AFS equities in an unrealized loss position, as reflected in AOCI may, at some point in the future, be realized through a sale.
We also use stress tests to determine the impact of various market scenarios on our financial and capital position. See MCT
monitoring discussion in Section 11 – Capital management.
To mitigate these risks, our investment policies set forth limits for each type of investment and compliance with the policies is closely
monitored by the Investment Risk Management Committee. We manage market risk through asset class and economic sector
diversification and, in some cases, the use of derivatives. We also monitor and review the duration of our fixed-income securities
and our policy liabilities to ensure any duration mismatch is within acceptable tolerances.
The rate of currency exchange may also have an unintended effect on earnings and equity when measured in domestic currency.
We are exposed to some foreign exchange risks arising from fixed-income and equity securities denominated in U.S. dollars. Our
general policy is to hedge foreign currency exposure for our fixed-income securities but not our equity securities. We mitigate
foreign exchange price risk or cash flow risk using foreign currency derivatives. In addition, we have minor unhedged exposure to
other currencies (i.e. $16 million exposure to the Brazilian Real).
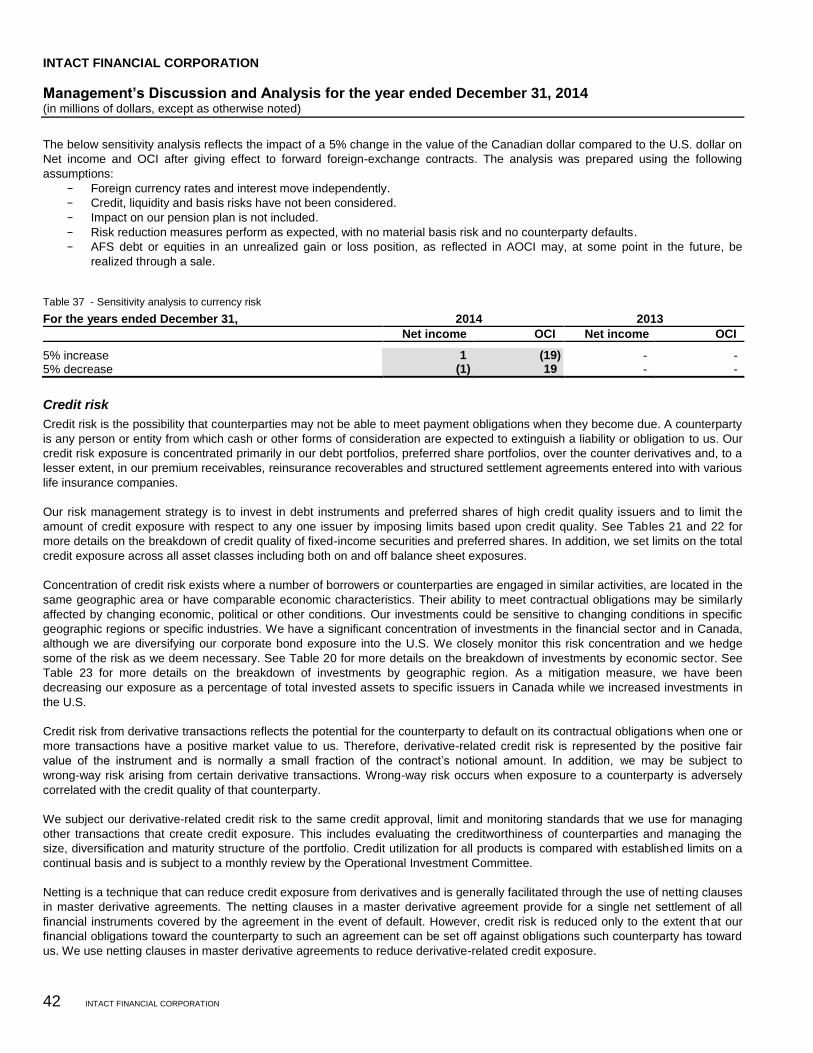
INTACT FINANCIAL CORPORATION
Management’s Discussion and Analysis for the year ended December 31, 2014 (in millions of dollars, except as otherwise noted)
42 INTACT FINANCIAL CORPORATION
The below sensitivity analysis reflects the impact of a 5% change in the value of the Canadian dollar compared to the U.S. dollar on
Net income and OCI after giving effect to forward foreign-exchange contracts. The analysis was prepared using the following
assumptions:
− Foreign currency rates and interest move independently.
− Credit, liquidity and basis risks have not been considered.
− Impact on our pension plan is not included.
− Risk reduction measures perform as expected, with no material basis risk and no counterparty defaults.
− AFS debt or equities in an unrealized gain or loss position, as reflected in AOCI may, at some point in the future, be
realized through a sale.
Table 37 - Sensitivity analysis to currency risk
For the years ended December 31, 2014 2013
Net income OCI Net income OCI
5% increase 1 (19) - - 5% decrease (1) 19 - -
Credit risk
Credit risk is the possibility that counterparties may not be able to meet payment obligations when they become due. A counterparty
is any person or entity from which cash or other forms of consideration are expected to extinguish a liability or obligation to us. Our
credit risk exposure is concentrated primarily in our debt portfolios, preferred share portfolios, over the counter derivatives and, to a
lesser extent, in our premium receivables, reinsurance recoverables and structured settlement agreements entered into with various
life insurance companies.
Our risk management strategy is to invest in debt instruments and preferred shares of high credit quality issuers and to limit the
amount of credit exposure with respect to any one issuer by imposing limits based upon credit quality. See Tables 21 and 22 for
more details on the breakdown of credit quality of fixed-income securities and preferred shares. In addition, we set limits on the total
credit exposure across all asset classes including both on and off balance sheet exposures.
Concentration of credit risk exists where a number of borrowers or counterparties are engaged in similar activities, are located in the
same geographic area or have comparable economic characteristics. Their ability to meet contractual obligations may be similarly
affected by changing economic, political or other conditions. Our investments could be sensitive to changing conditions in specific
geographic regions or specific industries. We have a significant concentration of investments in the financial sector and in Canada,
although we are diversifying our corporate bond exposure into the U.S. We closely monitor this risk concentration and we hedge
some of the risk as we deem necessary. See Table 20 for more details on the breakdown of investments by economic sector. See
Table 23 for more details on the breakdown of investments by geographic region. As a mitigation measure, we have been
decreasing our exposure as a percentage of total invested assets to specific issuers in Canada while we increased investments in
the U.S.
Credit risk from derivative transactions reflects the potential for the counterparty to default on its contractual obligations when one or
more transactions have a positive market value to us. Therefore, derivative-related credit risk is represented by the positive fair
value of the instrument and is normally a small fraction of the contract’s notional amount. In addition, we may be subject to
wrong-way risk arising from certain derivative transactions. Wrong-way risk occurs when exposure to a counterparty is adversely
correlated with the credit quality of that counterparty.
We subject our derivative-related credit risk to the same credit approval, limit and monitoring standards that we use for managing
other transactions that create credit exposure. This includes evaluating the creditworthiness of counterparties and managing the
size, diversification and maturity structure of the portfolio. Credit utilization for all products is compared with established limits on a
continual basis and is subject to a monthly review by the Operational Investment Committee.
Netting is a technique that can reduce credit exposure from derivatives and is generally facilitated through the use of netting clauses
in master derivative agreements. The netting clauses in a master derivative agreement provide for a single net settlement of all
financial instruments covered by the agreement in the event of default. However, credit risk is reduced only to the extent that our
financial obligations toward the counterparty to such an agreement can be set off against obligations such counterparty has toward
us. We use netting clauses in master derivative agreements to reduce derivative-related credit exposure.
INTACT FINANCIAL CORPORATION
Management’s Discussion and Analysis for the year ended December 31, 2014 (in millions of dollars, except as otherwise noted)
INTACT FINANCIAL CORPORATION 43
The overall exposure to credit risk that is reduced through the netting clauses may change substantially following the reporting date
as the exposure is affected by each transaction subject to the agreement as well as by changes in underlying market rates and
values.
The use of collateral is another significant credit mitigation technique for managing derivative-related counterparty credit risk.
Mark-to-market provisions in our agreements with some counterparties provide us with the right to request that the counterparty pay
down or collateralize the current market value of its derivatives positions when the value passes a specified threshold amount.
We enter into annuity agreements with various Canadian life insurance companies, which have credit ratings of at least ‘A-’, to
provide for fixed and recurring payments to claimants. Under such arrangements, we no longer record the liability in our
Consolidated balance sheet as the liability to the claimants is substantially discharged, although we remain exposed to the credit
risk that life insurers may fail to fulfill their obligations.
Use of derivatives
We use derivatives principally to mitigate certain of the above mentioned risks. Our use of derivatives exposes us to a number of
risks, including credit risk, as well as interest rate, equity market and currency fluctuations. The hedging of certain risks with
derivatives results in basis risk. Basis risk is the risk that offsetting investments in a hedging strategy will not experience price
changes in entirely opposite directions from each other. This imperfect correlation between the two investments creates the
potential for excess gains or losses in a hedging strategy, thus adding risk to the position. We monitor the effectiveness of our
hedges on a regular basis.
Credit downgrade risk
Independent third party rating agencies assess our ability to honour our financial obligations (the “issuer credit rating”) and our
insurance subsidiaries’ ability to meet their ongoing policyholder obligations (the “financial strength rating”).
The rating agencies periodically evaluate us to confirm that we continue to meet the criteria of the ratings previously assigned to us.
We may not be in a position to maintain either the issuer credit ratings or the financial strength ratings we have received from the
rating agencies. An issuer credit rating downgrade could result in materially higher borrowing costs. A financial strength rating
downgrade could result in a reduction in the number of insurance contracts we write and in a significant loss of business; as such
business could move to other competitors with higher ratings, thus causing premiums and earnings to decrease.
Credit downgrades may affect our ability to raise capital or may result in an increase in the cost of raising capital with negative
implications for shareholders and other stakeholders.
Liquidity risk
Liquidity risk is the risk that we will encounter difficulty in raising funds to meet obligations associated with financial liabilities.
To manage our cash flow requirements, we maintain a portion of our investments in liquid securities.
Our liquidity management is governed by establishing a prudent policy that identifies oversight responsibilities as well as by setting
limits and implementing effective techniques to monitor, measure and control exposure to liquidity risk. A portion of investments is
maintained in short-term (less than one year) highly liquid money market securities, which are used to manage our operational
requirements. A large portion of the investments are held in highly liquid unencumbered federal and provincial government debt to
protect against any unanticipated large cash requirements. In some circumstances requiring significant cash outflows such as a
large natural catastrophe, our reinsurance program is expected to provide an additional source of liquidity subject to the
aforementioned credit risk on reinsurance recoverables. We also have an unsecured committed credit facility as an additional
potential source of liquidity (see Section 10.1 – Financing and capital structure for further details on this facility).
We have issued term notes to finance acquisitions and for general corporate purposes. To manage liquidity risk, we have issued
longer term maturities and have staggered the maturities accordingly.
INTACT FINANCIAL CORPORATION
Management’s Discussion and Analysis for the year ended December 31, 2014 (in millions of dollars, except as otherwise noted)
44 INTACT FINANCIAL CORPORATION
Limit on dividend and capital distribution risk
As a holding company, IFC is a legal entity and is separate and distinct from its operating subsidiaries, most of which are regulated
insurance companies. While no regulatory approval is required for dividend payments from the regulated insurance companies,
OSFI notice is required together with pro forma capital calculations showing internal target capital levels are maintained both before
and after such dividends are paid out. In addition, for competitive reasons, our insurance subsidiaries maintain financial strength
ratings which require us maintain minimum capital levels in our insurance subsidiaries. These regulations and ratings targets limit
the ability of our insurance subsidiaries to pay unlimited dividends or invest all of their capital in other ways. In certain stressed
scenarios these limitations on our subsidiaries’ ability to pay dividends to IFC could have a material adverse effect on our business
and financial condition, our ability to pay shareholder dividends and the price of securities we have issued.
Strategic risk
Competition risk
The P&C insurance industry is highly competitive and intense competition for our insurance products could harm our ability to
maintain or increase our profitability, premium levels and written insured risk volume. We believe that the industry will remain highly
competitive in the foreseeable future. We also believe that competition in our business lines is based on price, service, commission
structure, product features, financial strength and scale, ability to pay claims, ratings, reputation and name or brand recognition.
We compete with a large number of domestic and foreign insurers as well as with several Canadian banks that are selling insurance
products. These firms may use business models different than ours and sell products through various distribution channels,
including aggregators, brokers and agents who sell products exclusively for one insurer and directly to the consumer. We compete
not only for business and individual customers, employers and other group customers but also for brokers and other distributors of
investment and insurance products.
The entrance of a new player in the market or a shift in methods to purchase insurance could challenge our distribution model.
The use of information technology in the distribution and pricing of insurance products (e.g. Usage Based Insurance) increased
steadily in 2014 and this trend is expected to continue in the near future. We launched our own Usage Based Insurance (UBI)
product in 2014 to better meet customer needs and to mitigate competition risk. However, this new initiative may not produce the
expected benefits and could lead to negative reputational consequences.
Our multi-channel distribution strategy including the broker channel, direct to consumer brands and web platforms, enhances our
ability to adapt to evolving conditions in the insurance market. To secure strong relationships with our brokers, we provide them with
advanced technology and support their growth with innovative financing. We invest significantly in promoting our brands with an
increasing focus on using web and mobile technology to reach consumers.
Consolidation in the Canadian P&C industry continued in 2014. As competitors gain scale, it may erode our competitive advantage.
Distribution risk
Distribution risk is the risk related to the distribution of our P&C insurance products. It includes the inherent risk of dealing with
independent distributors, the risk related to new market entrants and the risk associated with our multiple distribution channel
strategy. We may also face the risk that one of our channels or business models would not be sustainable in a specific market or
context.
We distribute our products primarily through a network of brokers and a great part of our success depends on the capacity of this
network to be competitive against other distributors, including direct insurers and web aggregators, as well as our ability to maintain
our business relationships with them while developing our distribution network strategy. The evolution of customer preferences for
different distribution channels could lead to a material decline in our market share.
These brokers sell our competitors’ insurance products and may stop selling our insurance products altogether. Strong competition
exists among insurers for brokers with demonstrated ability to sell insurance products. Premium volume and profitability could be
materially adversely affected if there is a material decrease in the number of brokers that choose to sell our insurance products. In
addition, our strategy of distributing through the direct channel may adversely impact our relationship with brokers who distribute our
products.
INTACT FINANCIAL CORPORATION
Management’s Discussion and Analysis for the year ended December 31, 2014 (in millions of dollars, except as otherwise noted)
INTACT FINANCIAL CORPORATION 45
From time to time we issue loans or take equity participation in certain brokers and consequently, we expose ourselves to financial
risk and to potential relationship issues. In order to maintain strong relationships with brokers, each relationship is managed by
officers in each of the main regions in which we operate. To mitigate the financial risk we generally receive guarantees and use
standard agreements which contain general security and oversight clauses. The Board of Directors participates in this oversight
process by reviewing these activities periodically. For various reasons, the broker channel has been in a consolidation mode for the
last few years and we believe that this situation will continue for the next few years. The acquisition of brokers by others or even by
insurers may impact our relationship with some of them and jeopardize our ability to grow our business.
We have established close relationships with our independent distributors by providing technology and training to help strengthen
their market position. We closely monitor pricing gaps between our various channels and manage the different channels under
different brand names including BrokerLink, our wholly owned broker network.
Regulation and legal risk
Our insurance subsidiaries are subject to regulation and supervision by insurance regulatory authorities of the jurisdictions in which
they are incorporated and licensed to conduct business. These laws and regulations delegate regulatory, supervisory and
administrative powers to federal, provincial and territorial insurance commissioners and agencies. Such laws and regulations are
generally designed to protect policyholders and creditors rather than shareholders, and are related to matters including:
— personal auto insurance rate setting;
— risk-based capital and solvency standards;
— restrictions on types of investments;
— maintenance of adequate reserves for unearned premiums and unpaid claims;
— examination of insurance companies by regulatory authorities, including periodic financial and market conduct examinations;
— licensing of insurers, agents and brokers;
— limitations on dividends and transactions with affiliates; and
— regulatory actions.
We believe that our insurance subsidiaries are in material compliance with all applicable regulatory requirements. It is not possible
to predict the future impact of changing federal, provincial and territorial regulations on our operations, and we cannot be sure that
laws and regulations enacted in the future will not be more restrictive than current laws. Overall, our business is heavily regulated
and changes in regulation may reduce our profitability and limit our growth.
In addition, these laws and regulations typically require us to periodically file financial statements and annual reports, prepared on a
statutory accounting basis, and other information with insurance regulatory authorities, including information concerning our capital
structure, ownership and financial condition including, on an annual basis, the aggregate amount of contingent commissions paid
and general business operations. We could be subject to regulatory actions, sanctions and fines if a regulatory authority believed we
had failed to comply with any applicable law or regulation. Any such failure to comply with applicable laws could result in the
imposition of significant restrictions on our ability to do business or significant penalties, which could adversely affect our reputation,
results of operations and financial condition. In addition, any changes in laws and regulations, including the adoption of consumer or
other initiatives regarding contingent and other commissions, rates charged for automobile or claims handling procedures, could
materially adversely affect our business, results of operations and financial condition.
In addition to the occasional employment-related litigation, we are a defendant in a number of claims relating to our insurance and
other related business operations. We may from time to time be subject to a variety of legal and regulatory actions relating to our
current and past business operations, including, but not limited to:
— disputes over coverage or claims adjudication;
— disputes regarding sales practices, disclosures, premium refunds, licensing, regulatory compliance and compensation
arrangements;
— disputes with our agents, brokers or network providers over compensation and termination of contracts and related claims;
— regulatory actions relating to consumer pressure in relation to benefits realized by insurers;
— disputes with taxing authorities regarding our tax liabilities and tax assets; and
— disputes relating to certain businesses acquired or disposed of by us.
INTACT FINANCIAL CORPORATION
Management’s Discussion and Analysis for the year ended December 31, 2014 (in millions of dollars, except as otherwise noted)
46 INTACT FINANCIAL CORPORATION
Plaintiffs may also continue to bring new types of legal claims against us. Current and future court decisions and legislative activity
may increase our exposure to these types of claims. Multiparty or class action claims may present additional exposure to substantial
economic, non-economic or punitive damage awards. The loss of even one of these claims, if it resulted in a significant damage
award or a judicial ruling that was otherwise detrimental, could have a material adverse effect on our results of operations and
financial condition. Unfavourable claim rulings may render fair settlements more difficult to reach. We cannot determine with any
certainty what new theories of recovery may evolve or what their impact may be on our businesses.
We may be subject to governmental or administrative investigations and proceedings in the context of our highly regulated sectors
of activity. We cannot predict the outcome of these investigations, proceedings and reviews, and cannot be sure that such
investigations, proceedings or reviews or related litigation or changes in operating policies and practices would not materially
adversely affect our results of operations and financial condition. In addition, if we were to experience difficulties with our
relationship with a regulatory body in a given jurisdiction, it could have a material adverse effect on our ability to do business in that
jurisdiction and the price of our common shares.
We are supported by an in-house team of lawyers and staff, and by outside counsel when deemed necessary or appropriate, in
handling general regulation and litigation issues and are an active member of the major industry associations. Additionally, our
government relations team ensures contact with the governments of the various jurisdictions in which we operate, and can be
proactive in situations that could affect our business.
In addition, our profitability can be significantly affected by many factors, including:
— regulatory regimes which limit our ability to detect and defend against fraudulent claims and fraud rings;
— developing trends in tort and class action litigation;
— changes in other laws or regulations, including the adoption of consumer initiatives regarding rates charged for automobile or other
insurance coverage or claims handling procedures; and
— privacy and consumer protection laws that prevent insurers from assessing risks or factors that have a high correlation with risks
considered, such as credit scoring.
As a mitigation action, we regularly monitor trends and make adjustments to our strategy and products, when deemed appropriate,
to ensure the sustainability of insurance products and to avoid the potential for additional regulation that may negatively impact our
profitability and financial condition.
General economic, financial market and political conditions
Our businesses and profitability may be materially adversely affected from time to time by general economic, financial market and
political conditions. In periods of economic downturn characterized by higher unemployment, lower family income, lower corporate
earnings, lower business investment and lower consumer spending, individuals and businesses may choose not to purchase
insurance products, may allow existing policies to lapse, or may choose to reduce the amount of coverage purchased. In addition to
the demand for our insurance products being adversely affected, frequency or severity of claims could increase, resulting in lower
earnings. General inflationary pressures may affect the costs of medical care, automobile parts and repair, construction and other
items, and may increase the costs of paying claims.
In addition to the risk related to investments discussed previously, an economic downturn could have a significant impact on the
financial condition of our defined benefit pension plans. Consequently, this could impact our financial condition.
Solvency risk
Regulatory authorities closely monitor the solvency of insurance companies by requiring them to comply with strict solvency
standards based on the risk assumed by each company with respect to asset composition, liability composition, and the matching
between these two components. We are required to submit regular reports to the regulatory authorities regarding our solvency, and
publish our solvency ratio every quarter. The minimum capital test (MCT) ratio that we target for our regulated subsidiaries is 170%,
which is higher than the regulatory requirement of 150%. The appointed actuary must present an annual report to the Risk
Management Committee and the Enterprise Risk Committee on our current and future solvency and mitigating measures. In 2014,
we revised our capital management policy. The policy contains guidelines to help ensure that we maintain adequate capital to
withstand adverse event scenarios and has documented procedures to take corrective actions should any unanticipated conditions
arise. In addition, we conducted a full internal solvency assessment as described below in Section 12.8 – Own Risk and Solvency
Assessment.
INTACT FINANCIAL CORPORATION
Management’s Discussion and Analysis for the year ended December 31, 2014 (in millions of dollars, except as otherwise noted)
INTACT FINANCIAL CORPORATION 47
Effective January 2015, the impact of revised MCT guidelines will be positive for our insurance subsidiaries and, all else being
equal, will reduce solvency risk from a regulatory perspective. Any future strategic or capital management decisions may have a
material impact on our solvency risk.
Reputation risk
Our insurance products and services are ultimately distributed to individual consumers and businesses. From time to time,
consumer advocacy groups or the media may focus attention on our products and services, thereby subjecting us or our
subsidiaries to periodic negative publicity. We also may be negatively impacted in relation to our information systems, security and
technology, or if one of our subsidiaries engages in practices resulting in increased public attention to our businesses. Negative
publicity may also result in increased regulation and legislative scrutiny of practices in the P&C insurance industry as well as
increased litigation. Such increase may further increase our costs of doing business and adversely affect our profitability by
impeding our ability to market our products and services, requiring us to change our products or services or increasing the
regulatory burdens under which we operate. The periodic negative publicity of insurance and related businesses may negatively
impact our financial results and financial condition.
To mitigate these risks the Board of Directors has created the Disclosure Committee which is composed of senior officers and
chaired by the Chief Legal Officer. This committee oversees our disclosure practices and procedures, its role includes maintaining
awareness and understanding of corporate disclosure rules and guidelines, educating and informing employees about our
disclosure practices, determining whether corporate developments constitute material information and reviewing and approving all
our material disclosure releases or statements. In addition, the Enterprise Risk Committee monitors our operations to identify
situations that can negatively affect our reputation. If necessary, the Enterprise Risk Committee approves policies and implements
procedures to mitigate reputation risk.
Operational risk
These risks are essentially resulting from inadequate or failed processes, people and systems or from external events. These
include events such as unauthorized activity, internal and external criminal activity, and information security failure, among others.
We believe that managing the risks related to our business activities significantly reduces losses resulting from failed processes,
procedures or controls, inadequate systems, human errors, fraud or external events such as natural disasters. To manage these
risks, we follow a specific framework that is composed of different steps including identification, assessment, response, and
monitoring.
For early detection of and clear insight into our key operational risks or any other related type of risks, the Risk Management team
uses many tools including periodic risk review interviews with management and risk assessments of our critical functions. It also
monitors and measures our risks on an ongoing basis through key risk indicators which enable management to proactively initiate
effective actions. We have also developed clear incident reporting channels within the organization to systematically report, manage
and monitor operational incidents which could lead to potential financial losses or reputation damage. Ongoing training and
exercises provided to all employees also contribute to increasing the operational risk awareness culture within the organization and
minimizing the severity and occurrence of incidents.
The effective implementation of the overall operational risk management program depends on management. Management is
supported by the Risk Management department which assists in monitoring the risk processes and ensuring that appropriate actions
are taken when necessary. Our Operational Risk Committee supports the Enterprise Risk Committee in the oversight and
management of operational risk.
Information technology risk
The use of information technology enables us to increase our productivity, to offer attractive products and interfaces to existing and
potential customers, and to distinguish ourselves from the competition by benefiting from a competitive advantage. However, our
dependency on technology, network, telephony and critical applications makes our ability to operate and our profitability vulnerable
to service interruption, third party agreement failure and security breaches. Massive denial of service attacks and system intrusion
attempts could compromise our ability to operate and we could be unable to safeguard confidential information from public
disclosure. To maintain our performance levels we are required to periodically modernize our systems and to constantly seek to
renew. Time required for accomplishing projects, unplanned delay or cost, or not being successful in executing such projects could
lead to a significant decline in service levels, impact retention negatively and jeopardize our competitive advantage.
INTACT FINANCIAL CORPORATION
Management’s Discussion and Analysis for the year ended December 31, 2014 (in millions of dollars, except as otherwise noted)
48 INTACT FINANCIAL CORPORATION
Information security risks for financial institutions have increased in recent years. Criminal organizations, hackers, and other
external actors have become more active and better equipped to attack even robust systems and networks. We and the third
parties that provide services to us may be the subject of information security breaches. Such incidents could result in financial loss,
government and regulatory action, and reputational damage. In 2014, we witnessed a number of high profile information security
breaches in well-established and sophisticated organizations. News of technology vulnerabilities such as the Heartbleed bug
caused many firms to react quickly to mitigate the risk of information leakage.
To ensure the security and the resilience of our systems, the safeguard of our confidential information and the integrity of our
information and databases, various dedicated teams plan, test and execute our continuity and security plans, including threat and
vulnerability assessments and appropriate mitigation actions. Their efforts are supported by teams constantly monitoring our
systems and ready to intervene if an incident occurs. To ensure the expected levels of service are delivered by our critical
third-party service providers, service level agreements are signed and added to relevant contracts. We continue to upgrade our
applications to better protect our systems and information and monitor trends in cyber risk to ensure we rapidly mitigate known
vulnerabilities. Despite these efforts, this remains a material risk and we may suffer a loss of confidential information leading to
financial loss, regulatory action, and reputational harm.
Business interruption risk
We may also experience an abrupt interruption of activities caused by unforeseeable and/or catastrophe events, an example of
which being a global pandemic (e.g. the Ebola virus). Our operations may be subject to losses resulting from such disruptions.
Losses can relate to property, financial assets, trading positions and also to key personnel. If our business continuity plans cannot
be put into action or do not take such events into account, losses may increase further.
We continuously monitor world events, such as the recent escalation in the Ebola virus outbreak, to enable us to pro-actively adapt
our response plan. In order to maintain the integrity and continuity of our operations in the event of a crisis, we have developed
personalized alert and mobilization procedures as well as communication protocols. For example, emergency action plans, business
continuity plans, business recovery plans, major health crisis plans, building evacuation plans and crisis communication plans have
all been defined and are tested on an ongoing basis. This process is supported by a crisis management structure adapted to our
organization and to the type of events we may have to manage.
Dependency on key employees risk
Our success has been, and will continue to be, dependent on our ability to retain the services of our existing key employees and to
attract and retain additional qualified personnel in the future. The loss of the services of any of our key employees, or the inability to
identify, hire and retain other highly qualified personnel in the future, could adversely affect the quality and profitability of our
business operations.
We have developed a focused recruiting strategy to aggressively market careers and opportunities at Intact. The strategy includes
an updated web site, focused external recruiting, campaigns, rebranding, and targeted advertising. It also includes partnering with
four universities on graduate recruiting as well as commercial and personal lines trainee program recruiting. Talent identification and
development programs have been implemented to retain and grow existing talent. We also have a comprehensive succession
planning program at various levels within the organization to ensure we are prepared for unplanned departures and retirements.
12.7 Reinsurance
In the ordinary course of business, we reinsure certain risks with other reinsurers to limit our maximum loss in the event of
catastrophe events or other significant losses.
Our objectives related to ceded reinsurance are:
— capital protection;
— reduction in the volatility of results;
— increase in underwriting capacity; and
— access to the expertise of reinsurers.
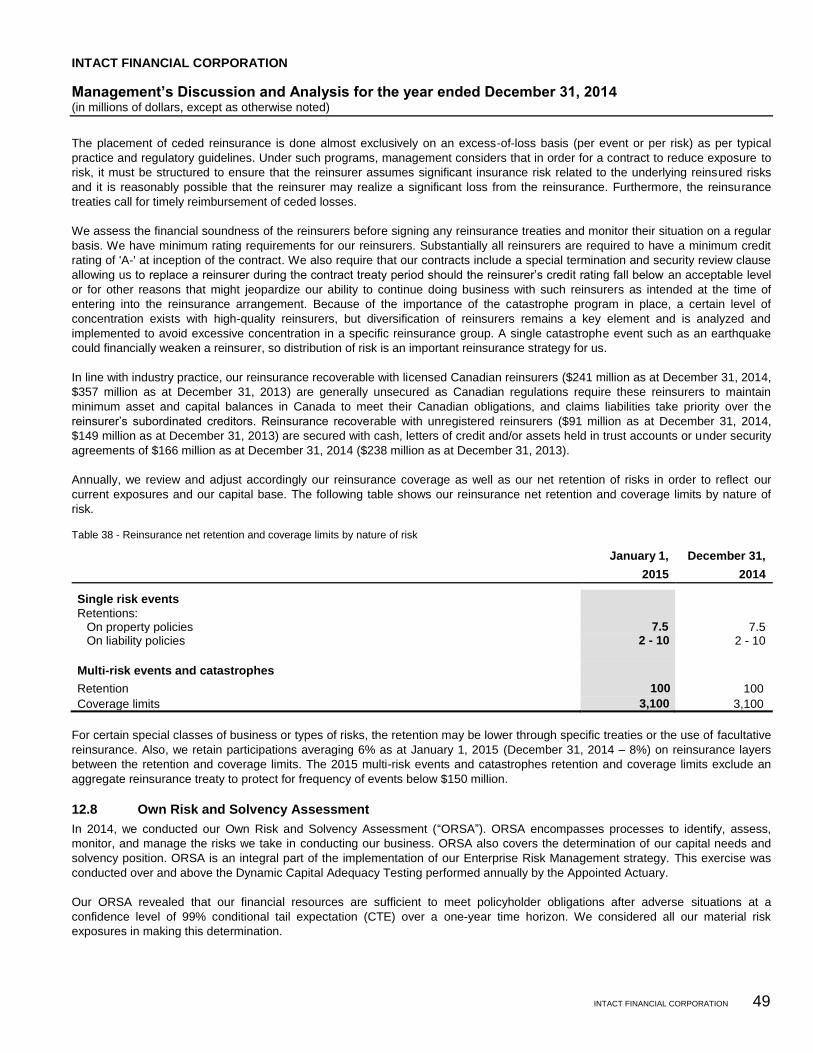
INTACT FINANCIAL CORPORATION
Management’s Discussion and Analysis for the year ended December 31, 2014 (in millions of dollars, except as otherwise noted)
INTACT FINANCIAL CORPORATION 49
The placement of ceded reinsurance is done almost exclusively on an excess-of-loss basis (per event or per risk) as per typical
practice and regulatory guidelines. Under such programs, management considers that in order for a contract to reduce exposure to
risk, it must be structured to ensure that the reinsurer assumes significant insurance risk related to the underlying reinsured risks
and it is reasonably possible that the reinsurer may realize a significant loss from the reinsurance. Furthermore, the reinsurance
treaties call for timely reimbursement of ceded losses.
We assess the financial soundness of the reinsurers before signing any reinsurance treaties and monitor their situation on a regular
basis. We have minimum rating requirements for our reinsurers. Substantially all reinsurers are required to have a minimum credit
rating of 'A-' at inception of the contract. We also require that our contracts include a special termination and security review clause
allowing us to replace a reinsurer during the contract treaty period should the reinsurer’s credit rating fall below an acceptable level
or for other reasons that might jeopardize our ability to continue doing business with such reinsurers as intended at the time of
entering into the reinsurance arrangement. Because of the importance of the catastrophe program in place, a certain level of
concentration exists with high-quality reinsurers, but diversification of reinsurers remains a key element and is analyzed and
implemented to avoid excessive concentration in a specific reinsurance group. A single catastrophe event such as an earthquake
could financially weaken a reinsurer, so distribution of risk is an important reinsurance strategy for us.
In line with industry practice, our reinsurance recoverable with licensed Canadian reinsurers ($241 million as at December 31, 2014,
$357 million as at December 31, 2013) are generally unsecured as Canadian regulations require these reinsurers to maintain
minimum asset and capital balances in Canada to meet their Canadian obligations, and claims liabilities take priority over the
reinsurer’s subordinated creditors. Reinsurance recoverable with unregistered reinsurers ($91 million as at December 31, 2014,
$149 million as at December 31, 2013) are secured with cash, letters of credit and/or assets held in trust accounts or under security
agreements of $166 million as at December 31, 2014 ($238 million as at December 31, 2013).
Annually, we review and adjust accordingly our reinsurance coverage as well as our net retention of risks in order to reflect our
current exposures and our capital base. The following table shows our reinsurance net retention and coverage limits by nature of
risk.
Table 38 - Reinsurance net retention and coverage limits by nature of risk
January 1,
2015
December 31,
2014
Single risk events
Retentions: On property policies 7.5 7.5 On liability policies 2 - 10 2 - 10
Multi-risk events and catastrophes
Retention 100 100
Coverage limits 3,100 3,100
For certain special classes of business or types of risks, the retention may be lower through specific treaties or the use of facultative
reinsurance. Also, we retain participations averaging 6% as at January 1, 2015 (December 31, 2014 – 8%) on reinsurance layers
between the retention and coverage limits. The 2015 multi-risk events and catastrophes retention and coverage limits exclude an
aggregate reinsurance treaty to protect for frequency of events below $150 million.
12.8 Own Risk and Solvency Assessment
In 2014, we conducted our Own Risk and Solvency Assessment (“ORSA”). ORSA encompasses processes to identify, assess,
monitor, and manage the risks we take in conducting our business. ORSA also covers the determination of our capital needs and
solvency position. ORSA is an integral part of the implementation of our Enterprise Risk Management strategy. This exercise was
conducted over and above the Dynamic Capital Adequacy Testing performed annually by the Appointed Actuary.
Our ORSA revealed that our financial resources are sufficient to meet policyholder obligations after adverse situations at a
confidence level of 99% conditional tail expectation (CTE) over a one-year time horizon. We considered all our material risk
exposures in making this determination.
INTACT FINANCIAL CORPORATION
Management’s Discussion and Analysis for the year ended December 31, 2014 (in millions of dollars, except as otherwise noted)
50 INTACT FINANCIAL CORPORATION
We concluded that our overall risk is well balanced primarily between insurance risk and financial risk while operational risk
contributes a modest additional amount. Diversification and other adjustments modestly reduce our overall risk assessment.
We also compared our assessment of our own capital requirements with that of regulatory bodies. Our overall assessment is
materially lower than current regulatory requirements given the same confidence level and time horizon. The revisions to the MCT
Guidelines in 2015 converge directionally with our assessment for the main categories of risk. We believe this reflects a
convergence of the regulatory views of risk with our own risk assessment and is a positive development for IFC and the Canadian
P&C industry.
Section 13 – Off-balance sheet arrangements
13.1 Securities lending
We participate in a securities lending program to generate fee income. This program is managed by our custodian, a major
Canadian financial institution, whereby we lend securities we own to other financial institutions to allow them to meet their delivery
commitments. We loaned securities, which are reported as Investments in the accompanying Consolidated financial statements,
with a fair value of $1.6 billion as at December 31, 2014 ($1.6 billion as at December 31, 2013). Collateral is provided by the
counterparty and is held in trust by the custodian for our benefit until the underlying security has been returned to us. The collateral
cannot be sold or re-pledged externally by us, unless the counterparty defaults on its financial obligations. Additional collateral is
obtained or refunded on a daily basis as the market value of the underlying loaned securities fluctuates. The collateral consists of
government securities with an estimated fair value of 105% of the fair value of the loaned securities and amounts to $1.7 billion as
at December 31, 2014 ($1.7 billion as at December 31, 2013).
Section 14 – Accounting and disclosure matters
14.1 New accounting standards effective January 1, 2014
There were no new accounting standards, applicable to us, effective January 1, 2014. Please refer to Note 2 – Summary of
significant accounting policies in the Consolidated financial statements.
14.2 Significant accounting judgments, estimates and assumptions
The preparation of financial statements in conformity with IFRS requires management to use judgments, estimates and assumptions
that can have a significant impact on reported amounts of assets and liabilities, disclosure of contingent assets and liabilities as at
the balance sheet date, as well as reported amounts of revenues and expenses during the reporting period. Actual results could
differ significantly from these estimates.
The key estimates and assumptions that have a risk of causing a material adjustment to the carrying value of certain assets and
liabilities within the next financial year are as follows:
Valuation of claims liabilities
We establish claims liabilities to cover the estimated liability for the payment of all losses, including loss adjustment expenses
incurred with respect to insurance contracts underwritten by the Company. Claims liabilities do not represent an exact calculation of
the liability. The ultimate cost of claims liabilities is estimated by using a range of standard actuarial claims projection techniques in
accordance with Canadian accepted actuarial practice.
The main assumption underlying these techniques is that a company’s past claims development experience can be used to project
future claims development and hence ultimate claims costs. As such, these methods extrapolate the development of paid and
incurred losses, average costs per claim (severity) and number of claims (frequency) based on the observed development of earlier
years and expected loss ratios. Historical claims development is analyzed by accident years, by geographical area, as well as by
significant business line and claim type. Large catastrophic events are usually separately addressed, either by being reserved at the
face value of loss adjuster estimates in the case of very large losses or separately projected in order to reflect their future
development, which might differ from historical data in the case of catastrophic events. In most cases, no explicit assumptions are
made regarding future rates of claims inflation. Instead, the assumptions used are those implicit in the historical claims development
data on which the projections are based.
INTACT FINANCIAL CORPORATION
Management’s Discussion and Analysis for the year ended December 31, 2014 (in millions of dollars, except as otherwise noted)
INTACT FINANCIAL CORPORATION 51
Additional qualitative judgment is used to assess the extent to which past trends may not apply in the future, in order to arrive at the
estimated ultimate cost of claims that present the likely outcome from the range of possible outcomes, taking into account all the
uncertainties involved.
Details of the key assumptions and sensitivity analysis can be found in Note 9 – Insurance risk to the accompanying Consolidated
financial statements.
Valuation of defined benefit obligation
The cost of the defined benefit plans and the defined benefit obligation are calculated by our independent actuaries using
assumptions determined by management. The actuarial valuation involves making assumptions about discount rates, future salary
increases, future inflation, the employees’ age upon termination and retirement, mortality rates, future pension increases, disability
incidence and health and dental care cost trend. If actuarial experience differs from the assumptions used, the expected obligation
could increase or decrease in future years.
Due to the complexity of the valuation and its long-term nature, the defined benefit obligation is highly sensitive to changes in the
assumptions. Assumptions are reviewed at each reporting date. Details of the key assumptions and sensitivity analysis can be
found in Note 20 – Employee future benefits to the accompanying Consolidated financial statements.
Business combinations
Upon initial recognition, the acquiree’s assets and liabilities have been included in the Consolidated balance sheets at fair value.
Management estimated the fair values using estimates on future cash flows and discount rates. However, actual results can be
different from those estimates. The changes in the estimates that relate to new information obtained about facts and circumstances
that existed as of the acquisition date, made at initial recognition with regard to items for which the valuation was incomplete, would
have an impact on the amount of goodwill recognized. Any other changes in the estimates made at initial recognition would be
recognized in income.
Impairment
Goodwill and intangible assets
We determine whether goodwill and intangible assets with indefinite useful lives are impaired at least on an annual basis. Also,
intangible assets under development are not subject to amortization but are tested for impairment on an annual basis.
The carrying value of these intangibles is allocated to a single cash generating unit (or “CGU”), which is our sole operating segment,
P&C insurance operations. It is the lowest level at which there are separately identifiable cash flows. Impairment testing of these
intangibles requires an estimation of the recoverable amount.
The most recent test was performed as at June 30, 2014. As at this date, the P&C insurance operations CGU was tested for
impairment, calculating both the fair value less costs to sell and the value in use. The value-in-use calculation was based on the
following key estimates and assumptions:
— Cash flow projections for the next three years are based on financial budgets approved by management and determined using
budgeted margins based on past performance and management expectations for the Company and the industry.
— Cash flows beyond the three-year period are extrapolated using estimated growth rates of 3% as at June 30, 2014 and 2013,
which do not exceed the industry long-term average past growth rate in which the Company operates.
— A Company specific risk adjusted discount rate of 12.5% as at June 30, 2014 (June 30, 2013 – 13%) is used.
The test results indicate that the recoverable amount of the P&C insurance operations CGU exceeds its carrying value.
No impairment loss for goodwill or intangible assets has been recognized for the year ended December 31, 2014 or prior.
We are not aware of any reasonably possible change in any of the above key assumptions that would cause the carrying value of
the CGU to exceed its recoverable amount.
INTACT FINANCIAL CORPORATION
Management’s Discussion and Analysis for the year ended December 31, 2014 (in millions of dollars, except as otherwise noted)
52 INTACT FINANCIAL CORPORATION
Financial assets
We determine, at each balance sheet date, whether there is objective evidence that financial assets, other than those classified or
designated as at FVTPL, are impaired. Considerations which form the basis of these objective evidence judgments include a
significant or prolonged decline in fair value, a loss event that has occurred which has impaired the expected cash flows, as well as
other considerations such as liquidity and credit risk.
Details on objective evidence of impairment can be found in Note 2.4 – Financial instruments to the accompanying Consolidated
financial statements.
Measurement of income taxes
Management exercises judgment in estimating the provision for income taxes. We are subject to federal income tax law and
provincial income tax laws in the various jurisdictions where we operate. Various tax laws are potentially subject to different
interpretations by the taxpayer and the relevant tax authority. To the extent that our interpretations of tax laws differ from those of
tax authorities or that the timing of the realization of deferred tax assets is not as expected, the provision for income taxes may
increase or decrease in future periods to reflect actual experience.
14.3 Financial instruments
An important portion of our Consolidated balance sheets is composed of financial instruments. Our financial assets include
investments (cash and cash equivalents, debt securities, preferred shares, common shares and loans) and premium receivables.
Our financial liabilities include claims liabilities, financial liabilities related to investments and debt outstanding. Derivative financial
instruments are used for risk management purposes and are generally held for non-trading purposes to mitigate foreign exchange
and market risks (see Section 12.6 – Main risk factors and mitigating actions). They consist mostly of forwards, futures, swaps and
options.
— Forwards are used to mitigate the risk arising from foreign currency fluctuations and futures are used to modify exposure to interest
rate fluctuations.
— Swaps are primarily used for risk management purposes, mainly in conjunction with other financial instruments to synthetically alter
the cash flows of certain investments and credit exposure to specific bond issuers.
— Options are used to modify our exposure to interest rate risk.
— Inflation caps, which are a type of option, are used to manage inflation risk.
Financial instruments are required to be recognized at their fair value on initial recognition. Subsequent measurement is at fair value or
amortized cost depending on the classification of the financial instruments. Financial instruments classified as FVTPL or AFS are
carried at fair value, while all others are carried at amortized cost.
The fair value of financial instruments on initial recognition is normally the transaction price, being the fair value of the consideration
given or received. Subsequent to initial recognition, the fair value of financial instruments is determined based on available information
and categorized according to a three-level fair value hierarchy. The distribution of our financial instruments between each of the fair
value hierarchy levels is described in Note 6 – Fair value measurement to the accompanying Consolidated financial statements.
Where the fair values of financial assets and financial liabilities reported on the Consolidated balance sheets cannot be derived from
active markets, they are determined using a variety of valuation techniques that include the use of discounted cash flow models and/or
mathematical models. The inputs to these models are derived from observable market data where possible, but where observable
market data is not available, judgment is required to establish fair values.
For discounted cash flow analyses, estimated future cash flows and discount rates are based on current market information and rates
applicable to financial instruments with similar yields, credit quality and maturity characteristics. Estimated future cash flows are
influenced by factors such as economic conditions (including country specific risks), concentrations in specific industries, types of
instruments, currencies, market liquidity and financial conditions of counterparties. Discount rates are influenced by risk free interest
rates and credit risk. Changes in assumptions about these factors could affect the reported fair value of financial instruments.
Refer to Note 2 – Summary of significant accounting policies, Note 5 – Derivative financial instruments and Note 6 – Fair value
measurement to the accompanying Consolidated financial statements for details on the classification and measurement of financial
instruments.
INTACT FINANCIAL CORPORATION
Management’s Discussion and Analysis for the year ended December 31, 2014 (in millions of dollars, except as otherwise noted)
INTACT FINANCIAL CORPORATION 53
14.4 Standards issued but not yet effective
Please refer to Note 26 - Standards issued but not yet effective to the accompanying Consolidated financial statements.
14.5 Related-party transactions
We enter into transactions with associates and joint ventures in the normal course of business. Most of these related-party
transactions are with entities associated with our distribution channel. These transactions mostly comprise of commissions for
insurance policies, as well as interest and principal payments on loans. These transactions are measured at the amount of the
consideration paid or received, as established and agreed by the related parties. Management believes that such exchange
amounts approximate fair value.
We also enter into transactions with key management personnel and post-employment plans. Our key management personnel
include all members of the Board of Directors and certain members of the Executive Committee. Key management personnel can
purchase our insurance products offered in the normal course of business. The terms and conditions of such transactions are
essentially the same as those available to our clients and employees. Transactions with post-employment plans comprise the
contributions paid to these plans.
Note 22 – Related-party transactions to the accompanying Consolidated financial statements provides additional information on
related-party transactions.
14.6 Disclosure controls and procedures
We are committed to providing timely, accurate and balanced disclosure of all material information about the Company and to
providing fair and equal access to such information. Management is responsible for establishing and maintaining our disclosure
controls and procedures to ensure that information used internally and disclosed externally is complete and reliable. Due to the
inherent limitations in all control systems, an evaluation of controls can provide only reasonable, not absolute assurance, that all
control issues and instances of fraud or error, if any, within the Company have been detected. We continue to evolve and enhance
our system of controls and procedures.
Management, at the direction and under the supervision of the Chief Executive Officer and the Chief Financial Officer of the
Company, has evaluated the effectiveness of our disclosure controls and procedures. The evaluation was conducted in accordance
with the requirements of National Instrument 52-109 of the Canadian Securities Administrators. This evaluation confirmed, subject
to the inherent limitations noted above, the effectiveness of the design and operation of disclosure controls and procedures as at
December 31, 2014. Management can therefore provide reasonable assurance that material information relating to the Company
and its subsidiaries is reported to it on a timely basis so that it may provide investors with complete and reliable information.
14.7 Internal controls over financial reporting
Management has designed and is responsible for maintaining adequate internal control over financial reporting (“ICFR”) to provide
reasonable assurance regarding the reliability of financial reporting and the preparation of financial statements for external purposes
in accordance with IFRS.
Management has evaluated the design and operating effectiveness of its ICFR (as defined in Regulation 52-109 – Certification of
Disclosure in Issuer's Annual and Interim Filings). The evaluation was based on the criteria established in the "Internal Control-
Integrated Framework" issued by the Committee of Sponsoring Organizations of the Treadway Commission (“COSO”). This
evaluation was performed by the Chief Executive Officer and the Chief Financial Officer of the Company with the assistance of other
Company Management and staff to the extent deemed necessary. Based on this evaluation, the Chief Executive Officer and the
Chief Financial Officer concluded that the ICFR were appropriately designed and operating effectively, as at December 31, 2014.
In spite of its evaluation, Management does recognize that any controls and procedures, no matter how well designed and operated,
can only provide reasonable assurance and not absolute assurance of achieving the desired control objectives.
No significant changes were made to our ongoing internal controls over financial reporting during 2014 that have materially affected,
or are reasonably likely to materially affect the Company’s internal controls over financial reporting.
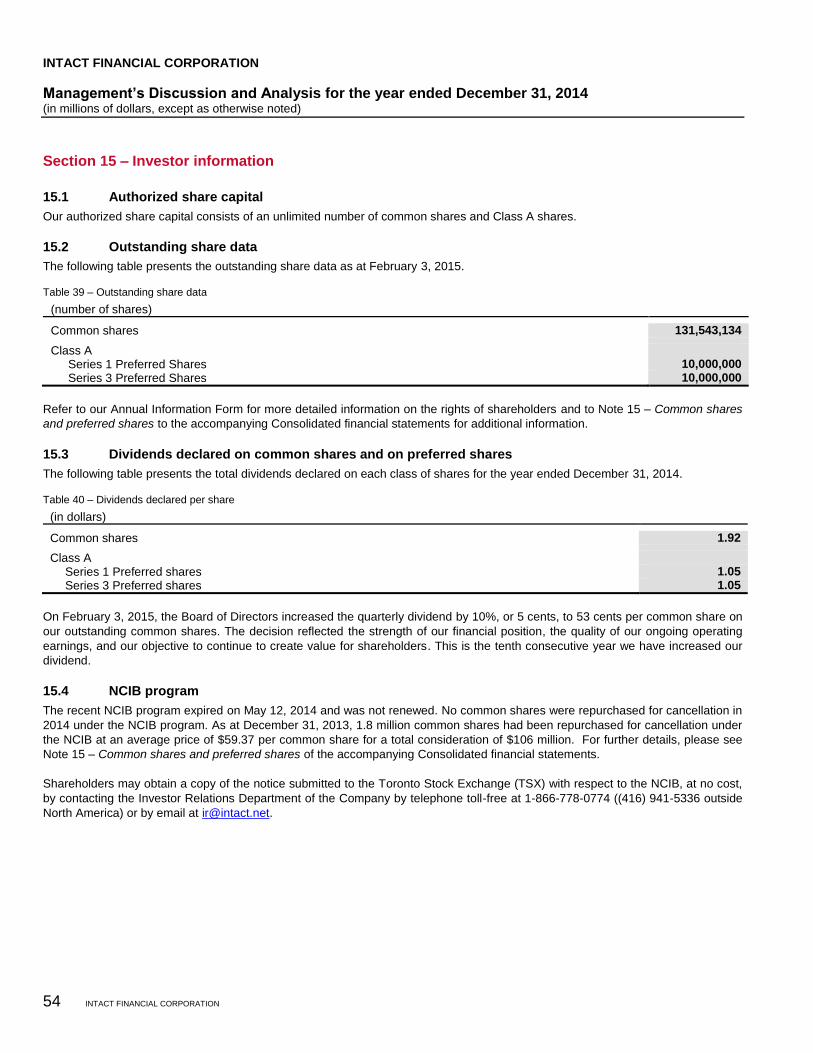
INTACT FINANCIAL CORPORATION
Management’s Discussion and Analysis for the year ended December 31, 2014 (in millions of dollars, except as otherwise noted)
54 INTACT FINANCIAL CORPORATION
Section 15 – Investor information
15.1 Authorized share capital
Our authorized share capital consists of an unlimited number of common shares and Class A shares.
15.2 Outstanding share data
The following table presents the outstanding share data as at February 3, 2015.
Table 39 – Outstanding share data
(number of shares)
Common shares 131,543,134
Class A
Series 1 Preferred Shares 10,000,000
Series 3 Preferred Shares 10,000,000
Refer to our Annual Information Form for more detailed information on the rights of shareholders and to Note 15 – Common shares
and preferred shares to the accompanying Consolidated financial statements for additional information.
15.3 Dividends declared on common shares and on preferred shares
The following table presents the total dividends declared on each class of shares for the year ended December 31, 2014.
Table 40 – Dividends declared per share
(in dollars)
Common shares 1.92
Class A
Series 1 Preferred shares 1.05
Series 3 Preferred shares 1.05
On February 3, 2015, the Board of Directors increased the quarterly dividend by 10%, or 5 cents, to 53 cents per common share on
our outstanding common shares. The decision reflected the strength of our financial position, the quality of our ongoing operating
earnings, and our objective to continue to create value for shareholders. This is the tenth consecutive year we have increased our
dividend.
15.4 NCIB program
The recent NCIB program expired on May 12, 2014 and was not renewed. No common shares were repurchased for cancellation in
2014 under the NCIB program. As at December 31, 2013, 1.8 million common shares had been repurchased for cancellation under
the NCIB at an average price of $59.37 per common share for a total consideration of $106 million. For further details, please see
Note 15 – Common shares and preferred shares of the accompanying Consolidated financial statements.
Shareholders may obtain a copy of the notice submitted to the Toronto Stock Exchange (TSX) with respect to the NCIB, at no cost,
by contacting the Investor Relations Department of the Company by telephone toll-free at 1-866-778-0774 ((416) 941-5336 outside
North America) or by email at [email protected].
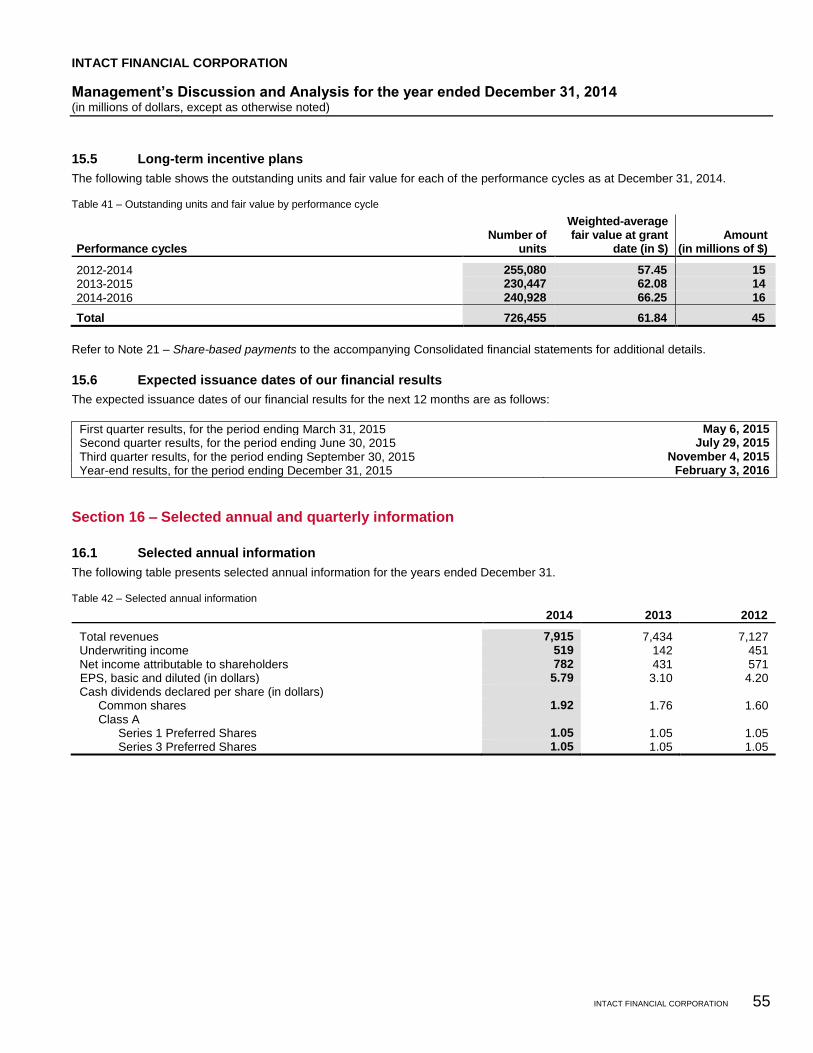
INTACT FINANCIAL CORPORATION
Management’s Discussion and Analysis for the year ended December 31, 2014 (in millions of dollars, except as otherwise noted)
INTACT FINANCIAL CORPORATION 55
15.5 Long-term incentive plans
The following table shows the outstanding units and fair value for each of the performance cycles as at December 31, 2014.
Table 41 – Outstanding units and fair value by performance cycle
Performance cycles Number of
units
Weighted-average fair value at grant
date (in $) Amount
(in millions of $)
2012-2014 255,080 57.45 15
2013-2015 230,447 62.08 14
2014-2016 240,928 66.25 16
Total 726,455 61.84 45
Refer to Note 21 – Share-based payments to the accompanying Consolidated financial statements for additional details.
15.6 Expected issuance dates of our financial results
The expected issuance dates of our financial results for the next 12 months are as follows:
First quarter results, for the period ending March 31, 2015 May 6, 2015
Second quarter results, for the period ending June 30, 2015 July 29, 2015
Third quarter results, for the period ending September 30, 2015 November 4, 2015
Year-end results, for the period ending December 31, 2015 February 3, 2016
Section 16 – Selected annual and quarterly information
16.1 Selected annual information
The following table presents selected annual information for the years ended December 31.
Table 42 – Selected annual information
2014 2013 2012
Total revenues 7,915 7,434 7,127 Underwriting income 519 142 451 Net income attributable to shareholders 782 431 571 EPS, basic and diluted (in dollars) 5.79 3.10 4.20 Cash dividends declared per share (in dollars)
Common shares 1.92 1.76 1.60 Class A
Series 1 Preferred Shares 1.05 1.05 1.05 Series 3 Preferred Shares 1.05 1.05 1.05
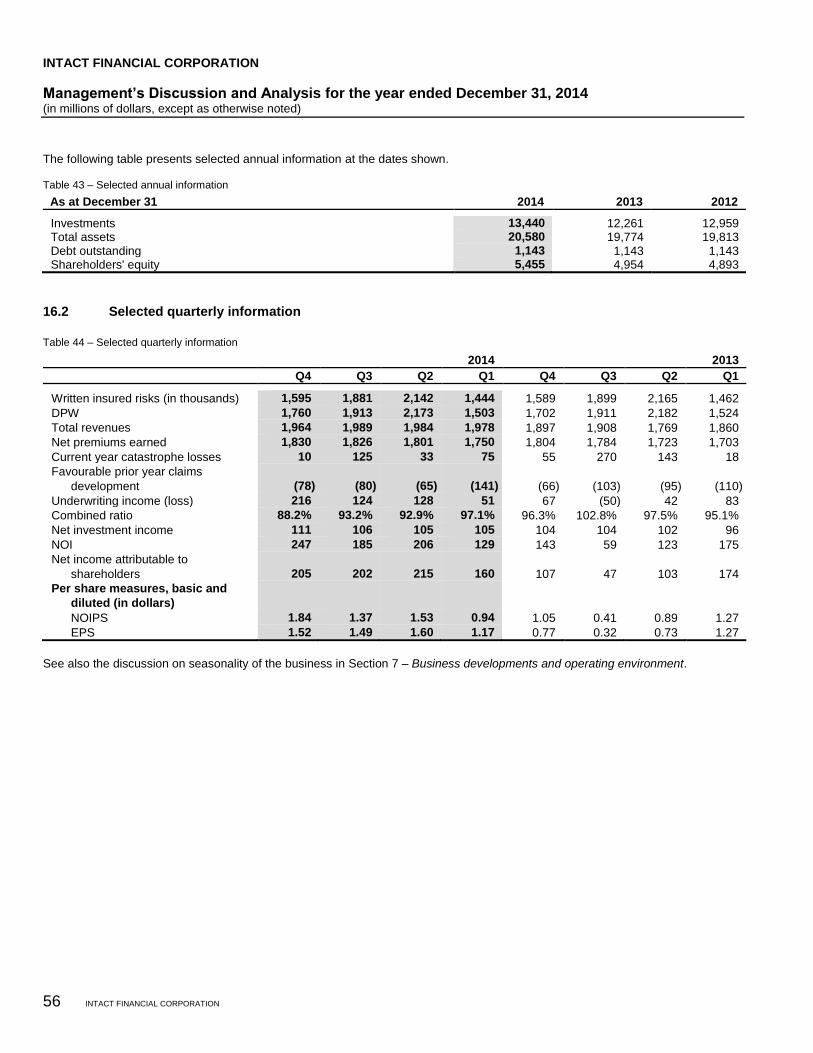
INTACT FINANCIAL CORPORATION
Management’s Discussion and Analysis for the year ended December 31, 2014 (in millions of dollars, except as otherwise noted)
56 INTACT FINANCIAL CORPORATION
The following table presents selected annual information at the dates shown.
Table 43 – Selected annual information
As at December 31 2014 2013 2012
Investments 13,440 12,261 12,959 Total assets 20,580 19,774 19,813 Debt outstanding 1,143 1,143 1,143 Shareholders' equity 5,455 4,954 4,893
16.2 Selected quarterly information
Table 44 – Selected quarterly information
2014 2013
Q4 Q3 Q2 Q1 Q4 Q3 Q2 Q1
Written insured risks (in thousands) 1,595 1,881 2,142 1,444 1,589 1,899 2,165 1,462
DPW 1,760 1,913 2,173 1,503 1,702 1,911 2,182 1,524
Total revenues 1,964 1,989 1,984 1,978 1,897 1,908 1,769 1,860
Net premiums earned 1,830 1,826 1,801 1,750 1,804 1,784 1,723 1,703
Current year catastrophe losses 10 125 33 75 55 270 143 18
Favourable prior year claims
development (78) (80) (65) (141) (66) (103) (95) (110)
Underwriting income (loss) 216 124 128 51 67 (50) 42 83
Combined ratio 88.2% 93.2% 92.9% 97.1% 96.3% 102.8% 97.5% 95.1%
Net investment income 111 106 105 105 104 104 102 96
NOI 247 185 206 129 143 59 123 175
Net income attributable to
shareholders 205 202 215 160 107 47 103 174
Per share measures, basic and
diluted (in dollars)
NOIPS 1.84 1.37 1.53 0.94 1.05 0.41 0.89 1.27
EPS 1.52 1.49 1.60 1.17 0.77 0.32 0.73 1.27
See also the discussion on seasonality of the business in Section 7 – Business developments and operating environment.
Intact Financial Corporation
Consolidated financial statements
For the year ended December 31, 2014
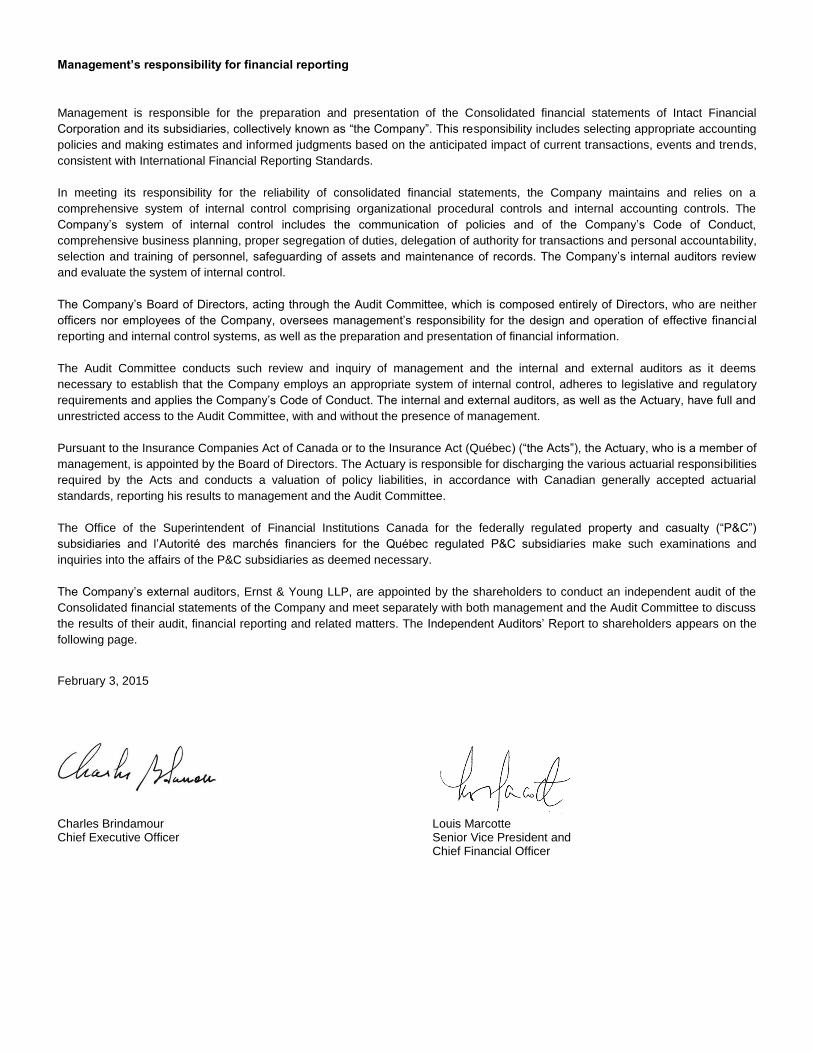
Management’s responsibility for financial reporting
Management is responsible for the preparation and presentation of the Consolidated financial statements of Intact Financial
Corporation and its subsidiaries, collectively known as “the Company”. This responsibility includes selecting appropriate accounting
policies and making estimates and informed judgments based on the anticipated impact of current transactions, events and trends,
consistent with International Financial Reporting Standards.
In meeting its responsibility for the reliability of consolidated financial statements, the Company maintains and relies on a
comprehensive system of internal control comprising organizational procedural controls and internal accounting controls. The
Company’s system of internal control includes the communication of policies and of the Company’s Code of Conduct,
comprehensive business planning, proper segregation of duties, delegation of authority for transactions and personal accountability,
selection and training of personnel, safeguarding of assets and maintenance of records. The Company’s internal auditors review
and evaluate the system of internal control.
The Company’s Board of Directors, acting through the Audit Committee, which is composed entirely of Directors, who are neither
officers nor employees of the Company, oversees management’s responsibility for the design and operation of effective financial
reporting and internal control systems, as well as the preparation and presentation of financial information.
The Audit Committee conducts such review and inquiry of management and the internal and external auditors as it deems
necessary to establish that the Company employs an appropriate system of internal control, adheres to legislative and regulatory
requirements and applies the Company’s Code of Conduct. The internal and external auditors, as well as the Actuary, have full and
unrestricted access to the Audit Committee, with and without the presence of management.
Pursuant to the Insurance Companies Act of Canada or to the Insurance Act (Québec) (“the Acts”), the Actuary, who is a member of
management, is appointed by the Board of Directors. The Actuary is responsible for discharging the various actuarial responsibilities
required by the Acts and conducts a valuation of policy liabilities, in accordance with Canadian generally accepted actuarial
standards, reporting his results to management and the Audit Committee.
The Office of the Superintendent of Financial Institutions Canada for the federally regulated property and casualty (“P&C”)
subsidiaries and l’Autorité des marchés financiers for the Québec regulated P&C subsidiaries make such examinations and
inquiries into the affairs of the P&C subsidiaries as deemed necessary.
The Company’s external auditors, Ernst & Young LLP, are appointed by the shareholders to conduct an independent audit of the
Consolidated financial statements of the Company and meet separately with both management and the Audit Committee to discuss
the results of their audit, financial reporting and related matters. The Independent Auditors’ Report to shareholders appears on the
following page. February 3, 2015
Charles Brindamour Chief Executive Officer
Louis Marcotte Senior Vice President and Chief Financial Officer
A member firm of Ernst & Young Global Limited
1 CPA auditor, CA, public accountancy permit no. A114960
INDEPENDENT AUDITORS’ REPORT
To the Shareholders of
Intact Financial Corporation
We have audited the accompanying consolidated financial statements of Intact Financial
Corporation, which comprise the consolidated balance sheets as at December 31, 2014 and 2013,
and the consolidated statements of comprehensive income, changes in shareholders’ equity and
cash flows for the years ended December 31, 2014 and 2013, and a summary of significant
accounting policies and other explanatory information.
Management's responsibility for the consolidated financial statements
Management is responsible for the preparation and fair presentation of these consolidated financial
statements in accordance with International Financial Reporting Standards, and for such internal
control as management determines is necessary to enable the preparation of consolidated financial
statements that are free from material misstatement, whether due to fraud or error.
Auditors’ responsibility
Our responsibility is to express an opinion on these consolidated financial statements based on our
audits. We conducted our audits in accordance with Canadian generally accepted auditing
standards. Those standards require that we comply with ethical requirements and plan and perform
the audit to obtain reasonable assurance about whether the consolidated financial statements are
free from material misstatement.
An audit involves performing procedures to obtain audit evidence about the amounts and
disclosures in the consolidated financial statements. The procedures selected depend on the
auditors’ judgment, including the assessment of the risks of material misstatement of the
consolidated financial statements, whether due to fraud or error. In making those risk assessments,
the auditors consider internal control relevant to the entity's preparation and fair presentation of
the consolidated financial statements in order to design audit procedures that are appropriate in the
circumstances, but not for the purpose of expressing an opinion on the effectiveness of the entity's
internal control. An audit also includes evaluating the appropriateness of accounting policies used
and the reasonableness of accounting estimates made by management, as well as evaluating the
overall presentation of the consolidated financial statements.
We believe that the audit evidence we have obtained in our audits is sufficient and appropriate to
provide a basis for our audit opinion.
Opinion
In our opinion, the consolidated financial statements present fairly, in all material respects, the
financial position of Intact Financial Corporation as at December 31, 2014 and 2013, and its
financial performance and its cash flows for the years ended December 31, 2014 and 2013 in
accordance with International Financial Reporting Standards.
Montréal, Canada
February 3, 2015
INTACT FINANCIAL CORPORATION
Consolidated financial statements For the year ended December 31, 2014
Table of contents Consolidated balance sheets…………………………………………………………………………………………….. 3
Consolidated statements of comprehensive income……………………………………..……………………………. 4
Consolidated statements of changes in shareholders’ equity………………………………………………………… 5
Consolidated statements of cash flows………………………………………………………………………………… 6
Notes to the Consolidated financial statements Note 1 – Status of the Company .......................................................................................................................... 7 Note 2 – Summary of significant accounting policies ........................................................................................... 7 Note 3 – Significant accounting judgments, estimates and assumptions .......................................................... 19 Note 4 – Financial instruments .......................................................................................................................... 21 Note 5 – Derivative financial instruments........................................................................................................... 25 Note 6 – Fair value measurement ..................................................................................................................... 27 Note 7 – Financial risk ....................................................................................................................................... 28 Note 8 – Claims liabilities and unearned premiums ........................................................................................... 36 Note 9 – Insurance risk ...................................................................................................................................... 40 Note 10 – Other assets and other liabilities ....................................................................................................... 43 Note 11 – Investments in associates and joint ventures .................................................................................... 43 Note 12 – Property and equipment .................................................................................................................... 44 Note 13 – Goodwill and intangible assets .......................................................................................................... 45 Note 14 – Debt outstanding ............................................................................................................................... 46 Note 15 – Common shares and preferred shares .............................................................................................. 47 Note 16 – Capital management ......................................................................................................................... 48 Note 17 – Earnings per share ............................................................................................................................ 49 Note 18 – Revenues .......................................................................................................................................... 49 Note 19 – Income taxes ..................................................................................................................................... 50 Note 20 – Employee future benefits .................................................................................................................. 52 Note 21 – Share-based payments ..................................................................................................................... 57 Note 22 – Related-party transactions ................................................................................................................ 59 Note 23 – Additional information on the Consolidated statements of cash flows ............................................... 60 Note 24 – Commitments and contingencies ...................................................................................................... 60 Note 25 – Disclosures on rate regulation for automobile insurance ................................................................... 61 Note 26 – Standards issued but not yet effective .............................................................................................. 62
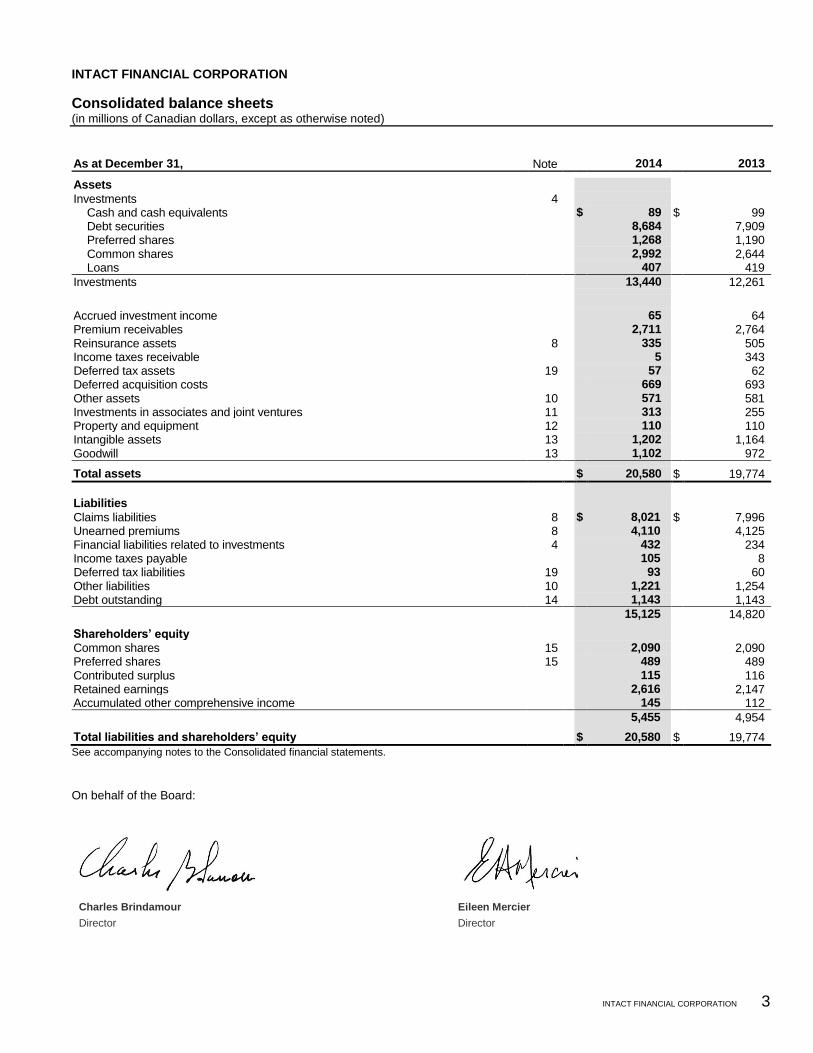
INTACT FINANCIAL CORPORATION
INTACT FINANCIAL CORPORATION 3
Consolidated balance sheets (in millions of Canadian dollars, except as otherwise noted)
As at December 31, Note 2014 2013
Assets Investments 4
Cash and cash equivalents $ 89 $ 99 Debt securities 8,684 7,909 Preferred shares 1,268 1,190 Common shares 2,992 2,644 Loans 407 419
Investments 13,440 12,261
Accrued investment income 65 64 Premium receivables 2,711 2,764 Reinsurance assets 8 335 505 Income taxes receivable 5 343 Deferred tax assets 19 57 62 Deferred acquisition costs 669 693 Other assets 10 571 581 Investments in associates and joint ventures 11 313 255 Property and equipment 12 110 110 Intangible assets 13 1,202 1,164 Goodwill 13 1,102 972
Total assets $ 20,580 $ 19,774
Liabilities Claims liabilities 8 $ 8,021 $ 7,996 Unearned premiums 8 4,110 4,125 Financial liabilities related to investments 4 432 234 Income taxes payable 105 8 Deferred tax liabilities 19 93 60 Other liabilities 10 1,221 1,254 Debt outstanding 14 1,143 1,143
15,125 14,820
Shareholders’ equity Common shares 15 2,090 2,090 Preferred shares 15 489 489 Contributed surplus 115 116 Retained earnings 2,616 2,147 Accumulated other comprehensive income 145 112
5,455 4,954
Total liabilities and shareholders’ equity $ 20,580 $ 19,774
See accompanying notes to the Consolidated financial statements.
On behalf of the Board:
Charles Brindamour
Director
Eileen Mercier
Director
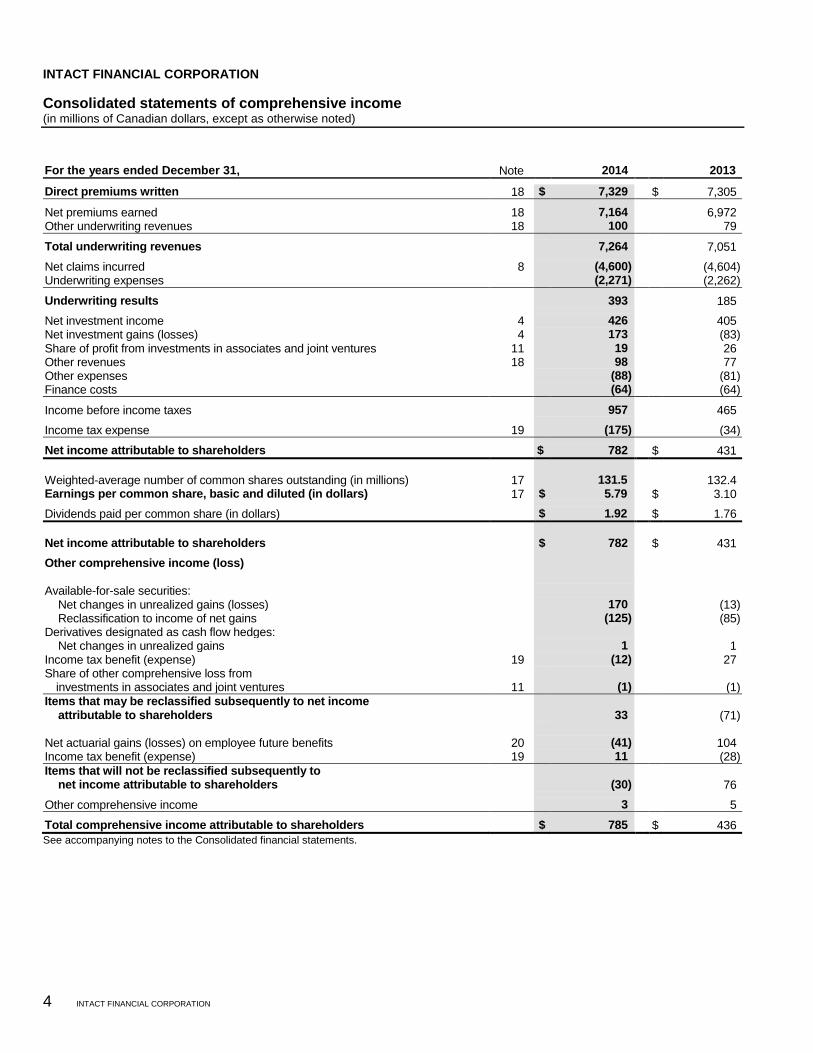
INTACT FINANCIAL CORPORATION
4 INTACT FINANCIAL CORPORATION
Consolidated statements of comprehensive income (in millions of Canadian dollars, except as otherwise noted)
For the years ended December 31, Note 2014 2013
Direct premiums written 18 $ 7,329 $ 7,305
Net premiums earned 18 7,164 6,972 Other underwriting revenues 18 100 79
Total underwriting revenues 7,264 7,051
Net claims incurred 8 (4,600) (4,604) Underwriting expenses (2,271) (2,262)
Underwriting results 393 185
Net investment income 4 426 405 Net investment gains (losses) 4 173 (83) Share of profit from investments in associates and joint ventures 11 19 26 Other revenues 18 98 77 Other expenses (88) (81) Finance costs (64) (64)
Income before income taxes 957 465
Income tax expense 19 (175) (34)
Net income attributable to shareholders $ 782 $ 431
Weighted-average number of common shares outstanding (in millions) 17 131.5 132.4 Earnings per common share, basic and diluted (in dollars) 17 $ 5.79 $ 3.10
Dividends paid per common share (in dollars) $ 1.92 $ 1.76
Net income attributable to shareholders $ 782 $ 431
Other comprehensive income (loss) Available-for-sale securities: Net changes in unrealized gains (losses) 170 (13) Reclassification to income of net gains (125) (85) Derivatives designated as cash flow hedges: Net changes in unrealized gains 1 1 Income tax benefit (expense) 19 (12) 27 Share of other comprehensive loss from
investments in associates and joint ventures 11
(1)
(1)
Items that may be reclassified subsequently to net income attributable to shareholders
33
(71)
Net actuarial gains (losses) on employee future benefits 20 (41) 104 Income tax benefit (expense) 19 11 (28)
Items that will not be reclassified subsequently to net income attributable to shareholders
(30)
76
Other comprehensive income 3 5
Total comprehensive income attributable to shareholders $ 785 $ 436
See accompanying notes to the Consolidated financial statements.
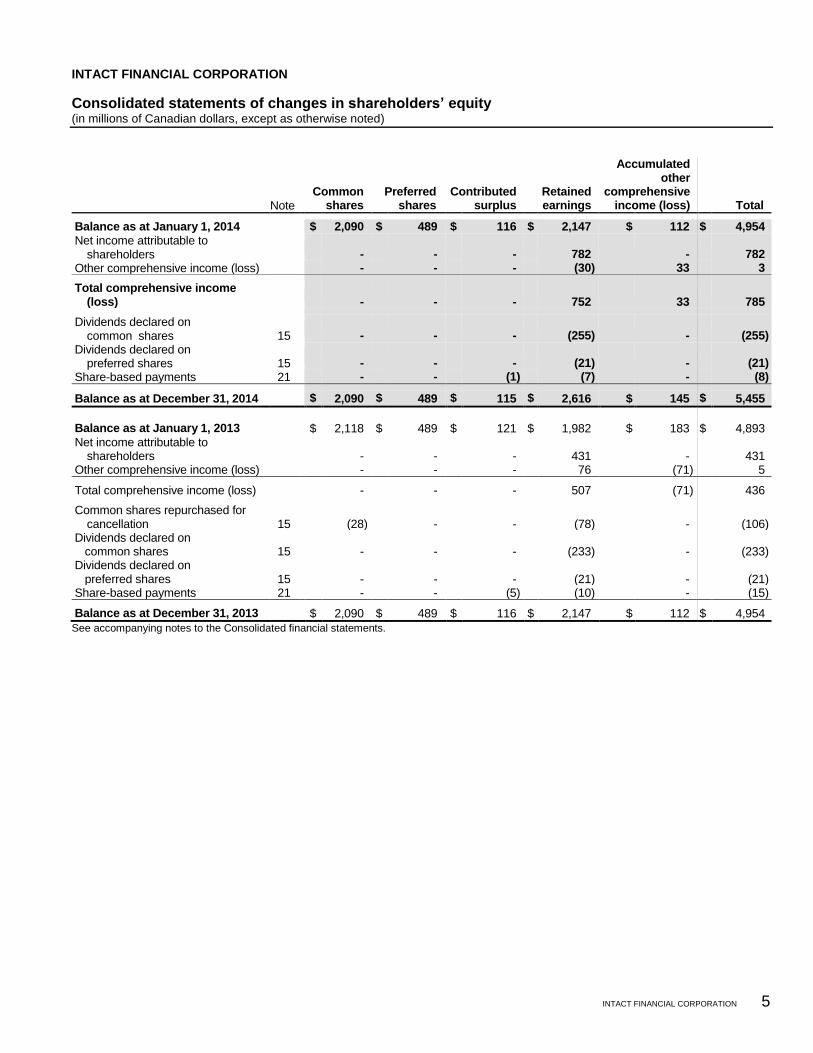
INTACT FINANCIAL CORPORATION
INTACT FINANCIAL CORPORATION 5
Consolidated statements of changes in shareholders’ equity (in millions of Canadian dollars, except as otherwise noted)
Note
Common shares
Preferred shares
Contributed surplus
Retained earnings
Accumulated other
comprehensive income (loss) Total
Balance as at January 1, 2014 $ 2,090 $ 489 $ 116 $ 2,147 $ 112 $ 4,954
Net income attributable to shareholders
-
-
-
782 -
782
Other comprehensive income (loss) - - - (30) 33 3
Total comprehensive income (loss)
-
-
-
752 33
785
Dividends declared on common shares 15
-
-
-
(255) -
(255)
Dividends declared on preferred shares 15
-
-
-
(21) -
(21)
Share-based payments 21 - - (1) (7) - (8)
Balance as at December 31, 2014 $ 2,090 $ 489 $ 115 $ 2,616 $ 145 $ 5,455
Balance as at January 1, 2013 $ 2,118 $ 489 $ 121 $ 1,982 $ 183 $ 4,893 Net income attributable to
shareholders
-
- -
-
431 -
431
Other comprehensive income (loss) - - - 76 (71) 5
Total comprehensive income (loss) - - - 507 (71) 436
Common shares repurchased for cancellation 15
(28)
-
-
(78) -
(106) Dividends declared on
common shares 15
-
-
-
(233) -
(233)
Dividends declared on preferred shares 15
-
-
-
(21) -
(21) Share-based payments 21 - - (5) (10) - (15)
Balance as at December 31, 2013 $ 2,090 $ 489 $ 116 $ 2,147 $ 112 $ 4,954
See accompanying notes to the Consolidated financial statements.
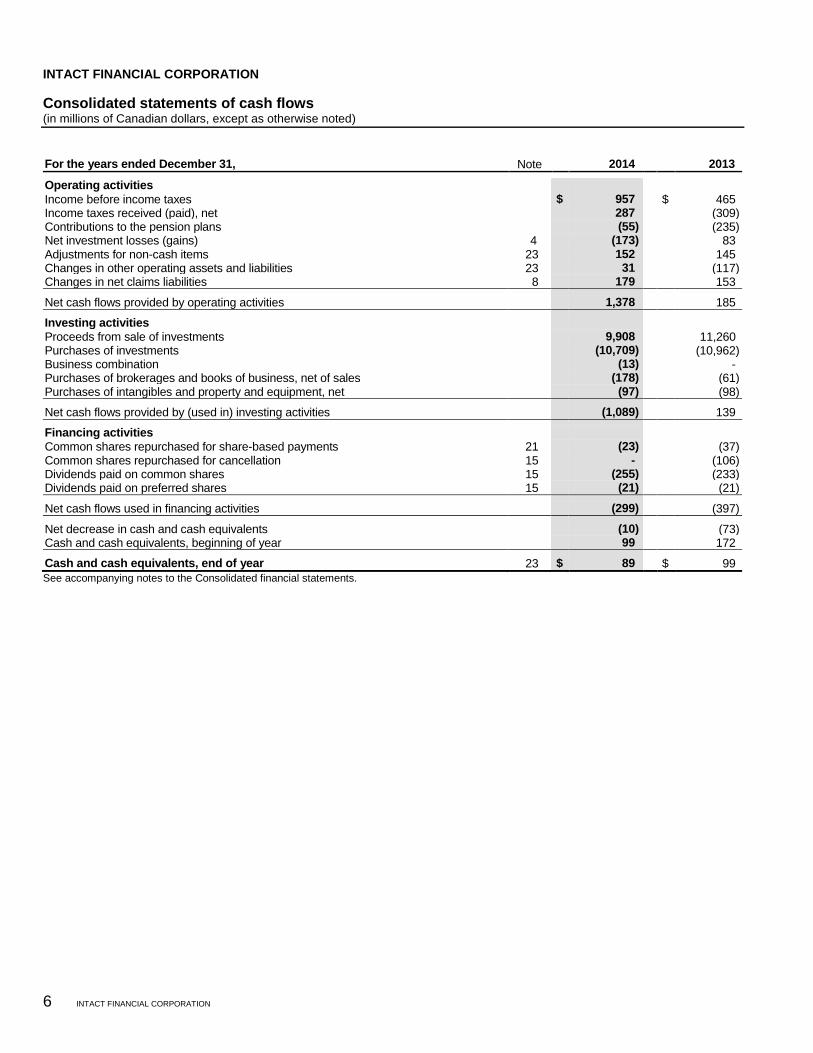
INTACT FINANCIAL CORPORATION
6 INTACT FINANCIAL CORPORATION
Consolidated statements of cash flows (in millions of Canadian dollars, except as otherwise noted)
For the years ended December 31, Note 2014 2013
Operating activities Income before income taxes $ 957 $ 465 Income taxes received (paid), net 287 (309) Contributions to the pension plans (55) (235) Net investment losses (gains) 4 (173) 83 Adjustments for non-cash items 23 152 145 Changes in other operating assets and liabilities 23 31 (117) Changes in net claims liabilities 8 179 153
Net cash flows provided by operating activities 1,378 185
Investing activities Proceeds from sale of investments 9,908 11,260 Purchases of investments (10,709) (10,962) Business combination (13) - Purchases of brokerages and books of business, net of sales (178) (61) Purchases of intangibles and property and equipment, net (97) (98)
Net cash flows provided by (used in) investing activities (1,089) 139
Financing activities Common shares repurchased for share-based payments 21 (23) (37) Common shares repurchased for cancellation 15 - (106) Dividends paid on common shares 15 (255) (233) Dividends paid on preferred shares 15 (21) (21)
Net cash flows used in financing activities (299) (397)
Net decrease in cash and cash equivalents (10) (73) Cash and cash equivalents, beginning of year 99 172
Cash and cash equivalents, end of year 23 $ 89 $ 99
See accompanying notes to the Consolidated financial statements.
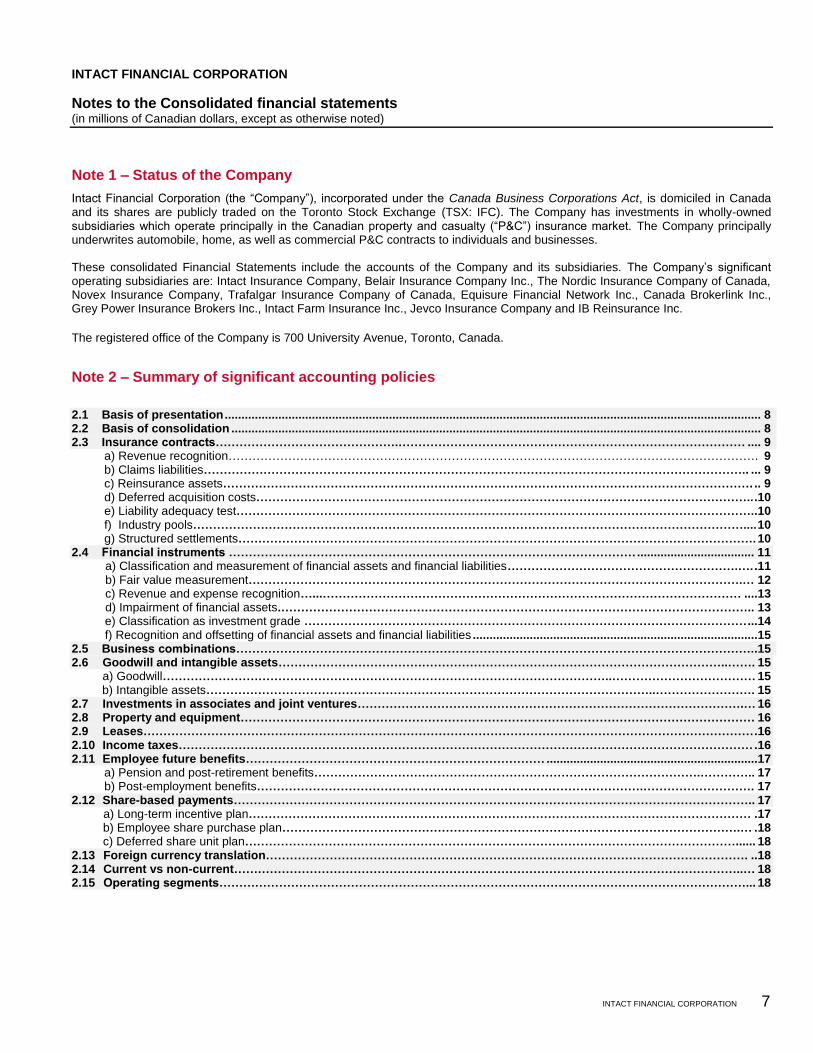
INTACT FINANCIAL CORPORATION
Notes to the Consolidated financial statements (in millions of Canadian dollars, except as otherwise noted)
INTACT FINANCIAL CORPORATION 7
Note 1 – Status of the Company
Intact Financial Corporation (the “Company”), incorporated under the Canada Business Corporations Act, is domiciled in Canada and its shares are publicly traded on the Toronto Stock Exchange (TSX: IFC). The Company has investments in wholly-owned subsidiaries which operate principally in the Canadian property and casualty (“P&C”) insurance market. The Company principally underwrites automobile, home, as well as commercial P&C contracts to individuals and businesses. These consolidated Financial Statements include the accounts of the Company and its subsidiaries. The Company’s significant operating subsidiaries are: Intact Insurance Company, Belair Insurance Company Inc., The Nordic Insurance Company of Canada, Novex Insurance Company, Trafalgar Insurance Company of Canada, Equisure Financial Network Inc., Canada Brokerlink Inc., Grey Power Insurance Brokers Inc., Intact Farm Insurance Inc., Jevco Insurance Company and IB Reinsurance Inc.
The registered office of the Company is 700 University Avenue, Toronto, Canada.
Note 2 – Summary of significant accounting policies
2.1 Basis of presentation ................................................................................................................................................................ 8 2.2 Basis of consolidation .............................................................................................................................................................. 8 2.3 Insurance contracts……………………………………….…………………………………………………………………………… .... 9
a) Revenue recognition……………………………………………………………………………………………………………………. 9 b) Claims liabilities……………………………………………………………………………………………………………………….. ... 9 c) Reinsurance assets……………………………………………………………………………………………………………………. .. 9 d) Deferred acquisition costs…………………………………………………………………………………………………………….. .10 e) Liability adequacy test…………………………………………………………………………………………………………………..10 f) Industry pools………………………………………………………………………………………………………………………….... 10 g) Structured settlements…………………………………………………………………………………………………………………. 10
2.4 Financial instruments ………………………………………………………………………………………… ................................... 11 a) Classification and measurement of financial assets and financial liabilities………………………………………………….…. .11 b) Fair value measurement…………………………………………………………………………………………………………….… 12 c) Revenue and expense recognition…...…………………………………………………………………………………………… ....13 d) Impairment of financial assets.……………………………………………………………………………………………………….. 13 e) Classification as investment grade ………………………………………………………………………………………………… ...14 f) Recognition and offsetting of financial assets and financial liabilities .....................................................................................15
2.5 Business combinations…………………………………………………………………………………………………………………..15 2.6 Goodwill and intangible assets…………………………………………………………………………………………………..……. 15
a) Goodwill…………………………………………………………………………………………………..……………………………… 15 b) Intangible assets…………………………………………………………………………………………………..……………………. 15
2.7 Investments in associates and joint ventures…………………………………………………………………………………….… 16 2.8 Property and equipment………………………………………………………………………………………………………………… 16 2.9 Leases……………………………………………………………………………………………………………………………………… .16 2.10 Income taxes……………………………………………………………………………………………………………………………… .16 2.11 Employee future benefits………………………………………………………………… ...............................................................17
a) Pension and post-retirement benefits…………………………………………………………………………………….………….. 17 b) Post-employment benefits…………………………………………………………………………………….………………………. 17
2.12 Share-based payments………………………………………………………………………………………………………………….. 17 a) Long-term incentive plan……………………………………………………………………………………………………………… .17 b) Employee share purchase plan…………………………………………………………………………………………………….… .18 c) Deferred share unit plan……………………………………………………………………………………………………………...... 18
2.13 Foreign currency translation…………………………………………………………………………………………………………. ..18 2.14 Current vs non-current………………………………………………………………………………………………………………..… 18 2.15 Operating segments……………………………………………………………………………………………………………………... 18
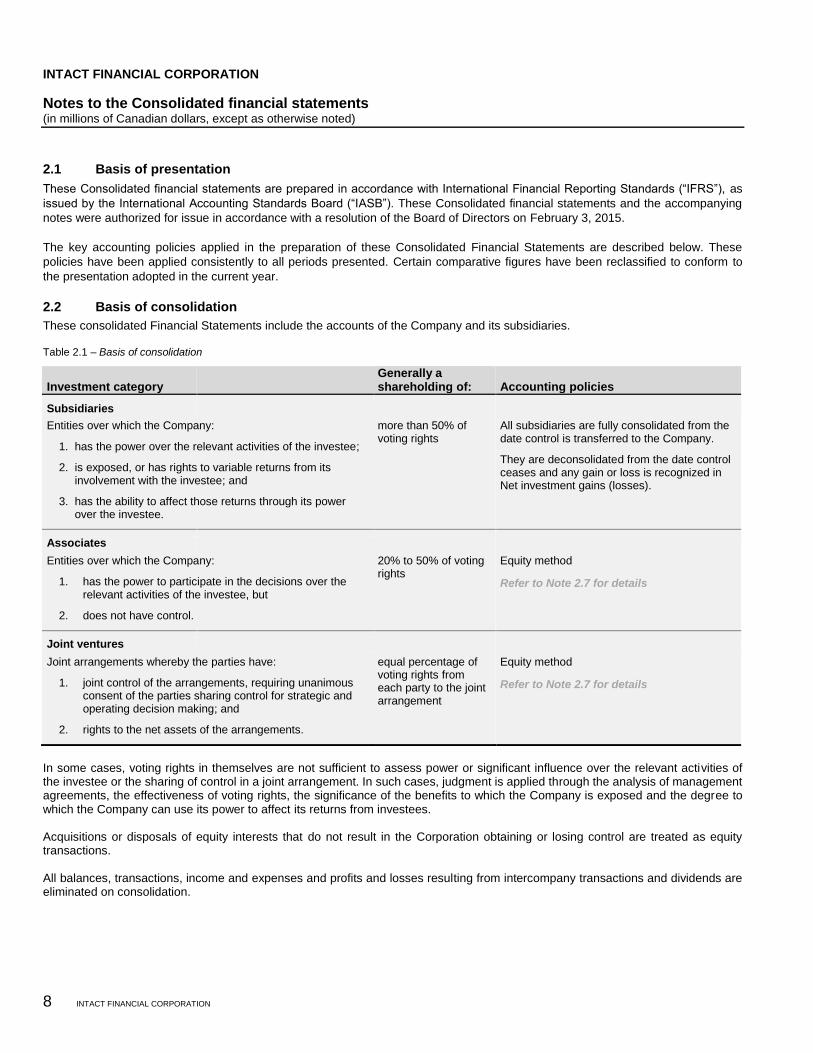
INTACT FINANCIAL CORPORATION
Notes to the Consolidated financial statements (in millions of Canadian dollars, except as otherwise noted)
8 INTACT FINANCIAL CORPORATION
2.1 Basis of presentation
These Consolidated financial statements are prepared in accordance with International Financial Reporting Standards (“IFRS”), as
issued by the International Accounting Standards Board (“IASB”). These Consolidated financial statements and the accompanying
notes were authorized for issue in accordance with a resolution of the Board of Directors on February 3, 2015.
The key accounting policies applied in the preparation of these Consolidated Financial Statements are described below. These
policies have been applied consistently to all periods presented. Certain comparative figures have been reclassified to conform to
the presentation adopted in the current year.
2.2 Basis of consolidation
These consolidated Financial Statements include the accounts of the Company and its subsidiaries. Table 2.1 – Basis of consolidation
Investment category Generally a shareholding of: Accounting policies
Subsidiaries
Entities over which the Company:
1. has the power over the relevant activities of the investee;
2. is exposed, or has rights to variable returns from its involvement with the investee; and
3. has the ability to affect those returns through its power over the investee.
more than 50% of voting rights
All subsidiaries are fully consolidated from the date control is transferred to the Company.
They are deconsolidated from the date control ceases and any gain or loss is recognized in Net investment gains (losses).
Associates
Entities over which the Company:
1. has the power to participate in the decisions over the relevant activities of the investee, but
2. does not have control.
20% to 50% of voting rights
Equity method
Refer to Note 2.7 for details
Joint ventures
Joint arrangements whereby the parties have:
1. joint control of the arrangements, requiring unanimous consent of the parties sharing control for strategic and operating decision making; and
2. rights to the net assets of the arrangements.
equal percentage of voting rights from each party to the joint arrangement
Equity method
Refer to Note 2.7 for details
In some cases, voting rights in themselves are not sufficient to assess power or significant influence over the relevant activities of the investee or the sharing of control in a joint arrangement. In such cases, judgment is applied through the analysis of management agreements, the effectiveness of voting rights, the significance of the benefits to which the Company is exposed and the degree to which the Company can use its power to affect its returns from investees. Acquisitions or disposals of equity interests that do not result in the Corporation obtaining or losing control are treated as equity transactions. All balances, transactions, income and expenses and profits and losses resulting from intercompany transactions and dividends are eliminated on consolidation.
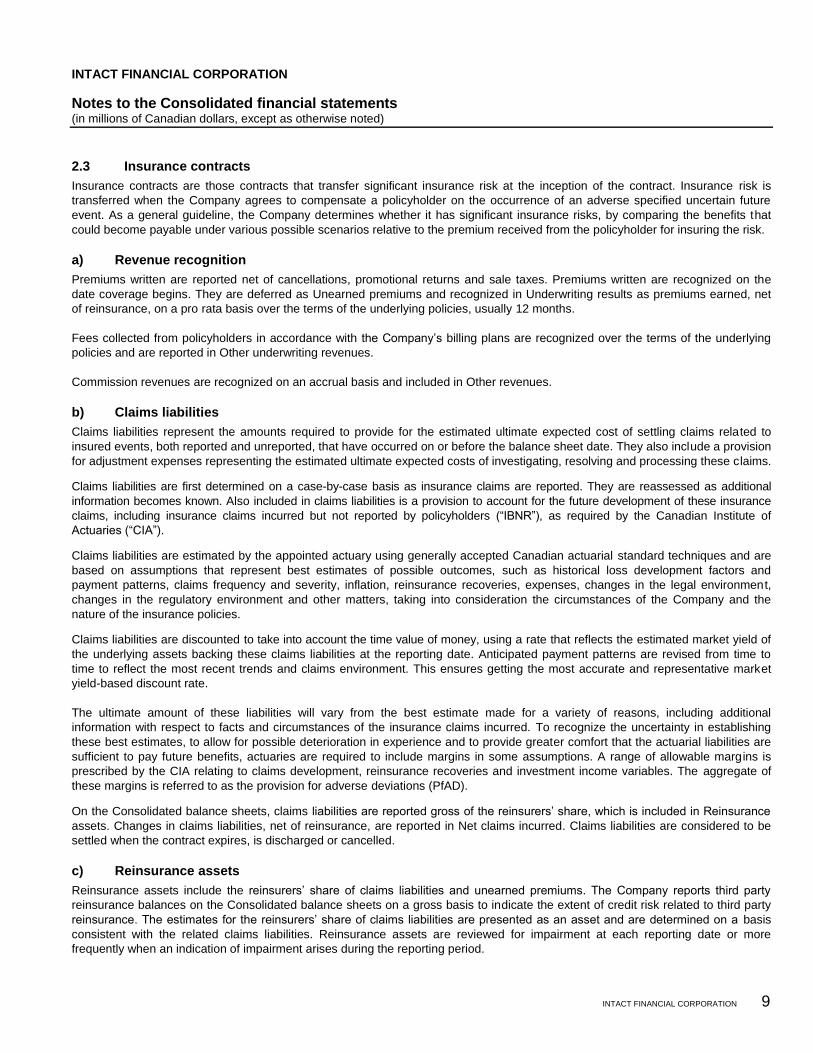
INTACT FINANCIAL CORPORATION
Notes to the Consolidated financial statements (in millions of Canadian dollars, except as otherwise noted)
INTACT FINANCIAL CORPORATION 9
2.3 Insurance contracts
Insurance contracts are those contracts that transfer significant insurance risk at the inception of the contract. Insurance risk is
transferred when the Company agrees to compensate a policyholder on the occurrence of an adverse specified uncertain future
event. As a general guideline, the Company determines whether it has significant insurance risks, by comparing the benefits that
could become payable under various possible scenarios relative to the premium received from the policyholder for insuring the risk.
a) Revenue recognition
Premiums written are reported net of cancellations, promotional returns and sale taxes. Premiums written are recognized on the
date coverage begins. They are deferred as Unearned premiums and recognized in Underwriting results as premiums earned, net
of reinsurance, on a pro rata basis over the terms of the underlying policies, usually 12 months.
Fees collected from policyholders in accordance with the Company’s billing plans are recognized over the terms of the underlying
policies and are reported in Other underwriting revenues.
Commission revenues are recognized on an accrual basis and included in Other revenues.
b) Claims liabilities
Claims liabilities represent the amounts required to provide for the estimated ultimate expected cost of settling claims related to
insured events, both reported and unreported, that have occurred on or before the balance sheet date. They also include a provision
for adjustment expenses representing the estimated ultimate expected costs of investigating, resolving and processing these claims.
Claims liabilities are first determined on a case-by-case basis as insurance claims are reported. They are reassessed as additional
information becomes known. Also included in claims liabilities is a provision to account for the future development of these insurance
claims, including insurance claims incurred but not reported by policyholders (“IBNR”), as required by the Canadian Institute of
Actuaries (“CIA”).
Claims liabilities are estimated by the appointed actuary using generally accepted Canadian actuarial standard techniques and are
based on assumptions that represent best estimates of possible outcomes, such as historical loss development factors and
payment patterns, claims frequency and severity, inflation, reinsurance recoveries, expenses, changes in the legal environment,
changes in the regulatory environment and other matters, taking into consideration the circumstances of the Company and the
nature of the insurance policies.
Claims liabilities are discounted to take into account the time value of money, using a rate that reflects the estimated market yield of
the underlying assets backing these claims liabilities at the reporting date. Anticipated payment patterns are revised from time to
time to reflect the most recent trends and claims environment. This ensures getting the most accurate and representative market
yield-based discount rate.
The ultimate amount of these liabilities will vary from the best estimate made for a variety of reasons, including additional
information with respect to facts and circumstances of the insurance claims incurred. To recognize the uncertainty in establishing
these best estimates, to allow for possible deterioration in experience and to provide greater comfort that the actuarial liabilities are
sufficient to pay future benefits, actuaries are required to include margins in some assumptions. A range of allowable margins is
prescribed by the CIA relating to claims development, reinsurance recoveries and investment income variables. The aggregate of
these margins is referred to as the provision for adverse deviations (PfAD).
On the Consolidated balance sheets, claims liabilities are reported gross of the reinsurers’ share, which is included in Reinsurance
assets. Changes in claims liabilities, net of reinsurance, are reported in Net claims incurred. Claims liabilities are considered to be
settled when the contract expires, is discharged or cancelled.
c) Reinsurance assets
Reinsurance assets include the reinsurers’ share of claims liabilities and unearned premiums. The Company reports third party
reinsurance balances on the Consolidated balance sheets on a gross basis to indicate the extent of credit risk related to third party
reinsurance. The estimates for the reinsurers’ share of claims liabilities are presented as an asset and are determined on a basis
consistent with the related claims liabilities. Reinsurance assets are reviewed for impairment at each reporting date or more
frequently when an indication of impairment arises during the reporting period.
INTACT FINANCIAL CORPORATION
Notes to the Consolidated financial statements (in millions of Canadian dollars, except as otherwise noted)
10 INTACT FINANCIAL CORPORATION
d) Deferred acquisition costs
Policy acquisition costs incurred in acquiring insurance premiums include commissions and premium taxes directly related to the
writing or renewal of insurance policies. These acquisition costs are deferred and amortized on the same basis as the unearned
premiums and are reported in Underwriting expenses. Deferred acquisition costs are no longer recorded when the corresponding
contracts are settled or cancelled.
e) Liability adequacy test
At the end of each reporting period, a liability adequacy test is performed to validate the adequacy of unearned premiums and
deferred acquisition costs. A premium deficiency would exist if unearned premiums were deemed insufficient to cover the estimated
future costs associated with the unexpired portion of written insurance policies. A premium deficiency would be recognized
immediately as a reduction of deferred acquisition costs to the extent that unearned premiums plus anticipated investment income
are not considered adequate to cover for all deferred acquisition costs and related insurance claims and expenses. If the premium
deficiency is greater than the unamortized deferred acquisition costs, a liability is accrued for the excess deficiency.
f) Industry pools
When certain automobile owners are unable to obtain insurance via the voluntary insurance market, they are insured via the Facility
Association (“FA”). In addition, entities can choose to cede certain risks to the FA administered risk sharing pools (“RSP”). The
related risks associated with FA insurance policies and policies ceded to the RSP are aggregated and shared by the entities in the
Canadian P&C insurance industry, generally in proportion to market share and volume of business ceded to the RSP. The Company
applies the same accounting policies to FA and RSP insurance it assumes as it does to insurance policies issued by the Company
directly to policyholders. In accordance with the Office of the Superintendent of Financial Institutions Canada (“OSFI”) guidelines,
assumed and ceded RSP premiums are reported in Direct premiums written.
The Company acts as a “facility carrier” responsible for the administration of a portion of the FA policies. In exchange for providing
these services, the Company receives fees, which are reported in Other underwriting revenues. Policy issuance fees are earned
immediately while claims handling fees are deferred and earned over the servicing life of the claims.
g) Structured settlements
The Company enters into annuity agreements with various Canadian life insurance companies to provide for fixed and recurring
payments to claimants. When the annuity agreements are non-commutable, non-assignable and non-transferable, the Company is
released by the claimant for the settlement of the claim amount. As a result, the liability to its claimants is substantially discharged
and the Company removes that liability from its Consolidated balance sheet. However, the Company remains exposed to the credit
risk that life insurers may fail to fulfill their obligations. When the annuity agreements are commutable, assignable or transferable,
the Company keeps the liability and the corresponding asset on its financial statements.
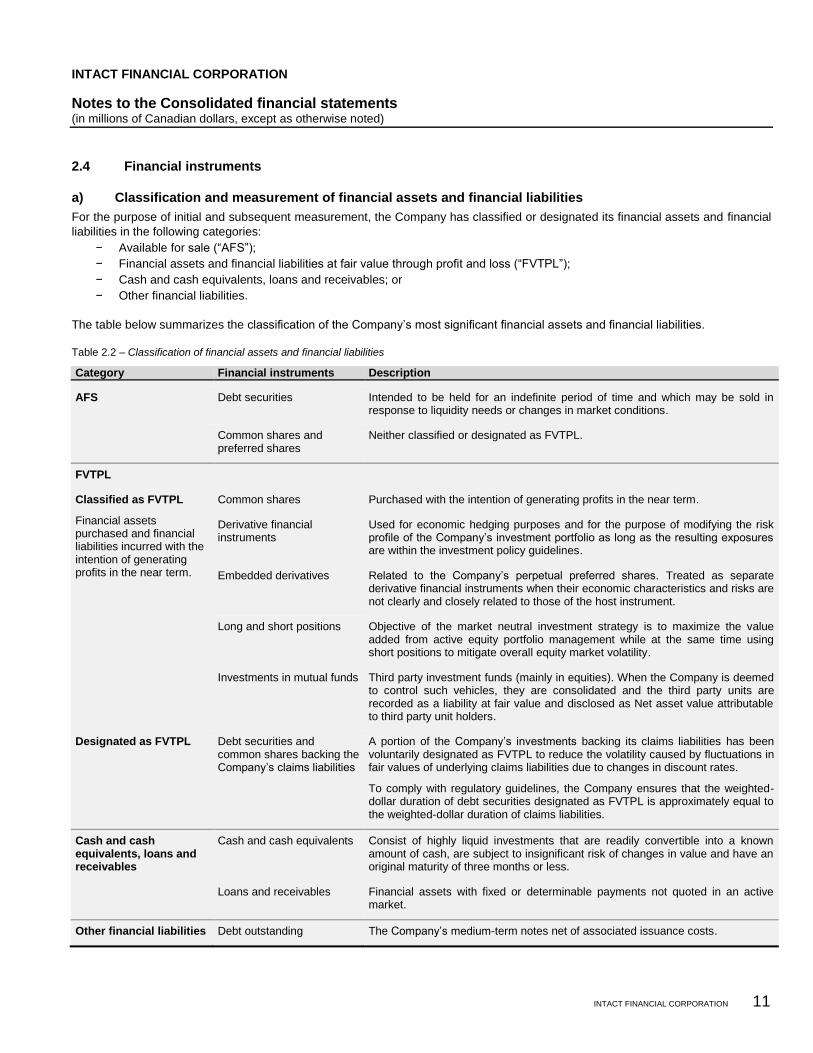
INTACT FINANCIAL CORPORATION
Notes to the Consolidated financial statements (in millions of Canadian dollars, except as otherwise noted)
INTACT FINANCIAL CORPORATION 11
2.4 Financial instruments
a) Classification and measurement of financial assets and financial liabilities
For the purpose of initial and subsequent measurement, the Company has classified or designated its financial assets and financial
liabilities in the following categories:
− Available for sale (“AFS”);
− Financial assets and financial liabilities at fair value through profit and loss (“FVTPL”);
− Cash and cash equivalents, loans and receivables; or
− Other financial liabilities.
The table below summarizes the classification of the Company’s most significant financial assets and financial liabilities.
Table 2.2 – Classification of financial assets and financial liabilities
Category Financial instruments Description
AFS Debt securities Intended to be held for an indefinite period of time and which may be sold in response to liquidity needs or changes in market conditions.
Common shares and preferred shares
Neither classified or designated as FVTPL.
FVTPL
Classified as FVTPL
Financial assets purchased and financial liabilities incurred with the intention of generating profits in the near term.
Common shares Purchased with the intention of generating profits in the near term.
Derivative financial instruments
Used for economic hedging purposes and for the purpose of modifying the risk profile of the Company’s investment portfolio as long as the resulting exposures are within the investment policy guidelines.
Embedded derivatives Related to the Company’s perpetual preferred shares. Treated as separate derivative financial instruments when their economic characteristics and risks are not clearly and closely related to those of the host instrument.
Long and short positions Objective of the market neutral investment strategy is to maximize the value added from active equity portfolio management while at the same time using short positions to mitigate overall equity market volatility.
Investments in mutual funds Third party investment funds (mainly in equities). When the Company is deemed to control such vehicles, they are consolidated and the third party units are recorded as a liability at fair value and disclosed as Net asset value attributable to third party unit holders.
Designated as FVTPL
Debt securities and common shares backing the Company’s claims liabilities
A portion of the Company’s investments backing its claims liabilities has been voluntarily designated as FVTPL to reduce the volatility caused by fluctuations in fair values of underlying claims liabilities due to changes in discount rates.
To comply with regulatory guidelines, the Company ensures that the weighted-dollar duration of debt securities designated as FVTPL is approximately equal to the weighted-dollar duration of claims liabilities.
Cash and cash equivalents, loans and receivables
Cash and cash equivalents Consist of highly liquid investments that are readily convertible into a known amount of cash, are subject to insignificant risk of changes in value and have an original maturity of three months or less.
Loans and receivables Financial assets with fixed or determinable payments not quoted in an active market.
Other financial liabilities Debt outstanding The Company’s medium-term notes net of associated issuance costs.
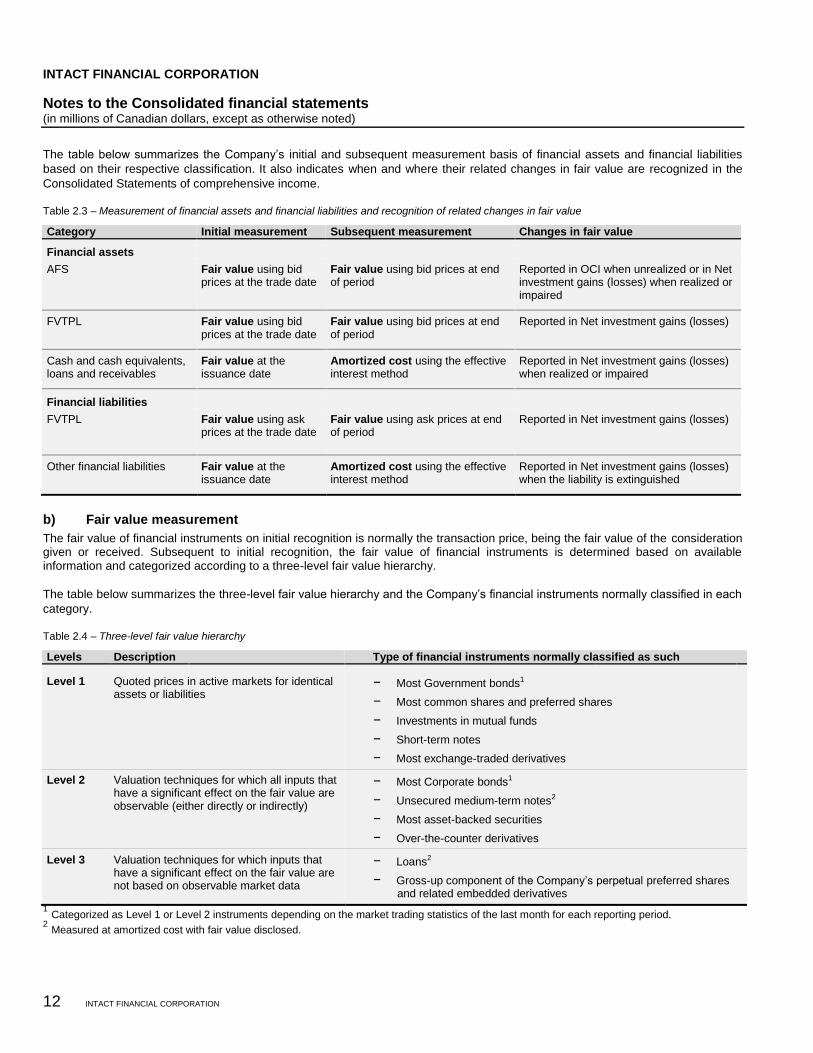
INTACT FINANCIAL CORPORATION
Notes to the Consolidated financial statements (in millions of Canadian dollars, except as otherwise noted)
12 INTACT FINANCIAL CORPORATION
The table below summarizes the Company’s initial and subsequent measurement basis of financial assets and financial liabilities
based on their respective classification. It also indicates when and where their related changes in fair value are recognized in the
Consolidated Statements of comprehensive income.
Table 2.3 – Measurement of financial assets and financial liabilities and recognition of related changes in fair value
Category Initial measurement Subsequent measurement Changes in fair value
Financial assets
AFS Fair value using bid prices at the trade date
Fair value using bid prices at end of period
Reported in OCI when unrealized or in Net investment gains (losses) when realized or impaired
FVTPL Fair value using bid prices at the trade date
Fair value using bid prices at end of period
Reported in Net investment gains (losses)
Cash and cash equivalents, loans and receivables
Fair value at the issuance date
Amortized cost using the effective interest method
Reported in Net investment gains (losses) when realized or impaired
Financial liabilities
FVTPL
Fair value using ask prices at the trade date
Fair value using ask prices at end of period
Reported in Net investment gains (losses)
Other financial liabilities Fair value at the issuance date
Amortized cost using the effective interest method
Reported in Net investment gains (losses) when the liability is extinguished
b) Fair value measurement
The fair value of financial instruments on initial recognition is normally the transaction price, being the fair value of the consideration given or received. Subsequent to initial recognition, the fair value of financial instruments is determined based on available information and categorized according to a three-level fair value hierarchy.
The table below summarizes the three-level fair value hierarchy and the Company’s financial instruments normally classified in each
category.
Table 2.4 – Three-level fair value hierarchy
Levels Description Type of financial instruments normally classified as such
Level 1 Quoted prices in active markets for identical assets or liabilities
− Most Government bonds1
− Most common shares and preferred shares
− Investments in mutual funds
− Short-term notes
− Most exchange-traded derivatives
Level 2 Valuation techniques for which all inputs that have a significant effect on the fair value are observable (either directly or indirectly)
− Most Corporate bonds1
− Unsecured medium-term notes2
− Most asset-backed securities
− Over-the-counter derivatives
Level 3 Valuation techniques for which inputs that have a significant effect on the fair value are not based on observable market data
− Loans2
− Gross-up component of the Company’s perpetual preferred shares and related embedded derivatives
1 Categorized as Level 1 or Level 2 instruments depending on the market trading statistics of the last month for each reporting period.
2 Measured at amortized cost with fair value disclosed.
INTACT FINANCIAL CORPORATION
Notes to the Consolidated financial statements (in millions of Canadian dollars, except as otherwise noted)
INTACT FINANCIAL CORPORATION 13
A financial instrument is regarded as quoted in an active market (Level 1) if quoted prices for that financial instrument are readily
and regularly available from an exchange, dealer, broker, industry group, pricing service or regulatory agency and those prices
represent actual and regularly occurring market transactions on an arm’s length basis.
Where the fair values of financial assets and financial liabilities reported on the Consolidated balance sheets cannot be derived from
active markets, they are determined using a variety of valuation techniques that include the use of discounted cash flow models
and/or mathematical models. The inputs to these models are derived from observable market data where possible. Inputs used in
their valuation include:
− prevailing market rates for bonds with similar characteristics and risk profiles;
− closing prices of the most recent trade date subject to liquidity adjustments; or
− average brokers’ quotes when trades are too sparse to constitute an active market.
For discounted cash flow analyses, estimated future cash flows and discount rates are based on current market information and
rates applicable to financial instruments with similar yields, credit quality and maturity characteristics. Estimated future cash flows
are influenced by factors such as economic conditions (including country specific risks), concentrations in specific industries, types
of instruments, currencies, market liquidity and financial conditions of counterparties. Discount rates are influenced by risk free
interest rates and credit risk.
In limited circumstances, the Company uses input parameters that are not based on observable market data. Non-market
observable inputs use fair values determined in whole or in part using a valuation technique or model based on assumptions that
are neither supported by prices from observable current market transactions for the same instrument nor based on available market
data. In these cases, judgment is required to establish fair values.
Changes in assumptions about these factors could affect the reported fair value of financial instruments.
c) Revenue and expense recognition
Dividends are recognized when the shareholders’ right to receive payment is established, which is the ex-dividend date. Interest
income from debt securities and loans are recognized on an accrual basis. Premiums and discounts on debt securities classified as
AFS are amortized using the effective interest method. Premiums earned or discounts incurred for loans and AFS securities are
also amortized using the effective interest method. Dividend income and interest income are reported in Net investment income.
Transaction costs associated with the acquisition of financial instruments classified or designated as FVTPL are recognized in
income as incurred and included in Net investment gains (losses); otherwise, transaction costs are capitalized on initial recognition
and amortized using the effective interest method. Transaction costs incurred at the time of disposition of a financial instrument are
included in Net investment gains (losses).
Gains and losses on the sale of AFS debt and equity securities are calculated on a first in, first out basis and on an average cost
basis, respectively.
d) Impairment of financial assets
The Company determines, at each balance sheet date, whether there is objective evidence that a financial asset or a group of
financial assets, other than those classified or designated as FVTPL, are impaired. In order to do so, the Company considers the
impact of one or more events on the estimated future cash flows of the financial asset or group of financial assets.
AFS debt securities
An AFS debt security is impaired when it is probable that the future cash flows will not be fully recovered following a credit event that
affected the issuer of those debt securities. However, a credit event is not sufficient to constitute, in itself, evidence of impairment.
Other factors are considered to conclude that the debt security is impaired, such as payment default.
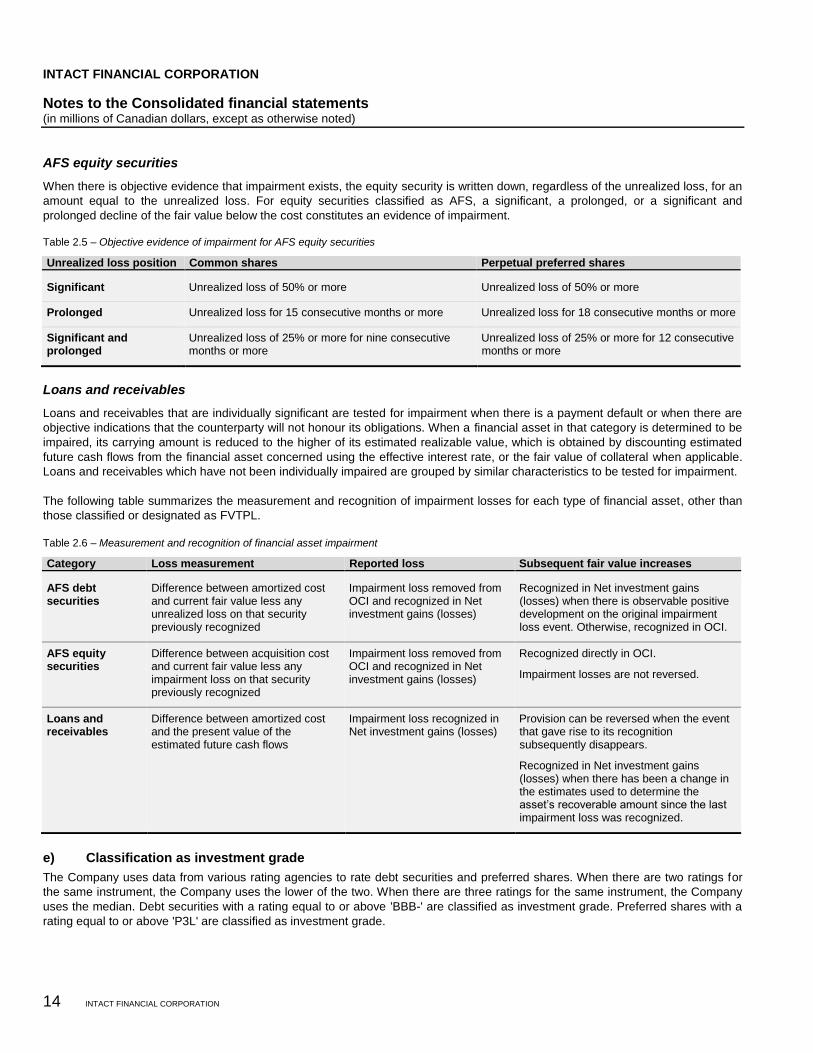
INTACT FINANCIAL CORPORATION
Notes to the Consolidated financial statements (in millions of Canadian dollars, except as otherwise noted)
14 INTACT FINANCIAL CORPORATION
AFS equity securities
When there is objective evidence that impairment exists, the equity security is written down, regardless of the unrealized loss, for an
amount equal to the unrealized loss. For equity securities classified as AFS, a significant, a prolonged, or a significant and
prolonged decline of the fair value below the cost constitutes an evidence of impairment. Table 2.5 – Objective evidence of impairment for AFS equity securities
Unrealized loss position Common shares Perpetual preferred shares
Significant Unrealized loss of 50% or more Unrealized loss of 50% or more
Prolonged Unrealized loss for 15 consecutive months or more Unrealized loss for 18 consecutive months or more
Significant and prolonged
Unrealized loss of 25% or more for nine consecutive months or more
Unrealized loss of 25% or more for 12 consecutive months or more
Loans and receivables
Loans and receivables that are individually significant are tested for impairment when there is a payment default or when there are
objective indications that the counterparty will not honour its obligations. When a financial asset in that category is determined to be
impaired, its carrying amount is reduced to the higher of its estimated realizable value, which is obtained by discounting estimated
future cash flows from the financial asset concerned using the effective interest rate, or the fair value of collateral when applicable.
Loans and receivables which have not been individually impaired are grouped by similar characteristics to be tested for impairment.
The following table summarizes the measurement and recognition of impairment losses for each type of financial asset, other than
those classified or designated as FVTPL.
Table 2.6 – Measurement and recognition of financial asset impairment
Category Loss measurement Reported loss Subsequent fair value increases
AFS debt securities
Difference between amortized cost and current fair value less any unrealized loss on that security previously recognized
Impairment loss removed from OCI and recognized in Net investment gains (losses)
Recognized in Net investment gains (losses) when there is observable positive development on the original impairment loss event. Otherwise, recognized in OCI.
AFS equity securities
Difference between acquisition cost and current fair value less any impairment loss on that security previously recognized
Impairment loss removed from OCI and recognized in Net investment gains (losses)
Recognized directly in OCI.
Impairment losses are not reversed.
Loans and receivables
Difference between amortized cost and the present value of the estimated future cash flows
Impairment loss recognized in Net investment gains (losses)
Provision can be reversed when the event that gave rise to its recognition subsequently disappears.
Recognized in Net investment gains (losses) when there has been a change in the estimates used to determine the asset’s recoverable amount since the last impairment loss was recognized.
e) Classification as investment grade
The Company uses data from various rating agencies to rate debt securities and preferred shares. When there are two ratings for
the same instrument, the Company uses the lower of the two. When there are three ratings for the same instrument, the Company
uses the median. Debt securities with a rating equal to or above 'BBB-' are classified as investment grade. Preferred shares with a
rating equal to or above 'P3L' are classified as investment grade.
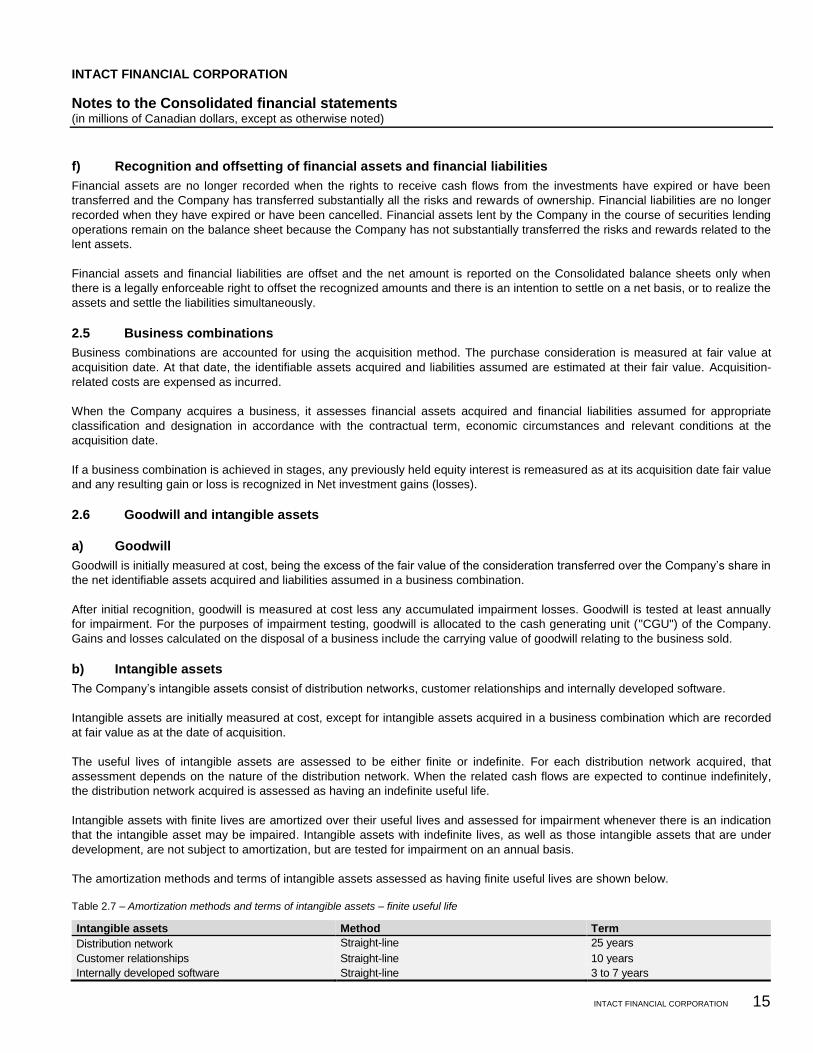
INTACT FINANCIAL CORPORATION
Notes to the Consolidated financial statements (in millions of Canadian dollars, except as otherwise noted)
INTACT FINANCIAL CORPORATION 15
f) Recognition and offsetting of financial assets and financial liabilities
Financial assets are no longer recorded when the rights to receive cash flows from the investments have expired or have been
transferred and the Company has transferred substantially all the risks and rewards of ownership. Financial liabilities are no longer
recorded when they have expired or have been cancelled. Financial assets lent by the Company in the course of securities lending
operations remain on the balance sheet because the Company has not substantially transferred the risks and rewards related to the
lent assets.
Financial assets and financial liabilities are offset and the net amount is reported on the Consolidated balance sheets only when
there is a legally enforceable right to offset the recognized amounts and there is an intention to settle on a net basis, or to realize the
assets and settle the liabilities simultaneously.
2.5 Business combinations
Business combinations are accounted for using the acquisition method. The purchase consideration is measured at fair value at
acquisition date. At that date, the identifiable assets acquired and liabilities assumed are estimated at their fair value. Acquisition-
related costs are expensed as incurred.
When the Company acquires a business, it assesses financial assets acquired and financial liabilities assumed for appropriate
classification and designation in accordance with the contractual term, economic circumstances and relevant conditions at the
acquisition date.
If a business combination is achieved in stages, any previously held equity interest is remeasured as at its acquisition date fair value
and any resulting gain or loss is recognized in Net investment gains (losses).
2.6 Goodwill and intangible assets
a) Goodwill
Goodwill is initially measured at cost, being the excess of the fair value of the consideration transferred over the Company’s share in
the net identifiable assets acquired and liabilities assumed in a business combination.
After initial recognition, goodwill is measured at cost less any accumulated impairment losses. Goodwill is tested at least annually
for impairment. For the purposes of impairment testing, goodwill is allocated to the cash generating unit ("CGU") of the Company.
Gains and losses calculated on the disposal of a business include the carrying value of goodwill relating to the business sold.
b) Intangible assets
The Company’s intangible assets consist of distribution networks, customer relationships and internally developed software.
Intangible assets are initially measured at cost, except for intangible assets acquired in a business combination which are recorded
at fair value as at the date of acquisition.
The useful lives of intangible assets are assessed to be either finite or indefinite. For each distribution network acquired, that
assessment depends on the nature of the distribution network. When the related cash flows are expected to continue indefinitely,
the distribution network acquired is assessed as having an indefinite useful life.
Intangible assets with finite lives are amortized over their useful lives and assessed for impairment whenever there is an indication
that the intangible asset may be impaired. Intangible assets with indefinite lives, as well as those intangible assets that are under
development, are not subject to amortization, but are tested for impairment on an annual basis.
The amortization methods and terms of intangible assets assessed as having finite useful lives are shown below.
Table 2.7 – Amortization methods and terms of intangible assets – finite useful life
Intangible assets Method Term
Distribution network Straight-line 25 years
Customer relationships Straight-line 10 years
Internally developed software Straight-line 3 to 7 years
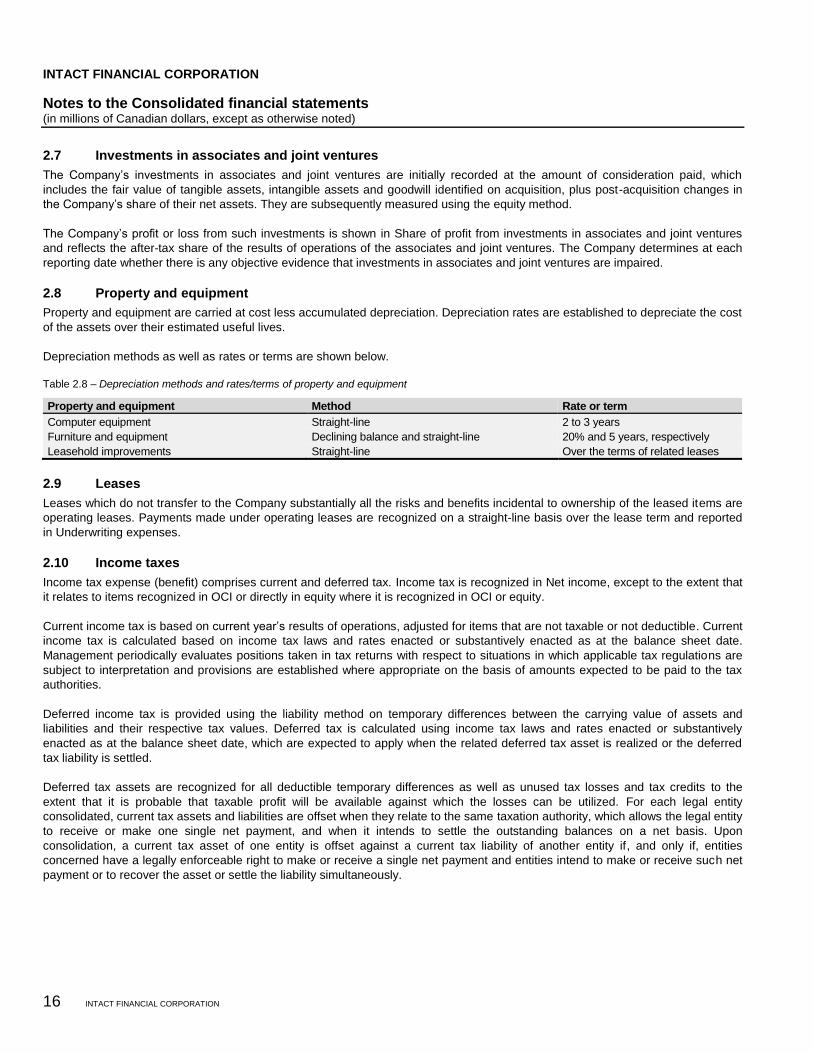
INTACT FINANCIAL CORPORATION
Notes to the Consolidated financial statements (in millions of Canadian dollars, except as otherwise noted)
16 INTACT FINANCIAL CORPORATION
2.7 Investments in associates and joint ventures
The Company’s investments in associates and joint ventures are initially recorded at the amount of consideration paid, which
includes the fair value of tangible assets, intangible assets and goodwill identified on acquisition, plus post-acquisition changes in
the Company’s share of their net assets. They are subsequently measured using the equity method.
The Company’s profit or loss from such investments is shown in Share of profit from investments in associates and joint ventures
and reflects the after-tax share of the results of operations of the associates and joint ventures. The Company determines at each
reporting date whether there is any objective evidence that investments in associates and joint ventures are impaired.
2.8 Property and equipment
Property and equipment are carried at cost less accumulated depreciation. Depreciation rates are established to depreciate the cost
of the assets over their estimated useful lives.
Depreciation methods as well as rates or terms are shown below.
Table 2.8 – Depreciation methods and rates/terms of property and equipment
Property and equipment Method Rate or term
Computer equipment Straight-line 2 to 3 years
Furniture and equipment Declining balance and straight-line 20% and 5 years, respectively
Leasehold improvements Straight-line Over the terms of related leases
2.9 Leases
Leases which do not transfer to the Company substantially all the risks and benefits incidental to ownership of the leased items are
operating leases. Payments made under operating leases are recognized on a straight-line basis over the lease term and reported
in Underwriting expenses.
2.10 Income taxes
Income tax expense (benefit) comprises current and deferred tax. Income tax is recognized in Net income, except to the extent that
it relates to items recognized in OCI or directly in equity where it is recognized in OCI or equity.
Current income tax is based on current year’s results of operations, adjusted for items that are not taxable or not deductible. Current
income tax is calculated based on income tax laws and rates enacted or substantively enacted as at the balance sheet date.
Management periodically evaluates positions taken in tax returns with respect to situations in which applicable tax regulations are
subject to interpretation and provisions are established where appropriate on the basis of amounts expected to be paid to the tax
authorities.
Deferred income tax is provided using the liability method on temporary differences between the carrying value of assets and
liabilities and their respective tax values. Deferred tax is calculated using income tax laws and rates enacted or substantively
enacted as at the balance sheet date, which are expected to apply when the related deferred tax asset is realized or the deferred
tax liability is settled.
Deferred tax assets are recognized for all deductible temporary differences as well as unused tax losses and tax credits to the
extent that it is probable that taxable profit will be available against which the losses can be utilized. For each legal entity
consolidated, current tax assets and liabilities are offset when they relate to the same taxation authority, which allows the legal entity
to receive or make one single net payment, and when it intends to settle the outstanding balances on a net basis. Upon
consolidation, a current tax asset of one entity is offset against a current tax liability of another entity if, and only if, entities
concerned have a legally enforceable right to make or receive a single net payment and entities intend to make or receive such net
payment or to recover the asset or settle the liability simultaneously.
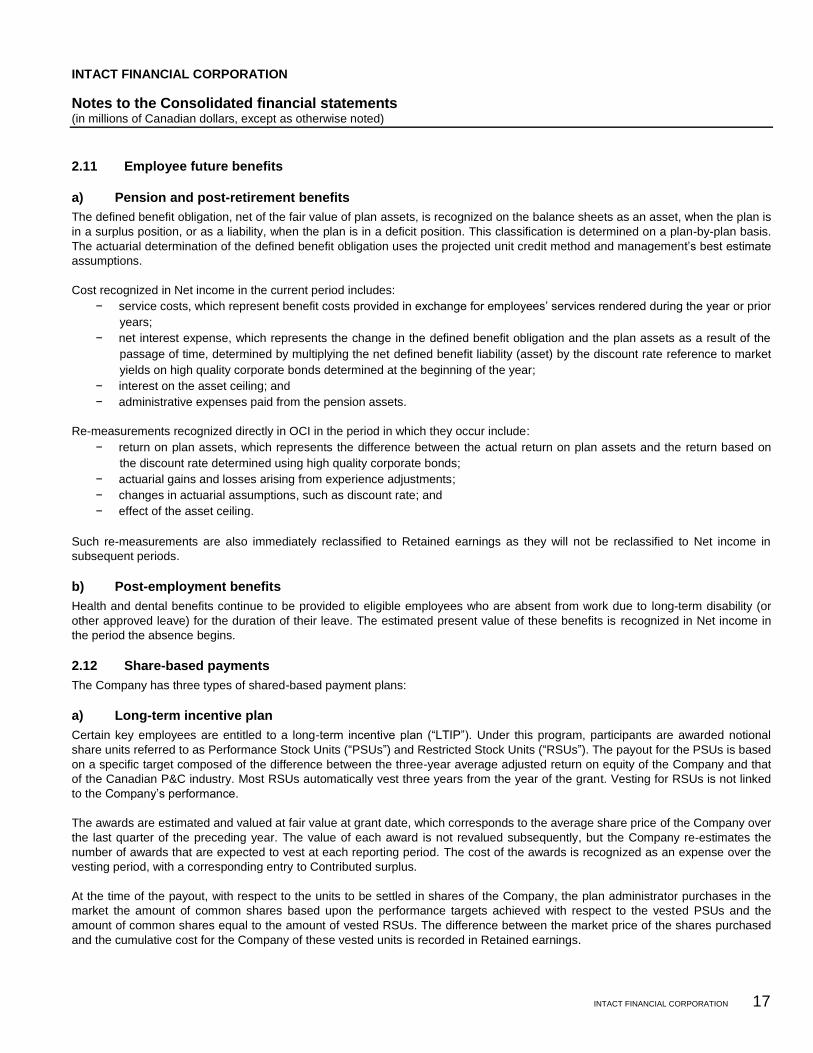
INTACT FINANCIAL CORPORATION
Notes to the Consolidated financial statements (in millions of Canadian dollars, except as otherwise noted)
INTACT FINANCIAL CORPORATION 17
2.11 Employee future benefits
a) Pension and post-retirement benefits
The defined benefit obligation, net of the fair value of plan assets, is recognized on the balance sheets as an asset, when the plan is
in a surplus position, or as a liability, when the plan is in a deficit position. This classification is determined on a plan-by-plan basis.
The actuarial determination of the defined benefit obligation uses the projected unit credit method and management’s best estimate
assumptions.
Cost recognized in Net income in the current period includes:
− service costs, which represent benefit costs provided in exchange for employees’ services rendered during the year or prior
years;
− net interest expense, which represents the change in the defined benefit obligation and the plan assets as a result of the
passage of time, determined by multiplying the net defined benefit liability (asset) by the discount rate reference to market
yields on high quality corporate bonds determined at the beginning of the year;
− interest on the asset ceiling; and
− administrative expenses paid from the pension assets.
Re-measurements recognized directly in OCI in the period in which they occur include:
− return on plan assets, which represents the difference between the actual return on plan assets and the return based on
the discount rate determined using high quality corporate bonds;
− actuarial gains and losses arising from experience adjustments;
− changes in actuarial assumptions, such as discount rate; and
− effect of the asset ceiling.
Such re-measurements are also immediately reclassified to Retained earnings as they will not be reclassified to Net income in
subsequent periods.
b) Post-employment benefits
Health and dental benefits continue to be provided to eligible employees who are absent from work due to long-term disability (or
other approved leave) for the duration of their leave. The estimated present value of these benefits is recognized in Net income in
the period the absence begins.
2.12 Share-based payments
The Company has three types of shared-based payment plans:
a) Long-term incentive plan
Certain key employees are entitled to a long-term incentive plan (“LTIP”). Under this program, participants are awarded notional
share units referred to as Performance Stock Units (“PSUs”) and Restricted Stock Units (“RSUs”). The payout for the PSUs is based
on a specific target composed of the difference between the three-year average adjusted return on equity of the Company and that
of the Canadian P&C industry. Most RSUs automatically vest three years from the year of the grant. Vesting for RSUs is not linked
to the Company’s performance.
The awards are estimated and valued at fair value at grant date, which corresponds to the average share price of the Company over
the last quarter of the preceding year. The value of each award is not revalued subsequently, but the Company re-estimates the
number of awards that are expected to vest at each reporting period. The cost of the awards is recognized as an expense over the
vesting period, with a corresponding entry to Contributed surplus.
At the time of the payout, with respect to the units to be settled in shares of the Company, the plan administrator purchases in the
market the amount of common shares based upon the performance targets achieved with respect to the vested PSUs and the
amount of common shares equal to the amount of vested RSUs. The difference between the market price of the shares purchased
and the cumulative cost for the Company of these vested units is recorded in Retained earnings.
INTACT FINANCIAL CORPORATION
Notes to the Consolidated financial statements (in millions of Canadian dollars, except as otherwise noted)
18 INTACT FINANCIAL CORPORATION
b) Employee share purchase plan
Employees who are not eligible for the LTIP are entitled to make contributions to a voluntary employee share purchase plan
(“ESPP”). Under the ESPP, eligible employees can contribute up to 10% of their annual base salary through a payroll deduction. As
an incentive to participate in the plan, the Company contributes to the plan an amount equal to 50% of the employee contribution.
The common shares are purchased in the market by an independent broker at the end of each month and are held by a custodian
on behalf of the employees. The common shares purchased with the Company’s contributions vest upon continued employment for
a period of 12 months. The Company’s contributions under the ESPP are cash-settled awards which are accrued and expensed
over the vesting period.
c) Deferred share unit plan
Non-employee directors of the Company are eligible to participate in the Company’s deferred share unit (“DSU”) Plan. A portion of
the remuneration of non-employee directors of the Company must be received in DSUs or shares of the Company. For the
remainder of their compensation, the directors are given the choice of cash, shares of the Company, DSUs or a combination of the
three.
Both DSUs and shares vest at the time of the grant. The DSUs are redeemed upon director retirement or termination and are settled
for cash or shares at that time. The DSUs are cash-settled awards which are expensed at the time of granting with a corresponding
financial liability reported in Other liabilities. This liability is re-measured at each reporting date based on the current share price,
with any fluctuations in the liability also recorded as an expense until it is settled. When directors elect to receive shares, the
Company makes instalments to the plan administrator for the purchase of shares of the Company on behalf of the directors.
2.13 Foreign currency translation
Monetary assets and liabilities denominated in foreign currencies are translated using the exchange rates in effect at the balance
sheet date. Non-monetary assets and liabilities are translated using the exchange rates in effect on the transaction dates. Revenues
and expenses are translated using the exchange rates in effect on the transaction dates. Exchange differences on translation are
included in Net investment gains (losses) or OCI.
2.14 Current vs non-current
In line with industry practice for insurance companies, the Company’s balance sheets are not presented using current and
non-current classifications, but are rather presented broadly in order of liquidity. Most of the Company’s assets and liabilities are
considered current given they are expected to be realized or settled within the Company’s normal operating cycle. All other assets
and liabilities are considered as non-current and generally include: Investments in associates and joint ventures, Deferred tax
assets, Property and equipment, Intangible assets, Goodwill, Deferred tax liabilities and Debt outstanding.
2.15 Operating segments
The Company’s business activities are directed towards P&C insurance operations. These activities are captured within a sole
reporting and operating segment, P&C insurance operations. Internal reports on the performance of the segment are regularly
reviewed by senior management, the Company’s Chief Executive Officer and the Board of Directors.
INTACT FINANCIAL CORPORATION
Notes to the Consolidated financial statements (in millions of Canadian dollars, except as otherwise noted)
INTACT FINANCIAL CORPORATION 19
Note 3 – Significant accounting judgments, estimates and assumptions
The preparation of financial statements in conformity with IFRS requires management to use judgments, estimates and assumptions
that can have a significant impact on the reported amounts of assets and liabilities, disclosure of contingent assets and liabilities as
at the balance sheet date, as well as reported amounts of revenues and expenses during the reporting period. Actual results could
differ significantly from these estimates.
The key estimates and assumptions that have a risk of causing a material adjustment to the carrying value of certain assets and
liabilities within the next financial year are as follows:
3.1 Valuation of claims liabilities
The Company establishes claims liabilities to cover the estimated liability for the payment of all losses, including loss adjustment
expenses incurred with respect to insurance contracts underwritten by the Company. Claims liabilities do not represent an exact
calculation of the liability. The ultimate cost of claims liabilities is estimated by using a range of standard actuarial claims projection
techniques in accordance with Canadian accepted actuarial practice.
The main assumption underlying these techniques is that a company’s past claims development experience can be used to project
future claims development and hence ultimate claims costs. As such, these methods extrapolate the development of paid and
incurred losses, average costs per claim (severity) and number of claims (frequency) based on the observed development of earlier
years and expected loss ratios. Historical claims development is analyzed by accident years, by geographical area, as well as by
significant business line and claim type. Large catastrophic events are usually separately addressed, either by being reserved at the
face value of loss adjuster estimates in the case of very large losses or separately projected in order to reflect their future
development which might differ from historical data in the case of catastrophic events. In most cases, no explicit assumptions are
made regarding future rates of claims inflation. Instead, the assumptions used are those implicit in the historical claims development
data on which the projections are based.
Additional qualitative judgment is used to assess the extent to which past trends may not apply in future, in order to arrive at the
estimated ultimate cost of claims that present the likely outcome from the range of possible outcomes, taking into account all the
uncertainties involved.
Details on key assumptions and sensitivity analysis can be found in Note 9.
3.2 Valuation of defined benefit obligation
The cost of the defined benefit plans and the defined benefit obligation are calculated by the Company’s independent actuaries
using assumptions determined by management. The actuarial valuation involves making assumptions about discount rates, future
salary increases, future inflation, the employees’ age upon termination and retirement, mortality rates, future pension increases,
disability incidence and health and dental care cost trends. If actuarial experience differs from the assumptions used, the expected
obligation could increase or decrease in future years.
Due to the complexity of the valuation and its long-term nature, the defined benefit obligation is highly sensitive to changes in the
assumptions. Assumptions are reviewed at each reporting date.
Details on key assumptions and sensitivity analysis can be found in Note 20.6.
3.3 Business combination
Upon initial recognition, acquiree’s assets and liabilities have been included in the Consolidated balance sheets at fair value.
Management estimated the fair values using estimates on future cash flows and discount rates. However, actual results can be
different from those estimates. The changes in the estimates that relate to new information obtained about facts and circumstances
that existed as of the acquisition date, made at initial recognition with regard to items for which the valuation was incomplete, would
have an impact on the amount of goodwill recognized. Any other changes in the estimates made at initial recognition would be
recognized in income.
INTACT FINANCIAL CORPORATION
Notes to the Consolidated financial statements (in millions of Canadian dollars, except as otherwise noted)
20 INTACT FINANCIAL CORPORATION
3.4 Impairment of goodwill and intangible assets
The Company determines whether goodwill and intangible assets with indefinite useful lives are impaired at least on an annual
basis. Also, intangible assets under development are not subject to amortization but are tested for impairment on an annual basis.
The carrying value of these intangibles is allocated to a single CGU, which is the Company’s sole operating segment, P&C
insurance operations. It is the lowest level at which there are separately identifiable cash flows. Impairment testing of these
intangibles requires an estimation of the recoverable amount.
The most recent test was performed as at June 30, 2014. As at this date, the P&C insurance operations CGU was tested for
impairment, calculating both the fair value less costs to sell and the value in use. The value-in-use calculation was based on the
following key estimates and assumptions:
− Cash flow projections for the next three years are based on financial budgets approved by management and determined
using budgeted margins based on past performance and management expectations for the Company and the industry.
− Cash flows beyond the three-year period are extrapolated using estimated growth rates of 3% as at June 30, 2014 and
2013, which do not exceed the industry long-term average past growth rate in which the Company operates.
− A Company specific risk adjusted discount rate of 12.5% as at June 30, 2014 (June 30, 2013 – 13% was used).
The test results indicate that the recoverable amount of the P&C insurance operations CGU exceeds its carrying value. No
impairment loss for goodwill or intangible assets has been recognized for the year ended December 31, 2014 or prior.
The Company is not aware of any reasonably possible change in any of the above key assumptions that would cause the carrying
value of the CGU to exceed its recoverable amount.
3.5 Impairment of financial assets
The Company determines, at each balance sheet date, whether there is objective evidence that financial assets, other than those
classified or designated as FVTPL, are impaired. Considerations which form the basis of these objective evidence judgments
include a significant or prolonged decline in fair value, a loss event that has occurred which has impaired the expected cash flows,
as well as other considerations such as liquidity and credit risk.
Details on objective evidence of impairment can be found in Note 2.4.
3.6 Measurement of income taxes
Management exercises judgment in estimating the provision for income taxes. The Company is subject to federal income tax law
and provincial income tax laws in the various jurisdictions where it operates. Various tax laws are potentially subject to different
interpretations by the taxpayer and the relevant tax authority. To the extent that the Company’s interpretations of tax laws differ from
those of tax authorities or that the timing of realization of deferred tax assets is not as expected, the provision for income taxes may
increase or decrease in future periods to reflect actual experience.
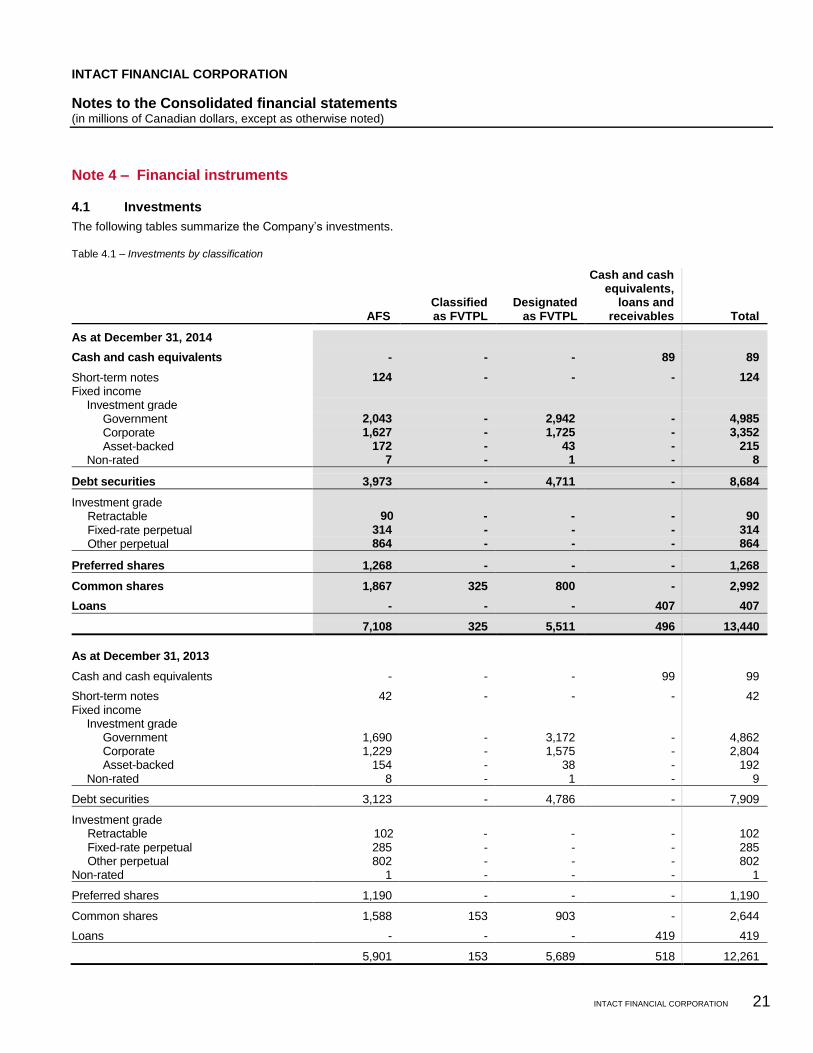
INTACT FINANCIAL CORPORATION
Notes to the Consolidated financial statements (in millions of Canadian dollars, except as otherwise noted)
INTACT FINANCIAL CORPORATION 21
Note 4 – Financial instruments
4.1 Investments
The following tables summarize the Company’s investments.
Table 4.1 – Investments by classification
AFS Classified as FVTPL
Designated as FVTPL
Cash and cash equivalents,
loans and receivables Total
As at December 31, 2014
Cash and cash equivalents - - - 89 89
Short-term notes 124 - - - 124
Fixed income
Investment grade
Government 2,043 - 2,942 - 4,985
Corporate 1,627 - 1,725 - 3,352
Asset-backed 172 - 43 - 215
Non-rated 7 - 1 - 8
Debt securities 3,973 - 4,711 - 8,684
Investment grade
Retractable 90 - - - 90
Fixed-rate perpetual 314 - - - 314
Other perpetual 864 - - - 864
Preferred shares 1,268 - - - 1,268
Common shares 1,867 325 800 - 2,992
Loans - - - 407 407
7,108 325 5,511 496 13,440
As at December 31, 2013
Cash and cash equivalents - - - 99 99
Short-term notes 42 - - - 42 Fixed income Investment grade Government 1,690 - 3,172 - 4,862 Corporate 1,229 - 1,575 - 2,804 Asset-backed 154 - 38 - 192 Non-rated 8 - 1 - 9
Debt securities 3,123 - 4,786 - 7,909
Investment grade Retractable 102 - - - 102 Fixed-rate perpetual 285 - - - 285 Other perpetual 802 - - - 802 Non-rated 1 - - - 1
Preferred shares 1,190 - - - 1,190
Common shares 1,588 153 903 - 2,644
Loans - - - 419 419
5,901 153 5,689 518 12,261
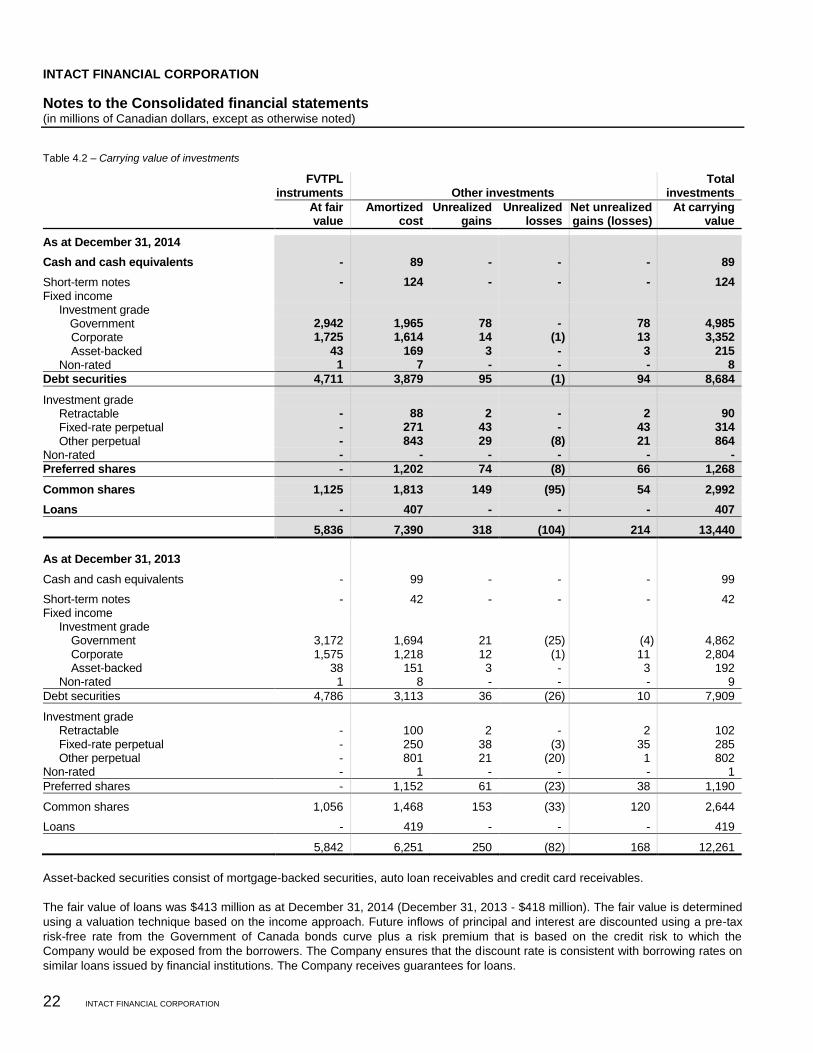
INTACT FINANCIAL CORPORATION
Notes to the Consolidated financial statements (in millions of Canadian dollars, except as otherwise noted)
22 INTACT FINANCIAL CORPORATION
Table 4.2 – Carrying value of investments
FVTPL instruments Other investments
Total investments
At fair value
Amortized cost
Unrealized gains
Unrealized losses
Net unrealized gains (losses)
At carrying value
As at December 31, 2014
Cash and cash equivalents - 89 - - - 89
Short-term notes - 124 - - - 124
Fixed income
Investment grade
Government 2,942 1,965 78 - 78 4,985
Corporate 1,725 1,614 14 (1) 13 3,352
Asset-backed 43 169 3 - 3 215
Non-rated 1 7 - - - 8
Debt securities 4,711 3,879 95 (1) 94 8,684
Investment grade
Retractable - 88 2 - 2 90
Fixed-rate perpetual - 271 43 - 43 314
Other perpetual - 843 29 (8) 21 864
Non-rated - - - - - -
Preferred shares - 1,202 74 (8) 66 1,268
Common shares 1,125 1,813 149 (95) 54 2,992
Loans - 407 - - - 407
5,836 7,390 318 (104) 214 13,440
As at December 31, 2013
Cash and cash equivalents - 99 - - - 99
Short-term notes - 42 - - - 42 Fixed income Investment grade Government 3,172 1,694 21 (25) (4) 4,862 Corporate 1,575 1,218 12 (1) 11 2,804 Asset-backed 38 151 3 - 3 192 Non-rated 1 8 - - - 9
Debt securities 4,786 3,113 36 (26) 10 7,909
Investment grade Retractable - 100 2 - 2 102 Fixed-rate perpetual - 250 38 (3) 35 285 Other perpetual - 801 21 (20) 1 802 Non-rated - 1 - - - 1
Preferred shares - 1,152 61 (23) 38 1,190
Common shares 1,056 1,468 153 (33) 120 2,644
Loans - 419 - - - 419
5,842 6,251 250 (82) 168 12,261
Asset-backed securities consist of mortgage-backed securities, auto loan receivables and credit card receivables.
The fair value of loans was $413 million as at December 31, 2014 (December 31, 2013 - $418 million). The fair value is determined
using a valuation technique based on the income approach. Future inflows of principal and interest are discounted using a pre-tax
risk-free rate from the Government of Canada bonds curve plus a risk premium that is based on the credit risk to which the
Company would be exposed from the borrowers. The Company ensures that the discount rate is consistent with borrowing rates on
similar loans issued by financial institutions. The Company receives guarantees for loans.
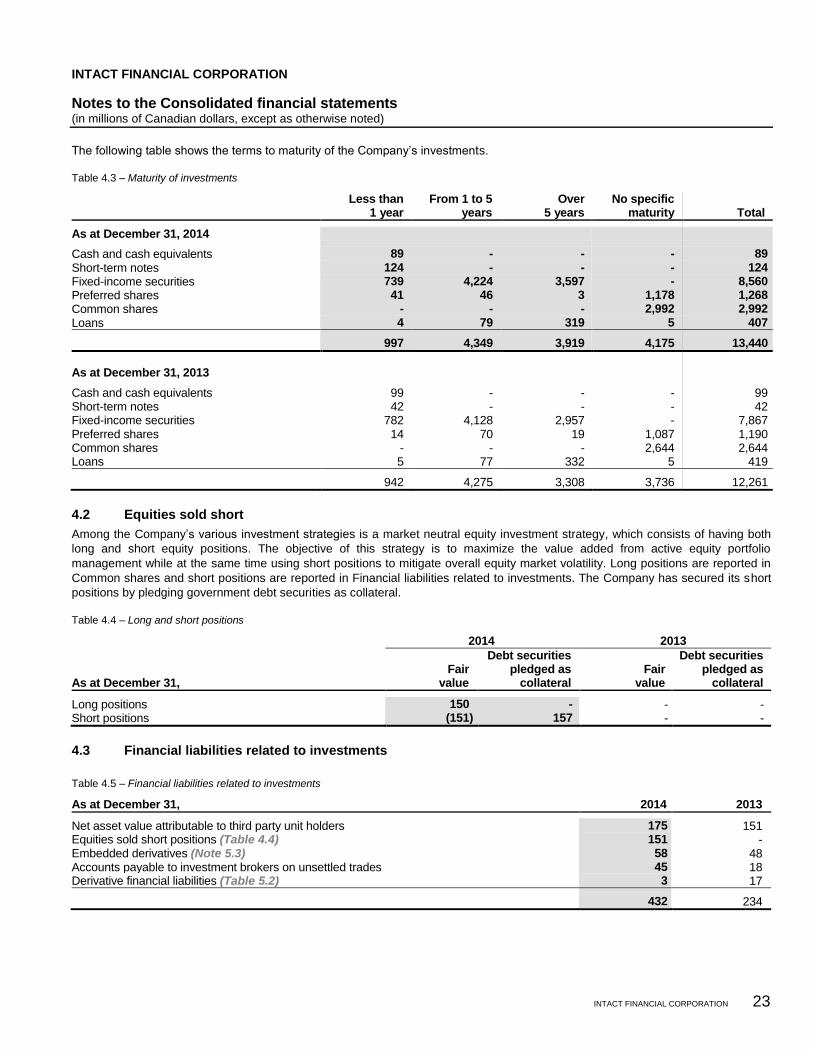
INTACT FINANCIAL CORPORATION
Notes to the Consolidated financial statements (in millions of Canadian dollars, except as otherwise noted)
INTACT FINANCIAL CORPORATION 23
The following table shows the terms to maturity of the Company’s investments.
Table 4.3 – Maturity of investments
Less than
1 year From 1 to 5
years Over
5 years No specific
maturity Total
As at December 31, 2014
Cash and cash equivalents 89 - - - 89
Short-term notes 124 - - - 124
Fixed-income securities 739 4,224 3,597 - 8,560
Preferred shares 41 46 3 1,178 1,268
Common shares - - - 2,992 2,992
Loans 4 79 319 5 407
997 4,349 3,919 4,175 13,440
As at December 31, 2013
Cash and cash equivalents 99 - - - 99 Short-term notes 42 - - - 42 Fixed-income securities 782 4,128 2,957 - 7,867 Preferred shares 14 70 19 1,087 1,190 Common shares - - - 2,644 2,644 Loans 5 77 332 5 419
942 4,275 3,308 3,736 12,261
4.2 Equities sold short
Among the Company’s various investment strategies is a market neutral equity investment strategy, which consists of having both
long and short equity positions. The objective of this strategy is to maximize the value added from active equity portfolio
management while at the same time using short positions to mitigate overall equity market volatility. Long positions are reported in
Common shares and short positions are reported in Financial liabilities related to investments. The Company has secured its short
positions by pledging government debt securities as collateral.
Table 4.4 – Long and short positions
2014 2013
As at December 31, Fair
value
Debt securities pledged as
collateral Fair
value
Debt securities pledged as
collateral
Long positions 150 - - - Short positions (151) 157 - -
4.3 Financial liabilities related to investments
Table 4.5 – Financial liabilities related to investments
As at December 31, 2014 2013
Net asset value attributable to third party unit holders 175 151 Equities sold short positions (Table 4.4) 151 - Embedded derivatives (Note 5.3) 58 48 Accounts payable to investment brokers on unsettled trades 45 18 Derivative financial liabilities (Table 5.2) 3 17
432 234
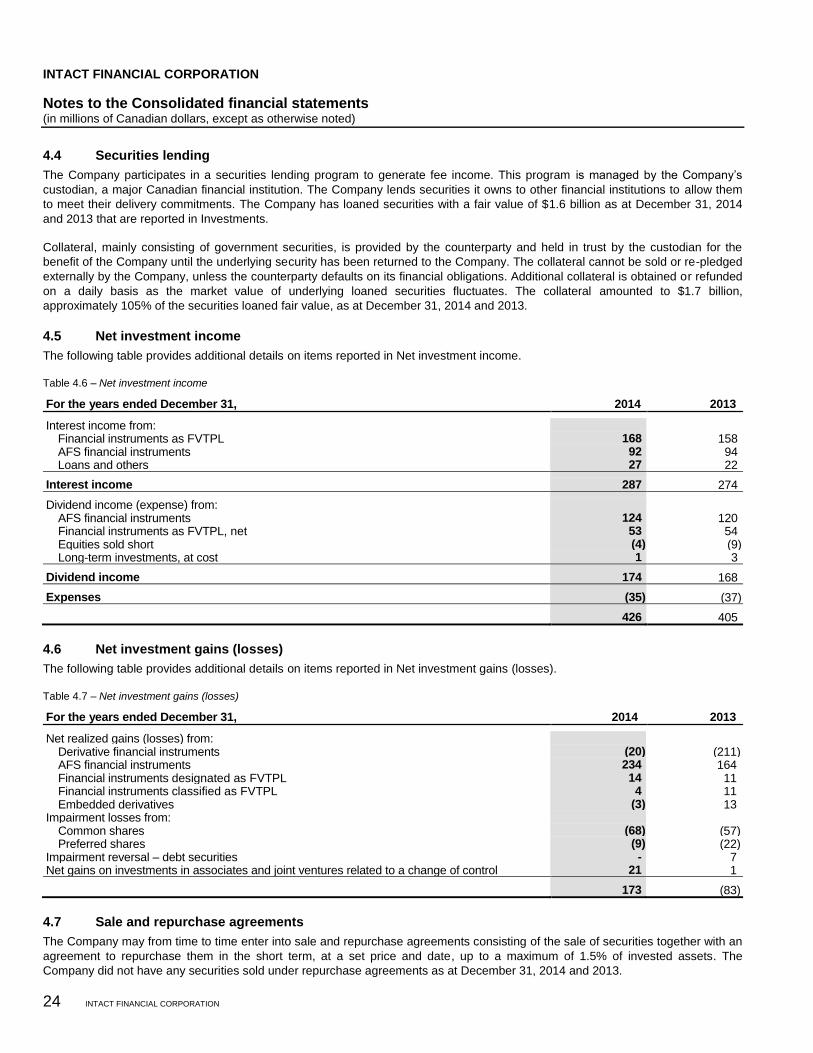
INTACT FINANCIAL CORPORATION
Notes to the Consolidated financial statements (in millions of Canadian dollars, except as otherwise noted)
24 INTACT FINANCIAL CORPORATION
4.4 Securities lending
The Company participates in a securities lending program to generate fee income. This program is managed by the Company’s
custodian, a major Canadian financial institution. The Company lends securities it owns to other financial institutions to allow them
to meet their delivery commitments. The Company has loaned securities with a fair value of $1.6 billion as at December 31, 2014
and 2013 that are reported in Investments.
Collateral, mainly consisting of government securities, is provided by the counterparty and held in trust by the custodian for the
benefit of the Company until the underlying security has been returned to the Company. The collateral cannot be sold or re-pledged
externally by the Company, unless the counterparty defaults on its financial obligations. Additional collateral is obtained or refunded
on a daily basis as the market value of underlying loaned securities fluctuates. The collateral amounted to $1.7 billion,
approximately 105% of the securities loaned fair value, as at December 31, 2014 and 2013.
4.5 Net investment income
The following table provides additional details on items reported in Net investment income.
Table 4.6 – Net investment income
For the years ended December 31, 2014 2013
Interest income from: Financial instruments as FVTPL 168 158 AFS financial instruments 92 94 Loans and others 27 22
Interest income 287 274
Dividend income (expense) from: AFS financial instruments 124 120 Financial instruments as FVTPL, net 53 54 Equities sold short (4) (9) Long-term investments, at cost 1 3
Dividend income 174 168
Expenses (35) (37)
426 405
4.6 Net investment gains (losses)
The following table provides additional details on items reported in Net investment gains (losses).
Table 4.7 – Net investment gains (losses)
For the years ended December 31, 2014 2013
Net realized gains (losses) from: Derivative financial instruments (20) (211) AFS financial instruments 234 164 Financial instruments designated as FVTPL 14 11 Financial instruments classified as FVTPL 4 11 Embedded derivatives (3) 13 Impairment losses from: Common shares (68) (57) Preferred shares (9) (22) Impairment reversal – debt securities - 7 Net gains on investments in associates and joint ventures related to a change of control 21 1
173 (83)
4.7 Sale and repurchase agreements
The Company may from time to time enter into sale and repurchase agreements consisting of the sale of securities together with an
agreement to repurchase them in the short term, at a set price and date, up to a maximum of 1.5% of invested assets. The
Company did not have any securities sold under repurchase agreements as at December 31, 2014 and 2013.
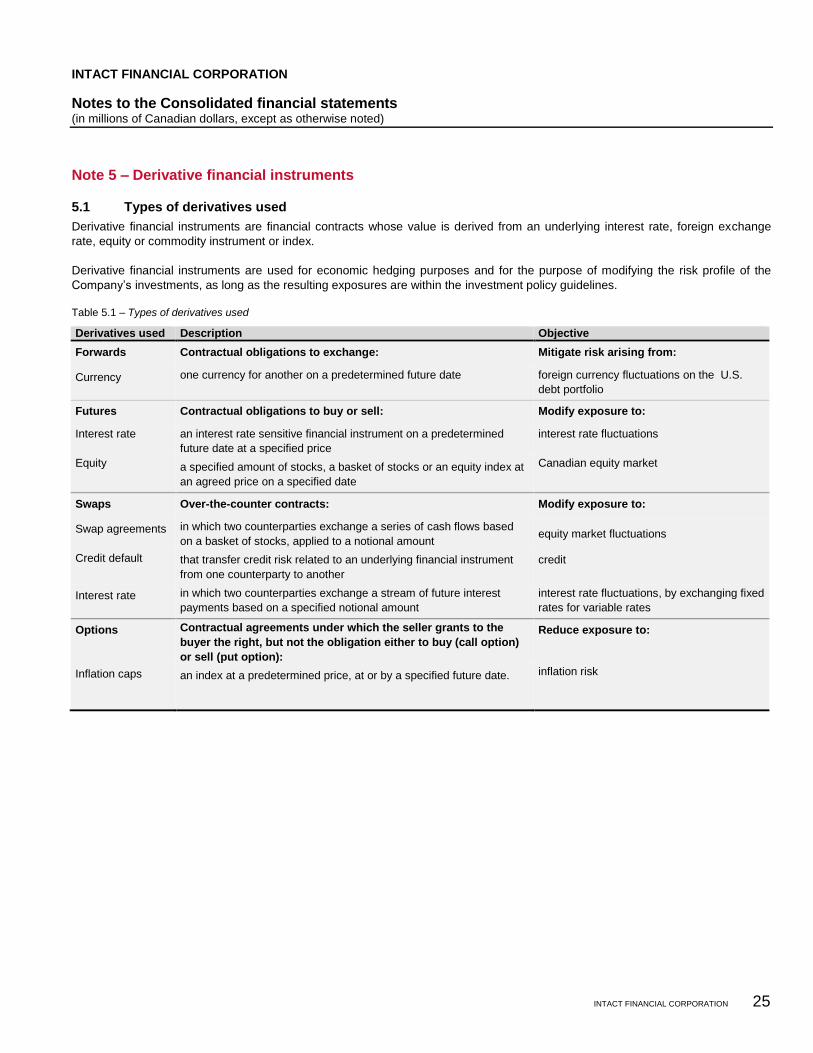
INTACT FINANCIAL CORPORATION
Notes to the Consolidated financial statements (in millions of Canadian dollars, except as otherwise noted)
INTACT FINANCIAL CORPORATION 25
Note 5 – Derivative financial instruments
5.1 Types of derivatives used
Derivative financial instruments are financial contracts whose value is derived from an underlying interest rate, foreign exchange
rate, equity or commodity instrument or index.
Derivative financial instruments are used for economic hedging purposes and for the purpose of modifying the risk profile of the
Company’s investments, as long as the resulting exposures are within the investment policy guidelines.
Table 5.1 – Types of derivatives used
Derivatives used Description Objective
Forwards Contractual obligations to exchange: Mitigate risk arising from:
Currency one currency for another on a predetermined future date foreign currency fluctuations on the U.S.
debt portfolio
Futures Contractual obligations to buy or sell: Modify exposure to:
Interest rate an interest rate sensitive financial instrument on a predetermined
future date at a specified price
interest rate fluctuations
Equity a specified amount of stocks, a basket of stocks or an equity index at
an agreed price on a specified date
Canadian equity market
Swaps Over-the-counter contracts: Modify exposure to:
Swap agreements in which two counterparties exchange a series of cash flows based
on a basket of stocks, applied to a notional amount equity market fluctuations
Credit default that transfer credit risk related to an underlying financial instrument
from one counterparty to another
credit
Interest rate in which two counterparties exchange a stream of future interest
payments based on a specified notional amount
interest rate fluctuations, by exchanging fixed
rates for variable rates
Options Contractual agreements under which the seller grants to the
buyer the right, but not the obligation either to buy (call option)
or sell (put option):
Reduce exposure to:
Inflation caps
an index at a predetermined price, at or by a specified future date. inflation risk
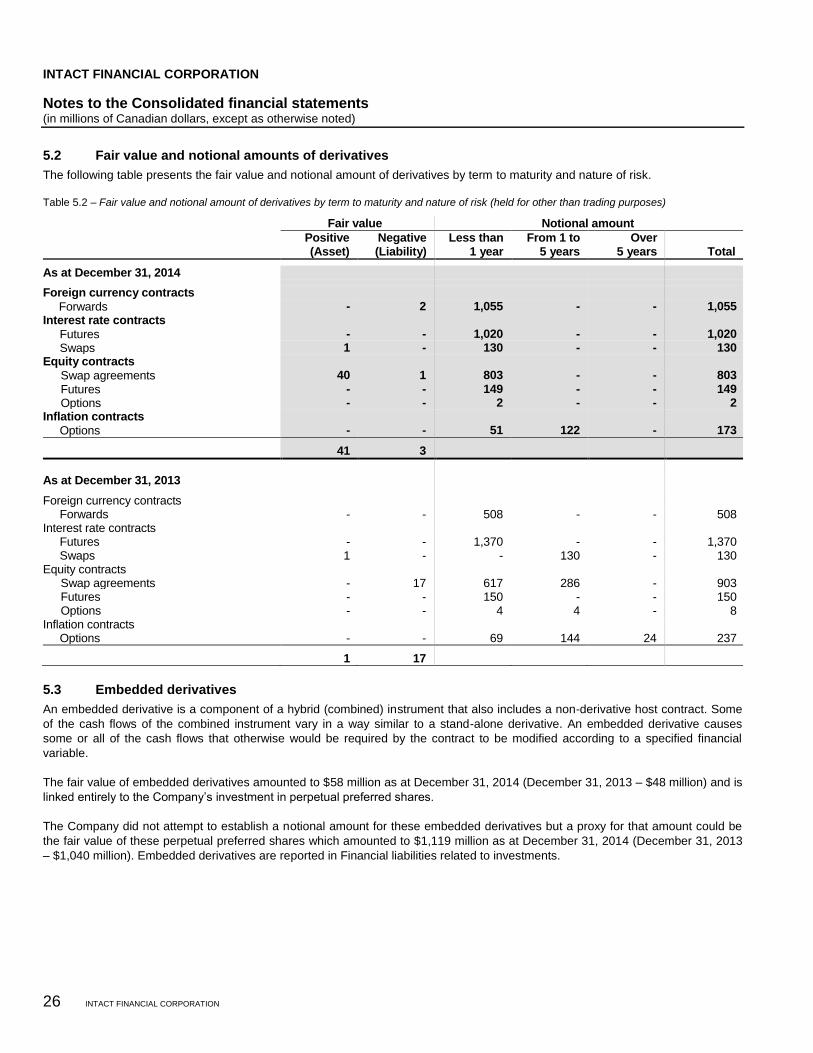
INTACT FINANCIAL CORPORATION
Notes to the Consolidated financial statements (in millions of Canadian dollars, except as otherwise noted)
26 INTACT FINANCIAL CORPORATION
5.2 Fair value and notional amounts of derivatives
The following table presents the fair value and notional amount of derivatives by term to maturity and nature of risk.
Table 5.2 – Fair value and notional amount of derivatives by term to maturity and nature of risk (held for other than trading purposes)
Fair value Notional amount
Positive (Asset)
Negative (Liability)
Less than 1 year
From 1 to 5 years
Over 5 years Total
As at December 31, 2014
Foreign currency contracts
Forwards - 2 1,055 - - 1,055 Interest rate contracts
Futures - - 1,020 - - 1,020
Swaps 1 - 130 - - 130 Equity contracts
Swap agreements 40 1 803 - - 803
Futures - - 149 - - 149
Options - - 2 - - 2 Inflation contracts
Options - - 51 122 - 173
41 3
As at December 31, 2013
Foreign currency contracts
Forwards - - 508 - - 508 Interest rate contracts Futures - - 1,370 - - 1,370 Swaps 1 - - 130 - 130 Equity contracts Swap agreements - 17 617 286 - 903 Futures - - 150 - - 150 Options - - 4 4 - 8 Inflation contracts
Options - - 69 144 24 237
1 17
5.3 Embedded derivatives
An embedded derivative is a component of a hybrid (combined) instrument that also includes a non-derivative host contract. Some
of the cash flows of the combined instrument vary in a way similar to a stand-alone derivative. An embedded derivative causes
some or all of the cash flows that otherwise would be required by the contract to be modified according to a specified financial
variable.
The fair value of embedded derivatives amounted to $58 million as at December 31, 2014 (December 31, 2013 – $48 million) and is
linked entirely to the Company’s investment in perpetual preferred shares.
The Company did not attempt to establish a notional amount for these embedded derivatives but a proxy for that amount could be
the fair value of these perpetual preferred shares which amounted to $1,119 million as at December 31, 2014 (December 31, 2013
– $1,040 million). Embedded derivatives are reported in Financial liabilities related to investments.
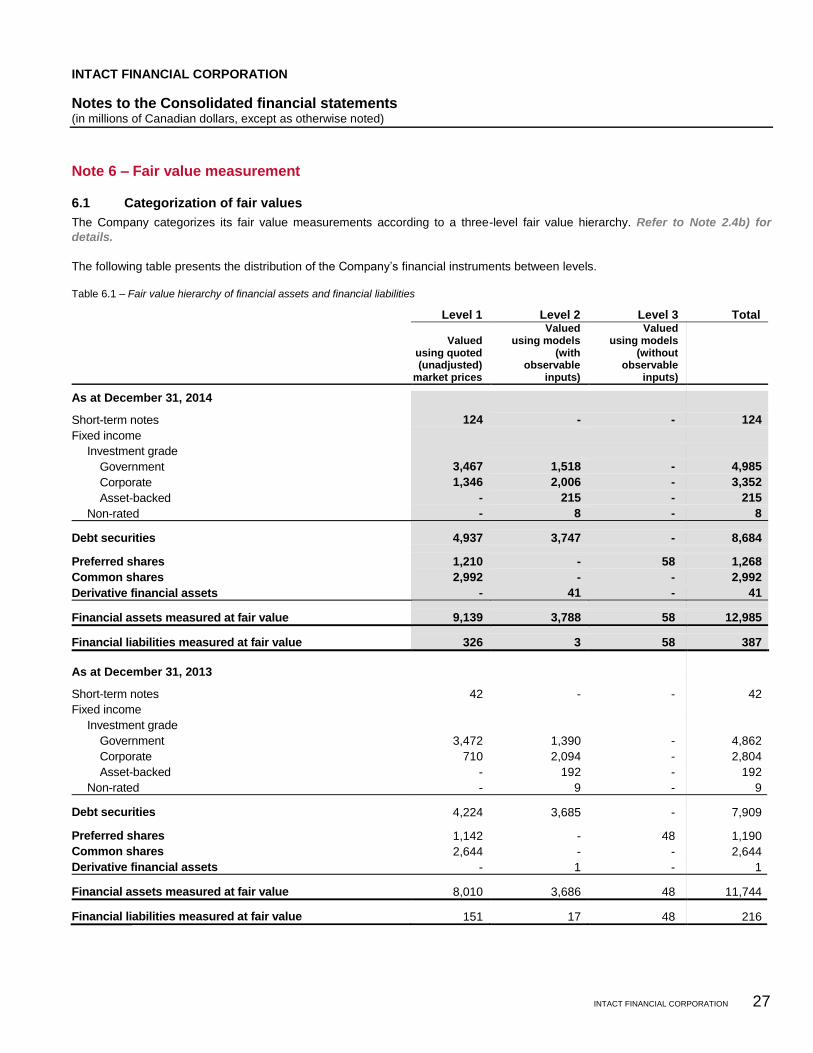
INTACT FINANCIAL CORPORATION
Notes to the Consolidated financial statements (in millions of Canadian dollars, except as otherwise noted)
INTACT FINANCIAL CORPORATION 27
Note 6 – Fair value measurement
6.1 Categorization of fair values
The Company categorizes its fair value measurements according to a three-level fair value hierarchy. Refer to Note 2.4b) for
details.
The following table presents the distribution of the Company’s financial instruments between levels.
Table 6.1 – Fair value hierarchy of financial assets and financial liabilities
Level 1 Level 2 Level 3 Total
Valued
using quoted (unadjusted)
market prices
Valued using models
(with observable
inputs)
Valued using models
(without observable
inputs)
As at December 31, 2014
Short-term notes 124 - - 124
Fixed income
Investment grade
Government 3,467 1,518 - 4,985
Corporate 1,346 2,006 - 3,352
Asset-backed - 215 - 215
Non-rated - 8 - 8
Debt securities 4,937 3,747 - 8,684
Preferred shares 1,210 - 58 1,268
Common shares 2,992 - - 2,992
Derivative financial assets - 41 - 41
Financial assets measured at fair value 9,139 3,788 58 12,985
Financial liabilities measured at fair value 326 3 58 387
As at December 31, 2013
Short-term notes 42 - - 42
Fixed income
Investment grade
Government 3,472 1,390 - 4,862
Corporate 710 2,094 - 2,804
Asset-backed - 192 - 192
Non-rated - 9 - 9
Debt securities 4,224 3,685 - 7,909
Preferred shares 1,142 - 48 1,190
Common shares 2,644 - - 2,644
Derivative financial assets - 1 - 1
Financial assets measured at fair value 8,010 3,686 48 11,744
Financial liabilities measured at fair value 151 17 48 216
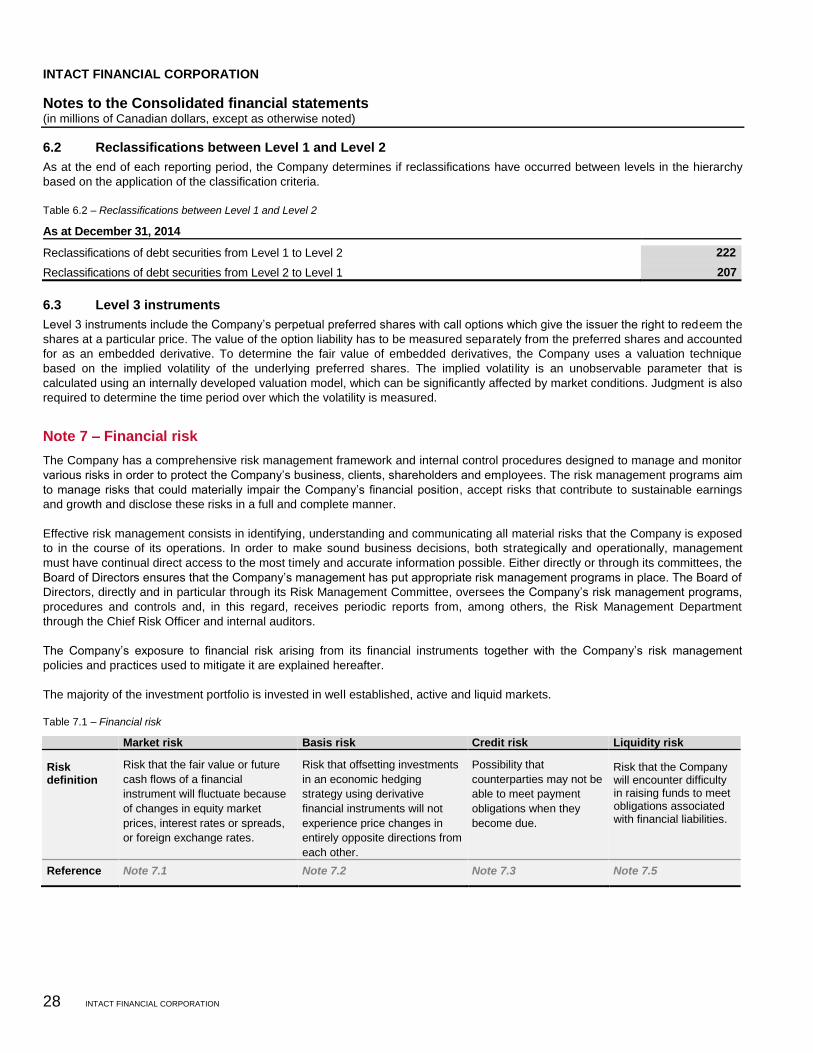
INTACT FINANCIAL CORPORATION
Notes to the Consolidated financial statements (in millions of Canadian dollars, except as otherwise noted)
28 INTACT FINANCIAL CORPORATION
6.2 Reclassifications between Level 1 and Level 2
As at the end of each reporting period, the Company determines if reclassifications have occurred between levels in the hierarchy
based on the application of the classification criteria.
Table 6.2 – Reclassifications between Level 1 and Level 2
As at December 31, 2014
Reclassifications of debt securities from Level 1 to Level 2 222
Reclassifications of debt securities from Level 2 to Level 1 207
6.3 Level 3 instruments
Level 3 instruments include the Company’s perpetual preferred shares with call options which give the issuer the right to redeem the
shares at a particular price. The value of the option liability has to be measured separately from the preferred shares and accounted
for as an embedded derivative. To determine the fair value of embedded derivatives, the Company uses a valuation technique
based on the implied volatility of the underlying preferred shares. The implied volatility is an unobservable parameter that is
calculated using an internally developed valuation model, which can be significantly affected by market conditions. Judgment is also
required to determine the time period over which the volatility is measured.
Note 7 – Financial risk
The Company has a comprehensive risk management framework and internal control procedures designed to manage and monitor
various risks in order to protect the Company’s business, clients, shareholders and employees. The risk management programs aim
to manage risks that could materially impair the Company’s financial position, accept risks that contribute to sustainable earnings
and growth and disclose these risks in a full and complete manner.
Effective risk management consists in identifying, understanding and communicating all material risks that the Company is exposed
to in the course of its operations. In order to make sound business decisions, both strategically and operationally, management
must have continual direct access to the most timely and accurate information possible. Either directly or through its committees, the
Board of Directors ensures that the Company’s management has put appropriate risk management programs in place. The Board of
Directors, directly and in particular through its Risk Management Committee, oversees the Company’s risk management programs,
procedures and controls and, in this regard, receives periodic reports from, among others, the Risk Management Department
through the Chief Risk Officer and internal auditors.
The Company’s exposure to financial risk arising from its financial instruments together with the Company’s risk management
policies and practices used to mitigate it are explained hereafter.
The majority of the investment portfolio is invested in well established, active and liquid markets.
Table 7.1 – Financial risk
Market risk Basis risk Credit risk Liquidity risk
Risk definition
Risk that the fair value or future
cash flows of a financial
instrument will fluctuate because
of changes in equity market
prices, interest rates or spreads,
or foreign exchange rates.
Risk that offsetting investments
in an economic hedging
strategy using derivative
financial instruments will not
experience price changes in
entirely opposite directions from
each other.
Possibility that
counterparties may not be
able to meet payment
obligations when they
become due.
Risk that the Company will encounter difficulty in raising funds to meet obligations associated with financial liabilities.
Reference Note 7.1 Note 7.2 Note 7.3 Note 7.5
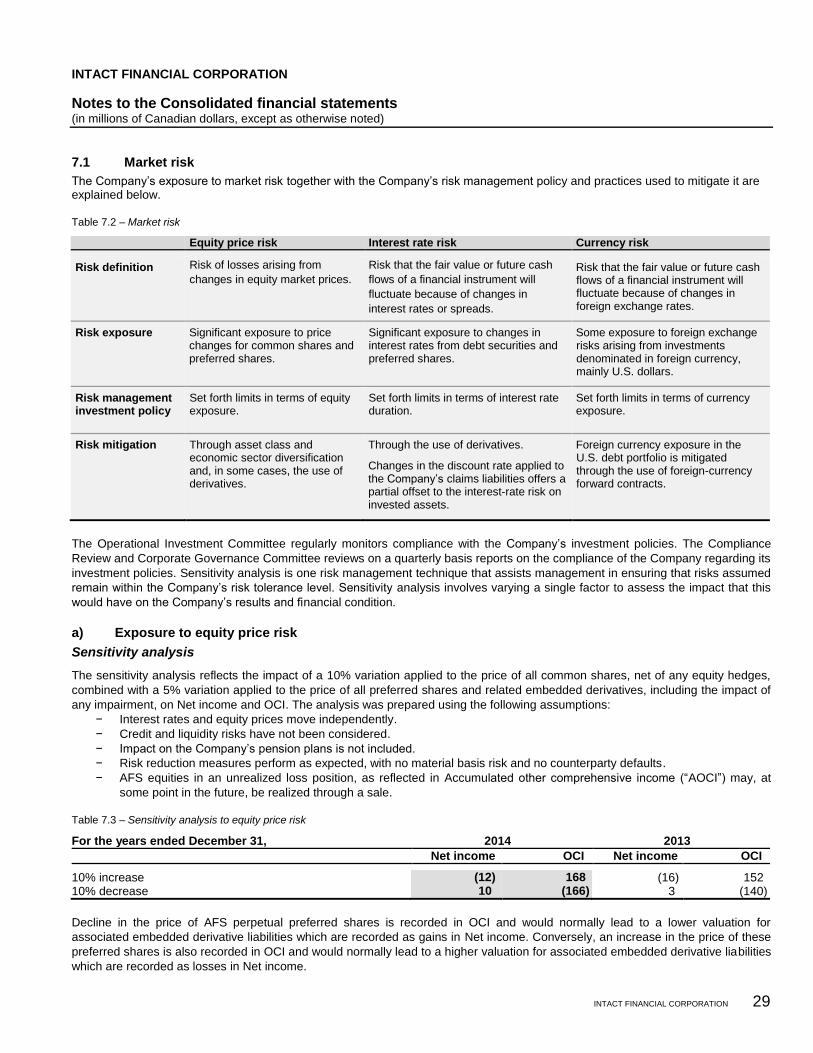
INTACT FINANCIAL CORPORATION
Notes to the Consolidated financial statements (in millions of Canadian dollars, except as otherwise noted)
INTACT FINANCIAL CORPORATION 29
7.1 Market risk
The Company’s exposure to market risk together with the Company’s risk management policy and practices used to mitigate it are explained below.
Table 7.2 – Market risk
Equity price risk Interest rate risk Currency risk
Risk definition Risk of losses arising from
changes in equity market prices.
Risk that the fair value or future cash
flows of a financial instrument will
fluctuate because of changes in
interest rates or spreads.
Risk that the fair value or future cash flows of a financial instrument will fluctuate because of changes in foreign exchange rates.
Risk exposure Significant exposure to price changes for common shares and preferred shares.
Significant exposure to changes in interest rates from debt securities and preferred shares.
Some exposure to foreign exchange risks arising from investments denominated in foreign currency, mainly U.S. dollars.
Risk management investment policy
Set forth limits in terms of equity exposure.
Set forth limits in terms of interest rate duration.
Set forth limits in terms of currency exposure.
Risk mitigation Through asset class and economic sector diversification and, in some cases, the use of derivatives.
Through the use of derivatives.
Changes in the discount rate applied to the Company’s claims liabilities offers a partial offset to the interest-rate risk on invested assets.
Foreign currency exposure in the U.S. debt portfolio is mitigated through the use of foreign-currency forward contracts.
The Operational Investment Committee regularly monitors compliance with the Company’s investment policies. The Compliance
Review and Corporate Governance Committee reviews on a quarterly basis reports on the compliance of the Company regarding its
investment policies. Sensitivity analysis is one risk management technique that assists management in ensuring that risks assumed
remain within the Company’s risk tolerance level. Sensitivity analysis involves varying a single factor to assess the impact that this
would have on the Company’s results and financial condition.
a) Exposure to equity price risk
Sensitivity analysis
The sensitivity analysis reflects the impact of a 10% variation applied to the price of all common shares, net of any equity hedges,
combined with a 5% variation applied to the price of all preferred shares and related embedded derivatives, including the impact of
any impairment, on Net income and OCI. The analysis was prepared using the following assumptions:
− Interest rates and equity prices move independently.
− Credit and liquidity risks have not been considered.
− Impact on the Company’s pension plans is not included.
− Risk reduction measures perform as expected, with no material basis risk and no counterparty defaults.
− AFS equities in an unrealized loss position, as reflected in Accumulated other comprehensive income (“AOCI”) may, at
some point in the future, be realized through a sale.
Table 7.3 – Sensitivity analysis to equity price risk
For the years ended December 31, 2014 2013
Net income OCI Net income OCI
10% increase (12) 168 (16) 152 10% decrease 10 (166) 3 (140)
Decline in the price of AFS perpetual preferred shares is recorded in OCI and would normally lead to a lower valuation for
associated embedded derivative liabilities which are recorded as gains in Net income. Conversely, an increase in the price of these
preferred shares is also recorded in OCI and would normally lead to a higher valuation for associated embedded derivative liabilities
which are recorded as losses in Net income.
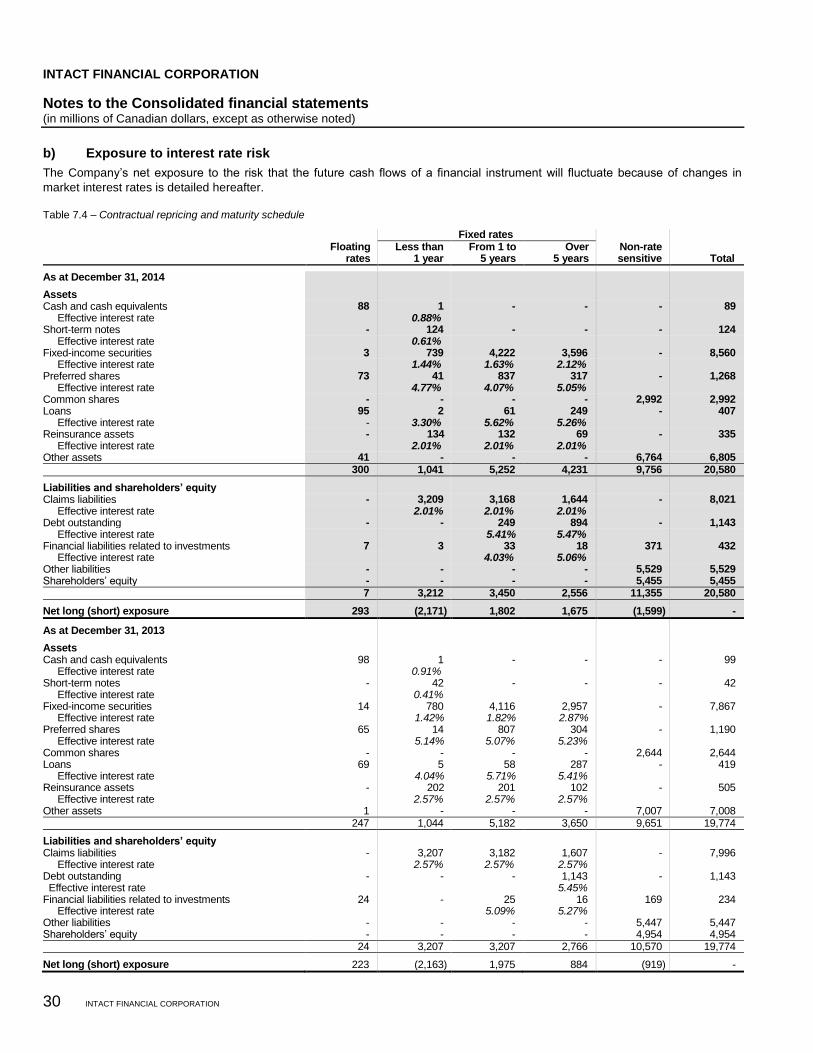
INTACT FINANCIAL CORPORATION
Notes to the Consolidated financial statements (in millions of Canadian dollars, except as otherwise noted)
30 INTACT FINANCIAL CORPORATION
b) Exposure to interest rate risk
The Company’s net exposure to the risk that the future cash flows of a financial instrument will fluctuate because of changes in
market interest rates is detailed hereafter.
Table 7.4 – Contractual repricing and maturity schedule
Fixed rates
Floating
rates Less than
1 year From 1 to
5 years Over
5 years Non-rate sensitive Total
As at December 31, 2014
Assets Cash and cash equivalents 88 1 - - - 89 Effective interest rate 0.88% Short-term notes - 124 - - - 124 Effective interest rate 0.61% Fixed-income securities 3 739 4,222 3,596 - 8,560 Effective interest rate 1.44% 1.63% 2.12% Preferred shares 73 41 837 317 - 1,268 Effective interest rate 4.77% 4.07% 5.05% Common shares - - - - 2,992 2,992 Loans 95 2 61 249 - 407 Effective interest rate - 3.30% 5.62% 5.26% Reinsurance assets - 134 132 69 - 335 Effective interest rate 2.01% 2.01% 2.01% Other assets 41 - - - 6,764 6,805
300 1,041 5,252 4,231 9,756 20,580
Liabilities and shareholders’ equity Claims liabilities - 3,209 3,168 1,644 - 8,021 Effective interest rate 2.01% 2.01% 2.01% Debt outstanding - - 249 894 - 1,143 Effective interest rate 5.41% 5.47% Financial liabilities related to investments 7 3 33 18 371 432 Effective interest rate 4.03% 5.06% Other liabilities - - - - 5,529 5,529 Shareholders’ equity - - - - 5,455 5,455 7 3,212 3,450 2,556 11,355 20,580
Net long (short) exposure 293 (2,171) 1,802 1,675 (1,599) -
As at December 31, 2013
Assets Cash and cash equivalents 98 1 - - - 99 Effective interest rate 0.91% Short-term notes - 42 - - - 42 Effective interest rate 0.41% Fixed-income securities 14 780 4,116 2,957 - 7,867 Effective interest rate 1.42% 1.82% 2.87% Preferred shares 65 14 807 304 - 1,190 Effective interest rate 5.14% 5.07% 5.23% Common shares - - - - 2,644 2,644 Loans 69 5 58 287 - 419 Effective interest rate 4.04% 5.71% 5.41% Reinsurance assets - 202 201 102 - 505 Effective interest rate 2.57% 2.57% 2.57% Other assets 1 - - - 7,007 7,008 247 1,044 5,182 3,650 9,651 19,774
Liabilities and shareholders’ equity Claims liabilities - 3,207 3,182 1,607 - 7,996 Effective interest rate 2.57% 2.57% 2.57% Debt outstanding - - - 1,143 - 1,143 Effective interest rate 5.45% Financial liabilities related to investments 24 - 25 16 169 234 Effective interest rate 5.09% 5.27% Other liabilities - - - - 5,447 5,447 Shareholders’ equity - - - - 4,954 4,954 24 3,207 3,207 2,766 10,570 19,774
Net long (short) exposure 223 (2,163) 1,975 884 (919) -
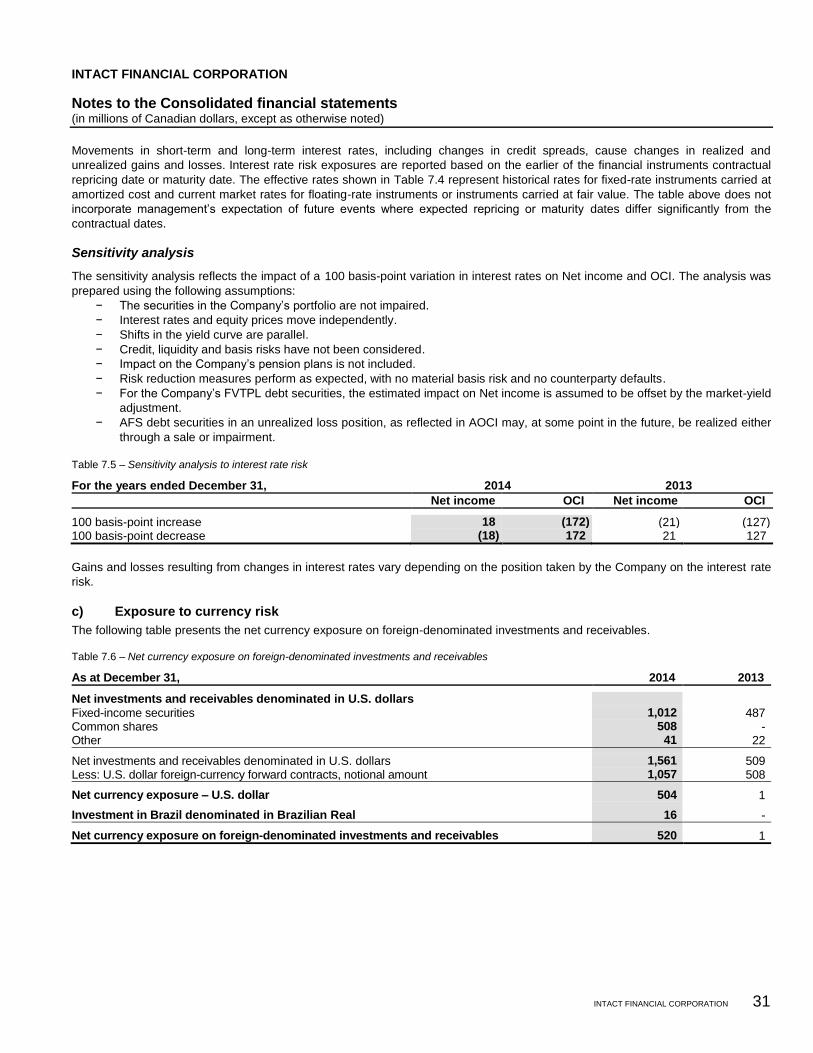
INTACT FINANCIAL CORPORATION
Notes to the Consolidated financial statements (in millions of Canadian dollars, except as otherwise noted)
INTACT FINANCIAL CORPORATION 31
Movements in short-term and long-term interest rates, including changes in credit spreads, cause changes in realized and
unrealized gains and losses. Interest rate risk exposures are reported based on the earlier of the financial instruments contractual
repricing date or maturity date. The effective rates shown in Table 7.4 represent historical rates for fixed-rate instruments carried at
amortized cost and current market rates for floating-rate instruments or instruments carried at fair value. The table above does not
incorporate management’s expectation of future events where expected repricing or maturity dates differ significantly from the
contractual dates.
Sensitivity analysis
The sensitivity analysis reflects the impact of a 100 basis-point variation in interest rates on Net income and OCI. The analysis was
prepared using the following assumptions:
− The securities in the Company’s portfolio are not impaired.
− Interest rates and equity prices move independently.
− Shifts in the yield curve are parallel.
− Credit, liquidity and basis risks have not been considered.
− Impact on the Company’s pension plans is not included.
− Risk reduction measures perform as expected, with no material basis risk and no counterparty defaults.
− For the Company’s FVTPL debt securities, the estimated impact on Net income is assumed to be offset by the market-yield
adjustment.
− AFS debt securities in an unrealized loss position, as reflected in AOCI may, at some point in the future, be realized either
through a sale or impairment.
Table 7.5 – Sensitivity analysis to interest rate risk
For the years ended December 31, 2014 2013
Net income OCI Net income OCI
100 basis-point increase 18 (172) (21) (127) 100 basis-point decrease (18) 172 21 127
Gains and losses resulting from changes in interest rates vary depending on the position taken by the Company on the interest rate
risk.
c) Exposure to currency risk
The following table presents the net currency exposure on foreign-denominated investments and receivables. Table 7.6 – Net currency exposure on foreign-denominated investments and receivables
As at December 31, 2014 2013
Net investments and receivables denominated in U.S. dollars Fixed-income securities 1,012 487 Common shares 508 - Other 41 22
Net investments and receivables denominated in U.S. dollars 1,561 509 Less: U.S. dollar foreign-currency forward contracts, notional amount 1,057 508
Net currency exposure – U.S. dollar 504 1
Investment in Brazil denominated in Brazilian Real 16 -
Net currency exposure on foreign-denominated investments and receivables 520 1
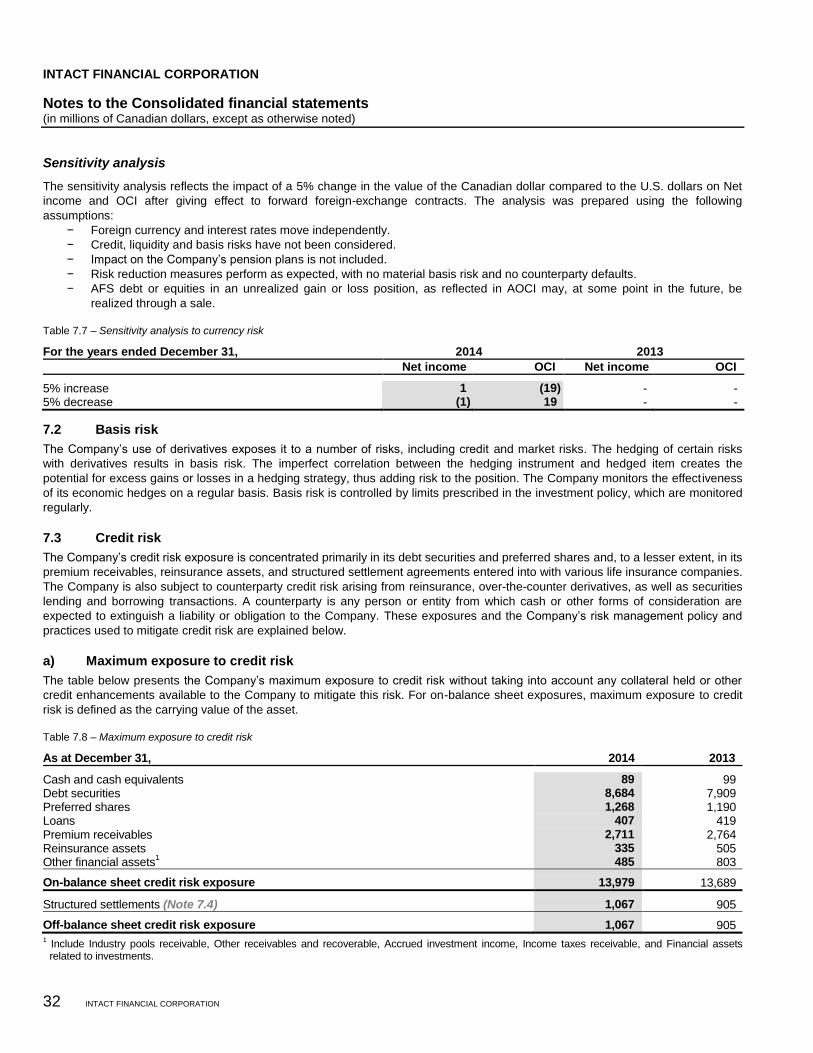
INTACT FINANCIAL CORPORATION
Notes to the Consolidated financial statements (in millions of Canadian dollars, except as otherwise noted)
32 INTACT FINANCIAL CORPORATION
Sensitivity analysis
The sensitivity analysis reflects the impact of a 5% change in the value of the Canadian dollar compared to the U.S. dollars on Net
income and OCI after giving effect to forward foreign-exchange contracts. The analysis was prepared using the following
assumptions:
− Foreign currency and interest rates move independently.
− Credit, liquidity and basis risks have not been considered.
− Impact on the Company’s pension plans is not included.
− Risk reduction measures perform as expected, with no material basis risk and no counterparty defaults.
− AFS debt or equities in an unrealized gain or loss position, as reflected in AOCI may, at some point in the future, be
realized through a sale.
Table 7.7 – Sensitivity analysis to currency risk
For the years ended December 31, 2014 2013
Net income OCI Net income OCI
5% increase 1 (19) - - 5% decrease (1) 19 - -
7.2 Basis risk
The Company’s use of derivatives exposes it to a number of risks, including credit and market risks. The hedging of certain risks
with derivatives results in basis risk. The imperfect correlation between the hedging instrument and hedged item creates the
potential for excess gains or losses in a hedging strategy, thus adding risk to the position. The Company monitors the effectiveness
of its economic hedges on a regular basis. Basis risk is controlled by limits prescribed in the investment policy, which are monitored
regularly.
7.3 Credit risk
The Company’s credit risk exposure is concentrated primarily in its debt securities and preferred shares and, to a lesser extent, in its
premium receivables, reinsurance assets, and structured settlement agreements entered into with various life insurance companies.
The Company is also subject to counterparty credit risk arising from reinsurance, over-the-counter derivatives, as well as securities
lending and borrowing transactions. A counterparty is any person or entity from which cash or other forms of consideration are
expected to extinguish a liability or obligation to the Company. These exposures and the Company’s risk management policy and
practices used to mitigate credit risk are explained below.
a) Maximum exposure to credit risk
The table below presents the Company’s maximum exposure to credit risk without taking into account any collateral held or other
credit enhancements available to the Company to mitigate this risk. For on-balance sheet exposures, maximum exposure to credit
risk is defined as the carrying value of the asset.
Table 7.8 – Maximum exposure to credit risk
As at December 31, 2014 2013
Cash and cash equivalents 89 99 Debt securities 8,684 7,909 Preferred shares 1,268 1,190 Loans 407 419 Premium receivables 2,711 2,764 Reinsurance assets 335 505 Other financial assets
1 485 803
On-balance sheet credit risk exposure 13,979 13,689
Structured settlements (Note 7.4) 1,067 905
Off-balance sheet credit risk exposure 1,067 905 1 Include Industry pools receivable, Other receivables and recoverable, Accrued investment income, Income taxes receivable, and Financial assets related to investments.
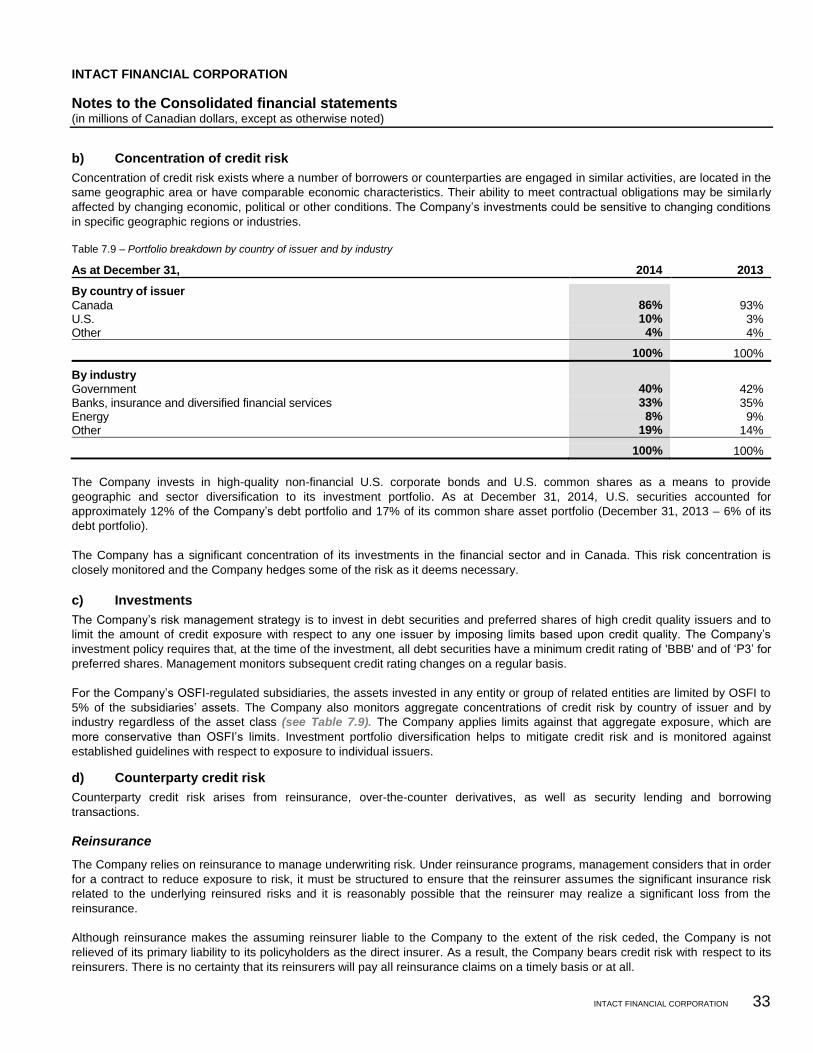
INTACT FINANCIAL CORPORATION
Notes to the Consolidated financial statements (in millions of Canadian dollars, except as otherwise noted)
INTACT FINANCIAL CORPORATION 33
b) Concentration of credit risk
Concentration of credit risk exists where a number of borrowers or counterparties are engaged in similar activities, are located in the
same geographic area or have comparable economic characteristics. Their ability to meet contractual obligations may be similarly
affected by changing economic, political or other conditions. The Company’s investments could be sensitive to changing conditions
in specific geographic regions or industries.
Table 7.9 – Portfolio breakdown by country of issuer and by industry
As at December 31, 2014 2013
By country of issuer Canada 86% 93% U.S. 10% 3% Other 4% 4%
100% 100%
By industry Government 40% 42% Banks, insurance and diversified financial services 33% 35% Energy 8% 9% Other 19% 14%
100% 100%
The Company invests in high-quality non-financial U.S. corporate bonds and U.S. common shares as a means to provide
geographic and sector diversification to its investment portfolio. As at December 31, 2014, U.S. securities accounted for
approximately 12% of the Company’s debt portfolio and 17% of its common share asset portfolio (December 31, 2013 – 6% of its
debt portfolio).
The Company has a significant concentration of its investments in the financial sector and in Canada. This risk concentration is
closely monitored and the Company hedges some of the risk as it deems necessary.
c) Investments
The Company’s risk management strategy is to invest in debt securities and preferred shares of high credit quality issuers and to
limit the amount of credit exposure with respect to any one issuer by imposing limits based upon credit quality. The Company’s
investment policy requires that, at the time of the investment, all debt securities have a minimum credit rating of 'BBB' and of ‘P3’ for
preferred shares. Management monitors subsequent credit rating changes on a regular basis.
For the Company’s OSFI-regulated subsidiaries, the assets invested in any entity or group of related entities are limited by OSFI to
5% of the subsidiaries’ assets. The Company also monitors aggregate concentrations of credit risk by country of issuer and by
industry regardless of the asset class (see Table 7.9). The Company applies limits against that aggregate exposure, which are
more conservative than OSFI’s limits. Investment portfolio diversification helps to mitigate credit risk and is monitored against
established guidelines with respect to exposure to individual issuers.
d) Counterparty credit risk
Counterparty credit risk arises from reinsurance, over-the-counter derivatives, as well as security lending and borrowing
transactions.
Reinsurance
The Company relies on reinsurance to manage underwriting risk. Under reinsurance programs, management considers that in order
for a contract to reduce exposure to risk, it must be structured to ensure that the reinsurer assumes the significant insurance risk
related to the underlying reinsured risks and it is reasonably possible that the reinsurer may realize a significant loss from the
reinsurance.
Although reinsurance makes the assuming reinsurer liable to the Company to the extent of the risk ceded, the Company is not
relieved of its primary liability to its policyholders as the direct insurer. As a result, the Company bears credit risk with respect to its
reinsurers. There is no certainty that its reinsurers will pay all reinsurance claims on a timely basis or at all.
INTACT FINANCIAL CORPORATION
Notes to the Consolidated financial statements (in millions of Canadian dollars, except as otherwise noted)
34 INTACT FINANCIAL CORPORATION
The Company may also be subject to credit risk on potential future recoverables arising from catastrophes that could be subject to a
non-payment (default). The Company’s placement of reinsurance is diversified such that it is not dependent on a single reinsurer
and the Company’s operations are not substantially dependent upon any single reinsurance contract.
The Company assesses the financial soundness of the reinsurers before signing any reinsurance treaties and monitors their
situation on a regular basis. The Company also has minimum rating requirements for its reinsurers. Substantially all reinsurers are
required to have a minimum credit rating of 'A-' at inception of the contract. The Company also requires that its contracts include a
special termination and security review clause allowing the Company to replace a reinsurer during the contract period should the
reinsurer’s credit rating fall below the level acceptable to the Company or for other reasons that might jeopardize the Company’s
ability to continue doing business with such reinsurer as intended at the time of entering into the reinsurance arrangement.
The Company has collateral in place to support amounts receivable and recoverable from unregistered reinsurers. The Company is
the assigned beneficiary of collateral consisting of cash, security agreements and letters of credit totalling $166 million as at
December 31, 2014 (December 31, 2013 – $238 million) as guarantees from unregistered reinsurers. This collateral is held in
support of policy liabilities of $91 million as at December 31, 2014 (December 31, 2013 – $149 million) and could be used should
these reinsurers be unable to meet their obligations.
Management concluded that the Company was not exposed to significant loss from reinsurers for potentially uncollectible
reinsurance as at the year-end date.
Over-the-counter derivatives, as well as security lending and borrowing transactions
Credit risk from over-the-counter derivative transactions reflects the potential for the counterparty to default on its contractual
obligations when one or more transactions have a positive market value to the Company. Therefore, derivative-related credit risk is
represented by the positive fair value of an over-the-counter instrument and is normally a small fraction of the contract’s notional
amount. In addition, the Company may be subject to wrong-way risk arising from certain derivative transactions. Wrong-way risk
occurs when exposure to a counterparty is adversely correlated with the credit quality of that counterparty.
Credit risk from security lending and borrowing transactions arises when the counterparty is allowed to re-hypothecate or re-pledge
the collateral externally. Credit risk from security borrowing is the potential for the counterparty to default when the value of the
collateral posted is higher than the value of the security borrowed.
The Company subjects its derivative-related, as well as security lending and borrowing credit risk to the same credit approval, limit
and monitoring standards that it uses for managing other transactions that create credit exposure. This includes evaluating the
creditworthiness of counterparties, and managing the size, diversification and maturity structure of the portfolio. Credit utilization for
all products is compared with established limits on a continual basis and is subject to a monthly review by the Operational
Investment Committee. The Company has adopted a policy whereby, upon signing the derivative contract, the counterparty is
required to have a minimum credit rating of ‘A-’ and an issuer credit spread below established thresholds.
The Company uses netting clauses in master derivative agreements to reduce derivative-related credit exposure. Netting clauses in
master derivative agreements provide for a single net settlement of all financial instruments covered by the agreement in the event
of default. However, credit risk is reduced only to the extent that the Company’s financial obligations toward the counterparty to such
an agreement can be set off against obligations such counterparty has toward the Company. The overall exposure to credit risk that
is reduced through the netting clauses may change substantially following the reporting date as the exposure is affected by each
transaction subject to the agreement as well as by changes in underlying market rates and values.
The Company’s rigorous collateral management process is another significant credit mitigation tool used to manage counterparty
credit risk arising from over-the-counter derivative and security lending and borrowing transactions. Most of the Company’s legal
agreements allow for daily collateral movement. Consequently, the Company regularly validates that the collateral that it pledges is
not too high and that mark-to-market provisions for derivatives are sufficient. Mark-to-market provisions provide the Company with
the right to request that the counterparty pay down or collateralize the current market value of its derivative positions when the value
exceed a specified threshold amount.
The credit risk exposure was $123 million as at December 31, 2014 (December 31, 2013 – $96 million) and is the sum of the
replacement cost plus an add-on amount for potential future credit exposure. The risk-weighted amount represents the credit risk
equivalent, weighted according to the creditworthiness of the counterparty, as prescribed by OSFI.
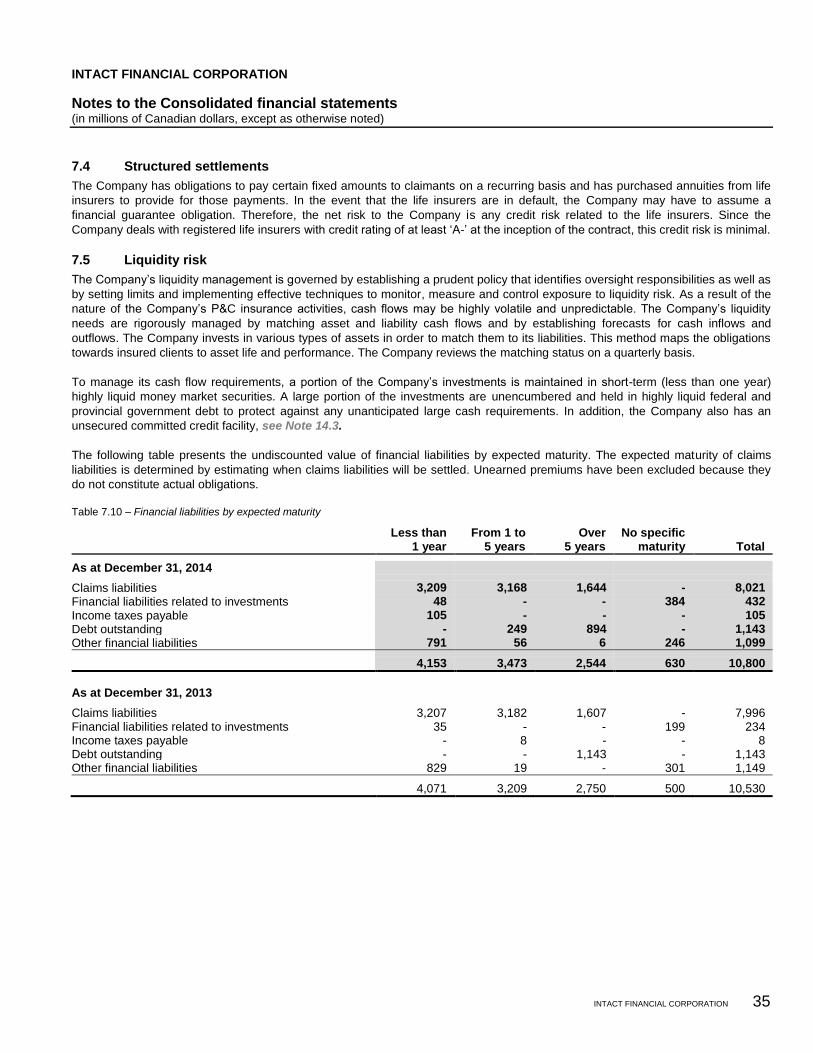
INTACT FINANCIAL CORPORATION
Notes to the Consolidated financial statements (in millions of Canadian dollars, except as otherwise noted)
INTACT FINANCIAL CORPORATION 35
7.4 Structured settlements
The Company has obligations to pay certain fixed amounts to claimants on a recurring basis and has purchased annuities from life
insurers to provide for those payments. In the event that the life insurers are in default, the Company may have to assume a
financial guarantee obligation. Therefore, the net risk to the Company is any credit risk related to the life insurers. Since the
Company deals with registered life insurers with credit rating of at least ‘A-’ at the inception of the contract, this credit risk is minimal.
7.5 Liquidity risk
The Company’s liquidity management is governed by establishing a prudent policy that identifies oversight responsibilities as well as
by setting limits and implementing effective techniques to monitor, measure and control exposure to liquidity risk. As a result of the
nature of the Company’s P&C insurance activities, cash flows may be highly volatile and unpredictable. The Company’s liquidity
needs are rigorously managed by matching asset and liability cash flows and by establishing forecasts for cash inflows and
outflows. The Company invests in various types of assets in order to match them to its liabilities. This method maps the obligations
towards insured clients to asset life and performance. The Company reviews the matching status on a quarterly basis.
To manage its cash flow requirements, a portion of the Company’s investments is maintained in short-term (less than one year)
highly liquid money market securities. A large portion of the investments are unencumbered and held in highly liquid federal and
provincial government debt to protect against any unanticipated large cash requirements. In addition, the Company also has an
unsecured committed credit facility, see Note 14.3.
The following table presents the undiscounted value of financial liabilities by expected maturity. The expected maturity of claims
liabilities is determined by estimating when claims liabilities will be settled. Unearned premiums have been excluded because they
do not constitute actual obligations.
Table 7.10 – Financial liabilities by expected maturity
Less than 1 year
From 1 to 5 years
Over 5 years
No specific maturity Total
As at December 31, 2014
Claims liabilities 3,209 3,168 1,644 - 8,021
Financial liabilities related to investments 48 - - 384 432
Income taxes payable 105 - - - 105
Debt outstanding - 249 894 - 1,143
Other financial liabilities 791 56 6 246 1,099
4,153 3,473 2,544 630 10,800
As at December 31, 2013
Claims liabilities 3,207 3,182 1,607 - 7,996 Financial liabilities related to investments 35 - - 199 234 Income taxes payable - 8 - - 8 Debt outstanding - - 1,143 - 1,143 Other financial liabilities 829 19 - 301 1,149
4,071 3,209 2,750 500 10,530
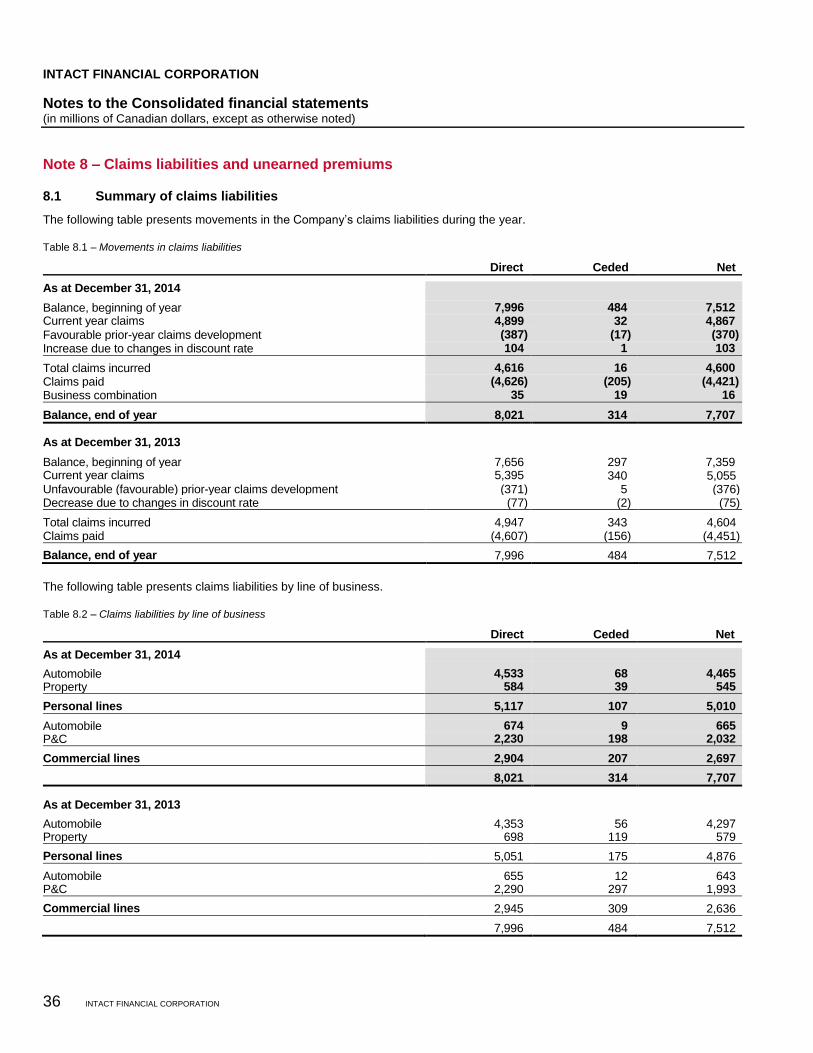
INTACT FINANCIAL CORPORATION
Notes to the Consolidated financial statements (in millions of Canadian dollars, except as otherwise noted)
36 INTACT FINANCIAL CORPORATION
Note 8 – Claims liabilities and unearned premiums
8.1 Summary of claims liabilities
The following table presents movements in the Company’s claims liabilities during the year.
Table 8.1 – Movements in claims liabilities
Direct Ceded Net
As at December 31, 2014
Balance, beginning of year 7,996 484 7,512 Current year claims 4,899 32 4,867 Favourable prior-year claims development (387) (17) (370) Increase due to changes in discount rate 104 1 103
Total claims incurred 4,616 16 4,600 Claims paid (4,626) (205) (4,421) Business combination 35 19 16
Balance, end of year 8,021 314 7,707
As at December 31, 2013
Balance, beginning of year 7,656 297 7,359 Current year claims 5,395
340 5,055
Unfavourable (favourable) prior-year claims development (371) 5 (376) Decrease due to changes in discount rate (77) (2) (75)
Total claims incurred 4,947 343 4,604 Claims paid (4,607) (156) (4,451)
Balance, end of year 7,996 484 7,512
The following table presents claims liabilities by line of business.
Table 8.2 – Claims liabilities by line of business
Direct Ceded Net
As at December 31, 2014
Automobile 4,533 68 4,465 Property 584 39 545
Personal lines 5,117 107 5,010
Automobile 674 9 665 P&C 2,230 198 2,032
Commercial lines 2,904 207 2,697
8,021 314 7,707
As at December 31, 2013
Automobile 4,353 56 4,297 Property 698 119 579
Personal lines 5,051 175 4,876
Automobile 655 12 643 P&C 2,290 297 1,993
Commercial lines 2,945 309 2,636
7,996 484 7,512
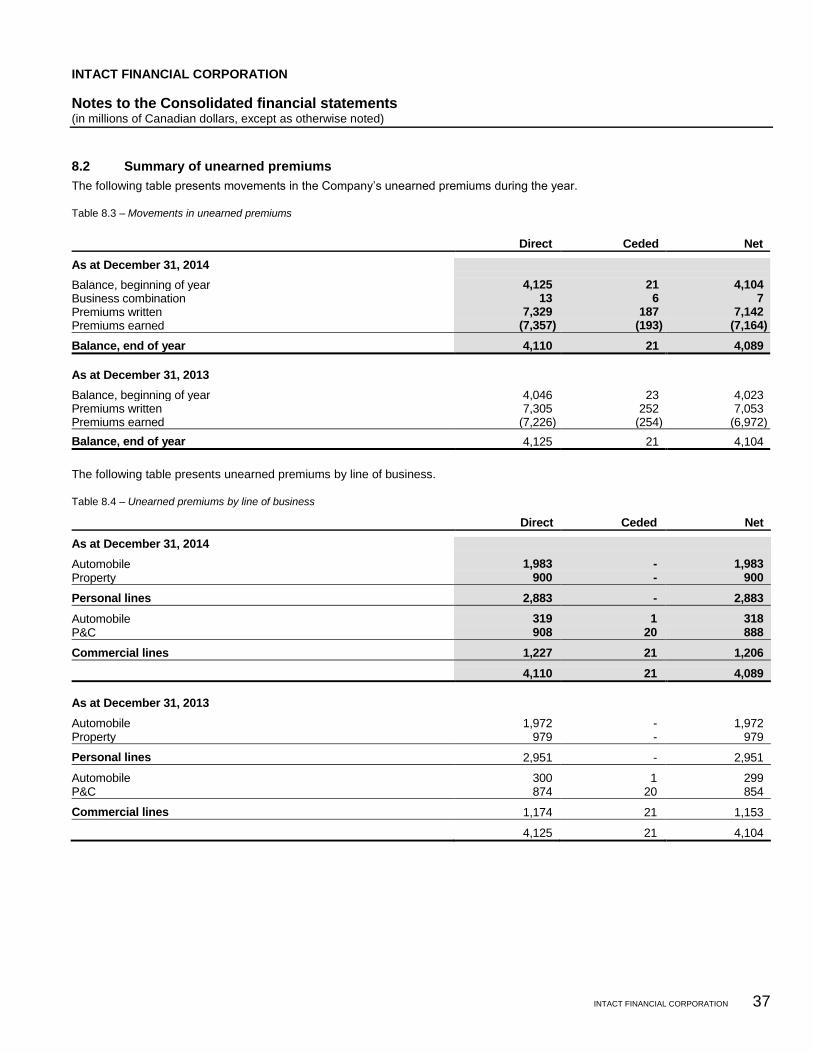
INTACT FINANCIAL CORPORATION
Notes to the Consolidated financial statements (in millions of Canadian dollars, except as otherwise noted)
INTACT FINANCIAL CORPORATION 37
8.2 Summary of unearned premiums
The following table presents movements in the Company’s unearned premiums during the year.
Table 8.3 – Movements in unearned premiums
Direct Ceded Net
As at December 31, 2014
Balance, beginning of year 4,125 21 4,104 Business combination 13 6 7 Premiums written 7,329 187 7,142 Premiums earned (7,357) (193) (7,164)
Balance, end of year 4,110 21 4,089
As at December 31, 2013
Balance, beginning of year 4,046 23 4,023 Premiums written 7,305 252 7,053 Premiums earned (7,226) (254) (6,972)
Balance, end of year 4,125 21 4,104
The following table presents unearned premiums by line of business.
Table 8.4 – Unearned premiums by line of business
Direct Ceded Net
As at December 31, 2014
Automobile 1,983 - 1,983
Property 900 - 900
Personal lines 2,883 - 2,883
Automobile 319 1 318
P&C 908 20 888
Commercial lines 1,227 21 1,206
4,110 21 4,089
As at December 31, 2013
Automobile 1,972 - 1,972 Property 979 - 979
Personal lines 2,951 - 2,951
Automobile 300 1 299 P&C 874 20 854
Commercial lines 1,174 21 1,153
4,125 21 4,104
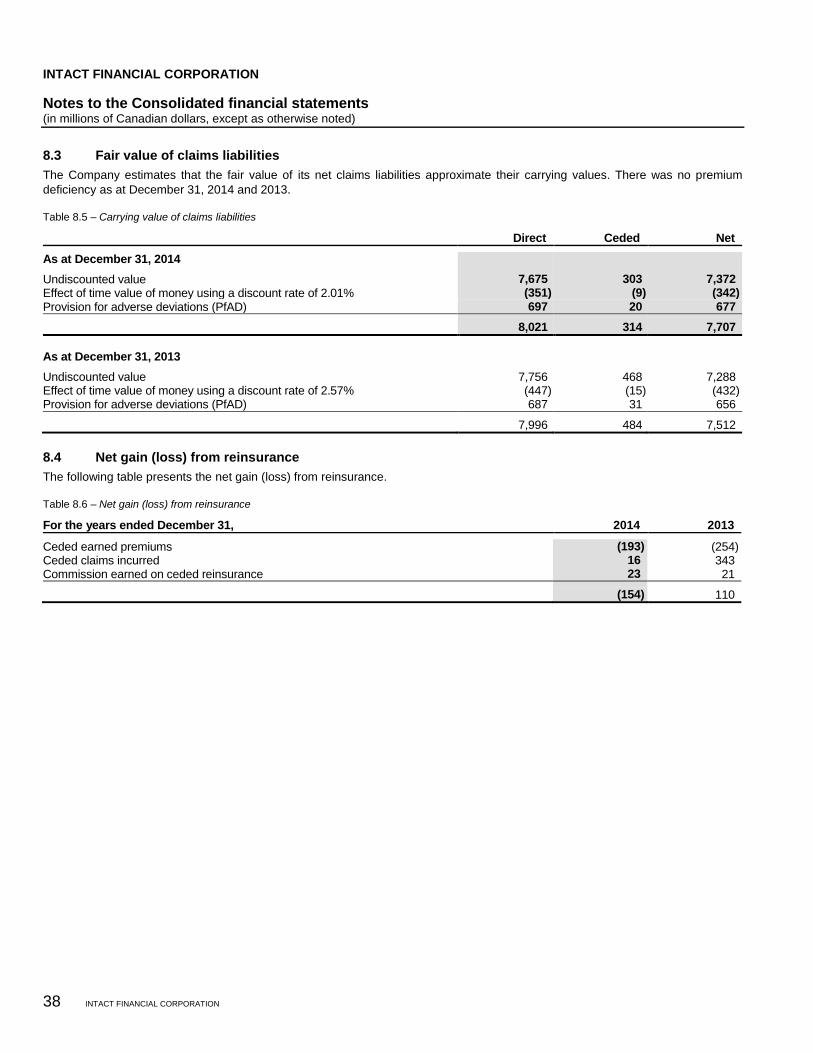
INTACT FINANCIAL CORPORATION
Notes to the Consolidated financial statements (in millions of Canadian dollars, except as otherwise noted)
38 INTACT FINANCIAL CORPORATION
8.3 Fair value of claims liabilities
The Company estimates that the fair value of its net claims liabilities approximate their carrying values. There was no premium
deficiency as at December 31, 2014 and 2013.
Table 8.5 – Carrying value of claims liabilities
Direct Ceded Net
As at December 31, 2014
Undiscounted value 7,675 303 7,372
Effect of time value of money using a discount rate of 2.01% (351) (9) (342)
Provision for adverse deviations (PfAD) 697 20 677
8,021 314 7,707
As at December 31, 2013
Undiscounted value 7,756 468 7,288 Effect of time value of money using a discount rate of 2.57% (447) (15) (432) Provision for adverse deviations (PfAD) 687 31 656
7,996 484 7,512
8.4 Net gain (loss) from reinsurance
The following table presents the net gain (loss) from reinsurance.
Table 8.6 – Net gain (loss) from reinsurance
For the years ended December 31, 2014 2013
Ceded earned premiums (193) (254) Ceded claims incurred 16 343 Commission earned on ceded reinsurance 23 21
(154) 110
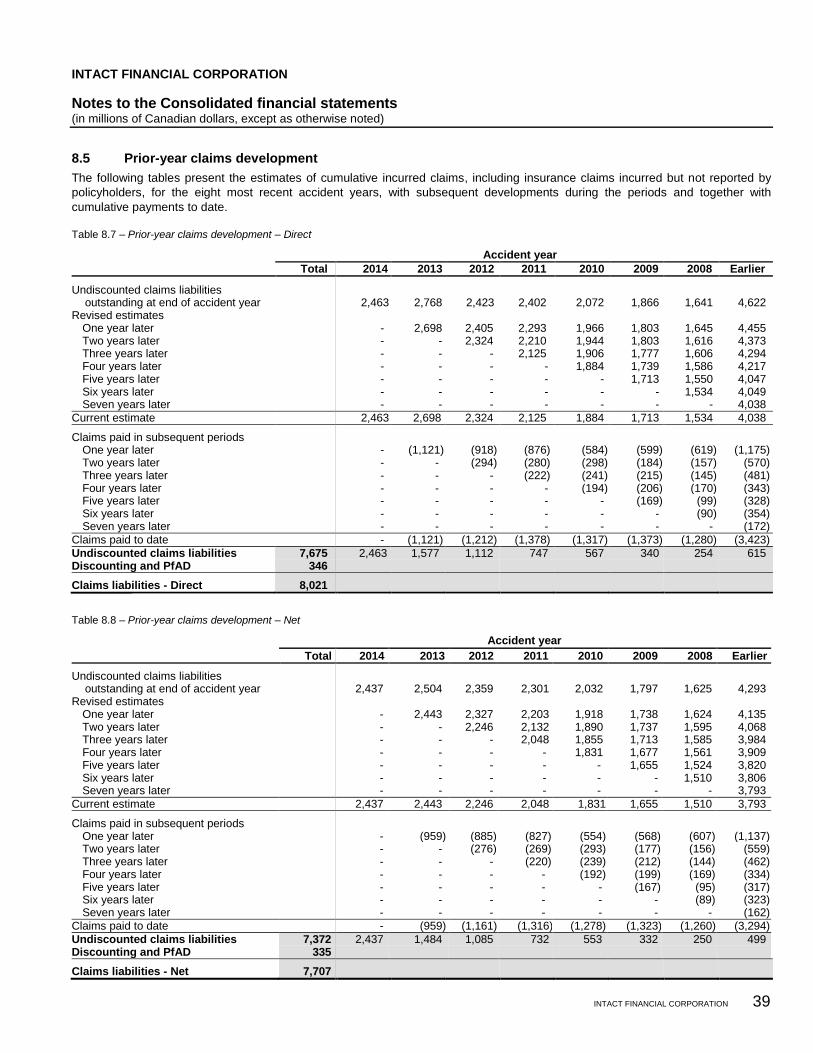
INTACT FINANCIAL CORPORATION
Notes to the Consolidated financial statements (in millions of Canadian dollars, except as otherwise noted)
INTACT FINANCIAL CORPORATION 39
8.5 Prior-year claims development
The following tables present the estimates of cumulative incurred claims, including insurance claims incurred but not reported by
policyholders, for the eight most recent accident years, with subsequent developments during the periods and together with
cumulative payments to date.
Table 8.7 – Prior-year claims development – Direct
Accident year
Total 2014 2013 2012 2011 2010 2009 2008 Earlier
Undiscounted claims liabilities outstanding at end of accident year 2,463 2,768 2,423 2,402 2,072 1,866 1,641 4,622
Revised estimates One year later - 2,698 2,405 2,293 1,966 1,803 1,645 4,455 Two years later - - 2,324 2,210 1,944 1,803 1,616 4,373 Three years later - - - 2,125 1,906 1,777 1,606 4,294 Four years later - - - - 1,884 1,739 1,586 4,217 Five years later - - - - - 1,713 1,550 4,047 Six years later - - - - - - 1,534 4,049 Seven years later - - - - - - - 4,038
Current estimate 2,463 2,698 2,324 2,125 1,884 1,713 1,534 4,038
Claims paid in subsequent periods One year later - (1,121) (918) (876) (584) (599) (619) (1,175) Two years later - - (294) (280) (298) (184) (157) (570) Three years later - - - (222) (241) (215) (145) (481) Four years later - - - - (194) (206) (170) (343) Five years later - - - - - (169) (99) (328) Six years later - - - - - - (90) (354) Seven years later - - - - - - - (172)
Claims paid to date - (1,121) (1,212) (1,378) (1,317) (1,373) (1,280) (3,423)
Undiscounted claims liabilities 7,675 2,463 1,577 1,112 747 567 340 254 615 Discounting and PfAD 346
Claims liabilities - Direct 8,021
Table 8.8 – Prior-year claims development – Net
Accident year
Total 2014 2013 2012 2011 2010 2009 2008 Earlier
Undiscounted claims liabilities outstanding at end of accident year 2,437 2,504 2,359 2,301 2,032 1,797 1,625 4,293
Revised estimates One year later - 2,443 2,327 2,203 1,918 1,738 1,624 4,135 Two years later - - 2,246 2,132 1,890 1,737 1,595 4,068 Three years later - - - 2,048 1,855 1,713 1,585 3,984 Four years later - - - - 1,831 1,677 1,561 3,909 Five years later - - - - - 1,655 1,524 3,820 Six years later - - - - - - 1,510 3,806 Seven years later - - - - - - - 3,793
Current estimate 2,437 2,443 2,246 2,048 1,831 1,655 1,510 3,793
Claims paid in subsequent periods One year later - (959) (885) (827) (554) (568) (607) (1,137) Two years later - - (276) (269) (293) (177) (156) (559) Three years later - - - (220) (239) (212) (144) (462) Four years later - - - - (192) (199) (169) (334) Five years later - - - - - (167) (95) (317) Six years later - - - - - - (89) (323) Seven years later - - - - - - - (162)
Claims paid to date - (959) (1,161) (1,316) (1,278) (1,323) (1,260) (3,294)
Undiscounted claims liabilities 7,372 2,437 1,484 1,085 732 553 332 250 499 Discounting and PfAD 335
Claims liabilities - Net 7,707
INTACT FINANCIAL CORPORATION
Notes to the Consolidated financial statements (in millions of Canadian dollars, except as otherwise noted)
40 INTACT FINANCIAL CORPORATION
The Company applied the transitional rules of IFRS 4 - Insurance contracts that permit only five years of information to be disclosed
upon adoption of IFRS in 2011. The claims development information disclosed in the preceding table is being increased from five
years to ten years over the period 2012 – 2016.
The original reserve estimates are evaluated quarterly for redundancy or deficiency. The evaluation is based on actual payments in
full or partial settlement of claims and current estimates of claims liabilities for claims still open or claims still unreported.
Note 9 – Insurance risk
The Company principally underwrites automobile, home, as well as commercial P&C contracts to individuals and businesses. The
majority of the insurance risk to which the Company is exposed is of a short-tail nature. Policies generally cover a 12-month period.
The average duration of claims liabilities is approximately 2.4 years as at December 31, 2014 and 2013.
Insurance contract risk is the risk that a loss arises from the following reasons:
− underwriting and pricing (Note 9.1);
− fluctuation in the timing, frequency and severity of claims relative to expectations (Note 9.2);
− inadequate reinsurance protection (Note 7.3); and
− large unexpected losses arising from a single event such as a catastrophe (Note 9.3).
Insured events can occur at any time during the coverage period and can generate losses of variable amounts. An objective of the
Company is to ensure that sufficient claims liabilities are established to cover future insurance claim payments related to past
insured events. The Company’s success depends upon its ability to accurately assess the risk associated with the insurance
contracts underwritten by the Company. The Company establishes claims liabilities to cover the estimated liability for the payment of
all losses, including loss adjustment expenses incurred with respect to insurance contracts underwritten by the Company. Claims
liabilities do not represent an exact calculation of the liability. Rather, claims liabilities are the Company’s best estimates of its
expected ultimate cost of resolution and administration of claims. Expected inflation is taken into account when estimating claims
liabilities, thereby mitigating inflation risk.
The composition of the Company’s insurance risk, as well as the methods employed to mitigate risks, are described hereafter.
9.1 Underwriting and pricing risks
The insurance business is cyclical in nature whereby the industry generally reduces insurance rates following periods of increased profitability, while it generally increases rates following periods of sustained loss. The Company’s profitability tends to follow this cyclical market pattern and can also be affected by demand and competition. In addition, the Company is at risk from changes in automobile insurance legislation, the economic environment and climate patterns.
In order to properly monitor the Company’s risk appetite, pricing targets are set by the Insurance Risk Department and distributed to
each region. Pricing targets are established using an internal return on equity model and a risk-based capital model.
Risks associated with commercial P&C and personal property insurance contracts may vary in relation to the geographical area of
the risk insured by the Company. The Company’s exposure to concentration of insurance risk, in terms of type of risk and level of
insured benefits, is mitigated by careful selection and implementation of underwriting strategies, which is in turn largely achieved
through diversification across industry sectors and geographical areas. For automobile insurance, legislation is in place at a
provincial level and this creates differences in the benefits provided among the provinces.
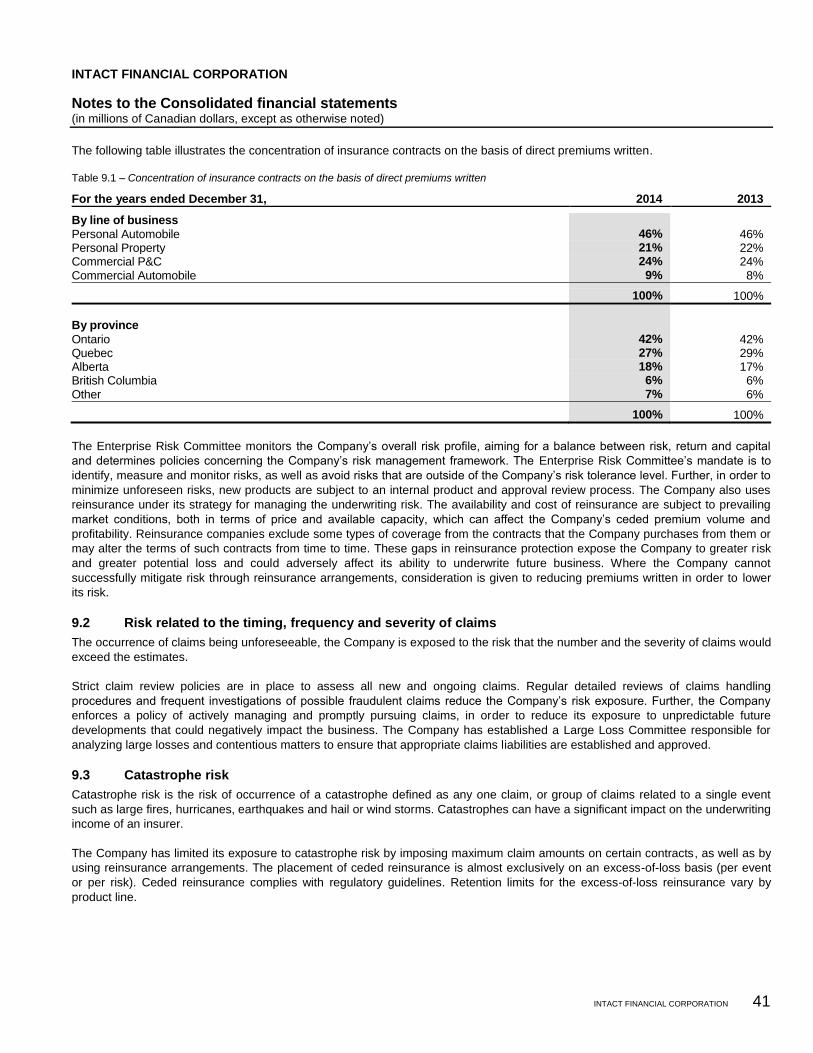
INTACT FINANCIAL CORPORATION
Notes to the Consolidated financial statements (in millions of Canadian dollars, except as otherwise noted)
INTACT FINANCIAL CORPORATION 41
The following table illustrates the concentration of insurance contracts on the basis of direct premiums written.
Table 9.1 – Concentration of insurance contracts on the basis of direct premiums written
For the years ended December 31, 2014 2013
By line of business Personal Automobile 46% 46% Personal Property 21% 22% Commercial P&C 24% 24% Commercial Automobile 9% 8%
100% 100%
By province Ontario 42% 42% Quebec 27% 29% Alberta 18% 17% British Columbia 6% 6% Other 7% 6%
100% 100%
The Enterprise Risk Committee monitors the Company’s overall risk profile, aiming for a balance between risk, return and capital
and determines policies concerning the Company’s risk management framework. The Enterprise Risk Committee’s mandate is to
identify, measure and monitor risks, as well as avoid risks that are outside of the Company’s risk tolerance level. Further, in order to
minimize unforeseen risks, new products are subject to an internal product and approval review process. The Company also uses
reinsurance under its strategy for managing the underwriting risk. The availability and cost of reinsurance are subject to prevailing
market conditions, both in terms of price and available capacity, which can affect the Company’s ceded premium volume and
profitability. Reinsurance companies exclude some types of coverage from the contracts that the Company purchases from them or
may alter the terms of such contracts from time to time. These gaps in reinsurance protection expose the Company to greater risk
and greater potential loss and could adversely affect its ability to underwrite future business. Where the Company cannot
successfully mitigate risk through reinsurance arrangements, consideration is given to reducing premiums written in order to lower
its risk.
9.2 Risk related to the timing, frequency and severity of claims
The occurrence of claims being unforeseeable, the Company is exposed to the risk that the number and the severity of claims would
exceed the estimates.
Strict claim review policies are in place to assess all new and ongoing claims. Regular detailed reviews of claims handling
procedures and frequent investigations of possible fraudulent claims reduce the Company’s risk exposure. Further, the Company
enforces a policy of actively managing and promptly pursuing claims, in order to reduce its exposure to unpredictable future
developments that could negatively impact the business. The Company has established a Large Loss Committee responsible for
analyzing large losses and contentious matters to ensure that appropriate claims liabilities are established and approved.
9.3 Catastrophe risk
Catastrophe risk is the risk of occurrence of a catastrophe defined as any one claim, or group of claims related to a single event
such as large fires, hurricanes, earthquakes and hail or wind storms. Catastrophes can have a significant impact on the underwriting
income of an insurer.
The Company has limited its exposure to catastrophe risk by imposing maximum claim amounts on certain contracts, as well as by
using reinsurance arrangements. The placement of ceded reinsurance is almost exclusively on an excess-of-loss basis (per event
or per risk). Ceded reinsurance complies with regulatory guidelines. Retention limits for the excess-of-loss reinsurance vary by
product line.
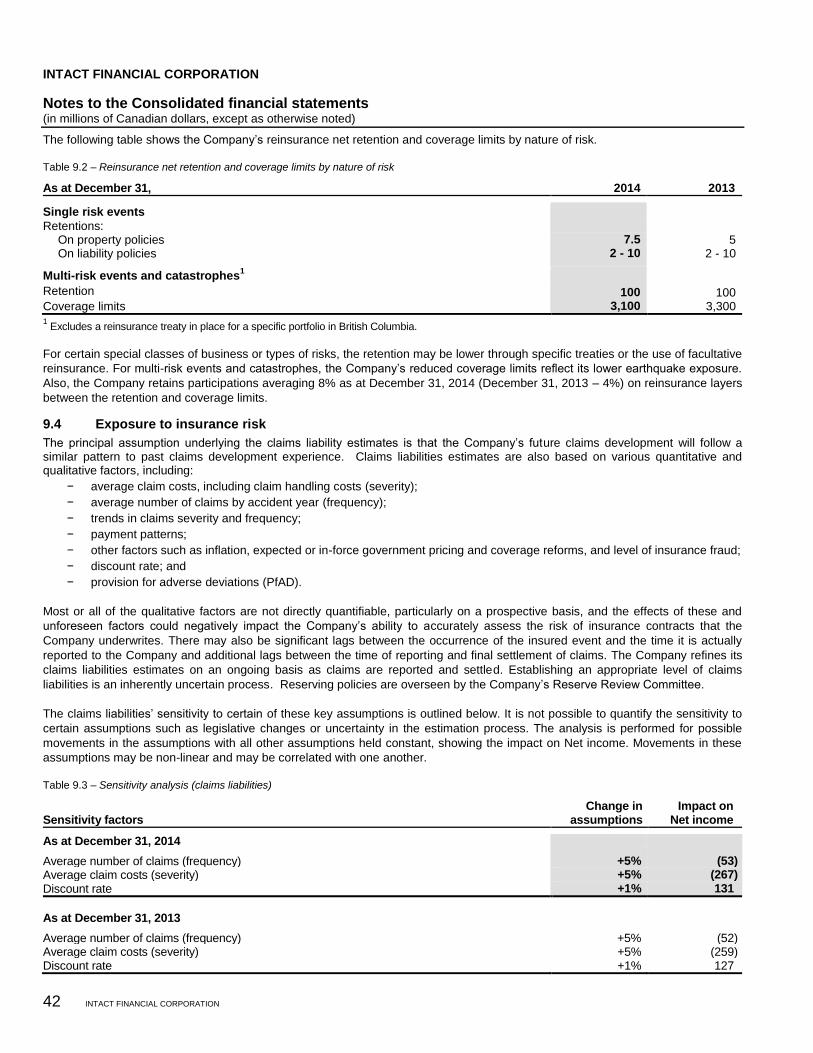
INTACT FINANCIAL CORPORATION
Notes to the Consolidated financial statements (in millions of Canadian dollars, except as otherwise noted)
42 INTACT FINANCIAL CORPORATION
The following table shows the Company’s reinsurance net retention and coverage limits by nature of risk.
Table 9.2 – Reinsurance net retention and coverage limits by nature of risk
As at December 31, 2014 2013
Single risk events Retentions: On property policies 7.5 5 On liability policies 2 - 10 2 - 10
Multi-risk events and catastrophes1
Retention 100
100
Coverage limits 3,100 3,300 1 Excludes a reinsurance treaty in place for a specific portfolio in British Columbia.
For certain special classes of business or types of risks, the retention may be lower through specific treaties or the use of facultative
reinsurance. For multi-risk events and catastrophes, the Company’s reduced coverage limits reflect its lower earthquake exposure.
Also, the Company retains participations averaging 8% as at December 31, 2014 (December 31, 2013 – 4%) on reinsurance layers
between the retention and coverage limits.
9.4 Exposure to insurance risk
The principal assumption underlying the claims liability estimates is that the Company’s future claims development will follow a similar pattern to past claims development experience. Claims liabilities estimates are also based on various quantitative and qualitative factors, including:
− average claim costs, including claim handling costs (severity);
− average number of claims by accident year (frequency);
− trends in claims severity and frequency;
− payment patterns;
− other factors such as inflation, expected or in-force government pricing and coverage reforms, and level of insurance fraud;
− discount rate; and
− provision for adverse deviations (PfAD).
Most or all of the qualitative factors are not directly quantifiable, particularly on a prospective basis, and the effects of these and
unforeseen factors could negatively impact the Company’s ability to accurately assess the risk of insurance contracts that the
Company underwrites. There may also be significant lags between the occurrence of the insured event and the time it is actually
reported to the Company and additional lags between the time of reporting and final settlement of claims. The Company refines its
claims liabilities estimates on an ongoing basis as claims are reported and settled. Establishing an appropriate level of claims
liabilities is an inherently uncertain process. Reserving policies are overseen by the Company’s Reserve Review Committee.
The claims liabilities’ sensitivity to certain of these key assumptions is outlined below. It is not possible to quantify the sensitivity to
certain assumptions such as legislative changes or uncertainty in the estimation process. The analysis is performed for possible
movements in the assumptions with all other assumptions held constant, showing the impact on Net income. Movements in these
assumptions may be non-linear and may be correlated with one another.
Table 9.3 – Sensitivity analysis (claims liabilities)
Sensitivity factors Change in
assumptions Impact on
Net income
As at December 31, 2014
Average number of claims (frequency) +5% (53)
Average claim costs (severity) +5% (267)
Discount rate +1% 131
As at December 31, 2013
Average number of claims (frequency) +5% (52) Average claim costs (severity) +5% (259) Discount rate +1% 127
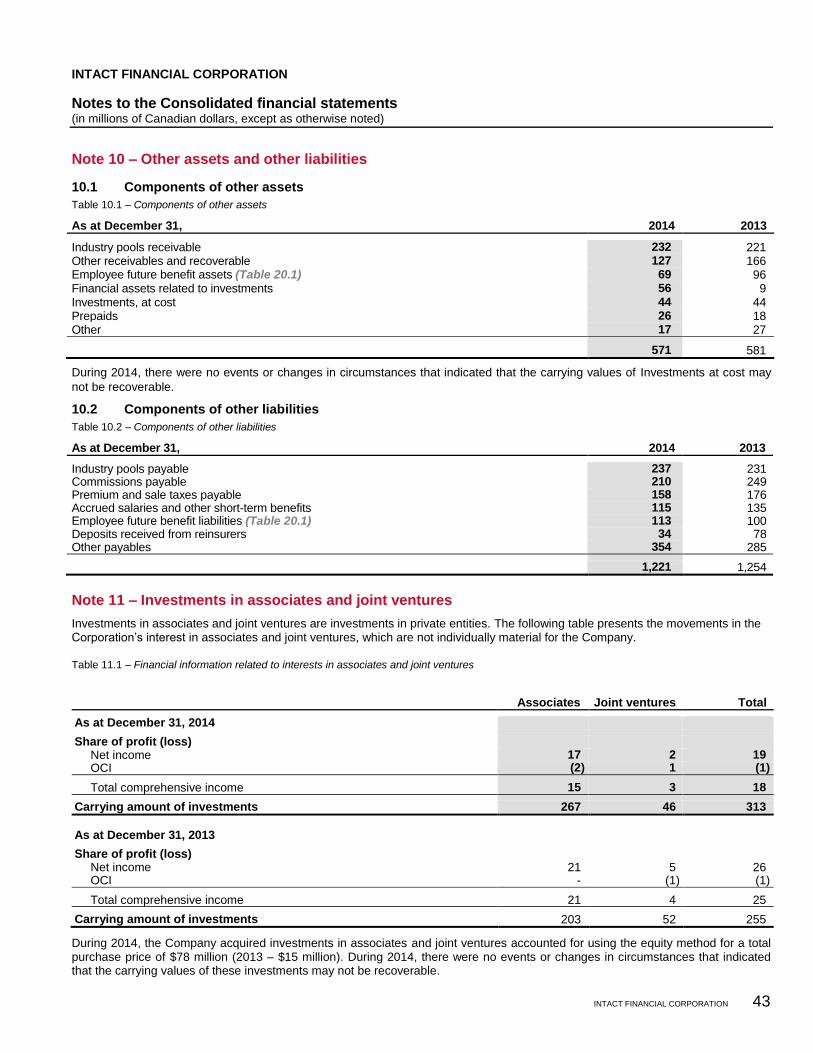
INTACT FINANCIAL CORPORATION
Notes to the Consolidated financial statements (in millions of Canadian dollars, except as otherwise noted)
INTACT FINANCIAL CORPORATION 43
Note 10 – Other assets and other liabilities
10.1 Components of other assets
Table 10.1 – Components of other assets
As at December 31, 2014 2013
Industry pools receivable 232 221 Other receivables and recoverable 127 166 Employee future benefit assets (Table 20.1) 69 96 Financial assets related to investments 56 9 Investments, at cost 44 44 Prepaids 26 18 Other 17 27
571 581
During 2014, there were no events or changes in circumstances that indicated that the carrying values of Investments at cost may
not be recoverable.
10.2 Components of other liabilities
Table 10.2 – Components of other liabilities
As at December 31, 2014 2013
Industry pools payable 237 231 Commissions payable 210 249 Premium and sale taxes payable 158 176 Accrued salaries and other short-term benefits 115 135 Employee future benefit liabilities (Table 20.1) 113 100 Deposits received from reinsurers 34 78 Other payables
354 285
1,221 1,254
Note 11 – Investments in associates and joint ventures
Investments in associates and joint ventures are investments in private entities. The following table presents the movements in the Corporation’s interest in associates and joint ventures, which are not individually material for the Company.
Table 11.1 – Financial information related to interests in associates and joint ventures
Associates Joint ventures Total
As at December 31, 2014
Share of profit (loss) Net income 17 2 19 OCI (2) 1 (1)
Total comprehensive income 15 3 18
Carrying amount of investments 267 46 313
As at December 31, 2013
Share of profit (loss) Net income 21 5 26 OCI - (1) (1)
Total comprehensive income 21 4 25
Carrying amount of investments 203 52 255
During 2014, the Company acquired investments in associates and joint ventures accounted for using the equity method for a total purchase price of $78 million (2013 – $15 million). During 2014, there were no events or changes in circumstances that indicated that the carrying values of these investments may not be recoverable.
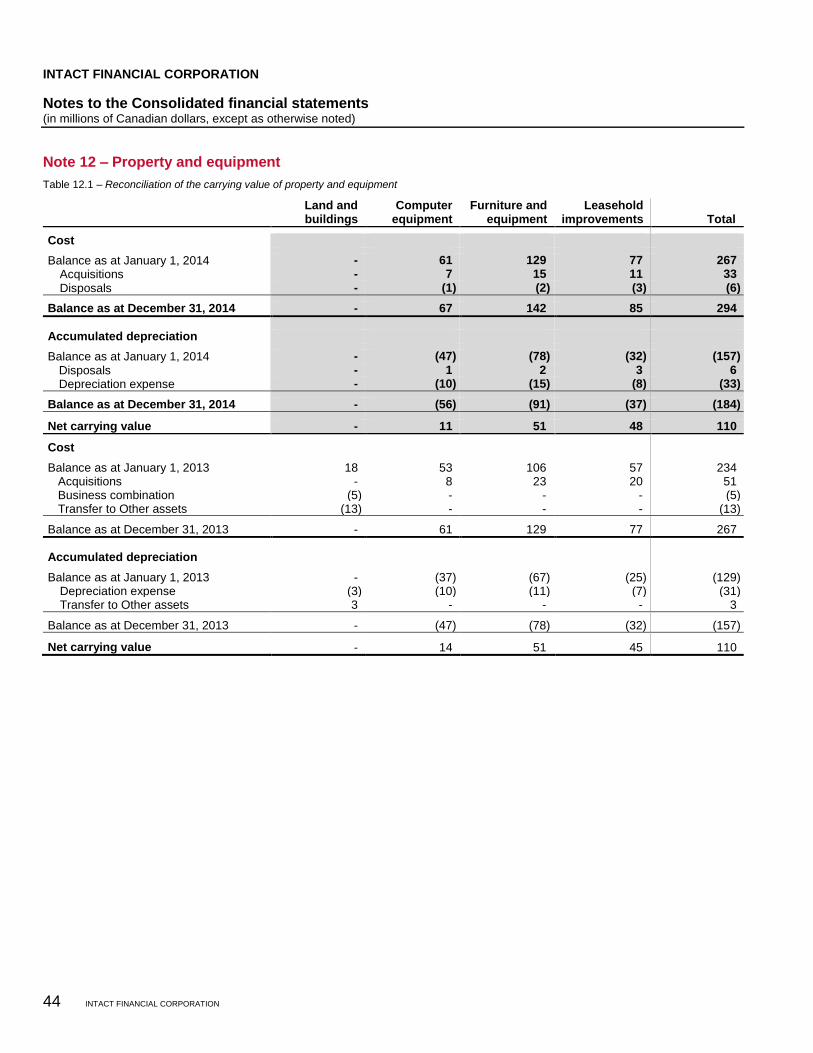
INTACT FINANCIAL CORPORATION
Notes to the Consolidated financial statements (in millions of Canadian dollars, except as otherwise noted)
44 INTACT FINANCIAL CORPORATION
Note 12 – Property and equipment
Table 12.1 – Reconciliation of the carrying value of property and equipment
Land and buildings
Computer equipment
Furniture and equipment
Leasehold improvements Total
Cost
Balance as at January 1, 2014 - 61 129 77 267
Acquisitions - 7 15 11 33
Disposals - (1) (2) (3) (6)
Balance as at December 31, 2014 - 67 142 85 294
Accumulated depreciation
Balance as at January 1, 2014 - (47) (78) (32) (157)
Disposals - 1 2 3 6
Depreciation expense - (10) (15) (8) (33)
Balance as at December 31, 2014 - (56) (91) (37) (184)
Net carrying value - 11 51 48 110
Cost
Balance as at January 1, 2013 18 53 106 57 234 Acquisitions - 8 23 20 51 Business combination (5) - - - (5) Transfer to Other assets (13) - - - (13)
Balance as at December 31, 2013 - 61 129 77 267
Accumulated depreciation
Balance as at January 1, 2013 - (37) (67) (25) (129) Depreciation expense (3) (10) (11) (7) (31) Transfer to Other assets 3 - - - 3
Balance as at December 31, 2013 - (47) (78) (32) (157)
Net carrying value - 14 51 45 110
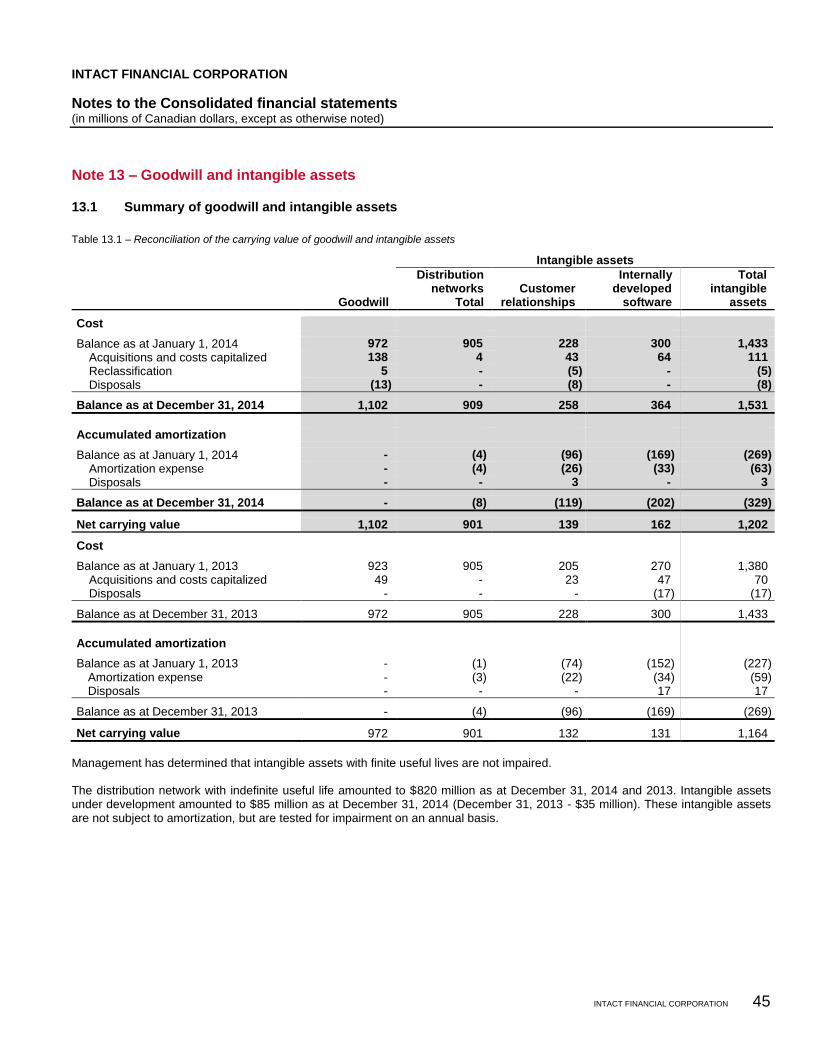
INTACT FINANCIAL CORPORATION
Notes to the Consolidated financial statements (in millions of Canadian dollars, except as otherwise noted)
INTACT FINANCIAL CORPORATION 45
Note 13 – Goodwill and intangible assets
13.1 Summary of goodwill and intangible assets
Table 13.1 – Reconciliation of the carrying value of goodwill and intangible assets
Intangible assets
Goodwill
Distribution networks
Total Customer
relationships
Internally developed
software
Total intangible
assets
Cost
Balance as at January 1, 2014 972 905 228 300 1,433
Acquisitions and costs capitalized 138 4 43 64 111
Reclassification 5 - (5) - (5)
Disposals (13) - (8) - (8)
Balance as at December 31, 2014 1,102 909 258 364 1,531
Accumulated amortization
Balance as at January 1, 2014 - (4) (96) (169) (269)
Amortization expense - (4) (26) (33) (63)
Disposals - - 3 - 3
Balance as at December 31, 2014 - (8) (119) (202) (329)
Net carrying value 1,102 901 139 162 1,202
Cost
Balance as at January 1, 2013 923 905 205 270 1,380 Acquisitions and costs capitalized 49 - 23 47 70 Disposals - - - (17) (17)
Balance as at December 31, 2013 972 905 228 300 1,433
Accumulated amortization
Balance as at January 1, 2013 - (1) (74) (152) (227) Amortization expense - (3) (22) (34) (59) Disposals - - - 17 17
Balance as at December 31, 2013 - (4) (96) (169) (269)
Net carrying value 972 901 132 131 1,164
Management has determined that intangible assets with finite useful lives are not impaired. The distribution network with indefinite useful life amounted to $820 million as at December 31, 2014 and 2013. Intangible assets under development amounted to $85 million as at December 31, 2014 (December 31, 2013 - $35 million). These intangible assets are not subject to amortization, but are tested for impairment on an annual basis.
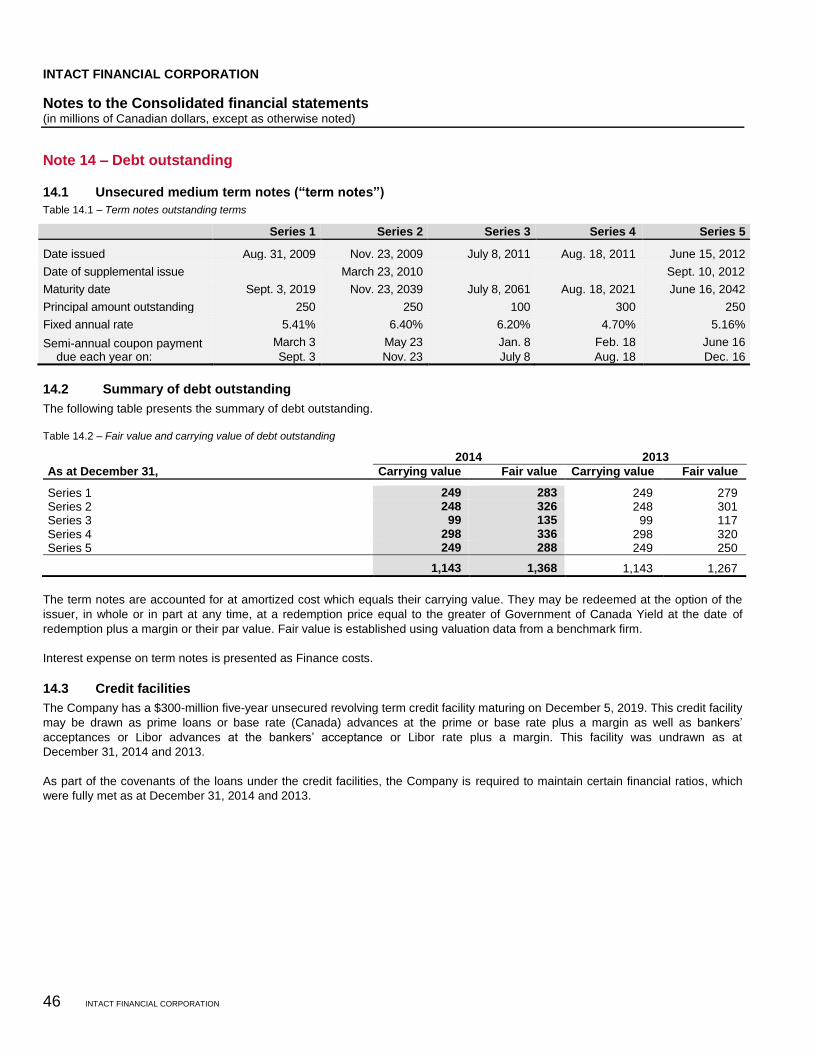
INTACT FINANCIAL CORPORATION
Notes to the Consolidated financial statements (in millions of Canadian dollars, except as otherwise noted)
46 INTACT FINANCIAL CORPORATION
Note 14 – Debt outstanding
14.1 Unsecured medium term notes (“term notes”)
Table 14.1 – Term notes outstanding terms
Series 1 Series 2 Series 3 Series 4 Series 5
Date issued Aug. 31, 2009 Nov. 23, 2009 July 8, 2011 Aug. 18, 2011 June 15, 2012
Date of supplemental issue March 23, 2010 Sept. 10, 2012
Maturity date Sept. 3, 2019 Nov. 23, 2039 July 8, 2061 Aug. 18, 2021 June 16, 2042
Principal amount outstanding 250 250 100 300 250
Fixed annual rate 5.41% 6.40% 6.20% 4.70% 5.16%
Semi-annual coupon payment due each year on:
March 3
Sept. 3
May 23
Nov. 23
Jan. 8
July 8
Feb. 18
Aug. 18
June 16
Dec. 16
14.2 Summary of debt outstanding
The following table presents the summary of debt outstanding.
Table 14.2 – Fair value and carrying value of debt outstanding
2014 2013
As at December 31, Carrying value Fair value Carrying value Fair value
Series 1 249 283 249 279 Series 2 248 326 248 301 Series 3 99 135 99 117 Series 4 298 336 298 320 Series 5 249 288 249 250
1,143 1,368 1,143 1,267
The term notes are accounted for at amortized cost which equals their carrying value. They may be redeemed at the option of the
issuer, in whole or in part at any time, at a redemption price equal to the greater of Government of Canada Yield at the date of
redemption plus a margin or their par value. Fair value is established using valuation data from a benchmark firm.
Interest expense on term notes is presented as Finance costs.
14.3 Credit facilities
The Company has a $300-million five-year unsecured revolving term credit facility maturing on December 5, 2019. This credit facility
may be drawn as prime loans or base rate (Canada) advances at the prime or base rate plus a margin as well as bankers’
acceptances or Libor advances at the bankers’ acceptance or Libor rate plus a margin. This facility was undrawn as at
December 31, 2014 and 2013.
As part of the covenants of the loans under the credit facilities, the Company is required to maintain certain financial ratios, which
were fully met as at December 31, 2014 and 2013.
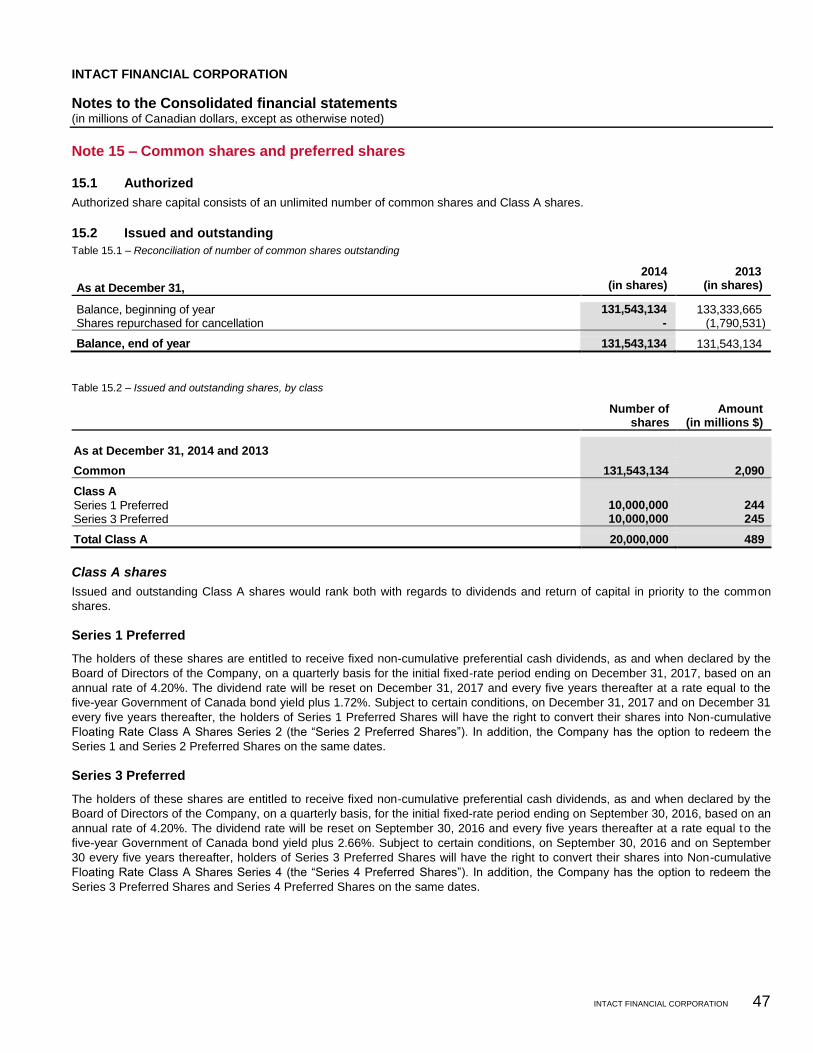
INTACT FINANCIAL CORPORATION
Notes to the Consolidated financial statements (in millions of Canadian dollars, except as otherwise noted)
INTACT FINANCIAL CORPORATION 47
Note 15 – Common shares and preferred shares
15.1 Authorized
Authorized share capital consists of an unlimited number of common shares and Class A shares.
15.2 Issued and outstanding
Table 15.1 – Reconciliation of number of common shares outstanding
As at December 31,
2014 (in shares)
2013 (in shares)
Balance, beginning of year 131,543,134 133,333,665 Shares repurchased for cancellation - (1,790,531)
Balance, end of year 131,543,134 131,543,134
Table 15.2 – Issued and outstanding shares, by class
Number of
shares Amount
(in millions $)
As at December 31, 2014 and 2013
Common 131,543,134 2,090
Class A
Series 1 Preferred 10,000,000 244
Series 3 Preferred 10,000,000 245
Total Class A 20,000,000 489
Class A shares
Issued and outstanding Class A shares would rank both with regards to dividends and return of capital in priority to the common
shares.
Series 1 Preferred
The holders of these shares are entitled to receive fixed non-cumulative preferential cash dividends, as and when declared by the
Board of Directors of the Company, on a quarterly basis for the initial fixed-rate period ending on December 31, 2017, based on an
annual rate of 4.20%. The dividend rate will be reset on December 31, 2017 and every five years thereafter at a rate equal to the
five-year Government of Canada bond yield plus 1.72%. Subject to certain conditions, on December 31, 2017 and on December 31
every five years thereafter, the holders of Series 1 Preferred Shares will have the right to convert their shares into Non-cumulative
Floating Rate Class A Shares Series 2 (the “Series 2 Preferred Shares”). In addition, the Company has the option to redeem the
Series 1 and Series 2 Preferred Shares on the same dates.
Series 3 Preferred
The holders of these shares are entitled to receive fixed non-cumulative preferential cash dividends, as and when declared by the
Board of Directors of the Company, on a quarterly basis, for the initial fixed-rate period ending on September 30, 2016, based on an
annual rate of 4.20%. The dividend rate will be reset on September 30, 2016 and every five years thereafter at a rate equal to the
five-year Government of Canada bond yield plus 2.66%. Subject to certain conditions, on September 30, 2016 and on September
30 every five years thereafter, holders of Series 3 Preferred Shares will have the right to convert their shares into Non-cumulative
Floating Rate Class A Shares Series 4 (the “Series 4 Preferred Shares”). In addition, the Company has the option to redeem the
Series 3 Preferred Shares and Series 4 Preferred Shares on the same dates.
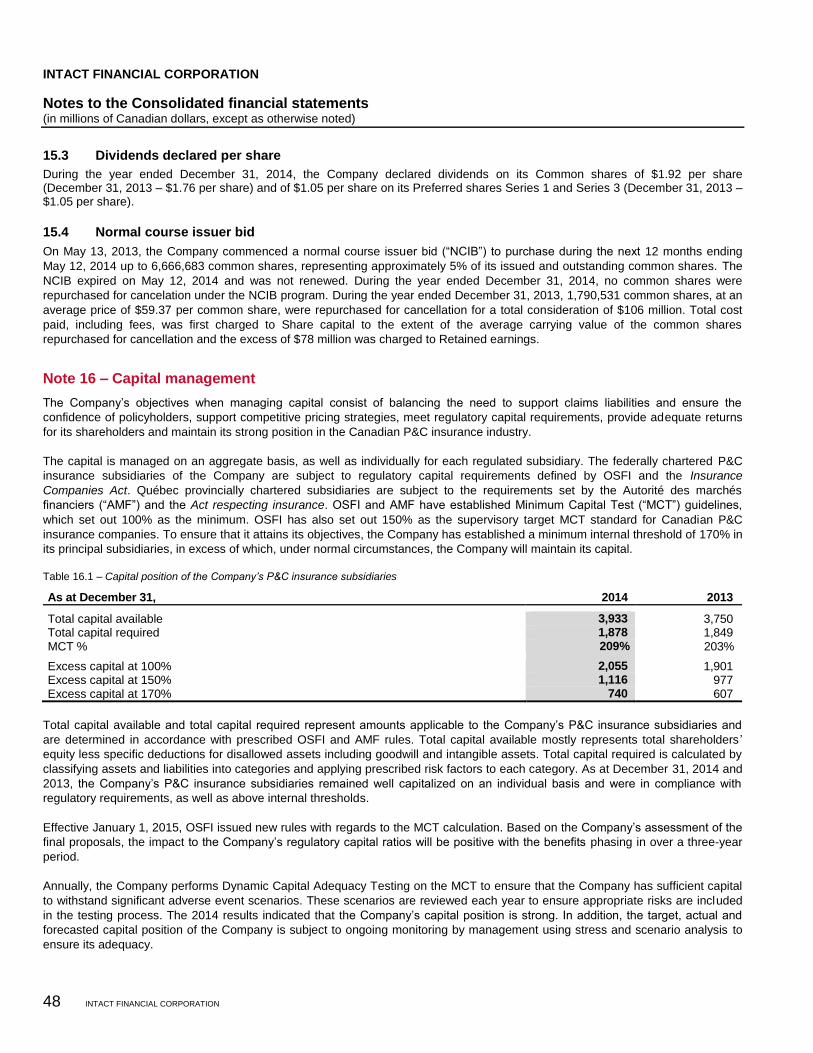
INTACT FINANCIAL CORPORATION
Notes to the Consolidated financial statements (in millions of Canadian dollars, except as otherwise noted)
48 INTACT FINANCIAL CORPORATION
15.3 Dividends declared per share
During the year ended December 31, 2014, the Company declared dividends on its Common shares of $1.92 per share (December 31, 2013 – $1.76 per share) and of $1.05 per share on its Preferred shares Series 1 and Series 3 (December 31, 2013 – $1.05 per share).
15.4 Normal course issuer bid
On May 13, 2013, the Company commenced a normal course issuer bid (“NCIB”) to purchase during the next 12 months ending
May 12, 2014 up to 6,666,683 common shares, representing approximately 5% of its issued and outstanding common shares. The
NCIB expired on May 12, 2014 and was not renewed. During the year ended December 31, 2014, no common shares were
repurchased for cancelation under the NCIB program. During the year ended December 31, 2013, 1,790,531 common shares, at an
average price of $59.37 per common share, were repurchased for cancellation for a total consideration of $106 million. Total cost
paid, including fees, was first charged to Share capital to the extent of the average carrying value of the common shares
repurchased for cancellation and the excess of $78 million was charged to Retained earnings.
Note 16 – Capital management
The Company’s objectives when managing capital consist of balancing the need to support claims liabilities and ensure the
confidence of policyholders, support competitive pricing strategies, meet regulatory capital requirements, provide adequate returns
for its shareholders and maintain its strong position in the Canadian P&C insurance industry.
The capital is managed on an aggregate basis, as well as individually for each regulated subsidiary. The federally chartered P&C
insurance subsidiaries of the Company are subject to regulatory capital requirements defined by OSFI and the Insurance
Companies Act. Québec provincially chartered subsidiaries are subject to the requirements set by the Autorité des marchés
financiers (“AMF”) and the Act respecting insurance. OSFI and AMF have established Minimum Capital Test (“MCT”) guidelines,
which set out 100% as the minimum. OSFI has also set out 150% as the supervisory target MCT standard for Canadian P&C
insurance companies. To ensure that it attains its objectives, the Company has established a minimum internal threshold of 170% in
its principal subsidiaries, in excess of which, under normal circumstances, the Company will maintain its capital.
Table 16.1 – Capital position of the Company’s P&C insurance subsidiaries
As at December 31, 2014 2013
Total capital available 3,933 3,750 Total capital required 1,878 1,849 MCT % 209% 203%
Excess capital at 100% 2,055 1,901 Excess capital at 150% 1,116 977 Excess capital at 170% 740 607
Total capital available and total capital required represent amounts applicable to the Company’s P&C insurance subsidiaries and
are determined in accordance with prescribed OSFI and AMF rules. Total capital available mostly represents total shareholders ’
equity less specific deductions for disallowed assets including goodwill and intangible assets. Total capital required is calculated by
classifying assets and liabilities into categories and applying prescribed risk factors to each category. As at December 31, 2014 and
2013, the Company’s P&C insurance subsidiaries remained well capitalized on an individual basis and were in compliance with
regulatory requirements, as well as above internal thresholds.
Effective January 1, 2015, OSFI issued new rules with regards to the MCT calculation. Based on the Company’s assessment of the
final proposals, the impact to the Company’s regulatory capital ratios will be positive with the benefits phasing in over a three-year
period.
Annually, the Company performs Dynamic Capital Adequacy Testing on the MCT to ensure that the Company has sufficient capital
to withstand significant adverse event scenarios. These scenarios are reviewed each year to ensure appropriate risks are included
in the testing process. The 2014 results indicated that the Company’s capital position is strong. In addition, the target, actual and
forecasted capital position of the Company is subject to ongoing monitoring by management using stress and scenario analysis to
ensure its adequacy.
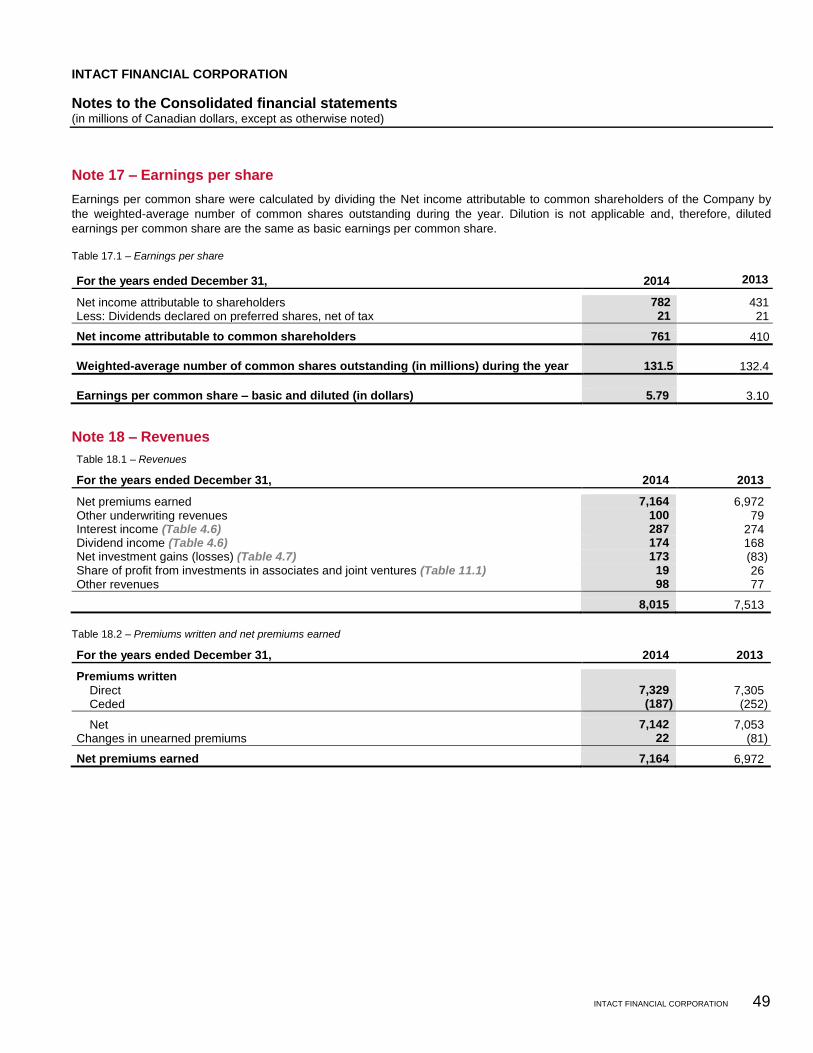
INTACT FINANCIAL CORPORATION
Notes to the Consolidated financial statements (in millions of Canadian dollars, except as otherwise noted)
INTACT FINANCIAL CORPORATION 49
Note 17 – Earnings per share
Earnings per common share were calculated by dividing the Net income attributable to common shareholders of the Company by
the weighted-average number of common shares outstanding during the year. Dilution is not applicable and, therefore, diluted
earnings per common share are the same as basic earnings per common share.
Table 17.1 – Earnings per share
For the years ended December 31, 2014 2013
Net income attributable to shareholders 782 431 Less: Dividends declared on preferred shares, net of tax 21 21
Net income attributable to common shareholders 761 410
Weighted-average number of common shares outstanding (in millions) during the year 131.5 132.4
Earnings per common share – basic and diluted (in dollars) 5.79 3.10
Note 18 – Revenues
Table 18.1 – Revenues
For the years ended December 31, 2014 2013
Net premiums earned 7,164 6,972 Other underwriting revenues 100 79 Interest income (Table 4.6) 287 274 Dividend income (Table 4.6) 174 168 Net investment gains (losses) (Table 4.7) 173 (83) Share of profit from investments in associates and joint ventures (Table 11.1) 19 26 Other revenues 98 77
8,015 7,513
Table 18.2 – Premiums written and net premiums earned
For the years ended December 31, 2014 2013
Premiums written Direct 7,329 7,305 Ceded (187) (252)
Net 7,142 7,053 Changes in unearned premiums 22 (81)
Net premiums earned 7,164 6,972
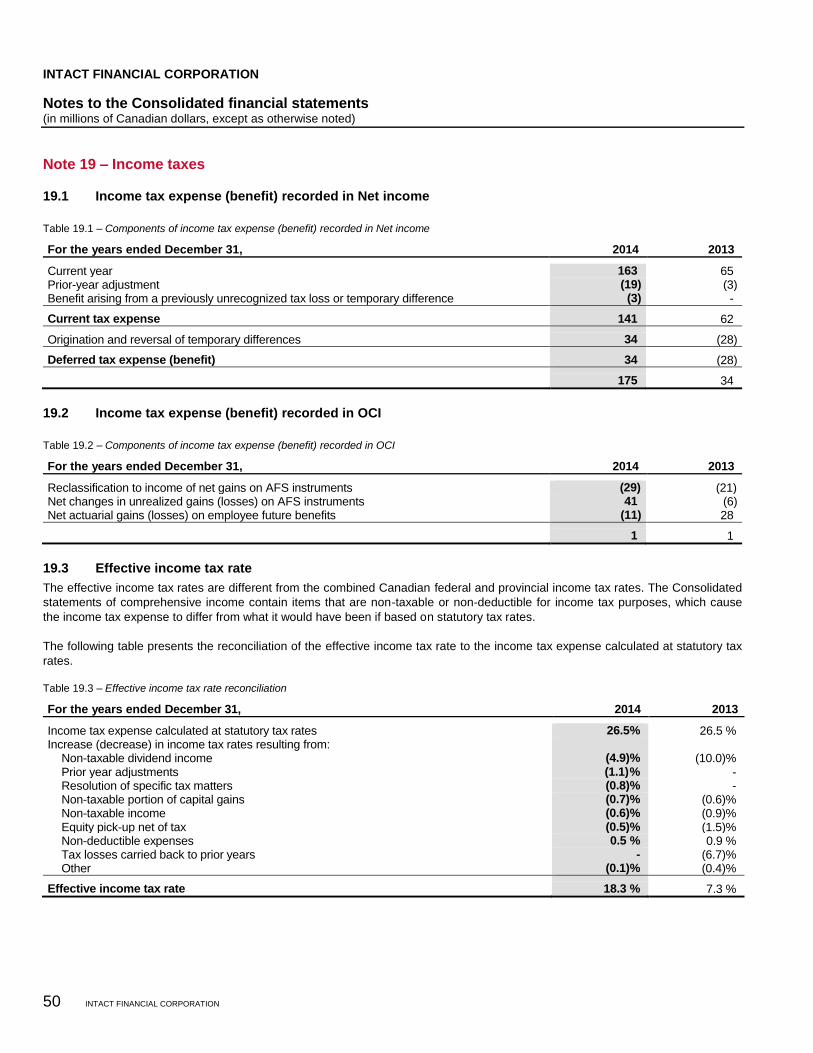
INTACT FINANCIAL CORPORATION
Notes to the Consolidated financial statements (in millions of Canadian dollars, except as otherwise noted)
50 INTACT FINANCIAL CORPORATION
Note 19 – Income taxes
19.1 Income tax expense (benefit) recorded in Net income
Table 19.1 – Components of income tax expense (benefit) recorded in Net income
For the years ended December 31, 2014 2013
Current year 163 65 Prior-year adjustment (19) (3) Benefit arising from a previously unrecognized tax loss or temporary difference (3) -
Current tax expense 141 62
Origination and reversal of temporary differences 34 (28)
Deferred tax expense (benefit) 34 (28)
175 34
19.2 Income tax expense (benefit) recorded in OCI
Table 19.2 – Components of income tax expense (benefit) recorded in OCI
For the years ended December 31, 2014 2013
Reclassification to income of net gains on AFS instruments (29) (21) Net changes in unrealized gains (losses) on AFS instruments 41 (6) Net actuarial gains (losses) on employee future benefits (11) 28
1 1
19.3 Effective income tax rate
The effective income tax rates are different from the combined Canadian federal and provincial income tax rates. The Consolidated
statements of comprehensive income contain items that are non-taxable or non-deductible for income tax purposes, which cause
the income tax expense to differ from what it would have been if based on statutory tax rates.
The following table presents the reconciliation of the effective income tax rate to the income tax expense calculated at statutory tax
rates.
Table 19.3 – Effective income tax rate reconciliation
For the years ended December 31, 2014 2013
Income tax expense calculated at statutory tax rates 26.5% 26.5 % Increase (decrease) in income tax rates resulting from: Non-taxable dividend income (4.9)% (10.0)% Prior year adjustments (1.1) % - Resolution of specific tax matters (0.8)% - Non-taxable portion of capital gains (0.7)% (0.6)% Non-taxable income (0.6)% (0.9)% Equity pick-up net of tax (0.5)% (1.5)% Non-deductible expenses 0.5 % 0.9 % Tax losses carried back to prior years - (6.7)% Other (0.1)% (0.4)%
Effective income tax rate 18.3 % 7.3 %
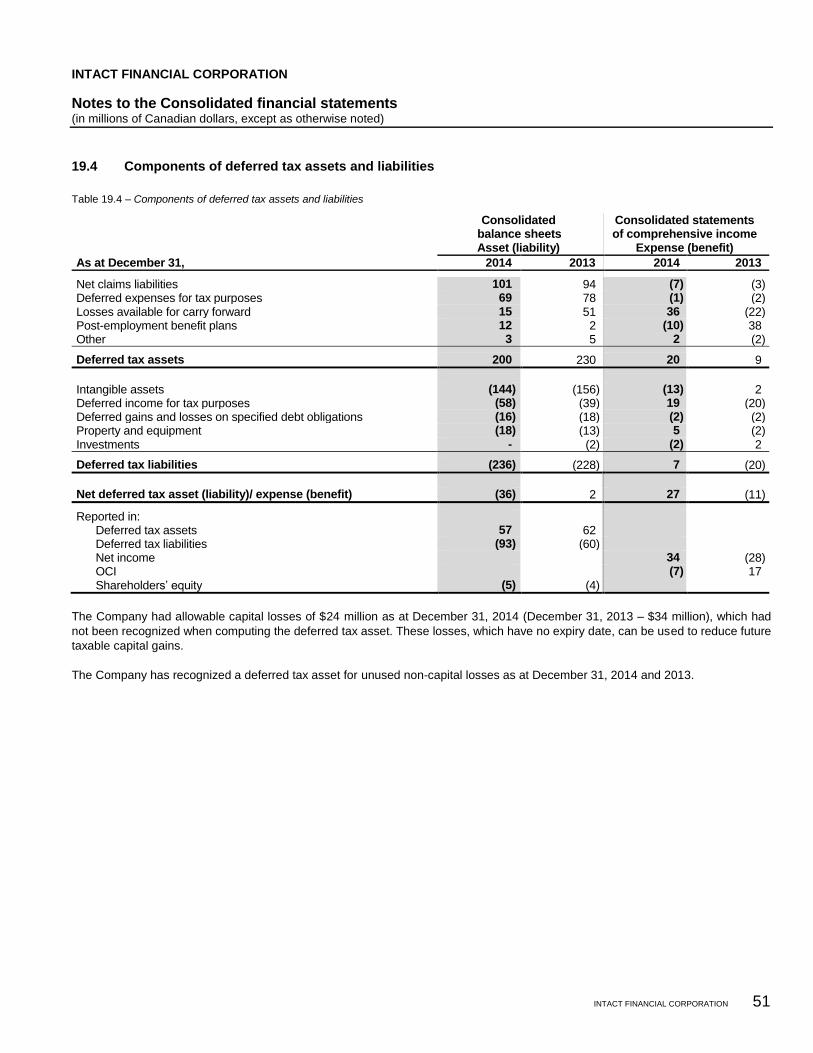
INTACT FINANCIAL CORPORATION
Notes to the Consolidated financial statements (in millions of Canadian dollars, except as otherwise noted)
INTACT FINANCIAL CORPORATION 51
19.4 Components of deferred tax assets and liabilities
Table 19.4 – Components of deferred tax assets and liabilities
Consolidated balance sheets Asset (liability)
Consolidated statements of comprehensive income
Expense (benefit)
As at December 31, 2014 2013 2014 2013
Net claims liabilities 101 94 (7) (3) Deferred expenses for tax purposes 69 78 (1) (2) Losses available for carry forward 15 51 36 (22) Post-employment benefit plans 12 2 (10) 38 Other 3 5 2 (2)
Deferred tax assets 200 230 20 9
Intangible assets (144) (156) (13) 2 Deferred income for tax purposes (58) (39) 19 (20) Deferred gains and losses on specified debt obligations (16) (18) (2) (2) Property and equipment (18) (13) 5 (2) Investments - (2) (2) 2
Deferred tax liabilities (236) (228) 7 (20)
Net deferred tax asset (liability)/ expense (benefit) (36) 2 27 (11)
Reported in: Deferred tax assets 57 62 Deferred tax liabilities (93) (60) Net income 34 (28) OCI (7) 17 Shareholders’ equity (5) (4)
The Company had allowable capital losses of $24 million as at December 31, 2014 (December 31, 2013 – $34 million), which had
not been recognized when computing the deferred tax asset. These losses, which have no expiry date, can be used to reduce future
taxable capital gains.
The Company has recognized a deferred tax asset for unused non-capital losses as at December 31, 2014 and 2013.
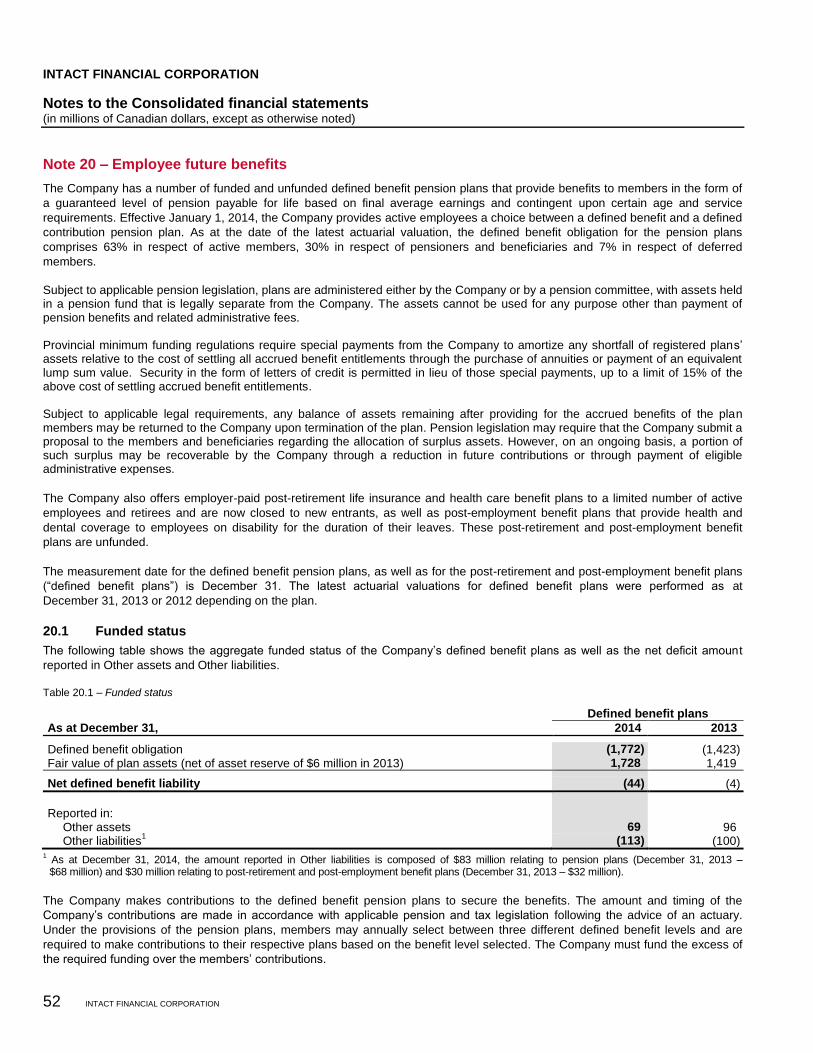
INTACT FINANCIAL CORPORATION
Notes to the Consolidated financial statements (in millions of Canadian dollars, except as otherwise noted)
52 INTACT FINANCIAL CORPORATION
Note 20 – Employee future benefits
The Company has a number of funded and unfunded defined benefit pension plans that provide benefits to members in the form of
a guaranteed level of pension payable for life based on final average earnings and contingent upon certain age and service
requirements. Effective January 1, 2014, the Company provides active employees a choice between a defined benefit and a defined
contribution pension plan. As at the date of the latest actuarial valuation, the defined benefit obligation for the pension plans
comprises 63% in respect of active members, 30% in respect of pensioners and beneficiaries and 7% in respect of deferred
members.
Subject to applicable pension legislation, plans are administered either by the Company or by a pension committee, with assets held in a pension fund that is legally separate from the Company. The assets cannot be used for any purpose other than payment of pension benefits and related administrative fees.
Provincial minimum funding regulations require special payments from the Company to amortize any shortfall of registered plans’ assets relative to the cost of settling all accrued benefit entitlements through the purchase of annuities or payment of an equivalent lump sum value. Security in the form of letters of credit is permitted in lieu of those special payments, up to a limit of 15% of the above cost of settling accrued benefit entitlements.
Subject to applicable legal requirements, any balance of assets remaining after providing for the accrued benefits of the plan members may be returned to the Company upon termination of the plan. Pension legislation may require that the Company submit a proposal to the members and beneficiaries regarding the allocation of surplus assets. However, on an ongoing basis, a portion of such surplus may be recoverable by the Company through a reduction in future contributions or through payment of eligible administrative expenses.
The Company also offers employer-paid post-retirement life insurance and health care benefit plans to a limited number of active
employees and retirees and are now closed to new entrants, as well as post-employment benefit plans that provide health and
dental coverage to employees on disability for the duration of their leaves. These post-retirement and post-employment benefit
plans are unfunded.
The measurement date for the defined benefit pension plans, as well as for the post-retirement and post-employment benefit plans
(“defined benefit plans”) is December 31. The latest actuarial valuations for defined benefit plans were performed as at
December 31, 2013 or 2012 depending on the plan.
20.1 Funded status
The following table shows the aggregate funded status of the Company’s defined benefit plans as well as the net deficit amount
reported in Other assets and Other liabilities.
Table 20.1 – Funded status
Defined benefit plans
As at December 31, 2014 2013
Defined benefit obligation (1,772) (1,423) Fair value of plan assets (net of asset reserve of $6 million in 2013) 1,728 1,419
Net defined benefit liability (44) (4)
Reported in: Other assets 69 96 Other liabilities
1 (113) (100)
1 As at December 31, 2014, the amount reported in Other liabilities is composed of $83 million relating to pension plans (December 31, 2013 – $68 million) and $30 million relating to post-retirement and post-employment benefit plans (December 31, 2013 – $32 million).
The Company makes contributions to the defined benefit pension plans to secure the benefits. The amount and timing of the
Company’s contributions are made in accordance with applicable pension and tax legislation following the advice of an actuary.
Under the provisions of the pension plans, members may annually select between three different defined benefit levels and are
required to make contributions to their respective plans based on the benefit level selected. The Company must fund the excess of
the required funding over the members’ contributions.
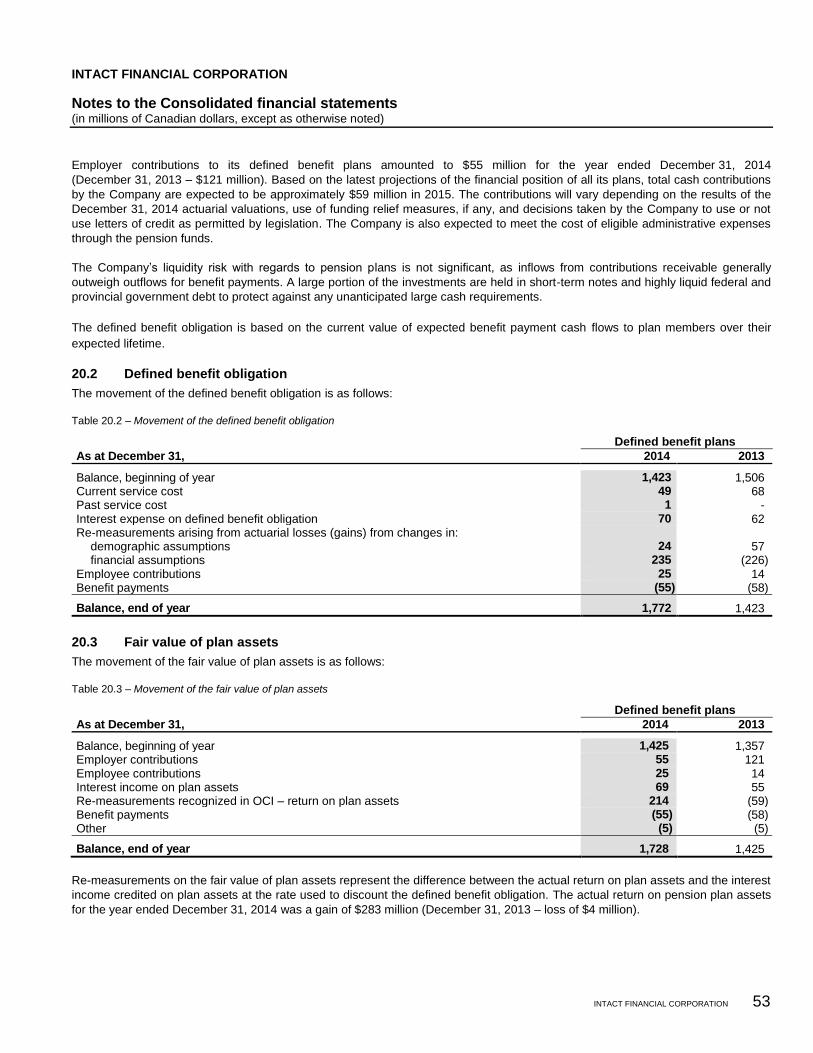
INTACT FINANCIAL CORPORATION
Notes to the Consolidated financial statements (in millions of Canadian dollars, except as otherwise noted)
INTACT FINANCIAL CORPORATION 53
Employer contributions to its defined benefit plans amounted to $55 million for the year ended December 31, 2014
(December 31, 2013 – $121 million). Based on the latest projections of the financial position of all its plans, total cash contributions
by the Company are expected to be approximately $59 million in 2015. The contributions will vary depending on the results of the
December 31, 2014 actuarial valuations, use of funding relief measures, if any, and decisions taken by the Company to use or not
use letters of credit as permitted by legislation. The Company is also expected to meet the cost of eligible administrative expenses
through the pension funds.
The Company’s liquidity risk with regards to pension plans is not significant, as inflows from contributions receivable generally
outweigh outflows for benefit payments. A large portion of the investments are held in short-term notes and highly liquid federal and
provincial government debt to protect against any unanticipated large cash requirements.
The defined benefit obligation is based on the current value of expected benefit payment cash flows to plan members over their
expected lifetime.
20.2 Defined benefit obligation
The movement of the defined benefit obligation is as follows:
Table 20.2 – Movement of the defined benefit obligation
Defined benefit plans
As at December 31, 2014 2013
Balance, beginning of year 1,423 1,506 Current service cost 49 68 Past service cost 1 - Interest expense on defined benefit obligation 70 62 Re-measurements arising from actuarial losses (gains) from changes in:
demographic assumptions 24 57 financial assumptions 235 (226)
Employee contributions 25 14 Benefit payments (55) (58)
Balance, end of year 1,772 1,423
20.3 Fair value of plan assets
The movement of the fair value of plan assets is as follows:
Table 20.3 – Movement of the fair value of plan assets
Defined benefit plans
As at December 31, 2014 2013
Balance, beginning of year 1,425 1,357 Employer contributions 55 121 Employee contributions 25 14 Interest income on plan assets 69 55 Re-measurements recognized in OCI – return on plan assets 214 (59) Benefit payments (55) (58) Other (5) (5)
Balance, end of year 1,728 1,425
Re-measurements on the fair value of plan assets represent the difference between the actual return on plan assets and the interest
income credited on plan assets at the rate used to discount the defined benefit obligation. The actual return on pension plan assets
for the year ended December 31, 2014 was a gain of $283 million (December 31, 2013 – loss of $4 million).
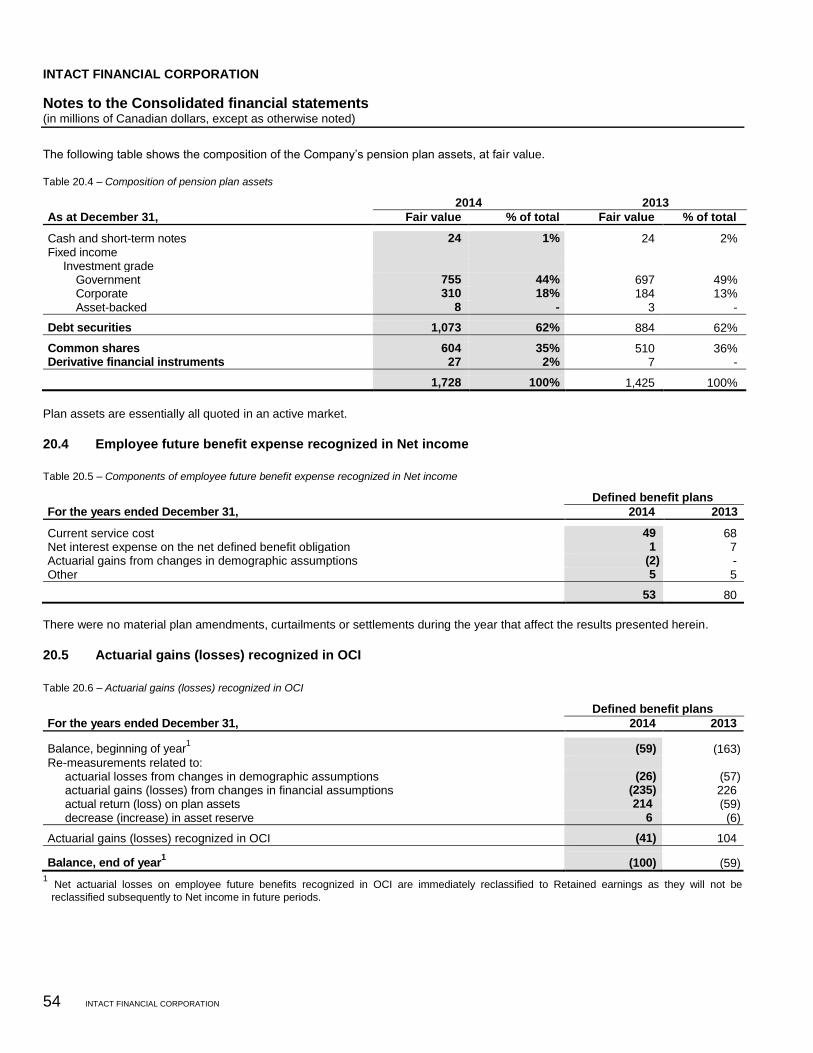
INTACT FINANCIAL CORPORATION
Notes to the Consolidated financial statements (in millions of Canadian dollars, except as otherwise noted)
54 INTACT FINANCIAL CORPORATION
The following table shows the composition of the Company’s pension plan assets, at fair value.
Table 20.4 – Composition of pension plan assets
2014 2013
As at December 31, Fair value % of total Fair value % of total
Cash and short-term notes 24 1% 24 2% Fixed income Investment grade Government 755 44% 697 49% Corporate 310 18% 184 13% Asset-backed 8 - 3 -
Debt securities 1,073 62% 884 62%
Common shares 604 35% 510 36% Derivative financial instruments 27 2% 7 -
1,728 100% 1,425 100%
Plan assets are essentially all quoted in an active market.
20.4 Employee future benefit expense recognized in Net income
Table 20.5 – Components of employee future benefit expense recognized in Net income
Defined benefit plans
For the years ended December 31, 2014 2013
Current service cost 49 68 Net interest expense on the net defined benefit obligation 1 7 Actuarial gains from changes in demographic assumptions (2) - Other 5 5
53 80
There were no material plan amendments, curtailments or settlements during the year that affect the results presented herein.
20.5 Actuarial gains (losses) recognized in OCI
Table 20.6 – Actuarial gains (losses) recognized in OCI
Defined benefit plans
For the years ended December 31, 2014 2013
Balance, beginning of year1 (59) (163)
Re-measurements related to: actuarial losses from changes in demographic assumptions (26) (57) actuarial gains (losses) from changes in financial assumptions (235) 226 actual return (loss) on plan assets 214 (59) decrease (increase) in asset reserve 6 (6)
Actuarial gains (losses) recognized in OCI (41) 104
Balance, end of year1 (100) (59)
1 Net actuarial losses on employee future benefits recognized in OCI are immediately reclassified to Retained earnings as they will not be
reclassified subsequently to Net income in future periods.
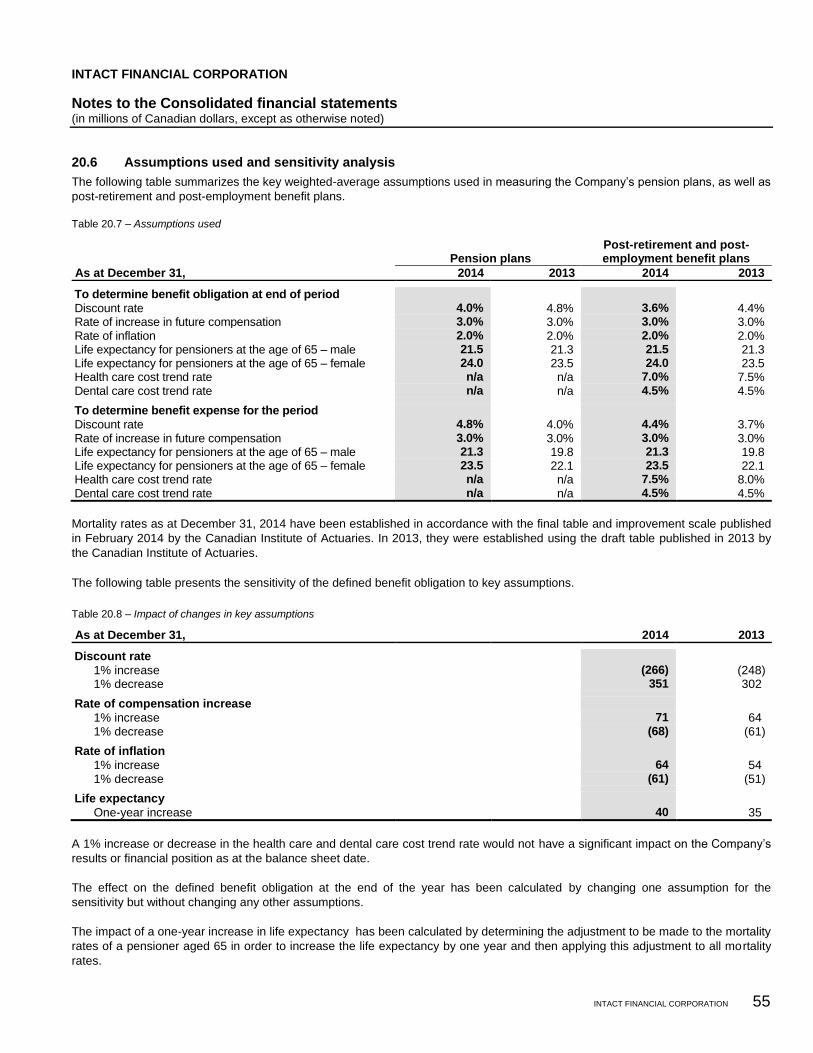
INTACT FINANCIAL CORPORATION
Notes to the Consolidated financial statements (in millions of Canadian dollars, except as otherwise noted)
INTACT FINANCIAL CORPORATION 55
20.6 Assumptions used and sensitivity analysis
The following table summarizes the key weighted-average assumptions used in measuring the Company’s pension plans, as well as
post-retirement and post-employment benefit plans.
Table 20.7 – Assumptions used
Pension plans Post-retirement and post- employment benefit plans
As at December 31, 2014 2013 2014 2013
To determine benefit obligation at end of period Discount rate 4.0% 4.8% 3.6% 4.4% Rate of increase in future compensation 3.0% 3.0% 3.0% 3.0% Rate of inflation 2.0% 2.0% 2.0% 2.0% Life expectancy for pensioners at the age of 65 – male 21.5 21.3 21.5 21.3 Life expectancy for pensioners at the age of 65 – female 24.0 23.5 24.0 23.5 Health care cost trend rate n/a n/a 7.0% 7.5% Dental care cost trend rate n/a n/a 4.5% 4.5%
To determine benefit expense for the period Discount rate 4.8% 4.0% 4.4% 3.7% Rate of increase in future compensation 3.0% 3.0% 3.0% 3.0% Life expectancy for pensioners at the age of 65 – male 21.3 19.8 21.3 19.8 Life expectancy for pensioners at the age of 65 – female 23.5 22.1 23.5 22.1 Health care cost trend rate n/a n/a 7.5% 8.0% Dental care cost trend rate n/a n/a 4.5% 4.5%
Mortality rates as at December 31, 2014 have been established in accordance with the final table and improvement scale published
in February 2014 by the Canadian Institute of Actuaries. In 2013, they were established using the draft table published in 2013 by
the Canadian Institute of Actuaries.
The following table presents the sensitivity of the defined benefit obligation to key assumptions.
Table 20.8 – Impact of changes in key assumptions
As at December 31, 2014 2013
Discount rate 1% increase (266) (248) 1% decrease 351 302
Rate of compensation increase 1% increase 71 64 1% decrease (68) (61)
Rate of inflation 1% increase 64 54 1% decrease (61) (51)
Life expectancy One-year increase 40 35
A 1% increase or decrease in the health care and dental care cost trend rate would not have a significant impact on the Company’s
results or financial position as at the balance sheet date.
The effect on the defined benefit obligation at the end of the year has been calculated by changing one assumption for the
sensitivity but without changing any other assumptions.
The impact of a one-year increase in life expectancy has been calculated by determining the adjustment to be made to the mortality
rates of a pensioner aged 65 in order to increase the life expectancy by one year and then applying this adjustment to all mortality
rates.
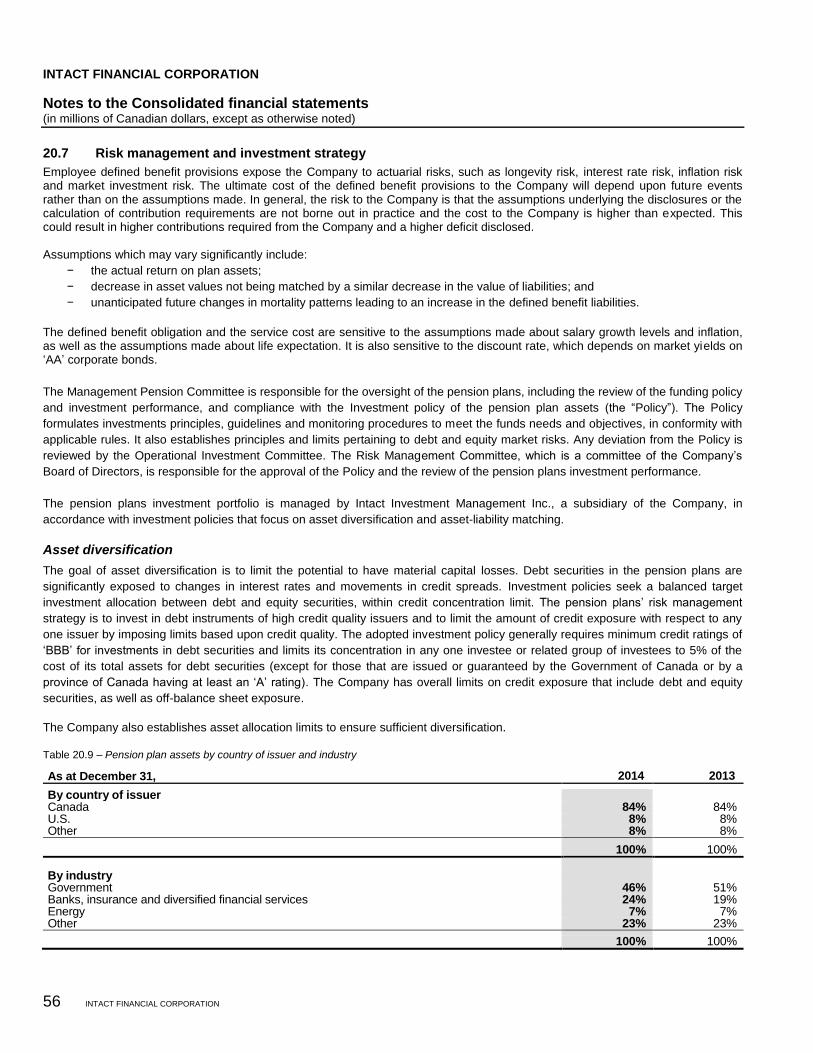
INTACT FINANCIAL CORPORATION
Notes to the Consolidated financial statements (in millions of Canadian dollars, except as otherwise noted)
56 INTACT FINANCIAL CORPORATION
20.7 Risk management and investment strategy
Employee defined benefit provisions expose the Company to actuarial risks, such as longevity risk, interest rate risk, inflation risk and market investment risk. The ultimate cost of the defined benefit provisions to the Company will depend upon future events rather than on the assumptions made. In general, the risk to the Company is that the assumptions underlying the disclosures or the calculation of contribution requirements are not borne out in practice and the cost to the Company is higher than expected. This could result in higher contributions required from the Company and a higher deficit disclosed.
Assumptions which may vary significantly include:
− the actual return on plan assets;
− decrease in asset values not being matched by a similar decrease in the value of liabilities; and
− unanticipated future changes in mortality patterns leading to an increase in the defined benefit liabilities.
The defined benefit obligation and the service cost are sensitive to the assumptions made about salary growth levels and inflation, as well as the assumptions made about life expectation. It is also sensitive to the discount rate, which depends on market yields on ‘AA’ corporate bonds.
The Management Pension Committee is responsible for the oversight of the pension plans, including the review of the funding policy
and investment performance, and compliance with the Investment policy of the pension plan assets (the “Policy”). The Policy
formulates investments principles, guidelines and monitoring procedures to meet the funds needs and objectives, in conformity with
applicable rules. It also establishes principles and limits pertaining to debt and equity market risks. Any deviation from the Policy is
reviewed by the Operational Investment Committee. The Risk Management Committee, which is a committee of the Company’s
Board of Directors, is responsible for the approval of the Policy and the review of the pension plans investment performance.
The pension plans investment portfolio is managed by Intact Investment Management Inc., a subsidiary of the Company, in
accordance with investment policies that focus on asset diversification and asset-liability matching.
Asset diversification
The goal of asset diversification is to limit the potential to have material capital losses. Debt securities in the pension plans are
significantly exposed to changes in interest rates and movements in credit spreads. Investment policies seek a balanced target
investment allocation between debt and equity securities, within credit concentration limit. The pension plans’ risk management
strategy is to invest in debt instruments of high credit quality issuers and to limit the amount of credit exposure with respect to any
one issuer by imposing limits based upon credit quality. The adopted investment policy generally requires minimum credit ratings of
‘BBB’ for investments in debt securities and limits its concentration in any one investee or related group of investees to 5% of the
cost of its total assets for debt securities (except for those that are issued or guaranteed by the Government of Canada or by a
province of Canada having at least an ‘A’ rating). The Company has overall limits on credit exposure that include debt and equity
securities, as well as off-balance sheet exposure.
The Company also establishes asset allocation limits to ensure sufficient diversification.
Table 20.9 – Pension plan assets by country of issuer and industry
As at December 31, 2014 2013 By country of issuer Canada 84% 84% U.S. 8% 8% Other 8% 8%
100% 100%
By industry Government 46% 51% Banks, insurance and diversified financial services 24% 19% Energy 7% 7% Other 23% 23% 100% 100%
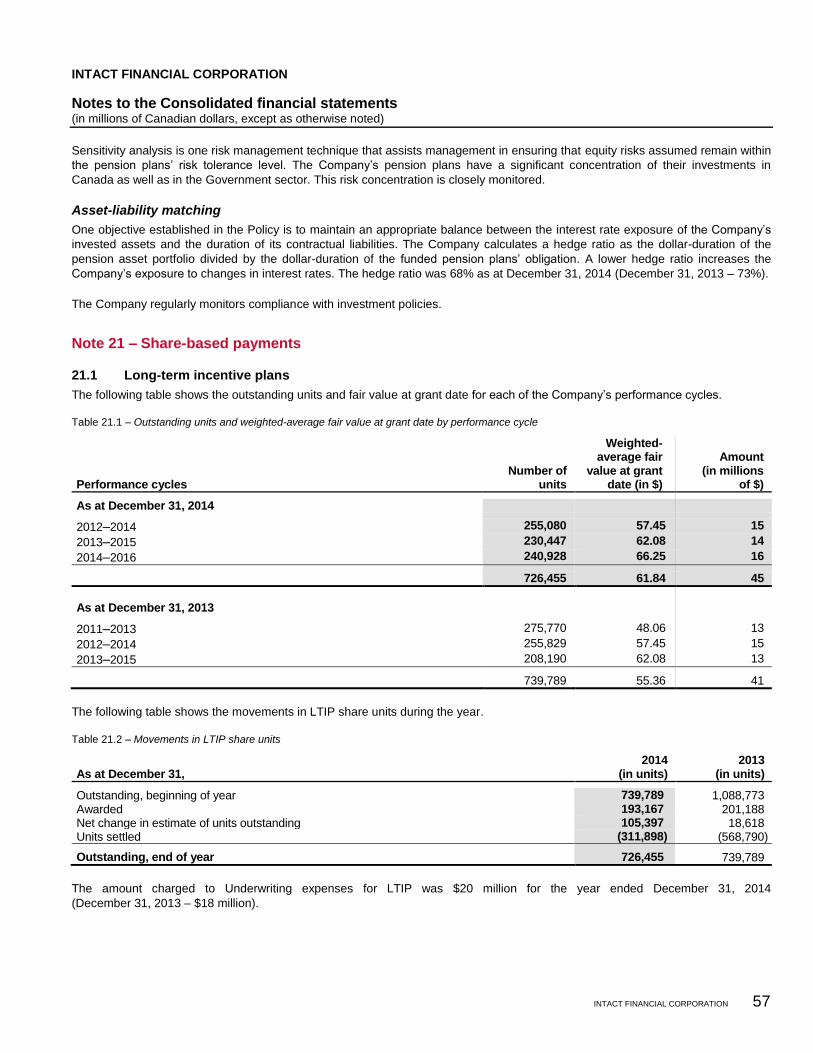
INTACT FINANCIAL CORPORATION
Notes to the Consolidated financial statements (in millions of Canadian dollars, except as otherwise noted)
INTACT FINANCIAL CORPORATION 57
Sensitivity analysis is one risk management technique that assists management in ensuring that equity risks assumed remain within
the pension plans’ risk tolerance level. The Company’s pension plans have a significant concentration of their investments in
Canada as well as in the Government sector. This risk concentration is closely monitored.
Asset-liability matching
One objective established in the Policy is to maintain an appropriate balance between the interest rate exposure of the Company’s
invested assets and the duration of its contractual liabilities. The Company calculates a hedge ratio as the dollar-duration of the
pension asset portfolio divided by the dollar-duration of the funded pension plans’ obligation. A lower hedge ratio increases the
Company’s exposure to changes in interest rates. The hedge ratio was 68% as at December 31, 2014 (December 31, 2013 – 73%).
The Company regularly monitors compliance with investment policies.
Note 21 – Share-based payments
21.1 Long-term incentive plans
The following table shows the outstanding units and fair value at grant date for each of the Company’s performance cycles.
Table 21.1 – Outstanding units and weighted-average fair value at grant date by performance cycle
Performance cycles Number of
units
Weighted-average fair
value at grant date (in $)
Amount (in millions
of $)
As at December 31, 2014
2012–2014 255,080 57.45 15
2013–2015 230,447 62.08 14
2014–2016 240,928 66.25 16
726,455 61.84 45
As at December 31, 2013
2011–2013 275,770 48.06 13
2012–2014 255,829 57.45 15
2013–2015 208,190 62.08 13
739,789 55.36 41
The following table shows the movements in LTIP share units during the year.
Table 21.2 – Movements in LTIP share units
As at December 31, 2014
(in units) 2013
(in units)
Outstanding, beginning of year 739,789 1,088,773 Awarded 193,167 201,188 Net change in estimate of units outstanding 105,397 18,618 Units settled (311,898) (568,790)
Outstanding, end of year 726,455 739,789
The amount charged to Underwriting expenses for LTIP was $20 million for the year ended December 31, 2014
(December 31, 2013 – $18 million).
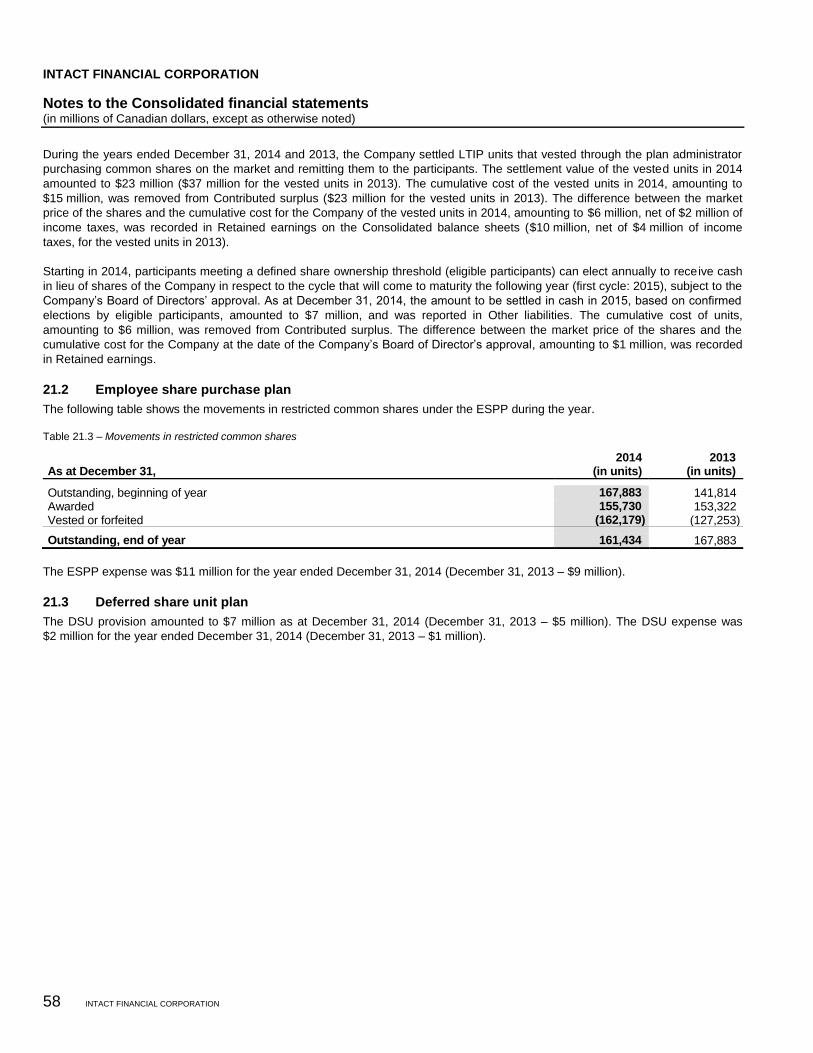
INTACT FINANCIAL CORPORATION
Notes to the Consolidated financial statements (in millions of Canadian dollars, except as otherwise noted)
58 INTACT FINANCIAL CORPORATION
During the years ended December 31, 2014 and 2013, the Company settled LTIP units that vested through the plan administrator
purchasing common shares on the market and remitting them to the participants. The settlement value of the vested units in 2014
amounted to $23 million ($37 million for the vested units in 2013). The cumulative cost of the vested units in 2014, amounting to
$15 million, was removed from Contributed surplus ($23 million for the vested units in 2013). The difference between the market
price of the shares and the cumulative cost for the Company of the vested units in 2014, amounting to $6 million, net of $2 million of
income taxes, was recorded in Retained earnings on the Consolidated balance sheets ($10 million, net of $4 million of income
taxes, for the vested units in 2013).
Starting in 2014, participants meeting a defined share ownership threshold (eligible participants) can elect annually to receive cash
in lieu of shares of the Company in respect to the cycle that will come to maturity the following year (first cycle: 2015), subject to the
Company’s Board of Directors’ approval. As at December 31, 2014, the amount to be settled in cash in 2015, based on confirmed
elections by eligible participants, amounted to $7 million, and was reported in Other liabilities. The cumulative cost of units,
amounting to $6 million, was removed from Contributed surplus. The difference between the market price of the shares and the
cumulative cost for the Company at the date of the Company’s Board of Director’s approval, amounting to $1 million, was recorded
in Retained earnings.
21.2 Employee share purchase plan
The following table shows the movements in restricted common shares under the ESPP during the year.
Table 21.3 – Movements in restricted common shares
As at December 31, 2014
(in units) 2013
(in units)
Outstanding, beginning of year 167,883 141,814 Awarded 155,730 153,322 Vested or forfeited (162,179) (127,253)
Outstanding, end of year 161,434 167,883
The ESPP expense was $11 million for the year ended December 31, 2014 (December 31, 2013 – $9 million).
21.3 Deferred share unit plan
The DSU provision amounted to $7 million as at December 31, 2014 (December 31, 2013 – $5 million). The DSU expense was
$2 million for the year ended December 31, 2014 (December 31, 2013 – $1 million).
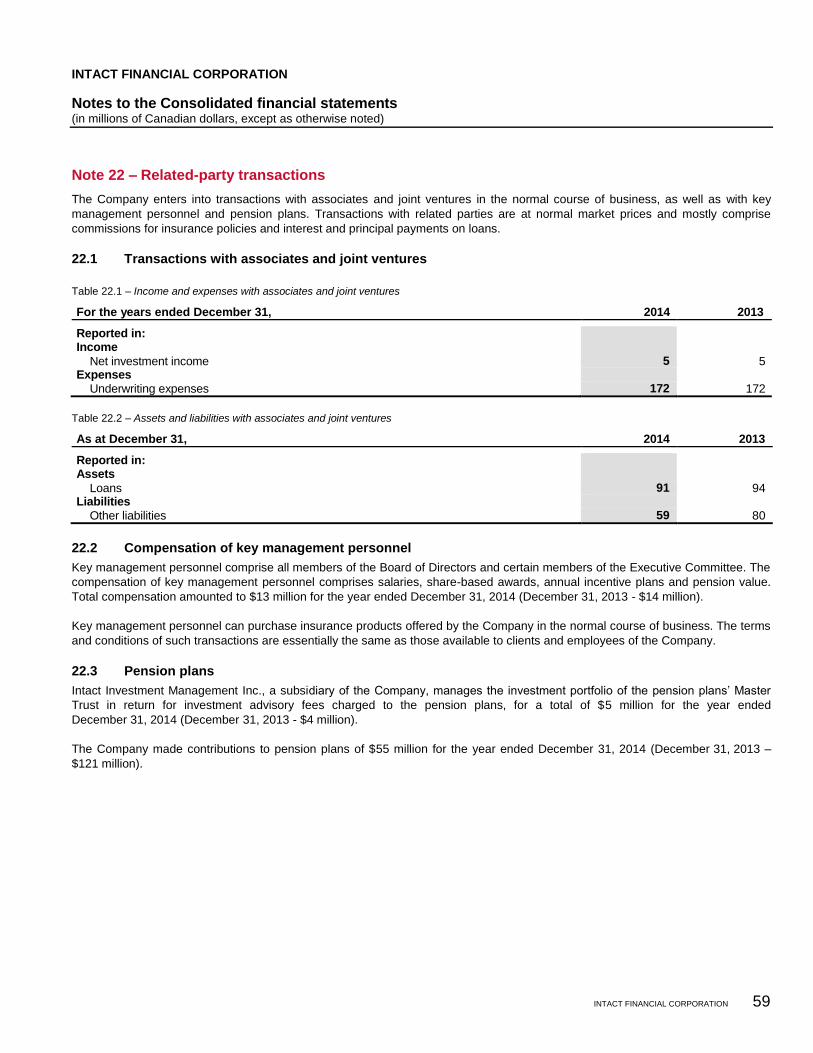
INTACT FINANCIAL CORPORATION
Notes to the Consolidated financial statements (in millions of Canadian dollars, except as otherwise noted)
INTACT FINANCIAL CORPORATION 59
Note 22 – Related-party transactions
The Company enters into transactions with associates and joint ventures in the normal course of business, as well as with key
management personnel and pension plans. Transactions with related parties are at normal market prices and mostly comprise
commissions for insurance policies and interest and principal payments on loans.
22.1 Transactions with associates and joint ventures
Table 22.1 – Income and expenses with associates and joint ventures
For the years ended December 31, 2014 2013
Reported in: Income
Net investment income 5 5 Expenses
Underwriting expenses 172 172
Table 22.2 – Assets and liabilities with associates and joint ventures
As at December 31, 2014 2013
Reported in: Assets
Loans 91 94 Liabilities
Other liabilities 59 80
22.2 Compensation of key management personnel
Key management personnel comprise all members of the Board of Directors and certain members of the Executive Committee. The
compensation of key management personnel comprises salaries, share-based awards, annual incentive plans and pension value.
Total compensation amounted to $13 million for the year ended December 31, 2014 (December 31, 2013 - $14 million).
Key management personnel can purchase insurance products offered by the Company in the normal course of business. The terms
and conditions of such transactions are essentially the same as those available to clients and employees of the Company.
22.3 Pension plans
Intact Investment Management Inc., a subsidiary of the Company, manages the investment portfolio of the pension plans’ Master
Trust in return for investment advisory fees charged to the pension plans, for a total of $5 million for the year ended
December 31, 2014 (December 31, 2013 - $4 million).
The Company made contributions to pension plans of $55 million for the year ended December 31, 2014 (December 31, 2013 –
$121 million).
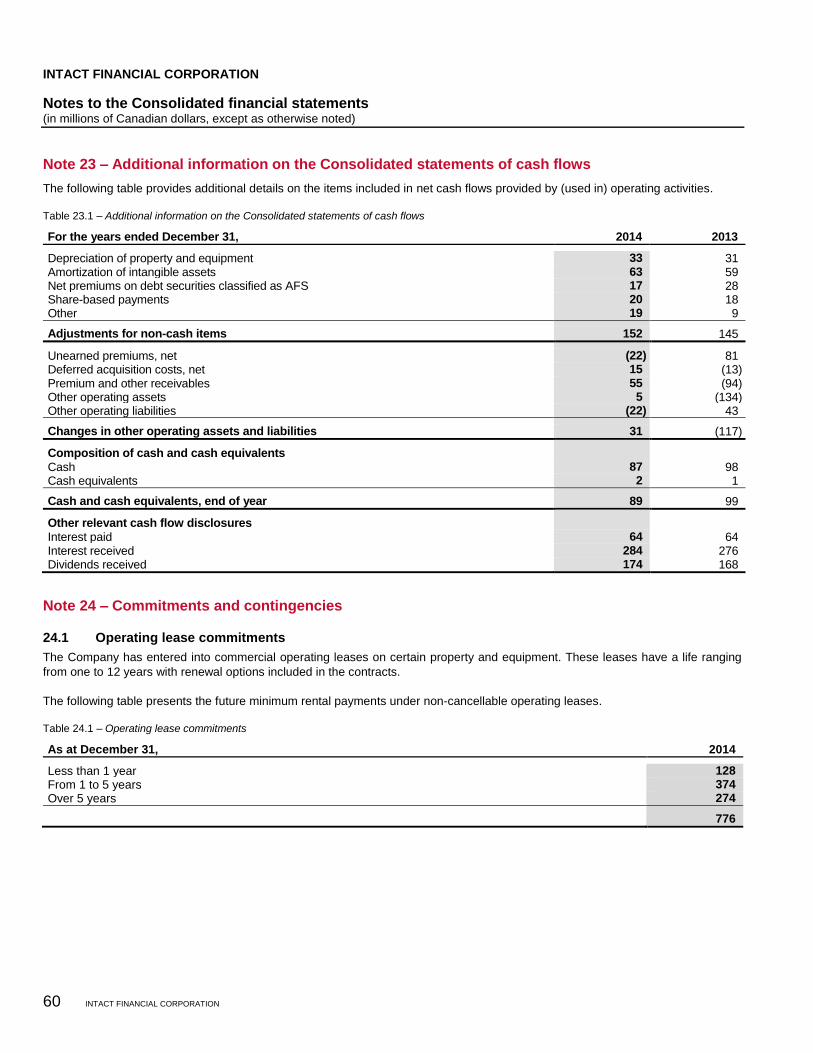
INTACT FINANCIAL CORPORATION
Notes to the Consolidated financial statements (in millions of Canadian dollars, except as otherwise noted)
60 INTACT FINANCIAL CORPORATION
Note 23 – Additional information on the Consolidated statements of cash flows
The following table provides additional details on the items included in net cash flows provided by (used in) operating activities.
Table 23.1 – Additional information on the Consolidated statements of cash flows
For the years ended December 31, 2014 2013
Depreciation of property and equipment 33 31 Amortization of intangible assets 63 59 Net premiums on debt securities classified as AFS 17 28 Share-based payments 20 18 Other 19 9
Adjustments for non-cash items 152 145
Unearned premiums, net (22) 81 Deferred acquisition costs, net 15 (13) Premium and other receivables 55 (94) Other operating assets 5 (134) Other operating liabilities (22) 43
Changes in other operating assets and liabilities 31 (117)
Composition of cash and cash equivalents Cash 87 98 Cash equivalents 2 1
Cash and cash equivalents, end of year 89 99
Other relevant cash flow disclosures Interest paid 64 64 Interest received 284 276 Dividends received 174 168
Note 24 – Commitments and contingencies
24.1 Operating lease commitments
The Company has entered into commercial operating leases on certain property and equipment. These leases have a life ranging
from one to 12 years with renewal options included in the contracts.
The following table presents the future minimum rental payments under non-cancellable operating leases.
Table 24.1 – Operating lease commitments
As at December 31, 2014
Less than 1 year 128
From 1 to 5 years 374
Over 5 years 274
776
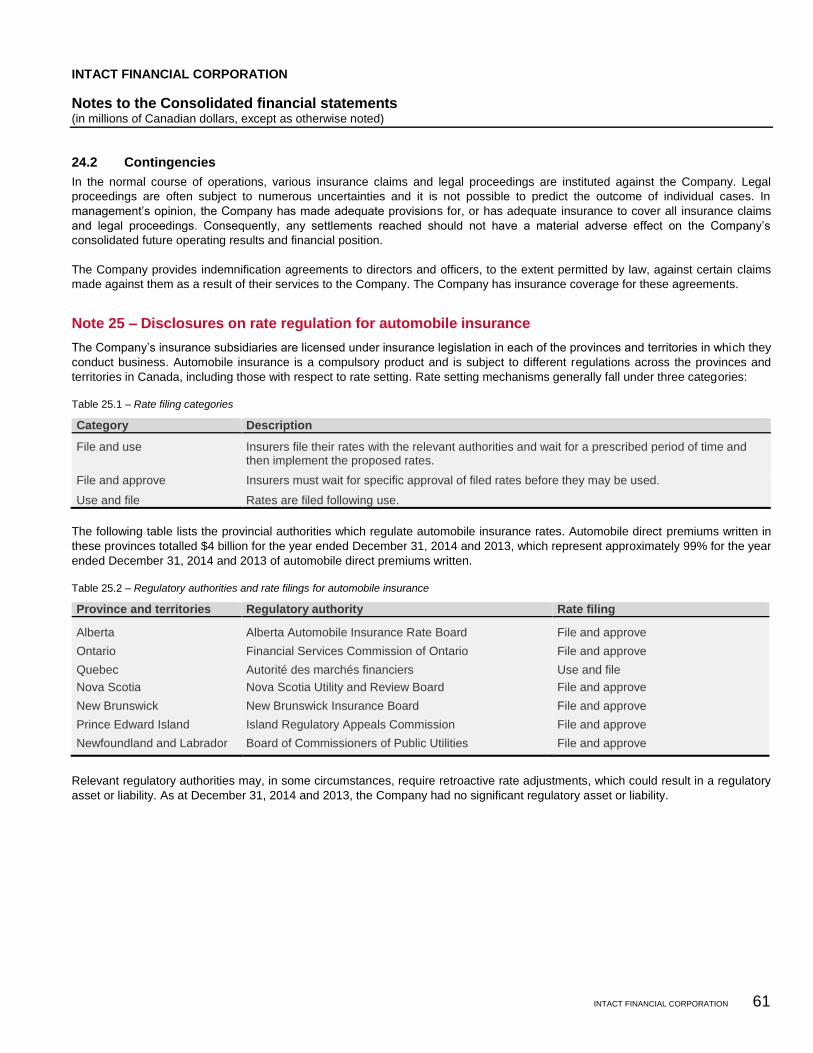
INTACT FINANCIAL CORPORATION
Notes to the Consolidated financial statements (in millions of Canadian dollars, except as otherwise noted)
INTACT FINANCIAL CORPORATION 61
24.2 Contingencies
In the normal course of operations, various insurance claims and legal proceedings are instituted against the Company. Legal
proceedings are often subject to numerous uncertainties and it is not possible to predict the outcome of individual cases. In
management’s opinion, the Company has made adequate provisions for, or has adequate insurance to cover all insurance claims
and legal proceedings. Consequently, any settlements reached should not have a material adverse effect on the Company’s
consolidated future operating results and financial position.
The Company provides indemnification agreements to directors and officers, to the extent permitted by law, against certain claims
made against them as a result of their services to the Company. The Company has insurance coverage for these agreements.
Note 25 – Disclosures on rate regulation for automobile insurance
The Company’s insurance subsidiaries are licensed under insurance legislation in each of the provinces and territories in which they
conduct business. Automobile insurance is a compulsory product and is subject to different regulations across the provinces and
territories in Canada, including those with respect to rate setting. Rate setting mechanisms generally fall under three categories:
Table 25.1 – Rate filing categories
Category Description
File and use Insurers file their rates with the relevant authorities and wait for a prescribed period of time and then implement the proposed rates.
File and approve Insurers must wait for specific approval of filed rates before they may be used.
Use and file Rates are filed following use.
The following table lists the provincial authorities which regulate automobile insurance rates. Automobile direct premiums written in
these provinces totalled $4 billion for the year ended December 31, 2014 and 2013, which represent approximately 99% for the year
ended December 31, 2014 and 2013 of automobile direct premiums written.
Table 25.2 – Regulatory authorities and rate filings for automobile insurance
Province and territories Regulatory authority Rate filing
Alberta Alberta Automobile Insurance Rate Board File and approve
Ontario Financial Services Commission of Ontario File and approve
Quebec Autorité des marchés financiers Use and file
Nova Scotia Nova Scotia Utility and Review Board File and approve
New Brunswick New Brunswick Insurance Board File and approve
Prince Edward Island Island Regulatory Appeals Commission File and approve
Newfoundland and Labrador Board of Commissioners of Public Utilities File and approve
Relevant regulatory authorities may, in some circumstances, require retroactive rate adjustments, which could result in a regulatory
asset or liability. As at December 31, 2014 and 2013, the Company had no significant regulatory asset or liability.
INTACT FINANCIAL CORPORATION
Notes to the Consolidated financial statements (in millions of Canadian dollars, except as otherwise noted)
62 INTACT FINANCIAL CORPORATION
Note 26 – Standards issued but not yet effective
26.1 Financial instruments
IFRS 9 – Financial instruments (“IFRS 9”) is a three-part standard that will replace IAS 39 – Financial instruments: Recognition and
measurement (“IAS 39”). The new standard will reduce complexity by replacing the many different rules in IAS 39. IFRS 9 wil l be
effective for annual periods beginning on or after January 1, 2018. The Company is currently evaluating the impact that this
standard will have on its Consolidated financial statements.
a) Classification and measurement
The classification of financial instruments is dependent of the economic model and the cash flows characteristics.
Table 26.1 – Classification of financial instruments
Amortized cost Fair value through OCI (“FVTOCI”) FVTPL
Default classification when the objective
of the economic model is uniquely to:
Default classification when the objective of
the economic model is equally to:
Default classification for:
− receive contractual cash flows of
principal and interest.
− receive contractual cash flows of principal
and interest; and
− realize cash flows from the sale.
− all other financial assets.
An entity can elect on initial recognition to present fair value changes on an equity investment that is not held for trading directly in
OCI. Dividends on investments for which this election is made must be recognized in profit or loss but gains or losses are not
removed from OCI when the equity investment is disposed of. For financial assets that must be classified as amortized cost or
FVTOCI, an entity can elect to measure them as FVTPL if it eliminates or significantly reduces an accounting mismatch.
b) Hedge accounting
The new model more closely aligns hedge accounting with risk management activities undertaken by companies when hedging their
financial and non-financial risk exposures (IAS 39 allows components of financial items to be hedged, but not components of non-
financial items). It will enable more entities to apply hedge accounting to reflect their actual risk management activities. The new
IFRS 9 model also enables an entity to use information produced internally for risk management purposes as a basis for hedge
accounting, compared to IAS 39 which imposes eligibility and compliance based on metrics that are designed solely for accounting
purposes.
c) Expected credit loss
This new impairment model applies only to financial assets classified as amortised cost and those that are classified by default as FVTOCI. Under the expected credit loss model, all the financial assets concerned will be impaired, and depending of the circumstances, their impairment will correspond to life time expected credit losses or 12-month expected credit losses.
26.2 Revenues from contracts with customers
In May 2014, the IASB issued IFRS 15 – Revenue from Contracts with Customers (“IFRS 15”). The standard supersedes IAS 18 – Revenue, IAS 11 – Construction Contracts, and a number of revenue-related interpretations. IFRS 15 applies to nearly all contracts with customers: main exceptions are insurance contracts, financial instruments and leases. IFRS 15:
− specifies how and when to recognize revenue;
− provides more comprehensive guidance for transactions that were not previously addressed;
− improves guidance for multiple-element arrangements; and
− requires entities to provide users of financial statements with more informative, relevant disclosures.
IFRS 15 is effective for annual periods beginning on or after January 1, 2017, with earlier adoption permitted. The Company does not expect significant impacts upon adoption of this standard.
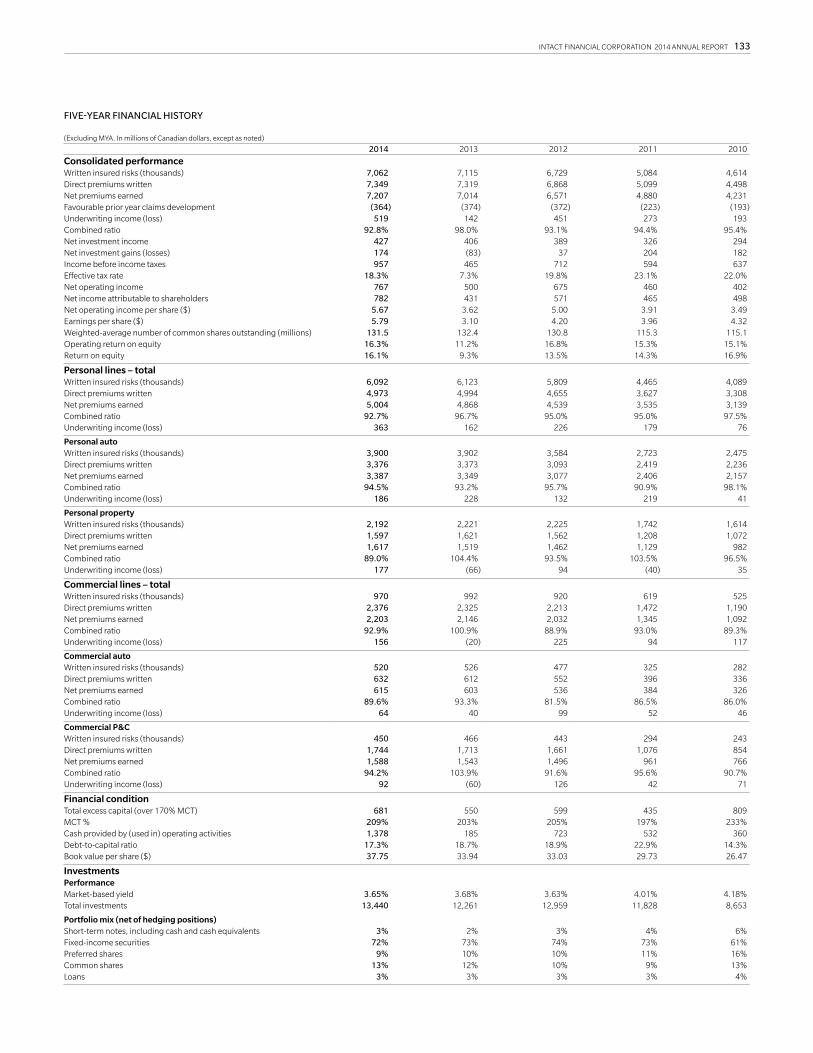
INTACT FINANCIAL CORPORATION 2014 ANNUAL REPORT 133
(Excluding MYA. In millions of Canadian dollars, except as noted) 2014 2013 2012 2011 2010
Consolidated performanceWritten insured risks (thousands) 7,062 7,115 6,729 5,084 4,614Direct premiums written 7,349 7,319 6,868 5,099 4,498Net premiums earned 7,207 7,014 6,571 4,880 4,231Favourable prior year claims development (364) (374) (372) (223) (193)Underwriting income (loss) 519 142 451 273 193Combined ratio 92.8% 98.0% 93.1% 94.4% 95.4%Net investment income 427 406 389 326 294Net investment gains (losses) 174 (83) 37 204 182Income before income taxes 957 465 712 594 637Effective tax rate 18.3% 7.3% 19.8% 23.1% 22.0%Net operating income 767 500 675 460 402Net income attributable to shareholders 782 431 571 465 498Net operating income per share ($) 5.67 3.62 5.00 3.91 3.49Earnings per share ($) 5.79 3.10 4.20 3.96 4.32Weighted-average number of common shares outstanding (millions) 131.5 132.4 130.8 115.3 115.1Operating return on equity 16.3% 11.2% 16.8% 15.3% 15.1%Return on equity 16.1% 9.3% 13.5% 14.3% 16.9%
Personal lines – totalWritten insured risks (thousands) 6,092 6,123 5,809 4,465 4,089Direct premiums written 4,973 4,994 4,655 3,627 3,308Net premiums earned 5,004 4,868 4,539 3,535 3,139Combined ratio 92.7% 96.7% 95.0% 95.0% 97.5%Underwriting income (loss) 363 162 226 179 76
Personal autoWritten insured risks (thousands) 3,900 3,902 3,584 2,723 2,475Direct premiums written 3,376 3,373 3,093 2,419 2,236Net premiums earned 3,387 3,349 3,077 2,406 2,157Combined ratio 94.5% 93.2% 95.7% 90.9% 98.1%Underwriting income (loss) 186 228 132 219 41
Personal propertyWritten insured risks (thousands) 2,192 2,221 2,225 1,742 1,614Direct premiums written 1,597 1,621 1,562 1,208 1,072Net premiums earned 1,617 1,519 1,462 1,129 982Combined ratio 89.0% 104.4% 93.5% 103.5% 96.5%Underwriting income (loss) 177 (66) 94 (40) 35
Commercial lines – totalWritten insured risks (thousands) 970 992 920 619 525Direct premiums written 2,376 2,325 2,213 1,472 1,190Net premiums earned 2,203 2,146 2,032 1,345 1,092Combined ratio 92.9% 100.9% 88.9% 93.0% 89.3%Underwriting income (loss) 156 (20) 225 94 117
Commercial autoWritten insured risks (thousands) 520 526 477 325 282Direct premiums written 632 612 552 396 336Net premiums earned 615 603 536 384 326Combined ratio 89.6% 93.3% 81.5% 86.5% 86.0%Underwriting income (loss) 64 40 99 52 46
Commercial P&CWritten insured risks (thousands) 450 466 443 294 243Direct premiums written 1,744 1,713 1,661 1,076 854Net premiums earned 1,588 1,543 1,496 961 766Combined ratio 94.2% 103.9% 91.6% 95.6% 90.7%Underwriting income (loss) 92 (60) 126 42 71
Financial conditionTotal excess capital (over 170% MCT) 681 550 599 435 809MCT % 209% 203% 205% 197% 233%Cash provided by (used in) operating activities 1,378 185 723 532 360Debt-to-capital ratio 17.3% 18.7% 18.9% 22.9% 14.3%Book value per share ($) 37.75 33.94 33.03 29.73 26.47
InvestmentsPerformanceMarket-based yield 3.65% 3.68% 3.63% 4.01% 4.18%Total investments 13,440 12,261 12,959 11,828 8,653
Portfolio mix (net of hedging positions)Short-term notes, including cash and cash equivalents 3% 2% 3% 4% 6%Fixed-income securities 72% 73% 74% 73% 61%Preferred shares 9% 10% 10% 11% 16%Common shares 13% 12% 10% 9% 13%Loans 3% 3% 3% 3% 4%
FIVE-YEAR FINANCIAL HISTORY
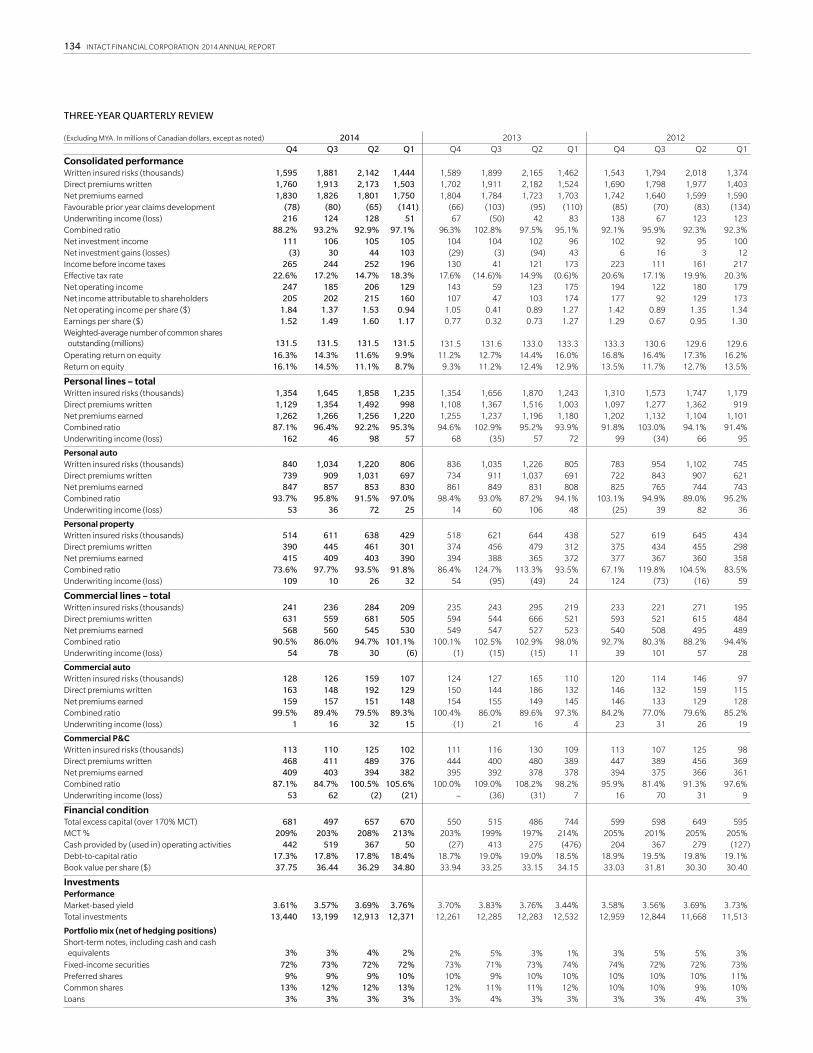
134 INTACT FINANCIAL CORPORATION 2014 ANNUAL REPORT
(Excluding MYA. In millions of Canadian dollars, except as noted) 2014 2013 2012Q4 Q3 Q2 Q1 Q4 Q3 Q2 Q1 Q4 Q3 Q2 Q1
Consolidated performanceWritten insured risks (thousands) 1,595 1,881 2,142 1,444 1,589 1,899 2,165 1,462 1,543 1,794 2,018 1,374Direct premiums written 1,760 1,913 2,173 1,503 1,702 1,911 2,182 1,524 1,690 1,798 1,977 1,403Net premiums earned 1,830 1,826 1,801 1,750 1,804 1,784 1,723 1,703 1,742 1,640 1,599 1,590Favourable prior year claims development (78) (80) (65) (141) (66) (103) (95) (110) (85) (70) (83) (134)Underwriting income (loss) 216 124 128 51 67 (50) 42 83 138 67 123 123Combined ratio 88.2% 93.2% 92.9% 97.1% 96.3% 102.8% 97.5% 95.1% 92.1% 95.9% 92.3% 92.3%Net investment income 111 106 105 105 104 104 102 96 102 92 95 100Net investment gains (losses) (3) 30 44 103 (29) (3) (94) 43 6 16 3 12Income before income taxes 265 244 252 196 130 41 121 173 223 111 161 217Effective tax rate 22.6% 17.2% 14.7% 18.3% 17.6% (14.6)% 14.9% (0.6)% 20.6% 17.1% 19.9% 20.3%Net operating income 247 185 206 129 143 59 123 175 194 122 180 179Net income attributable to shareholders 205 202 215 160 107 47 103 174 177 92 129 173Net operating income per share ($) 1.84 1.37 1.53 0.94 1.05 0.41 0.89 1.27 1.42 0.89 1.35 1.34Earnings per share ($) 1.52 1.49 1.60 1.17 0.77 0.32 0.73 1.27 1.29 0.67 0.95 1.30Weighted-average number of common shares
outstanding (millions) 131.5 131.5 131.5
131.5
131.5
131.6
133.0
133.3
133.3
130.6
129.6
129.6Operating return on equity 16.3% 14.3% 11.6% 9.9% 11.2% 12.7% 14.4% 16.0% 16.8% 16.4% 17.3% 16.2%Return on equity 16.1% 14.5% 11.1% 8.7% 9.3% 11.2% 12.4% 12.9% 13.5% 11.7% 12.7% 13.5%
Personal lines – totalWritten insured risks (thousands) 1,354 1,645 1,858 1,235 1,354 1,656 1,870 1,243 1,310 1,573 1,747 1,179Direct premiums written 1,129 1,354 1,492 998 1,108 1,367 1,516 1,003 1,097 1,277 1,362 919Net premiums earned 1,262 1,266 1,256 1,220 1,255 1,237 1,196 1,180 1,202 1,132 1,104 1,101Combined ratio 87.1% 96.4% 92.2% 95.3% 94.6% 102.9% 95.2% 93.9% 91.8% 103.0% 94.1% 91.4%Underwriting income (loss) 162 46 98 57 68 (35) 57 72 99 (34) 66 95
Personal autoWritten insured risks (thousands) 840 1,034 1,220 806 836 1,035 1,226 805 783 954 1,102 745Direct premiums written 739 909 1,031 697 734 911 1,037 691 722 843 907 621Net premiums earned 847 857 853 830 861 849 831 808 825 765 744 743Combined ratio 93.7% 95.8% 91.5% 97.0% 98.4% 93.0% 87.2% 94.1% 103.1% 94.9% 89.0% 95.2%Underwriting income (loss) 53 36 72 25 14 60 106 48 (25) 39 82 36
Personal propertyWritten insured risks (thousands) 514 611 638 429 518 621 644 438 527 619 645 434Direct premiums written 390 445 461 301 374 456 479 312 375 434 455 298Net premiums earned 415 409 403 390 394 388 365 372 377 367 360 358Combined ratio 73.6% 97.7% 93.5% 91.8% 86.4% 124.7% 113.3% 93.5% 67.1% 119.8% 104.5% 83.5%Underwriting income (loss) 109 10 26 32 54 (95) (49) 24 124 (73) (16) 59
Commercial lines – totalWritten insured risks (thousands) 241 236 284 209 235 243 295 219 233 221 271 195Direct premiums written 631 559 681 505 594 544 666 521 593 521 615 484Net premiums earned 568 560 545 530 549 547 527 523 540 508 495 489Combined ratio 90.5% 86.0% 94.7% 101.1% 100.1% 102.5% 102.9% 98.0% 92.7% 80.3% 88.2% 94.4%Underwriting income (loss) 54 78 30 (6) (1) (15) (15) 11 39 101 57 28
Commercial autoWritten insured risks (thousands) 128 126 159 107 124 127 165 110 120 114 146 97Direct premiums written 163 148 192 129 150 144 186 132 146 132 159 115Net premiums earned 159 157 151 148 154 155 149 145 146 133 129 128Combined ratio 99.5% 89.4% 79.5% 89.3% 100.4% 86.0% 89.6% 97.3% 84.2% 77.0% 79.6% 85.2%Underwriting income (loss) 1 16 32 15 (1) 21 16 4 23 31 26 19
Commercial P&CWritten insured risks (thousands) 113 110 125 102 111 116 130 109 113 107 125 98Direct premiums written 468 411 489 376 444 400 480 389 447 389 456 369Net premiums earned 409 403 394 382 395 392 378 378 394 375 366 361Combined ratio 87.1% 84.7% 100.5% 105.6% 100.0% 109.0% 108.2% 98.2% 95.9% 81.4% 91.3% 97.6%Underwriting income (loss) 53 62 (2) (21) – (36) (31) 7 16 70 31 9
Financial conditionTotal excess capital (over 170% MCT) 681 497 657 670 550 515 486 744 599 598 649 595MCT % 209% 203% 208% 213% 203% 199% 197% 214% 205% 201% 205% 205%Cash provided by (used in) operating activities 442 519 367 50 (27) 413 275 (476) 204 367 279 (127)Debt-to-capital ratio 17.3% 17.8% 17.8% 18.4% 18.7% 19.0% 19.0% 18.5% 18.9% 19.5% 19.8% 19.1%Book value per share ($) 37.75 36.44 36.29 34.80 33.94 33.25 33.15 34.15 33.03 31.81 30.30 30.40
InvestmentsPerformanceMarket-based yield 3.61% 3.57% 3.69% 3.76% 3.70% 3.83% 3.76% 3.44% 3.58% 3.56% 3.69% 3.73%Total investments 13,440 13,199 12,913 12,371 12,261 12,285 12,283 12,532 12,959 12,844 11,668 11,513
Portfolio mix (net of hedging positions)Short-term notes, including cash and cash
equivalents
3%
3%
4%
2%
2%
5%
3%
1%
3%
5%
5%
3%Fixed-income securities 72% 73% 72% 72% 73% 71% 73% 74% 74% 72% 72% 73%Preferred shares 9% 9% 9% 10% 10% 9% 10% 10% 10% 10% 10% 11%Common shares 13% 12% 12% 13% 12% 11% 11% 12% 10% 10% 9% 10%Loans 3% 3% 3% 3% 3% 4% 3% 3% 3% 3% 4% 3%
THREE-YEAR QUARTERLY REVIEW
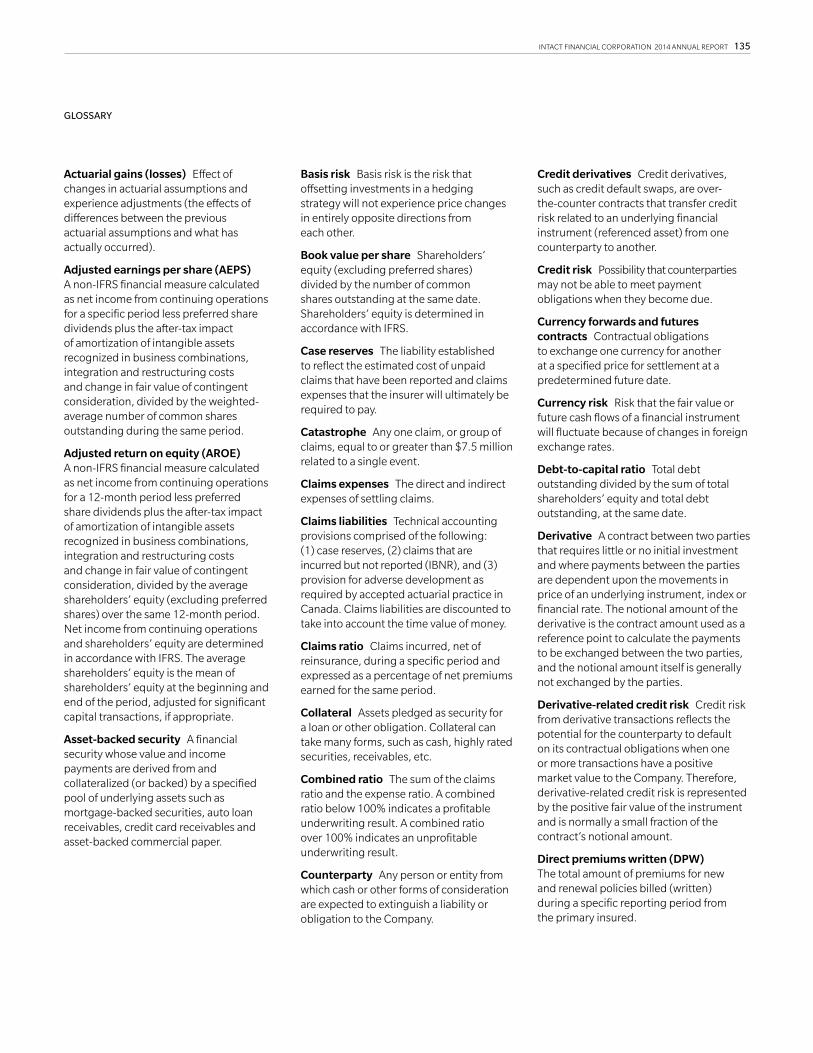
INTACT FINANCIAL CORPORATION 2014 ANNUAL REPORT 135
Actuarial gains (losses) Effect of changes in actuarial assumptions and experience adjustments (the effects of differences between the previous actuarial assumptions and what has actually occurred).
Adjusted earnings per share (AEPS) A non-IFRS financial measure calculated as net income from continuing operations for a specific period less preferred share dividends plus the after-tax impact of amortization of intangible assets recognized in business combinations, integration and restructuring costs and change in fair value of contingent consideration, divided by the weighted-average number of common shares outstanding during the same period.
Adjusted return on equity (AROE) A non-IFRS financial measure calculated as net income from continuing operations for a 12-month period less preferred share dividends plus the after-tax impact of amortization of intangible assets recognized in business combinations, integration and restructuring costs and change in fair value of contingent consideration, divided by the average shareholders’ equity (excluding preferred shares) over the same 12-month period. Net income from continuing operations and shareholders’ equity are determined in accordance with IFRS. The average shareholders’ equity is the mean of shareholders’ equity at the beginning and end of the period, adjusted for significant capital transactions, if appropriate.
Asset-backed security A financial security whose value and income payments are derived from and collateralized (or backed) by a specified pool of underlying assets such as mortgage-backed securities, auto loan receivables, credit card receivables and asset-backed commercial paper.
Basis risk Basis risk is the risk that offsetting investments in a hedging strategy will not experience price changes in entirely opposite directions from each other.
Book value per share Shareholders’ equity (excluding preferred shares) divided by the number of common shares outstanding at the same date. Shareholders’ equity is determined in accordance with IFRS.
Case reserves The liability established to reflect the estimated cost of unpaid claims that have been reported and claims expenses that the insurer will ultimately be required to pay.
Catastrophe Any one claim, or group of claims, equal to or greater than $7.5 million related to a single event.
Claims expenses The direct and indirect expenses of settling claims.
Claims liabilities Technical accounting provisions comprised of the following: (1) case reserves, (2) claims that are incurred but not reported (IBNR), and (3) provision for adverse development as required by accepted actuarial practice in Canada. Claims liabilities are discounted to take into account the time value of money.
Claims ratio Claims incurred, net of reinsurance, during a specific period and expressed as a percentage of net premiums earned for the same period.
Collateral Assets pledged as security for a loan or other obligation. Collateral can take many forms, such as cash, highly rated securities, receivables, etc.
Combined ratio The sum of the claims ratio and the expense ratio. A combined ratio below 100% indicates a profitable underwriting result. A combined ratio over 100% indicates an unprofitable underwriting result.
Counterparty Any person or entity from which cash or other forms of consideration are expected to extinguish a liability or obligation to the Company.
Credit derivatives Credit derivatives, such as credit default swaps, are over-the-counter contracts that transfer credit risk related to an underlying financial instrument (referenced asset) from one counterparty to another.
Credit risk Possibility that counterparties may not be able to meet payment obligations when they become due.
Currency forwards and futures contracts Contractual obligations to exchange one currency for another at a specified price for settlement at a predetermined future date.
Currency risk Risk that the fair value or future cash flows of a financial instrument will fluctuate because of changes in foreign exchange rates.
Debt-to-capital ratio Total debt outstanding divided by the sum of total shareholders’ equity and total debt outstanding, at the same date.
Derivative A contract between two parties that requires little or no initial investment and where payments between the parties are dependent upon the movements in price of an underlying instrument, index or financial rate. The notional amount of the derivative is the contract amount used as a reference point to calculate the payments to be exchanged between the two parties, and the notional amount itself is generally not exchanged by the parties.
Derivative-related credit risk Credit risk from derivative transactions reflects the potential for the counterparty to default on its contractual obligations when one or more transactions have a positive market value to the Company. Therefore, derivative-related credit risk is represented by the positive fair value of the instrument and is normally a small fraction of the contract’s notional amount.
Direct premiums written (DPW) The total amount of premiums for new and renewal policies billed (written) during a specific reporting period from the primary insured.
GLOSSARY
136 INTACT FINANCIAL CORPORATION 2014 ANNUAL REPORT
Earnings per share to common shareholders (EPS), basic Calculated as net income attributable to common shareholders divided by the weighted-average number of common shares outstanding during the same period.
Earnings per share to common shareholders (EPS), diluted Calculated as net income attributable to common shareholders divided by the weighted-average number of common shares outstanding during the same period, adjusted for the dilutive effect of stock options and other convertible securities.
Equities sold short A transaction in which the seller sells equities and then borrows the equities in order to deliver them to the purchaser upon settlement. At a later date, the seller buys identical equities in the market to replace the borrowed securities.
Equity price risk Equity price risk is the risk of losses arising from movements in equity market prices.
Excess capital Excess capital in the P&C insurance subsidiaries at 170% minimum capital test (MCT) plus net liquid assets of the non-regulated entities.
Expense ratio Underwriting expenses including commissions, premium taxes and general expenses incurred in connection with underwriting activities during a specific period and expressed as a percentage of net premiums earned for the same period.
Facility Association The Facility Association is an entity established by the automobile insurance industry to ensure that automobile insurance is available to all owners and licensed drivers of motor vehicles where such owners or drivers are unable to obtain automobile insurance through the private insurance market. The Facility Association serves the following provinces and territories: Alberta, New Brunswick, Newfoundland and Labrador, Northwest Territories, Nova Scotia, Nunavut, Ontario, Prince Edward Island and Yukon.
Fair value The amount of consideration that would be agreed upon in an arm’s length transaction between knowledgeable, willing parties who are under no compulsion to act.
Forwards Forward contracts are effectively tailor-made agreements that are transacted between counterparties in the over-the-counter market.
Frequency (of claims) Total number of claims reported in a specific period.
Futures Standardized contracts with respect to amounts and settlement dates, and traded on regular futures exchanges.
Hedge A risk management technique used to insulate financial results from market, interest rate or foreign currency exchange risk (exposure) arising from normal investing operations. The elimination or reduction of such exposure is accomplished by establishing offsetting or “hedging” positions.
Incurred but not reported (IBNR) claims reserve Reserves (accounting provisions) for estimated claims that have been incurred but not yet reported by policyholders including a reserve for future developments on claims which have been reported.
Industry pools Industry pools consist of the “residual market” as well as risk-sharing pools (RSP) in Alberta, Ontario, Québec, New Brunswick and Nova Scotia. These pools are managed by the Facility Association, except for the Québec RSP.
Interest rate forwards and futures contracts Contractual obligations to buy or sell interest-rate-sensitive financial instruments at a predetermined future date at a specified price.
Interest rate risk Interest rate risk is the risk that the fair value or future cash flows of a financial instrument will fluctuate because of changes in market interest rates.
Internal rate of return (IRR) The rate of return expected to be produced on the shareholders’ capital deployed over the life of a project or acquisition.
International Financial Reporting Standards (IFRS) As issued by the International Accounting Standards Board (IASB). The term “IFRS” includes IFRS and interpretations developed by the International Financial Reporting Interpretations Committee (IFRIC).
Investments or investment portfolio Financial assets owned by the Company including debt and equity securities and loans.
Liquidity risk Liquidity risk is the risk that an entity will encounter difficulty in raising funds to meet obligations associated with financial liabilities.
Market-based yield Non-IFRS financial measure defined as the annualized total pre-tax investment income (before expenses) divided by the average fair values of net equity and fixed-income securities held during the reporting period.
Market yield adjustment (MYA) The impact of changes in the discount rate used to discount claims liabilities based on the change in the market-based yield of the underlying assets.
Master netting agreement An agreement between the Company and a counterparty designed to reduce the credit risk of derivative transactions through the creation of a legal right to offset the exposure in the event of a default.
Minimum capital test (MCT) Ratio of available capital to required capital. Federally regulated property and casualty insurers, including our Canadian insurance subsidiaries, must meet a minimum capital test that assesses the insurer’s available capital in relation to its required capital and requires that available capital equal at least the minimum capital requirement. OSFI expects insurers to establish a target capital level above the minimum requirement, and maintain ongoing capital, at no less than the supervisory target of 150% of required capital under MCT. The Company has an internal operating target of 170%.
GLOSSARY

INTACT FINANCIAL CORPORATION 2014 ANNUAL REPORT 137
Net operating income (NOI) A non-IFRS financial measure calculated as net income from continuing operations for a specific period less preferred share dividends, plus the after-tax impact of amortization of intangible assets recognized in business combinations, integration and restructuring costs, change in fair value of contingent consideration, net investment gains (losses), difference between expected return and discount rate on pension assets, and MYA.
Net operating income per share (NOIPS) A non-IFRS financial measure calculated as net operating income for a specific period less preferred share dividends, divided by the weighted-average number of common shares outstanding during the same period.
Net premiums earned Premiums written that are recognized for accounting purposes as revenue earned during a period.
Net premiums written Direct premiums written for a given period less premiums ceded to reinsurers during the same period.
Normal course issuer bid (NCIB) A program for the repurchase of the Company’s own common shares, for cancellation through a stock exchange that is subject to the various rules of the relevant stock exchange and securities commission.
Notional amount The contract amount used as a reference point to calculate cash payments for derivatives.
Operating return on equity (OROE) A non-IFRS financial measure calculated as net operating income for the last 12 months divided by the average shareholders’ equity (excluding preferred shares and accumulated other comprehensive income) over the same 12-month period. The average shareholders’ equity is the mean of shareholders’ equity at the beginning and the end of the period, adjusted for significant capital transactions, if appropriate.
Options Contractual agreements under which the seller grants to the buyer the right, but not the obligation, either to buy (call option) or sell (put option) an asset (underlying asset) at a predetermined price, at or by a specified future date.
Prior year claims development Change in total prior year claims liabilities in a given period. A reduction to claims liabilities is called favourable prior year claims development. An increase in claims liabilities is called unfavourable prior year claims development.
Provision for adverse deviation (PfAD) An amount added to undiscounted case reserves and IBNR to account for adverse deviation from claims reserve estimates.
Reinstatement premium Premium payable to restore the original reinsurance policy limit as a result of a reinsurance loss payment under a catastrophe cover. Reinstatement premiums are reported in Net premiums earned.
Reinsurer An insurance company that agrees to indemnify another insurance or reinsurance company, the ceding company, against all or a portion of the insurance or reinsurance risks underwritten by the ceding company, under one or more policies.
Return on equity (ROE) Net income for a 12-month period less preferred share dividends, divided by the average shareholders’ equity (excluding preferred shares) over the same 12-month period. Net income and shareholders’ equity are determined in accordance with IFRS. The average shareholders’ equity is the mean of shareholders’ equity at the beginning and the end of the period, adjusted for significant capital transactions, if appropriate.
Securities lending Transactions in which the owner of a security agrees to lend it under the terms of a prearranged contract to a borrower for a fee. The borrower must collateralize the security loan at all times.
Severity (of claims) Average cost of a claim calculated by dividing the total cost of claims by the total number of claims.
Shareholders’ equity Capital invested by the shareholders via share capital and contributed surplus, plus retained earnings and accumulated other comprehensive income (loss).
Structured settlements Periodic payments to claimants for a determined number of years for life, typically in settlement for a claim under a liability policy, usually funded through the purchase of an annuity.
Swaps, including currency and total return swaps Over-the-counter contracts in which two counterparties exchange a series of cash flows based on agreed upon rates such as exchange rates or value of an equity index applied to a contract notional amount.
Underlying current year loss ratio A non-IFRS financial measure calculated as current year claims ratio excluding catastrophe losses, reinstatement premiums and prior year claims development.
Underlying growth Growth in DPW normalized for the effect of multi-year policies. This measure matches DPW to accident year, whereas under IFRS, the full value of multi-year policies is recognized in the year the policy is written.
Underwriting income Net premiums earned less net claims incurred, commissions, premium taxes and general expenses (excluding MYA).
Written insured risks The number of vehicles in automobile insurance, the number of premises in personal property insurance and the number of policies in commercial insurance (excluding commercial auto insurance).

138 INTACT FINANCIAL CORPORATION 2014 ANNUAL REPORT
Charles Brindamour Chief Executive Officer
Yves Brouillette 1,4
President, Placements Beluca Inc.
Robert W. Crispin 1,4
Corporate Director
Janet De Silva 2,4
President and Chief Executive Officer, Toronto Region Board of Trade
Claude DussaultChairman of the Board and President, ACVA Investing Corporation
Eileen Mercier 1,4
Corporate Director
Timothy H. Penner 2,4
Corporate Director
Louise Roy 2,3
Chancellor and Chair of the Board, Université de Montréal and Invited Fellow, Centre for Interuniversity Research and Analysis on Organizations
Frederick Singer 1,3
CEO of Echo360
Stephen Snyder 1,3
Corporate Director
Carol Stephenson 2,3
Corporate Director
Charles Brindamour Chief Executive Officer
Patrick Barbeau Senior Vice President, Personal Lines
Martin Beaulieu Senior Vice President and Chief Operating Officer, Direct-to-Consumer Distribution
Alan Blair Senior Vice President, Atlantic Canada
Jean-François Blais President, Intact Insurance
Debbie Coull-Cicchini Senior Vice President, Ontario
Jean-François DesautelsSenior Vice President, Québec
Claude Désilets Senior Vice President and Chief Risk Officer
Monika Federau Senior Vice President and Chief Strategy Officer
Anne Fortin Senior Vice President, Marketing and Strategic Relationships, Direct-to-Consumer Distribution
Louis Gagnon President, Service and Distribution
Françoise Guénette Senior Vice President, Corporate and Legal Services, and Secretary
Byron Hindle Senior Vice President, International Business Development
Mathieu Lamy Senior Vice President, Claims
Alain Lessard Senior Vice President, Commercial Lines
Louis Marcotte Senior Vice President and Chief Financial Officer
Lucie Martel Senior Vice President and Chief Human Resources Officer
Benoit MorissetteSenior Vice President and Chief Internal Auditor
Jennie Moushos Senior Vice President, Western Canada
Werner Muehlemann Senior Vice President and Managing Director of Intact Investment Management
Jack Ott Senior Vice President and Chief Information Officer
Lilia Sham Senior Vice President, Corporate Development
Mark A. Tullis Executive Vice President, Governance and Capital Management
Peter Weightman President, BrokerLink
Notes:1 Denotes member of the Audit Committee
2 Denotes member of the Compliance Review and Corporate Governance Committee
3 Denotes member of the Human Resources and Compensation Committee
4 Denotes member of the Risk Management Committee
For complete biographies of the members of the Board of Directors, please see theManagement Proxy Circular which may be found on the SEDAR website at www.sedar.com.
BOARD OF DIRECTORS EXECUTIVE COMMITTEE MEMBERS
Con
cep
t an
d D
esig
n: T
HE
WO
RK
S D
ES
IGN
CO
MM
UN
ICA
TIO
NS
ww
w.w
ork
sdes
ign
.co
m
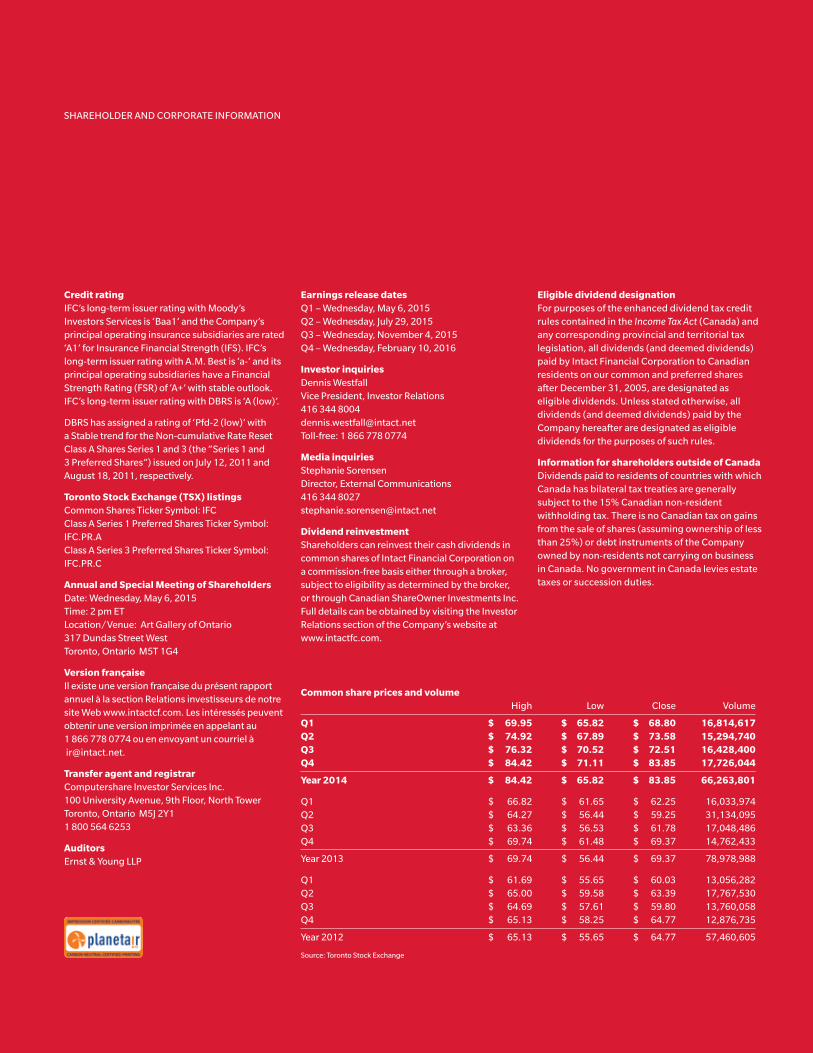
Credit ratingIFC’s long-term issuer rating with Moody’s Investors Services is ‘Baa1’ and the Company’s principal operating insurance subsidiaries are rated ‘A1’ for Insurance Financial Strength (IFS). IFC’s long-term issuer rating with A.M. Best is ‘a-’ and its principal operating subsidiaries have a Financial Strength Rating (FSR) of ‘A+’ with stable outlook. IFC’s long-term issuer rating with DBRS is ‘A (low)’.
DBRS has assigned a rating of ‘Pfd-2 (low)’ with a Stable trend for the Non-cumulative Rate Reset Class A Shares Series 1 and 3 (the “Series 1 and 3 Preferred Shares”) issued on July 12, 2011 and August 18, 2011, respectively.
Toronto Stock Exchange (TSX) listingsCommon Shares Ticker Symbol: IFC Class A Series 1 Preferred Shares Ticker Symbol: IFC.PR.A Class A Series 3 Preferred Shares Ticker Symbol: IFC.PR.C
Annual and Special Meeting of ShareholdersDate: Wednesday, May 6, 2015 Time: 2 pm ET Location/Venue: Art Gallery of Ontario 317 Dundas Street West Toronto, Ontario M5T 1G4
Version françaiseIl existe une version française du présent rapport annuel à la section Relations investisseurs de notre site Web www.intactcf.com. Les intéressés peuvent obtenir une version imprimée en appelant au 1 866 778 0774 ou en envoyant un courriel à [email protected].
Transfer agent and registrarComputershare Investor Services Inc. 100 University Avenue, 9th Floor, North Tower Toronto, Ontario M5J 2Y1 1 800 564 6253
AuditorsErnst & Young LLP
Earnings release datesQ1 – Wednesday, May 6, 2015 Q2 – Wednesday, July 29, 2015 Q3 – Wednesday, November 4, 2015 Q4 – Wednesday, February 10, 2016
Investor inquiriesDennis Westfall Vice President, Investor Relations 416 344 8004 [email protected] Toll-free: 1 866 778 0774
Media inquiriesStephanie Sorensen Director, External Communications 416 344 8027 [email protected]
Dividend reinvestmentShareholders can reinvest their cash dividends in common shares of Intact Financial Corporation on a commission-free basis either through a broker, subject to eligibility as determined by the broker, or through Canadian ShareOwner Investments Inc. Full details can be obtained by visiting the Investor Relations section of the Company’s website at www.intactfc.com.
Eligible dividend designationFor purposes of the enhanced dividend tax credit rules contained in the Income Tax Act (Canada) and any corresponding provincial and territorial tax legislation, all dividends (and deemed dividends) paid by Intact Financial Corporation to Canadian residents on our common and preferred shares after December 31, 2005, are designated as eligible dividends. Unless stated otherwise, all dividends (and deemed dividends) paid by the Company hereafter are designated as eligible dividends for the purposes of such rules.
Information for shareholders outside of Canada Dividends paid to residents of countries with which Canada has bilateral tax treaties are generally subject to the 15% Canadian non-resident withholding tax. There is no Canadian tax on gains from the sale of shares (assuming ownership of less than 25%) or debt instruments of the Company owned by non-residents not carrying on business in Canada. No government in Canada levies estate taxes or succession duties.
Common share prices and volume High Low Close Volume
Q1 $ 69.95 $ 65.82 $ 68.80 16,814,617Q2 $ 74.92 $ 67.89 $ 73.58 15,294,740Q3 $ 76.32 $ 70.52 $ 72.51 16,428,400Q4 $ 84.42 $ 71.11 $ 83.85 17,726,044
Year 2014 $ 84.42 $ 65.82 $ 83.85 66,263,801
Q1 $ 66.82 $ 61.65 $ 62.25 16,033,974Q2 $ 64.27 $ 56.44 $ 59.25 31,134,095Q3 $ 63.36 $ 56.53 $ 61.78 17,048,486Q4 $ 69.74 $ 61.48 $ 69.37 14,762,433
Year 2013 $ 69.74 $ 56.44 $ 69.37 78,978,988
Q1 $ 61.69 $ 55.65 $ 60.03 13,056,282Q2 $ 65.00 $ 59.58 $ 63.39 17,767,530Q3 $ 64.69 $ 57.61 $ 59.80 13,760,058Q4 $ 65.13 $ 58.25 $ 64.77 12,876,735
Year 2012 $ 65.13 $ 55.65 $ 64.77 57,460,605
Source: Toronto Stock Exchange
SHAREHOLDER AND CORPORATE INFORMATION

Intact Financial Corporation700 University Ave.Toronto, OntarioM5G 0A1www.intactfc.com
OUR VALUES
We behave with integrity
We are customer driven
We are socially responsible
We strive for excellence
We respect each other
VIEW OUR ONLINE REPORT reports.intactfc.com/2014
INTA
CT FIN
AN
CIA
L CO
RP
OR
ATIO
N 2
01
4 A
NN
UA
L RE
PO
RT