in vitro–in vivo and pharmacokinetic evaluation of solid
TRANSCRIPT

RSC Advances
PAPER
Ope
n A
cces
s A
rtic
le. P
ublis
hed
on 0
3 Ju
ly 2
017.
Dow
nloa
ded
on 1
0/14
/202
1 7:
37:1
0 PM
. T
his
artic
le is
lice
nsed
und
er a
Cre
ativ
e C
omm
ons
Attr
ibut
ion-
Non
Com
mer
cial
3.0
Unp
orte
d L
icen
ce.
View Article OnlineView Journal | View Issue
In vitro–in vivo a
aDepartment of Pharmaceutical Sciences and
Mesra, Ranchi-835215, Jharkhand, India. E-
com; Tel: +91 092 3465 3731; +82 010 4356bMarine Bioprocess Research Centre and
Science, Pukyong National University, 36
Republic of KoreacKolmar Korea Co., Ltd., 18, Saimdang-ro,
KoreadDepartment of Marine Life Sciences, Kore
Taejong-ro, Yeongdo-Gu, Busan 49112, RepueDepartment of Pharmacy, Birla Institute of T
India
Cite this: RSC Adv., 2017, 7, 33314
Received 9th April 2017Accepted 12th June 2017
DOI: 10.1039/c7ra04038e
rsc.li/rsc-advances
33314 | RSC Adv., 2017, 7, 33314–3332
nd pharmacokinetic evaluation ofsolid lipid nanoparticles of furosemide usingGastroplus™
Hasan Ali,a Priya Ranjan Prasad Verma,a Sunil Kumar Dubey,e
Jayachandran Venkatesan,c Youngwan Seo,d Se-Kwon Kim *cd
and Sandeep Kumar Singh *ab
In this work, we conducted pharmacokinetic studies and established the in vitro and in vivo correlation
(IVIVC) of furosemide (FRS) loaded solid lipid nanoparticles (FSLN). A bioanalytical method using RP-
HPLC was developed and validated to evaluate the pharmacokinetic properties of FSLN and FRS
suspension (FSP). The pharmacokinetic parameters were analyzed using various pharmacokinetic
compartment models (one, two and three) and non-compartmental analysis. The IVIVC was
accomplished using numerical deconvolution (single Weibull and double Weibull), the Wagner-Nelson
(one compartment model) and the Loo-Riegelman method (two and three compartment model) via
GastroPlus™ software. The method was developed and successfully validated for the quantification of
FRS in plasma. An enhancement in Cmax from 2261.7 ng mL�1 (FSP) to 3604.7 ng mL�1 FSLN, and AUC0/
24 from 10 130 ng h mL�1 (FSP) to 17 077 ng h mL�1 (FSLN) indicated an enhancement in the oral
bioavailability of FRS when given in the form of SLN. In the statistical analysis, the Loo-Riegelman
method was found to be the best-fit deconvolution method for establishing the IVIVC of FSLN. As an
innovative approach, having more restrictive and conclusive IVIVC, the entire plasma profile of the
convoluted and observed was divided into three time phases, (i) 0 / 0.5 h, (ii) 0.5 / 3 h and (iii) 3 /
24 h, and statistically analyzed to demonstrate IVIVC. The study showed that FSLN could be a potential
drug carrier for the delivery of FRS with improved bioavailability.
Introduction
Oral formulations are the most widely used and desirabledosage forms because of their ease of administration, accom-panied by greater convenience to patients. However, they aresubject to low systemic absorption of drug candidatesbelonging to class II of the biopharmaceutical classicationsystem (BCS) and have solubility issues. Furthermore, the issueof formulation development is even more challenging for theBCS class IV drug candidates that are both less soluble and have
Technology, Birla Institute of Technology,
mail: dr.sandeep_pharmaceutics@yahoo.
2918
Department of Marine Bio-convergence
5 Sinseon-ro, Nam-gu, Busan, 608739,
Seocho-Gu, Seoul, 137876, Republic of
an Maritime and Ocean University, 727
blic of Korea
echnology and Science, Pilani, Rajasthan,
6
poor permeability issues, causing low bioavailability and highintra- and inter-subject variability.1,2
With the advent of nanomedicine, continuous research effortsare underway to minimize undesirable side effects and improvethe therapeutic efficacy.3 A plethora of research approaches (e.g.polymeric nanoparticles, liposomes, nanocrystals, nano-emulsions, micelles and mixed micelles) have been employed toovercome problems associated with BCS II and IV drugs.3,4
However, deciencies of harmless polymers with regulatorycompliance and high price have restricted the extensive appli-cations of polymeric nanoparticles in clinical medicine.5–7 Toovercome these restrictions, lipids have been used as a materialof choice for the development of solid lipid nanoparticles(SLN).8,9 Analogous to nanoemulsions, SLN make up a colloidaldrug delivery system that employs solidied lipids, such as highmelting fatty acids, glycerides or waxes.3,10 Furthermore, SLNs arestabilized by using surfactant(s) (natural/synthetic) that arebiocompatible and biodegradable and belong to the generallyrecognized as safe (GRAS) category.3,11,12 Additionally, SLNs havesome other advantages such as (i) enhanced bio-absorption ofencapsulated drug, (ii) ability to modify the drug releasebehavior, (iii) improvement of tissue distribution and (iv) drugtargeting via surface engineering.13,14
This journal is © The Royal Society of Chemistry 2017
Paper RSC Advances
Ope
n A
cces
s A
rtic
le. P
ublis
hed
on 0
3 Ju
ly 2
017.
Dow
nloa
ded
on 1
0/14
/202
1 7:
37:1
0 PM
. T
his
artic
le is
lice
nsed
und
er a
Cre
ativ
e C
omm
ons
Attr
ibut
ion-
Non
Com
mer
cial
3.0
Unp
orte
d L
icen
ce.
View Article Online
Furosemide (FRS) is a high ceiling diuretic given in themanagement of edema linked with cardiac, renal, and hepaticfailure and the treatment of hypertension. It is a BCS class IV drugbecause of its low solubility and low permeability, which result inreduced bioavailability.15,16 FRS acts by inhibiting the reabsorptionof sodium and chloride in the ascending loop of Henle and distaltubules. Peak plasma drug concentrations (Cmax) occur between 1to 1.5 h, with variable bioavailability and low permeability, whichresult in reduced bioavailability.15–17 The dosage form, underlyingdisease conditions and food substantially inuence the rate andextent of bioavailability following oral administration. Thepermeability and drug delivery related concerns of FRS have beenaddressed using various formulation maneuvers. The recentstudies employing nanosuspensions,18 chitosan coated lipo-somes,19 colloidal carriers (niosome encapsulated self-microemulsifying drug delivery system),20 polyamidoamine den-drimer complexes,21 proniosomes,22 supramolecular complexes,solid dispersion, co-crystals, and micro-emulsions are well docu-mented in literature.23–26
The rst objective of this investigation was to develop andvalidate a bioanalytical method to estimate the pharmacoki-netics of FRS loaded SLN (FSLN) and FRS suspensions (FSP)using the RP-HPLC method. The second objective was tocompare the pharmacokinetics of FSLN and FSP and select theappropriate pharmacokinetic model, followed by in vitro and invivo correlation (IVIVC). We used the GastroPlus™ soware toevaluate the pharmacokinetic parameters of FSLN and FSP.Furthermore, the IVIVCPlus™ module of the GastroPlus™soware was used to estimate the correlation function to selectthe best-t IVIVC model employing various deconvolutionmethods. The plasma drug concentration–time prole wasreconstructed from in vitro drug release data and then predictedin order to establish the correlation between in vitro drugrelease and systemic availability (convolution).
Materials and methodsMaterials
Furosemide and Venlafaxine hydrochloride (as an internalstandard, IS) were obtained from Unicure India Limited, India,as a gi sample. Compritol 888 ATO (CMP), a mixture of mono-,di- and triglycerides of behenic acid (glyceryl behenate), wasa kind gi from Gattefosse, France. Cremophor RH 40 (CRH40),a mixture of hydrogenated vegetable fatty acids with a chainlength of 10–18 carbon atoms, was a generous gi from BASF,UK. HPLC grade acetonitrile, methanol and analytical gradehydrochloric acid, sodium hydroxide pellets and sodium dihy-drogen phosphate were obtained from Merck India Limited,Mumbai, India. An electronic balance (AG-135, Mettler-Toledo,Germany), pH meter (pH Testr, Eutech Instruments, Singapore)and a sonicator (Takashi, Japan, Tokyo) were also used.
Methods
Preparation of SLN. The SLN was fabricated using the phase-inversion temperature (PIT) technique as reported earlier.10
Accurately weighed CMP and CRH40 were heated in a glass
This journal is © The Royal Society of Chemistry 2017
beaker and mixed together until a clear mixture was obtained(10 �C above the melting point of the solid lipid). Hot aqueousphase (Millipore water), was slowly added with continuousstirring on a magnetic stirrer (IKA, Germany) at 350 rpm, then itwas allowed to cool to room temperature to obtain a transparentcolloidal dispersion of SLN.
Chromatographic system and conditions. The chromato-graphic system used to perform the method development andvalidation consisted of an LC-20AD quaternary pump, an SPD-M20A photodiode array detector (PDA), and SIL 20 AC auto-sampler, connected to a communication & bus module CBM20A (Shimadzu, Kyoto, Japan). Chromatographic analysis wasperformed on an Agilent column (150 � 4.6 mm internaldiameter, 5.0 mm particle size) Agilent Technologies, California,USA. Separation was performed using amobile phase of sodiumdihydrogen phosphate (20 mM, pH 4): acetonitrile (35 : 65, v/v)at a ow rate of 1.0 mL min�1. The eluent was monitored usinga PDA detector at wavelength 229 nm for FRS. The column wasmaintained at ambient temperature and an injection volume of50.0 mL was used.
Preparation of stock and standards. The primary stocksolution was prepared by dissolving 10 mg of FRS in a 10 mLvolumetric ask containing methanol, and the volume wasmade up to 10 mL to obtain the stock of 1 mg mL�1 of FRS inmethanol. Plasma standards of FRS in the range of 100–5000 ngmL�1 were prepared. Aerwards, four quality control (QC)samples were prepared at the lower limit of quantication(LLOQ ¼ 105.6 ng mL�1), low (LQC ¼ 302 ng mL�1), medium(MQC¼ 2520 ngmL�1) and high (HQC¼ 4200 ng mL�1) qualitycontrol levels. The prepared bio-samples were then processed asdescribed in the sample preparation section and analyzed bythe proposed method with an IS of 1 ppm.
Analyte extraction from plasma. The solid phase extraction(SPE) method was used to extract the analyte from the plasmasample. Oasis HLB (Hydrophilic Lipophilic Balance) cartridges,supplied by Waters Corporation, USA, were used. The cartridgeswere conditioned with methanol (1 mL) and equilibrated withdeionized water (1 mL). Mobile phase (200 mL) and 5% v/v for-mic acid (100 mL) were added to the prepared sample (500 mL).Aer vortexing for 5 min the sample was loaded onto thecartridges. The cartridges were then washed with 5% meth-anolic aqueous solution (1 mL) and nally eluted withmethanol(1 mL). The eluates were evaporated to dryness. The obtainedresidues were then reconstituted in 500 mL of the mobile phase.
Drug administration and sample collection. To study thepharmacokinetic parameters of the FSLN and FSP, maleSprague-Dawley rats (200–250 gm) were used. The rats wererandomly separated into two groups: the control group to betreated by FSP, and the test group treated by FSLN; each con-sisting of six animals. The animals were housed under standardconditions (24� 2 �C, 60% RH), and water was given ad libitum.No food was supplied 18 hours prior to dosing. This study wasperformed in accordance with CPCSEA (Committee for thePurpose of Control and Supervision of Experiments on Animals)guidelines and was approved by the Institutional Animal EthicsCommittee (BIT/PH/IAEC/10/2015) of BIT, Mesra. The controlgroup received FSP (prepared in 0.5% sodium carboxymethyl
RSC Adv., 2017, 7, 33314–33326 | 33315

RSC Advances Paper
Ope
n A
cces
s A
rtic
le. P
ublis
hed
on 0
3 Ju
ly 2
017.
Dow
nloa
ded
on 1
0/14
/202
1 7:
37:1
0 PM
. T
his
artic
le is
lice
nsed
und
er a
Cre
ativ
e C
omm
ons
Attr
ibut
ion-
Non
Com
mer
cial
3.0
Unp
orte
d L
icen
ce.
View Article Online
cellulose), while the test group was treated by FSLN at a dosingrate of 15 mg kg�1.27 The blood samples were collected incentrifuge tubes containing K2EDTA (1.8 mg mL�1, NOVACPOLYMED, supplied by Poly Medicure Ltd., Faridabad, India),from the retro-orbital plexus using heparinized glass capillarytubes at different time points (0, 0.25, 0.5, 1.5, 2, 3, 6, 9, 12 and24 h) aer dosing. The blood samples were centrifuged at3000 rpm for 15 min to separate the plasma. Isolated plasmasamples were stored at �20 �C until further analysis.
Method validation
Selectivity. The test for selectivity was carried out using sixdifferent lots of blank rat plasma batches processed by the SPEmethod and analyzed to determine the extent to which endog-enous substances may contribute to interferences for the ana-lyte. The blank plasma sample was compared with thatcontaining FRS, at the LLOQ. The aim of performing theselectivity study with blank plasma samples was to ensure thequality of the results of sample analysis. The area of the inter-fering peak at the retention time of the analyte should be <20%of the peak area response of the analyte in the LLOQ sample.28,29
Linearity and range. The various concentrations of standardsolutions were prepared in the range of 105.6–5000 ng mL�1,containing 1 ppm of IS to assess the linearity. A standard curvewas prepared aer plotting the peak area ratio of FRS and ISversus plasma concentration of the analyte. Linearity was eval-uated by analyzing the standard curve.30
Accuracy and precision. The accuracy of the analyticalmethod was assessed by comparing a known concentration ofFRS to the experimental value. The accuracy and precision ofthe analytical method in the individual samples were assessedby analyzing QC samples (LLOQC, LQC, MQC and HQC). Aerprocessing, each QC sample was estimated in six replicates. Theaccuracy was expressed as % bias, and precision was deter-mined as the percent coefficient of variation (% CV). Theacceptance criterion of precision at each QC level is less than�15.0% deviation from nominal concentration (except LLOQ,where it must not be more than �20.0%).28
Recovery. The extraction recovery study for FRS was carriedout at three QC levels, low (LQC¼ 302 ng mL�1), medium (MQC¼ 2520 ng mL�1) and high (HQC ¼ 4200 ng mL�1), in ratplasma, with six replicates. Recovery was calculated bycomparing the area responses of the extracted samples with theresponses of the analyte from post-extracted blank plasmasamples spiked with analytes at equivalent concentrations.28,31
Sensitivity. The developed bioanalytical method must besensitive enough to measure the analyte to enable proper esti-mation of the pharmacokinetic parameters. Sensitivity wasanalyzed in six lots of screened plasma and spiked LLOQsamples. The lowest standard on the calibration curve was to beaccepted as the LLOQ, if the analyte response was at least vetimes greater than that of the extracted blank plasma. Themeanvalue of accuracy at LLOQ should not deviate by more than 25%,and precision determined should not exceed 25% of the % CV.28
Pharmacokinetic analysis. Pharmacokinetic (PK) parameterswere assessed using the PKPlus™ module of Gastroplus™
33316 | RSC Adv., 2017, 7, 33314–33326
(version 9.0, Simulations Plus Inc., Lancaster, CA, USA). Variouspharmacokinetic parameters were evaluated, including peakplasma drug concentration (Cmax), the time to achieve peakplasma drug concentration (tmax), area under the plasma drugconcentration–time curve from time zero to time t (AUC0/t),AUC from time zero to innity (AUC0/N), area under themoment curve (AUMC), clearance (CL), half-life (t1/2), meanresidence time (MRT), absorption rate constant (Ka), elimina-tion rate constant (Kel), volume of distribution (Vd) and micro-constants. Additionally, various pharmacokinetic compart-ment models (one, two and three compartments) were statisti-cally analyzed and the best-t model was selected on the basis ofthe correlation coefficient (R2) and other statistical tests likeSchwartz Criterion (SC) and Akaike Information Criterion(AIC).30,31
Assessment of in vitro–in vivo correlation. The process ofestablishing IVIVCwas done by importing the in vitro release datafor the optimized formulation in silico, according to our previouspublication,10 followed by in vivo plasma concentration data, intothe IVIVC module of GastroPlus™ soware. Deconvolutionmethods (DM) implemented for establishing correlation wereWager-Nelson-1-compartment (WN1C), Loo-Riegelman-2-compartment (LR2C), Loo-Riegelman-3-compartment (LR3C),Numerical deconvolution single Weibull (NDSW) and numericaldeconvolution double Weibull (NDDW). Prior to executing thedeconvolution methods, the plasma concentration–time datawere analysed by one compartment, two compartment and threecompartment methods, using the PKPlus™ module of Gastro-Plus™, and the relevant PK parameters were exported in thepharmacokinetic tab of the soware. Aer exporting, deconvo-lution was carried out followed by correlation establishment(linear, power function, second and third order polynomial). Thebest correlation function was then automatically selected on thebasis of R2, standard error of prediction (SEP) andmean absoluteerror (MAE). Finally, convolution was carried out and statisticallyevaluated using the mean absolute percent prediction error(MAPPE) for two main PK parameters i.e., Cmax and AUC. Addi-tionally, the true plasma drug concentration–time prole andreconstructed plasma drug concentration were statisticallystudied.
Results and discussionFabrication of SLN
In this study, an experimental assembly was developed tofabricate the FSLN with small particle size and low poly-dispersity index, using the phase inversion temperature tech-nique. Phase inversion is related to a change in the nature of thesurfactant from water-soluble to oil-soluble. At the inversionpoint, surfactants have an approximately equal affinity towardsboth oil and aqueous phases; consequently, the interfacialtension is very much reduced and results in the formation of anemulsion with low globule size, i.e., a nanoemulsion.32,33 Thesize of the FSLN was determined by transmission electronmicroscopy (Fig. 1A) and dynamic light scattering (25.54 nm)(Fig. 1B), and both methods were in good agreement, as dis-cussed in our previous report.10
This journal is © The Royal Society of Chemistry 2017

Fig. 1 Transmission electron microscopic image (A) and size distribution curve of FRSM loaded SLN (B) [reproduced with permission10].
Paper RSC Advances
Ope
n A
cces
s A
rtic
le. P
ublis
hed
on 0
3 Ju
ly 2
017.
Dow
nloa
ded
on 1
0/14
/202
1 7:
37:1
0 PM
. T
his
artic
le is
lice
nsed
und
er a
Cre
ativ
e C
omm
ons
Attr
ibut
ion-
Non
Com
mer
cial
3.0
Unp
orte
d L
icen
ce.
View Article Online
Furthermore, it was observed that at elevated temperature,the turbid pre-emulsion (w/o) inverts to the stable emulsion (o/w). In this study, initially, a turbid pre-emulsion was obtainedby heating and then slowly cooling to room temperature, byusing a non-ionic ethoxylated surfactant (CRH40), whosesurface interfacial characteristics at the globule interface areconsiderably temperature dependent.10 Generally, withincreasing temperature, ethoxylated surfactant molecules havethe tendency for dehydration of the polyethylene oxidechain.32,33 The SLN produced from the PIT method showed goodphysical properties and stability over time.10
Method development
Successful analysis of an analyte in biological uids relies onthe optimization of sample preparation, chromatographicseparation, and interference free detection. In the process of thebioanalytical method development for FRS, mobile phasecomposition and ow rate were optimized by trying differentaqueous and non-aqueous phase combinations at different owrates. Phosphate buffer solution (PBS) (pH 3–7 and 20 mM) andammonium acetate buffers (pH 3–7 and 10 mM) were studied incombination with acetonitrile (50, 60, and 70%). Mobile phasecomposition and ow rate were nally selected based on thecriteria of peak properties and sensitivity. Among the exploredbuffers, phosphate buffer gave a peak with good symmetry andresolution, hence it was selected for the method development.
Increasing the concentration of buffer (>20 mM) led to thepeak tailing, eventually resulting in poor resolution. In contrastto this, using reduced concentrations (<20 mM) of bufferdecreased the sensitivity in this setting. The optimum concen-tration of phosphate buffer was found to be 20 mM, which gavebetter resolution with enhanced sensitivity. A variable effect ofpH was also observed. On increasing the pH of the mobilephase, a negative charge was increased on the stationary phase,which decreased the retention of FRS, causing faster elution. Onthe other hand, decreasing the pH caused a reduction ofnegative charge on the stationary phase, which resulted ina decrease in the elution of the analyte. A suitable pH of 4 wasset aer many trials and errors; nally, the optimized mobilephase was found to be 35 : 65 (PBS : ACN). In this experiment,venlafaxine HCl (IS) was eluted rst, followed by FRS, with theretention times of 3.5 min and 5.5 min, respectively, anda runtime of 6 minutes. The ow rate was maintained at 1 mL
This journal is © The Royal Society of Chemistry 2017
min�1 and absorbance was observed at 229 nm. Recovery of theanalyte was carried out by solid phase extraction; therefore, theoptimized extraction procedure should exhibit consistentrecovery at all QC levels without any interference from endog-enous components. Columns used in HPLC are produced ina variety of length and internal diameter combinations, withvarious particle sizes. HPLC column dimensions (length andinternal diameter) generally affect the sensitivity, speed ofanalysis, and consequently the efficiency. The selection ofcolumn by taking dimensions into consideration whollydepends on the application, analysis, preparative methods, andthe number of analytes present in the single analysate; hence,the column with the required dimensions to achieve an effi-cient, sensitive and fast analysis should be selected.34,35 Thelength of the column has an important effect on the efficiency ofchromatographic separation, i.e., the efficiency increases withcolumn length; a two fold increase in the column lengthenhances the resolution by a factor of 1.4. Short column lengthwill give short run times with diminished backpressure, whichhas limited applications. Longer columns generally exhibitbetter resolution, but with increased analysis time and theexcess use of mobile phase (solvents), resulting in the highercost of analysis.34,35 In this study, a 15 cm column was used,which showed good resolution and less retention time (Fig. 2).Particle size is of prime importance when selecting thestationary phase. On reducing the particle size, the efficiency ofthe column increases. Smaller particle size contributes toimproved separation, but at the cost of increased columnbackpressure. Larger particles reduce the efficiency of thecolumn, which results in poor separation. Herein, a columnwith 5 mm particle size was employed in order to achieve betterefficiency by avoiding the issues related to backpressure.34,35
Columns with small internal diameters show high sensitivity,but with an increase in back pressure. On the other hand, largerdiameter columns require higher ow rates, resulting in the useof the larger volume of the mobile phase. To troubleshoot theproblem of back pressure and wastage of solvents, a columnwith internal diameter of 4.6 mm was selected for bettersensitivity. In an effort to increase the sensitivity of the method,different wavelengths were used, 235, 254 and 280 nm, fordetection purposes.36 In our study, the better sensitivity withlower interference for FRS was achieved at wavelength 229 nm.The performance of the HPLC assay was assessed by selectivity,
RSC Adv., 2017, 7, 33314–33326 | 33317
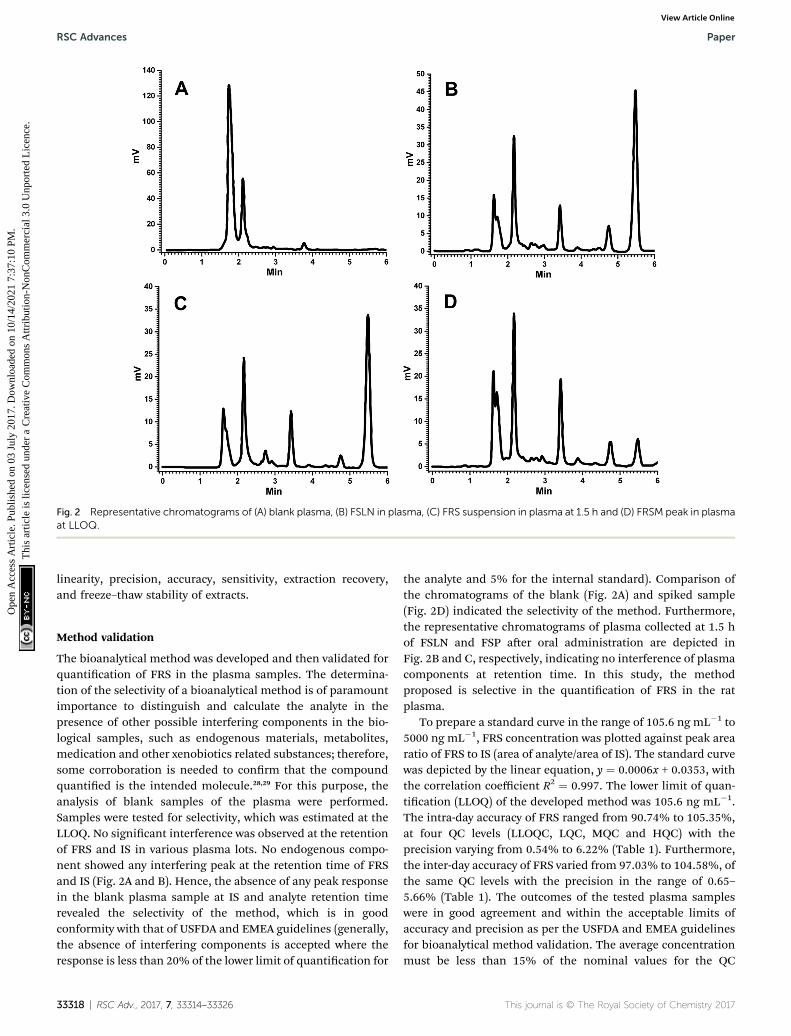
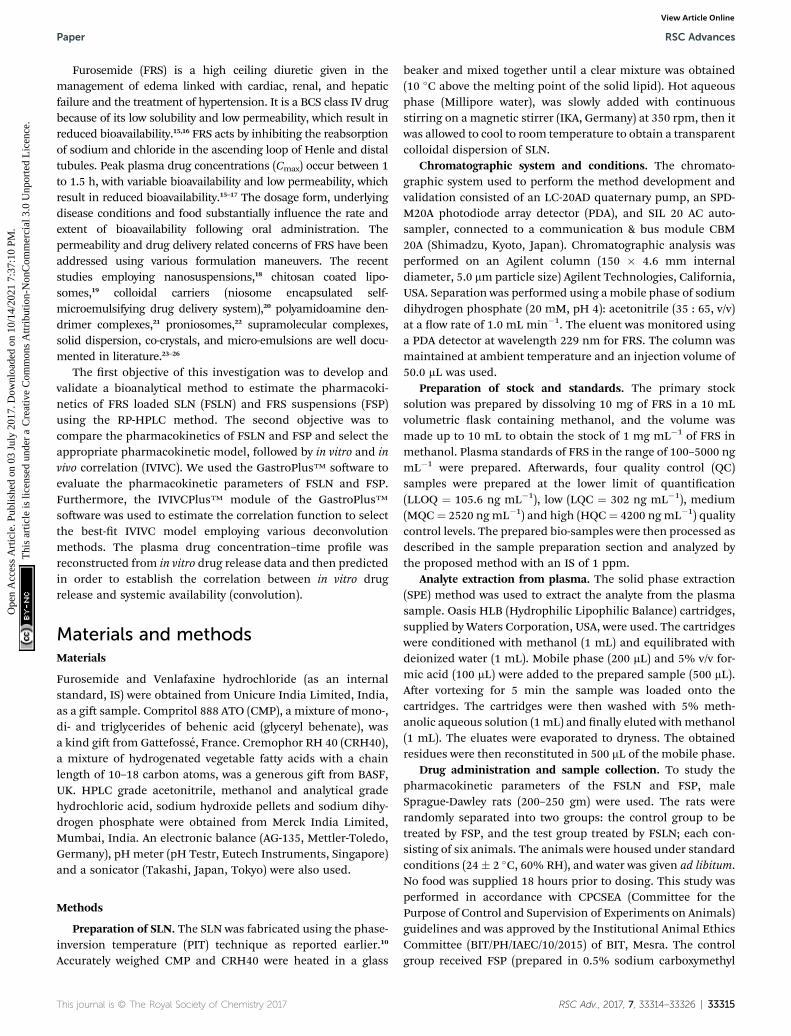
Fig. 2 Representative chromatograms of (A) blank plasma, (B) FSLN in plasma, (C) FRS suspension in plasma at 1.5 h and (D) FRSM peak in plasmaat LLOQ.
RSC Advances Paper
Ope
n A
cces
s A
rtic
le. P
ublis
hed
on 0
3 Ju
ly 2
017.
Dow
nloa
ded
on 1
0/14
/202
1 7:
37:1
0 PM
. T
his
artic
le is
lice
nsed
und
er a
Cre
ativ
e C
omm
ons
Attr
ibut
ion-
Non
Com
mer
cial
3.0
Unp
orte
d L
icen
ce.
View Article Online
linearity, precision, accuracy, sensitivity, extraction recovery,and freeze–thaw stability of extracts.
Method validation
The bioanalytical method was developed and then validated forquantication of FRS in the plasma samples. The determina-tion of the selectivity of a bioanalytical method is of paramountimportance to distinguish and calculate the analyte in thepresence of other possible interfering components in the bio-logical samples, such as endogenous materials, metabolites,medication and other xenobiotics related substances; therefore,some corroboration is needed to conrm that the compoundquantied is the intended molecule.28,29 For this purpose, theanalysis of blank samples of the plasma were performed.Samples were tested for selectivity, which was estimated at theLLOQ. No signicant interference was observed at the retentionof FRS and IS in various plasma lots. No endogenous compo-nent showed any interfering peak at the retention time of FRSand IS (Fig. 2A and B). Hence, the absence of any peak responsein the blank plasma sample at IS and analyte retention timerevealed the selectivity of the method, which is in goodconformity with that of USFDA and EMEA guidelines (generally,the absence of interfering components is accepted where theresponse is less than 20% of the lower limit of quantication for
33318 | RSC Adv., 2017, 7, 33314–33326
the analyte and 5% for the internal standard). Comparison ofthe chromatograms of the blank (Fig. 2A) and spiked sample(Fig. 2D) indicated the selectivity of the method. Furthermore,the representative chromatograms of plasma collected at 1.5 hof FSLN and FSP aer oral administration are depicted inFig. 2B and C, respectively, indicating no interference of plasmacomponents at retention time. In this study, the methodproposed is selective in the quantication of FRS in the ratplasma.
To prepare a standard curve in the range of 105.6 ng mL�1 to5000 ng mL�1, FRS concentration was plotted against peak arearatio of FRS to IS (area of analyte/area of IS). The standard curvewas depicted by the linear equation, y ¼ 0.0006x + 0.0353, withthe correlation coefficient R2 ¼ 0.997. The lower limit of quan-tication (LLOQ) of the developed method was 105.6 ng mL�1.The intra-day accuracy of FRS ranged from 90.74% to 105.35%,at four QC levels (LLOQC, LQC, MQC and HQC) with theprecision varying from 0.54% to 6.22% (Table 1). Furthermore,the inter-day accuracy of FRS varied from 97.03% to 104.58%, ofthe same QC levels with the precision in the range of 0.65–5.66% (Table 1). The outcomes of the tested plasma sampleswere in good agreement and within the acceptable limits ofaccuracy and precision as per the USFDA and EMEA guidelinesfor bioanalytical method validation. The average concentrationmust be less than 15% of the nominal values for the QC
This journal is © The Royal Society of Chemistry 2017

Table 1 Intra and inter-day accuracy and precision of furosemide in rat plasma (n ¼ 6)
LevelsSpiked concentration(ng mL�1)
Mean concentration found(ng mL�1) � SD Accuracy (%) % bias Precision (% CV)
Intra-dayLLOQC 105.6 108.80 � 6.77 103.03 3.03 6.22LQC 302 310.83 � 12.78 102.92 2.92 4.11MQC 2520 2286.83 � 25.08 90.74 �9.25 1.10HQC 4200 4424.56 � 24.01 105.35 5.35 0.54
Inter-dayLLOQC 105.6 108.63 � 5.37 102.87 2.86 4.94LQC 302 297.11 � 16.83 98.38 �1.62 5.66MQC 2520 2445.35 � 27.54 97.03 �2.96 1.12HQC 4200 4392.16 � 28.61 104.58 4.58 0.65
Paper RSC Advances
Ope
n A
cces
s A
rtic
le. P
ublis
hed
on 0
3 Ju
ly 2
017.
Dow
nloa
ded
on 1
0/14
/202
1 7:
37:1
0 PM
. T
his
artic
le is
lice
nsed
und
er a
Cre
ativ
e C
omm
ons
Attr
ibut
ion-
Non
Com
mer
cial
3.0
Unp
orte
d L
icen
ce.
View Article Online
samples, except for the LLOQ, which must be less than 20% ofthe nominal value as per the USFDA and EMEA guidelines forbioanalytical method validation.28,29 In this method, the ach-ieved LLOQ of 105.6 ng mL�1 was validated to match thesensitivity requirements. The precision value obtained was lessthan 10%, and the accuracy value was less than �5%, which isin good agreement with that of USFDA guidelines.28
Various plasma extraction methods were assessed to obtainclean plasma samples in order to avoid probable interferences.The protein precipitation procedure offers a simple and rapidmethod of extraction with clean plasma, but exhibits a consid-erable degree of unacceptability, due to high levels of noise.30
The liquid–liquid extraction (LLE) method, however, resulted ina clean sample with comparatively less noise, but the extractionmethod was tedious, involving multiple steps of extraction.Moreover, in the present work, rat plasma was used as a bio-logical sample, where the volume of plasma for the study waslow; therefore, the LLE technique was not adopted. The solidphase extraction (SPE) method was employed, having theadvantages of extracts with considerably lower lipid levels(which is an important cause of noise and interference inchromatograms), and higher and consistent extraction recoveryof the analyte and IS. The solid phase extraction (SPE) method,when used for the extraction of plasma samples using OasisHLB cartridges, unquestionably gives comparatively cleanextracts with very low noise, and shows high sensitivity with lowplasma volume. The cartridge used consisted of hydrophilic–lipophilic balanced water-wettable reversed phase sorbent fora wide spectrum of requirements. It was made from a deniteratio of two monomers, the lipophilic divinyl benzene andhydrophilic N-vinyl pyrrolidone, which offer better reversedphase capacity with neutral polar hook for enhanced retentionof polar analytes. Additional advantages of the HLB cartridgeare that it can be employed at extremes of pH and in a widerange of solvents. Furthermore, the water wettable sorbent inthe cartridge showed better retention capacity for a broad rangeof analytes, despite the sorbent bed running dry during condi-tioning and/or sample loading, leading to the conclusion thatthis SPE method is more robust and rugged, avoiding the needfor repeat preparation. The advantages of the HLB cartridge alsoinclude higher retention capacity; i.e., more analytes are
This journal is © The Royal Society of Chemistry 2017
retained with fewer breakthroughs, further improving thereproducibility of the extraction procedure. As per the USFDAguidelines, the recovery need not be 100%, but the level ofrecovery of the analyte must be reproducible and consistent atall QC levels (LQC, MQC, and HQC).28 The method of extractionexplained in the present work provides a rapid technique forseparating the analytes from the plasma sample. Here, theproposed method demonstrates consistent recovery of FRSfrom the rat plasma sample. Themean absolute recovery rangedfrom 43.9–58.6% for FRS at three QC levels (LQC, MQC, andHQC), with the precision varying from 3.5% to 5.1% (Table 2).
The analyte stability is an important parameter in plasmasamples, which should be assessed by the developed bio-analytical method and must mimic the analysis conditions thatcould be faced during handling and sample preparation.30 Theabsolute stability of the FRS at LQC, MQC, and HQC, coveringthe freeze/thaw conditions, is shown in Table 2. The FRS spikedin rat plasma was stable aer three freeze–thaw cycles over time.The freshly prepared QC samples showed acceptable accuracyin the range of 99.05–101.46%, and precision from 2.92% to0.60% (Table 2). Freshly prepared QC samples were thencompared with the sample aer freeze–thawing; the accuracyranged from of 95.85–99.87%, with the precision from 3.4% to0.68% (Table 2). The percent absolute stability aer freeze–thawing was in the range of 96.77–98.44%.
This method was demonstrated to be reproducible andaccurate for the estimation of FRS in rat plasma.
Pharmacokinetics study
Generally, drug carriers go into the organs away from the targetsite, and are then carried to the desired organ through bloodcirculation. Absorption of the drug from its site of administra-tion is a necessary process before going into the systemiccirculation. The rate and extent of drug absorption differ,depending on the route of administration/application, thephysiological environment of the site of drug uptake, andabsorption mechanism. These preconditions are applicable forall routes of drug administration, except for i.v. administration,where the drug is already in circulation, and topical applicationin which the drug is applied to the desired site directly. In thegastrointestinal tract (GIT), the drug passes through a layer of
RSC Adv., 2017, 7, 33314–33326 | 33319

Table 2 Extraction recovery and freeze thaw stability of furosemide in rat plasma (n ¼ 6)
Extraction recovery
Levels % mean recovery (�SD) % CV
LQC 47.30 (�1.66) 3.5MQC 43.90 (�2.15) 4.9HQC 58.60 (�3.00) 5.1
Freeze thaw stability
LevelsSpiked concentration(ng mL�1)
Initial mean concentrationfound (ng mL�1) � SD % CV % accuracy
Final mean concentrationfound (ng mL�1) � SD % CV % accuracy
% absolutestability
LQC 302 306.23 (8.94) 2.92 101.40 301.17 (10.23) 3.40 99.72 98.35MQC 2520 2496.12 (25.51) 1.02 99.05 2415.54 (39.84) 1.65 95.85 96.77HQC 4200 4261.46 (23.83) 0.60 101.46 4194.83 (28.34) 0.68 99.87 98.44
RSC Advances Paper
Ope
n A
cces
s A
rtic
le. P
ublis
hed
on 0
3 Ju
ly 2
017.
Dow
nloa
ded
on 1
0/14
/202
1 7:
37:1
0 PM
. T
his
artic
le is
lice
nsed
und
er a
Cre
ativ
e C
omm
ons
Attr
ibut
ion-
Non
Com
mer
cial
3.0
Unp
orte
d L
icen
ce.
View Article Online
epithelial cells, having tight junctions, before entering into thesystemic circulation; hence, drugs face a greater difficulty indrug absorption aer oral administration.37 To overcome theproblems of poor absorption and low bioavailability of drugs,due to low solubility and/or low permeability, such moleculesneed to be circulated by employing various nanocarriers.
The developed and validated bioanalytical method wasfruitfully implemented to evaluate the pharmacokineticparameters aer oral administration of FSLN and FSP. Thecomparative plasma drug concentration–time prole of FSLNand FSP is depicted in Fig. 3. Furthermore, the pharmacokineticparameters evaluated by non-compartmental and compart-mental analysis (one, two and three) are tabulated in Table 3.
The non-compartmental method is more versatile, in that itdoes not assume any specic compartmental model andproduces accurate outcomes. This method is widely used inbioequivalence studies that have the advantage of minimalassumptions about the data-generating process, which has
Fig. 3 The comparative plasma concentration time profile of furo-semide loaded SLN and suspension.
33320 | RSC Adv., 2017, 7, 33314–33326
been collected in a very structured way.38 The pharmacokineticcompartment modeling consists of a description of the fate ofa drug with respect to time. The benet of compartmental oversome non-compartmental analyses is the ability to predict theconcentration at any given time point. In the one compartmentmodel, the time course of plasma drug concentration, esti-mated aer the administration can be adequately explained byconsidering the body as a single kinetically homogenous unit,which has no barriers to the movement of the drug, with a rstorder disposition process (Fig. 4A). In the two and threecompartment models, the drug concentration is estimated asfunction of time, aer assuming the body as comprised ofhighly vascular organs/tissue (central compartment) or lessvascular organs (peripheral compartment) aer theextravascular/intravascular administration (Fig. 4B and C).Fig. 4 demonstrates the relative comparison and tness ofsuperposition between true and simulated plasma drugconcentrations (using one, two and three compartment models)and the respective compartment models are displayed in theinset of Fig. 4. The drug molecules generally leave the site ofadministration (aer absorption) to come into the centralcompartment; from there they are transported to the peripheralcompartment and exchanged (distribution) and then elimi-nated irreversibly (excreted and metabolized). This movementof drug from one compartment to another compartment ischaracterized by transfer rate constants (micro-constants).30 Anincrease in Cmax from 2261.7 ng mL�1 (FSP) to 3604.7 ng mL�1
(FSLN) (1.59 fold), and AUC0/24 from 10 130 ng hmL�1 (FSP) to17 077 ng hmL�1 (FSLN) (1.69 fold) conrmed an enhancementin the oral bioavailability of FRS when ferried via SLNs. Theobvious explanation for the bioavailability enhancement of FRSis the developed carrier system (SLN), containing lipid as themain constituent. Lipids are usually known for the enhance-ment of oral absorption of the drug, and can be formulated inthe carriers with low particle size.39 However, factors likeenzymes, pH of GIT, ionic strength, ingested food materials,residence time, absorption window, solubility and rate ofdissolution also inuence the delivery of the drug.40 Other thanthese factors, SLN play an active role in the augmentation of oral
This journal is © The Royal Society of Chemistry 2017

Table 3 Pharmacokinetic parameters of FRSM loaded SLN and FRSM suspension obtained after non-compartmental and compartmentalanalysis by the PKPlus™ module of GastroPlus™ software (n ¼ 3)
PK parameters
FSLN FSP
NCA One Comp Two Comp Three Comp NCA One Comp Two Comp Three Comp
Cmax (ng mL�1) 3604.7 — — — 2261.7 — — —tmax (h) 0.5 — — — 1 — — —AUC0–t (ng h mL�1) 17 077 — — — 10 130 — — —AUC0–N (ng h mL�1) 19 200 — — — 11 400 — — —AUMC (ng h2 mL�1) 190 100 — — — 106 400 — — —t1/2 (h) — 6.222 7.61 38.79 — 5.103 8.233 27.77MRT (h) 9.903 — — — 9.333 — — —Kel (h
�1) 0.081 — — — 0.073 — — —CL (L h�1) 0.234 0.174 0.24 0.193 1.754 1.388 1.801 1.548Vd (L) — 1.564 — — — 10.22 — —Vc (L) — — 0.96 0.808 — — 2.859 3.205Vss (L) 2.322 — — — 16.37 — — —Ka (h
�1) — 7.34 � 104 5.733 4.491 — 334.2 1.504 1.728K10 (h
�1) — 0.111 0.25 0.239 — 0.136 0.630 0.483K12 (h
�1) — — 0.625 0.992 — — 1.004 0.821K21 (h
�1) — — 0.449 0.711 — — 0.239 0.348K13 (h
�1) — — — 0.107 — — — 0.211K31 (h
�1) — — — 0.028 — — — 0.038R2 — 0.7401 0.9834 0.9867 — 0.756 0.971 0.9699AIC — �21.84 �53.15 �53.92 — �19.03 �43.98 �42.48SC — �20.65 �51.16 �51.13 — �17.84 �41.99 �39.69
Paper RSC Advances
Ope
n A
cces
s A
rtic
le. P
ublis
hed
on 0
3 Ju
ly 2
017.
Dow
nloa
ded
on 1
0/14
/202
1 7:
37:1
0 PM
. T
his
artic
le is
lice
nsed
und
er a
Cre
ativ
e C
omm
ons
Attr
ibut
ion-
Non
Com
mer
cial
3.0
Unp
orte
d L
icen
ce.
View Article Online
uptake aer bringing the drug in the solubilized form into theGIT subsequent to the formation of micelles, because of thebreakdown of the triglycerides into the surface active mono-and diacylglycerols with the action of lipases, which furtherstimulate the bile salt secretion endogenously.41,42 Other factorscontributing to enhanced oral bioavailability can be linked tothe reduction of particle size, which facilitates the absorptionrate of the drug. Various researchers have demonstrated that anincrease in the surface area associated with a decrease inparticle size leads to adequate and consistent absorption in theGIT.43–45 In a previous study, AUC0/24 and Cmax values of FRSnanosuspension were approximately 1.38- and 1.68-fold greaterthan that of the pure drug, respectively.18 In addition to themicellar pathway, the oral uptake of drug molecules might besynergized by the absorption mechanism of fatty acids, di- andmonoacylglycerols, which are incorporated into the SLNinherently, or formed aer the degradation of triglycerides by GIlipases. In addition to the solubilization, the presence ofsurfactants in the formulation may also provide an adequateenvironment for the enhancement of bioavailability. Cremo-phor RH40 (ethoxylated hydrogenated castor oil), the surfactantemployed in the synthesis of SLN, is known to enhance theabsorption by inhibiting the P-glycoprotein efflux pump.46
Furthermore, an increase in the absorption rate constant(Ka) from 1.504 h�1 (FSP) to 5.733 h�1 (FSLN) (3.81 fold),conrmed the enhanced rate of absorption of FRS whenferried through SLN. It is the rate of absorption that deter-mines the time required for the administered drug to attain aneffective plasma concentration and may therefore inuencethe onset time of the drug effect. Hence, the rate of absorptionaffects both the peak plasma concentration (Cmax) and the
This journal is © The Royal Society of Chemistry 2017
time it takes to reach this peak (tmax). Another importantpharmacokinetic parameter, the mean residence time (MRT),is the arithmetic mean of the amount of time that a drugmolecule exists in the body before being eliminated. Thereason behind the estimation of the mean residence time isthat each molecule spends a different amount of time in thebody, with some molecules lasting for a very short period andothers lasting longer.47 In this study, the MRT of FSLN was9.903 h, while FSP exhibited 9.333 h (Table 3), probably due tothe protein binding of SLN, which creates a more hydrophilicparticle surface and thus prolongs the circulation time.48 Onthe basis of statistical analysis, (R2 closer to 1.0, and smallerAIC and SC), the one compartment model was found to bepoorly tted to describe the pharmacokinetics of FSLN as wellas FRS. The R2, AIC and SC of one the compartment model forFSLN and FSP were found to be 0.7401, �21.84, �20.65 and0.756, �19.03, �17.84, respectively (Table 3), implying nondependence on one compartment and suggesting the move-ment of the drug across less vascular organs (peripheralcompartments) from plasma. This was also conrmed by thenon-superimposable observed and simulated plasma concen-tration prole of FSLN (Fig. 4A). The tted compartmentmodel corresponded to two and three, as can be observed bythe superposition of observed and simulated plasma concen-tration proles (Fig. 4B and C) as well as from statisticalanalysis (Table 3). The R2, AIC and SC of the two compartmentmodel for FSLN and FSP were found to be 0.9834, �53.15,�51.16 and 0.971, �43.98, �41.99, respectively (Table 3).Similarly, the R2, AIC and SC of the three compartment modelfor FSLN and FSP were found to be 0.9867, �53.92,�51.13 and0.9699, �42.48, �39.69, respectively (Table 3).
RSC Adv., 2017, 7, 33314–33326 | 33321

Fig. 4 Overlay plot of true (red circle) and simulated (black curve)plasma concentration time profile of FSLN using (A) one compartment,(B) two compartment and (C) three compartment models. The insetshows the corresponding pharmacokinetics models.
RSC Advances Paper
Ope
n A
cces
s A
rtic
le. P
ublis
hed
on 0
3 Ju
ly 2
017.
Dow
nloa
ded
on 1
0/14
/202
1 7:
37:1
0 PM
. T
his
artic
le is
lice
nsed
und
er a
Cre
ativ
e C
omm
ons
Attr
ibut
ion-
Non
Com
mer
cial
3.0
Unp
orte
d L
icen
ce.
View Article Online
In vitro–in vivo correlation (IVIVC)
For the modied-release dosage form, IVIVC is an importantdesign component. It is dened as a predictive mathematicalmodel describing the relationship between an in vitro propertyof a dosage form and a relevant in vivo response.49 The drugrelease data generally provide the information on in vitro
33322 | RSC Adv., 2017, 7, 33314–33326
characteristics, whereas the in vivo properties are depicted bya plasma drug concentration–time prole. The data obtainedfrom in vitro and in vivo studies are mathematically treated inorder to set up a correlation; generally, a correlation is predictedwhen the in vitro drug release from the pharmaceuticalformulation is the step that determines the absorptionkinetics.30 Correlation between the in vitro and in vivo propertiesis mathematically represented by nonlinear or linear methods.31
However, the plasma drug concentration data is not correlatedas such to the in vitro drug release data; rst, the data have to betransformed to the underlying fraction absorbed in vivo, eitherby compartmental analysis, or the linear method. The linearmethod is generally established mathematically by employingthe deconvolution/convolution method. The numericaldeconvolution/convolution method is generally selected, sinceit does not make any pharmacokinetic model assumptions. Byemploying a compartmental approach, the rate of in vivoabsorption can be calculated when the pharmacokineticparameters of the drug are known.50
For the estimation of the plasma drug concentrations(output function), if dissolution data (input function) is avail-able, the procedure is known as convolution; on the other hand,i.e., obtaining a fraction absorbed in vivo, if plasma drugconcentrations are provided, the procedure will be calleddeconvolution.30,31 On the basis of in vitro drug release prolesand pharmacokinetic data of the FSLN, the IVIVC was evaluatedusing GastroPlus™ (IVIVCPlus™ module). The deconvolutionapproaches used were WN1C, LR2C, LR3C, NDSW and NDDWto calculate the fraction of drug absorbed. Fig. 5 demonstratesthe extent of superposition between observed and convolutedplasma drug concentration–time prole, along with the relationbetween AUC and time using WN1C (Fig. 5A), LR2C (Fig. 5B),LR3C (Fig. 5C), NDSW (Fig. 5D) and NDDW (Fig. 5E). Thecorrelation function associated with each deconvolutionapproach with percent prediction error (PPE) between observedand predicted values of Cmax and AUC0/t is tabulated inTable 4. The statistics of reconstructed plasma drug concen-tration–time proles from convolution are demonstrated by R2,SEP, and MAE (Table 4). The Wagner-Nelson method (one-compartment pharmacokinetic model) is depicted by the
equation, FaðTÞ ¼ XaðTÞXaðNÞ ¼
C þ kðT0Ctdt
kðN0Ctdt
, where, ‘Fa(T)’ is the
fraction of drug bioavailable at time (T), ‘Xa(T)’ and ‘Xa(N)’ arecumulative amounts of drug absorbed up to time ‘T’ andinnity, ‘C’ is the concentration of drug in the centralcompartment at time ‘T’, and ‘k’ is the rst order eliminationrate constant. Here, the power correlation function was besttted as demonstrated by the equation y ¼ 0.805(x)5.74�10�6
where, x¼ fraction released in vitro and y¼ fraction absorbed invivo. The observed and predicted Cmax using WN1C was foundto be 3604.7 ng mL�1 and 2157.0 ng mL�1, respectively, with thePPE of 40.17 (Table 4). PPE was calculated according to the
following equation: PPE ¼�observed� predicted
observed
�� 100.
This journal is © The Royal Society of Chemistry 2017

Fig. 5 IVIVC indicating the correlation of observed and convoluted plasma drug concentration time profile using the following methods: (A)Wagner-Nelson method; (B) Loo-Riegelman method, two compartment; (C) Loo-Riegelman method, three compartment; (D) numericaldeconvolution single Weibull; (E) numerical deconvolution double Weibull.
Paper RSC Advances
Ope
n A
cces
s A
rtic
le. P
ublis
hed
on 0
3 Ju
ly 2
017.
Dow
nloa
ded
on 1
0/14
/202
1 7:
37:1
0 PM
. T
his
artic
le is
lice
nsed
und
er a
Cre
ativ
e C
omm
ons
Attr
ibut
ion-
Non
Com
mer
cial
3.0
Unp
orte
d L
icen
ce.
View Article Online
Similarly, the observed and predicted AUC0/24 of FSLNusing the same method were 17 077 ng h mL�1 and 15 600 ng hmL�1, respectively, with the PPE of 8.65% (Table 4). Further-more, statistics of reconstructed plasma drug concentration–time prole showed poor tting, indicated by small R2 (0.38),and large SEP (1064.2) and MAE (541.5) (Table 4). The poorIVIVC exhibited by the WN1C deconvolution approach is readilyunderstood, since the pharmacokinetic prole of optimizedformulation of FRS showed the two/three compartment model
This journal is © The Royal Society of Chemistry 2017
t rather than the one compartment model. However, consid-ering the small PPE of 8.65% for AUC using WN1C, it becomesdifficult to conclude that IVIVC is acceptable in terms of AUCalone. Hence, in order to be more restrictive and conclusive, wedivided the entire prole into three time phases, (i) 0 / 0.5 h,(ii) 0.5 / 3 h and (iii) 3 / 24 h, for both convoluted andobserved plasma concentration proles with respective timeintervals, and AUC was calculated for each phase. In order toavoid any confusion, we did not describe these phases as
RSC Adv., 2017, 7, 33314–33326 | 33323
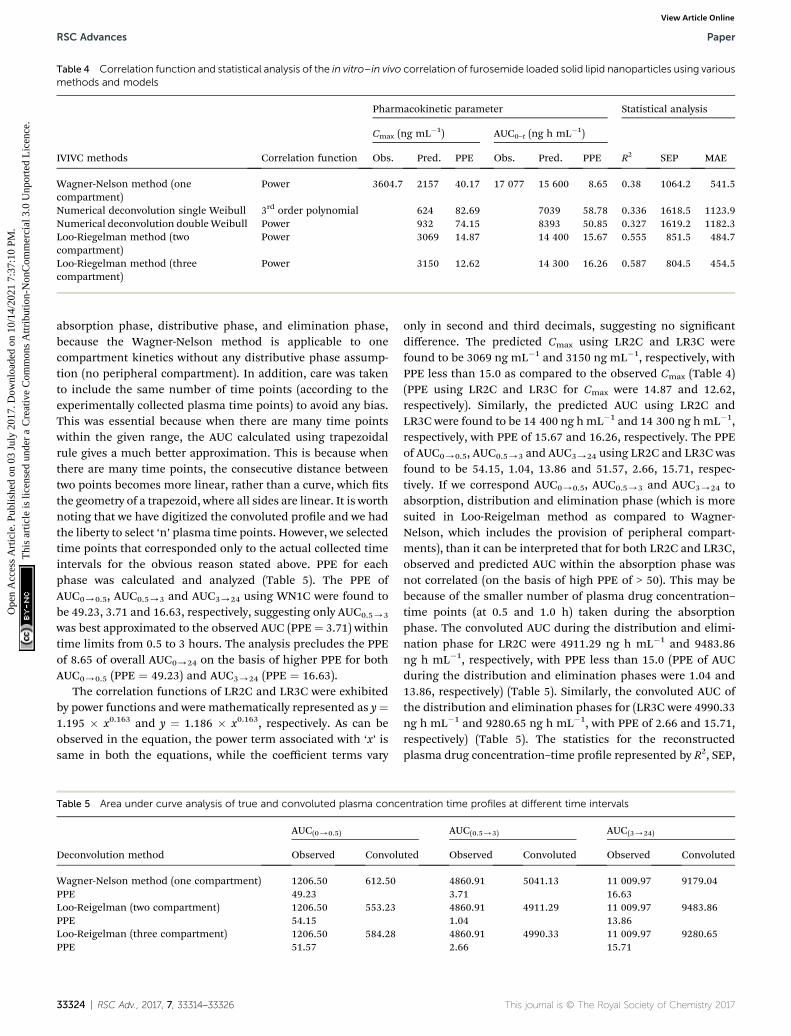
Table 4 Correlation function and statistical analysis of the in vitro–in vivo correlation of furosemide loaded solid lipid nanoparticles using variousmethods and models
IVIVC methods Correlation function
Pharmacokinetic parameter Statistical analysis
Cmax (ng mL�1) AUC0–t (ng h mL�1)
R2 SEP MAEObs. Pred. PPE Obs. Pred. PPE
Wagner-Nelson method (onecompartment)
Power 3604.7 2157 40.17 17 077 15 600 8.65 0.38 1064.2 541.5
Numerical deconvolution single Weibull 3rd order polynomial 624 82.69 7039 58.78 0.336 1618.5 1123.9Numerical deconvolution doubleWeibull Power 932 74.15 8393 50.85 0.327 1619.2 1182.3Loo-Riegelman method (twocompartment)
Power 3069 14.87 14 400 15.67 0.555 851.5 484.7
Loo-Riegelman method (threecompartment)
Power 3150 12.62 14 300 16.26 0.587 804.5 454.5
RSC Advances Paper
Ope
n A
cces
s A
rtic
le. P
ublis
hed
on 0
3 Ju
ly 2
017.
Dow
nloa
ded
on 1
0/14
/202
1 7:
37:1
0 PM
. T
his
artic
le is
lice
nsed
und
er a
Cre
ativ
e C
omm
ons
Attr
ibut
ion-
Non
Com
mer
cial
3.0
Unp
orte
d L
icen
ce.
View Article Online
absorption phase, distributive phase, and elimination phase,because the Wagner-Nelson method is applicable to onecompartment kinetics without any distributive phase assump-tion (no peripheral compartment). In addition, care was takento include the same number of time points (according to theexperimentally collected plasma time points) to avoid any bias.This was essential because when there are many time pointswithin the given range, the AUC calculated using trapezoidalrule gives a much better approximation. This is because whenthere are many time points, the consecutive distance betweentwo points becomes more linear, rather than a curve, which tsthe geometry of a trapezoid, where all sides are linear. It is worthnoting that we have digitized the convoluted prole and we hadthe liberty to select ‘n’ plasma time points. However, we selectedtime points that corresponded only to the actual collected timeintervals for the obvious reason stated above. PPE for eachphase was calculated and analyzed (Table 5). The PPE ofAUC0/0.5, AUC0.5/3 and AUC3/24 using WN1C were found tobe 49.23, 3.71 and 16.63, respectively, suggesting only AUC0.5/3
was best approximated to the observed AUC (PPE¼ 3.71) withintime limits from 0.5 to 3 hours. The analysis precludes the PPEof 8.65 of overall AUC0/24 on the basis of higher PPE for bothAUC0/0.5 (PPE ¼ 49.23) and AUC3/24 (PPE ¼ 16.63).
The correlation functions of LR2C and LR3C were exhibitedby power functions and were mathematically represented as y¼1.195 � x0.163 and y ¼ 1.186 � x0.163, respectively. As can beobserved in the equation, the power term associated with ‘x’ issame in both the equations, while the coefficient terms vary
Table 5 Area under curve analysis of true and convoluted plasma conc
Deconvolution method
AUC(0/0.5)
Observed Convolu
Wagner-Nelson method (one compartment) 1206.50 612.50PPE 49.23Loo-Reigelman (two compartment) 1206.50 553.23PPE 54.15Loo-Reigelman (three compartment) 1206.50 584.28PPE 51.57
33324 | RSC Adv., 2017, 7, 33314–33326
only in second and third decimals, suggesting no signicantdifference. The predicted Cmax using LR2C and LR3C werefound to be 3069 ng mL�1 and 3150 ng mL�1, respectively, withPPE less than 15.0 as compared to the observed Cmax (Table 4)(PPE using LR2C and LR3C for Cmax were 14.87 and 12.62,respectively). Similarly, the predicted AUC using LR2C andLR3C were found to be 14 400 ng hmL�1 and 14 300 ng hmL�1,respectively, with PPE of 15.67 and 16.26, respectively. The PPEof AUC0/0.5, AUC0.5/3 and AUC3/24 using LR2C and LR3C wasfound to be 54.15, 1.04, 13.86 and 51.57, 2.66, 15.71, respec-tively. If we correspond AUC0/0.5, AUC0.5/3 and AUC3/24 toabsorption, distribution and elimination phase (which is moresuited in Loo-Reigelman method as compared to Wagner-Nelson, which includes the provision of peripheral compart-ments), than it can be interpreted that for both LR2C and LR3C,observed and predicted AUC within the absorption phase wasnot correlated (on the basis of high PPE of > 50). This may bebecause of the smaller number of plasma drug concentration–time points (at 0.5 and 1.0 h) taken during the absorptionphase. The convoluted AUC during the distribution and elimi-nation phase for LR2C were 4911.29 ng h mL�1 and 9483.86ng h mL�1, respectively, with PPE less than 15.0 (PPE of AUCduring the distribution and elimination phases were 1.04 and13.86, respectively) (Table 5). Similarly, the convoluted AUC ofthe distribution and elimination phases for (LR3C were 4990.33ng h mL�1 and 9280.65 ng h mL�1, with PPE of 2.66 and 15.71,respectively) (Table 5). The statistics for the reconstructedplasma drug concentration–time prole represented by R2, SEP,
entration time profiles at different time intervals
AUC(0.5/3) AUC(3/24)
ted Observed Convoluted Observed Convoluted
4860.91 5041.13 11 009.97 9179.043.71 16.634860.91 4911.29 11 009.97 9483.861.04 13.864860.91 4990.33 11 009.97 9280.652.66 15.71
This journal is © The Royal Society of Chemistry 2017

Paper RSC Advances
Ope
n A
cces
s A
rtic
le. P
ublis
hed
on 0
3 Ju
ly 2
017.
Dow
nloa
ded
on 1
0/14
/202
1 7:
37:1
0 PM
. T
his
artic
le is
lice
nsed
und
er a
Cre
ativ
e C
omm
ons
Attr
ibut
ion-
Non
Com
mer
cial
3.0
Unp
orte
d L
icen
ce.
View Article Online
and MAE for LR2C and LR3C ranging between 0.555 and 0.587,804.5–851.5, 454.5–484.7 (Table 4) suggesting marginally smalldifference between LR2C and LR3C. This can also be observedby better superposition of the convoluted and observed plasmaconcentration–time prole (except for absorption phase).However, if we strictly compare only the AUC of the distributionand elimination phase, LR2C seems to have an edge over LR3C,on the basis of the least PPE of 1.04 and 13.86 (for LR2C) vis-a-vis PPE of 2.66 and 15.71 (for LR3C).
In the present study, we also explored NDSW and NDDW forpossible IVIVC methodology, however, both these models werenot appropriate, as observed by the non-superposition ofobserved and convoluted plasma drug concentration proles(Fig. 5D and E). NDSW and NDDWwere expressed by a 3rd orderpolynomial function; (y ¼ �0.042 + 1.2 � 10�3 � x + 2.086 � x2
� 1.096 � x3) and power function; y ¼ 1.042 � x1.646, respec-tively (Table 4). The numerical deconvolution method uses theinverse operation of the convolution integral and the principleof superposition, which states that the response is doseproportional and time invariant, to calculate an input ratefunction.51,52 The PPE of Cmax and AUC for NDSW and NDDWranged between 74.15–82.69 and 50.85–58.78, respectively,suggesting the model's inconclusive reliability. The observationis further bolstered by the poor statistical analysis of recon-structed plasma drug concentration–time prole (R2: 0.327–0.336; SEP: 1618.5–1619.2; MAE: 1123.9–1182.3) for LR2C andLR3C.
LR2C and LR3C were the preferred deconvolutionapproaches to establish the IVIVC of optimized FSLN on thebasis of the overall PPE, SEP, MAE and R2.
Conclusion
A simple, sensitive bioanalytical method was developed usingRP-HPLC. The unknown plasma concentrations of FRS weresuccessfully determined in the plasma samples of rats by usingthe solid phase extraction technique. Here, venlafaxine HCl wasused as an internal standard and linearity was obtained in therange of 105.6–5000 ng mL�1, with the R2 ¼ 0.997. The methodwas found to be selective and sensitive. The GastroPlus™soware was employed to evaluate various pharmacokineticparameters using compartmental and non-compartmentalapproaches. FSLN, as compared to FSP, showed an increase inCmax, AUC, and Ka, with the decrease in tmax depicting theenhanced bioavailability and fast onset of action. IVIVC wasestablished with the help of IVIVCPlus™, an IVIVC toolkit ofGastroPlus™. On the statistical analysis of various IVIVCapproaches, Loo-Riegelman was found to be the best t. Thestudy showed that SLN could be a potential drug carrier toferry the FRS with enhanced bioavailability, aer oraladministration.
Conflicts of interest
The authors report no conicts of interest.
This journal is © The Royal Society of Chemistry 2017
Ethical statement
Animals used in the study were maintained in accordance toCPCSEA (Committee for the Purpose of Control and Supervisionof Experiments on Animals) guidelines and was approved byInstitutional Animal Ethics Committee (BIT/PH/IAEC/10/2015)of BIT, Mesra. No Human subjects were involved in the study.
Acknowledgements
Authors thank University Grants Commission (UGC), Govern-ment of India, New Delhi, for providing nancial assistance forthis research under UGC-BSR scheme (F-7-32/2007-BSR). San-deep Kumar Singh acknowledges Pukyong National University,Busan, South Korea (National Research Foundation of Korea,Ministry of Education, grant no. 2012R1A6A1028677) forproviding postdoctoral fellowship and Birla Institute of Tech-nology for granting the study leave.
References
1 P. Fasinu, V. Pillay, V. M. Ndesendo, L. C. du Toit andY. E. Choonara, Biopharm. Drug Dispos., 2011, 32, 185–209.
2 S. K. Singh, P. R. P. Verma and B. Razdan, Drug Dev. Ind.Pharm., 2010, 36, 933–945.
3 W. Mehnert and K. Mader, Adv. Drug Delivery Rev., 2001, 47,165–196.
4 S. K. Singh, P. R. P. Verma and B. Razdan, Pharm. Dev.Technol., 2010, 15, 469–483.
5 D. F. Emerich and C. G. Thanos, J. Drug Targeting, 2007, 15,163–183.
6 V. Wagner, A. Dullaart, A.-K. Bock and A. Zweck, Nat.Biotechnol., 2006, 24, 1211.
7 L. Zhang, F. Gu, J. Chan, A. Wang, R. Langer andO. Farokhzad, Clin. Pharmacol. Ther., 2008, 83, 761–769.
8 E. Souto, S. Wissing, C. Barbosa and R. Muller, Int. J. Pharm.,2004, 278, 71–77.
9 R. H. Muller, M. Radtke and S. A. Wissing, Adv. Drug DeliveryRev., 2002, 54(suppl. 1), S131–S155.
10 H. Ali and S. K. Singh, Part. Sci. Technol., 2017, DOI: 10.1080/02726351.2017.1295293.
11 M. Ghadiri, S. Fatemi, A. Vatanara, D. Doroud,A. R. Najafabadi, M. Darabi and A. A. Rahimi, Int. J.Pharm., 2012, 424, 128–137.
12 H. Vaghasiya, A. Kumar and K. Sawant, Eur. J. Pharm. Sci.,2013, 49, 311–322.
13 T. Yuan, L. Qin, Z. Wang, J. Nie, Z. Guo, G. Li and C. Wu,Asian J. Pharm. Sci., 2013, 8, 39–47.
14 T. Goppert and R. Muller, Int. J. Pharm., 2005, 302, 172–186.15 G. E. Granero, M. R. Longhi, M. J. Mora, H. E. Junginger,
K. K. Midha, V. P. Shah, S. Stavchansky, J. B. Dressmanand D. M. Barends, J. Pharm. Sci., 2010, 99, 2544–2556.
16 C.-Y. Wu and L. Z. Benet, Pharm. Res., 2005, 22, 11–23.17 H. Ali, S. K. Singh and P. R. P. Verma, J. Pharm. Invest., 2015,
45, 385–398.18 B. P. Sahu and M. K. Das, J. Nanopart. Res., 2014, 16, 2360.
RSC Adv., 2017, 7, 33314–33326 | 33325

RSC Advances Paper
Ope
n A
cces
s A
rtic
le. P
ublis
hed
on 0
3 Ju
ly 2
017.
Dow
nloa
ded
on 1
0/14
/202
1 7:
37:1
0 PM
. T
his
artic
le is
lice
nsed
und
er a
Cre
ativ
e C
omm
ons
Attr
ibut
ion-
Non
Com
mer
cial
3.0
Unp
orte
d L
icen
ce.
View Article Online
19 I. Vural, C. Sarisozen and S. S. Olmez, J. Biomed.Nanotechnol., 2011, 7, 426–430.
20 A. A. Sultan, S. A. El-Gizawy, M. A. Osman and G. M. ElMaghraby, J. Pharm. Pharmacol., 2016, 68, 324–332.
21 B. Devarakonda, D. P. Otto, A. Judefeind, R. A. Hill andM. M. de Villiers, Int. J. Pharm., 2007, 345, 142–153.
22 A. Azeem, N. Jain, Z. Iqbal, F. J. Ahmad, M. Aqil andS. Talegaonkar, Pharm. Dev. Technol., 2008, 13, 155–163.
23 S.-C. Shin and J. Kim, Int. J. Pharm., 2003, 251, 79–84.24 N. R. Goud, S. Gangavaram, K. Suresh, S. Pal,
S. G. Manjunatha, S. Nambiar and A. Nangia, J. Pharm.Sci., 2012, 101, 664–680.
25 C. Garnero, A. K. Chattah and M. Longhi, J. Pharm. Biomed.Anal., 2014, 95, 139–145.
26 A. Zvonar, K. Berginc, A. Kristl and M. Gasperlin, Int. J.Pharm., 2010, 388, 151–158.
27 L. H. Nielsen, T. Rades and A. Mullertz, Int. J. Pharm., 2015,490, 334–340.
28 USFDA, Guidance for Industry: Bioanalytical MethodValidation, US Department of Health and Human Services,Food and Drug Administration, Center for Drug Evaluationand Research, Center for Veterinary Medicine, NewHampshire Ave., Silver Spring, MD, 2013.
29 E. M. A., Guideline on Bioanalytical Method Validation,Committee for Medicinal Products for Human Use,Churchill Place, Canary Wharf, London, United Kingdom,2011.
30 S. Verma and S. K. Singh, J. Pharm. Biomed. Anal., 2016, 124,10–21.
31 J. K. George, S. K. Singh and P. R. P. Verma, Ther. Delivery,2016, 7, 305–318.
32 D. Morales, J. M. Gutierrez, M. Garcia-Celma and Y. Solans,Langmuir, 2003, 19, 7196–7200.
33 P. Fernandez, V. Andre, J. Rieger and A. Kuhnle, ColloidsSurf., A, 2004, 251, 53–58.
33326 | RSC Adv., 2017, 7, 33314–33326
34 D. T. T. Nguyen, D. Guillarme, S. Rudaz and J. L. Veuthey, J.Sep. Sci., 2006, 29, 1836–1848.
35 M. J. Tessalone, CHROMacademy: Paving the Way forContinued Education in Analytical Science, AdvanstarCommunications Inc., Duluth, MN, USA, 2014.
36 Y. S. El-Saharty, J. Pharm. Biomed. Anal., 2003, 33, 699–709.37 H. Ali and S. K. Singh, Ther. Delivery, 2016, 7, 691–709.38 T. Jaki and M. J. Wolfsegger, Stat. Med., 2012, 31, 1059–1073.39 S. Chakraborty, D. Shukla, B. Mishra and S. Singh, Eur. J.
Pharm. Biopharm., 2009, 73, 1–15.40 Z. Cai, Y. Wang, L. J. Zhu and Z. Q. Liu, Curr. Drug Metab.,
2010, 11, 197–207.41 B. K. Nanjwade, D. J. Patel, R. A. Udhani and F. V. Manvi, Sci.
Pharm., 2011, 79, 705–727.42 C. J. Porter, N. L. Trevaskis and W. N. Charman, Nat. Rev.
Drug Discovery, 2007, 6, 231–248.43 H. Li, X. Zhao, Y. Ma, G. Zhai, L. Li and H. Lou, J. Controlled
Release, 2009, 133, 238–244.44 C. Y. Zhuang, N. Li, M. Wang, X. N. Zhang, W. S. Pan,
J. J. Peng, Y. S. Pan and X. Tang, Int. J. Pharm., 2010, 394,179–185.
45 A. Hanafy, H. Spahn-Langguth, G. Vergnault, P. Grenier,M. Tubic Grozdanis, T. Lenhardt and P. Langguth, Adv.Drug Delivery Rev., 2007, 59, 419–426.
46 Y. Tayrouz, Clin. Pharmacol. Ther., 2003, 73, 397–405.47 J. Fan and I. A. de Lannoy, Biochem. Pharmacol., 2014, 87, 93–
120.48 M. Rahman, S. Laurent, N. Tawil, L. H. Yahia and
M. Mahmoudi, in Protein-Nanoparticle Interactions,Springer, 2013, pp. 21–44.
49 J. Shen and D. J. Burgess, J. Controlled Release, 2015, 219,644–651.
50 H. Rettig and J. Mysicka, Dissolution Technol., 2008, 15, 6.51 F. Langenbucher, Eur. J. Pharm. Biopharm., 2003, 56, 429–
437.52 P. Veng-Pedersen, Adv. Drug Delivery Rev., 2001, 48, 265–300.
This journal is © The Royal Society of Chemistry 2017