in vivo characterization of chronic traumatic ... · in vivo characterization of chronic traumatic...
TRANSCRIPT

Correction
MEDICAL SCIENCESCorrection for “In vivo characterization of chronic traumaticencephalopathy using [F-18]FDDNP PET brain imaging,” byJorge R. Barrio, Gary W. Small, Koon-Pong Wong, Sung-ChengHuang, Jie Liu, David A. Merrill, Christopher C. Giza, Robert P.Fitzsimmons, Bennet Omalu, Julian Bailes, and Vladimir Kepe,which appeared in issue 16, April 21, 2015, of Proc Natl Acad SciUSA (112:E2039–E2047; first published April 6, 2015; 10.1073/pnas.1409952112).The authors note that the following information should be added
to the conflict of interest statement: “R.P.F. is a practicing attorney.He has never represented a claimant in a case alleging diagnosedCTE. R.P.F. is a director of the Brain Injury Research Institute(BIRI), which is a 501(c)(3) corporation. He has never billed norbeen paid for any work he has done for BIRI.”
www.pnas.org/cgi/doi/10.1073/pnas.1508756112
www.pnas.org PNAS | June 2, 2015 | vol. 112 | no. 22 | E2981
CORR
ECTION
In vivo characterization of chronic traumaticencephalopathy using [F-18]FDDNP PET brain imagingJorge R. Barrioa,1, Gary W. Smallb, Koon-Pong Wonga, Sung-Cheng Huanga, Jie Liu (刘捷)a, David A. Merrillb,Christopher C. Gizac, Robert P. Fitzsimmonsd, Bennet Omalue, Julian Bailesf, and Vladimir Kepea,1
Departments of aMolecular and Medical Pharmacology, bPsychiatry and Biobehavioral Sciences and the Semel Institute for Neuroscience and HumanBehavior, and cNeurosurgery and Pediatrics, The David Geffen School of Medicine, University of California, Los Angeles, CA 90095; dFitzsimmons LawOffices, Wheeling, WV 26003; eDepartment of Medical Pathology and Laboratory Medicine, School of Medicine, University of California, Davis, Sacramento,CA 95817; and fDepartment of Neurosurgery, NorthShore University Health System and University of Chicago Pritzker School of Medicine, Evanston,IL 60201
Edited by Marcus E. Raichle, Washington University in St. Louis, St. Louis, MO, and approved January 9, 2015 (received for review May 29, 2014)
Chronic traumatic encephalopathy (CTE) is an acquired primarytauopathy with a variety of cognitive, behavioral, and motorsymptoms linked to cumulative brain damage sustained fromsingle, episodic, or repetitive traumatic brain injury (TBI). Nodefinitive clinical diagnosis for this condition exists. In this work,we used [F-18]FDDNP PET to detect brain patterns of neuropa-thology distribution in retired professional American footballplayers with suspected CTE (n = 14) and compared results withthose of cognitively intact controls (n = 28) and patients withAlzheimer’s dementia (AD) (n = 24), a disease that has beencognitively associated with CTE. [F-18]FDDNP PET imaging resultsin the retired players suggested the presence of neuropathologicalpatterns consistent with models of concussion wherein brainstemwhite matter tracts undergo early axonal damage and cumulativeaxonal injuries along subcortical, limbic, and cortical brain circuitriessupporting mood, emotions, and behavior. This deposition patternis distinctively different from the progressive pattern of neuropa-thology [paired helical filament (PHF)-tau and amyloid-β] in AD,which typically begins in the medial temporal lobe progressingalong the cortical default mode network, with no or minimal in-volvement of subcortical structures. This particular [F-18]FDDNPPET imaging pattern in cases of suspected CTE also is primarily con-sistent with PHF-tau distribution observed at autopsy in subjectswith a history of mild TBI and autopsy-confirmed diagnosis of CTE.
traumatic brain injury | chronic traumatic encephalopathy |[F-18]FDDNP PET | tau imaging | concussions
The consensus statement on concussions from the Fourth In-ternational Conference on Concussion in Sports (Zurich
2012) (1) defines acute mild traumatic brain injury (mTBI) orcerebral concussion as a brain injury with a complex patho-physiological process induced by biomechanical forces. Cerebralconcussion causes white matter axonal injury due to axonal shearingand stretching (2), typically resulting in the rapid onset of short-livedimpairment of neurological function that resolves spontaneouslyand largely reflects a functional disturbance rather than a structuralinjury. As such, no abnormality is seen on standard structuralneuroimaging determinations (1).A number of early literature reports described a neurodegen-
erative disease associated with a history of repetitive TBI in re-tired professional boxers (3, 4), with a prevalence rate of up to47% among retired professional boxers aged 50 y and older whoboxed for more than 10 y (5). Initially named “punch drunksyndrome” (3) and dementia pugilistica (4), this syndrome is nowknown as chronic traumatic encephalopathy (CTE) in the cur-rent literature (6, 7).Compelling autopsy evidence (6–8) and neurobehavioral deter-
minations (9) of retired professional American football athletesindicate that a subgroup develops neurodegenerative and clinicalchanges typical of CTE, a progressive syndrome distinctivelydifferent from Alzheimer’s disease (AD), which is the mostcommon form of dementia in the elderly (10). The connection
between multiple concussions and subconcussive head impacts(2) and CTE is compelling, because history of repetitive con-cussions is the strongest risk factor for development of CTE innumerous contact sports (e.g., American football, rugby, boxing,ice hockey, soccer, and professional wrestling), in war veteranswith a history of blast or blunt force TBI, and in conditions wheretrauma to the head occurs for various reasons (e.g., falls duringseizures, head-banging in autistic children, motor vehicle anddomestic accidents, domestic violence and abuse) (6, 8, 11–14).As with most neurodegenerative diseases, clinical diagnosis remainselusive due to the lack of specificity of CTE clinical symptomatologycriteria, and histopathological examination of brain at autopsy is themost definitive diagnostic modality (6, 8, 11).The novel imaging approaches leading to the in vivo charac-
terization of CTE brain neuropathology premortem (e.g., PET)are complementary to structural imaging modalities [e.g., diffu-sion tensor imaging MRI (DTI MRI)] and offer a specific andsensitive strategy to facilitate diagnosis of CTE. Neuronal andglial fibrillar hyperphosphorylated microtubule-associated pro-tein tau deposits composed of paired helical filament (PHF)-tauare the primary brain proteinopathy of CTE based on autopsydeterminations, and their 3R/4R tau isoform ratio is similar tothat of AD (11). Their topographically predictable pattern ofdistribution was used as a basis for a severity staging system ofCTE neuropathology (7), ranging from mild (neuropathology
Significance
Mild traumatic brain injuries are frequent events in the generalpopulation and are associated with a severe neurodegenera-tive disease, chronic traumatic encephalopathy (CTE). This dis-ease is characterized by abnormal accumulation of proteinaggregates, primarily tau proteins, which accumulate in brainareas responsible for mood, fear, stress, and cognition. There isno definitive clinical diagnosis of CTE at the present time, andthis new work shows how a tau-sensitive brain imaging agent,[F-18]FDDNP, may be able to detect the disease in living peoplewith varying degrees of symptoms. Early detection would fa-cilitate the most effective management strategies and providea baseline to measure the effectiveness of treatments.
Author contributions: J.R.B., G.W.S., R.P.F., B.O., J.B., and V.K. designed research; J.R.B.,G.W.S., J.L., D.A.M., C.C.G., and V.K. performed research; B.O. contributed new reagents/analytic tools; J.R.B., K.-P.W., S.-C.H., and V.K. analyzed data; and J.R.B. and V.K. wrotethe paper.
Conflict of interest statement: J.R.B., G.W.S., and S.-C.H. are coinventors of the [F-18]FDDNPPET technology that is covered under University of California, Los Angeles patents andlicensed to TauMark, LLC. J.R.B., G.W.S., R.P.F., and B.O. have a financial interest inTauMark, LLC.
This article is a PNAS Direct Submission.1To whom correspondence may be addressed. Email: [email protected] or [email protected].
This article contains supporting information online at www.pnas.org/lookup/suppl/doi:10.1073/pnas.1409952112/-/DCSupplemental.
www.pnas.org/cgi/doi/10.1073/pnas.1409952112 PNAS | Published online April 6, 2015 | E2039–E2047
MED
ICALSC
IENCE
SPN
ASPL
US
stages I and II) to advanced (neuropathology stages III and IV)(7) (Tables S1 and S2). In addition, more than 80% of analyzedpathologically confirmed CTE cases also show transactive re-sponse (TAR) DNA-binding protein of ∼43 kDa (TDP-43) ei-ther as inclusions in sparse neurites in cortex, medial temporallobe structures, and brainstem in CTE neuropathology stagesI–III, as widespread neuronal and glial inclusions in severe CTEcases (neuropathology stage IV), or in CTE cases with motorneuron disease (7, 15) (Tables S1 and S2). CTE cases also canexhibit the presence of other fibrillar protein aggregates.McKee et al. (7) and Omalu et al. (8) reported that in autopsydeterminations, less than half of all CTE cases and less thanone third of “pure” CTE cases show amyloid-β (Aβ) deposits,predominantly as scattered cortical diffuse plaques in lowdensity (Tables S1 and S2). Of note is that subjects with Aβdeposits were significantly older than those without. Moreover,their neuropathology was more severe than that in cases with-out Aβ deposits and was often combined with α-synucleindeposits (7). As an example, as reported by McKee et al. (7), of30 CTE cases with at least some cortical Aβ deposits (of 68confirmed CTE cases), 29 brains were from subjects who died intheir seventh decade of life and one from a subject who died inhis sixth decade.Subsequent to our preliminary report (16), in this work we use
[F-18]FDDNP, an imaging agent for fibrillar insoluble proteinaggregates (16–20), and PET imaging with the aim of estab-lishing (i) topographic brain localization of [F-18]FDDNP PETsignals indicative of fibrillar neuroaggregates in retired pro-fessional American football players with suspected CTE (mTBIgroup) vs. controls (CTRL); (ii) determination of [F-18]FDDNPPET signal patterns in the mTBI group; (iii) presence of[F-18]FDDNP PET signal as a measure of neuropathology in thebrain areas involved in mood disorders related neurocircuits;(iv) correlation of [F-18]FDDNP PET results with neuropathologydistributions in confirmed CTE cases; (v) differential patterns of[F-18]FDDNP PET signals, and thus deposition of fibrillar neuro-aggregates, in the mTBI group with respect to the AD group; and(vi) preliminary demonstration of differences in [F-18]FDDNPPET signal patterns in mTBI cases with different etiology, i.e.,contact-sport–related mTBI in retired professional Americanfootball players vs. blast-induced mTBI in war veterans. We fur-ther intended to demonstrate that tau (vs. Aβ) specificity of highaffinity PET molecular imaging probes may not be a necessaryrequirement when used in CTE subjects with primary proteinop-
athy in the form of PHF-tau (8): PET imaging probes potentiallysensitive to TDP-43 aggregates and Aβ deposits, which arepresent in higher densities almost exclusively in older CTE caseswith more advanced neuropathology (e.g., stage IV), couldbetter define disease progression based on quantification ofdifferences in regional loads of combined neuropathologiesbecause additional neuropathologies appear in predictabletopographical and temporal patterns.
ResultsBrain [F-18]FDDNP PET Patterns in Suspected CTE (mTBI Group). In alltypes of neurodegenerative proteinopathies, including CTE,pathology-based diagnosis using protein specific immunohisto-chemistry (IHC) does not result only from the presence of pro-tein pathology in the brain, but rather from detection of diseasespecific topographic patterns of pathology distribution combinedwith quantitation of regional and global pathology loads. Mo-lecular imaging agents targeting such fibrillar protein patholo-gies must therefore accurately and reliably detect these disease-specific patterns of distribution and their changes both in thepattern complexity and in regional pathology loads that mayevolve due to the progressive nature of these neurodegenera-tive diseases.Demographic data for all mTBI group subjects are provided in
Table 1. We identified four distinctive topographical patterns ofbrain [F-18]FDDNP PET signal in the mTBI group, which arepresented in increasing complexity from T1 to T4 in Fig. 1(Upper) in three views (transaxial, top row; sagittal, middle row;and coronal, bottom row). All four patterns distinguish the mTBIsubjects from cognitively intact control subjects (CTRL group)(Fig. 1, Upper, and Table 2).The observed [F-18]FDDNP PET signal patterns are defined
as follows:
i) Pattern T1 is predominantly subcortical in brainstem (mid-brain) with localized involvement of the limbic medial tem-poral lobe structures (limited to amygdala).
ii) Pattern T2 shows [F-18]FDDNP PET signal in all subcorti-cal areas analyzed in this study, in all limbic medial temporallobe areas [amygdala and medial temporal lobe (MTL); hip-pocampus, entorhinal cortex, parahippocampal gyrus)], andin parts of the frontal cortex including anterior cingulategyrus (ACG).
iii) Pattern T3 shows further increases in signal intensity andpattern complexity: all affected areas in the T2 pattern plus
Table 1. Demographic information for the mTBI group
Subject Age (y) Education (y) RaceActive
career (y) Position Retirement (y) DiagnosisMMSE(score)
HAM-Dscore
HAM-Ascore
TBI01 59 18 AA 16 Linebacker 28 MCI-MD 25 11 13TBI02 64 17 C 10 Quarterback 38 Normal 30 5 6TBI03 73 18 C 16 Offensive guard 44 Dementia 17 8 5TBI04 50 15 C 14 Defensive tackle 20 MCI-MD 28 17 12TBI05 45 18 C 12 Center 16 MCI-A 29 6 0TBI06 86 16 C 11 Running back 58 MCI-A 27 3 3TBI07 62 16 C 17 Offensive guard 28 MCI-NA 27 16 19TBI08 51 18 AA 14 Defensive lineman 22 MCI-MD 30 17 31TBI09 59 15 AA 16 Running back 26 MCI-MD 27 14 12TBI10 54 14 AA 12 Wide receiver 22 MCI-MD 25 15 16TBI11 40 16 C 17 Center 7 MCI-A 27 17 21TBI12 54 16 C 16 Offensive lineman 20 MCI-A 26 0 1TBI13 62 16 AA 13 Offensive lineman 32 MCI-A 28 33 30TBI14 54 16 C 9 Nose tackles 25 MCI-MD 26 21 22
A, amnestic; AA, African American; C, Caucasian; HAM-A, Hamilton Anxiety Score (mild to moderate symptoms: 18–24; moderate to severe: > 24); HAM-D,Hamilton Depression Score (mild symptoms: 8–16; moderate to severe: >16); MCI, mild cognitive impairment; MD, multiple domains; MMSE, mini-mental stateexamination (dementia range <24); NA, nonamnestic.
E2040 | www.pnas.org/cgi/doi/10.1073/pnas.1409952112 Barrio et al.

additional cortical areas [posterior cingulate gyrus (PCG),lateral temporal lobe (LTL), and parietal lobe]; this patternis not associated with severe ventricular enlargement andprominent cortical atrophy commonly observed in aged re-tired boxers with dementia pugilistica.
iv) Pattern T4 shows high [F-18]FDDNP PET signal through-out the cortical, subcortical, and limbic medial temporallobe structures, as well as in the white matter areas; thispattern was associated with significant brain atrophy (MRIor CT); possible comorbidity of CTE with other neurode-generative diseases may be suspected, e.g., AD or end stageCTE progressing to, and simulating, AD.
All mTBI subjects (n = 14) were treated as a single group forfurther group comparison with the CTRL group (n = 28).Analysis of [F-18]FDDNP PET signal patterns T1–T4 identifiedthe dorsal midbrain and amygdala as two core regions withconsistently increased [F-18]FDDNP PET signals, which sepa-rated the mTBI group from the CTRL group as shown in the2D correlation graph in Fig. 1A (Lower). Statistical analysis(ANOVA with post hoc Tukey–Kramer test; Table 2) showsa high degree of statistical significance (P < 0.0001) for groupseparation in both areas and for a positive correlation betweenthese two areas within the mTBI group (Spearman rank corre-
lation coefficient: rS = 0.745, P < 0.01; Table S3). All subcorticaland limbic medial temporal lobe areas have also met strict cri-terion for good separation of mTBI and CTRL groups (Tukey-Kramer test at P < 0.0001) (Table 2). Other subcortical areasalso show positive Spearman rank correlations with both coreregions (Fig. S1 and Table S3) reflective of similar trends ofincreasing regional [F-18]FDDNP distribution volume ratio (DVR)values with increasing [F-18]FDDNP PET signal pattern com-plexity from T1 to T4. However, some subcortical structures likethalamus and caudate/putamen in mTBI subjects show increasedDVR values only in more severe cases.In contrast to subcortical regions, cortical areas showed dif-
ferent trajectories of involvement in the [F-18]FDDNP PETsignal patterns T1–T4 with a clear anterior–posterior gradient.This difference in cortical trajectories is reflected in separationof the mTBI and CTRL groups only in the ACG (Fig. 1B, Lower,and Fig. S1A) and frontal lobe (Figs. 1C, Lower, and 2A, z axis,and Table 2). Spearman rank correlations within the mTBIgroup were determined for combinations of all analyzed re-gions that have shown mTBI-CTRL group separations (andinvolvement in the [F-18]FDDNP PET signal patterns T1–T4)and correlations of the core regions (amygdala and dorsalmidbrain) with a large number of subcortical regions [brain-stem (pons), diencephalon (thalamus), and basal ganglia (striatum)]
Fig. 1. (Upper) [F-18]FDDNP distribution volume ratios (DVR) parametric images showing patterns T1 to T4 of increased [F-18]FDDNP signal observed inthe mTBI group compared with cognitive control subjects (Left). The T1 pattern shows involvement of two core areas which have consistently increased[F-18]FDDNP signal in all four patterns: amygdala (limbic) and dorsal midbrain (subcortical). Patterns T2 to T4 are marked by increase of [F-18]FDDNP signal inthese two core regions and progressively larger number of subcortical, limbic, and cortical areas. Although more complex patterns (e.g., T4) overlap with ADin the cortex, midbrain and amygdala signals are elevated above the levels in AD (Table 2). An AD case is shown in the right column for comparison. (Lower) Ais a 2D scatter plot showing [F-18]FDDNP DVR values in two core areas consistently involved in CTE (subcortical structures (dorsal midbrain) and limbicstructures (amygdala)), clearly demonstrating separation of mTBI and CTRL groups. B and C demonstrate similar separation effect when dorsal midbrainis compared with cortical areas typically associated with CTE and its mood disorders, namely anterior cingulate gyrus (ACG) (B) and frontal lobe (C). mTBIsubjects are represented by green circles, and CTRL subjects are represented by blue circles. See SI Materials and Methods for additional correlations of[F-18]FDDNP PET DVR values in dorsal midbrain and amygdala with several cortical and subcortical areas (Fig. S1).
Barrio et al. PNAS | Published online April 6, 2015 | E2041
MED
ICALSC
IENCE
SPN
ASPL
US

and cortical regions (frontal, ACG, LTL, parietal) were all foundto be significant (P < 0.05; Table S3). It is noteworthy that thesestructures—brainstem (midbrain, pons), limbic medial temporallobe (amygdala), and frontal lobe (frontal cortex, ACG)—areinterconnected by brain circuitry supporting normal mood andbehavioral functioning (21), which is perturbed early in subjectswith a history of multiple concussions (2, 22).
Results of ANOVA statistical tests for separation of DVRvalues in all three groups are given for all areas analyzed, andareas that meet the Tukey–Kramer test criterion of P < 0.0001are identified for comparisons of the mTBI group with theCTRL and the AD groups separately (Table 2). Tables S4(mTBI group), S5 (CTRL group), and S6 (AD group) show allregional DVR values for all subjects in all groups. Tables S7
Table 2. [F-18]FDDNP DVR group mean values for mTBI group (14 subjects), control group (28 subjects), and Alzheimer’s disease group(24 subjects)
Limbic Subcortical Cortical
Amygd MTL Midb-V Midb-D Hypo-Th Th Pons Str F ACG P PCG LTL OCC
mTBI 1.397(0.095)
1.183(0.042)
1.330(0.090)
1.373(0.060)
1.429(0.082)
1.507(0.107)
1.319(0.071)
1.531(0.104)
1.144(0.049)
1.230(0.068)
1.095(0.047)
1.160(0.077)
1.122(0.048)
0.997(0.050)
CTRL 1.162(0.036)
1.112(0.023)
1.135(0.057)
1.138(0.055)
1.234(0.049)
1.250(0.086)
1.156(0.064)
1.322(0.069)
1.039(0.033)
1.093(0.043)
1.054(0.026)
1.082(0.040)
1.064(0.026)
1.021(0.048)
AD 1.242(0.060)
1.189(0.020)
1.137(0.062)
1.164(0.078)
1.229(0.058)
1.318(0.109)
1.145(0.075)
1.345(0.090)
1.112(0.027)
1.141(0.073)
1.148(0.030)
1.180(0.022)
1.155(0.024)
1.059(0.056)
ANOVAF value 59.82* 73.26* 29.26* 26.56* 24.36* 15.01* 13.97* 21.82* 45.83* 13.72* 72.00* 44.93* 82.04* 5.43
Student t testmTBI-CTRL * * * * * * * * * * * * * *mTBI-AD * NS * * * * * * NS NS NS NS NS NSAD-CTRL * * NS NS NS NS NS NS * NS * * * NS
Tukey–Kramer testmTBI-CTRL * * * * * * * * * * NS NS NS NSmTBI-AD * NS * * * NS * * NS NS NS NS NS NSAD-CTRL * * NS NS NS NS NS NS * NS * * * NS
Mean group DVR values (SD values given in parentheses). ACG, anterior cingulate gyrus; Amygd, amygdala; F, frontal; Hypo-Th, hypothalamus;LTL, lateral temporal lobe; Midb-D, dorsal midbrain; Midb-V, ventral midbrain; MTL, medial temporal lobe; NS, not significant (P ≥ 0.0001); Occ, occipital;P, parietal; PCG, posterior cingulate gyrus; Str, striatum (caudate nucleus and putamen); Th, thalamus (medial thalamus). *P < 0.0001; NS, not significant(P ≥ 0.0001).
Fig. 2. [F-18]FDDNP PET DVR value analysis separates mTBI, CTRL and AD groups. (A) A 3D scatter plot correlation of subcortical regions (dorsal midbrain)with limbic structures (amygdala) and cortical regions (frontal lobe) shows that all three groups (mTBI, green; AD, red; CTRL, blue) can be effectively separatedbased on the differences in binding patterns in these three areas. The mTBI group is significantly separated from control group in all three areas and from theAD group in the limbic and subcortical areas (Table 2). (B) A 3D scatter plot correlation of cortical structures alone, without comparison with subcortical orlimbic structures, demonstrates that the mTBI group overlaps both with AD and CTRL groups. Results of discriminant analysis for the correlation of three areasdepicted in each 3D scatter plot are shown underneath each graph.
E2042 | www.pnas.org/cgi/doi/10.1073/pnas.1409952112 Barrio et al.

(mTBI group), S8 (CTRL group), and S9 (AD group) show allregional Z-score values for all subjects in all groups.
[F-18]FDDNP Results: Correlation with Autopsy of Confirmed CTE Cases.[F-18]FDDNP PET signal patterns T1–T4 are consistent withpathology reports showing involvement of subcortical structures(e.g., locus coeruleus, substantia nigra, dorsal raphe, thalamus,basal ganglia), limbic medial temporal lobe structures (amygdalaand MTL), and frontal cortex (6–8, 10, 11, 23). The F-18]FDDNP PET signal in the subcortical structures is in accordancewith the examples of tau IHC labeling of pons, midbrain, thalamus,and basal ganglia in CTE shown on large brain tissue samplesin refs. 7, 10, 11, and 23 (Fig. S2, Left). Presence of tau IHC insubcortical regions is further supported by our evidence from con-firmed CTE cases that were not scanned with [F-18]FDDNP PET(Fig. 3II and Fig. S2, Right). Midbrain and amygdala are uniquebrain regions with elevated [F-18]FDDNP signals found in all14 mTBI subjects. DVR values shown in Table S4 suggest that
the PET signal is not uniformly distributed throughout all midbrainstructures. A dorsal-ventral gradient observed with PET imagingagrees well with tau IHC results (Fig. 3II, Left), which shows highIHC density in the periaqueductal gray in dorsal midbrain andlesser IHC levels in substantia nigra, red nucleus, and othernuclei situated in the ventral midbrain (Fig. S2, bottom examplein the left panel) (11). Similarly, high [F-18]FDDNP signals inthe amygdala and other limbic medial temporal lobe structurescoincide with common CTE autopsy observations of high in-volvement of amygdala and MTL shown in deceased retiredprofessional American football players (Fig. 3III) (7, 23).
[F-18]FDDNP PET in mTBI vs. AD. From a perspective of clinicaldiagnosis, CTE can be mistaken for AD, particularly at laterstages (24). However, the pattern of subcortical and limbic medialtemporal lobe (amygdala vs. MTL) [F-18]FDDNP signal dis-tribution in AD is quite different from that of concussion-based mTBI (suspected CTE) (Figs. 1 and 2 and Fig. S1) (25). To
Fig. 3. Involvement of amygdala and midbrain areas in concussion-based mTBI is supported by both mechanistic concept of injury (I) and by the results ofneuropathological examinations in deceased retired American football players with premortem complaints of functional impairments (II and III). (I) Rotationof the brain in the sagittal plane during a concussion, associated with significant accelerations and deceleration, will have significant negative effect on thebrain tissue in the midbrain and thalamus (green shaded area) and on the affected cortical areas (red area). Stretching, compression, and shearing of axonsduring such sudden brain movements is hypothesized to be the cause of axonal injury (reprinted from ref. 33; reproduced with permission from Massa-chusetts Medical Society.) Online version of ref. 33 also contains an animated version of this figure (www.nejm.org/doi/full/10.1056/NEJMcp064645). Similarly,rotation in the coronal plane has been shown to lead to consistent damage to midbrain region tracts (27). (II) A–D show results of tau immunohistochemistryand demonstrate that in the mTBI group areas of increased [F-18]FDDNP signal in amygdala and dorsal midbrain coincide with presence of dense tau depositsin periaqueductal gray (PAG) in dorsal midbrain (A and B) and in amygdala (C and D; reprinted from ref. 21; reproduced with permission from Wolters KluwerHealth). (III) Amygdala and MTL areas are affected in the brains of retired professional American football players who died due to suicide (Left; 45-y-oldretired player; reprinted from ref. 21; reproduced with permission from Wolters Kluwer Health) or due to natural causes [Right; 80-y-old retired NFL player; ©Oxford University Press (brain.oxfordjournals.org/content/136/1/43) (reprinted from ref. 11)]. Amygdala and MTL areas are the first areas with high density oftau deposits in the neocortex and remain one of the most affected cortical regions in the majority of retired professional American football player cases.
Barrio et al. PNAS | Published online April 6, 2015 | E2043
MED
ICALSC
IENCE
SPN
ASPL
US
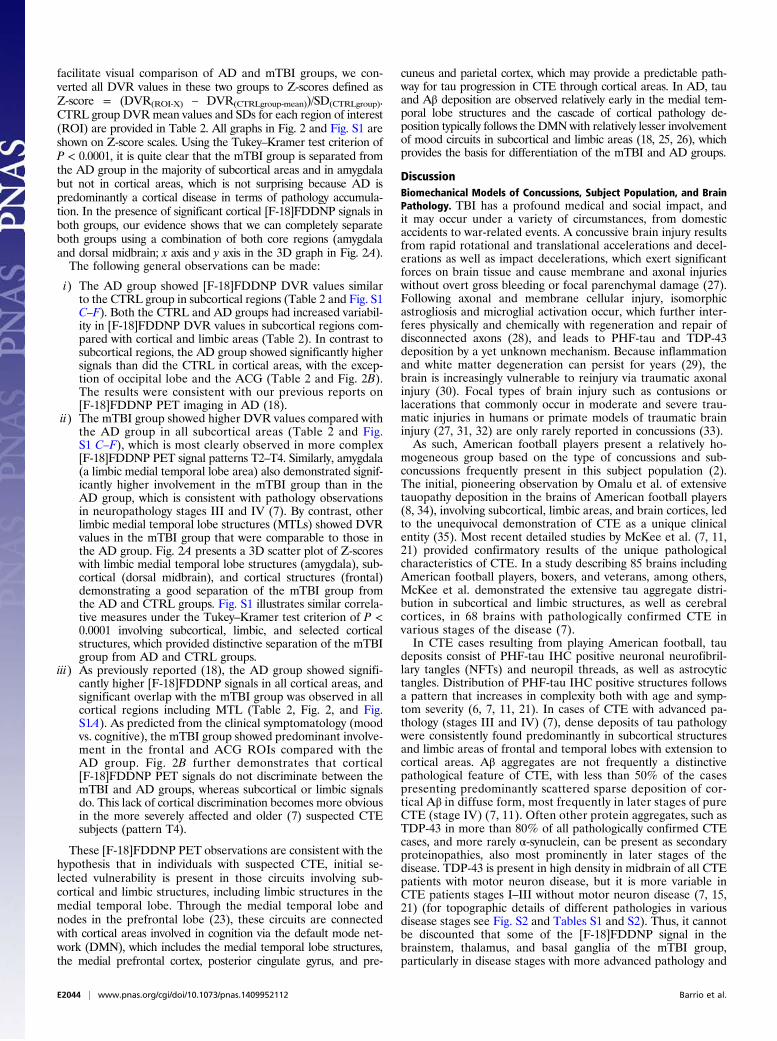
facilitate visual comparison of AD and mTBI groups, we con-verted all DVR values in these two groups to Z-scores defined asZ-score = (DVR(ROI-X) – DVR(CTRLgroup-mean))/SD(CTRLgroup).CTRL group DVRmean values and SDs for each region of interest(ROI) are provided in Table 2. All graphs in Fig. 2 and Fig. S1 areshown on Z-score scales. Using the Tukey–Kramer test criterion ofP < 0.0001, it is quite clear that the mTBI group is separated fromthe AD group in the majority of subcortical areas and in amygdalabut not in cortical areas, which is not surprising because AD ispredominantly a cortical disease in terms of pathology accumula-tion. In the presence of significant cortical [F-18]FDDNP signals inboth groups, our evidence shows that we can completely separateboth groups using a combination of both core regions (amygdalaand dorsal midbrain; x axis and y axis in the 3D graph in Fig. 2A).The following general observations can be made:
i) The AD group showed [F-18]FDDNP DVR values similarto the CTRL group in subcortical regions (Table 2 and Fig. S1C–F). Both the CTRL and AD groups had increased variabil-ity in [F-18]FDDNP DVR values in subcortical regions com-pared with cortical and limbic areas (Table 2). In contrast tosubcortical regions, the AD group showed significantly highersignals than did the CTRL in cortical areas, with the excep-tion of occipital lobe and the ACG (Table 2 and Fig. 2B).The results were consistent with our previous reports on[F-18]FDDNP PET imaging in AD (18).
ii) The mTBI group showed higher DVR values compared withthe AD group in all subcortical areas (Table 2 and Fig.S1 C–F), which is most clearly observed in more complex[F-18]FDDNP PET signal patterns T2–T4. Similarly, amygdala(a limbic medial temporal lobe area) also demonstrated signif-icantly higher involvement in the mTBI group than in theAD group, which is consistent with pathology observationsin neuropathology stages III and IV (7). By contrast, otherlimbic medial temporal lobe structures (MTLs) showed DVRvalues in the mTBI group that were comparable to those inthe AD group. Fig. 2A presents a 3D scatter plot of Z-scoreswith limbic medial temporal lobe structures (amygdala), sub-cortical (dorsal midbrain), and cortical structures (frontal)demonstrating a good separation of the mTBI group fromthe AD and CTRL groups. Fig. S1 illustrates similar correla-tive measures under the Tukey–Kramer test criterion of P <0.0001 involving subcortical, limbic, and selected corticalstructures, which provided distinctive separation of the mTBIgroup from AD and CTRL groups.
iii) As previously reported (18), the AD group showed signifi-cantly higher [F-18]FDDNP signals in all cortical areas, andsignificant overlap with the mTBI group was observed in allcortical regions including MTL (Table 2, Fig. 2, and Fig.S1A). As predicted from the clinical symptomatology (moodvs. cognitive), the mTBI group showed predominant involve-ment in the frontal and ACG ROIs compared with theAD group. Fig. 2B further demonstrates that cortical[F-18]FDDNP PET signals do not discriminate between themTBI and AD groups, whereas subcortical or limbic signalsdo. This lack of cortical discrimination becomes more obviousin the more severely affected and older (7) suspected CTEsubjects (pattern T4).
These [F-18]FDDNP PET observations are consistent with thehypothesis that in individuals with suspected CTE, initial se-lected vulnerability is present in those circuits involving sub-cortical and limbic structures, including limbic structures in themedial temporal lobe. Through the medial temporal lobe andnodes in the prefrontal lobe (23), these circuits are connectedwith cortical areas involved in cognition via the default mode net-work (DMN), which includes the medial temporal lobe structures,the medial prefrontal cortex, posterior cingulate gyrus, and pre-
cuneus and parietal cortex, which may provide a predictable path-way for tau progression in CTE through cortical areas. In AD, tauand Aβ deposition are observed relatively early in the medial tem-poral lobe structures and the cascade of cortical pathology de-position typically follows the DMNwith relatively lesser involvementof mood circuits in subcortical and limbic areas (18, 25, 26), whichprovides the basis for differentiation of the mTBI and AD groups.
DiscussionBiomechanical Models of Concussions, Subject Population, and BrainPathology. TBI has a profound medical and social impact, andit may occur under a variety of circumstances, from domesticaccidents to war-related events. A concussive brain injury resultsfrom rapid rotational and translational accelerations and decel-erations as well as impact decelerations, which exert significantforces on brain tissue and cause membrane and axonal injurieswithout overt gross bleeding or focal parenchymal damage (27).Following axonal and membrane cellular injury, isomorphicastrogliosis and microglial activation occur, which further inter-feres physically and chemically with regeneration and repair ofdisconnected axons (28), and leads to PHF-tau and TDP-43deposition by a yet unknown mechanism. Because inflammationand white matter degeneration can persist for years (29), thebrain is increasingly vulnerable to reinjury via traumatic axonalinjury (30). Focal types of brain injury such as contusions orlacerations that commonly occur in moderate and severe trau-matic injuries in humans or primate models of traumatic braininjury (27, 31, 32) are only rarely reported in concussions (33).As such, American football players present a relatively ho-
mogeneous group based on the type of concussions and sub-concussions frequently present in this subject population (2).The initial, pioneering observation by Omalu et al. of extensivetauopathy deposition in the brains of American football players(8, 34), involving subcortical, limbic areas, and brain cortices, ledto the unequivocal demonstration of CTE as a unique clinicalentity (35). Most recent detailed studies by McKee et al. (7, 11,21) provided confirmatory results of the unique pathologicalcharacteristics of CTE. In a study describing 85 brains includingAmerican football players, boxers, and veterans, among others,McKee et al. demonstrated the extensive tau aggregate distri-bution in subcortical and limbic structures, as well as cerebralcortices, in 68 brains with pathologically confirmed CTE invarious stages of the disease (7).In CTE cases resulting from playing American football, tau
deposits consist of PHF-tau IHC positive neuronal neurofibril-lary tangles (NFTs) and neuropil threads, as well as astrocytictangles. Distribution of PHF-tau IHC positive structures followsa pattern that increases in complexity both with age and symp-tom severity (6, 7, 11, 21). In cases of CTE with advanced pa-thology (stages III and IV) (7), dense deposits of tau pathologywere consistently found predominantly in subcortical structuresand limbic areas of frontal and temporal lobes with extension tocortical areas. Aβ aggregates are not frequently a distinctivepathological feature of CTE, with less than 50% of the casespresenting predominantly scattered sparse deposition of cor-tical Aβ in diffuse form, most frequently in later stages of pureCTE (stage IV) (7, 11). Often other protein aggregates, such asTDP-43 in more than 80% of all pathologically confirmed CTEcases, and more rarely α-synuclein, can be present as secondaryproteinopathies, also most prominently in later stages of thedisease. TDP-43 is present in high density in midbrain of all CTEpatients with motor neuron disease, but it is more variable inCTE patients stages I–III without motor neuron disease (7, 15,21) (for topographic details of different pathologies in variousdisease stages see Fig. S2 and Tables S1 and S2). Thus, it cannotbe discounted that some of the [F-18]FDDNP signal in thebrainstem, thalamus, and basal ganglia of the mTBI group,particularly in disease stages with more advanced pathology and
E2044 | www.pnas.org/cgi/doi/10.1073/pnas.1409952112 Barrio et al.

increased deposit densities (stage IV) (7), originates from thepresence of TDP-43. TDP-43 contains amino acid sequences thatmake it aggregation prone in vitro and also in vivo becausea portion of neuronal and glial TDP-43 inclusion bodies in motorneuron disease and CTE appear as filamentous structures (36)but are generally not considered amyloid due to missing amyloidspecific thioflavin-S fluorescent stain. Recent evidence showsthat at least some of these inclusion bodies do show the typicalthioflavin-S staining, which provides evidence for presence ofamyloid fibrillar structures within them (36).
Brain-Specific Neuropathology Accumulation Measured with [F-18]FDDNPPET. This work offers compelling evidence of the ability of[F-18]FDDNP PET to detect neuropathology in the living brainof American football players in a manner consistent with thepattern of deposition found at autopsy (6, 7, 34). [F-18]FDDNPhas a high affinity for tau fibrils (KD = 36.7 ± 11.6 nM vs. KD =5.52 ± 1.97 nM for Aβ42 fibrils) (37), which provides a highbinding potential (BP; defined as R/KD; where R = number of tauaggregate binding sites per volume of brain tissue) for tau im-aging visualization in vivo (38). The very low regional density ofother proteinaceous β-sheet–containing aggregates (e.g., TDP-43,diffuse Aβ) would result in a low [F-18]FDDNP binding potentialfor non-tau aggregates, below the limit of sensitivity of PET, in theearlier CTE stages (stages I and II) as previously shown with thelow abundance of α-synuclein in a Lewy body dementia patient(17). However, the ability of [F-18]FDDNP PET to detect Aβbecomes important to help in the characterization of AD comor-bidity when it is present, particularly in advanced neuropathologyCTE stages (stage IV) when proteinaceous neuropathologies arewidespread, and quantitation of total neuropathology load can re-flect additional pathology burden due to comorbid conditions.This investigation further confirms the unique sensitivity of [F-18]FDDNP to tau aggregates in vivo, as demonstrated by earlier workin patients with a neurodegenerative tauopathy, progressive supra-nuclear palsy (PSP) (19). All these studies in humans are supportedby the demonstration of the ability of the 6-dialkylamino naph-thalenyl-2-cyanoacrylate scaffold (present in FDDNP) to bind tightlyto tau aggregates as previously shown by X-ray analysis of crystalsobtained by cocrystallization of DDNP with tau segments (39), invitro binding affinities with tau fibrils, tau rodent models, andpostmortem autopsy results and comparisons with premortemscans (16, 17).These findings of brain tau accumulation and distribution in
this subject population are also consistent with earlier observa-tions that subcortical structures such as brainstem and thalamusare considered as the fulcrum or center point of force vectorsthat bear the maximal rotational forces in American footballplayers receiving concussions (Fig. 3) (2, 33). Axonal degenera-tion due to thousands of cranial impacts resulting in concussiveand subconcussive injuries leads to other neurodegenerativechanges including PHF-tau deposition throughout the areas ofselective vulnerability in heavily interconnected cortico-striato-pallido-thalamic loops that support emotions, mood, and be-havior (for a review of this topic, see ref. 22). Initial widespreadinvolvement of the limbic areas of the medial temporal lobe(followed by the frontal lobe) is also observed in the subjectsstudied in this investigation and defines core regions that areconsistently affected as neuropathology distribution increases incomplexity during CTE evolution (Fig. 1, Upper).These [F-18]FDDNP PET imaging patterns are observed in all
cases studied thus far, suggesting a “fingerprint” PET scan ofneuropathology accumulation that is characteristic of CTE. This[F-18]FDDNP PET imaging topographic distribution, moreover,is quite different from that found in AD (Fig. 2) and is consistentwith profiles of neuropathology distribution described by Omaluet al. (6) and McKee et al. (7) in autopsy specimens with con-firmed CTE. Omalu et al. defined four distinct pathology phe-
notypes (6), of which phenotype III (brainstem predominant)closely resembles the T1 pattern, whereas phenotypes I and II fitthe description of patterns T2 and T3 described in this work.Comparison with the pathology stages as defined by McKee et al.(7) clearly identifies that [F-18]FDDNP PET signal patterns T1–T4may primarily result from more affected examples of neuropathol-ogy stage II and from stages III and IV (Table S2) (7, 11), as they allshow prominent neuropathology in medial temporal lobe structures.[F-18]FDDNP PET signal pattern T4 parallels neuropathology ofsevere stage IV in widespread distribution of signal and in signs ofsevere atrophy of ventricles. Patterns T2 and T3 would fit into stageIII and milder examples of stage IV (Table S2) (7).
[F-18]FDDNP Signal Is Consistent with Mood and Cognitive Disordersin Suspected CTE. Dysfunction within brain circuits, caused byaxonal damage leading eventually to PHF-tau aggregate accumu-lation in CTE, is believed to be the trigger for the mood disordersobserved in these subjects who have experienced multiple con-cussions and subconcussions. Presence of axonal injury in brain-stem and cortical white matter has been demonstrated postmortemin teenagers who had a history of playing high school Americanfootball (11). Such neurodegenerative processes can produce typ-ical manifestations, initially involving behavioral and mood symp-toms and leading to subsequent impairments of cognition and, insome cases, motor impairments in later stages (22).The [F-18]FDDNP PET results in this work show direct early
involvement of brain areas that participate in processing ofemotions, mood, and behavior. We observed neuropathologydeposition using [F-18]FDDNP PET even in the minimallyaffected subjects, in the amygdala, several areas of the frontalcortex including the ACG, medial thalamus, hypothalamus, anddorsal midbrain (which contains the periaqueductal gray; Fig. 3).This midbrain pathology distribution pattern has also beenreported recently in a retired Australian rugby player with CTE(stage IV) (11). Our [F-18]FDDNP PET imaging results, togetherwith neuropathology observations at autopsy, highlight the selectivevulnerability of these midbrain structures, some of which are in-volved in maintaining consciousness, modulating pain, and con-trolling defensive behavior (27).Resting state fMRI studies also have shown that connectivity
in these circuits is altered in generalized anxiety disorder (40),panic disorder (41), and depression (42). Some aspects of theseneuronal circuits have also been closely connected with otherneurodegenerative tauopathies, e.g., progressive supranuclearpalsy, as demonstrated by Gardner et al. (43) and further con-firmed by direct measurement of PHF-tau accumulation with[F-18]FDDNP PET (19). It has been speculated that in thiscase, the connectivity of these circuits offers an opportunity fortransmissibility of tau aggregation to different brain regions ina predictable manner (44). It is possible that similar relationshipbetween neuropathology accumulation and the pattern of in-volved neuronal circuits also exists in CTE, and our currentobservations seem to confirm this possibility.Regardless of the predictable mechanism of neuropathology
transmissibility through the connectivity of these circuits, thepresent study supports a correlation between the mechanicaleffects of concussions and subconcussions on specific brain areasand accumulation of neuroaggregates with the subsequentneuronal dysfunction and their corresponding neuropsychiatricconsequences. However, effective confirmation awaits a largercohort of subjects, also including subjects suffering brain con-cussions that may be biomechanically different from those foundin American football players (e.g., war veterans, boxers). Expo-sure to blasts from explosive devices has caused changes con-sistent with TBI in war veterans, with clinical signs and changesin their DTI MRI scans consistent with traumatic diffuse axonalinjury. Our initial [F-18]FDDNP PET studies in war veteransand other severe TBIs (n = 8) seem to indicate that blast-induced
Barrio et al. PNAS | Published online April 6, 2015 | E2045
MED
ICALSC
IENCE
SPN
ASPL
US

concussions present with a different neuropathology depositionprofile than that found in blunt-force TBI or contact-sport–related concussions (Fig. S3).Clinical diagnosis of CTE remains elusive, and alternative
approaches using blood-based biomarkers of cellular degener-ation (45) are being explored; however, such methods mayprovide information about the presence of neurodegenerativeprocesses but not their brain distribution and thus may be in-ferior to brain imaging biomarkers. DTI MRI (46) can provideuseful information about axonal injury in the white matter inCTE but is not specific to this condition as other neurodegenerativediseases (e.g., AD) can have similar patterns of white matter de-generation caused by different mechanisms. Resting state fMRI hasalso been used to assess changes in large-scale cognitive networksin concussed athletes and in subjects with a history of TBI (47).The present work suggests that, based on the definition of
disease-specific tau pathology deposition stages in suspectedCTE, we can use neuropathology deposition as a brain tissuetarget for PET molecular imaging probes with in vivo sensitivityfor these neuroaggregates. However, considering that tau depositsare not specific for CTE but are present in other tauopathies andalso in AD, a simple positive or negative reading with PHF-tauPET imaging probes is in itself clinically irrelevant. Only whencombined with the regional sensitivity of PET will these probesprovide significant in vivo information about regional tau de-position throughout the entire brain, at the earliest possible stagewhen medical management is most likely to succeed with CTE.This potential can be realized if the molecular imaging probe usedhas sufficient sensitivity for in vivo detection of relevant neuro-pathology aggregates and reliably reflects the presence of theseaggregates in all brain regions affected in a concentration-dependent manner, in agreement with autopsy determinationsand with the prevalent mood and cognitive symptoms observedin this patient population.
ConclusionThis work with [F-18]FDDNP PET offers a sensitive method tovisualize and quantify the regional presence of neuroaggregatesin the living brain of human subjects with mTBI and suspectedCTE and generates useful information about the mechanismsunderlying disease staging and the mood disorders observed inthese patients. It also offers the potential for early diagnosis ofCTE in living subjects, when the probability of successful ex-perimental therapeutic interventions would be greatest. Basedon neuropathology indicators (7) (Tables S1 and S2), these[F-18]FDDNP distribution patterns in suspected CTE are largelydue to PHF-tau in milder CTE stages (stages I–III), with possibleTDP-43 and Aβ contributions in advanced CTE stages (stage IV)and in CTE with comorbidities. These [F-18]FDDNP topo-graphic distribution patterns are unique among neurodegenera-tive diseases and significantly different from those found in AD(Figs. 1 and 2), progressive supranuclear palsy (19), and fronto-temporal lobar degeneration (20). Thus, [F-18]FDDNP PEToffers critical help in their differential diagnosis within a contextof clinical history, physical examination, neuropsychiatric evalua-tion, and conventional radiological scans. These promising resultsprovide the basis for a larger trial to determine the scope of thisimaging procedure for CTE and for the use of this PET imagingtechnique to monitor disease progression in follow-up studies.
Materials and MethodsWritten, informed consent for this [F-18]FDDNP PET imaging study wasobtained from subjects in accordance with procedures of the Office of theHuman Research Protection Program (OHRPP) of the University of California,Los Angeles, under strict, standard ethics guidelines.
Patient Population and Neurobehavioral Symptoms. The mTBI group includedsubjects with an increased risk of developing CTE as a result of having re-
ceived repetitive concussions and subconcussions and presenting persistentcognitive, behavioral, and psychiatric problems, as defined by McKee et al.(7). It consisted of 14 retired male professional athletes who played Ameri-can football professionally with histories of mood and cognitive symptomsas described above and in Table 1. Subjects TBI01–TBI05 from a preliminaryreport (16) have been included in this work. All mTBI subjects were college-educated retired professional American football players (age range, 40–86 y;mean ± SD = 57.2 ± 11.6 y; mean years of education ± SD = 16.2 ± 1.4 y),who had played from 9 to 17 combined preprofessional (high school, college)and professional years (mean ± SD = 13.4 ± 3.6). All players, with the exceptionof a 64-y-old former quarterback (TBI02; Table 1), showed evidence of cog-nitive impairment. A standard neuropsychological test battery indicated that12 subjects had a diagnosis of mild cognitive impairment (MCI), which is a riskstate for dementia. A 73-y-old former offensive guard had a diagnosis ofdementia (TBI03). Most subjects also showed symptoms of depression (mean ±SD: HAM-D score = 12.8 ± 8.3) and anxiety (mean ± SD: HAM-A score = 12.1 ±8.7). The mTBI subjects also had more prominent cognitive and mood symp-toms than motor symptoms. As part of the neurological examinations, motorand balance performance were measured on nine subjects using a modifiedBalance Error Scoring System (BESS) assessment (mean score ± SD = 18.9 ± 5.6)(48) and the Chronic Brain Injury Scale (mean score ± SD = 2.9 ± 1.1) (49).
Radiosynthesis. [F-18]FDDNP was prepared as previously described (50) fol-lowing current US Pharmacopeia 823 requirements for chemistry, manu-facture, and control of PET radiopharmaceuticals for human use (51).
PET Scanning. All PET scans of the mTBI group were performed on a BiographPET/CT camera, except for one subject who was scanned using an ECAT HR+PET camera (subject TBI01) (both Siemens/CTI), with subjects in the supineposition and with the imaging plane parallel to the orbito-meatal line asdescribed previously (18). A bolus of [F-18]FDDNP (320–550 MBq) wasinjected through an indwelling venous catheter as a bolus i.v. injectionfollowing a 10-min attenuation scan. The dynamic data acquisition wasstarted at the time of injection, and the following time frames were col-lected: 6 × 30, 4 × 180, and 10 × 300 s (total duration: 65 min). All PET scanswere decay corrected and reconstructed using filtered back-projection(Hann filter, 5.5-mm FWHM) with scatter correction and measured attenuationcorrection. The resulting images from the PET/CT camera contained 109contiguous slices with a plane-to-plane separation of 2.0 mm. Performanceof PET scanners (e.g., Biograph, ECAT HR or ECAT EXACT HR+ scanner; Sie-mens CTI) was tested using the Hoffman brain phantom, and no significantdifferences between images from the two scanners were observed. Allsubjects from the AD and CTRL groups were scanned as previously reported(18) and summarized in the SI Materials and Methods.
Imaging Data Analysis. Quantification of the [F-18]FDDNP binding data forthe mTBI group was performed using the Logan graphical method, with thecerebellar gray matter as the reference region, for time points between 15and 65 min (52, 53). The relative distribution volume (DVR) parametricimages were generated and analyzed with the use of regions of interest(ROIs) drawn bilaterally on the coregistered MRI or CT scans for a number ofcortical, limbic, and subcortical areas as defined below. No atrophy correc-tion of the PET data was performed. Partial volume effects result in re-duction of the PET signal due to brain atrophy, and if performed, thiscorrection would increase the intensity of the [F-18]FDDNP brain signal evenfurther. Results of [F-18]FDDNP PET data quantification are provided as DVRvalues (Tables S4–S6) and as Z-scores (Tables S7–S9). DVR values for all ROIsare also provided in cumulative form (as group mean DVR value ± SD) for 28cognitively intact control subjects and for 24 AD subjects previously reported(18). These subjects were included in the analysis to provide negative (CTRLgroup) and positive (AD group) reference points for low and high DVRvalues in the areas where fibrillar protein aggregates are present in AD(predominantly cortical areas). Both the CTRL and AD groups appear asrelatively homogeneous groups based on age and cognitive performance,but the TBI group contains subjects with a range of impairments.
ROIs. ROI sets included subcortical areas [striatum (Str), medial thalamus (Th),hypothalamus (Hypo-Th), dorsal midbrain (Midb-D), ventral midbrain (Midb-V),pons (Pons)], limbic areas of the medial temporal lobe [amygdala (Amygd),hippocampus with parahippocampal gyrus and entorhinal cortex (MTL)], andcortical areas [frontal lobe (F), anterior cingulate gyrus (ACG), parietal lobe (P),posterior cingulate gyrus (PCG), lateral temporal lobe (LTL) and occipital lobe(Occ)]. ROIs were drawn bilaterally on each region, with the exception of thedorsal midbrain (Midb-D), where only one ROI was placed, and striatum (Str),which has been determined as an average of caudate nucleus and putamen.
E2046 | www.pnas.org/cgi/doi/10.1073/pnas.1409952112 Barrio et al.

MRI Scanning. MRI scans were performed for the purpose of anatomicalreference to aid the analysis of PET data as described previously (18). T1-weighted magnetization-prepared rapid acquisition gradient-echo (MPRAGE)MRI volumetric scans, using a 3-T Siemens Allegra MRI scanner, were obtainedfor nine mTBI subjects (sagittal plane; repetition time, 2,300 ms; echo time,2.93 ms; 160 slices; slice thickness, 1 mm; skip, 0.5 mm; in-plane voxel size, 1.3 ×1.3 mm; field of view, 256 × 256; flip angle, 8°). Four of the other mTBI subjectsreceived CT scans because they could not tolerate an MRI scan (e.g., becauseof anxiety, claustrophobia, or metal in the body). One subject (TBI10) wasunable to undergo either MRI or CT scans.
Statistical Analysis. Statistical analyses were performed with the use of SASsoftware (version 9.2). P < 0.0001 was considered statistically significant unlessotherwise stated. One-way ANOVA with Tukey–Kramer post hoc multiple com-parisons was used to test for statistically significant differences in regional [F-18]FDDNP binding (DVR values) among the three groups of subjects. MultivariateANOVA (MANOVA) was used to determine if a selected pair of regional DVRvariables showed significant differences among normal controls and CTEs. Spear-man rank correlations were computed between regional [F-18]FDDNP bindingwithin the mTBI group to determine their associations, and scatter plots weregenerated to visualize how regional DVR variables related to one another (P< 0.05was considered statistically significant for this test). Discriminant analysis (DA) (54)
was used to evaluate the performance of classification of subjects withknown group memberships (CTRL, mTBI, or AD) based on the selectedcombinations of various regional [F-18]FDDNP DVR values as predictorvariables. Because of a large number of possible combinations of pre-dictor variables for DA, a backward elimination analysis was performed todetermine the set of predictor variables that optimally discriminating thethree groups (54). All predictor variables were first included, and the leastsignificant variable (F-test, P > 0.15) was removed in a stepwise manner. Thisvariable elimination procedure was repeated until no variable could be re-moved. The resulting reduced DA model functions and their canonical var-iables were used to assess the degree of overlapping between groups bycalculating the percent of correct group classification and the overall clas-sification accuracy, both of which were cross-validated by a leave-one-outmethod (54).
ACKNOWLEDGMENTS. We thank Natacha Donoghue and Jacqueline Marti-nez for subject scheduling and management; John Williams, University ofCalifornia, Los Angeles, Nuclear Medicine Clinic, for performing the PETscans; and Shelley West, Billy West, and Bus Cook for guidance with subjectreferral and for their helpful input. Funding from the National Institutes ofHealth (P01-AG025831 and M01-RR00865), the Toulmin Foundation, andRobert and Marion Wilson is highly appreciated. No company providedresearch funding for this study.
1. McCrory P, et al. (2013) Consensus statement on concussion in sport: The 4thInternational Conference on Concussion in Sport held in Zurich, November 2012. Br JSports Med 47(5):250–258.
2. Bailes JE, Petraglia AL, Omalu BI, Nauman E, Talavage T (2013) Role of subconcussionin repetitive mild traumatic brain injury. J Neurosurg 119(5):1235–1245.
3. Martland HS (1928) Punch drunk. JAMA 91(15):1103–1107.4. Millspaugh JA (1937) Dementia pugilistica. U S Nav Med Bull 35(3):297–303.5. Roberts AH (1969) Brain Damage in Boxers: A Study of the Prevalence of Traumatic
Encephalopathy Among Ex-Professional Boxers (Pitman Medical & Scientific Publish-ing Company, London).
6. Omalu B, et al. (2011) Emerging histomorphologic phenotypes of chronic traumaticencephalopathy in American athletes. Neurosurgery 69(1):173–183.
7. McKee AC, et al. (2013) The spectrum of disease in chronic traumatic encephalopathy.Brain 136(Pt 1):43–64.
8. Omalu BI, et al. (2005) Chronic traumatic encephalopathy in a National FootballLeague player. Neurosurgery 57(1):128–134, discussion 128–134.
9. Stern RA, et al. (2011) Long-term consequences of repetitive brain trauma: Chronictraumatic encephalopathy. PM R 3(10, Suppl 2):S460–S467.
10. Stein TD, Alvarez VE, McKee AC (2014) Chronic traumatic encephalopathy: A spec-trum of neuropathological changes following repetitive brain trauma in athletes andmilitary personnel. Alzheimers Res Ther 6(1):4.
11. McKee AC, Daneshvar DH, Alvarez VE, Stein TD (2014) The neuropathology of sport.Acta Neuropathol 127(1):29–51.
12. Omalu B, et al. (2011) Chronic traumatic encephalopathy in an Iraqi war veteran withposttraumatic stress disorder who committed suicide. Neurosurg Focus 31(5):E3,10.3171/2011.9.FOCUS11178.
13. Geddes JF, Vowles GH, Robinson SF, Sutcliffe JC (1996) Neurofibrillary tangles, but notAlzheimer-type pathology, in a young boxer. Neuropathol Appl Neurobiol 22(1):12–16.
14. Hof PR, Knabe R, Bovier P, Bouras C (1991) Neuropathological observations in a caseof autism presenting with self-injury behavior. Acta Neuropathol 82(4):321–326.
15. McKee AC, et al. (2010) TDP-43 proteinopathy and motor neuron disease in chronictraumatic encephalopathy. J Neuropathol Exp Neurol 69(9):918–929.
16. Small GW, et al. (2013) PET scanning of brain tau in retired national football leagueplayers: Preliminary findings. Am J Geriatr Psychiatry 21(2):138–144.
17. Smid LM, et al. (2013) Postmortem 3-D brain hemisphere cortical tau and amyloid-βpathology mapping and quantification as a validation method of neuropathologyimaging. J Alzheimers Dis 36(2):261–274.
18. Small GW, et al. (2006) PET of brain amyloid and tau in mild cognitive impairment.N Engl J Med 355(25):2652–2663.
19. Kepe V, et al. (2013) PET imaging of neuropathology in tauopathies: Progressivesupranuclear palsy. J Alzheimers Dis 36(1):145–153.
20. Barrio JR, et al. (2009) Dissecting molecular mechanisms in the living brain of de-mentia patients. Acc Chem Res 42(7):842–850.
21. McKee AC, et al. (2009) Chronic traumatic encephalopathy in athletes: Progressivetauopathy after repetitive head injury. J Neuropathol Exp Neurol 68(7):709–735.
22. Price JL, Drevets WC (2010) Neurocircuitry of mood disorders. Neuropsychopharmacology35(1):192–216.
23. Stern RA, et al. (2013) Clinical presentation of chronic traumatic encephalopathy.Neurology 81(13):1122–1129.
24. Randolph C (2014) Is chronic traumatic encephalopathy a real disease? Curr SportsMed Rep 13(1):33–37.
25. Protas HD, et al. (2012) Prediction of cognitive decline based on hemispheric corticalsurface maps of FDDNP PET. Neuroimage 61(4):749–760.
26. Braak H, Braak E (1991) Neuropathological stageing of Alzheimer-related changes.Acta Neuropathol 82(4):239–259.
27. Adams JH, Graham DI, Murray LS, Scott G (1982) Diffuse axonal injury due to non-missile head injury in humans: an analysis of 45 cases. Ann Neurol 12(6):557–563.
28. Buss A, et al. (2004) Gradual loss of myelin and formation of an astrocytic scar duringWallerian degeneration in the human spinal cord. Brain 127(Pt 1):34–44.
29. Johnson VE, et al. (2013) Inflammation and white matter degeneration persist foryears after a single traumatic brain injury. Brain 136(Pt 1):28–42.
30. Blaylock RL, Maroon J (2011) Immunoexcitotoxicity as a central mechanism in chronictraumatic encephalopathy-A unifying hypothesis. Surg Neurol Int 2:107.
31. Strich SJ, Oxon DM (1961) Shearing of nerve fibers as a cause of brain damage due tohead injury: A pathological study of twenty cases. Lancet 278(7200):443–448.
32. Prins M, Greco T, Alexander D, Giza CC (2013) The pathophysiology of traumatic braininjury at a glance. Dis Model Mech 6(6):1307–1315.
33. Ropper AH, Gorson KC (2007) Clinical practice. Concussion. N Engl J Med 356(2):166–172.34. Omalu BI, et al. (2006) Chronic traumatic encephalopathy in a national football lea-
gue player: Part II. Neurosurgery 59(5):1086–1092, discussion 1092–1093.35. Gavett BE, et al. (2011) Clinical appraisal of chronic traumatic encephalopathy: Cur-
rent perspectives and future directions. Curr Opin Neurol 24(6):525–531.36. Robinson JL, et al. (2013) TDP-43 skeins show properties of amyloid in a subset of ALS
cases. Acta Neuropathol 125(1):121–131.37. Harada R, et al. (2013) Comparison of the binding characteristics of [18F]THK-523 and
other amyloid imaging tracers to Alzheimer’s disease pathology. Eur J Nucl Med MolImaging 40(1):125–132.
38. Mintun MA, Raichle ME, Kilbourn MR, Wooten GF, Welch MJ (1984) A quantitativemodel for the in vivo assessment of drug binding sites with positron emission to-mography. Ann Neurol 15(3):217–227.
39. Landau M, et al. (2011) Towards a pharmacophore for amyloid. PLoS Biol 9(6):e1001080.40. Prater KE, Hosanagar A, Klumpp H, Angstadt M, Phan KL (2013) Aberrant amygdala-
frontal cortex connectivity during perception of fearful faces and at rest in gener-alized social anxiety disorder. Depress Anxiety 30(3):234–241.
41. Pannekoek JN, et al. (2013) Aberrant limbic and salience network resting-state func-tional connectivity in panic disorder without comorbidity. J Affect Disord 145(1):29–35.
42. Ramasubbu R, et al. (2014) Reduced intrinsic connectivity of amygdala in adults withmajor depressive disorder. Front Psychiatry 5:17.
43. Gardner RC, et al. (2013) Intrinsic connectivity network disruption in progressive su-pranuclear palsy. Ann Neurol 73(5):603–616.
44. Clavaguera F, et al. (2013) Brain homogenates from human tauopathies induce tauinclusions in mouse brain. Proc Natl Acad Sci USA 110(23):9535–9540.
45. Jeter CB, et al. (2013) Biomarkers for the diagnosis and prognosis of mild traumaticbrain injury/concussion. J Neurotrauma 30(8):657–670.
46. Shenton ME, et al. (2012) A review of magnetic resonance imaging and diffusion tensorimaging findings in mild traumatic brain injury. Brain Imaging Behav 6(2):137–192.
47. Palacios EM, et al. (2013) Resting-state functional magnetic resonance imaging activity andconnectivity and cognitive outcome in traumatic brain injury. JAMA Neurol 70(7):845–851.
48. Brown HJ, et al. (2014) Development and validation of an objective balance errorscoring system. Med Sci Sports Exerc 46(8):1610–1616.
49. Jordan BD, et al. (1997) Apolipoprotein E epsilon4 associated with chronic traumaticbrain injury in boxing. JAMA 278(2):136–140.
50. Liu J, et al. (2007) High-yield, automated radiosynthesis of 2-(1-6-[(2-[18F]fluoroethyl)(methyl)amino]-2-naphthylethylidene)malononitrile ([18F]FDDNP) ready for animalor human administration. Mol Imaging Biol 9(1):6–16.
51. US Pharmacopeial Convention (2013) Positron emission tomography drugs for com-pounding, investigational, and research uses. US Pharmacopeia 36–National Formu-lary 31 (US Pharmacopeial Convention, Rockville, MD), General Chapter 823.
52. Kepe V, Huang SC, Small GW, Satyamurthy N, Barrio JR (2006) Visualizing pathology depositsin the living brain of patients with Alzheimer’s disease. Methods Enzymol 412:144–160.
53. Tantawy MN, et al. (2009) [(18)F]Fallypride dopamine D2 receptor studies using de-layed microPET scans and a modified Logan plot. Nucl Med Biol 36(8):931–940.
54. McLachlan GJ (1992) Discriminant Analysis and Statistical Pattern Recognition (JohnWiley & Sons, Hoboken, NJ).
Barrio et al. PNAS | Published online April 6, 2015 | E2047
MED
ICALSC
IENCE
SPN
ASPL
US