in vivo stability and biodistribution of superparamagnetic …rx918059r/... · in vivo stability...
TRANSCRIPT

In vivo Stability and Biodistribution of Superparamagnetic
Iron Oxide Nanoparticles Radiolabeled with Indium-111
Master’s Thesis
By
Haotian Wang
Advisor: Dr. Samuel John Gatley
to
The Bouvé Graduate School of Health Sciences
In Partial Fulfillment of the Requirements for the Degree of Master of
Science in Pharmaceutical Science with Specialization in
Pharmaceutics and Drug Delivery
NORTHEASTERN UNIVERSITY
BOSTON, MASSACHUSETTS
January, 2014

ABSTRACT
Nanoparticles of various kinds have generated considerable excitement as vehicles for drug
delivery, and as imaging agents (Yen, 2013). Magnetic nanoparticles are of particular
interest since their distribution in the body can be manipulated using magnetic fields, and
they can also act as highly sensitive contrast agents in magnetic resonance imaging (MRI)
(Bonnemain, 1998; Wang, Hussain, & Krestin, 2001). For some applications, radionuclide
imaging (Positron emission tomography (PET) or Single-photon emission computed
tomography (SPECT)) offers advantages when used in conjunction with MRI, since the
strengths of the two modalities, higher spatial resolution for MRI, but better quantification
for PET or SPECT, are complementary (Bouziotis et al., 2012). On the other hand, the
validity of dual modality imaging requires that the association between radioactive label
and magnetic label remains intact in the human or animal body during the period of study.
Evaluation of the extent to which this requirement is true for PEGylated nanoparticles
containing a core of superparamagnetic iron oxide (SPION), and also labeled with a
radioactive metal which is commonly used in nuclear medicine, indium-111, is a major
component of this proposal.
In the present study, we prepared SPIONs using co-precipitation of iron oxide,
complexation with oleic acid, and final coating of the particles with DSPE-PEG plus
DMPE-DTPA using the lipid rehydration technique. We radiolabeled the particles by
introducing iron-59 ferric chloride or carbon-14 oleic acid during their preparation, and by
forming a chelate between the anchored DTPA and indium-111. We conducted
biodistribution studies in mice with particles labeled with each radionuclide, and also with
indium-111 labeled indium citrate, indium-DTPA, and DMPE-DTPA-indium, and with

carbon-14 oleic acid. We found that that the radioactivity from radioindium labeled
SPIONs was, as hypothesized, preferentially localized in liver, spleen and bone associated
with trapping of colloids by reticuloendothelial cells. However, radioactivity from SPIONs
labeled with iron-59 was accumulated in liver, spleen and bone to a greater extent than
from indium-111 labeled SPIONs, showing that the association of indium with the particles
is not completely maintained in vivo. Radioactivity from SPIONs labeled with carbon-
14 oleic acid exhibited a quite different distribution pattern to iron-59 or indium-111, and
so does not remain with the iron oxide core after injection into mice.

NORTHEASTERN UNIVERSITY
Graduate School of Bouvé College of Health Sciences
Thesis Approval
Thesis title: In vivo Stability and Biodistribution of Superparamagnetic Iron Oxide
Nanoparticles Radiolabeled with Indium-111
Author: Haotian Wang
Program: Pharmaceutical Sciences
Approval for thesis requirements for the Master of Science Degree
in Pharmaceutical Sciences
Thesis Committee
(Chairman) Date
Other committee members:
Date
Date
Date
Dean of the Bouvé College Graduate School of Health Sciences:
Date

5
ACKNOWLEDGEMENTS
I would like to express my heartfelt gratitude and deepest appreciation to my supervisor,
Dr. John Gatley, for his invaluable advice and support throughout my project. His
brilliant ideas, guidance and mentoring helped me overcome many hurdles throughout
my Master’s research. Without your understanding and patience none of this would
have been possible.
I would like to thank my thesis committee members, Dr. Richard Duclos, Dr. Rajiv
Kumar and Dr. Ban-an Khaw, for their time, invaluable advice on my thesis project and
moral support.
I would particularly like to thank Dr. Dattatri Nagesha for his help and support in the
initial setting up of the project and for guiding me throughout.
Special thanks to Dr. Srinivas Sridhar for allowing me to learn the synthesis of SPIONs.
My sincere thanks to Sarom, Kun, Shilpa, Nidhi, Yu, Codi, Jodi, Rita and all my friends
who have given their time, their knowledge and their resources to help me.
Last but most importantly, I want to thank my parents, who have sacrificed much to
ensure that I have the best in life. And finally, I would like to thank my wonderful wife,
Lu, who has been there for me through the toughest of times and completely supporting
my dreams.

6
TABLE OF CONTENTS
ABSTRACT .................................................................................................................. 2
ACKNOWLEDGEMENTS ........................................................................................ 5
TABLE OF CONTENTS ............................................................................................. 6
LIST OF TABLES ..................................................................................................... 9
LIST OF FIGURES ................................................................................................. 10
1. INTRODUCTION.................................................................................................. 12
1.1 Brief Introduction to the History of Nanotechnology ....................................... 12
1.2 Nanoparticles Platform ...................................................................................... 15
1.2.1 Liposomes ............................................................................................... 15
1.2.2 Polymeric micelles .................................................................................. 16
1.2.3 Superparamagnetic Iron Oxide Nanoparticles (SPIONs) ....................... 17
1.3 Rationale for each Specific Aim ....................................................................... 18
2. SPECIFIC AIMS .................................................................................................... 22
2.1 Objectives .......................................................................................................... 22
2.2 Hypothesis ......................................................................................................... 23

7
3. MATERIAL AND METHODS ............................................................................. 25
3.1 Animals ............................................................................................................. 25
3.2 Chemical Reagents ............................................................................................ 25
3.3 Preparation of Superparamagnetic Iron Oxide Nanoparticles (SPIONs) .......... 26
3.4 Preparation of DSPE-PEGylated SPIONs ........................................................ 27
3.5 Characterization of PEGylated SPIONs ............................................................ 27
3.5.1 Particle Size and Surface Charge Analysis ............................................. 27
3.5.2 Transmission Electron Microscopy (TEM) ............................................ 28
3.6 Radiolabeling PEGylated SPIONs with Indium-111 ........................................ 28
3.7 Biodistribution Studies of indium-111 Radiolabeled PEGylated SPIONs........ 29
3.8 Biodistribution Studies of indium-111 Radiolabeled indium citrate, indium-
DTPA and DMPE-DTPA-indium ............................................................................ 29
3.8.1 Preparation of indium-111 radiolabeled indium citrate solution ............ 29
3.8.2 Preparation of indium-111 radiolabeled indium-DTPA solution ............ 30
3.8.3 Preparation of indium-111 radiolabeled DMPE-DTPA-indium solution 30
3.8.4 In vivo Biodistribution Studies................................................................ 30

8
3.9 Biodistribution studies of iron-59 and carbon-14 oleic acid radiolabeled
PEGylated SPIONs ................................................................................................. 31
3.9.1 Preparation of iron-59 or carbon-14 oleic acid radiolabeled SPIONs .... 31
3.9.2 In vivo biodistribution studies ................................................................. 32
4. RESULTS AND DISCUSSIONS........................................................................... 33
4.1 Preparation and Characterization of PEGylated SPIONs ................................. 33
4.2 Radiolabeling of PEGylated SPIONs with Indium-111 .................................... 35
4.3 Biodistribution of indium-111 radiolabeled PEGylated SPIONs ...................... 35
4.4 Biodistribution of indium-111 radiolabeled indium citrate, indium-DTPA and
DMPE-DTPA-indium .............................................................................................. 38
4.5 Biodistribution of iron-59 or carbon-14 oleic acid radiolabeled PEGylated
SPIONs .................................................................................................................... 43
4.6 OVERALL CONCLUSIONS ........................................................................... 49
5. LIMITATIONS AND FUTURE DIRECTIONS ............................................... 51
6. BIBLIOGRAPHY ............................................................................................... 52

9
LIST OF TABLES
Page Number
Table 1: Radioactivity recovered of 111indium with SPIONs in 35
successive filtration.
Table 2: Biodistribution data of indium-111 labeled PEGylated SPIONs 36
at different time points.
Table 3: Biodistribution data of indium-111 labeled DMPE-DTPA- 42
indium, indium citrate and indium-DTPA.
Table 4: Biodistribution data of iron-59 labeled PEGylated SPIONs 44
Table 5: Biodistribution data of carbon-14 oleic acid labeled PEGylated 45
SPIONs.

10
LIST OF FIGURES
Page Number
Figure 1: Photographs of (a) the Lycurgus cup; and (b) Church 14
window in the Cathédrale Notre-Dame de Chartres.
Figure 2: Schematic structure of (a) non-modified liposomes; 16
(b) PEGylated liposomes with PEG coated on the surface;
(c) immune-liposomes with antibodies attached to the
surface.
Figure 3: Schematic structure of self-assembled micelles. 17
Figure 4: Schematic diagram of oleic acid stabilized SPIONs. 22
Figure 5: Schematic structure of water dispersible polyethylene glycol 23
SPIONs.
Figure 6: Particles size of PEGylated SPIONs measured using 33
dynamic light scattering in 90Plus particle size analyzer
Figure 7: Stability Measurement of PEGylated SPIONs for consistent 34
7 days.
Figure 8: TEM micrograph of the iron core of PEGylated SPIONs 34
Figure 9: Graph of biodistribution of 111indium labeled PEGylated 37
SPIONs at different time points.
Figure 10: Indium-111 in urine after administration of 111indium 37
labeled PEGylated SPIONs.
Figure 11: Graphs showing liver-to-blood (left) and brain-to-blood 38
(right) ratios versus time.

11
Page Number
Figure 12: Comparison of biodistribution between indium-SPIONs 39
and DMPE-DTPA-indium at 30 min and 2 h.
Figure 13: Comparison of liver-to-blood ratios versus time between. 39
indium-SPIONs and DMPE-DTPA-indium.
Figure 14: Comparison of urine radioactivity between indium-SPIONs 40
and DMPE-DTPA-indium.
Figure 15: Comparison of biodistribution of indium-SPIONs, DMPE- 42
DTPA-indium and indium citrate at 30 minutes post
injection.
Figure 16: Comparison of indium-111, iron-59, and carbon-14 oleic 46
acid biodistribution patterns in liver, spleen, bone, blood
and kidney at 10 min, 30 min, and 24 h time points.

12
1. INTRODUCTION
1.1 Brief Introduction to the History of Nanotechnology
According to the International Union of Pure and Applied Chemistry (IUPAC),
International Organization for Standardization (ISO), American Society of Testing and
Materials (ASTM) and National Institute of Occupational Safety and Health (NIOSH),
nanoparticles are defined as particles of size between 1 and 100 nm (Vert et al., 2012;
Horikoshi & Serpone, 2013). Although terms such as “nanoparticle” and
“nanotechnology”, which was first coined by Professor Taniguchi (1974), are of fairly
modern origin practical uses of nanoparticles predate recognition of their existence by
many centuries (Colomban, 2009). In ancient Rome (4th Century A.D.) craftsmen knew
how to produce colored glasses, sculptures and paintings that we now know owed their
optical properties to gold and silver nanoparticles (Hougha, Noblea, & Reich, 2011).
The Lycurgus Cup (Figure 1a) in the British Museum of London is an amazing example.
Its color changes from green in daylight to red when illuminated from the inside
(Heiligtag & Niederberger, 2013; Freestone et al., 2007). From the Medieval Period to
the Renaissance Period, stained glass church windows (Figure 1b) of breathtaking
beauty were made that owed their ruby red color to gold nanoparticles and their deep
yellow color to silver nanoparticles (Jin et al., 2001) and the size of metal nanoparticles
is critical to producing particular colors. The astonishing discovery in nanoparticle
research was made by Michael Faraday approximately 157 years ago (1857). Faraday
prepared his deep red gold dispersions by reduction of an aqueous solution of

13
chloroaurate (Na[AuCl4]) by phosphorus in carbon disulfide (a two-phase system). The
red “solution” was due to the optical property of gold nanoparticles. Later, such
“solutions” became known as colloidal systems, which are defined as particles of size
between 1 and 1000 nm of one material or composition suspended in another material.
Milk, blood and paint are colloidal systems. In fact, Faraday’s systematic studies on the
interaction between light and metal nanoparticles is considered as the threshold of
modern colloid chemistry and the beginning of Nanoscience and Nanotechnology
(Edwards & Thomas, 2007). Thus there is considerable overlap in terminology between
“nanoparticles” and “colloids”. An early medical application of a colloid was the X-ray
contrast agent Thorotrast (Dickson 1932). This consisted of an injected preparation of
particles of thorium-232 dioxide that were taken up by reticuloendothelial cells in the
liver and, since thorium is opaque to X-rays, permitted medical imaging of this organ.
It was used worldwide from 1930 to 1950 (Kaick. Et al., 1999; Jellinek, 2004).
Unfortunately, thorium dioxide particles remained in the liver for the patients’ lifetime
and is radioactive, and since thorium emits alpha particles, many people developed liver
cancer many years later. This may be the first medical use of a nanoparticle. Another
imaging application example is the utilization of sulfur colloid, labeled with
Technetium-99m for liver and spleen scanning (Stern, McAfee, & Subramanian, 1966).
This radiopharmaceutical is still used today in nuclear medicine (Bhalani et al., 2012).

14
Figure 1. Photographs of (a) the Lycurgus cup displays different colors depending on
whether it is illuminated externally (left) or internally (right) (The British Museum); (b)
Church window in the Cathédrale Notre-Dame de Chartres (France). (Horikoshi &
Serpone, 2013)
In the 20th century, a much better understanding of colloidal systems developed due to
advances in physical instrumentation. For example, conventional light microscopes are
unable to visualize objects as small as 100 nm, but the development of the electron
microscope by German scientists Max Knoll and Ernst Ruska in 1931 enabled
researchers to detect and measure objects in this size-range.
Additionally, in the early 20th century, the idea of targeted delivery to enhance drug
therapy was conceptualized by German scientist Dr. Paul Ehrlich. The word
“Zauberkugeln” – “Magic Bullets” – in English was coined to describe selectively
targeted chemotherapy (Kreuter, 2007; Yordanov, 2013). Ehrlich’s notion was the use
of histological dyes, which had affinity for syphilis bacteria in tissues, to deliver arsenic,
which was toxic to the bacteria. The dye was the vehicle and arsenic was the cargo
(Ehrlich, 1877). Salvarsan was actually a low molecular weight compound, but the idea
of drug delivery vehicles is now more commonly associated with nanoparticles.

15
Nowadays, the literature on this subject is very large. A MEDLINE search on
“nanoparticle” and “drug delivery” on January 9th, 2014 yielded almost 17,000 articles.
1.2 Nanoparticles Platform
Nanotechnologies have the potential to revolutionize the drug development process and
change the landscape of the pharmaceutical industry (Allen & Cullis, 2004; Shi et al.,
2010). Many different nanoparticles platforms have shown promise in delivering drugs
to desired tissue sites in the body such as liposomes, polymeric micelles, dendrimers,
etc. (Farokhzad & Langer, 2009) Because these carriers have high loading efficiencies
and protect drugs from undesired in vivo interference, nanotechnologies can improve
the therapeutic effect of drugs by enhancing their efficacy and/or increasing their
tolerability in the body (Swami et al., 2010; Zhang et al., 2007). Here are some
examples:
1.2.1 Liposomes
Liposomes are multilayer vesicular platform made with interior aqueous phospholipid
(such as phosphatidylcholine) bilayered membrane structures (Antimisiaris, Kallinteri,
& Fatouros, 2007). Hydrophobic agents can be incorporated into the phospholipid
membrane, while hydrophilic agents can be inserted into the aqueous interior. The
vesicles size can range from several microns to 30 nm (Barenholz, 2001). The
encapsulated drugs can be released in the body when the liposomes are broken down
by enzymes or by the fusion of the liposomal bilayer with the cell membrane or

16
endosomal membrane (Farokhzad & Langer, 2006). Moreover, liposomes have
properties including long circulation time in the body system, ease of surface
modification, and fewer side effects that make them well suited as drug delivery carriers
(Antimisiaris, Kallinteri, & Fatouros, 2007). Current research is focused on the
development of multifunctional nanocarriers that combine the advantages of the basic
types leading to improved efficacy (Torchilin, 2009). Major types of liposomes are
shown in Figure 2. Liposomes were the first nano-based drug carriers to be approved
by the Food and Drug Administration (FDA) for clinical use. For instance, DOXIL®
(doxorubicin liposomes) was approved in 1995 for the treatment of patients with
ovarian cancer whose disease has progressed or recurred after platinum-based
chemotherapy (Barenholz, 2012).
Figure 2. Schematic structure of (a) non-modified liposomes; (b) PEGylated liposomes
with PEG coated on the surface make liposomes more stable and long circulating; (c)
immune-liposomes with antibodies attached to the surface intended for recognizing
specific target receptors and antigens. (Yordanov, 2013)
1.2.2 Polymeric micelles
Polymeric micelles (Figure 3) are spontaneously self-assembling block copolymers
with an inner hydrophobic core and hydrophilic shell, such as PEG, in aqueous solution
at concentration above the critical micellar concentration (CMC) (Chan et al., 2010).

17
Polymeric micelles have proved that they have great potential modalities as therapeutic
drug carriers (Matsumura & Kataoka, 2009; Nishiyama & Kataoka, 2006). As drug
delivery carriers, polymeric micelles exhibit several unique properties including ease
of preparation, long circulation in bloodstream, reduced adverse effects, ultra small
particles size, as well as reaching target sites and controlled drug release, thus making
them promising for effective tumor accumulation of therapeutic agents by the EPR-
based mechanism (Bae et al., 2005; Nishiyama et al., 2005).
Figure 3. Schematic structure of self-assembled micelles (Yordanov, 2013).
1.2.3 Superparamagnetic Iron Oxide Nanoparticles (SPIONs)
Superparamagnetic iron oxide nanoparticles, magnetite (Fe3O4) and maghemite (γ-
Fe2O3) with a small particle size of 5-25 nm, with appropriate surface coatings have
higher capabilities as MRI contrast enhancers than conventional contrast agents such
as gadolinium chelates (Shanehsazzadeh et al., 2013; Thomas, Park, & Jeong, 2013;
Chen et al., 2010). SPIONs also have potential applications in drug delivery and in
detoxification of biological fluids (Neuberger et al., 2005; Lodhia et al., 2010). The
essential requirement for the use of SPIONs in these applications is a controlled particle
size smaller than 100 nm with a narrow distribution and high magnetisation value

18
because the properties of the nanocrystals depend on their size and superparamagnetism
(Gupta & Gupta, 2005). Uncoated iron nanoparticles tend to form large aggregates.
Degradable nontoxic and biocompatible polymers such as PEG, poly(lactide-co-
glycolide) (PLGA), and dextran are used to coat the iron oxide nanoparticles to prevent
aggregation (Teja & Koh, 2009). Surfactants and surface coatings used can affect size,
surface charge and physiological stability of nanoparticles, so that different
pharmacokinetics and biodistributions can be obtained. A potential advantage of
SPIONs is that they can be attracted to a tumor or organ by using an external magnet
(Gupta and Gupta, 2005; Sawant, 2008).
Among all the techniques to synthesize SPIONs, the co-precipitation method is the
easiest and cheapest (Qu et al., 1999; Gupta & Wells, 2004). The method has many
advantages: the production scale can be easily amplified or reduced, and the particle
size distribution ranges from 5 to 25 nm (Gupta and Curtis, 2004).
1.3 Rationale for each Specific Aim
Rationale for Aim 1: Expertize in making and characterizing this type of nanoparticle
is available in the laboratory of Dr. Sridhar, which will greatly facilitate its preparation
in our own hands. Dr. Sridhar’s group also has experience in using this kind of particles
in MRI experiments. It will be necessary to transfer the methodology to our own
laboratory, in order to work with radioactive materials.

19
Rationale for Aim 2: This method of radiolabeling has been used extensively with
nanoparticles such as liposomes. The phospholipid hydrocarbon tails incorporate
themselves into the lipid membrane, while the polar ethanolamine-phosphate head
group is exposed on the surface of the particles. DTPA attached to the ethanolamine
moiety via an amide bond chelates trivalent metal cations with very high affinity. One
such metal is indium, and a radioisotope of this metal, indium-111, is commonly used
in clinical nuclear medicine. It emits gamma-rays of energy 0.17 and 0.25 MeV, which
combine the features of good ability to penetrate the human body, with efficient
detection using nuclear medicine imaging instruments. The half-life is 2.8 days, which
offers a reasonable “shelf-life” in the radiopharmacy with acceptably rapid clearance
from the patient by physical decay after imaging studies have been completed. The
electron-capture mode of decay avoids the higher radiation doses to tissues associated
with nuclides that emit beta particles.
Rationale for Aim 3: Mice were chosen as test subjects for tissue distribution
experiments following long established practice in experimental nuclear medicine. As
fellow mammals, they are similar in terms of basic biochemistry and physiology to
humans, and candidate radiopharmaceuticals can be conveniently administered via one
of the prominent tail veins. Particles of sub-micron to micron size-range are well known
to be accumulated from the blood by reticuloendothelial cells in the liver and spleen,
and therefore if the radio-indium remains associated with the nanoparticles one should
find the radioactivity predominantly in these organs following intravenous injection.

20
Rationale for Aim 4: Since indium is attached to DTPA via chelation, the DTPA is
itself attached to phosphatidyl ethanolamine via an amide bond, and the DMPE-DTPA
is attached to the nanoparticles via hydrophobic forces, it seems possible that any of
these labeled species (indium citrate, indium-DTPA or DMPE-DTPA-indium) could be
released from the particles. However, they are all expected to have biodistribution
patterns that are distinct from that of indium labeled PEGylated SPIONs and distinct
also from each other. A finding that none of these species of indium-111 (indium citrate,
indium-DTPA or DMPE-DTPA-indium) selectively localizes in liver or spleen (as
hypothesized for indium-111 administered as labeled nanoparticles) would therefore
strengthen the argument that indium-111 remains firmly associated with the SPIONs in
vivo.
One possible complication when using indium3+ is the formation of a colloidal form of
indium oxide that can also be accumulated by endothelial cells (Ebbe et al., 1996). For
this reason, indium-111 is handled in dilute citric acid which forms a weak chelate
compound, indium citrate. In the circulation, indium is strongly chelated by transferrin.
A complication in administering the modified phospholipid DMPE-DTPA-indium is
the possible formation of micelles, which could also be cleared by reticuloendothelial
cells.

21
Rationale for Aim 5: If the nanoparticles remain intact after in the blood after
administration, then all the components, iron oxide core, intermediate oleic acid layer
and DMPE-DTPA-indium on the surface should be delivered to various organs to the
same degree. If the core is labeled with a radioisotope of iron, and the oleic acid is
labeled with a radioisotope of carbon, then the organ distributions of these nuclides
after intravenous administration should be the same as that seen with indium-111
labeled nanoparticles. However, while our studies were in progress, Freund et al. (2012)
reported that carbon-14 oleic acid label may be rapidly removed from the iron core after
intravenous injection of similarly labeled SPIONs, so that carbon-14 labeled particles
were unsuitable for in vivo studies. We sought to confirm or refute the findings of
Freund et al (2012).

22
2. SPECIFIC AIMS
2.1 Objectives
1. Prepare and characterize SPIONs with an iron oxide core, an intermediate layer (the
surfactant) of oleic acid and a surface coating of distearoyl phosphatidyl
ethanolamine polyethylene glycol (DSPE-PEG) (Figure 4 and 5).
Figure 4. Schematic diagram of oleic acid stabilized superparamagnetic iron oxide
nanoparticles (Herranz, Pellico, & Ruiz-Cabello, 2012). As detailed in section 3.3, SPIONs
nanoparticles are precipitated from a mixture of ferrous chloride and ferric chloride by
addition of ammonium hydroxide. When oleic acid is added to the mixture, it induces the
formation of oleic acid coated particles that can be handled as a dispersion in chloroform
(Gupta & Wells, 2004).
2. Evaluate the labeling of the SPIONs with radionuclide indium-111 by means of a
lipid anchored chelating group of dimyristoyl phosphatidyl ethanolamine
diethylenetriaminepentaacetic acid (DMPE-DTPA) (Figure 5).
3. Measure the concentration of indium-111 in major organs as a function of time after
intravenous administration of indium-111 labeled SPIONs.
4. Compare the disposition of indium-111 from labeled SPIONs with the disposition
of indium citrate, indium-DTPA and DMPE-DTPA-indium.

23
5. Compare in vivo disposition of indium-111 labeled SPIONs with the dispositions
of iron-59 and carbon-14 oleic acid labeled SPIONs.
Figure 5. Schematic structure of water dispersible polyethylene glycol SPIONs formed by
hydrophobic interaction between lipids. As detailed in section 3.4, addition of DSPE-
mPEG(2000) to oleic acid coated SPIONs results in PEGylated particles that can be
handled in aqueous media. (Yang et al., 2009)
2.2 Hypothesis
1. Indium-111 will become firmly attached to nanoparticles into whose surface coating
DMPE-DTPA has been incorporated, as shown by recovery of indium-111 with
nanoparticles when these are harvested by ultrafiltration.
2. Radioactivity will become relatively concentrated in liver and spleen at early times
after intravenous administration because of trapping of particles by
reticuloendothelial cells, and will remain located in these organs for many hours.
3. Following intravenous administration of indium-111 in the chemical forms of
indium citrate, indium-DTPA or DMPE-DTPA-indium, the radioactivity
concentrations in liver and spleen will be significantly lower than the liver and
spleen radioactivity concentrations measured after administration of indium-111
labeled SPIONs.

24
4. Disposition patterns of radioactivity from nanoparticles labeled with iron-59 in the
core, with carbon-14 in the oleic acid layer, or with indium-111 on the surface will
be different because a very recent article comparing iron-59 and carbon-14 oleic
acid labeling of similarly prepared particles reports that the carbon-14 label may
not be stable in vivo (Freund et al., 2012).

25
3. MATERIAL AND METHODS
3.1 Animals
Male Swiss Webster mice (Charles River laboratories, Cambridge, MA) weighed 25 ~
30 g were used for all in vivo studies. Mice are maintained at the animal facility of
Division of Laboratory Animal Medicine (DLAM) on 12 hour alternating light and dark
period, with access to food and water ad libitum. Mice were treated in compliance with
NIH guidelines for the use of laboratory animals and according to a protocol approved
by Northeastern University Institutional Animal Care and Use Committee (IACUC).
3.2 Chemical Reagents
Iron (II) chloride tetrahydrate (99+%, Acros Organics) (FeCl2.4H2O), Iron (III) chloride
hexahydrate (99+%, Acros Organics) (FeCl3.6H2O) and Ethanol (200 proof, USP/NF)
were purchased from Fisher Scientific (NJ). Sodium Chloride (ACS Reagent, 99+%),
Oleic acid (99+%), Ammonium hydroxide solution (ACS reagent, 28.0-30.0% NH3
basis), Chloroform (ACS Reagent, 99.8+%), and HPLC grade water were purchased
from Sigma-Aldrich (Saint Louis, MO). 1,2-distearoyl-sn-glycero-3-
phosphoethanolamine-N-[amino(polyethylene glycol)-2000] (ammonium salt) (DSPE-
mPEG2000) and 1,2-dimyristoyl-sn-glycero-3-phosphoethanolamine-N-
diethylenetriaminepentaacetic acid (DMPE-DTPA) were purchased from Avanti Polar
Lipids (Alabaster, AL). Indium-111 Radionuclide indium citrate, Iron-59 Radionuclide
ferric chloride, [1-14C]-Oleic Acid, SolvableTM and Ultima Gold™ XR were purchased
26
from Perkin Elmer (Waltham, MA).
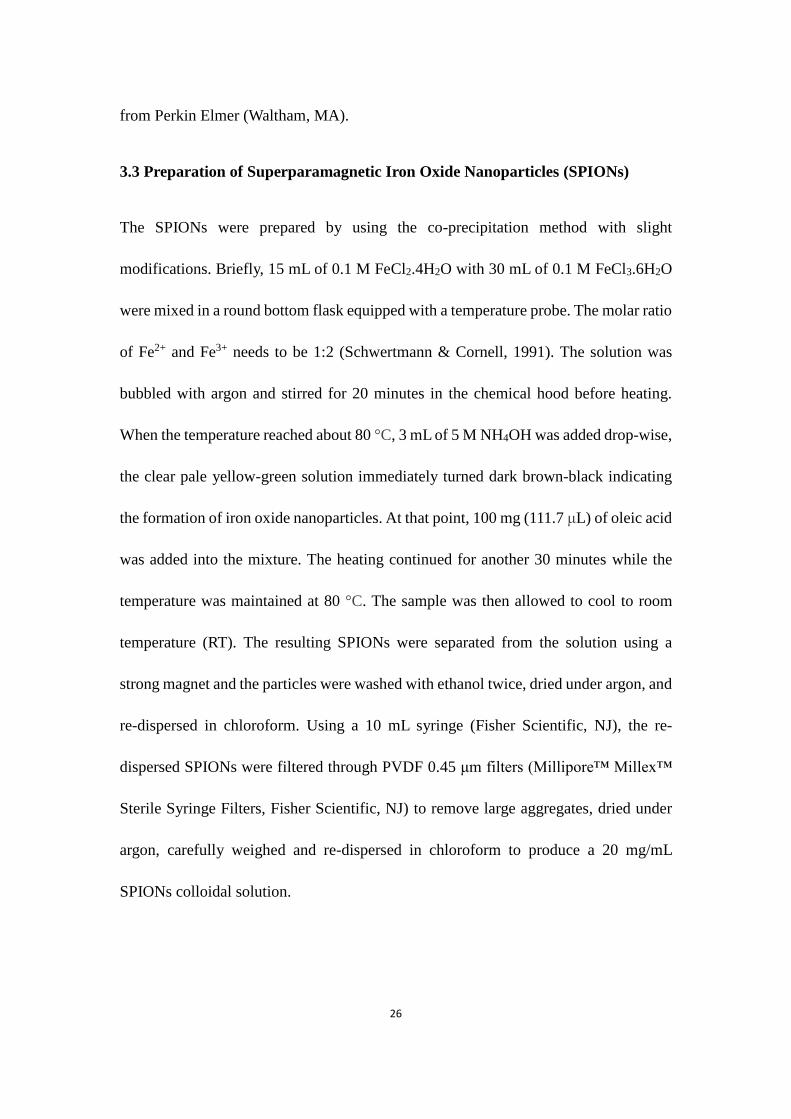
3.3 Preparation of Superparamagnetic Iron Oxide Nanoparticles (SPIONs)
The SPIONs were prepared by using the co-precipitation method with slight
modifications. Briefly, 15 mL of 0.1 M FeCl2.4H2O with 30 mL of 0.1 M FeCl3.6H2O
were mixed in a round bottom flask equipped with a temperature probe. The molar ratio
of Fe2+ and Fe3+ needs to be 1:2 (Schwertmann & Cornell, 1991). The solution was
bubbled with argon and stirred for 20 minutes in the chemical hood before heating.
When the temperature reached about 80 °C, 3 mL of 5 M NH4OH was added drop-wise,
the clear pale yellow-green solution immediately turned dark brown-black indicating
the formation of iron oxide nanoparticles. At that point, 100 mg (111.7 μL) of oleic acid
was added into the mixture. The heating continued for another 30 minutes while the
temperature was maintained at 80 °C. The sample was then allowed to cool to room
temperature (RT). The resulting SPIONs were separated from the solution using a
strong magnet and the particles were washed with ethanol twice, dried under argon, and
re-dispersed in chloroform. Using a 10 mL syringe (Fisher Scientific, NJ), the re-
dispersed SPIONs were filtered through PVDF 0.45 μm filters (Millipore™ Millex™
Sterile Syringe Filters, Fisher Scientific, NJ) to remove large aggregates, dried under
argon, carefully weighed and re-dispersed in chloroform to produce a 20 mg/mL
SPIONs colloidal solution.

27
3.4 Preparation of DSPE-PEGylated SPIONs
PEGylated SPIONs were prepared by the rehydration method. In brief, 10 mg of DSPE-
mPEG2000 and 2.5 mg of SPIONs were mixed in chloroform. The organic solvent was
removed by using a rotary evaporator to complete dryness. The film was then warmed
in 80 °C water for 1 minute and rehydrated using 1 mL of HPLC grade water. The film
was placed in a sonicating bath for 20 minutes to obtain PEGylated SPION. Uncoated
particles were removed by applying an external magnet, and the supernatant was
removed to a fresh vial.
3.5 Characterization of PEGylated SPIONs
3.5.1 Particle Size and Surface Charge Analysis
The particle size distribution and surface charge (zeta potential) of the PEGylated
SPIONs were determined by dynamic light scattering (DLS) measurement with
Brookhaven Instrument’s 90Plus particle size analyzer (Holtsville, NY). The particle
size was determined at 90° angle and at 25 °C temperature and the average count rate
was adjusted in the range of 100 - 500 kcps by proper dilution (10 μL of the PEGylated
SPIONs solution was diluted in 2 mL deionized water). The mean number diameter of
the particles was obtained on MSD distribution mode. The average zeta potential values
were determined based on the electrophoretic mobility using the Smoluchowski-
Helmholtz equation (Cho, Lee, & Frey, 2012). Each sample was performed five times
with 10 cycles each time and an average value was obtained from the five

28
measurements. The PEGylated SPIONs were stored at 4 °C and their stability was
assessed on day 2, day 3, day 4, day 5, day 6 and day 7.
3.5.2 Transmission Electron Microscopy (TEM)
A JEOL 100-X transmission electron microscope (Peabody, MA) was utilized for
analyzing the structure of the iron core of the PEGylated SPIONs. 10 μL of the
PEGylated SPIONs solution was properly diluted in HPLC grade water and placed on
the carbon-coated copper grids and allowed to air-dry at RT.
3.6 Radiolabeling PEGylated SPIONs with Indium-111
To radiolabel PEGylated SPIONs with indium-111, the particles were synthesized as
described above along with addition of 0.5 mol% of DMPE-DTPA to the lipid film.
This was about 0.02 mg (Sawant, 2008). 1 mL of DMPE-DTPA containing SPIONs
were incubated for 1 hour with 10 μL of 111indium citrate solution (diluted to
approximately 8 - 10 μCi by using 0.5 M HCl) at RT, to allow for the transchelation of
indium-111 from a weak citrate complex into a strong DTPA complex. The radioactivity
was measured in an ionization chamber (CAL/RAD MARK IV, Fluke Biomedical) with
a setting of 676. The unbound indium-111 was removed by a 30 Kilo Dalton cut
microcentrifuge filter (Amicon Ultra 0.5 mL centrifugal filters, Sigma-Aldrich, St.
Louis, MO) at 14,000 rpm for 15 minutes at 4 °C for 3 times. The radiolabeled
PEGylated SPIONs were recovered from the filter using 1.5 mL of 0.9% NaCl solutions
(saline).

29
3.7 Biodistribution Studies of indium-111 Radiolabeled PEGylated SPIONs
Indium-111 labeled PEGylated SPIONs were administered to Male Swiss Webster mice
(25-30 g) via a tail vein. 0.2 mL of indium-111 labeled SPIONs saline solution
(containing about 0.3 mg SPIONs and 1 µCi radioactivity) was injected into each mouse.
The mice were euthanized by cervical dislocation at times 10 minutes, 30 minutes, 1
hour, 2 hours and 24 hours post injection. Five mice were used for each time point.
After euthanasia, blood, urine and other solid organs (brain, heart, liver, lung, spleen,
kidney, testis, fat, bone, muscle and skin) were collected. Each sample was carefully
weighed and placed in the bottom 1 cm of a 12 × 75 mm tube and counted for indium-
111 radioactivity as count per minute (CPM) using a Cobra auto-gamma counter
(Packard, a Canberra company). Lower and upper window thresholds in the counting
protocol were 100 and 300 keV, respectively. From the data, the percentage of injected
dose of radioactivity per gram (ID/g %) of each sample was calculated by 100 × (Tissue
CPM – Background CPM) × Weight (g) / (Injected CPM – Background CPM).
3.8 Biodistribution Studies of indium-111 Radiolabeled indium citrate, indium-
DTPA and DMPE-DTPA-indium
3.8.1 Preparation of indium-111 radiolabeled indium citrate solution
5 μL of 111indium citrate solution (approximately 4 - 5 μCi) was dissolved in 1.25 mL
of saline. 0.2 mL of 111indium citrate saline solution was injected intravenously to each
mouse (a group of 5) through tail vein. The mice were euthanized by cervical
dislocation at time point 30 minutes post injection.

30
3.8.2 Preparation of indium-111 radiolabeled indium-DTPA solution
0.02 mg of DTPA was dissolved in 1.25 mL of saline. The solution was incubated with
5 μL of 111indium citrate solution (about 4 - 5 μCi) for 1 hour at RT, to allow for the
transchelation of indium-111. 0.2 mL of 111indium-DTPA saline solution was injected
intravenously to each mouse (a group of 5) through tail vein. The mice were euthanized
by cervical dislocation at time point 1 hour post injection.
3.8.3 Preparation of indium-111 radiolabeled DMPE-DTPA-indium solution
0.02 mg of DMPE-DTPA was dissolved in 1.25 mL of ethanol-emulphor-saline (1:1:18).
The solution was incubated with 5 μL of 111indium citrate solution (about 4 - 5 μCi) for
1 hour at RT, to allow for the transchelation of indium-111. 0.2 mL of DMPE-DTPA-
111indium solution was injected intravenously to each mouse (a group of 5) through tail
vein. The mice were euthanized by cervical dislocation at time points 30 minutes and 2
hours post injection.
3.8.4 In vivo Biodistribution Studies
For all euthanized mice, blood, urine and other solid organs (brain, heart, liver, lung,
spleen, kidney, testis, fat, bone, muscle and skin) were collected. Each sample was
carefully weighed and counted for indium-111 radioactivity as CPM using the auto-
gamma counter.

31
3.9 Biodistribution studies of iron-59 and carbon-14 oleic acid radiolabeled
PEGylated SPIONs
3.9.1 Preparation of iron-59 or carbon-14 oleic acid radiolabeled SPIONs
Particles radiolabeled with iron-59 in the SPION core were prepared by adding a small
volume (15 μL; 15 μCi) of radioactive 59Fe3+ chloride solution to the mixture of ferrous
and ferric chloride solutions before addition of ammonia (see procedure 3.3 for
preparation of unlabeled particles, earlier in this section). Similarly, particles
radiolabeled with carbon-14 oleic acid were prepared by adding a small volume (0.25
mL; 25 μCi) of carbon-14 oleic acid solution to the oleic acid that was added after
addition of ammonia. In both cases, neither the additional volume nor the extra mass of
material should have any effect on the formation and coating of the particles, since this
is being done in a volume of 45 mL using approximately 250 mg of iron and 100 mg of
oleic acid. The radioactivity in the preparation of iron-59 labeled SPIONs was estimated
using the ionization chamber. The radioactivity in a 10 μL sample of the carbon-14 oleic
acid labeled SPIONs was measured using a liquid scintillation counter (LS6500,
Beckman Coulter) since carbon-14 emits no photonic radiation.
After the formulation of iron-59 and carbon-14 oleic acid labeled SPIONs, the
PEGylated SPIONs were prepared as described above in section 3.4 with one difference.
The PEGylated particles were rehydrated using 1.5 mL saline instead of HPLC grade
water.

32
3.9.2 In vivo biodistribution studies
0.2 mL of iron-59 labeled PEGylated SPIONs saline solution or 0.2 mL of carbon-14
oleic acid labeled PEGylated SPIONs saline solution was injected intravenously to each
mouse (a group of 5) through tail vein. The mice were euthanized by cervical
dislocation at time points 10 minutes, 30 minutes and 24 hours post injection with five
mice in a group for each time points. Besides, a comparison group of five mice was
intravenously injected with 0.2 mL of ethanol-emulphor-saline (1:1:18) which only
contained about 0.3 μCi carbon-14 oleic acid.
For mice administered with iron-59 labeled particles, blood, urine and other solid
organs (brain, heart, liver, lung, spleen, kidney, testis, fat, bone, muscle and skin) were
collected. Each sample was carefully weighed and counted for iron-59 radioactivity as
count per minute (CPM) using the auto-gamma counter with appropriate energy
windows (800-1600 keV).
For mice administered with carbon-14 oleic acid labeled particles, blood, urine and
other solid organs (brain, heart, liver, lung, spleen, kidney, and testis) were collected.
Tissues were completely dissolved in SolvableTM and bleached with 30% hydrogen
peroxide before addition of UltimaGoldTM XR liquid scintillation fluid. The samples
were then assayed for carbon-14 using the liquid scintillation counter.

33
4. RESULTS AND DISCUSSIONS
4.1 Preparation and Characterization of PEGylated SPIONs
The PEGylated SPIONs were stable and did not show signs of aggregation after 1 week
at 4 °C (Figure 7). The size of the PEGylated SPIONs, as well as DTPA anchored
PEGylated SPIONs, was generally in the range of 30 - 50 nm (40.08 ± 6.75 nm, Figure
6). The surface zeta potential for the nanoparticles were always negative at about -36.6
± 6.58 mV. TEM images of the iron core of PEGylated SPIONs are shown in figure 8.
The size distribution of the iron core ranged from 5 nm to 25 nm. These results are in
agreement with previous studies (Sawant, 2008; Plouffe et al., 2011).
Figure 6. Particles size of PEGylated SPIONs measured using dynamic light scattering
in 90Plus particle size analyzer.

34
Figure 7. Stability Measurement of PEGylated SPIONs for consistent 7 days. Values are
mean ± s. d. (n = 5)
Figure 8. TEM micrograph of the iron core of PEGylated SPIONs.
05
101520253035404550
0 1 2 3 4 5 6 7 8
Mea
n N
ano
par
ticl
es S
ize
(nm
)
Time (Days)
Stability Measurement of PEGylated SPIONs

35
4.2 Radiolabeling of PEGylated SPIONs with Indium-111
The majority of the 111indium citrate used in the reaction mixtures was recovered in the
DTPA modified PEGylated SPIONs. Table 1 shows counting data from filters and
filtrates for successive centrifugations. The labeling efficiency percentage was higher
than 70%.
Table 1. Radioactivity recovered of 111indium with SPIONs in successive filtration. Values
are mean ± s. d. (n = 5)
111Indium Radioactivity (µCi)
Recovered from membrane Filtrate
First Centrifugation 7.7 ± 1.3 0.6 ± 0.4
Second Centrifugation 7.6 ± 1.1 0.1 ± 0.05
Third Centrifugation 7.6 ± 0.8 <0.1
4.3 Biodistribution of indium-111 radiolabeled PEGylated SPIONs
Biodistribution studies were conducted at 5 time-points after administration of indium-
111 labeled SPIONs: 10 minutes; 30 minutes; 1 hour; 2 hours; and 24 hours. The results
(percent injected radioactivity per gram tissue wet weight) are shown in Table 2. Liver
followed by spleen exhibited the highest radioactivity concentrations at all times.
Radioactivity in the blood decreased with time after administration, as to a lesser degree
did radioactivity in lung and heart, probably reflecting the large amounts of blood in
these organs. In contrast, radioactivity in liver increased with time. This rise was
significant (p<0.05) between 10 and 30 min. This is consistent with the notion that
indium-111 remained bound to nanoparticles in blood during the period of our
experiments, and that the particles continued to be accumulated by liver

36
reticuloendothelial cells, and remained trapped in these cells. Similarly to the case with
liver, the concentration of radioactivity in spleen and bone did not decrease over the
course of our experiments, again consistent with trapping by reticuloendothelial cells
in these organs (Martindale, Papadimitriou, & Turner, 1980) (Figure 9). Radioactivity
concentrations decreased in the order skin > muscle > testes > fat > brain, and also fell
between earlier and later time-points in these tissues. It is likely that all radioactivity
measured in the brain was actually in the brain vasculature, since it was very low at all
times, and its concentration was 3-5% of that in the blood at all time-points (Figure 11).
Kidney had the third highest concentrations of radio-indium at all times, after liver and
spleen; this could reflect trapping of smaller nanoparticles (HD < 10 nm) in the
glomerulus (Zuckerman & Davis, 2013). Some radio-indium was recovered in urine,
indicating that some loss of indium from the particles occurs (Figure 10).
Table 2. Biodistribution data of indium-111 labeled PEGylated SPIONs at different time
points (represented as the average percentage of injected activity per gram of each organ).
Values are mean ± s. d. (n = 5)
Tissues/ Times 10 minutes 30 minutes 1 hour 2 hours 24 hours
Liver 27.04 ± 1.89 33.90 ± 1.44 33.35 ± 1.12 34.83 ± 0.57 37.28 ± 1.03
Spleen 15.46 ± 0.41 15.71 ± 1.50 15.18 ± 1.06 13.43 ± 0.45 21.48 ± 2.41
Kidney 10.72 ± 1.57 7.71 ± 1.37 5.68 ± 0.91 9.57 ± 0.97 8.03 ± 1.00
Blood 9.59 ± 1.38 4.23 ± 0.81 4.22 ± 0.72 3.97 ± 0.58 0.55 ± 0.13
Lung 4.85 ± 1.01 2.99 ± 0.28 2.76 ± 0.50 2.65 ± 0.15 1.27 ± 0.31
Heart 2.32 ± 0.62 1.24 ± 0.16 1.08 ± 0.07 1.10 ± 0.18 0.62 ± 0.15
Bone 2.10 ± 0.19 3.14 ± 0.17 3.43 ± 0.40 3.66 ± 0.34 3.87 ± 0.25
Skin 1.36 ± 0.37 1.06 ± 0.07 0.73 ± 0.09 0.78 ± 0.20 1.00 ± 0.18
Muscle 0.80 ± 0.24 0.65 ± 0.10 0.41 ± 0.07 0.58 ± 0.09 0.53 ± 0.12
Testis 0.40 ± 0.05 0.32 ± 0.09 0.34 ± 0.05 0.42 ± 0.04 0.45 ± 0.07
Fat 0.30 ± 0.03 0.29 ± 0.05 0.16 ± 0.01 0.26 ± 0.01 0.22 ± 0.04
Brain 0.25 ± 0.09 0.13 ± 0.03 0.12 ± 0.02 0.11 ± 0.03 0.05 ± 0.01
Urine 11.17 ± 3.63 5.84 ± 0.97 2.47 ± 0.62 0.73 ± 0.34 7.83 ± 1.91

37
Figure 9. Graph of biodistribution of 111indium labeled PEGylated SPIONs at different
time points (represented as the average percentage of injected activity per gram of each
organ). Mice (25-30 g) were injected intravenously with indium-111 labeled particles
suspended in 0.2 mL of 0.9% NaCl solutions.
Figure 10. Indium-111 in urine after administration of 111indium labeled PEGylated
SPIONs.
0.00
5.00
10.00
15.00
20.00
25.00
30.00
35.00
40.00
Liver Spleen Bone Kidney Blood Lung Heart
Ave
rage
%In
ject
ed R
adio
acti
vity
per
gra
m
Biodistribution of 111indium labeled SPIONs at different time points
10 min
30 min
1 hour
2 hours
24 hours
0.00
2.00
4.00
6.00
8.00
10.00
12.00
14.00
16.00
10 min 30 min 1 h 2 h 24 h
Ave
rage
%In
ject
ed A
ctiv
ity/
g
Time
Biodistibution of 111Indium Labeled SPIONs in Urine

38
Figure 11. Graphs showing liver-to-blood (left) and brain-to-blood (right) ratios versus
time.
4.4 Biodistribution of indium-111 radiolabeled indium citrate, indium-DTPA and
DMPE-DTPA-indium
Surprisingly, the distribution of label from DMPE-DTPA-indium at 2 h was similar to
the distribution of label from 111indium labeled PEGylated SPIONs at that time, when
tissues were ordered according to concentrations of label. However, liver, spleen and
bone levels were lower for DMPE-DTPA-indium, while the blood, heart and lung
concentrations were higher. At the earlier time-point of 30 min, these differences from
the distribution seen for indium-SPIONs were more marked, and the concentrations in
liver and spleen were only half for DMPE-DTPA-indium than for indium-SPIONs,
while the blood level was 4 times higher for DMPE-DTPA-indium (Figure 12). At 30
min time point, the liver-to-blood ratio for DMPE-DTPA-Indium was <1, whereas for
indium-SPIONs it was > 7 (Figure 13).
0.00
20.00
40.00
60.00
80.00
100.00
10 min 30 min 1 h 2 h 24 h
Live
r to
Blo
od
Rat
io
Time
Liver to Blood Ratios versus Time
0.00
0.05
0.10
0.15
0.20
10 min 30 min 1 h 2 h 24 h
Bra
in t
o B
loo
d R
atio
Time
Brain to Blood Ratios versus Time

39
Figure 12. Comparison of biodistribution between indium-SPIONs and DMPE-DTPA-
indium at 30 min and 2 h.
Figure 13. Comparison of liver-to-blood ratios versus time between indium-SPIONs and
DMPE-DTPA-indium.
Together, the data at 30 min and 2 h for DMPE-DTPA-indium indicate a much slower
transfer of label from blood to organs than for indium-SPIONs. It can therefore be
inferred that our preparations of indium-SPIONs do not contain appreciable amounts
0.00
5.00
10.00
15.00
20.00
25.00
30.00
35.00
40.00
Liver Spleen Bone Kidney Blood Lung HeartAve
rage
%In
ject
ed R
adio
acti
vity
/g
Comparison of Biodistribution between indium-SPIONs and DMPE-DTPA-indium at 30 min and 2 h
Indium-SPIONs 30 min
DMPE-DTPA-indium 30 min
Indium-SPIONs 2 h
DMPE-DTPA-indium 2 h
0.00
2.00
4.00
6.00
8.00
10.00
12.00
30 min 2 h
Live
r to
Blo
od
Rat
io
Time
Liver to Blood Ratio versus Time
Indium-SPIONs
DMPE-DTPA-indium

40
of free DMPE-DTPA-indium, and that the labeled phospholipid remains bound to the
SPIONs during the distribution phase. Nevertheless, DMPE-DTPA-indium could
dissociate from the SPIONs to some extent in the blood, and extensive dissociation
could occur in tissues after uptake, since the distribution of DMPE-DTPA-indium at 2
h is similar to that of indium-SPIONs; presumably, then, labeled phospholipid released
from indium-SPIONs would remain in the tissues where the nanoparticles were
deposited.
Two hours after administration of labeled substance, urine contained about 10 times
more radioindium for DMPE-DTPA-indium than for indium-SPIONs (Figure 14).
Thus, indium incorporated into the PEGylated SPIONs is more resistant to loss of a
radioactive species that can exit tissues and undergo clearance by the kidneys.
Figure 14. Comparison of urine radioactivity between indium-SPIONs and DMPE-
DTPA-indium.
Thirty minutes after administration of 111indium citrate, blood and kidney, as well as
bone, contained higher concentrations of radioactivity than after administration of
0.00
2.00
4.00
6.00
8.00
10.00
12.00
14.00
30 min 2 h
Ave
rage
%In
ject
ed A
ctiv
ity/
g
Time
Radioindium in Urine
Indium-SPIONs
DMPE-DTPA-indium

41
indium-SPIONs, while liver and spleen contained less (Figure 15). Indium is tightly
complexed by the iron-transport protein transferrin, and the observed disposition of
label may reflect a combination of the behaviors of Indium3+ and indium-transferrin.
Although this is speculative, one could suggest that the high blood level is due to
indium-transferrin, while the high concentration in bone is due to incorporation of
Indium3+ into the bone marrow, or to formation of indium oxide colloid that is taken up
by reticuloendothelial cells (Ebbe et al., 1996). Irrespective of the chemical forms
present, this experiment supports the notion that the tissue dispositions seen with
DMPE-DTPA-indium and indium-SPIONs are not predominantly due to Indium3+
released from its chelated form. This notion is strongly supported by examination of
the distribution of labeled form 111indium-DTPA at 1 h time point. Tissue concentrations
of label were quite distinct from those seen when indium citrate was injected. As
expected from the nuclear medicine literature on simple metal chelates, it was
characterized by extensive urinary excretion (Corcoran et al., 2010; Fritsch et al., 2009).
Tissue concentrations of radiolabeled 111indium-DTPA at 1 h were much lower than
obtained with the other forms of radio-indium. Kidney had the highest level, probably
reflecting indium chelate in the urinary collection system (Corcoran et al., 2010; Fritsch
et al., 2009).

42
Figure 15. Comparison of biodistribution of indium-SPIONs, DMPE-DTPA-indium and
indium citrate at 30 minutes post injection, showing distinct distribution patterns for each
form of radioactive indium. .
Table 3. Biodistribution data of indium-111 labeled DMPE-DTPA-indium, indium citrate
and indium-DTPA (represented as the average percentage of injected activity per gram of
each organ). Values are mean ± s. d. (n = 5)
Tissues DMPE-DTPA-
111Indium (30 min)
DMPE-DTPA-111Indium (2 h)
111Indium citrate
(30 min)
111Indium-
DTPA (1 h)
Liver 16.10 ± 1.19 25.27 ± 0.42 20.58 ± 2.79 0.23 ± 0.06
Spleen 8.11 ± 1.21 7.03 ± 0.37 8.19 ± 1.60 0.13 ± 0.02
Kidney 4.79 ± 0.49 5.14 ± 0.60 27.33 ± 3.46 2.16 ± 0.65
Blood 18.60 ± 0.92 8.07 ± 0.91 14.58 ± 3.26 0.39 ± 0.17
Lung 11.19 ± 1.19 7.53 ± 0.77 10.73 ± 1.98 0.41 ± 0.06
Heart 4.57 ± 0.38 2.65 ± 0.33 4.22 ± 1.39 0.23 ± 0.13
Bone 1.79 ± 0.29 1.90 ± 0.37 6.72 ± 1.02 0.82 ± 0.35
Skin 0.55 ± 0.19 0.77 ± 0.12 2.35 ± 0.65 0.48 ± 0.09
Muscle 0.61 ± 0.04 0.54 ± 0.07 2.22 ± 0.83 0.27 ± 0.16
Testis 0.50 ± 0.07 0.59 ± 0.06 1.05 ± 0.21 0.35 ± 0.33
Fat 0.16 ± 0.06 0.28 ± 0.08 1.20 ± 0.31 0.13 ± 0.07
Brain 0.53 ± 0.06 0.30 ± 0.17 0.51 ± 0.12 0.05 ± 0.02
Urine 7.74 ± 2.16 9.45 ± 2.37 16.53 ± 3.46 79.30 ± 37.75
0.00
5.00
10.00
15.00
20.00
25.00
30.00
35.00
40.00
Liver Spleen Bone Kidney Blood Lung HeartAve
rage
%In
ject
ed A
citi
vity
/g
Biodistribution of Indium-SPIONs, DMPE-DTPA-indium and Indium citrate at 30 minutes Time Point
Indium-SPIONs
DMPE-DTPA-indium
Indium citrate

43
4.5 Biodistribution of iron-59 or carbon-14 oleic acid radiolabeled PEGylated
SPIONs
The incorporation efficiency for iron-59 was approximately 53% (8 μCi out of 15 μCi),
assayed using the ionization chamber, while the carbon-14 oleic acid incorporation
efficiency was about 8% (2 μCi out of 25 μCi), estimated by the liquid scintillation
counter. The poor efficiency for labeling with carbon-14 is due to the large excess of
oleic acid over iron salts used in the preparation of the SPIONs.
When the iron core of the SPIONs was labeled with iron-59, the distribution pattern at
each time-point was marked by higher fractions of injected radioactivity in liver and
spleen than for indium-111 (compare Table 2 with Table 4), and lower concentrations
elsewhere. However, bone, kidney, blood and urine contained more radioactivity than
other organs (except liver and spleen).
The fraction of injected iron-59 in liver decreased by about 15%, from 55% to 45%
between 10 min and 24h (p < 0.05). This decrease, together with the finding of iron-59
in urine (as well as increased levels of radioactivity in kidney and bone) suggests that
PEGylated SPIONs in the liver can be slowly broken down to one or more soluble iron
species.

44
Table 4. Biodistribution data of iron-59 labeled PEGylated SPIONs (represented as the
average percentage of injected activity per gram of each organ). Values are mean ± s. d.
(n = 5)
Tissues/Time 10 minutes 30 minutes 24 hours
Liver 54.58 ± 0.87 51.16 ± 2.95 45.04 ± 2.10
Spleen 17.83 ± 0.65 17.78 ± 0.63 17.36 ± 1.45
Kidney 0.40 ± 0.18 0.43 ± 0.14 0.72 ± 0.21
Blood 1.32 ± 0.19 0.44 ± 0.09 1.26 ± 0.43
Lung 0.52 ± 0.03 0.61 ± 0.07 0.19 ± 0.03
Heart 0.14 ± 0.09 0.29 ± 0.11 0.19 ± 0.09
Bone 0.95 ± 0.24 1.34 ± 0.47 1.79 ± 0.53
Skin 0.17 ± 0.10 0.04 ± 0.45 0.21 ± 0.07
Muscle 0.04 ± 0.03 0.16 ± 0.31 0.35 ± 0.14
Testis 0.00 ± 0.02 0.30 ± 0.08 0.07 ± 0.07
Fat 0.02 ± 0.01 0.04 ± 0.08 0.10 ± 0.05
Brain 0.02 ± 0.01 0.04 ± 0.03 0.04 ± 0.01
Urine 0.27 ± 0.17 0.76 ± 0.29 0.73 ± 0.22
Together, the data for indium and iron labeled particles suggest that during the
distribution phase about half of the radioactivity dissociates from the particles in the
form of DMPE-DTPA-Indium. However, as demonstrated in the experiment where
DMPE-DTPA-indium itself was administered, much of this radioactivity can be
subsequently taken up and retained by the liver and spleen. Thus, at 10 minutes post
injection the radioiron/radioindium ratio in liver is 2:1, but due to recirculation of
DMPE-DTPA-indium at 24h it has decreased to 1.25 (Figure 16).
When particles labeled with carbon-14 oleic acid were injected into mice, a different
pattern of distribution (Table 5) was observed than when the particles were labeled with
iron-59. Although the liver contained the highest concentration of carbon-14 at 10 and
30 minutes post injection, this halved (18 % IA/g to 9 % IA/g) between the two early

45
time-points. Spleen, blood, kidney, heart and lung all contained approximately equal
concentrations of carbon-14 (about 3% IA/g) at both 10 and 30 minutes, while the
concentrations in testis and brain were much lower (about 1% IA/g). Carbon-14 levels
in urine were higher than those in non-hepatic tissues at 10 and 30 minutes. By 24 hours
after administration of labeled particles, radioactivity-concentrations in all tissues,
including liver, were low (< 2% IA/g).
Table 5. Biodistribution data of carbon-14 oleic acid labeled PEGylated SPIONs
(represented as the average percentage of injected activity per gram of each organ). Values
are mean ± s. d. (n = 5)
Carbon-14 oleic acid labeled PEGylated SPIONs Carbon-14 oleic
acid only
Tissues/Time 10 minutes 30 minutes 24 hours 30 minutes
Liver 17.54 ± 1.71 9.47 ± 0.86 1.24 ± 0.16 1.80 ± 0.64
Spleen 3.16 ± 0.40 2.53 ± 0.20 1.27 ± 0.24 0.50 ± 0.19
Kidney 4.24 ± 0.65 3.17 ± 0.27 1.27 ± 0.13 0.85 ± 0.15
Blood 3.07 ± 0.75 3.47 ± 1.17 1.53 ± 0.21 0.60 ± 0.20
Lung 3.55 ± 0.56 3.29 ± 1.10 0.89 ± 0.38 3.52 ± 0.82
Heart 3.55 ± 1.31 2.73 ± 0.44 0.45 ± 0.13 1.50 ± 0.37
Testis 0.68 ± 0.08 0.64 ± 0.08 0.54 ± 0.15 0.16 ± 0.07
Brain 0.50 ± 0.05 0.40 ± 0.07 0.30 ± 0.03 0.11 ± 0.03
Urine 11.47 ± 1.05 10.03 ± 1.22 0.88 ± 0.24 0.80 ± 0.11
These observation, compared to those made using iron-59 labeled particles,
demonstrate that oleic acid does not remain attached to the iron oxide core of the
particles, in vivo. The failure to see high uptake in the spleen even at 10 minutes
indicates that dissociation is quite rapid. The higher uptake in liver than other organs at
10 and 30 minutes may reflect initial storage in complex lipid pools in this organ, which
is followed by incorporation into lipoproteins for export to other tissues via the blood.

46
Other processes such as partial oxidation to ketone bodies (acetoacetate and beta-
hydroxybutyrate), again exported to other tissues, are also expected to occur.
Figure 16. Comparison of indium-111, iron-59, and carbon-14 oleic acid biodistribution
patterns in liver, spleen, bone, blood and kidney at 10 min, 30 min, and 24 h time points.
(a)
(b)
0.00
10.00
20.00
30.00
40.00
50.00
60.00
10 min 30 min 24 h
Ave
rage
%In
ject
ed A
ctiv
ity/
g
Time
Liver
111Indium-SPIONs
59Iron-SPIONs
14Carbon-SPIONs
0.00
5.00
10.00
15.00
20.00
25.00
30.00
10 min 30 min 24 h
Ave
rage
%In
ject
ed A
ctiv
ity/
g
Time
Spleen
111Indium-SPIONs
59Iron-SPIONs
14Carbon-SPIONs

47
(c)
(d)
(e)
0.00
0.50
1.00
1.50
2.00
2.50
3.00
3.50
4.00
4.50
10 min 30 min 24 h
Ave
rage
%In
ject
ed A
ctiv
ity/
g
Time
Bone
111Indium-SPIONs
59Iron-SPIONs
0.00
2.00
4.00
6.00
8.00
10.00
12.00
10 min 30 min 24 h
Ave
rage
%In
ject
ed A
ctiv
ity/
g
Time
Blood
111Indium-SPIONs
59Iron-SPIONs
14Carbon-SPIONs
0.00
2.00
4.00
6.00
8.00
10.00
12.00
14.00
10 min 30 min 24 h
Ave
rage
%In
ject
ed A
ctiv
ity/
g
Time
Kidney
111Indium-SPIONs
59Iron-SPIONs
14Carbon-SPIONs

48
Biodistribution data for SPIONs labeled with iron-59, indium-111 and carbon-14 which
are discussed above for each radionuclide are re-displayed in Figure 16 for tissues, (a)
liver, (b) spleen, (c) bone, (d) blood and (e) kidney, at 10 min, 30 min and 24h. This
facilitates comparison of the three radionuclides in terms of their effectiveness in
labeling SPIONs. (Panel (c) for bone shows data for iron-59 and indium-111 only since
carbon-14 levels were too low to be measured in bone.) These comparisons illustrate
the points made above that while indium-111 is not a perfect proxy for iron-59, it might
be useful for imaging the distribution of SPIONs using SPECT. However, it is clear that
the oleic acid component of the SPIONs does not remain with the iron oxide core after
administration to mice.
As to the biodistribution of carbon-14 oleic acid alone, it is very different from the 14C-
SPIONs at 30 minutes time point. Less radioactivity remained in tissues (except lung)
after administration of oleic acid alone than after administration of carbon-14 oleic acid
labeled SPIONs (Table 5). One explanation is that, in associating with and dissociating
from the SPIONs, most or perhaps all of the carbon-14 oleic acid is converted to a
chemical form that is cleared more slowly from the body. Oleic acid itself may be
cleared rapidly because long chain fatty acid are a major metabolic fuel and are rapidly
converted to labeled carbon dioxide, which leaves the body in exhaled breath.
Additionally, there is more radioactivity in lungs than other tissues after injection of
14C-oleic acid alone, whereas there is more radioactivity in liver than other tissues after
administration of carbon-14 oleic acid labeled SPIONs. Some compounds that are very

49
lipophilic are trapped in the lungs immediately after intravenous administration because
they dissolve in the lung surfactant and oleic acid is one of these compounds (Koren et
al., 1980). If this is the explanation for the higher uptake in lungs, we could argue that
the failure to see higher lung uptake from oleic acid labeled SPIONs is consistent with
the view that the carbon-14 released from the SPIONs is in a different chemical form.
Thus, radiochromatographic studies on tissues will be necessary to confirm these
speculations.
4.6 OVERALL CONCLUSIONS
After intravenous injection of radiolabeled particles, the radioactive indium was
preferentially localized in those organs (liver, spleen and bone) associated with trapping
of colloids by reticuloendothelial cells, with no reduction of radioactivity concentration
up to the longest time-point examined (24h).
The tissue distributions obtained with indium-111 SPIONss at various times are
encouraging for use of such labeled particles in imaging experiments. The differences
in distribution of either indium-citrate or of indium-DTPA from those obtained with
labeled SPIONs supports the view that a substantial fraction of the indium-111 remains
associated with the iron oxide core. However, the somewhat similar distribution of
DMPE-DTPA-indium to that of indium-111 labeled SPIONs, in terms of high uptake in
organs containing reticuloendothelial cells, raises the question of whether some of the
uptake seen with labeled SPIONs in liver and spleen is due to recirculation of
dissociated DMPE-DTPA-indium to these organs. In other words, if this labeled

50
phospholipid itself preferentially distributes to liver and spleen, then the fact that
indium-111 from the labeled SPIONs is found in liver and spleen does not absolutely
prove that the labeled particles remain intact in vivo.
In contrast to the situation with indium-111, it is clear that carbon-14 oleic acid
incorporated into the SPIONs does not remain firmly associated with the iron oxide
core. Carbon-14 appears to be released rapidly from the SPIONs in the blood since the
spleen is not targeted by carbon-14 labeled SPIONs, though this organ is targeted by
SPIONs labeled with indium-111 or iron-59. However, the carbon-14 released does not
appear to be in the chemical form of oleic acid, since the biodistributions of radiolabel
administered as oleic acid itself or oleic acid labeled SPIONs were quite distinct.

51
5. LIMITATIONS AND FUTURE DIRECTIONS
PEGylated SPIONs that were characterized by DLS and TEM were not radioactive, as
we were not allowed to use radioactive materials in these analytical instruments.
The procedures used to prepare SPIONs radiolabeled with iron-59 and with carbon-14
oleic acid, addition of labeled reagent to the reaction mixture conducted on the usual
scale, limited the radioactivity of carbon-14 or iron-59 that could be injected into a
mouse. We were able to deal with this problem by using long counting times. However,
if further studies with these radionuclides are warranted, one could improve
radiochemical yields and specific activities by miniaturizing the mass scale of the
syntheses but maintaining the same amounts of radioactive iron or oleic acid. However,
it is very likely that the size and possibly other characteristics of the SPIONs may
depend on factors such as heating rates that could be altered by the scale of the reaction,
so that miniaturization might require extensive development work.
Further progress in understanding the behavior of the indium-111 labeled PEGylated
SPIONs will require analysis of the chemical form(s) of indium present in tissues
(including liver, spleen and especially kidney and urine) using radiochromatographic
methods.

52
6. BIBLIOGRAPHY
Allen, T. M., Cullis, P. R. (2004). Drug delivery systems: entering the mainstream.
Science 303:1818–1822. doi:10.1126/science.1095833
Antimisiaris, S. G., Kallinteri, P. & Fatouros, D. G. (2007). Liposomes and Drug
Delivery. In S. C. Gad (Ed.), Pharmaceutical manufacturing handbook:
Production and processes (pp. 443-534). Hoboken, NJ: Wiley-Interscience.
doi:10.1002/9780470259818.ch13
Bae, Y., Nishiyama, N., Fukushima, S., Koyama, H., Matsumura, Y., & Kataoka, K.
(2005). Preparation and biological characterization of polymeric micelle
drug carriers with intracellular pH-triggered drug release property: tumor
permeability, controlled subcellular drug distribution, and enhanced in vivo
antitumor efficacy. Bioconjugate chemistry, 16(1), 122– 130.
doi:10.1021/bc0498166
Barenholz, Y. (2001). Liposome application: problems and prospects. Current Opinion
in Colloid & Interface Science, 6(1), 66– 77.
http://dx.doi.org.ezproxy.neu.edu/10.1016/S1359-0294(00)00090-X
Barenholz, Y. (2012). Doxil®--the first FDA-approved nano-drug: lessons learned.
Journal of Controlled Release, 160(2), 117-34.
doi:10.1016/j.jconrel.2012.03.020
Bhalani, V. V., Hecht, H., Sachs, P., & King M. (2012). Thoracic splenosis:
Noninvasive diagnosis using Technetium-99 sulfur colloid. Connecticut
Medicine, 76(10), 585-587. Retrieved from
http://www.ncbi.nlm.nih.gov/pubmed/23243759
Bonnemain, B. (1998). Superparamagnetic agents in magnetic resonance imaging:
Physicochemical characteristics and clinical applications. A review. Journal
of Drug Targeting, 6(3), 167-174. doi:10.3109/10611869808997890
Botosoa, E. P., Maillasson, M., Mougin-Degraef, M., Sa ec, P. R., Gestin, J., Jacques,
Y., . . . Faivre-Chauvet, A. (2010). Antibody-hapten recognition at the
surface of functionalized liposomes studied by SPR: Steric hindrance of
PEGylated phospholipids in stealth liposomes prepared for targeted
radionuclide delivery. Journal of Drug Delivery, 2011, Article ID 368535, 9
pages. http://dx.doi.org/10.1155/2011/368535
Bouziotis, P., Psimadas, D., Tsotakos, T., Stamopoulos, D., Tsoukalas, C. (2012).
Radiolabeled iron oxide nanoparticles as dual-modality SPECT/MRI and
PET/MRI agents. Current Topics in Medicinal Chemistry, 12(23), 2694-
2702. doi:10.2174/1568026611212230007
The British Museum. The Lycurgus Cup. Retrieved from
http://www.britishmuseum.org/explore/highlights/highlight_objects/pe_mla/
t/the_lycurgus_cup.aspx
Chan, J. M., Valencia, P. M., Zhang, L., Langer, R., & Farokhzad, O. C. (2010).
Polymeric nanoparticles for drug delivery. Methods in molecular biology,
624, 163–175. doi:10.1007/978-1-60761-609-2_11

53
Chen, Y., Tao, J., Xiong, F., Zhu, J., Gu N., Zhang, Y., Ding, Y., & Ge L. (2010).
Synthesis, self-assembly, and characterization of PEG-coated iron oxide
nanoparticles as potential MRI contrast agent. Drug Development and
Industrial Pharmacy, 36(10), 1235-1244. doi:10.3109/03639041003710151
Cho, D., Lee, S., & Frey, M. W. (2012). Characterizing zeta potential of functional
nanofibers in a microfluidic device. Journal of Colloid And Interface
Science, 372(1), 252-260.
http://dx.doi.org.ezproxy.neu.edu/10.1016/j.jcis.2012.01.007
Colomban, P. (2009). The use of .metal nanoparticles to produce yellow, red and
iridescent colour, from Bronze Age to present times in lustre pottery and
glass: Solid state chemistry, spectroscopy and nanostructure. Journal of
Nano Research, 8, 109-132. doi:10.4028/www.scientific.net/JNanoR.8.109
Corcoran, T. E., Thomas, K. M., Myerburg, M. M., Muthukrishnan, A., Weber, L.,
Frizzell, R., & Pilewski, J. M. (2010). Absorptive clearance of DTPA as an
aerosol-based biomarker in the cystic fibrosis airway. European Respiratory
Journal, 35(4), 781-786. doi:10.1183/09031936.00059009
Dickson, W. H. (1932). Thortrast: A new contrast medium for radiological diagnosis.
Canadian Medical Association Journal, 27(2), 125-129. Retrieved from
http://www.ncbi.nlm.nih.gov/pmc/articles/PMC402461/
Ebbe, S., Taylor, S., Maurer, H., & Kullgren, B. (1996). Uptake of indium-111-labeled
platelets and indium-111 oxine by murine kidneys after total-body
irradiation. Radiation Research Society, 146(2), 216-222. Retrieved from
http://www.jstor.org/stable/3579593
Edwards, P. P., & Thomas, J. M. (2007). Gold in a metallic divided state – from
Faraday to present-day nanoscience. Angewandte Chemie International
Edition, 46(29), 5480-5486. doi:10.1002/anie.200700428
Ehrlich, P. (1877). Beiträge zur Kenntniss der Anilinfärbungen und ihre Verwendung
in der mikroskopischen Technik. Archiv für mikroskopische Anatomie,
13(1), 263–277. doi:10.1007/BF02933937
Faraday, M. (1857). The Bakerian lecture: Experimental relations of gold (and other
metals) to light. Philosophical Transactions of the Royal Society of London,
147, 145-181. doi:10.1098/rstl.1857.0011
Farokhzad, O., & R. Langer. (2006). Nanomedicine: developing smarter therapeutic
and diagnostic modalities. Advanced Drug Delivery Reviews, 58(14), 1456–
1459. http://dx.doi.org.ezproxy.neu.edu/10.1016/j.addr.2006.09.011
Farokhzad, O. C., & Langer, R. (2009). Impact of nanotechnology on drug delivery.
ACS Nano, 3(1): 16–20. doi:10.1021/nn900002m
Freestone, I., Meeks, N., Sax, M., & Higgitt, C. (2007). The Lycurgus Cup – a Roman
nanotechnology. Gold Bulletin, 40(4), 270-277. Retrieved from
http://master-mc.u-strasbg.fr/IMG/pdf/lycurgus.pdf
Freund, B., Tromsdorf, U. I., Bruns, O. T., Heine, M., Giemsa, A., Bartelt, A., . . .
Nielsen, P. (2012). A simple and widely applicable method to 59Fe-
radiolabel monodisperse superparamagnetic iron oxide nanoparticles for in
vivo quantification studies. ACS Nano, 6(8), 7318-7325. Retrieved from

54
http://pubs.acs.org/doi/abs/10.1021/nn3024267
Fritsch, P., Sérandour, A. L., Grémy, O., Phan, G., Tsapis, N., Abram, M. C., . . .
Poncy, J. L. (2009). Simplified structure of a new model to describe urinary
excretion of plutonium after systemic, liver or pulmonary contamination of
rats associated with Ca-DTPA treatments. Radiation Research Society,
171(6), 674-86. doi:10.1667/RR1530.1
Gupta, A. K., & Curtis, A. S. (2004). Lactoferrin and ceruloplasmin derivatized
superparamagnetic iron oxide nanoparticles for targeting cell surface
receptors. Biomaterials, 25(15), 3029-3040.
http://dx.doi.org.ezproxy.neu.edu/10.1016/j.biomaterials.2003.09.095
Gupta, A. K., & Gupta, M. (2005). Synthesis and surface engineering of iron oxide
nanoparticles for biomedical applications. Biomaterials, 26, 3995-4021.
doi:10.1016/j.biomaterials.2004.10.012
Gupta, A. K. & Wells, S. (2004). Surface-modified superparamagnetic nanoparticles
for drug delivery: preparation, characterization, and cytotoxicity studies.
IEEE transactions on nanobioscience, 3(1), 66-73.
doi:10.1109/TNB.2003.820277
Heiligtag, F. J., & Niederberger, M. (2013). The fascinating world of nanoparticle
research. Materials Today, 16 (7/8), 262-271.
http://dx.doi.org/10.1016/j.mattod.2013.07.004
Herranz, Fernando, Pellico, J., & Ruiz-Cabello, J. (2012). Covalent functionalization
of magnetic nanoparticles for biomedical imaging. Biomedical Optics &
Medical Imaging, SPIE Newsroom. doi:10.1117/2.1201209.004473
Horikoshi, S., & Serpone, N. (Eds.). (2013). Microwaves in nanoparticle synthesis:
Fundamentals and applications. Somerset, NJ: Wiley.
doi:10.1002/9783527648122.ch1
Hougha, R. M., Noblea, R. R. P., Reich, M. (2011). Natural gold nanoparticles. Ore
Geology Reviews, 42(1), 55-61. doi:10.1016/j.oregeorev.2011.07.003
Jellinek, E. H. (2004). Chronic alpha-irradiation of the nervous system from thorium
dioxide. Journal of the Royal Society of Medicine, 97(9), 345-349.
Retrieved from http://www.ncbi.nlm.nih.gov/pmc/articles/PMC1079535/
Jin, R., Cao, Y., Mirkin, C. A., Kelly, K. L., Schatz, G. C., & Zheng J. G. (2001).
Photoinduced conversion of silver nanospheres to nanoprisms. Science,
294(5548), 1901-1903. doi:10.1126/science.1066541
Kaick, v. G., Bahner, M. L., Liebermann, D., Luhrs, H., & Wesch, H. (1999).
Thorotrast-induced liver cancer: results of the German thorotrast study.
Radiologe, 39(8), 643-651. doi:10.1007/s001170050561
Knoll, M., & Ruska, E. (1931). Beitrag zur geometrischen Elektronenoptik. I.
Annalen der Physik, 404(5), 607-640. doi:10.1002/andp.19324040506
Kreuter, J. (2007). Nanoparticles – a historical perspective. International Journal of
Pharmaceutics, 331(1), 1–10. doi:10.1016/j.ijpharm.2006.10.021
Lodhia, J., Mandarano, G., Ferris, N. J., Eu, P., & Cowell, S. F. (2010). Development
and use of iron oxide nanoparticles (Part 1): Synthesis of iron oxide
nanoparticles for MRI. Biomedical Imaging and Intervention Journal, 6(2),

55
e12. doi:10.2349/biij.6.2.e12
Martindale, A. A., Papadimitriou, J. M., & Turner, J. H. (1980). Technetium-99m
antimony colloid for bone-marrow imaging. Journal of Nuclear Medicine,
21(11), 1035-1041. Retrieved from
http://jnm.snmjournals.org/content/21/11/1035.long
Matsumura Y., & Kataoka K. (2009). Preclinical and clinical studies of anticancer
agentincorporating polymer micelles. Cancer Science, 100(4), 572–579.
doi:10.1111/j.1349-7006.2009.01103.x
Neuberger, T., Schöpf, B., Hofmann, H., Hofmann, M., & Brigitte, V. R. (2005).
Superparamagnetic nanoparticles for biomedical applications: Possibilities
and limitations of a new drug delivery system. Journal of Magnetism and
Magnetic Materials, 293(1), 483-496.
http://dx.doi.org.ezproxy.neu.edu/10.1016/j.jmmm.2005.01.064
Nishiyama, N., Bae, Y., Miyata, K., Fukushima, S., & Kataoka, K. (2005). Smart
polymeric micelles for gene and drug delivery. Drug Discovery Today:
Technologies, 2(1), 21– 26.
http://dx.doi.org.ezproxy.neu.edu/10.1016/j.ddtec.2005.05.007
Nishiyama, N., & Kataoka, K. (2006). Current state, achievements, and future
prospects of polymeric micelles as nanocarriers for drug and gene delivery.
Pharmacology and Therapeutics, 112(3), 630– 648.
http://dx.doi.org.ezproxy.neu.edu/10.1016/j.pharmthera.2006.05.006
Plouffe, B. D., Nagesha, D. K., DiPietro, R. S., Sridhar, S., Heiman, D., Murthy, S.
K., & Lewis L. H. (2011). Thermomagnetic determination of Fe3O4
magnetic nanoparticle diameters for biomedical applications. Journal of
Magnetism and Magnetic Materials, 323(17), 2310-2317.
http://dx.doi.org/10.1016/j.jmmm.2011.04.013
Qu, S., Yang, H., Ren, D., Kan, S., Zou, G., Li, D. & Li, M. (1999). Magnetite
Nanoparticles Prepared by Precipitation from Partially Reduced Ferric
Chloride Aqueous Solutions. Journal of Colloid and Interface Science,
215(1), 190-192. http://dx.doi.org.ezproxy.neu.edu/10.1006/jcis.1999.6185
Sawant, R. M. (2008). Polyethylene glycol (peg) as a key component of long-
circulating delivery systems for therapy and imaging. (Doctoral
dissertation). Retrieved from Digital Scholarship, Publishing, and
Preservation at Northeastern University.
http://hdl.handle.net/2047/d1001701x
Schwertmann, U., & Cornell, R. M. (1991). Iron oxides in the laboratory preparation
and characterization. Weinheim, New York: VCH.
doi:10.1002/9783527613229
Shanehsazzadeh, S., Oghabian, M. A., Daha, F. J., Amanlou, M., & Allen, B. J.
(2013). Biodistribution of ultra small superparamagnetic iron oxide
nanoparticles in BALB mice. Journal of Radioanalytical and Nuclear
Chemistry, 295(2), 1517-1523. doi:10.1007/s10967-012-2173-4
Shi, J., Votruba, A. R., Farokhzad, O. C., & Langer, R. (2010). Nanotechnology in
drug delivery and tissue engineering: from discovery to applications. Nano

56
Letters, 10(9): 3223–3230. doi:10.1021/nl102184c
Stern, H.S., McAfee, J.G., & Subramanian, G. (1966). Preparation, distribution and
utilization of Technetium-99m-sulfur-colloid. Journal of Nuclear Medicine,
7, 665-675. Retrieved from http://jnm.snmjournals.org/content/7/9/665.long
Swami, A., Shi, J., Gadde, S., Votruba, A. R., Kolishetti, N., & Farokhazd, O. C.
(2012). Nanoparticles for targeted and temporally controlled drug delivery.
In S. Svenson & R.K. Prud’homme (Eds.), Multifunctional Nanoparticles
for Drug Delivery Applications: Imaging, Targeting, and Delivery (pp. 9-
29). Nanostructure Science and Technology. doi:10.1007/978-1-4614-2305-
8_2
Taniguchi, Norio. (1974). On the Basic Concept of NanoTechnology. Proceedings of
the International Conference of Production Engineering. Tokyo, Part II,
Japan Society of Precision Engineering.
Teja, A. S., & Koh, P. (2009). Synthesis, properties, and applications of magnetic iron
oxide nanoparticles. Progress in Crystal Growth and Characterization of
Materials, 55, 22-45. doi:10.1016/j.pcrysgrow.2008.08.003
Thomas, R., Park, I., & Jeong, Y. Y. (2013). Magnetic iron oxide nanoparticles for
multimodal imaging and therapy of cancer. International Journal of
Molecular Science, 14(8), 15910-15930. doi:10.3390/ijms140815910
Torchilin, V. 2009. Multifunctional and stimuli-sensitive pharmaceutical nanocarriers.
European Journal of Pharmaceutics and Biopharmaceutics, 71(3), 431–
444. doi:10.1016/j.ejpb.2008.09.026
Vert, M., Doi, Y., Hellwich, K., Hess, M., Hodge, P., Kubisa, P., . . . Schué, F. (2012).
Terminology for biorelated polymers and applications (IUPAC
Recommendations 2012). Pure and Applied Chemistry, 84(2), 377-410.
http://dx.doi.org/10.1351/PAC-REC-10-12-04
Wang, Y. X., Hussain, S. M., & Krestin, G. P. (2001). Superparamagnetic iron oxide
contrast agents: Physicochemical characteristics and applications in MR
imaging. European Radiology, 11(11), 2319-2331.
doi:10.1007/s003300100908
Yang, H., Lee, H. J., Jang, K., Park, C. W., Yang, H. W., Heo, W. D., & Kim, J..
(2009). Poly(amino acid)-coated iron oxide nanoparticles as ultra-small
magnetic resonance probes. Journal of Materials Chemistry, 19(26), 4566-
4574. doi:10.1039/B820139K
Yen, S. K., Padmanabhan, P., & Selvan S. T. (2013). Multifunctional iron oxide
nanoparticles for diagnostics, therapy and macromolecule delivery.
Theranostics, 3(12), 986-1003. doi:10.7150/thno.4827
Yordanov, G. (2013). Advanced strategies for drug delivery in nanomedicine. In P.
Kralchevsky, R. Miller, & F. Ravera (Eds.), Progress in colloid and interface
science: Colloid and interface chemistry for nanotechnology (pp. 3-36).
London, GBR: CRC Press.
Zhang L., Gu, F. X., Chan, J. M., Wang, A. Z., Langer, R. S., & Farokhzad, O. C.
(2007). Nanoparticles in medicine: therapeutic applications and
developments. Clinical Pharmacology Therapeutics, 83(5): 761–769.

57
doi:10.1038/sj.clpt.6100400
Zuckerman, J. E., & Davis, M. E. (2013). Targeting therapeutics to the glomerulus
with nanoparticles. Advances in Chronic Kidney Disease, 20(6), 500-7.
doi:10.1053/j.ackd.2013.06.003.