in-work poverty in europe extent, structure and causal...
TRANSCRIPT

In-work Poverty in Europe
-
Extent, Structure and Causal Mechanisms
Dorothee Spannagel
Carl von Ossietzky Universität
Oldenburg

2
In-work poverty in Europe is an intensely discussed issue. The topic generates extensive media
coverage and is high on the EU policy agenda. In social science, however, in-work poverty is
far from being an established research topic. This can partly be traced back to the roots of re-
search on poverty and exclusion. Ever since the first studies on poverty, employment was re-
garded as the best way out of such a situation (Rowntree 1918). Also in the current debate on
activation (Barbier 2005; van Berkel and Moller 2002) a job is perceived as the most effective
prevention mechanism against falling into poverty and at the same time as a panacea leading
out of poverty. Against this theoretical background, the fact that people might suffer from pov-
erty even though they are employed fulltime was mostly left out of account. This has changed
gradually since the 1990s. A main driver for progress in this research field has always been the
EU (Frazer et al. 2011b). In 2003 the EU explicitly formulated the goal of reducing the number
of working poor as part of the European Employment Strategy and the “open method of coor-
dination” on poverty and social exclusion. For this purpose an indicator for measuring in-work
poverty was added to the respective indicator set (Eurostat 2010b). Until today, existing studies
deal almost exclusively with the individual and household-related circumstances of in-work
poverty (Commission 2011a; Cooke and Lawton 2008; Ponthieux 2010). The question how
country-level political, social or economic institutions influence in-work poverty patterns is
only just starting to be taken into account by research (Frazer et al. 2011a; Lohmann 2009;
Lohmann and Andreß 2008). To shed a light on these national factors which influence the level
of in-work poverty is the aim of the present article.
The existing micro-level studies on the working poor point at a crucial characteristic feature of
in-work poverty (Nollmann 2009; Peña-Casas and Latta 2004): There are different angles to
look at the working poor. On the one hand they can be regarded as poor persons who are work-
ing, on the other as working persons who are poor. Each perspective has far-reaching conse-
quences for the undertaken research: Studies following the latter perspective – working but
poor – often stress the relevance of labour-market related factors. In consequence, they discuss
the importance of policy measures that aim at improving the quality and remuneration of jobs.
In contrast, research that departs from the poverty perspective focuses more on household re-
lated factors and emphasises the importance of raising the employment intensity of households.
These two different approaches refer to a key characteristic of in-work poverty: The combina-
tion of individual and household related elements. The former aspect refers to the individual
labour market situation, whereas poverty is usually measured on the household level. Hence,
in-work poverty can be described in a general sense as the situation that an employed person

3
lives in a poor household. A comprehensive approach thus has to encompass individual and
household related aspects. It makes a difference if a person is regarded as in-work poor despite
potential household resources or if it is taken into account that a working person might be poor
precisely because of the household context he or she lives in. Furthermore, measuring in-work
poverty on the household level has the advantage that it provides a better understanding of the
social problems in-work poverty entails (Peña-Casas and Latta 2004). With regard to the coun-
try-level research interest of the present article the household perspective on in-work poverty
allows to take the influence of policy measures into special consideration, as they are often
targeted at the household level.
The distinction between individual characteristics and the household context is crucial for un-
derstanding in-work poverty. It this therefore obvious that both individual and household relat-
ed aspects have to be considered as explanatory factors for belonging to the working poor. Yet,
a comprehensive approach also has to take the country-level influences into account that under-
lie in-work poverty. This is right the starting point of the present article. On the basis of the
influence of individual characteristics and household related aspects that are taken from re-
viewing the literature the crucial question to ask is: How much of the extent of in-work poverty
is explained by the institutional country-level setting of the labour market and welfare state
related polices, especially family policies, and transfers and benefits and how does this pattern
vary across European countries? The basic assumption is that households are working poor not
only because of their certain composition or the characteristics of their household members, but
because of the prevailing labour market and welfare state institutions and policies. Using the
EU-SILC 2010 data it will be analysed if or to what extent such country-level factors explain
in-work poverty net of the individual and household context. The present article adds to exist-
ing research as it regards the in-work poverty risk as being moderated and filtered through the
country-level institutional context. This special focus will be dealt with by using multi-level
models.
The article is organised as follows: The first section deals with the theoretical concept of in-
work poverty. Section two takes a closer look at the EU-SILC data and the applied methods.
The varying structure of in-work poverty in European countries will be analysed in section
three. In a next step, the explanatory power of country-level influences is discussed against the
background of the results of the multi-level models. In a last section the main findings are criti-
cally assessed. The article concludes with proposals for further research as well as some policy
suggestions for combating in-work poverty.

4
1. The concept of in-work poverty
This section departs from the combination of individual and household related factors that
characterises in-work poverty. The first part deals with the state of the discussion concerning
these two explanatory aspects. The second focus is to derive the hypotheses under study. Ac-
cording to the research perspective of the present article, these are focused on the national
mechanisms that underlie in-work poverty. The task is to explain how the national institutional
setting contributes to the risk of being working poor.
As mentioned above, in-work poverty is a very young research topic. A first study dealing with
the relation of earning low-wages and being poor was published in 2002 (Observatory 2002). A
huge step forward was the implementation of the “EU Survey on Income and Living Condi-
tions” (EU-SILC) in 2003. This study was especially designed to monitor the changing living
conditions in Europe and to provide sound information on various faces of poverty and social
exclusion (Wolff et al. 2010). In the wake of launching this survey many studies were pub-
lished that stated markedly rising in-work poverty rates in Europe. They focus on the extent of
the poverty risk among employed persons in Europe (Bardone and Guio 2005), the socio-
demographic profile of the working poor (Eurostat 2010b; Ponthieux 2010) or the influence
low wages have on explaining in-work poverty (Cooke and Lawton 2008; Grimshaw 2011;
Nolan et al. 2010).Taken together, all these studies describe patterns of in-work poverty and
explain how individual characteristics and household related factors lead into being working
poor (Eurostat 2010b; Lohmann 2008). The two micro-level explanatory strands, individual
and household related aspects, are analysed in the following paragraphs.
1.1 Micro-level pathways into in-work poverty
1. Individual factors causing in-work poverty: Individual characteristics are in general related
to the employment situation of employed poor individuals. Low wages are an important fac-
tor contributing to a high risk of being in-work poor (Cooke and Lawton 2008; Grimshaw
2011; Nolan et al. 2010). Research therefore is often focussed on revealing the mechanisms
that are crucial for explaining low wages (Asplund and Persson 2000; Bardone and Guio
2005; Observatory 2002; Peña-Casas and Latta 2004): The bottom line story of this litera-
ture is that being poorly educated is the most prominent explanatory factor as it increases
the risk to earn low-wages markedly: The lower the level of qualification obtained, the
higher the risk of earning low-wages and, in turn, the higher the risk of being in-work poor

5
(Commission 2011b; Cooke and Lawton 2008). 1 A further aspect that makes a decisive
contribution to a low-wage risk is being a migrant (Grimshaw 2011). Furthermore, it is
widely agreed that low-wages tend to dominate among younger and female employees and
that they are clearly concentrated in certain occupations, especially in unskilled blue-collar
jobs (Peña-Casas and Latta 2004). Given all these aspects, it is important to stress, that most
low-paid workers are not poor when taking the household context into account (Nolan et al.
2010). According to Strengmann-Kuhn (Strengmann-Kuhn 2003) only one quarter of the
risk of being in-work poor can be explained by earning low wages. Furthermore, fixed-term
contracts and part-time employment vastly increase the in-work poverty risk (Commission
2011b). Self-employment is a further employment situation that is positively related to the
risk of being in-work poor (Lohmann and Andreß 2008).
2. Household related factors causing in-work poverty: Turning to the household related as-
pects of being working poor, means turning to the poverty part of in-work poverty. The
household perspective emphasises that the individual well-being strongly depends on the
sum of resources pooled by all household members and, in turn, on their needs (Bardone
and Guio 2005). Whether a household falls below the poverty threshold or not depends on
the level of the disposable household income. This income consists of three elements: The
financial resources of all household members, mainly their earnings, the household benefits
and the household composition. The latter refers to the number of dependent persons, espe-
cially children and retired, who live in a household. It was proven that a high number of
household members who depend on the total household income is a main factor leading into
in-work poverty (Commission 2011b).2 Single parents with dependent children face the
highest, households with more than one adult without dependents the lowest in-work pov-
erty risks (Frazer et al. 2010). This works through three mechanisms: Firstly, dependents in-
crease a household’s needs and they do not contribute to the household income. Secondly, a
high number of persons who need special care such as young children may lead to con-
straints for taking up a full-time or a second employment. Furthermore, the household com-
position accounts for the earnings-part of the disposable household income as it influences
the employment intensity of the household members. This aspect of the household composi-
tion explains a major proportion of the in-work poverty risk. Yet, the type of contract plays
1 Yet, it is important to mention that the link between low-wages and poverty is far from being straightforward. In fact, many studies have shown that there is only a restricted overlap between low-wages and poverty (Commission 2011b; Nolan and Marx 2000; Nolan et al. 2010). 2 This factor is, from a statistical perspective, to a great deal balanced by using equivalence scales to compute the disposable income.
6
an important role as well (Commission 2011a): The higher the proportion of full-time em-
ployees with permanent contracts, the lower the risk of being in-work poor (Nolan et al.
2010; Nollmann 2009). Accordingly, households with many unemployed or economic inac-
tive members, the latter being especially associated with women, are overrepresented among
working poor (Ponthieux 2010).
To put it in a nutshell: A single-earner household with high needs resulting from many depend-
ents is the prototypical working poor household, especially if the earner is poorly educated and
part-time employed (Brady et al. 2010; Goerne 2011). Departing from this picture, we can state
that there are two micro-level pathways that lead an employed person into poverty: First, if a
worker earns a low-wage and the income resources of the other household members, if there
are any, are not sufficient to lift the household as such above the poverty threshold. The second
mechanism relates to workers whose individual earnings are above the poverty line. They can
become in-work poor, because of the household context they live in. The household related
influences are twofold: Firstly, it can be the case that a household is poor because of a certain
unfavourable household constellation, i.e. high needs and a low employment intensity of the
working-age household members (Crettaz 2011). The second household related mechanism
refers to the household benefit level: The household an employed person lives can be poor,
because the public transfers and benefits this household receives are not sufficient to lift it
above the poverty threshold.
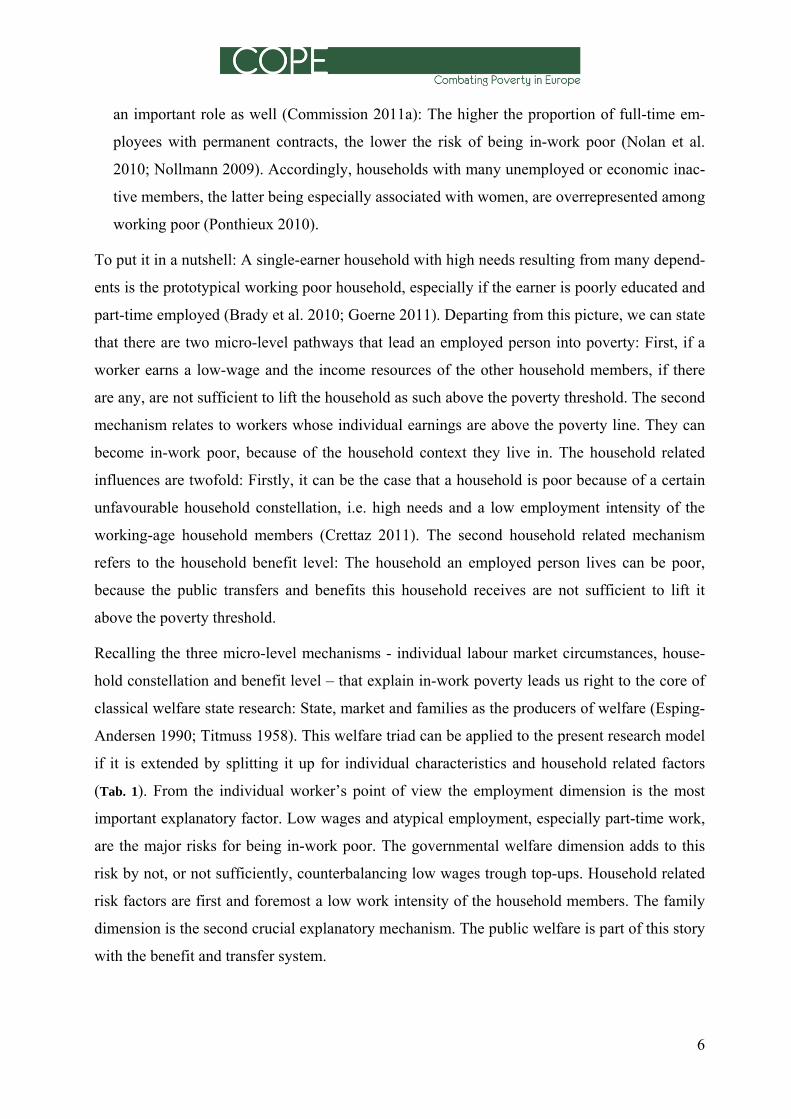
Recalling the three micro-level mechanisms - individual labour market circumstances, house-
hold constellation and benefit level – that explain in-work poverty leads us right to the core of
classical welfare state research: State, market and families as the producers of welfare (Esping-
Andersen 1990; Titmuss 1958). This welfare triad can be applied to the present research model
if it is extended by splitting it up for individual characteristics and household related factors
(Tab. 1). From the individual worker’s point of view the employment dimension is the most
important explanatory factor. Low wages and atypical employment, especially part-time work,
are the major risks for being in-work poor. The governmental welfare dimension adds to this
risk by not, or not sufficiently, counterbalancing low wages trough top-ups. Household related
risk factors are first and foremost a low work intensity of the household members. The family
dimension is the second crucial explanatory mechanism. The public welfare is part of this story
with the benefit and transfer system.
7
Tab. 1 The welfare triad of in-work poverty: Individual and household level
Source: Own research
1.2 The influence of the national institutional context
Research on in-work poverty that also takes the macro-level into account often does this in
order to explain the varying levels of in-work poverty in different countries. Existing literature
focuses on the impact of institutional factors. These studies analyse the influence of labour
market institutions (Lohmann 2009), redistribution (Lohmann 2010a), welfare regimes (Crettaz
2011; Lohmann and Marx 2008) or the economic performance (Brady et al. 2010). Others ex-
amine how the cross-national variations of in-work poverty can be explained (Crettaz and
Bonoli 2011a; Lohmann 2008; Lohmann and Andreß 2008).
Departing from a general point of view, we can state that the country-level frame for explain-
ing in-work poverty underwent major changes in recent years. Five macro-structural trends are
of special relevance for our purpose: Skill biased technological changes (SBTC) and globalisa-
tion trends of the economy, growing labour market inequalities, welfare-to work policies and
the welfare state retrenchment. Most of these developments are directly related to the labour
market dimension.
1. Skill biased technological changes: The focus of the “SBTC-hypothesis” is on a shift within
the demand side of the labour market. It is assumed that jobs for low-skilled persons are on
the decline. Especially the rapid rise of the importance of information technologies, the de-
cline of the fordist model of production and, in turn, the rising relevance of a knowledge
based service economy are discussed as driving factors for shifting labour demand away
from low skilled towards high-skilled workers (Giesecke and Verwiebe 2009). A conse-
quence of these developments is an increasing segmentation of labour markets (Frazer et al.
2011b; Nollmann 2009).
2. Globalisation trends: Globalisation processes are regarded as a further driving factor for the
loss of jobs for low-skilled persons. The extent to which a national economy is integrated in
the global production of goods and services and the scope of integration into global labour
Level Welfare agency Employment Family Public welfare
Individual characteristics
- Low wages - Atypical employment - Low qualifications
- No or insufficient in- work benefits
Household re-lated factors
- Low employment Intensity
- Single earner - High number of children, elderly and otherwise inac- tive or unemployed persons
- Low levels of bene- fits and transfers

8
markets affect low skilled workers. They now face a situation where they directly compete
with low-waged economies especially in countries outside Europe (Frazer et al. 2011b).
Furthermore, a growing global interdependence of national economies could weaken the in-
fluence of employees on the labour market.
3. Rising inequalities: The third crucial development is a rising inequality both within the la-
bour market as within the wage distribution. It results at least partly from the two other
trends. Technological changes work against low skilled workers as they entail growing ine-
qualities. The underlying mechanisms are twofold. Firstly, new jobs are concentrated in rel-
atively high and low pay levels especially in the service sector (Commission 2011a). Sec-
ondly, skill biased technological demand shifts lead to higher financial rewards for highly
skilled employees (OECD 2011). A further aspect that is discussed in this context is the ris-
ing female employment. Women are often employed part-time and/or in low-wage jobs
(Alderson and Nielsen 2002; Crettaz 2011).3
4. “Welfare-to-work”-policies: From a policy point of view the recent turn towards welfare-to-
work policies is an important aspect. At the heart of these policies are increasing work in-
centives for the non-working population. As a consequence, the proportion of workers who
formerly lived on unemployment benefits or social assistance increased. Many of these per-
sons were employed in poorly paid jobs at the bottom end of the labour market (Andreß and
Lohmann 2008). This is right the mechanism how active labour market policies could pave
the way to rising in-work poverty. Several studies point at the fact that activation measures
shift poor households with no one working into working poor households because individu-
als often are forced to take up any job they are offered no matter how bad the job conditions
are (Lohmann 2008; Nollmann 2009).
5. Welfare state retrenchment: What can be stated with regard to changing welfare state set-
tings is first and foremost a decline or stagnation of spending levels for the working-age
population (Cantillon et al. 2012). Furthermore, the spending has shifted to a more work-
orientated approach (Frazer et al. 2011b): Work-related spending was increased while the
generosity of passive income support declined (Cantillon 2011).
All these trends form the background against which it is now possible to derive the hypotheses.
They aim at explaining the influence the country level setting has on in-work poverty.
1.3 Hypotheses
3 Interestingly, empirical evidence from Scandinavian countries, especially Sweden, shows that this does not have to be the case. Sweden has high female employment rates and low wage inequalities (Larsson and Halleröd 2011).

9
The country-level setting works as a filter through which the micro-level risks for becoming in-
work poor can be either reduced or increased. Each individual and household related risk di-
mension – employment characteristics, household constellation and benefit level – is being
moderated through different nation-level institutions. Employment related aspects are mainly
influenced by labour market institutions which alter the effect of market forces. The household
constellation is shaped through family policies that set (dis-)incentives for the formation of
certain household types. The benefit level of course is related to the financial part of the wel-
fare system.
1.3.1 Labour market setting
Turning to the first strand, we have to recall that low wages are the main explanatory factor of
in-work poverty and that the risk of earning low wages is especially high for low skilled em-
ployees at the margins of the labour market. Thus, the main question is: How do national em-
ployment regimes contribute to these mechanisms? Low wages reflect first of all the employ-
ers’ ability and willingness to pay higher wages and the readiness of the employees to accept
low wages. The crucial labour market institutions that influence these elements are the struc-
ture of the labour force and the trade unions as they have a decisive influence on the wage lev-
els. Wage dispersion as an outcome measure will be considered as a third element.
1. Structure of the labour force: The crucial question is: Which are the population groups that
are overrepresented at the bottom of the labour market? Against the backdrop of the
“SBTC-hypothesis” and the impact of globalisation it can be assumed that the decisive
characteristics of the population groups in question are low educational and/or vocational
skills. With regard to in-work poverty we can therefore argue: A labour force that is charac-
terised through high shares of low skilled reduces the relative demand for low-skilled em-
ployees and therefore increases the pressure on these groups. Hence, a first crucial figure for
the present analysis is the percentage of low skilled among the labour force.
2. Trade unions: Unions play an important role in wage bargaining processes. It has been
proven they have an important influence on the wage levels and therefore on the individual
low-wage risk (Lohmann and Marx 2008; Lucifora 2000). Thus it can be assumed that low
wages are less wide-spread in countries with influential trade unions. Hence, union density
is the second explanatory aspect of the labour market context.
3. Wage dispersion: The third element that will be considered is the extent of wage dispersion.
Previous research on this topic widely stated that countries with a high degree of wage dif-
ferentiation tend to have higher shares of low wages (Blau and Kahn 1996; Lucifora 2000).

10
It is important to stress that the extent of wage dispersion has to be regarded as an outcome
of the structure of the labour force and the role of trade unions. Countries with powerful un-
ions have more egalitarian wage structures, i.e. lower income inequalities (Alderson and
Nielsen 2002; Grimshaw 2011).
Summing up these three considerations we can derive the first hypothesis:4
H1: The extent of in-poverty can be explained through the labour market setting. Countries
with a high percentage of low skilled among the labour force and high wage dispersion have
higher numbers of working poor. High union density lowers their share.
1.3.2 Dual earner policies
The second hypothesis concerns policies which affect the relation of non-working and working
household members as well as the work intensity of a household. In classical welfare state re-
search such measures are summed up under the term “defamilisation”. A low level of defam-
ilisation, as for example in the Mediterranean countries, describes a situation where the indi-
vidual welfare is highly dependent on the own family. In turn, the individual welfare is more
independent from family ties in countries with a high extent of defamilisation (as in Sweden).
Such countries are characterised through a good availability of public childcare, care for the
elderly and a high level of family transfers. As a result, women are more independent from care
obligations and a male earner in such countries (Lohmann 2008). In policy terms defamilisa-
tion relates to dual earner policies. As seen above, the relation of needs and resources is the
crucial explanatory mechanism for in-work poverty from a household point of view. The ar-
gument is that policies which foster dual earner households lead to lower numbers of working
poor because a second income in a household vastly increases the chance that the disposable
household income is lifted above the poverty threshold. The influences of dual earner policies
on in-work poverty can be looked at from two different angles:
1. Public childcare: The availability of public childcare is assumed to be a direct measure of
defamilisation. An easy access to public childcare facilities is regarded as a driver for high
numbers of dual-earner households. We can therefore argue that countries with a dense net
of public childcare have lower in-work poverty rates.
2. Female employment: The share of females among all employees is regarded as an outcome
of dual earner policies. Female employment rates tend to be higher in countries which are
4 Active labour market policies definitely play a key role as well. Unfortunately it was not possible to include appropriate variables for the relevant policies. Hence, this explanatory strand will not be covered. A comprehen-sive overview on active labour market policies can be found in Bonoli (Bonoli 2010). For a discussion how such policies influence in-work poverty see Cooke and Lawton (Cooke and Lawton 2008).

11
characterised by a high degree of defamilisation. It is plausible, however, to assume that
their share also depends on labour market characteristics.5
Taken together, all these aspects lead us to the hypothesis on defamilisation influences:6
H2: Defamilisation policies, especially dual earner policies, have a decisive impact on the ex-
tent of in-work poverty. Countries with a good availability of public childcare and high female
employment rates have lower in-work poverty shares.
1.3.3 Transfers and benefits
The last explanatory mechanism concerns the benefit level a household receives and hence an
important aspect of decommodification policies. The term “decommodification” refers to the
level and the availability of public transfers for those outside the labour market (Esping-
Andersen 1990). Individuals who live in poor households even though they are in-work are of
course not directly targeted by such policies. But as these measures have a decisive influence
on the balance of a household’s needs and resources, they have to be taken into account. They
mitigate the negative effect of risk factors such as low wages by ensuring that a household’s
disposable income is adequate (Frazer et al. 2010). What could be proven is that the generosity
of welfare states has a substantial effect on reducing in-work poverty (Brady et al. 2010;
Lohmann and Marx 2008). Countries with higher levels of decommodification, for example
Sweden, as a consequence have lower income inequality (Alderson and Nielsen 2002). Given
the research focus of the present article, three categories of transfers and benefits are of special
relevance:
1. Unemployment replacement rates: The benefits that are paid to unemployed persons directly
counterbalance the mechanism that such household members increase the poverty risk of
working households. In many households these benefits account for a significant part of the
disposable income (Peña-Casas and Latta 2004). Replacement rates influence in-work pov-
erty through a second mechanism: Lower replacement rates lead to lower wages as they re-
duce the wage levels individuals are willing to accept, i.e. the reservation wage. Due to pre-
vailing male breadwinner models, such reservation wages tend to be lower for women than
for men (Grimshaw 2011).
5 Defamilisation policies influence the extent of in-work poverty through a further mechanism the present article won’t pursue: Policy measures which are especially targeted at young unemployed persons reduce in-work pov-erty shares: If young adults, a group facing above average unemployment risks in most European countries, are forced to move back to their parents because they don’t receive enough public benefits this could shift the parent’s household into in-work poverty (Lohmann 2008). 6 It has to be mentioned that there are two more core elements of defamilisation and dual earner policies. The first, transfers targeted to families, is included in the third hypothesis; the second, the availability of care for the elderly, cannot be covered due to the lack of data.

12
2. Social assistance schemes: Social assistance schemes, which are an important aspect of de-
commodification policies, are included for two reasons: Firstly, the level of social assistance
can be regarded as the breadline for an adequate socio-cultural standard. In many countries,
low-wage earners are therefore eligible for top-ups that lift their income up to the social as-
sistance level. Secondly, social assistance is in many countries the type of transfer that is
paid to long-term unemployed – a population group which is overrepresented among in-
work poor households. The easier it is for individuals outside the labour market to receive
these benefits and the higher they are, the more likely it is that the level of benefits a work-
ing household receives is sufficient to lift it out of poverty. Hence, countries in which
households or their members have to meet rather strict criteria to be able to receive public
benefits are more likely to have high shares of in-work poverty. Working-age individuals
living in these countries depend more exclusively on their labour market earnings.
3. Family transfers: Benefits for families are decommodification as well as defamilisation
measures. Even though not directly targeted at persons outside the labour market, family
transfers contribute a significant proportion to the disposable income of families and there-
fore partly counterbalance the effect of several unfavourable household constellations.
In sum, public transfers are not only important for the level of household benefits. They can
also be regarded as shaping (dis-)incentives for individuals to accepts low wages and for em-
ployer to pay such low wages (Grimshaw 2011). Given these considerations, the hypothesis on
transfers and benefits is:
H3: The lower the generosity of welfare state benefits, the higher the number of working poor.
Countries with high unemployment replacement rates and generous social assistance schemes
and high family transfers have lower shares of working poor.
At this point it has to be recalled that these country-level mechanisms are not expected to ex-
plain the major part of the risk of being in-work poor. It is rather likely that their influence is
small compared to the micro-level aspects. Yet, an approach that aims at explaining in-work
poverty in a comprehensive way has to take all three explanatory levels into account: Individu-
al labour market circumstances, the household composition and its benefit level as well as in-
stitutional factors of the labour market setting, family policies and welfare state arrangements.
Based on the three country-level hypotheses we can now amend the welfare triad of pathways
into in-work poverty with the third level and by doing this complete the research model (Tab. 2).

13
Tab. 2 The welfare triad of in-work poverty: Country-level
Source: Own research
2. Data and methods
After analysing micro- and macro-level influences on the risk of being working poor, the issue
how to define and operationalise in-work poverty is tackled now. What is rather astonishing is
that, despite all the progress in research and the huge political interest in this topic, there are
still vivid debates about how exactly in-work poverty should be measured. This ambiguity can
certainly be explained by a characteristic feature of the research subject: The combination of
poverty and work.
Looking at the definition of poverty is the easier part of the story. It is widely agreed that
households are defined as poor if they have an equivalised disposable net-income of less that
60% of the national median income. When proceeding to the definition of the status “worker”,
things turn out to be more complex. Researchers still have not agreed on a common under-
standing of this term. Existing approaches can be broken down into three dominating concepts,
all of them referring to the main activity status an individual reports for at least six months in
the past year (Peña-Casas and Latta 2004; Ponthieux 2010):7 Firstly the active approach, a con-
cept, which is used by the US Bureau of Labour and Statistics. It is the broadest of the three
concepts as it defines employment as being active on the labour market, either employed or
unemployed. Secondly, the French employment concept which is based on the US-approach.
Yet, it restricts the US-concept in one central aspect: An individual has to be employed during
at least one of the six months in order to be designed the status “worker”. This criterion nar-
rows the potential population group markedly to all those persons who were unemployed for 7 This list only includes the three most important approaches. For an instructive overview over other concepts see Crettaz (Crettaz 2011).
Level Welfare agency Employment Family Public welfare
Individual characteristics
- Low wages - Atypical employment - Low qualifications
- No or insufficient in-work benefits
Household re-lated factors
- Low employment intensity
- Single earner - High number of children, elderly and otherwise inac- tive or unemployed pesons
- Low levels of bene- fits and transfers
Country-level influences
- Low skilled in labour force - Trade unions - Wage dispersion
- Degree of defamilisation - Dual earner policies
- Unemployment re- placement rates - Social assistance Schemes - Family transfers
14
only a comparatively short period, while the US-approach even includes long-term unem-
ployed. The third concept is the in-work approach. This is the one that is officially used by the
EU. Defining “working” as being in-work is a strict concept: Individuals are regarded as being
in-work only if they that were employed during at least six months in the past year.
The decision about one of these three concepts has both theoretical and empirical implications.
A broader concept like the active approach attaches more importance to labour market factors
whereas a more restricted one is more likely to produce the result that the household composi-
tion prevails over the individual labour market situation in explaining in-work poverty
(Ponthieux 2010). The empirical implication of how to define being “in-work” refers to the
issue of how broad or narrow the size of the potentially working poor population is. The pat-
tern is obvious: The more restricted the underlying definition of being a worker, the lower the
shares of in-work poverty.8 As the present article aims at being comparable with other studies
in this field the dominating EU-approach is applied. Thus, in-work poverty is defined as fol-
lows: A person is in-work poor if he or she reports employment as his or her main activity sta-
tus for at least six months during the past year and if this person lives in a household that has a
disposable of less than 60% of the national median.
The empirical analysis is based on the cross-sectional EU-SILC 2010 data. This dataset is cur-
rently the most comprehensive survey for comparative purposes within Europe.9 It consists of a
household questionnaire and an individual one for all household members older than 15 years.
The EU-SILC 2010 covers approximately 137.000 households with 283.00 persons from all
EU-27 countries plus Island and Norway (Eurostat 2010a). Being in-work is measured using
the self-reported information about the most frequent activity status for each month of the past
year. The income information is measured by converting the equivalised disposable monthly
household income into power purchasing parities using the conversion factors proposed in the
EU-SILC.10 11 The sample is restricted to working-age individuals who are full-time em-
8 The socio-demographic aspects that characterise the working poor also depend a great deal on the definition used: A higher selectivity of the definition especially leads to higher shares of single-earner households (Ponthieux 2010). 9 The data set, however, has some considerable problems concerning the strategies that are used for collecting data and sampling. Some population groups, especially foreigners and the elderly as well as young children are un-derrepresented in many countries (Frick and Krell 2010). Furthermore, the EU-SILC combines personal survey data with register data and information from proxy interviews. This leads to a few difficulties in comparing the data (Lohmann 2010). Nevertheless, the EU-SILC is the best available data source for large-scale cross-national comparisons. 10 The data are 1% top- and bottom-coded. Incomes that are zero are excluded. 11 This method entails some problems. The main one is the time discrepancy of the employment information and the income data: The income variable refers to the month the survey is carried out, the employment status to the

15
ployed.12 The operationalised research question is: How can the impact of the three county-
level mechanisms under study be evaluated against the background of the micro-level influ-
ences? This is examined by using multi-level models which will be explained later. First, the
potential influences the micro- and macro-level variables have on in-work poverty are de-
scribed.13
2.1 Micro-level variables
The micro-level variables encompass the three dimensions of the welfare triad of in-work pov-
erty: Individual labour market circumstances, the household constellation, i.e. especially the
labour market attachment of the household members and the household benefit level (Tab. 1).
Their influences on the risk of being in-work poor is briefly described on the basis of the litera-
ture findings discussed in section 1.1.
1. Individual labour market circumstances: As described above, low wages mainly stem from
the occupation held, the educational level and the type of contract. A low educational level,
a fixed-term contract and an occupation at the bottom of the labour market are related to a
high risk of being in-work poor.
2. Household composition: The three variables that are used to measure the household compo-
sition focus on the ratio between a household’s needs and resources: The percentage of full-
time employed per working-age household member. This element is assumed to decrease
the in-work poverty risk. In contrary, a high percentage of unemployed will increase this
risk. The assumed influence of the percentage of dependents, i.e. the number of household
members who are younger than 18 or older than 64 is: The higher their proportion the high-
er the in-work poverty risk.
3. The benefit level: This further important influential household characteristic is measured by
summing up the level all relevant individual and household-related benefits. The influence
on in-work poverty is obviously risk-decreasing.
months in the year prior to the study. This problem is at least partly attenuated by the fact that most employees are in stable employment situations (Eurostat 2010b). 12 The concentration on full-time employment has the advantage that in this case a low household income does not reflect the effects of limited hours of work (Nolan et al. 2010). Nevertheless is has to be stressed that low hours of work and the spread of part-time employment are an important explanatory factor for in-work poverty. Yet it can be argued from a policy point of view, that full-time, not part-time employment should prevent a household from falling below the poverty threshold. Self-employed are excluded from the analysis because this group is, com-pared to employed workers, rather heterogeneous in terms of structure and with regard to policy measures ad-dressing them (Eurostat 2010b). 13 A table with all variables is in Tab. 7 in the appendix.

16
2.2 Macro-level variables
The impact county-level institutions have on in-work poverty is focused on the three dimen-
sions of the welfare triad described above (Tab. 2):
1. Labour market setting: Following the arguments in section 1.2, three variables are used to
measure labour market institutions: First, the percentage of low skilled in the labour force.
The hypothesis is that higher shares of low-skilled increase the in-work poverty risk, as such
persons face markedly higher risks of earning low wages. The wage differentiation (2) is
measured using the D9/D1-ratio of gross earnings. It is assumed that higher wage inequali-
ties entail higher in-work poverty risks because higher wage dispersion is interrelated with
higher shares of low wages. The strength of trade unions (3) is measured as the union densi-
ty. Powerful unions are expected to positively influence wages, i.e. to lessen the spread of
low wages. Consequentially, it is hypothesised that influential unions decrease the risk of
belonging to the working poor.
2. Dual earner policies: The mechanisms in question focus on two aspects: The availability of
public childcare and the female employment rate. It is argued that both are negatively relat-
ed to the in-work poverty risk, i.e. to decrease it. The underlying argument is that both indi-
cators are expected to increase the number of dual-earner households.
3. Transfers and benefits: As described above three types of benefits and transfers are of spe-
cial relevance for the in-work poverty issue: Firstly, family transfers as they directly influ-
ence the household constellation. Secondly, unemployment replacement rates that not only
contribute to the household benefit level but also influence the wage level through lowering
or increasing reservation wages. Social assistance is the third important benefit scheme. Its
main impact on in-work poverty is that social assistance counterbalances the effect of unfa-
vourable household constellations, especially for such with many long-term unemployed.
The hypothesis is that more generous benefits increase the chance an in-work person has to
live in a household with a disposable income above the poverty threshold.
17
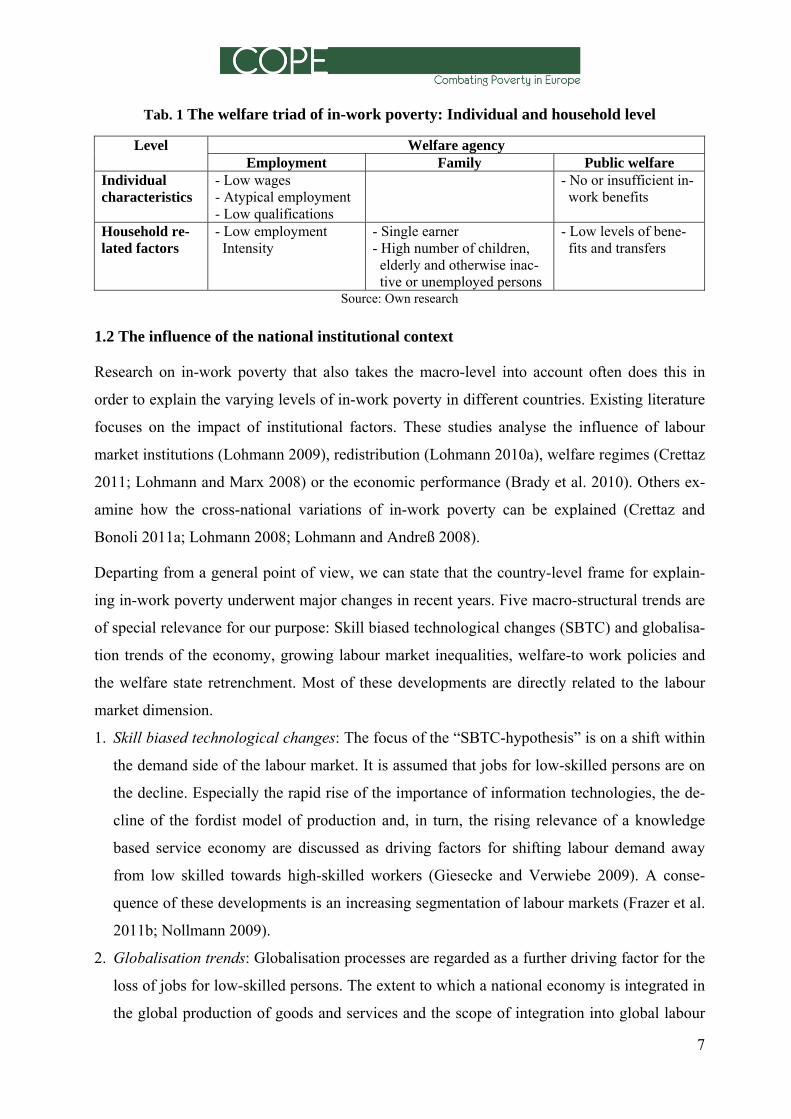
Tab. 3 Expected influences of the country-level context Hypothesis Indicators Expected impact on in-
work poverty Labour market setting (h1)
Low-skilled employees + Importance of trade unions + Wage dispersion +
Dual earner policies (h2)
Public childcare availability - Female employment -
Transfers and benefits (h3)
Family transfers - Unemployment replacement rates - Social assistance -
Source: Own research
2.3 Combing micro- and macro-level: Multi-level models
In order to combine micro- and macro-level multi-level models are used. The outcome variable
is binary coded: Poverty among full-time employed working-age individuals. Therefore the
research question requires a logistic regression, if we had only a single level. The aim, howev-
er, is to analyse the influence of two different levels which means that the observations in the
same country are not independent from each other: Therefore, multi-level models have to be
used. Such multi-level estimations can be understood as an extension of regression models.
They take the hierarchical nesting of data into account by splitting up the error terms for each
level. Thus, such models allow comparing the influence the household and the country-level
variables have on the in-work poverty risk. The multi-level estimation that is applied in the
present article is the logistic two-level random intercept model using the xtemelogit algorithm
in Stata. The similarity between regression and multi-level models can be seen by comparing
the equations for the logistic linear regression (1) (Guo and Zhao 2010; Hox 2010)
logit [pi / (1- pi)] = β0+ β1Xi1 + β2Xi2+ ε (1)
and the logistic two-level random intercept model (2)
logit [pij / (1- pij)] = β0+ β1Xij+ β1Zj ε ij+ μj (2)
where pij is the probability that a household i in a country j is in-work poor. Xij is a micro-level
explanatory variable and Zj is one on the country level. The probability pij that the outcome
equals one, i.e. that a present household is in-work poor, is modelled using a logistic link func-
tion.14 The multi-level model decomposes the error variance into a proportion associated with
the household level (εij) and one associated with the country level (μj).15
14 For reasons of comparability the variables are z-standardised. 15 In the case of a logistic two-level model the error term for the household level is by definition π2/3 3,29 (Rabe-Hesketh and Skrondal 2008).

18
3. Patterns of in-work poverty across Europe
The extent of in-work poverty (Fig.1) varies significantly across European countries. It ranges
from less than 2% in the Netherlands to more than 13% in Luxembourg– a picture that is con-
sistent with the results in literature (Brady et al. 2010; Commission 2011a). On average, in
2010 almost 6% of all full-time employees lived in poor households.16
Fig.1 In-work poverty across Europe 201017
Source: EU-SILC 2010, own calculations.
The countries with the lowest level of in-work poverty are dominated by the Nordic countries
while east European and Mediterranean countries exhibit the highest figures. This picture
shows some similarity to the extended typology of Esping-Andersen’s welfare state regimes
(Esping-Andersen 1999; Ferrera 1996). The general pattern we can state is: Countries with a
socio-democratic welfare regime (Denmark, Finland, Norway and Sweden) tend to have the
lowest in-work poverty rates, whereas the conservative-corporative cluster has moderately low,
under-average figures – especially France, Germany and Austria; the Netherlands and Belgium
have very low in-work poverty shares. The Mediterranean countries (Italy, Malta, Portugal and
Spain) have high in-work poverty rates. The east European cluster is on the one hand character-
ised through high working poor rates (Bulgaria, Estonia, Latvia, Lithuania, Poland); on the
other hand we find countries with only slightly above-average numbers (Hungary and Roma-
16 The result that Luxembourg is an outlier corresponds with findings in literature and is also found in studies dealing with poverty rates in general. It does not seem to be possible to find a good explanation for this result. This why Luxembourg is left out in some studies (Kangas and Ritakallio 2004). 17 The country abbreviations are explained in Tab. 8 in the appendix.
0
2
4
6
8
10
12
14
Working Poor (in % of working‐aged population)

19
nia) and even such with under-averages figures (Czech Republic, Slovakia and Slovenia). The
fact that welfare state regimes have an impact on the extent of in-work poverty, albeit in
various degrees, is a well-known finding (Brady et al. 2010; Crettaz and Bonoli 2011a;
Lohmann and Marx 2008). This is not astonishing, if we recall that defamilisation and
decommodification policies, both definitory dimensions of welfare state regimes, are assumed
to influence the extent of in-work poverty markedly.
There are some deviations from these general patterns that are worth mentioning: Firstly, Swe-
den, which exhibits, compared to the other Nordic countries, high numbers of in-work poverty.
A possible explanation might be the fact that young Swedes tend to leave their parent’s house-
hold rather early and often live on their own (Crettaz and Bonoli 2011b). Therefore, if they
earn low wages, what is quite probable at early stages of the career, these are not balanced by
further incomes. The results for the Netherlands and Belgium are noteworthy too, as they ex-
hibit by far the lowest figures among countries belonging to the continental cluster. The result
for the Netherlands might be related to the fact that this country seem to be a hybrid type with a
high proximity to the socio-democratic regime (Esping-Andersen 1999). The case of Belgium,
however, is a good example for a within-type variation (Lohmann and Andreß 2008). Was is
also striking is that the Czech Republic, as an east European country, has an in-work poverty
rate of less than 3%. The figures in Slovakia and in Slovenia are not much higher. Earlier re-
search proved that the very low in-work poverty shares in the Czech Republic can be explained
by the highly distributive effects of its welfare system (Commission 2011b).Taking these re-
sults into account, we can assume that the impact of the country-level variables under study
varies between the different welfare state regimes. This is examined by plotting the in-work
poverty shares against the country-level indicators.18
Figure Fig. 2 presents the interaction of the qualificational structure of the labour force and the
in-work poverty rate. Several trends can be identified: Firstly, it can be seen that the structure
of the labour force is not stronly related to the extent of in-work poverty. Secondly, the data
demonstrate that all Mediterranean countries are characterised through high in-work poverty
rates and very high shares of low skilled in the labour force. The Nordic and the continental
European countries are located near the bottom left corner with comparatively low figures in
both dimensions.19
18 The scatterplots are only displayed for the country-level variables that proved to have a significant influence on the in-work poverty rate when inculuding them in the multi-level models. 19 With the exception of Luxembourg what is due to its extremely high in-work poverty rate.

20
Fig.2-5 Working poor rates by qualificational structure of the labour force (Fig. 2), wage dispersion (Fig.3), female employment (Fig. 4) and replacement rates (Fig.5)
Fig. 2
Fig.3
Fig. 4
Fig.5
AT
BEBG
CZ
DEDK
EE
ES
FIFR
HU IT
LT LULV
MT
NL NO
PL
PT
RO
SE
SI
SK
UK
0
10
20
30
40
50
60
70
0 2 4 6 8 10 12 14
Female Employm
ent Rates (in%)
Working Poor Rates (in%)
AT
BEBG
CZ DE
DK
EE
ES
FI FR
HU
IT
LT
LU
LV
MT
NL
NO
PL
PT
RO
SE
SI
SKUK
50
55
60
65
70
75
80
85
90
0 2 4 6 8 10 12 14
Replacm
ent Rates 2/3 AW (in%)
Working Poor Rates (in%)
ATBEBG
CZ
DE
DK
EE
ES
FI
FR
HU
IT
LT
LU
LV
MT
NL
NO
PL
PT
RO
SE
SISK
UK
0
10
20
30
40
50
60
70
0 2 4 6 8 10 12 14
Low Educated in
Lab
our Force (in%)
Working Poor Rates (in%)
AT
BE
BG
CZ
DE
DK
EE
ESFIFR
HU
IT
LT
LU
LV
MT
NLNO PL
PTRO
SESI
SK
UK
0
1
2
3
4
5
6
7
8
0 2 4 6 8 10 12 14
D9/D
1‐Ratio of Gross Earnings
Working Poor Rates (in%)
21
How in-work poverty rates interact with wage dispersion is displyed in figure Fig.3. The data
indicate an obvious pattern: Countries that have high wage inequalities tend to have high in-
work poverty shares. East European countries dominate in the top right corner (marked wage
dispersion and many working poor), the corporatist-conservative and the Nordic countries at
the opposite end. All four Mediterranean countries (Italy, Malta, Portugal and Spain) are
located close together in the centre of the figure.
The results for female employment rates (Fig. 4) demonstrate a clear trend: Countries with high
female employment tend to have low numbers of working poor. Especially the Nordic and the
continental European countries show a close interaction of both dimensions. All of them are
located in the top left corner of the picture.
Replacement rates interact slightly negative with in-work poverty (Fig.5). Yet, the picture the
data depict is heterogeneous. The Mediterranean countries (except for Malta) as well as some
east European countries have high values in both dimensions, whereas Estonia, Romania and
Slovakia a characterised by rather low replacement rates and low in-work poverty shares.
If we put together the two aspects discussed above – the extent of in-work poverty and it’s in-
teraction with the significant country-level variables – we can derive some first hints how these
patterns could be explained. The countries with the lowest shares of in-work poverty tend to
have comparatively low wage dispersion (with the exception of Norway). Female employment
as well as the replacement rates are on average very high. Most of the countries with moderate-
ly low in-work poverty are characterised by a rather high percentage of low skilled (except
France) and, with the exception of Slovakia, high female employment rates. What can be noted
beyond that is that the majority of the countries with slightly above-average in-work poverty
rates is characterised through the lowest female employment rates in the sample and low re-
placement rates (except Hungary). The expenditures for family transfers tend to be under-
average in the countries with slightly above-average working poor rates. The picture for the
countries with the highest numbers of in-work poverty confirms the suspicion that Luxem-
bourg is an outlier. For all the other countries it can be stated that they have moderately low
shares of low skilled and rather low female employment rates.
Taken together, what does this picture tell us? It points at the direction that low wage disper-
sion is interrelated with low in-work poverty rates. What we can also assume furthermore is
that the connection between in-work poverty and public childcare is not that straightforward:
Both the countries with the highest and the lowest in-work poverty rates show findings that
22
seem to contradict the assumption that a good availability of childcare facilities goes together
with high female employment rates. Noteworthy, quite a few countries with a low extent of in-
work poverty have above-average shares of low-skilled employees (e.g. Denmark and the
Netherlands), whereas others, such as Poland and Lithuania, show high in-work poverty rates
and low shares of low-skilled.
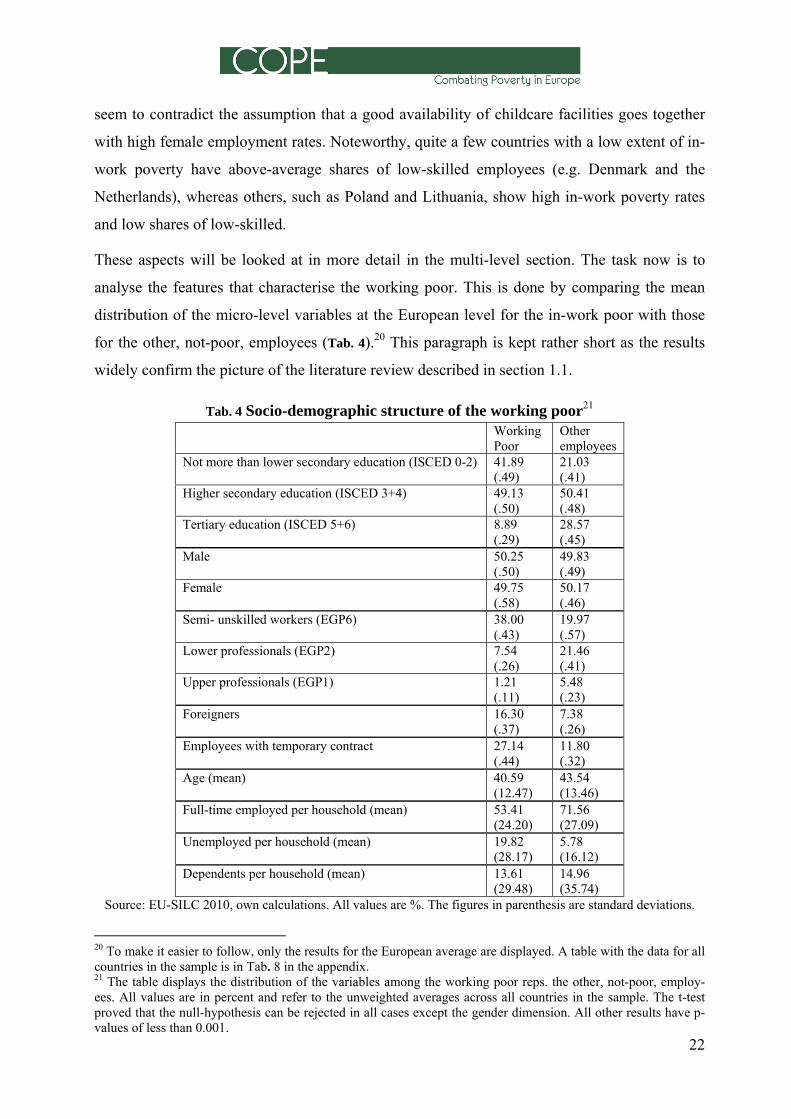
These aspects will be looked at in more detail in the multi-level section. The task now is to
analyse the features that characterise the working poor. This is done by comparing the mean
distribution of the micro-level variables at the European level for the in-work poor with those
for the other, not-poor, employees (Tab. 4).20 This paragraph is kept rather short as the results
widely confirm the picture of the literature review described in section 1.1.
Tab. 4 Socio-demographic structure of the working poor21 Working
Poor Other employees
Not more than lower secondary education (ISCED 0-2) 41.89 (.49)
21.03 (.41)
Higher secondary education (ISCED 3+4) 49.13 (.50)
50.41 (.48)
Tertiary education (ISCED 5+6) 8.89 (.29)
28.57 (.45)
Male 50.25 (.50)
49.83 (.49)
Female 49.75 (.58)
50.17 (.46)
Semi- unskilled workers (EGP6) 38.00 (.43)
19.97 (.57)
Lower professionals (EGP2) 7.54 (.26)
21.46 (.41)
Upper professionals (EGP1) 1.21 (.11)
5.48 (.23)
Foreigners 16.30 (.37)
7.38 (.26)
Employees with temporary contract 27.14 (.44)
11.80 (.32)
Age (mean) 40.59 (12.47)
43.54 (13.46)
Full-time employed per household (mean) 53.41 (24.20)
71.56 (27.09)
Unemployed per household (mean) 19.82 (28.17)
5.78 (16.12)
Dependents per household (mean) 13.61 (29.48)
14.96 (35.74)
Source: EU-SILC 2010, own calculations. All values are %. The figures in parenthesis are standard deviations.
20 To make it easier to follow, only the results for the European average are displayed. A table with the data for all countries in the sample is in Tab. 8 in the appendix. 21 The table displays the distribution of the variables among the working poor reps. the other, not-poor, employ-ees. All values are in percent and refer to the unweighted averages across all countries in the sample. The t-test proved that the null-hypothesis can be rejected in all cases except the gender dimension. All other results have p-values of less than 0.001.

23
The result for the educational dimension is very marked: Less than 9% of all working poor
have a tertiary education, more than 40% have only a low educational level. Not even 10% of
the working poor are employed as higher or lower professionals (compared to more than 25%
of all other employees), while almost 40% of them are semi- or unskilled workers (other em-
ployees: 20%). The percentage of foreigners among working poor is more than twice as high as
among other employees. The former are on average slightly younger. More than 27% of the
working poor have fixed-term contracts – compared to less than 12% of the other employees.
The gender distribution is fairly equal. From the household perspective it can be said that
working poor individuals live in households were, on average, slightly more than half of all
working-age household members are full-time employed while almost 20% of them are unem-
ployed – a figure that is more than three times higher than among the other employees.22
4. The country-level explanation of in-poverty
The aim of this section is to test the three hypotheses under study in order to judge the relative
explanatory power of the labour market, dual earner policies and benefits and transfers by us-
ing multi-level models. This will be done in four steps (Tab. 5): Firstly, a baseline model with-
out any explanatory variables is calculated (M0). Secondly the influence of the micro-level
variables is analysed (M1). M2 through M4 each test one of the three hypotheses. Finally, the
relative importance of each of these hypotheses will be examined by including all three of them
in one model (M5). The coefficients are displayed as odds ratios. A value greater than one in-
dicates a positive effect; a figure less than one a negative influence: The higher the value for
the explanatory variable, the lower the in-work poverty risk.
The empty model (M0) is the starting point for the analysis. It shows that the in-work poverty
risk differs a great deal by country (between-country variance = 0.37). This variance, however,
is mainly explained by the micro-level. The ICC of the null-model is 0.10 what tells us that
only 10% of the whole variance of in-work poverty across Europe is explained by the country-
level.23 At first sight, this seems to be a very low proportion. Yet, this figure is very much in
line with the findings in relevant literature (Lohmann 2010a). Nevertheless, the majority of the
factors that explain in-work poverty are part of the micro-level story. Accordingly, the micro-
model (M1) shows a high significance of all included variables; being male is the only insignif-
22 It is worth mentioning that this picture certainly differs between the welfare regimes. An overview of the dis-tinct working poor profiles of the country clusters is found in Lohmann and Andreß (Lohmann and Andreß 2008). 23 The ICC, the intra-cluster-correlation, measures the proportion of variance that is associated with the country-level (Hox 2010).

24
icant one.24 The results confirm the picture of the working poor described in section 3 and are
supported by contemporary evidence (Commission 2011b; Lohmann 2009): A high education-
al level does indeed markedly decrease the in-work poverty risk. It is the strongest risk-
lowering effect among all micro-level variables. The individual characteristics that increases
the in-work poverty risk the most is being a migrant, followed by a temporary-contract. The
effect age has on in-work poverty is u-shaped: Middle-aged persons face the highest in-work
poverty odds. Not surprisingly, being employed as an upper professional lowers the risk to be
in-work poor, while semi- and unskilled workers face higher risks. Turning to the household
related variables we can state the highly negative effect of full-time employed household
members. The higher their number the markedly lower the in-work poverty risk a household
has. As expected, higher shares of dependents and unemployed household members increase
the risk. The latter is the most powerful risk factor among all micro-level variables.
With regard to the country-level influences the first result to state is that the effects of individ-
ual characteristics and household related aspects are very robust. Their coefficients don’t
change when controlling for macro-level influences. This is certainly a further proof of the
great explanatory importance of individual and household related characteristics. Looking at
the effect of the labour market (M2) the results show that, as expected, both the percentage of
low skilled as well as the wage dispersion are positively correlated with in-work poverty. The
influence of the wage dispersion is more pronounced – a result that relates to the strong con-
nection between marked wage dispersion and high low-wage shares described above. Union
density does not have a significant effect.25
The second set of variables (M3) reveals that the availability of public childcare does not have
a significant influence on in-work poverty. This fits the picture described above that the coun-
tries with very low in-work poverty rates are those with an under-average public childcare
availability. The effect of female employment is as expected: The higher their rate the lower
the odds of in-work poverty.
24 Already Lohmann (Lohmann 2010b) proved that the gender dimension has no significant influence on the in-work poverty risk. 25 This does not necessarily have to lead to the conclusion that trade unions don’t have an effect on in-work pov-erty. As Lohmann (Lohmann 2008) pointed out, union density is a rather weak indicator for the strength of trade unions. Yet, the more appropriate variable, the level of wage coordination did not fit in the applied models.

25
Tab. 5 Country-level explanation of in-work poverty; odds ratios
Source: EU-SILC 2010, own calculations. Comments: ***p<0.001; the figures in parenthesis are z-scores, n.s. = non significant.
26 The pseudo R2 values are extremely low. Unfortunately there does not seem to be an explanation for this result. It was robust throughout all models and did not change significantly when testing different variables.
Independent variable M0 M1 M2 M3 M4 M5 Micro-level
Highest ISCED .64*** (-43.06)
.64*** (-43.06)
.64*** (-43.03)
.64*** (-43.07)
.64*** (-43.08)
Upper professional (EGP1) .43*** (-10.07)
.44*** (-9.82)
.43*** (-10.07)
.43*** (-10.07)
.44*** (-09.82)
Semi- unskilled worker (EGP3)
1.36*** (13.99)
1.36*** (13.99)
1.36*** (13.98)
1.36*** (13.99)
1.36*** (13.96)
Foreigner 2.21*** (25.36)
2.19*** (24.90)
2.21*** (25.37)
2.21*** (25.41)
2.20*** (24.99)
Temporary contract 1.71*** (20.79)
1.71*** (20.64)
1.71*** (20.78)
1.71*** (20.78)
1.71*** (20.60)
Age 3.59*** (20.72)
3.60*** (20.58)
3.59*** (20.70)
3.57*** (20.72)
3.60*** (20.57)
Age squared 1.0*** (-25.41)
1.0*** (-25.25)
1.0*** (-25.39)
1.0*** (-25.41)
1.0*** (-25.24)
% of full-time employed in household
.49*** (-58.47)
.49*** (-58.65)
.49*** (-58.46)
.49*** (-58.47)
.49*** (-58.61)
% of unemployed in house-hold
1.40*** (47.61)
1.40*** (47.24)
1.40*** (47.61)
1.40*** (47.61)
1.40*** (47.54)
% of dependents in house-hold
1.18*** (14.05)
1.18*** (14.20)
1.18*** (14.05)
1.18*** (14.05)
1.18*** (14.18)
Male n.s.
Macro-level Labour Market % of low educated working-age citizens
1.06** (2.72)
1.06** (2.71)
Wage dispersion 1.36*** (3.84)
1.36*** (5.11)
Union density N.S.
Dual Earner Policies
Public Childcare N.S.
Female employment rates .85* (-1.76)
.78** (-3.67)
Transfers and benefits
Replacement rates .80* (-2.51)
.87* (-2.19)
Social assistance (fam.+ 2 children) N.S. Family transfers N.S.
Intercept .05 (-24.50)
2.08 (4.57)
2.08 (4.97)
2.10 (4.76)
2.06 (4.73)
2.09 (5.44)
Coefficients
N 221618 218222 213997 218222 218222 213997
Pseudo-R2 (Mc-Fadden)26 .036 .031 .018 .028 .025 .008
ICC .100 .080 .051 .072 .066 .027
Between-country variance σ2 .365 .288 .178 .257 .231 .093
BIC 96577 79684 78486 79693 79690 78495

26
Testing the influences of transfers and benefits (M4) shows an interesting picture: Both the
expenditures for family transfers as well as social assistance are not significant. On the contra-
ry, replacement rates decrease the in-work poverty risk significantly. This result relates to two
aspects: Firstly, to the strong risk-increasing effect of high numbers of unemployed household
members; Secondly, to the fact that working poor often live in with many unemployed. What
we can conclude over and above this result is that unemployment replacement rates are a poli-
cy measure that successfully combats poverty among in-work individuals.
Including all significant macro-level variables in one model does not change much of the story
(M5). By and large the results described above are very robust. The negative effect of wage
dispersion and the positive influence of replacement rates are slightly higher in the full-model,
whereas the effect of female employment rates decreases a bit. In total, all significant country-
level variables reduce the between-country variance of in-work poverty by more than two third
(σ2mo=0.365 compared to σ2
m5=0.092). This reveals clearly that the country-level variables
have a sizable effect on reducing the unexplained variance. Accordingly, the ICC of the full-
model is very low with only 0.027, what is about one third of the ICC of the null-model. When
comparing the weight of each hypothesis we can state that the labour market setting has the
biggest influence on in-work poverty. Not only are there two labour market related variables
that are significant, both of them exhibit the strongest effects of all country-level variables un-
der study. Summed up, what do the results of the multi-level models tell us about the hypothe-
ses under study? By and large the three hypotheses are confirmed (Tab. 6).
Tab. 6 Observed influences of country-level context Hypothesis Indicators Expected impact Observed impact on
in-work poverty Labour mar-ket setting (h1)
Low-skilled employees + + Importance of trade unions + n.s. Wage dispersion + +
Dual earner policies (h2)
Public childcare availability - n.s. Female employment - -
Transfers and benefits (h3)
Family transfers - n.s. Unemployment replacement rates
- -
Social assistance - n.s. Source: Own research; n.s. = not significant
The hypothesis on the influence of labour market institutions (h1) is confirmed – with the limi-
tation however, that union density does not have a significant influence on the risk of belong-
ing to the working poor. The assumption that dual earner policies decrease the in-work poverty

27
risk is confirmed as well (h2) – yet, public childcare availability is not significant. The same
applies to the hypothesis on the effect of transfers and benefits. In general, the assumption in
confirmed. Two of the three indicators (family transfers and social assistance) do not have a
significant impact on the in-poverty odds.
To put all these results in a nutshell: The risk an in-work individual has to live in a poor house-
hold is increased by the shares of low-skilled in the labour force and the extent of wage disper-
sion; while higher female employment and more generous replacement rates lower the risk.
These findings relate to the picture the data in figures 2 to 5 describe and can be looked at us-
ing a welfare regime approach. The socio-democratic Nordic countries in general are character-
ised by a high degree of decommodification and defamilisation as well as low wage dispersion
and comparatively few low-skilled in the labour force. Right these elements contribute to the
low in-work poverty rates in these countries. On the other hand, the low levels of decommodi-
fication and defamilisation that are characteristic for the south European countries are the ex-
planatory mechanisms that underlie the high incidence of in-work poverty in these countries
(Lohmann and Marx 2008).
5. Summary and outlook
For a long period in post-war Europe being employed worked fairly well as a mechanism
which prevents poverty.27 That in the EU in 2010 almost 6 % of all full-time employed persons
lived in households with a disposable income below the poverty threshold, however, clearly
demonstrates that employment is no longer a sufficient guarantee for preventing poverty. This
landmark change has to be evaluated in the light of long-term structural changes within em-
ployment regimes, increasing labour market inequalities, growing global economic interde-
pendencies and shifting welfare state policies (Andreß and Lohmann 2008; OECD 2011). Es-
pecially a skill biased technological demand shift within the labour market and a activation turn
in labour market policies in combination with a gradual welfare state retrenchment are the main
driving factors for this development (Frazer et al. 2011b; Lohmann 2010a). Against these de-
velopments the present article aimed at analysing the relative explanatory power of individual
as well as household related characteristics and especially the impact of the institutional set-
ting. This was done by computing multi-level models using the EU-SILC 2010 data.
The results in the present article clearly demonstrate that micro-level aspects by far do explain
the largest share of the risk an employed person has to live in a poor household. Yet, it is not 27 As the research field is young, it might however be, that in-work poverty did exist in the post-war decades but just was not visible in science (Airio 2008). Yet, it was certainly not regarded as a political problem in these days.

28
possible to explain the whole story only through micro-level aspects. The prevalence of in-
work poverty varies markedly across Europe – and this variation is also due to varying institu-
tional country-level settings. A comprehensive explanatory approach therefore has to take such
macro-level characteristics into account.
There are several population groups who are rather prone to in-work poverty. There character-
istics can be related to three pathways leading into in-work poverty: First and foremost a low
wage which often can be explained by a low educational level, secondly an unfavourable
household composition, i.e. many dependents and few earners and as well as a low labour mar-
ket attachment. The third mechanism relates to household benefit levels that are not sufficient
to lift the household out of poverty. A further earner in a household vastly increases the likeli-
hood of a household income above the poverty threshold. These three mechanisms relate to
three core pillars of welfare provision: Employment, family and public welfare. Each of these
dimensions relates to the importance of specific country-level influences. The employment
dimension obviously relates to labour market institutions, the household constellation to family
policies and the public welfare to the benefit and transfer policies.
The multi-level analysis showed that especially the labour market context has a decisive influ-
ence on in-work poverty. The hypothesis was confirmed, showing that the main explanatory
factor is the share of low-skilled in the labour force. Dual earner policies also have a significant
impact. Noteworthy, this works through the female employment rate as an outcome of such
policies and not through the availability of public childcare. Regarding the influence of trans-
fers it was proven that only replacement rates have a significant, risk-decreasing impact on in-
work poverty, while the transfers targeted to families and social assistance proved to be insig-
nificant. When comparing the explanatory power of the micro- and the macro-level the conclu-
sion is: The influence of country-level aspects is small but highly significant. Put in a nutshell
we can state: Being poorly educated or living in a household with many unemployed deter-
mines the poverty risk a working household has far more than the institutional framework at
the country-level. Yet, the article confirms the evidence for institutional influences on the level
of in-work poverty already observed by Lohmann and Andreß (Lohmann and Andreß 2008).
Summarising all results we can conclude that employment still is the best protection against
poverty. To make sure that it stays this way, and therefore, in-turn, to reduce the extent of in-
work poverty, national and European policies have to foster not only the job quantity; the job
quality is at least just as important. Linking quantity and quality of work is vital to combat and
prevent in-work poverty.

29
6. Appendix
Tab. 7 Micro- and macro-level variables. Data sources and operationalisation28 Variable Operationalisation Data Source Dependent Poverty Equivalised, disposable monthly household income
<60% the nation median income EU-SILC (hy090)
In-work Self reported full-time employment as most fre-quent activity status for at least 6 months of the past year
EU-SILC (pl073)
Independent micro-level Occupation Ericson-Goldthorpe-Portocarero-Classes (1-3)
based on the ISCO88 data (ref. category: EGP2)29 EU-SILC (pl051)
Educational level Highest ISCED level attained (High = ISCED 5+6; medium = ISCED 3+4, low = ISECD 1+2
EU-SILC (pe040)
Type of contract Fixed-term and permanent contract (ref. category) EU-SILC (pl140) Gender Male and female (ref. category), control variable EU-SILC (rb090) Age Age of working poor person, control variable EU-SILC (rx020) Migration Status Working poor with a foreign nationality or born
abroad (ref. category: residents), control variable EU-SILC (pb210;
pb220a) Percentage full-time employed Ratio of full-time employed household members to
all household members aged 18 to 64 EU-SILC (pl140)
Percentage unemployed Ratio of unemployed household members to all household members aged 18 to 64
EU-SILC (pl073)
Percentage dependents Ratio of household members younger than 18 or older than 64 to all household members aged 18- 64
EU-SILC (rx020)
Level of household benefits Sum of family and housing allowance, individual unemployment, old age, survivor, sickness and disability benefits as well as individual education related allowances, net value
EU-SILC (py010g, py090g, py100g, py110g, py120g, py130g, py140g)
Independent macro-level Qualificational composition of labour force
% of ISCED 0-2 per working-age citizen Eurostat
Importance of trade unions Trade Union density, share of employees who are members of a trade union
(Visser et al. 2009)
Wage dispersion Individual gross earnings, D9/D1 ratio Eurostat Public childcare availability Average weekly hours of formal childcare (children
from the age of three up to the compulsory school age)
Eurostat
Female employment Female employment rates in % of all women aged 15 to 64
Eurostat
Family transfers Family and children benefits in % of GDP (2009) Eurostat Unemployment replacement rates
Net replacement rates for a married single-earner couple with 2 children, 67 % of the average wage in the initial phase of unemployment
OECD Database
Social assistance Minimum income protection for a family with 2 children
SaMip30
28 Unless otherwise stated all data refer to the year 2010. 29 The other classes are omitted in the models because it is not possible to identify the clear hierarchical structure that is required for the model. 30 “Social Assistance and Minimum Income Protection Interim Dataset” (Nelson 2007; 2011).

30
Tab. 8 Macro-level variables by country31 % of low skilled
in labour force Wage dispersion
(D9/D1-ratio) Union Den-sity (in %)
Average hours of public childcare
Female em-ployment (in %)
Replacement rate (in %)
Social Assistance (PPP-Euro)
Expenditure for family transfers (in %)
Austria (AT) 23.1 4.69 28.1 25.2 66.6 73 20.783.1 3.07 Belgium (BE) 25.9 2.80 52.0 30.7 57.5 77 52.393.1 2.23 Bulgaria (BG) 25.9 3.87 19.0 38.8 56.4 80 399.0 1.99 Czech Republic (CZ) 14.4 3.33 17.3 28.2 56.8 74 13.746.0 1.4 Germany (DE) 21.4 5.53 18.6 27.7 66.7 72 3.751.2 3.17 Denmark (DK) 31.8 3.06 68.8 33.8 69.8 87 23.323.7 4.20 Estonia (EE) 18.4 4.72 6.7 39.6 61.0 57 4.302.0 2.26 Spain (ES) 48.4 3.66 15.9 29.6 52.5 75 111.701.4 1.51 Finland (FI) 23.6 3.64 70.0 29.5 66.4 68 12.072.3 3.31 France (FR) 31.8 4.15 7.6 29.4 59.2 67 7.083.1 2.65 Hungary (HU) 24.3 4.26 16.8 35.6 50.8 81 87.123.0 3.03 Italy (IT) 46.2 3.37 35.1 33.0 46.5 74 1 1.40 Lithuania (LT) 16.9 7.81 9.5 37.8 59.1 63 1.509.0 2.83 Luxembourg (LU) 28.9 4.34 37.3 27.3 57.2 88 105.440.4 4.04 Latvia (LV) 19.6 5.64 14.8 37.8 58.8 72 231.3 1.73 Malta (MT) 69.6 3.41 51.0 26.8 40.0 67 326.4 1.26 Netherlands (NL) 31.9 4.02 19.0 19.9 69.7 80 3.561.9 1.30 Norway (NO) 25.7 4.62 54.4 33.6 73.0 74 2.230.9 3.25 Poland (PL) 17.8 4.54 15.0 34.4 53.1 60 1.064.0 0.75 Portugal (PT) 67.1 3.41 19.3 38.3 60.7 77 129.599.6 1.49 Romania (RO) 30.3 3.21 32.8 24.7 51.0 63 399.0 1.70 Sweden (SE) 25.3 4.04 68.4 33.2 70.3 72 18.131.2 3.22 Slovenia (SK) 20.9 3.78 17.2 34.9 62.0 80 215.077.0 2.11 Slovakia (SI) 16.3 3.27 29.7 35.3 52.9 80 12.510.0 1.68 United Kingdom (UK) 24.1 4.21 27.5 19.2 64.4 54 1.272.2 1.82 Mean/ EU-average32 29.2 4.14 30.1 31.4 59.3 72.6 4.1625.8 2.3
Source: EU-SILC 2010, own calculations. Comments: 1Italy has no nation-wide minimum income scheme. The data the SaMip-database provides refer to a locally run scheme. They are not representative for the whole country and are therefore treated as missing.
31 The precise definition of the variables is described in Tab. 7 in the appendix. 32 EU-27 except Cyprus, Greece and Ireland plus Norway.

31
7. References
Airio, I. (2008): Change of Norm? In-Work Poverty in a Comparative Perspective. Helsinki: Vammala. Alderson, A. S. and Nielsen, F. (2002): Globalization and the Great U-Turn: Income Inequality Trends in 16 OECD Countries. In: American Journal of Sociology 107(5): 1244-1299. Andreß, H.-J. and Lohmann, H. (2008): Introduction: The Working Poor in Europe. In: Andreß, H.-J./Lohmann, H. (Ed.): The Working Poor in Europe. Employment, Poverty and Globalization. Bodmin, Cornwall: Edward Elgar Publishing. Asplund, R. and Persson, I. (2000): Low Pay - A Special Affliction of Women. In: Gregory, M. et al. (Ed.): Labour Market Inequalities: Problems and Policies of Low-Wage Employment in International Perspective. Oxford: Oxford University Press. Barbier, J.-C. (2005): The European Employment Strategy. A Channel for Activating Social Protection. In: Zeitlin, J. et al. (Ed.): The Open Method of Coordination in Action. The European Employment and Social Inclusion Strategy. Brussels: Lang. Bardone, L. and Guio, A.-C. (2005): In-Work-Poverty. In: Statistics in Focus - Population and Social Conditions Luxembourg. Blau, F. D. and Kahn, L. M. (1996): International Differences in Male Wage Inequality: Institutions versus Market Forces. In: Journal of Political Economy 96(104): 791-837. Bonoli, G. (2010): The Political Economy of Active Labour-Market Policy. In: Politics & Society 38(4): 435-457. Brady, D. et al. (2010): More than just Nickels and Dimes. A Cross-National Analysis of Working Poverty in Affluent Democracies In: Luxembourg Income Study Working Paper Series 545. Cantillon, B. (2011): The Paradox of the Social Investment State. Growth, Employment and Poverty in the Lisbon Strategy. In: CSB Working Paper 11(03). Cantillon, B. et al. (2012): Household Work Intensity and the Adequacy of Social Protection in the EU. In: CSB Working Paper 12(04). Commission, E. (Ed.) (2011a): Employment and Social Developments in Europe 2011. Luxembourg: European Union. Commission, E. (2011b): Is Working enough to avoid Poverty? In-work Poverty Mechanisms and Policies in the EU. In: Commission, E. (Ed.): Employment and Social Developments in Europe 2011. Luxembourg: European Union. Cooke, G. and Lawton, K. (2008): Working out of Poverty: A Study of the Low Paid and the Working Poor. London: Insitute for Public Policy Research. Crettaz, E. (2011): Fighting Working Poverty in Postindustrial Societies. Causes, Trade-offs and Policy Solutions. Cheltenham: Edward Elgar. Crettaz, E. and Bonoli, G. (2011a): Worlds of Working Poverty. National variations in Mechanisms. . In: Frazer, N. et al. (Ed.): Working Poverty in Europe. A Comparative Approach. Basingstoke: Palgrave Macmillan. Crettaz, E. and Bonoli, G. (2011b): Worlds of Working Poverty: National Variations in Mechanisms. In: Frazer, N. et al. (Ed.): Working Poverty in Europe. A Comparative Approach. Basingstoke: Palgrave Macmillan. Esping-Andersen, G. (1990): The Three Worlds of Welfare Capitalism. Cambridge: Polity Press. Esping-Andersen, G. (1999): The Social Foundations of Postindustrial Economies. Oxford: Oxford University Press.

32
Eurostat (Ed.) (2010a): Description of Target Variables: Cross-Sectional and Longitudinal. 2010 Operation (Version February 2010). Luxembourg: Eurostat. Eurostat (2010b): In-Work Poverty in the EU. Luxemburg: European Commission. Ferrera, M. (1996): The "Southern" Model of Welfare in Social Europe In: Journal of European Social Policy 6(1): 17-37. Frazer, H. et al. (Ed.) (2010): In-Work Poverty and Labour Market Segmentation in the EU: Key Lessons. Synthesis Report. Frazer, N. et al. (Ed.) (2011a): Working Poverty in Europe. A Comparative Approach. Basingstoke: Palgrave Macmillan. Frazer, N. et al. (2011b): Introduction. In: Frazer, N. et al. (Ed.): Working Poverty in Europe. A Comparative Approach. Basingstoke: Palgrave Macmillan. Frick, J. R. and Krell, K. (2010): Measuring Income in Household Panel Surveys: A Comparison of EU-SILC and SOEP. In: SOEP Papers on Multidisciplinary Panel Data Research(263): 1-42. Giesecke, J. and Verwiebe, R. (2009): Wachsende Lohnungleichheit in Deutschland. Qualifikations- und klassenspezifische Determinanten der Entlohnung zwischen 1998 und 2006. In: Berliner Journal für Soziologie 19531-555. Goerne, A. (2011): A Comparative Analysis of In-Work Poverty in the European Union. In: Frazer, N. et al. (Ed.): Working Poverty in Europe. A Comparative Approach. Basingstoke: Palgrave Macmillan. Grimshaw, D. (2011): What do we know about Low-Wage Work and Low-Wage Workers? Analysing the Definitions, Patterns, Causes and Consequences in International Perspective. Geneva: ILO. Guo, G. and Zhao, H. (2010): Multilevel Modeling for Binary Data. In: Annual Review of Sociology 26441-462. Hox, J. J. (2010): Multilevel Analysis. Techniques and Aplications: Hove. Kangas, O. and Ritakallio, V.-M. (2004): Relative to What? Cross-national Picture of European Poverty measured by Regional, National and European Standards. In: Luxemburg Income Study Working Paper Series 3841-32. Larsson, D. and Halleröd, B. (2011): Sweden: The Impact of Policy and Labour Market Transformation. In: Frazer, N. et al. (Ed.): Working Poverty in Europe. A Comparative Approach. Basingstoke: Palgrave Macmillan. Lohmann, H. (2008): The Working Poor in European Welfare States: Empiricial Evidence from a Multilevel Perspective. In: Andreß, H.-J./Lohmann, H. (Ed.): The Working Poor in Europe. Employment, Poverty and Globalization. Bodmin, Cornwall: Edward Elgar Publishing. Lohmann, H. (2009): Welfare States, Labour Market Institutions and the Working Poor: A Comparative Analysis of 20 European Countries. In: European Sociological Review 25(4): 489-504. Lohmann, H. (2010a): Armut von Erwerbstätigen im europäischen Vergleich. Erwerbseinkommen und Umverteilung. In: Kölner Zeitschrift für Soziologie und Sozialpsychologie 621-30. Lohmann, H. (2010b): Comparability of EU-SILC Survey and Register Data: The Relationship among Employment, Earnings and Poverty. In: Journal of European Social Policy 21(1): 1-18. Lohmann, H. and Andreß, H.-J. (2008): Explaining In-Work Poverty Within and Across Countries. In: Andreß, H.-J./Lohmann, H. (Ed.): The Working Poor in Europe. Employment, Poverty and Globalization. Bodmin, Cornwall: Edward Elgar Publishing Lohmann, H. and Marx, I. (2008): The Different Faces of In-Work Poverty across European Welfare State Regimes. In: Andreß, H.-J./Lohmann, H. (Ed.): The Working Poor in

33
Europe. Employment, Poverty and Globalization. Bodmin, Cornwall: Edward Elgar Publishing. Lucifora, C. (2000): Wage Inequalities and Low Pay: The Rule of Labour Market Institutions. In: Gregory, M. et al. (Ed.): Labour Market Inequalities: Problems and Policies of Low-Wage Employment in International Perspective. Oxford: Oxford University Press. Nelson, K. (2007): Introducing SaMip: The Social Assistance and Minimum Income Protection Interim Dataset. In: Scandinavian Working Papers in Economics 11. Nelson, K. (2011): Social Assistance and EU Poverty Thresholds 1990–2008. Are European Welfare Systems Providing Just and Fair Protection Against Low Income? In: European Sociological Review 5(1): 1-16. Nolan, B. and Marx, I. (2000): Low Pay and Household Poverty. In: Gregory, M. et al. (Ed.): Labour Market Inequalities: Problems and Policies of Low-Wage Employment in International Perspective. Oxford: Oxford University Press. Nolan, B. et al. (2010): Low Pay, In-Work Poverty and Economic Vulnerability: A Comparative Analysis Using EU-SILC. In: Geary Insitute Working Paper 28. Nollmann, G. (2009): Working Poor. Eine vergleichende Längsschnittstudie für Deutschland und die USA. . In: Kölner Zeitschrift für Soziologie und Sozialpsychologie 61(1): 33-55. Observatory, E. I. R. (Ed.) (2002): Low Wage Workers and the Working Poor. OECD (Ed.) (2011): Divided we stand. Why Inequality keeps rising. Paris: OECD. Peña-Casas, R. and Latta, M. (2004): Working Poor in the European Union. Luxembourg: European Foundation for the Improvement of Living and Working Conditions. Ponthieux, S. (2010): Assessing and Analysing In-Work Poverty Risks. In: Atkinson, T. B./Eric, M. (Ed.): Income and Living Conditions in Europe. Luxemburg: EU. Rabe-Hesketh, S. and Skrondal, A. (2008): Multilevel and Longitudinal Modeling Using Stata. College Station: Stata Press. Rowntree, B. S. (1918): The Human Need of Labour. London: Thomas Nelson. Strengmann-Kuhn, W. (2003): Armut trotz Erwerbstätigkeit. Analysen und sozialpolitische Konsequenzen. Frankfurt am Main: Campus. Titmuss, R. M. (1958): Essays on the Welfare State. London: Allen and Unwin. van Berkel, R. and Moller, I. H. (2002): Active Social Policies in the EU. Inclusion through Participation? Bristol: Policy Press. Visser, J. et al. (2009): Trade Union Members and Union Density in OECD Countries. Paris: OECD. Wolff, P. et al. (2010): Investigating in Statistics: EU-SILC. In: Atkinson, T. B./Eric, M. (Ed.): Income and Living Conditions in Europe. Luxemburg: EU.