inactivation (disinfection) processes...inactivation (disinfection) processes this chapter covers...
TRANSCRIPT

© 2004 World Health Organization. Water Treatment and Pathogen Control: Process Efficiency in Achieving
Safe Drinking Water. Edited by Mark W LeChevallier and Kwok-Keung Au. ISBN: 1 84339 069 8.
Published by IWA Publishing, London, UK.
3
Inactivation (disinfection) processes
This chapter covers the various disinfection processes used in drinking-water treatment to inactivate pathogenic microbes. It looks first at factors affecting the efficiency of disinfection process, and then goes on to consider the following disinfection processes:
• pretreatment oxidation — in which oxidants are added to water early in the treatment process.
• primary disinfection — a common component of primary treatment of drinking-water, and important because granular filter media do not remove all microbial pathogens from water
• secondary disinfection — used to maintain the water quality achieved at the treatment plant throughout the distribution system up to the tap.
3.1 FACTORS AFFECTING DISINFECTION
The principal factors that influence disinfection efficiency are disinfectant concentration, contact time, temperature and pH. Disinfectant concentration and

42 Water treatment and pathogen control
contact time are integral to disinfection kinetics and the practical application of the CT concept (CT being the disinfectant concentration multiplied by the contact time). Development and derivations of this disinfection model are discussed in the modelling section below. Temperature, over the range appropriate for drinking-water, affects the rate of disinfection reactions according to the Arrhenius equation, although this may not hold for certain disinfectants at low temperatures. The pH of the disinfectant solution affects the reaction kinetics. For example, the disinfection efficiency of free chlorine is increased at lower pH values, whereas that of chlorine dioxide is greater at alkaline pH levels. Monochloramine is formed within seconds in the pH range 7–9, at chlorine to ammonia nitrogen ratios of less than 5:1 and at 25°C; it is also the predominant species when the pH is greater than 5.
Other factors that influence microbial sensitivity to disinfection include attachment to surfaces, encapsulation, aggregation and low-nutrient growth. Increased resistance to disinfection may result from attachment or association of microorganisms to various particulate surfaces, including:
• macroinvertebrates (Crustacea, Nematoda, Platyhelminthes and Insecta)(Tracy, Camarena & Wing, 1966; Levy, Cheetham & Hart, 1984);
• particles that cause turbidity (LeChevallier, Evans & Seidler, 1981; Ridgway & Olson, 1982);
• algae (Silverman, Nagy & Olson, 1983); • carbon fines (LeChevallier et al., 1984; Camper et al., 1986); • glass (Olivieri et al., 1985).
Ridgway & Olson (1982) showed that the majority of viable bacteria in chlorinated water were attached to particles. Stewart & Olson (1986) reported that aggregation of Acinetobacter strain EB22 increased its resistance to disinfection, making the bacteria 100-fold more resistant to hypochlorous acid (HOCl) and 2.3-fold more resistant to monochloramine. Several investigators have isolated encapsulated bacteria from chlorinated water (Reilly & Kippin, 1983; Clark, 1984) and concluded that production of the extracellular capsule helped protect bacteria from chlorine. Carson et al. (1972) reported that Pseudomonas aeruginosa grown in distilled water was markedly more resistant to acetic acid, glutaraldehyde, chlorine dioxide and a quaternary ammonium compound than cells cultured on tryptic soy agar. Similarly, Berg, Matin & Roberts (1981) and Harakeh et al. (1985) found that bacteria grown in a chemostat at low temperatures and submaximal growth rates caused by nutrient limitation (conditions thought to be similar to the natural aquatic environment) were resistant to several disinfectants.
Inactivation (disinfection) processes 43
3.2 PRETREATMENT OXIDATION
Water utilities often add oxidants early in the treatment process to: • maximize the contact time with the oxidant; • oxidize compounds for subsequent removal by the treatment process
(e.g. iron or manganese); • provide initial treatment in sufficient time for water to be further treated
if necessary (e.g. oxidation of taste and odour compounds); • control growth of microorganisms and higher organisms (e.g. zebra
mussels) on intake structures and in treatment basins; • improve particle removal in subsequent clarification and filtration
processes.
There are a number of potential problems with pretreatment oxidation. Variable source water conditions mean that variable or high levels of oxidant may be needed. This may lead to overdosing of pre-oxidants, which can result in “pink coloured” water when potassium permanganate is misapplied. Also, the process can produce oxidation by-products such as trihalomethanes (THMs), haloacetic acids and bromate. For example, in using chlorine as a pretreatment oxidant, chlorinated by-products can form rapidly. This often limits the application of chlorine to a later stage of the treatment process, when precursor material has been removed. A further problem is that oxidants can lyse algal cells, releasing liver or nerve toxins, or creating objectionable tastes or odours. (Yoo et al., 1995b; Chorus & Bartram, 1999).
One concern with using pre-oxidants for disinfection is that particulate material may interfere with microbial inactivation. Such material protects bacteria and viruses from disinfectants by creating an instantaneous disinfectant demand (preventing the maintenance of a disinfectant residual in subsequent treatment steps) and by shielding the microbe from the oxidant (Hoff, 1978; LeChevallier, Evans & Seidler, 1981; Berman, Rice & Hoff, 1988).
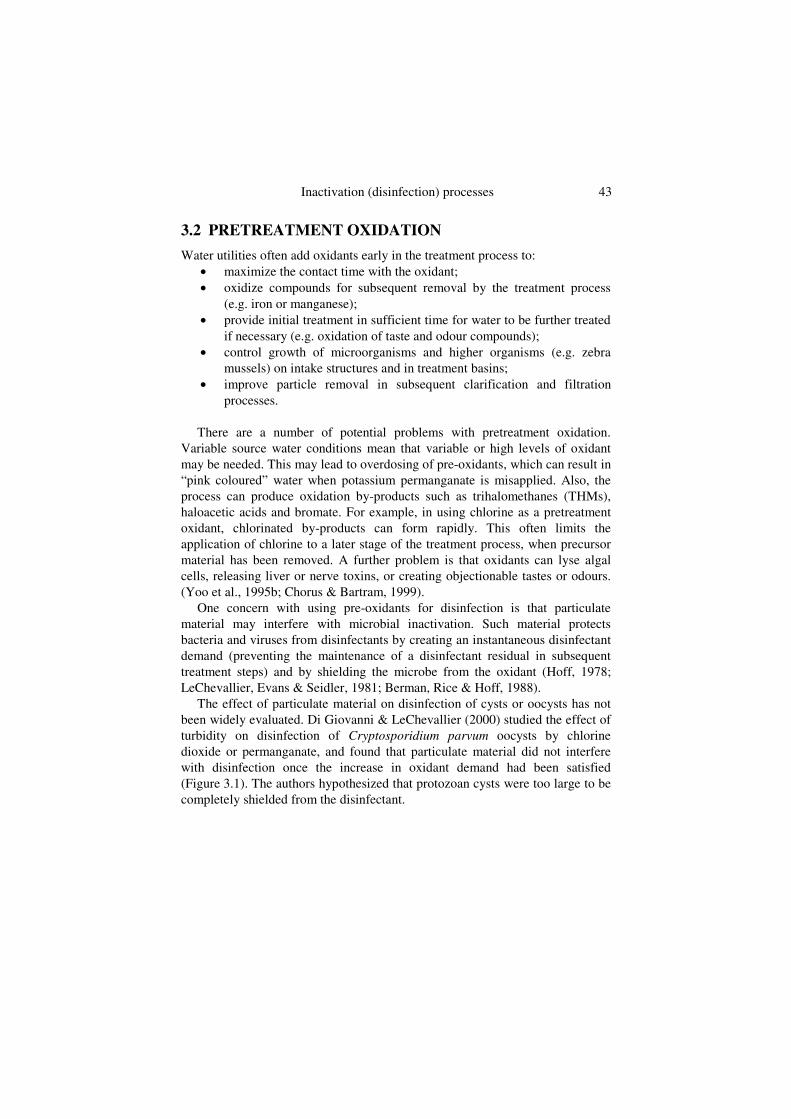
The effect of particulate material on disinfection of cysts or oocysts has not been widely evaluated. Di Giovanni & LeChevallier (2000) studied the effect of turbidity on disinfection of Cryptosporidium parvum oocysts by chlorine dioxide or permanganate, and found that particulate material did not interfere with disinfection once the increase in oxidant demand had been satisfied (Figure 3.1). The authors hypothesized that protozoan cysts were too large to be completely shielded from the disinfectant.
44 Water treatment and pathogen control
Figure 3.1 Effect of particulate material on disinfection of Cryptosporidium. Potassium permanganate applied at 2400 mg/min l–1, chlorine dioxide applied at 120 mg/min l–1.Source: Adapted from Di Giovanni & LeChevallier (2000).
3.3 PRIMARY DISINFECTION
A disinfection barrier is a common component of primary treatment of water. Primary disinfection is typically a chemical oxidation process, although ultraviolet (UV) irradiation and membrane treatment are gaining increased attention. This section looks at different types of disinfectant — chlorine, monochlorine, chlorine dioxide, ozone, UV light and mixed oxidants — in terms of their effectiveness against various pathogenic microorganisms. Further information on selecting a disinfection strategy for a piped distribution system can be found in the WHO publication Safe piped water: Managing microbial water quality in piped distribution systems (Ainsworth, 2004).
3.3.1 Chlorine
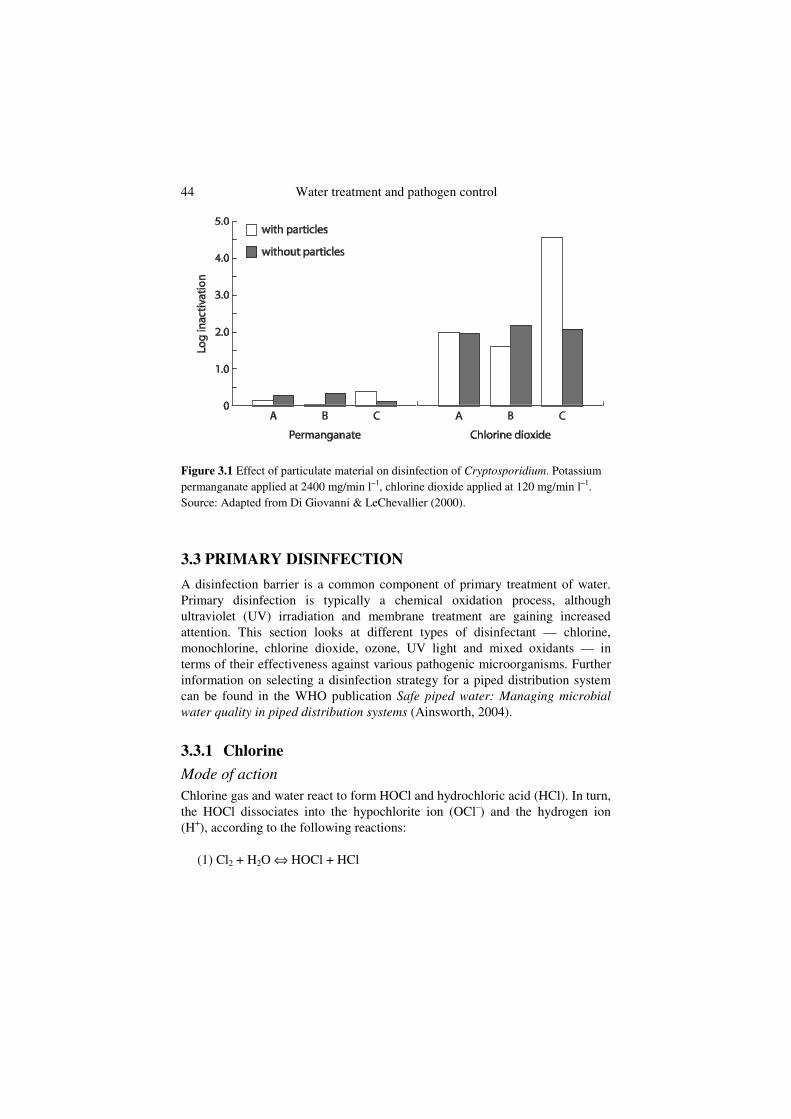
Mode of action Chlorine gas and water react to form HOCl and hydrochloric acid (HCl). In turn, the HOCl dissociates into the hypochlorite ion (OCl–) and the hydrogen ion (H+), according to the following reactions:
(1) Cl2 + H2O ⇔ HOCl + HCl
Inactivation (disinfection) processes 45
(2) HOCl ⇔ H+ + OCl–
The reactions are reversible and pH dependent: • between pH 3.5 and 5.5, HOCl is the predominant species • between about pH 5.5 and 9.5, both HOCl and OCl– species exist in
various proportions • above pH 8, OCl– predominates.
The OCl– and HOCl species are commonly referred to as free chlorine, which is extremely reactive with numerous components of the bacterial cell. HOCl can produce oxidation, hydrolysis and deamination reactions with a variety of chemical substrates, and produces physiological lesions that may affect several cellular processes. Baker (1926) theorized that chlorine destroys microorganisms by combining with proteins to form N-chloro compounds. Chlorine was later found to have powerful effects on sulfhydryl groups of proteins (Green & Stumpf, 1946, Knox et al., 1948; Venkobachar, Iyengar & Rao, 1977) and to convert several -amino acids by oxidation into a mixture of corresponding nitriles and aldehydes (Patton et al., 1972). The exact product of the reaction depends on chlorine concentration and pH (Dakin 1916, 1917; Wright 1936).
Cytochromes, iron-sulfur proteins and nucleotides are highly vulnerable to oxidative degradation by HOCl, suggesting that chlorine causes physiological damage primarily to the bacterial cell membranes (Venkobachar, Iyengar & Rao, 1977; Camper & McFeters, 1979; Haas & Engelbrecht, 1980; Albrich, McCarthy & Hurst, 1981). Respiration, glucose transport and adenosine triphosphate levels all decrease in chlorine-treated bacteria (Venkobachar, Iyengar & Rao, 1977; Camper & McFeters, 1979; Haas & Engelbrecht, 1980). Electron microscopy of chlorinated bacteria has demonstrated morphological changes in the cell membrane (Zaske, Dockins & McFeters, 1980). In addition, chlorination can kill microbes by disrupting metabolism (Wyss, 1961) and protein synthesis (Pereira et al., 1973), or by modifying purine and pyrimidine bases and thus causing genetic defects (Patton et al., 1972; Hoyano et al., 1973; Haas & Engelbrecht, 1980).
Nearly 100 years of chlorination for disinfection of drinking-water has demonstrated the effectiveness of this process for inactivation of microbial pathogens, with the notable exception of Cryptosporidium.
Effectiveness of chlorine against bacteria and viruses Table 3.1 shows CT values for 99% (2-log) inactivation of bacteria for various chlorine-based disinfectants. In general, the heterotrophic bacteria grown in

46 Water treatment and pathogen control
drinking-water were more resistant to disinfection than the laboratory-grown Escherichia coli.
Table 3.1 Comparative efficiency of disinfectants for the production of 99% bacterial inactivation in oxidant demand-free systems
Escherichia coli Heterotrophic bacteria
Disinfectant pH Temp (°C)
CT mg/min l–1 pH
Temp (°C)
CT mg/min l–1
Hypochlorous acid 6.0 5 0.04 7.0 1–2 0.08 ± 0.02 Hypochlorite ion 10.0 5 0.92 8.5 1–2 3.3 ± 1.0 Chlorine dioxide 6.5 20 0.18 7.0 1–2 0.13 ± 0.02 6.5 15 0.38 8.5 1–2 0.19 ± 0.06 7.0 25 0.28 Monochloramine 9.0 15 64 7.0 1–2 94.0 ± 7.0 8.5 1–2 278 ± 46.0
Source: Adapted from LeChevallier, Cawthon & Lee (1988)
Certain bacteria show a high level of resistance to free chlorine. Spore-forming bacteria such as Bacillus or Clostridium are highly resistant when disseminated as spores. Acid-fast and partially acid-fast bacteria such as Mycobacterium and Nocardia can also be highly resistant to chlorine disinfection. One study showed that nearly all of the bacteria surviving chlorine disinfection were Gram positive or acid fast (Norton & LeChevallier, 2000), possibly because Gram-positive bacteria have thicker walls than Gram-negative ones.
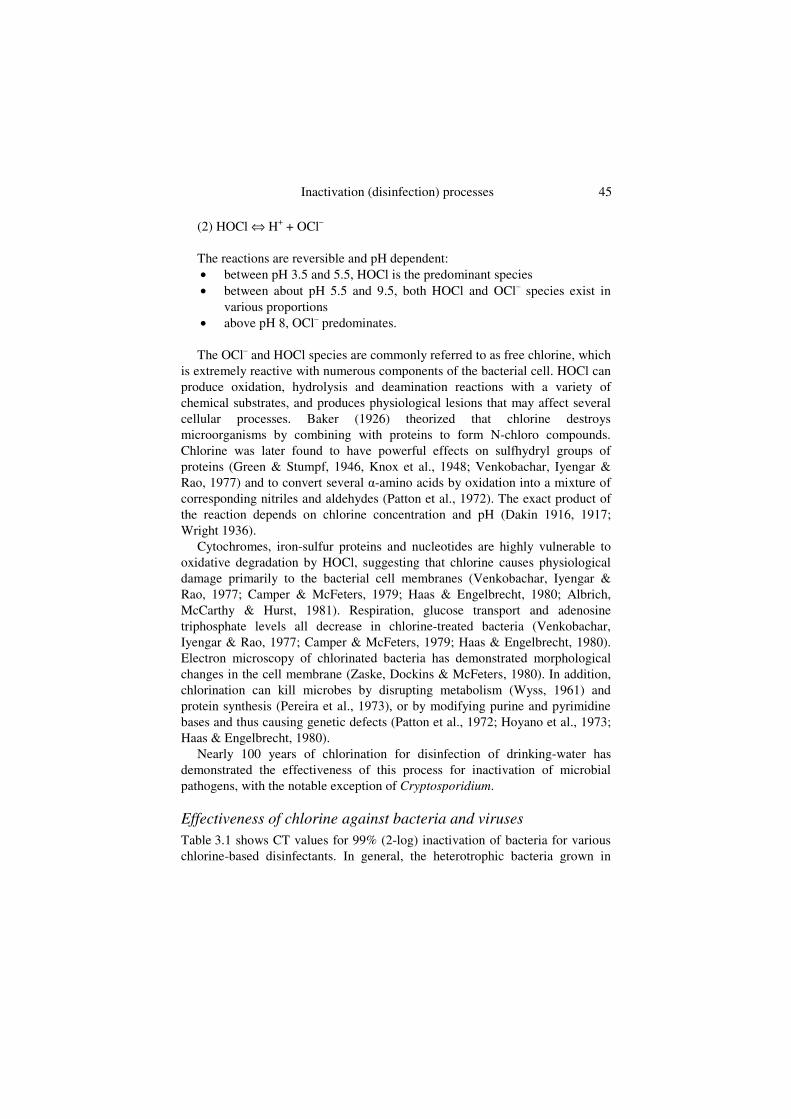
Enteric viruses are generally more resistant to free chlorine than enteric bacteria, with CT values for 99% inactivation ranging from about 2 to more than 30 mg/min l–1 (Figure 3.2). Viruses associated with cellular debris or organic particles may require high levels of disinfection due to the protective nature of the particle surface (Akin & Hoff, 1986; Hoff, 1992). Chlorination effectively inactivates viruses if the turbidity of the water is less than or equal to 1.0 nephelometric turbidity unit (NTU). It requires a free chlorine residual of 1.0 or greater for 30 minutes, and a pH of less than 8.0. For groundwaters where turbidities are generally low, or for filtered surface water, White (1999) suggests the CT guidelines for the 99% virus inactivation shown in Table 3.2. These data are based on conservative interpretation of inactivation data for Coxsackie A2.
Inactivation (disinfection) processes 47
Figure 3.2 Disinfection (2-log) of microorganisms by free available chlorine (White, 1999).
Table 3.2. Disinfection time–chlorine concentration envelopes for 99% virus inactivation at 0–5°C and 10°C
CT in mg/min l–1
pH range 0–5°C 10°C
7.0–7.5 12 8 7.5–8.0 20 15 8.0–8.5 30 20 8.5–9.0 35 22
Adapted from White (1999)
Effectiveness of chlorine against protozoa Protozoan cysts such as Entamoeba histolytica and Giardia lamblia are highly resistant to chlorine disinfection and may require prolonged contact times at high chlorine residuals (2–3 mg/l) to achieve 99.9% (3-log) inactivation. Clark, Read & Hoff (1989) have described a mathematical model for Giardiainactivation that is based on the infectivity data:
48 Water treatment and pathogen control
CT = 0.9847 C 0.1758 pH 2.7519 temp –0.1467
where:
C = the disinfectant residual concentration temp = the reaction temperature in degrees Celcius
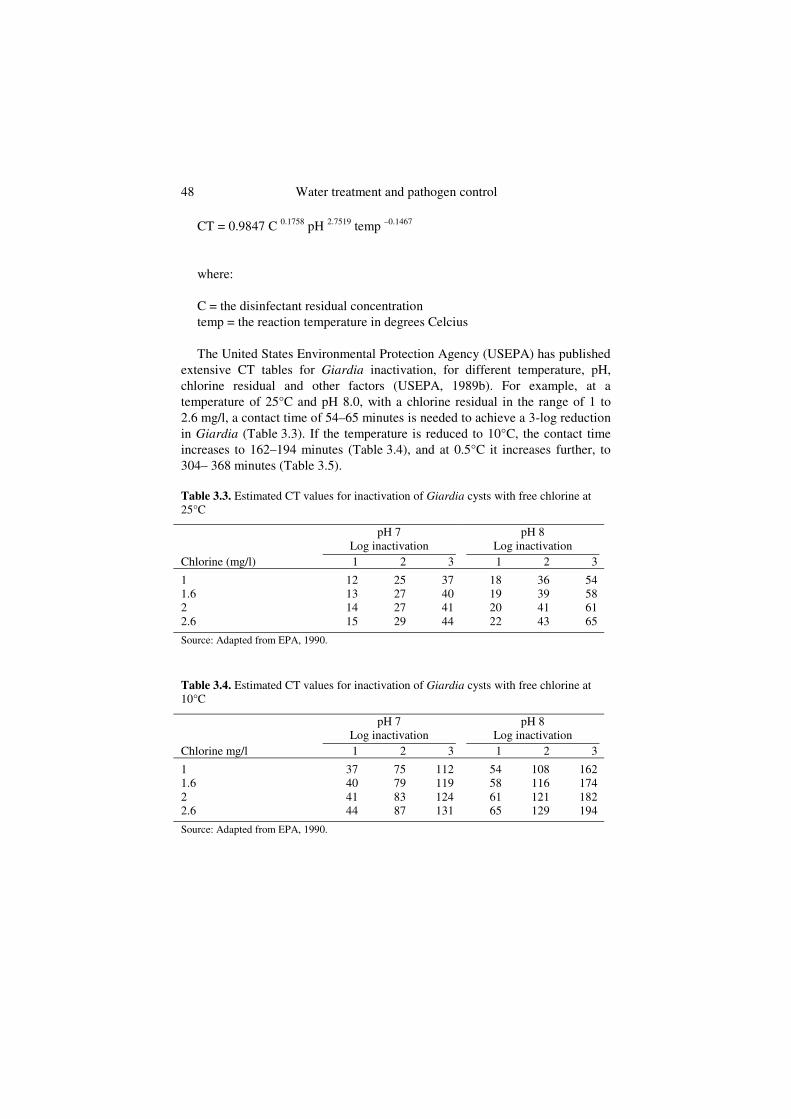
The United States Environmental Protection Agency (USEPA) has published extensive CT tables for Giardia inactivation, for different temperature, pH, chlorine residual and other factors (USEPA, 1989b). For example, at a temperature of 25°C and pH 8.0, with a chlorine residual in the range of 1 to 2.6 mg/l, a contact time of 54–65 minutes is needed to achieve a 3-log reduction in Giardia (Table 3.3). If the temperature is reduced to 10°C, the contact time increases to 162–194 minutes (Table 3.4), and at 0.5°C it increases further, to 304– 368 minutes (Table 3.5).
Table 3.3. Estimated CT values for inactivation of Giardia cysts with free chlorine at 25°C
pH 7 pH 8 Log inactivation Log inactivation Chlorine (mg/l) 1 2 3 1 2 3
1 12 25 37 18 36 54 1.6 13 27 40 19 39 58 2 14 27 41 20 41 61 2.6 15 29 44 22 43 65
Source: Adapted from EPA, 1990.
Table 3.4. Estimated CT values for inactivation of Giardia cysts with free chlorine at 10°C
pH 7 pH 8 Log inactivation Log inactivation Chlorine mg/l 1 2 3 1 2 3
1 37 75 112 54 108 162 1.6 40 79 119 58 116 174 2 41 83 124 61 121 182 2.6 44 87 131 65 129 194
Source: Adapted from EPA, 1990.

Inactivation (disinfection) processes 49
Table 3.5. Estimated CT values for inactivation of Giardia cysts with free chlorine at 0.5°C
pH 7 pH 8 Log inactivation Log inactivation Chlorine mg/l 1 2 3 1 2 3
1 70 140 210 101 203 304 1.6 75 151 226 110 219 329 2 79 157 236 115 231 346 2.6 84 168 252 123 245 368
Source: Adapted from EPA, 1990.
E. histolytica cysts were inactivated at pH 7.0 in 10 minutes at 25°C with a residual of 3.5 mg/l (Chang, 1982). At pH 4, 30°C and 10 minutes of exposure, 2 mg/l of free chlorine produced a 99.9% reduction of cysts; however, if the pH was increased to 10, a chlorine concentration of 12 mg/l was needed to achieve the same 3-log reduction. Data on other emerging protozoan pathogens are lacking, although a recent report indicated that the microsporidian Encephalitozoon syn. Septata intestinalis was inactivated by more than 3 logs when exposed to 2 mg/l chlorine for 16 min at pH 7 and 25°C (Wolk et al. 2000).
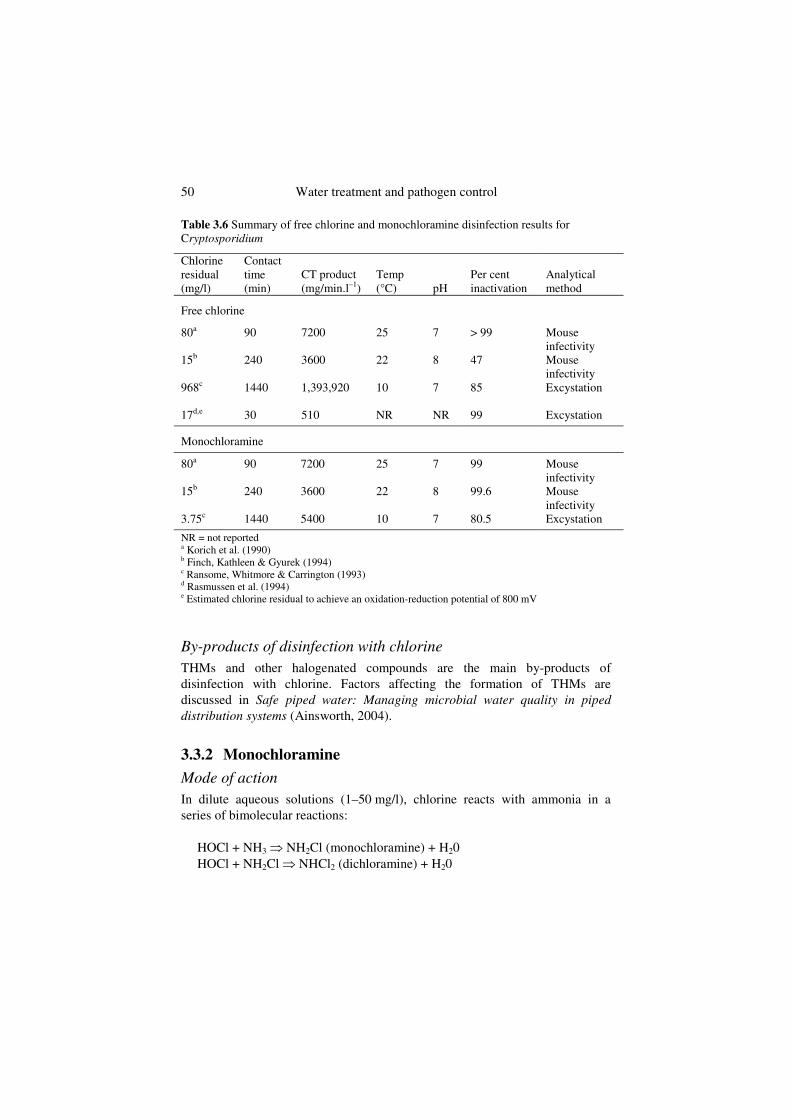
Chlorine-based disinfectants are generally not effective at inactivation of Cryptosporidium (Table 3.6) and early studies found that Cryptosporidiumoocysts were resistant to a variety of hospital disinfectants, including bleach (Campbell et al., 1982). Chlorine disinfection has not been effective in preventing outbreaks of cryptosporidiosis caused by Cryptosporidium in drinking-water and recreational water. Korich et al. (1990) reported that 80 mg/l of free chlorine or monochloramine required 90 minutes to achieve 90% inactivation of oocysts, and suggested that conventional disinfection practices would do little to inactivate waterborne Cryptosporidium. However, Rasmussen et al. (1994) examined the disinfection effectiveness of several biocides and found that inactivation of oocysts required an oxidation/reduction potential of about 800 mV, maintained for 30 minutes (Table 3.6). These authors suggest that oxidation/reduction potential is more important than CT for oocyst inactivation.
50 Water treatment and pathogen control
Table 3.6 Summary of free chlorine and monochloramine disinfection results for Cryptosporidium
Chlorine residual (mg/l)
Contact time (min)
CT product (mg/min.l–1)
Temp (°C) pH
Per cent inactivation
Analytical method
Free chlorine
80a 90 7200 25 7 > 99 Mouse infectivity
15b 240 3600 22 8 47 Mouse infectivity
968c 1440 1,393,920 10 7 85 Excystation
17d,e 30 510 NR NR 99 Excystation
Monochloramine
80a 90 7200 25 7 99 Mouse infectivity
15b 240 3600 22 8 99.6 Mouse infectivity
3.75c 1440 5400 10 7 80.5 Excystation
NR = not reported a Korich et al. (1990) b Finch, Kathleen & Gyurek (1994) c Ransome, Whitmore & Carrington (1993) d Rasmussen et al. (1994) e Estimated chlorine residual to achieve an oxidation-reduction potential of 800 mV
By-products of disinfection with chlorine THMs and other halogenated compounds are the main by-products of disinfection with chlorine. Factors affecting the formation of THMs are discussed in Safe piped water: Managing microbial water quality in piped distribution systems (Ainsworth, 2004).
3.3.2 Monochloramine
Mode of action In dilute aqueous solutions (1–50 mg/l), chlorine reacts with ammonia in a series of bimolecular reactions:
HOCl + NH3 NH2Cl (monochloramine) + H20HOCl + NH2Cl NHCl2 (dichloramine) + H20

Inactivation (disinfection) processes 51
HOCl + NHCl2 NCl3 (trichloramine) + H20
These competing reactions are dependent upon pH and the relative chlorine to nitrogen concentration (expressed as Cl2:N). To a lesser degree they are also dependent upon temperature and contact time. The reaction of HOCl and ammonia will convert all the free chlorine to monochloramine at pH 7–8 when the Cl2:N ratio is equimolar (5:1 by weight) or less.
Ingols (1958) examined the reaction of monochloramine with several amino acids and tripeptides. Exposure of alanine, tyrosine and glycylgylcylgylcine to the disinfectant for several hours at 25oC and pH 8.0 converted these compounds to organic chloramines. The sulfhydryl groups of cystine were oxidized to disulfides (by comparison, exposure of the same compounds to HOCl produced a variety of oxidized, hydrolysed or deaminated reactants). Reaction of monochloramine with hemin (an important component of enzymes such as cytochromes, catalases and peroxidases) resulted in products that could not be reactivated by reducing compounds. The author concluded that monochloramine may kill bacterial cells by reacting primarily with membrane-bound enzymes.
Jacangelo & Olivieri (1985) examined the reaction of monochloramine with amino acids, nucleic acids, nucleotides, nucleosides, purine and pyrimidine bases, and ribose sugars. Monochloramine was most reactive with sulfur-containing amino acids and tryptophan. When the sulfhydryl groups of cysteine were in excess, 1 mol of monochloramine reacted with 2 mol of cysteine to form 1 mol of the cystine disulfide. When monochloramine was in excess, the reaction proceeded beyond the disulfide state.
Watters et al. (1989) extended the observations of Jacangelo & Olivieri (1985) by examining whole cells. They found that Enterobacter cloacae could be reactivated after exposure to chloramine by addition of sodium sulfite, and hypothesized that sodium sulfite could reduce oxidized disulfides, or result in other types of oxidative injury. Interestingly, sodium sulfite had no effect on organisms exposed to free chlorine. The results suggest that free chlorine and chloramine react with different functional groups in the cell membrane.
Jacangelo & Olivieri (1985) found that monochloramine reacted more slowly with nucleic acids and free purine and pyrimidine bases than with amino acids. These results support the observation that many viruses are inactivated more slowly than bacterial cells. Berman & Hoff (1984) showed that simian rotavirus SA11 required more than 6 hours contact with 10 mg/l preformed monochloramine at pH 8.0 to achieve 99% inactivation. Shih & Lederberg (1976) found that exposure of Bacillus subtilis deoxyribonucleic acid (DNA) to monochloramine induced single and double stranded breaks, reduced the

52 Water treatment and pathogen control
transforming activity of DNA and enhanced the sensitivity of DNA to endonuclease cleavage.
Effectiveness of monochloramine Monochloramine is not recommended as a primary disinfectant because of its weak disinfecting power (Table 3.1). This disinfectant is not effective for inactivation of Cryptosporidium (Table 3.6). In systems using monochloramine, free chlorine is usually applied for a short time before addition of ammonia, or an alternative primary disinfectant is used (e.g. ozone, chlorine dioxide).
By-products of disinfection with monochloramine Treatment to produce a monochloramine residual poses the risk of nitrite formation in the distribution system, especially in low-flow stagnant areas, because bacteria on surfaces and in deposits may nitrify any slight excess of ammonia.
3.3.3 Chlorine dioxide Chlorine dioxide is a strong oxidant that can be used to control iron, manganese and taste and odour causing compounds. It has also been used as a secondary disinfectant in many European countries.
Mode of action Chlorine dioxide is highly soluble in water (particularly at low temperatures), and is effective over a range of pH values (pH 5–10). Theoretically, chlorine dioxide undergoes five valence changes in oxidation to chloride ion:
ClO2 + 5e– = Cl– + 2O2–
However, in practice, chlorine dioxide is rarely reduced completely to chloride ion (White 1999). Chlorine dioxide is thought to inactivate microorganisms through direct oxidation of tyrosine, methionyl, or cysteine-containing proteins, which interferes with important structural regions of metabolic enzymes or membrane proteins (Gates 1998). In water treatment, chlorine dioxide has the advantage of being a strong disinfectant, but not forming THMs or oxidizing bromide to bromate.

Inactivation (disinfection) processes 53
Effectiveness of chlorine dioxide against bacteria and viruses Chlorine dioxide is roughly comparable to free chlorine for inactivation of bacteria and viruses at neutral pH (White, 1999), but is more effective than free chlorine at pH 8.5 (Hoff & Geldreich, 1981).
Effectiveness of chlorine dioxide against protozoa Chlorine dioxide is an effective disinfectant for control of Giardia lamblia; the required CT values for 1-log inactivation (pH 6–9) range from 5 mg min/l at 20oC to 21 mg/min l–1 at 0.5oC (USEPA, 1989b; White, 1999). The 3-log inactivation CT values (pH 6–9) range from 19 mg/min l–1 at 15oC to 63 mg/min l–1 at 0.5oC. These values are 3–14 times less than those required for free chlorine, but approximately 20 times more than those required for ozone.
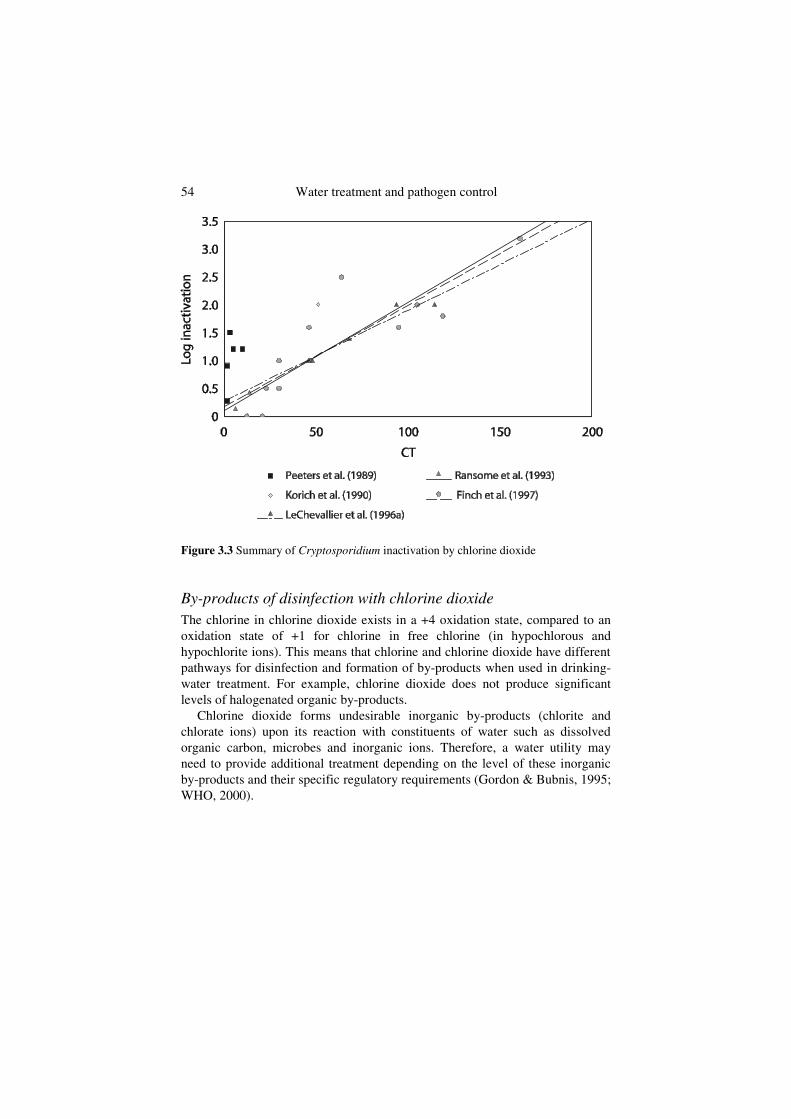
Figure 3.3 summarizes results from various studies of Cryptosporidiuminactivation by chlorine dioxide. Peeters et al. (1989) reported 1.5 and 1.2-log inactivation of Cryptosporidium, using an animal infectivity method, for CT values of 3 and 9.8 mg/min l–1, respectively (average of initial and final concentrations). Korich et al. (1990) reported a CT value of 78 mg/min l–1, with an initial concentration of 1.3 mg/l and a contact time of 60 minutes, for a 90% (1-log) inactivation of Cryptosporidium, based on mouse infectivity. The CT for 1-log inactivation was calculated to be 51 mg/min l–1 (average of initial and final concentrations). Finch, Liyanage & Belosevic (1995) recalculated the Korich data using a dose–response model developed for CD-1 mice, and estimated a 99% (or 2-log) inactivation. Ransome, Whitmore & Carrington (1993), employing the excystation viability method, reported Cryptosporidiuminactivation ranging from 0.14 to 1.4-log for average CT values ranging from 6.5 to 67.5 mg/min l–1, respectively. Based on results from 12 animal infectivity experiments, Finch et al. (1997) reported Cryptosporidium inactivation ranging from 0 to greater than 3.2-log for average CT values ranging from 12.5 to 212 mg/min l–1. Chlorine dioxide concentration decreased markedly at contact times of more than 30 minutes, a factor that could result in low CT values. LeChevallier et al. (1996) found that oocysts were more rapidly inactivated by chlorine dioxide at pH 8.0 than at pH 6.0, and that effectiveness was reduced by 40% when temperature was reduced from 20oC to 10oC. This finding is supported by other studies (Bernard et al., 1965; Owens et al., 1999; Ruffle, Rennecker & Marinas, 1998). Chlorine dioxide inactivation rates using a cell culture technique to determine infective oocysts were similar to rates generated using animal infectivity tests.
54 Water treatment and pathogen control
Figure 3.3 Summary of Cryptosporidium inactivation by chlorine dioxide
By-products of disinfection with chlorine dioxide The chlorine in chlorine dioxide exists in a +4 oxidation state, compared to an oxidation state of +1 for chlorine in free chlorine (in hypochlorous and hypochlorite ions). This means that chlorine and chlorine dioxide have different pathways for disinfection and formation of by-products when used in drinking-water treatment. For example, chlorine dioxide does not produce significant levels of halogenated organic by-products.
Chlorine dioxide forms undesirable inorganic by-products (chlorite and chlorate ions) upon its reaction with constituents of water such as dissolved organic carbon, microbes and inorganic ions. Therefore, a water utility may need to provide additional treatment depending on the level of these inorganic by-products and their specific regulatory requirements (Gordon & Bubnis, 1995; WHO, 2000).

Inactivation (disinfection) processes 55
3.3.4 Ozone Ozone has been used for more than a century for water treatment, mostly in Europe, although its use is now spreading to other countries.
Mode of action The mechanism by which ozone inactivates microbes is not well understood. Ozone in aqueous solution may react with microbes either by direct reaction with molecular ozone or by indirect reaction with the radical species formed when ozone decomposes. Ozone is known to attack unsaturated bonds, forming aldehydes, ketones or carbonyl compounds (Langlais, Reckhow & Brink, 1991). Additionally, ozone can participate in electrophilic reactions, particularly with aromatic compounds, and in nucleophilic reactions with many of the components of the microbial cell. Carbohydrates and fatty acids react only slightly with ozone, but amino acids, proteins, protein functional groups (e.g. disulfide bonds) and nucleic acids all react very quickly with it (Langlais, Reckhow & Brink, 1991). It is likely, therefore, that microbes become inactivated through ozone acting on the cytoplasmic membrane (due to the large number of functional proteins), the protein structure of a virus capsid, or nucleic acids of microorganisms.
Free radicals formed by the decomposition of ozone are generally less effective for microbial inactivation than molecular ozone, because microbial cells contain a high concentration of bicarbonate ions that quench the free radical reaction, and many microbial cells also contain catalase, peroxidase, or superoxide dismutase to control the free radicals produced by aerobic respiration. In addition, some bacteria contain carotenoid and flavonoid pigments that protect them from ozone. These factors can account for reports that heterotrophic bacteria may be less susceptible to ozone inactivation than Giardia (Wolfe et al., 1989). Studies of peroxone (a mixture of ozone and hydrogen peroxide that promotes the generation of hydroxyl free radicals) showed that peroxone was comparable to ozone, or slightly more potent, when CTs were based on ozone residuals (Wolfe et al., 1989). These results suggest that free radicals provide little benefit in terms of microbial destruction.
Effectiveness of ozone against bacteria and viruses Of the vegetative bacteria, Escherichia coli is one of the most sensitive (Table 3.7), while Gram-positive cocci (Staphylococcus and Streptococcus),Gram-positive bacilli (Bacillus) and mycobacteria are the most resistant (Langlais, Reckhow & Brink, 1991). Mycobacterium avium can be effectively controlled by low doses of ozone (CT99.9 of 0.1–0.2 mg/min l–1), whereas the

56 Water treatment and pathogen control
organism is highly resistant to free chlorine (CT99.9 of 551–1552 mg/min l–1 for water-grown isolates) (Taylor et al., 2000).
Table 3.7 CT values (mg/min l–1) for 99% inactivation at 5°C
Microorganism Free chlorine (pH 6–7)
Preformed chloramines (pH 8– 9)
Chlorine dioxide (pH 6–7)
Ozone (pH 6–7)
E. coli 0.034–0.05 95–180 0.4–0.75 0.02 Poliovirus 1 1.1–2.5 770–3740 0.2–6.7 0.1–0.2 Rotavirus 0.01–0.05 3810–6480 0.2–2.1 0.006–0.06 Phage f2 0.08–0.18 – – – G. lamblia cysts 47–>150 – – 0.5–0.6 G. muris cysts 30–630 1400 7.2–18.5 1.8–2.0
Adapted from Hoff (1986)
Viruses are generally more resistant to ozone than vegetative bacteria, although phage appear to be more sensitive than human viruses (Langlais, Reckhow & Brink, 1991).
Effectiveness of ozone against protozoa For the protozoa Giardia lamblia and Naegleria gruberi, ozone inactivation (Table 3.7) did not follow linear kinetics, due to an initial latent phase. However, CT products could be reasonably estimated with a CT99 (a CT for 99% inactivation) of 0.53 and 4.23 mg/min l–1, respectively, at 5°C (Wickramamayake, Rubin & Sproul, 1984).
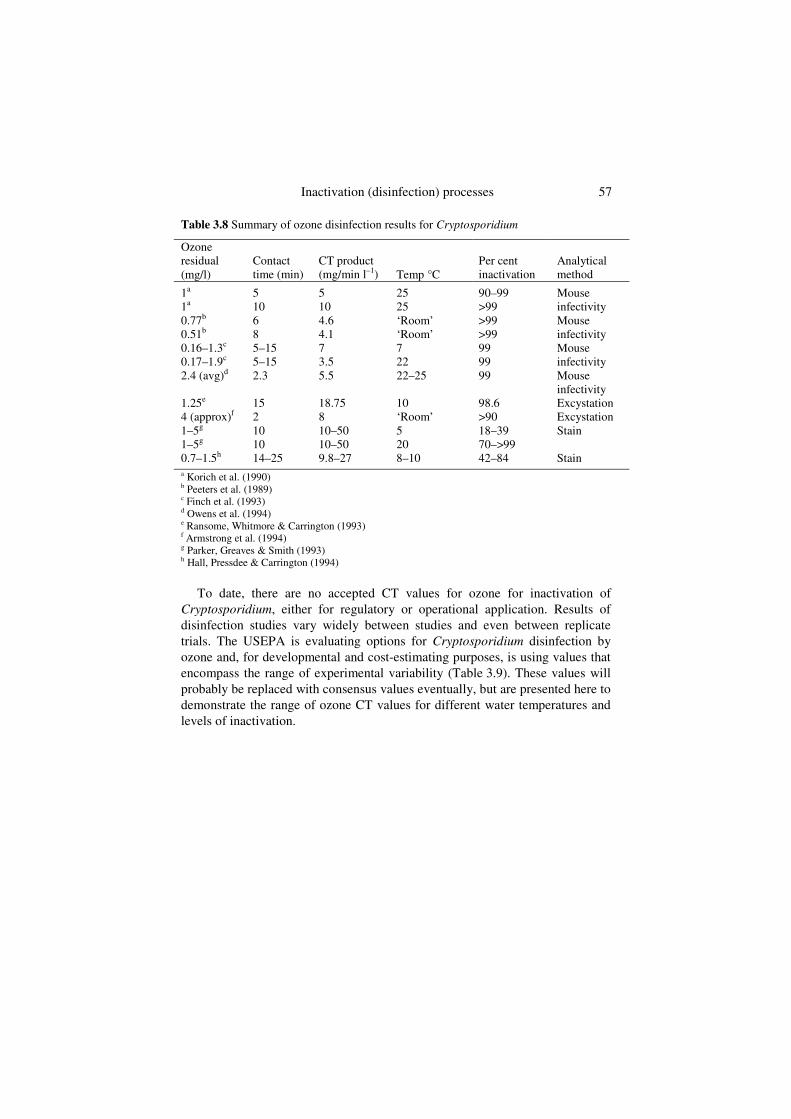
Ozone is effective for removal of Cryptosporidium (Table 3.8). Noticeable for Cryptosporidium is the impact of the analytical method on the CT values. Generally, excystation and vital staining are more conservative measures of oocyst inactivation than animal infectivity. Reliance on excystation and vital staining alone could greatly overestimate disinfection requirements for Cryptosporidium. On average, 4.5 mg/min l–1 CT was required for 99% oocyst inactivation (measured by mouse infectivity) by ozone at 20–25oC (Table 3.8). However, Finch et al. (1993) indicated that the conventional method of determining CT by using the final concentration of reactants at the end of the contact time overestimates the CT needed for disinfection and unduly increases treatment costs. The authors recommended the Holm disinfection model, which integrates the disinfectant concentration and time throughout the reactor. Using this alternative calculation, CT for Cryptosporidium inactivation were 6.9 mg/min l–1 at 7oC and 2.4 mg/min l–1 at 22oC.
Inactivation (disinfection) processes 57
Table 3.8 Summary of ozone disinfection results for Cryptosporidium
Ozone residual (mg/l)
Contact time (min)
CT product (mg/min l–1) Temp °C
Per cent inactivation
Analytical method
1a
1a510
510
2525
90–99 >99
Mouse infectivity
0.77b
0.51b68
4.64.1
‘Room’ ‘Room’
>99 >99
Mouse infectivity
0.16–1.3c
0.17–1.9c5–15 5–15
73.5
722
9999
Mouse infectivity
2.4 (avg)d 2.3 5.5 22–25 99 Mouse infectivity
1.25e 15 18.75 10 98.6 Excystation 4 (approx)f 2 8 ‘Room’ >90 Excystation 1–5g
1–5g1010
10–50 10–50
520
18–39 70–>99
Stain
0.7–1.5h 14–25 9.8–27 8–10 42–84 Stain a Korich et al. (1990) b Peeters et al. (1989) c Finch et al. (1993) d Owens et al. (1994) e Ransome, Whitmore & Carrington (1993) f Armstrong et al. (1994) g Parker, Greaves & Smith (1993) h Hall, Pressdee & Carrington (1994)
To date, there are no accepted CT values for ozone for inactivation of Cryptosporidium, either for regulatory or operational application. Results of disinfection studies vary widely between studies and even between replicate trials. The USEPA is evaluating options for Cryptosporidium disinfection by ozone and, for developmental and cost-estimating purposes, is using values that encompass the range of experimental variability (Table 3.9). These values will probably be replaced with consensus values eventually, but are presented here to demonstrate the range of ozone CT values for different water temperatures and levels of inactivation.
58 Water treatment and pathogen control
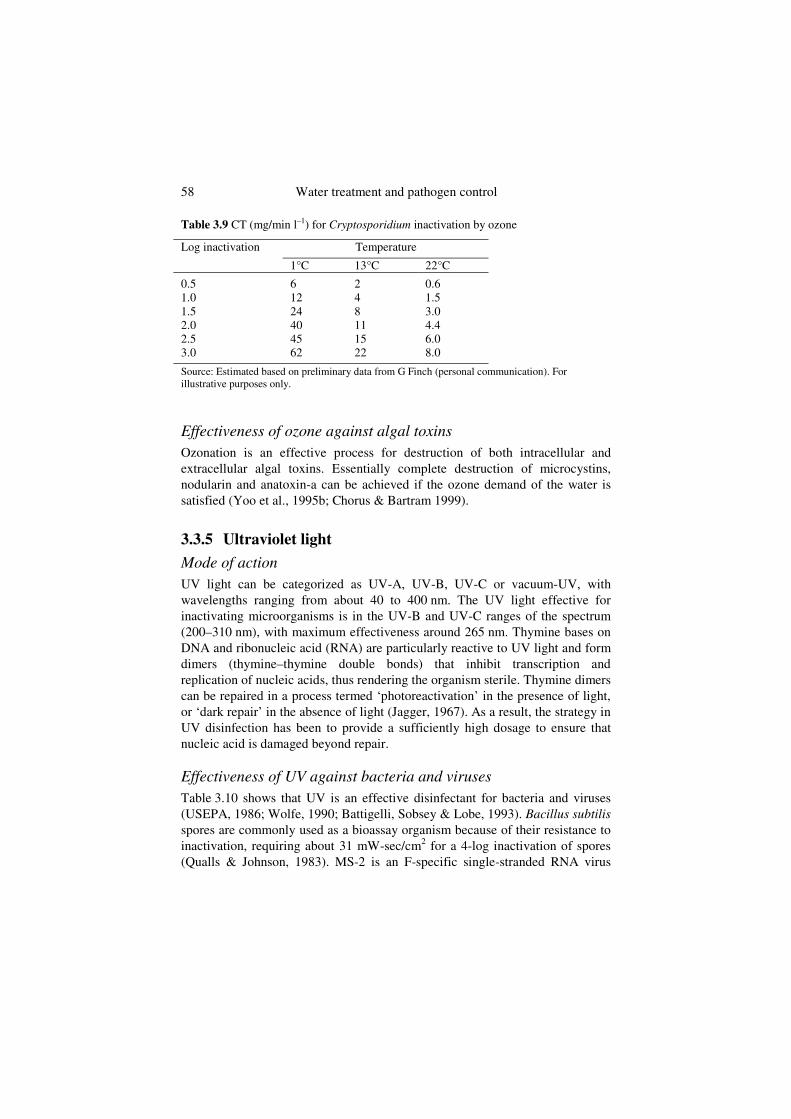
Table 3.9 CT (mg/min l–1) for Cryptosporidium inactivation by ozone
Temperature Log inactivation
1°C 13°C 22°C
0.5 6 2 0.6 1.0 12 4 1.5 1.5 24 8 3.0 2.0 40 11 4.4 2.5 45 15 6.0 3.0 62 22 8.0
Source: Estimated based on preliminary data from G Finch (personal communication). For illustrative purposes only.
Effectiveness of ozone against algal toxins Ozonation is an effective process for destruction of both intracellular and extracellular algal toxins. Essentially complete destruction of microcystins, nodularin and anatoxin-a can be achieved if the ozone demand of the water is satisfied (Yoo et al., 1995b; Chorus & Bartram 1999).
3.3.5 Ultraviolet light
Mode of action UV light can be categorized as UV-A, UV-B, UV-C or vacuum-UV, with wavelengths ranging from about 40 to 400 nm. The UV light effective for inactivating microorganisms is in the UV-B and UV-C ranges of the spectrum (200–310 nm), with maximum effectiveness around 265 nm. Thymine bases on DNA and ribonucleic acid (RNA) are particularly reactive to UV light and form dimers (thymine–thymine double bonds) that inhibit transcription and replication of nucleic acids, thus rendering the organism sterile. Thymine dimers can be repaired in a process termed ‘photoreactivation’ in the presence of light, or ‘dark repair’ in the absence of light (Jagger, 1967). As a result, the strategy in UV disinfection has been to provide a sufficiently high dosage to ensure that nucleic acid is damaged beyond repair.
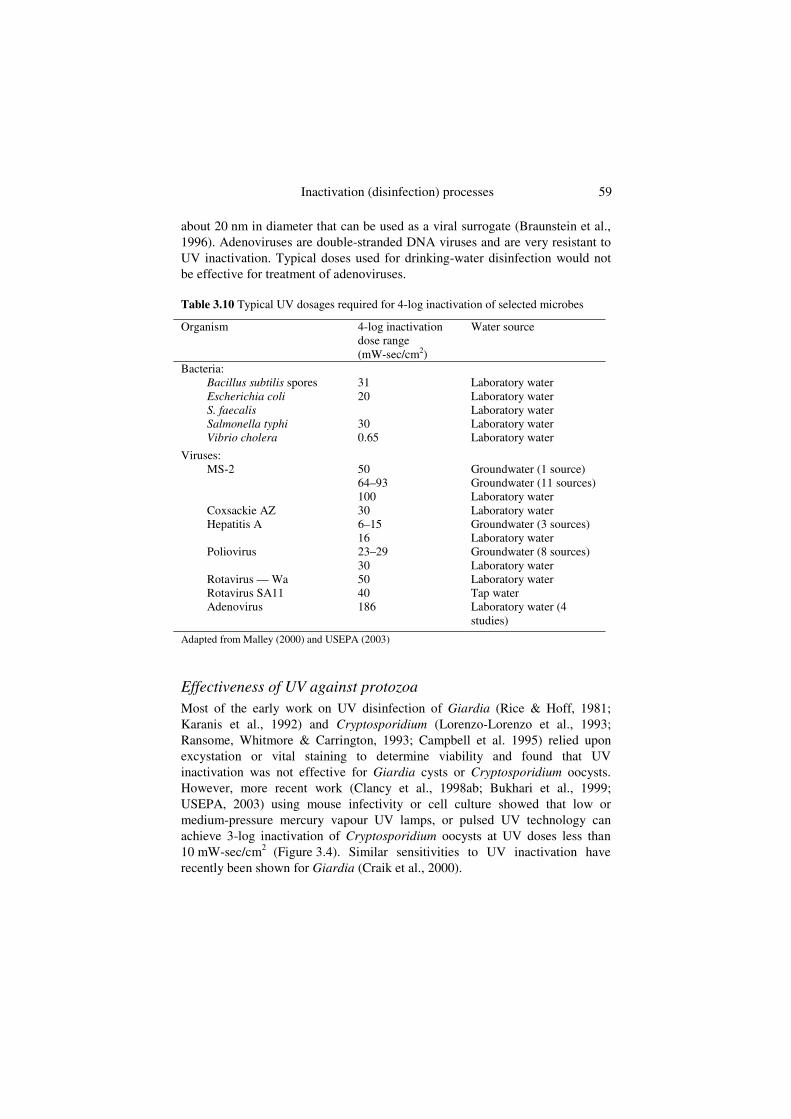
Effectiveness of UV against bacteria and viruses Table 3.10 shows that UV is an effective disinfectant for bacteria and viruses (USEPA, 1986; Wolfe, 1990; Battigelli, Sobsey & Lobe, 1993). Bacillus subtilisspores are commonly used as a bioassay organism because of their resistance to inactivation, requiring about 31 mW-sec/cm2 for a 4-log inactivation of spores (Qualls & Johnson, 1983). MS-2 is an F-specific single-stranded RNA virus
Inactivation (disinfection) processes 59
about 20 nm in diameter that can be used as a viral surrogate (Braunstein et al., 1996). Adenoviruses are double-stranded DNA viruses and are very resistant to UV inactivation. Typical doses used for drinking-water disinfection would not be effective for treatment of adenoviruses.
Table 3.10 Typical UV dosages required for 4-log inactivation of selected microbes
Organism 4-log inactivation dose range (mW-sec/cm2)
Water source
Bacteria: Bacillus subtilis spores 31 Laboratory water
Escherichia coli 20 Laboratory water S. faecalis Laboratory water Salmonella typhi 30 Laboratory water Vibrio cholera 0.65 Laboratory water
Viruses: MS-2 50
64–93 100
Groundwater (1 source) Groundwater (11 sources) Laboratory water
Coxsackie AZ 30 Laboratory water Hepatitis A 6–15
16Groundwater (3 sources) Laboratory water
Poliovirus 23–29 30
Groundwater (8 sources) Laboratory water
Rotavirus — Wa 50 Laboratory water Rotavirus SA11 40 Tap water Adenovirus 186 Laboratory water (4
studies)
Adapted from Malley (2000) and USEPA (2003)
Effectiveness of UV against protozoa Most of the early work on UV disinfection of Giardia (Rice & Hoff, 1981; Karanis et al., 1992) and Cryptosporidium (Lorenzo-Lorenzo et al., 1993; Ransome, Whitmore & Carrington, 1993; Campbell et al. 1995) relied upon excystation or vital staining to determine viability and found that UV inactivation was not effective for Giardia cysts or Cryptosporidium oocysts. However, more recent work (Clancy et al., 1998ab; Bukhari et al., 1999; USEPA, 2003) using mouse infectivity or cell culture showed that low or medium-pressure mercury vapour UV lamps, or pulsed UV technology can achieve 3-log inactivation of Cryptosporidium oocysts at UV doses less than 10 mW-sec/cm2 (Figure 3.4). Similar sensitivities to UV inactivation have recently been shown for Giardia (Craik et al., 2000).

60 Water treatment and pathogen control
Figure 3.4 Summary of UV inactivation data for Cryptosporidium (a) Scatter of individual study results. (b) Probability plot for achieving a 3-log inactivation. Source: USEPA (2003).
Inactivation (disinfection) processes 61
Guidelines and standards relating to the use of UV Recently, guidelines have been developed to evaluate the effects of reactor design, selection of UV lamps, performance standards for lamp ageing and fouling, and the accuracy of UV sensors (DVGW, 1997; ÖNORM, 2001; USEPA, 2003). Standards for the installation and operation of UV systems are important because the effectiveness of UV disinfection can be impaired by the transmittance of the water, colour and the presence of particulate material.
3.3.6 Mixed oxidants The use of mixtures of oxidants for microbial inactivation has gained attention as a way to maximize the efficiency of current disinfectants. The chemistry of mixed oxidant production is complex, resulting in a solution of free chlorine, chlorine dioxide, ozone and various oxidation states of chlorine. The oxidants can be produced from a sodium chloride brine in an electrolytically generated cell. Venczel et al. (1997) examined the inactivation of Cryptosporidium oocysts and Clostridium perfringens spores in oxidant demand-free water at pH 7 and 25°C using a disinfectant dose of 5 mg/l and contact times up to 24 hours. Free chlorine produced no measurable inactivation of Cryptosporidium parvumoocysts after exposure for 4–24 hours, although Clostridium perfringens spores were reduced by 1.4 logs after 4 hours. In contrast, a mixed oxidant solution resulted in more than 3-log inactivation of both oocysts and spores with 4 hours exposure. Other researchers, however, have found the mixed oxidant process equivalent to free chlorine for inactivation of biofilm samples (Crayton, Camper & Warwood, 1997). Additional research is needed to better understand the chemistry of seemingly incompatible oxidants within the mixed oxidant reaction.
Sequential disinfection Other approaches to combining the advantages of various oxidants have used sequential disinfection. Finch, Kathleen & Gyurek (1994) reported that the sequential combination of free chlorination followed by monochloramination produced superior oocyst inactivation compared to the sum of both disinfectants examined separately. The combination of free chlorine (1 mg/l for 60 min) and chloramines (2 mg/l for 240 min) are typical values that might be found in conventional treatment plants. Similar synergies have been seen for ozone and chloramines, free chlorine and chlorine dioxide, and chlorine dioxide followed by free chlorine or chloramines (Liyanage, Finch & Belosevic, 1997; Corona-Vasquez, Rennecker & Marinas, 1999; Li, Finch & Belosevic, 1999). Sequential disinfection has been proposed, to lessen or eliminate the inactivation lag phase
62 Water treatment and pathogen control
(Corona-Vasquez, Rennecker & Marinas, 1999). Combinations of disinfectants require further investigation, and may provide important insights into inactivation mechanisms and disinfection theory.
3.4 SECONDARY DISINFECTION
This section looks at the use of secondary disinfection to maintain water quality in distribution systems. The publication Safe piped water: Managing microbial water quality in piped distribution systems (Ainsworth, 2004) provides more detail on this topic.
3.4.1 Maintenance of water quality in the distribution system The purpose of a secondary disinfectant is to maintain the water quality achieved at the treatment plant throughout the distribution system up to the tap. Secondary disinfection provides a final partial barrier against microbial contamination and serves to control bacterial growth. The practice of residual disinfection has become controversial, with some opponents arguing that if biological stability is achieved and the system is well maintained, the disinfectant is unnecessary. These positions are presented in a series of papers published in Water Supply (Vol. 16(3/4), 1998).
3.4.2 Factors affecting microbial occurrence
Disinfectant residual and disinfectant level The growth of bacteria and occurrence of coliforms depend on a complex interaction of many factors including water temperature, disinfectant type and residual, pipe material, corrosion and other engineering and operational parameters (Berger, LeChevallier & Reasoner, 1992; LeChevallier et al., 1991, 1993; LeChevallier, Welch & Smith, 1996). Recent research has indicated that various disinfectants differ in their ability to interact with biofilm bacteria (LeChevallier, 1991; De Beer, Srinivasan & Stewart, 1994). Monochloramine, although a much less reactive disinfectant than free chlorine, is more specific in the type of compounds that it will react with. Therefore, monochloramine can be more effective than free chlorine at penetrating and inactivating certain types of biofilm, particularly those containing corrosion products (LeChevallier, Lowry & Lee, 1990; LeChevallier et al., 1993; Norton & LeChevallier, 1997). A study of 30 distribution systems showed a difference in the density and occurrence of coliform bacteria between systems using free chlorine and those using chloramines (LeChevallier et al., 1996). Modelling indicates that the penetration
Inactivation (disinfection) processes 63
of free chlorine into a biofilm is limited by its fast reaction rate (De Beer, Srinivasan & Stewart, 1994). Free chlorine is essentially consumed before it can react with the bacterial components of the film (Chen & Stewart, 1996). Chloramines, on the other hand, are slower reacting; they can diffuse into the biofilm and eventually inactivate attached bacteria, a mechanism that has been demonstrated using an alginate bead model (Chen and Stewart, 1996). Stewart, McFeters & Huang (2000) showed that free chlorine did not effectively penetrate alginate beads containing bacterial cells, but chloramines did penetrate into the alginate material and reduced bacterial levels nearly one million-fold over a 60 minute interval (2.5 mg/l chloramines, pH 8.9). Kool, Carpenter & Fields (1999) reported that hospitals supplied with water containing a chloramine residual were 10 times less likely to have water-associated legionella infections. Similarly, Heffelfinger et al. (2003), in a study of 166 hospitals, found that nosocomial legionellosis was five times less likely in the hospitals served with chloraminated water. The authors attributed the effectiveness of chloramines for legionella control to the ability of the disinfectant to penetrate biofilms.
In addition to the type of disinfectant used, the residual maintained at the end of the distribution system was also related to coliform occurrences (LeChevallier, Welch & Smith, 1996). Systems that maintained dead-end free chlorine levels of less than 0.2 mg/l or monochloramine levels of less than 0.5 mg/l had substantially more coliform occurrences than systems maintaining higher disinfectant residuals. Systems with high assimilable organic carbon (AOC) levels needed to maintain high disinfectant residuals to control coliform occurrences. Therefore, maintenance of a disinfectant residual alone does not ensure that treated waters will be free of coliform bacteria.
Biostability The presence of biodegradable organic matter in water will promote bacterial growth, and may be related to the occurrence of coliform bacteria in distribution systems (Bourbigot, Dodin & Lheritier, 1984; Camper et al., 1991; Geldreich & Stevens, 1987; LeChevallier, Babcock & Lee, 1987; LeChevallier et al., 1991). Biodegradable organic matter is commonly measured as AOC or biodegradable dissolved organic carbon (BDOC). Van der Kooij (1987) showed that AOC concentrations increased in water samples treated with increasing chlorine doses. Similarly, Hambsch & Werner (1993) reported higher biodegradability of humic substances after chlorination. LeChevallier et al. (1992) found that chlorination may increase AOC levels, depending on the point of chlorine application.
64 Water treatment and pathogen control
Corrosion control and pipe materials Corrosion of iron pipes can influence the effectiveness of chlorine-based disinfectants for inactivation of biofilm bacteria (LeChevallier, Lowry & Lee, 1990; LeChevallier et al., 1993; Ainsworth, 2004). Free chlorine is affected to a greater extent than monochloramine, although the effectiveness of both disinfectants is impaired if corrosion rates are not controlled (LeChevallier, Lowry & Lee, 1990; LeChevallier et al., 1993). Improving corrosion control can improve the ability of residual disinfectants to control bacterial growth (Norton & LeChevallier, 1997).
The pipe surface itself can influence the composition and activity of biofilm populations. Biofilms develop more quickly and support a more diverse microbial population on iron pipe surfaces than on plastic polyvinylchloride (PVC) pipes, even with adequate corrosion control, biological treatment of water to reduce AOC levels and consistently maintained chlorine residuals (LeChevallier et al., 1993; Camper, 1996).
Pressure, cross-connection control and maintenance Microbial quality of drinking-water cannot depend only on maintenance of a residual disinfectant. The extensive nature of the distribution system, with many kilometres of pipe, storage tanks, interconnections with industrial users and the potential for tampering and vandalism, provides opportunities for contamination. Cross-connections are a major risk to water quality. Although the risk can be reduced by vigilant control programs, complete control is difficult to achieve and water utilities worldwide face challenges in maintaining an effective cross-connection control program.
Despite the best efforts to repair main breaks using good sanitary procedures, main breaks provide an opportunity for contamination to enter the distribution system. Utilities typically isolate the affected section and repair, superchlorinate and flush the repaired pipe. However, it may be difficult to achieve flushing velocities sufficient to remove all contaminated debris; also, microbiological tests to check the final water quality may not detect contaminating organisms. McFeters, Kippin & LeChevallier (1986) reported high levels of damaged coliform bacteria, not detectable by standard coliform techniques, following the repair of a main break. Resampling of the site one week later showed persistence of high levels of the coliform bacteria, detectable only using m-T7 agar, a medium specially designed to recover chlorine-damaged coliforms.
Backflow devices to prevent the entry of contaminated water are important as a distribution system barrier. Because of high costs, backflow devices are installed mainly on service lines for facilities that use potentially hazardous substances (e.g. hospitals, mortuaries, dry cleaners and industrial users). It is not
Inactivation (disinfection) processes 65
common for all service connections to have backflow devices, so the possibility of back-siphonage exists at certain points. Also, installation of backflow devices for all service connections would make routine checking of the devices nearly impossible and, without routine inspection, the proper functioning of the units cannot be assured. Even when backflow devices have been installed, contamination events have occurred. For example, the failure of a backflow check valve allowed water stored for fire protection to enter the distribution system in Cabool, Missouri (USA) (Geldreich, 1996). A broken vent in the storage tank allowed birds to enter and contaminate the water with Salmonella.Three people died from Salmonella infection.
Recent research is focusing on transient pressure waves that can result in hydraulic surges in the distribution system (Kirmeyer et al., 2001). These waves have both a positive and negative amplitude, meaning that they can create transient negative pressures (lasting only a few seconds) in a distribution system, which may be missed by conventional pressure monitoring. Because these waves travel through the distribution system, any point where water is leaking out of the system is a potential entry point for microbes during the brief period of negative pressure.
3.4.3 Other non-chlorine disinfectants Non-chlorine disinfectants include other halogens (iodine, bromine) and a variety of metals. Various authors (Hsu, 1964; Sharp, Floyd & Johnson, 1975; Alvarez & O’Brien, 1982; Pyle, Broadaway & McFeters, 1992) have proposed these alternative disinfectants for use in drinking-water supplies, although currently none have gained widespread acceptance. A combination of copper and silver ions can inactivate bacteria and viruses, although contact times may be long (hours to days) (Derby, 1947; Thurman and Gerba, 1989; Pyle, Broadaway & McFeters, 1992). Low levels of chlorine (0.1 mg/l) combined with silver (38 µg/l) and copper (380 µg/l) resulted in more than 5-log inactivation of E. coli in tap water within 120 seconds (Thurman and Gerba, 1989). Silver (30 µg/l) and hydrogen peroxide (30 µg/l) together provided a long-lasting residual effect capable of more than 5-log inactivation of E. coli in phosphate buffer (pH 6.8) after one hour exposure (Pedahzur et al., 1995). Photocatalytic titanium dioxide has also been examined for disinfection of water (Wel et al., 1994).
