inaugural – dissertation zur erlangung der doktorw¼rde der
TRANSCRIPT
INAUGURAL – DISSERTATION
zur Erlangung der Doktorwürde
der Naturwissenschaftlich-Mathematischen
Gesamtfakultät der
Ruprecht-Karls-Universität Heidelberg
Vorgelegt von
Diplom-Chem. Domnica Cristina Breban
aus: Bukarest, Rumänien
Tag der mündlichen Prüfung: 20 April 2007
Thema
Provenance and Characterization of Aquatic Actinide Colloids:
Interaction of Actinides with Aluminosilicate and Humate
Colloids
Gutachter: Prof. Dr. Thomas Fanghänel
Gutachter: Prof. Dr. Margot Isenbeck- Schröter
Acknowledgements
The experiments described in this work were performed at the Institute of Radio-
chemistry (RCM), Technical University München (the radiometric experiments) and Insti-
tute of Nuclear Waste Management (INE), Forschungszentrum Karlsruhe (the spectro-
scopic measurements).
I would like to express my deepest gratitude to Prof. Dr. Jae-Il Kim, the initiator of
this research subject, for offering me the chance to work on the topic and to Dr. Maria-
Anna Kim, my direct supervisor, who shaped my work through her ideas, scientific guid-
ing and critical advices. They both were my mentors and the accomplishment of this the-
sis would not have been possible without their help.
Special consideration goes to my doctoral supervisor, Prof. Dr. Thomas Fanghänel
(FZK), for providing me the opportunity to work at INE-FZK and for his permanent sup-
port. I would also like to thank PD Dr. Petra Panak (INE), for the help during the EXAFS
measurements, many valuable discussions (regarding TRLFS and not only) and sugges-
tions for revising the thesis.
I am very grateful to Dr. Andrey Priemyschev (RCM) for sharing with me his ex-
perience and knowledge and very good collaboration.
Special thanks are due to the colleagues from the INE-EXAFS group: Dr. Melissa
Denecke for the very useful discussions and revision of the EXAFS chapter of the thesis
and Drs. Kathy Dardenne and Jörg Rothe for assistance during the EXAFS measurements,
data analysis as well as for helpful discussions.
A number of other people contributed to the realization of the present work.
Thanks are due to Dr. Christian Marquardt and Dr. Gunnar Buckau from INE, for provid-
ing the radioactive standard solutions and the humic acid, as well as to Dr. Alexander
Mansel (IIIF Leipzig) for labeling the humic acid. I would also like to thank Dr. Reinhard
Klenze (INE) for his very kind assistance regarding the formalities in obtaining the Ger-
man visa and those at the University of Heidelberg.
It was a chance, a pleasure and great experience for me to be one of the co-
workers of the RCM and INE; I would like to thank from all my heart to all people from
the two institutes for the very friendly atmosphere and their helpful attitude. I own special
thanks to Jörg Aign (RCM), for his patience in answering my numerous technical ques-
tions.
ANKA Angstromquelle Karlsruhe is acknowledged for the provision of the beam-
time for the EXAFS measurements. The financial support for the Ph.D grant provided by
the Helmholtz Association, FZK Germany, is also gratefully acknowledged.
Summary
One of the major uncertainties in the process of actinide migration is due to the
limited knowledge about the mechanism of formation and stability of the actinide col-
loids. During the formation of hydroxy-aluminosilicate (HAS) colloids as kernels of natu-
ral aquatic colloid, trace actinide ions may be incorporated and become colloid-borne spe-
cies.
The present work investigates the behaviour of actinides (An) of different oxida-
tion states in the process of aquatic colloid formation, e.g. at the generation of alumi-
nosilicates (HAS) by co-nucleation of Si and Al in absence or in presence of natural hu-
mic acid (HA). The study comprises three parts.
The first part of the work concentrates on the interaction of tri-, tetra-, penta- and
hexavalent actinide ions with HAS colloids. The HAS colloids are synthesized through
heterogeneous nucleation of Si and Al in the pH region 4 to 9 at room temperature and
atmospheric pressure. Si concentration is maintained either below or above the saturation
concentration of amorphous silica (2x10⁻³ M). In the former case 10-3 M Si is mixed with
10-5 M Al and Si is present in solution as monosilicic acid. In the latter case, 10-2 M Si is
mixed with 10-4 M Al and polysilicic acid prevails in solution. The following tracer nu-
clides are introduced in the co-nucleation process: 241Am(III), 234Th(IV), 237Np(V) and 233U(VI). Colloids are separated from solution and precipitate by sequential filtration and
ultrafiltration. Definition of the optimum conditions for the formation of colloid-borne
actinide species is ascertained by radiometric assay, determining the actinide fraction in
the colloidal phase as a function of pH, conditioning time, concentration and concentra-
tion ratio of the involved components. Several methods are further applied for the ap-
praisal of the chemical binding state of actinides in the HAS colloids as well as of Al in
aluminosilicate solutions: TRLFS (time resolved laser fluorescence spectroscopy),
EXAFS (extended X-ray absorption fine structure) spectroscopy and ligand displacement
method (using EDTA as competing ligand). The radiometric and spectroscopic results
show that the co-nucleation of An with Si and Al forming HAS colloid-borne actinides is
more favourable with increasing pH, and concentration of Si and Al, parameters favouring
the element hydrolysis. Accordingly, Np does not interact with the HAS colloids in its
non-hydrolysis pH range (≤ 9), whereas maximum incorporation of An(III, IV, VI) into
the colloidal phase is observed for HAS generated from polysilicic acid in the pH range
7-9. Under these conditions, the desorption experiments show that the Al-O-Si binding as
well as well as the Th(IV)/U(VI)-HAS colloid binding are EDTA resistant, whereas
Am(III)-HAS colloid binding is not EDTA resistant. The affinity for conucleation with
HAS (Th(IV) ~ U(VI) > Am(III)) appears to be higher for the elements with higher ten-
dency toward hydrolysis. The less hydrolyzing tendency of Am(III) might be also the rea-
son of its discrimination against Al(III), Th(IV) and U(VI) at the co-nucleation with
polysilicic acid.
The second part of the work further concerns the behaviour of An(III, IV, VI) at
the interaction with humate colloids. In addition to actinide activity measurements, 14C-
labelled natural humic acid is used in order to facilitate the tracing of humic colloids be-
haviour. The conditions of colloid formation are investigated by radiometric assay as a
function of pH (6.6-7.8), time, concentration of HA (0.6-8 mg/L), Al (1x10⁻⁵-1x10⁻⁴ M)
and An (5x10⁻⁸-1x10⁻⁵ M). Formation of humate-colloid-borne An species appears to be
very efficient for trace amount of actinides at HA concentration close to the average level
encountered in natural waters (approximately 5 mg/L), as long as the proton exchange ca-
pacity of HA for complexation of Al species is not exceeded. The generation of humate-
colloid-borne species is distinctively favored for the non-hydrolyzed ionic species. Ac-
cordingly, due to the higher hydrolysis tendency of Al(III), its ionic species have lower
tendency to complex with humic colloids. Among the An(III, IV, VI) present at tracer
concentration, the less hydrolyzing Am(III) shows higher affinity for formation of hu-
mate-colloid-borne species in the neutral pH range and for HA concentration at the aver-
age level of natural waters. Generation of humate-colloid-borne An(IV, VI) is enhanced
by increasing HA concentration or decreasing the An/HA concentration ratio.
The third part of the work follows the conditions for formation of colloid-borne
An(III, IV, VI) in the mixed system containing the competing HAS and humic colloids.
The simultaneous presence of HAS and HA generally enhances the stability region (in
respect with pH and Si/Al concentration) of the colloid-borne An species. The formation
of mixed HAS-humic colloids with synergic binding appears to be responsible for the sta-
ble incorporation of An into the colloidal phase, as ascertained for Cm(III) by TRLFS.
Such a synergic effect is assumed to be related to the two different and complementary
mechanisms exhibited by the HAS and HA colloids in binding the actinides. Formation of
mixed HAS-humic colloid-borne An could be expected under environmental conditions
favouring the presence of partially hydrolyzed An species, interacting with both HAS and
HA.
Zusammenfassung
Eine der größten Unsicherheiten im Migrationsprozess der Actiniden ergibt sich
aus den begrenzten Kenntnissen bezüglich des Bildungsmechanismus und der Stabilität
der kolloidalen Actinidspezies. Während des Kolloidbildungsprozesses von
Hydroxyalumosilikaten (HAS), welche Vorstufen für natürliche aquatische Kolloide
darstellen, können Actinidionen inkorporiert und so als Kolloidspezies transportiert
werden.
Diese Arbeit beschäftigt sich mit dem Verhalten von Actiniden (An)
unterschiedlicher Oxidationsstufen während des aquatischen Kolloidbildungsprozesses,
d.h. der Bildung von Alumosilikaten durch Si(IV) und Al(III) Kopolymerisation sowohl
in Ab- als auch in Anwesenheit von natürlicher Huminsäure (HA). Die Arbeit umfasst
drei Teile.
Das erste Teil befasst sich mit den Wechselwirkungen von tri-, tetra-, penta- und
hexavalenten Actinidionen mit HAS-Kolloiden. Die HAS-Kolloide werden durch
Kopolymerisation von Si und Al in einem pH-Bereich zwischen 4 und 9 bei
Raumtemperatur und Atmosphärendruck synthetisiert. Hierbei werden Si-
Konzentrationen entweder unter- oder oberhalb der Sättigungskonzentration von
amorphem SiO2 (2x10⁻³ M) verwendet. Im ersten Fall werden 10-3 M Si zu einer 10-5 M
Al-Lösung gegeben. Dabei liegt das Si in der Lösung als Monokieselsäure vor. Im
anderen Fall werden Konzentrationen von 10-2 M Si und 10-4 M Al verwendet, wobei
Polykieselsäuren in der Lösung dominieren. Folgende Nuklide werden dem
Kopolymerisationsprozess zugesetzt: 241Am(III), 234Th(IV), 237Np(V) und 233U(VI). Die
Kolloide werden durch Filtration und anschlieβende Ultrafiltration von der Lösung
getrennt. Die optimalen Bedienungen für den Bildungsprozess der kolloidalen
Actinidspezies werden durch radiometrische Untersuchungen bestimmt. Dabei werden die
Actinidfraktionen in der kolloidalen Phase unter verschiedenen Kombinationen von
Parametern wie pH-Wert, die Konditionierungszeit, die Konzentration und das
Konzentrationsverhältnis der Komponenten bestimmt. Verschiedene Methoden werden
für die Untersuchung des chemischen Bindungszustands der Actiniden in den HAS-
Kolloiden sowie von Al in den Alumosilikaten verwendet: TRLFS (zeitaufgelöste
Laserfluoreszenzspektroskopie), XAS (Röntgenabsorptionspektroskopie) sowie die sog.
„Ligandenaustauschmethode“ (mit EDTA als Ligand). Die radiometrischen und
spektroskopischen Ergebnisse deuten daraufhin, dass die HAS-Kolloidbildung durch
Kopolymerisation von An mit Al und Si mit zunehmendem pH-Wert und zunehmenden
Si- und Al-Konzentrationen favorisiert wird. Diese Parameter begünstigen auch die
Elementhydrolyse und die Polymerisationsreaktion. Np zeigt keine Wechselwirkungen
mit den HAS-Kolloiden für pH < 9 (unterhalb des Hydrolysebereichs). Die maximale
Inkorporation von An (III, IV, V) in die HAS-Kolloide aus Polykieselsäure wird dagegen
für pH-Werte zwischen 7 und 9 beobachtet. Unter diesen Bedingungen zeigen die
Desorptionsversuche mit EDTA, dass sowohl die Al-O-Si-Bindungen als auch die
Th(IV)/U(VI)-HAS-Kolloidbindungen in Anwesenheit von EDTA stabil sind. Im
Gegensatz dazu erfolgt für Am(III) eine Desorption von den HAS-Kolloiden. Die
Affinität zur Kopolymerisation mit HAS (Th(IV) ~ U(VI) > Am(III)) ist für Actinide mit
einer starken Neigung zur Hydrolyse deutlich höher. Die schwächere Tendenz des
Am(III) zur Hydrolyse kann auch ein Grund für das unterschiedliche Verhalten im
Vergleich zu Al(III), Th(IV) und U(VI) bei der Kopolymerisation mit Polykieselsäure
sein.
Der zweite Teil der Arbeit beschäftigt sich mit dem Verhalten der An (III, IV, VI)
bei der Wechselwirkung mit Huminkolloiden. Zusätzlich zu den Messungen der
Actinidaktivitäten wird 14C-markierte Huminsäure verwendet, um das Verhalten der
Huminkolloide leichter zu verfolgen. Die Bedingungen für die Kolloidbildung werden
durch radiometrische Versuche als Funktion des pH-Wertes (6.6-7.8), der Zeit und der
HA (0.6-8 mg/L), Al (1x10⁻⁵-1x10⁻⁴ M) und An (5x10⁻⁸-1x10⁻⁵ M)-Konzentration
untersucht. So lange die maximale Protonenaustauschkapazität der HA für die
Komplexation mit Al-Spezies nicht erreicht ist, lässt sich die Bildung der actinidhaltigen
Huminkolloide anhand der Aktivität der Actinidionen sehr effektiv im für natürliche
Grundwässer relevanten Konzentrationsbereich (ca. 5 mg/L) detektieren. Die Bildung von
kolloidalen An-Humatspezies ist im Falle von nicht hydrolysierten ionischen Spezies klar
favorisiert. D.h., wegen der höheren Tendenz von Al(III) zur Hydrolyse ist die Tendenz
zur Komplexbildung mit Huminkolloiden weitaus geringer. Ein Vergleich der An(III, IV,
VI), die in Tracerkonzentrationen vorliegen, zeigt, dass Am(III) die höchste Affinität für
die Bildung von actinidhaltigen Huminkolloiden aufweist. Die Tendenz zur Hydrolyse ist
insbesondere im neutralen pH-Bereich deutlich geringer. Die An(IV, VI)-
Huminkolloidbildung wird entweder durch höhere HA-Konzentrationen oder ein
kleineres An/HA – Konzentrationsverhältnis erhöht.
Im dritten Teil der Arbeit werden Bedingungen zur Bildung von An(III, IV, VI)-
Kolloiden in gemischten Systemen untersucht, die sowohl HAS als auch Huminkolloide
enthalten. Die gleichzeitige Anwesenheit von HAS und HA haben generell einen
stabilisierenden Einfluss auf die Pseudokolloidbindung von An (bezüglich pH-Wert und
Si/Al-Konzentration). Die Bildung von stabilen ternären An-HA-HAS-Kolloiden, wie sie
für Cm(III) durch TRLFS nachgewiesen wurden, führt bezüglich des Einbaus der
Actiniden in die kolloidale Phase zu einem synergistischen Effekt. Solche synergistische
Effekte sind durch unterschiedliche komplementäre Mechanismen bei der
Wechselwirkung von An mit HAS und HA-Kolloiden zu erklären. Die Bildung von
stabilen ternären An-HA-HAS-Kolloiden tritt vorwiegend unter für Grundwässer
relevanten Bedingungen auf, und ist somit auch in natürlichen Systemen zu erwarten, wo
ebenfalls partial hydrolysierte An-Spezies vorliegen, welche Wechselwirkungen sowohl
mit HAS als auch mit HA zeigen.
Contents
page
1 Introduction 1
2 Natural and actinide aquatic colloids: literature 3
2.1 Theory of aquatic colloid formation 3
2.1.1 Colloid generation 3
2.1.2 Colloid stability 9
2.2 Natural aquatic colloids in laboratory 12
2.2.1 Aluminosilicate colloids 12
2.2.2 Humate colloids 17
2.3 Actinide colloids in natural aquatic systems 19
2.4 Methods for the analysis of actinide colloids 22
2.4.1 Detection and chemical speciation of colloid-borne actinides 22
2.4.2 Quantification and characterization of colloids 29
3 Experimental section 32
3.1 Preparation of inactive and radioactive stock solutions 32
3.2 Mother solutions for actinide/colloids interaction 35
3.3 Activity partition in solution, colloids and precipitate 37
3.4 Colorimetric quantification of Si and Al 41
3.5 Spectroscopic characterization of the actinide/colloid binding 42
3.6 Desorption of activity with chelating agents 44
4 Interaction of actinide(III-VI) with aluminosilicate colloids 45
4.1 Co-nucleation of Si, Al and actinide(III)/(IV)/(V)/(VI) 45
4.1.1 Formation of colloid-borne actinides: parameter screening 45
4.1.2. Kinetics of actinide incorporation into colloids 50
4.1.3. Capacity of colloids to incorporate actinides 53
4.2 Spectroscopic speciation of aluminosilicate borne- actinide 55
4.2.1 Cm(III): Time-resolved laser fluorescence spectroscopy 56
4.2.2 Actinide(III)/(IV)/(V)/(VI): X-ray absorption spectroscopy 59
4.3 Stability of aluminosilicate colloid-borne actinides 74
4.3.1 pH reversibility of colloid-borne Al and actinide(III) 74
4.3.2 EDTA resistance of colloid-borne Al and actinide(III)/(IV)/(VI) 77
4.4 Conclusions 83
5 Interaction of actinide(III, IV, VI) with humate colloids 86
5.1 Humic acid as colloids: influencing parameters 86
5.2 Complexation of Al and actinide(III)/(IV)/(VI) with humic acid 90
5.2.1 Formation of colloid-borne actinides: parameter screening 90
5.2.2 Complexation behavior of Al and actinides: comparison 92
5.3 Identification of humate colloid-borne actinides species 95
5.4 Conclusions 102
6 Competitive interaction of actinide(III, IV, VI) with aluminosilicate 104
and humate colloids
6.1 Complexation of Al and An(III) with silicic and humic acid 104
6.1.1 Formation of colloid-borne actinide(III): parameter screening 104
6.1.2 Spectroscopic speciation of colloid-borne Cm(III) 108
6.1.3 Kinetics of actinide(III) incorporation into the colloid mixture 110
6.2 Complexation of Al and actinide(III)/(IV)/(VI) with silicic and humic acid: 113
comparison
6.3 Colloid stability and average size particle 118
6.4 Conclusions 119
7 Conclusions 120
8 Appendix 121
9 Figures captions 131
10 References 134
1
Introduction
1. Introduction Aquatic colloids are omnipresent in natural waters [1, 2, 3] and composed of inor-
ganic elements with different oxidation states via oxo-bridging [4] or inorganic-organic
composites in which ubiquitous humic acid is normally involved [5, 6, 7]. Their chemical
composition, number density and particle size distribution vary depending on the geo-
chemical conditions of their provenance. Hence, in natural systems the particle size distri-
bution has been generally observed between 1nm and up to 100 nm, but very often below
50 nm [8, 9]. For this size range, the typical number density has been reported to vary be-
tween 108 to 1014 particles/L water [5, 10]. Regardless of their composition, aquatic col-
loids have been recognized to play a significant carrier role in the migration of trace con-
taminants including radionuclides in aquifer systems [10, 11]. Several investigations have
demonstrated that low soluble, surface reactive radionuclides could travel much farther
and much faster than anticipated from traditional solute transport models taking into ac-
count the thermodynamic solubilities [12, 13, 14]. In all cases the enhanced radionuclide
transport has been attributed to the association of contaminants with the mobile colloidal
phase. As highly charged cations, actinides manifest strong tendency towards hydroly-
sis/poly-nucleation and complexation, and hence, high potential for incorporation into
aquatic colloids [9, 10]. Numerous studies have concentrated on the actinide interaction
with aquatic colloids [15-21], however the process for formation of aquatic colloid-borne
actinides is still not well understood, a key issue being the stability of such colloids [7].
Therefore, the appraisal of colloid-borne actinide generation is necessary for a possible
prediction of the colloid-facilitated migration of actinides which is a requirement for the
long-term safety analysis of nuclear waste repositories.
Hydroxyaluminosilicate (HAS) colloids are known to be kernels for a variety of
aquatic colloids [10, 22-24], as Al and silicic acid are always present in natural water and
may undergo co-nucleation via oxo-bridging to form stable water-soluble composites [1].
In the course of HAS-colloid formation, trace elements are easily integrated in the co-
nucleation process and become colloid-borne species. This process has been recently in-
vestigated for tri-and tetravalent actinides [25-28].
The present work is a continuation of this series and pursues the behavior of acti-
nides of higher oxidation states (penta-, hexavalent) and aspects regarding the stability
2
Introduction
of the HAS-colloid-borne actinides, (III to VI). For a better approach to the complex natu-
ral conditions, the formation of HAS-colloid-borne actinides is further analyzed in the
presence of humic acid (HA). As humic acid is an ubiquitous component of natural waters
and has a strong affinity to complex metal ions of higher charges (z ≥ 3+) [7, 9, 29], its
impact on the formation of HAS colloids and hence of HAS-colloid-borne actinides is ex-
pected to be significant. The selected actinides are Am(III), Th(IV), Np(V) and U(VI).
Am, Np and U are actinides of most concern from radiological point of view, due to their
long-lived isotopes and large abundance in the spent fuel to be disposed. Due to its stable
oxidation state, Th(IV) is taken as a model element to characterize the behaviour of redox
sensitive actinides like Pu, U and Np which may be reduced to the tetravalent state at low
redox potential in the near field of a nuclear repository [30, 31].
3
Natural and actinide aquatic colloids: literature
2. Natural and actinide aquatic colloids: literature
Colloidal systems are heterogeneous systems, containing very small particles
which can remain for an indefinite period in dispersed state in solution. The range of col-
loidal particle size is commonly defined between 1 and 1000 nm in diameter.
2.1 Theory of aquatic colloid formation [1, 2, 32].
2.1.1 Colloid generation
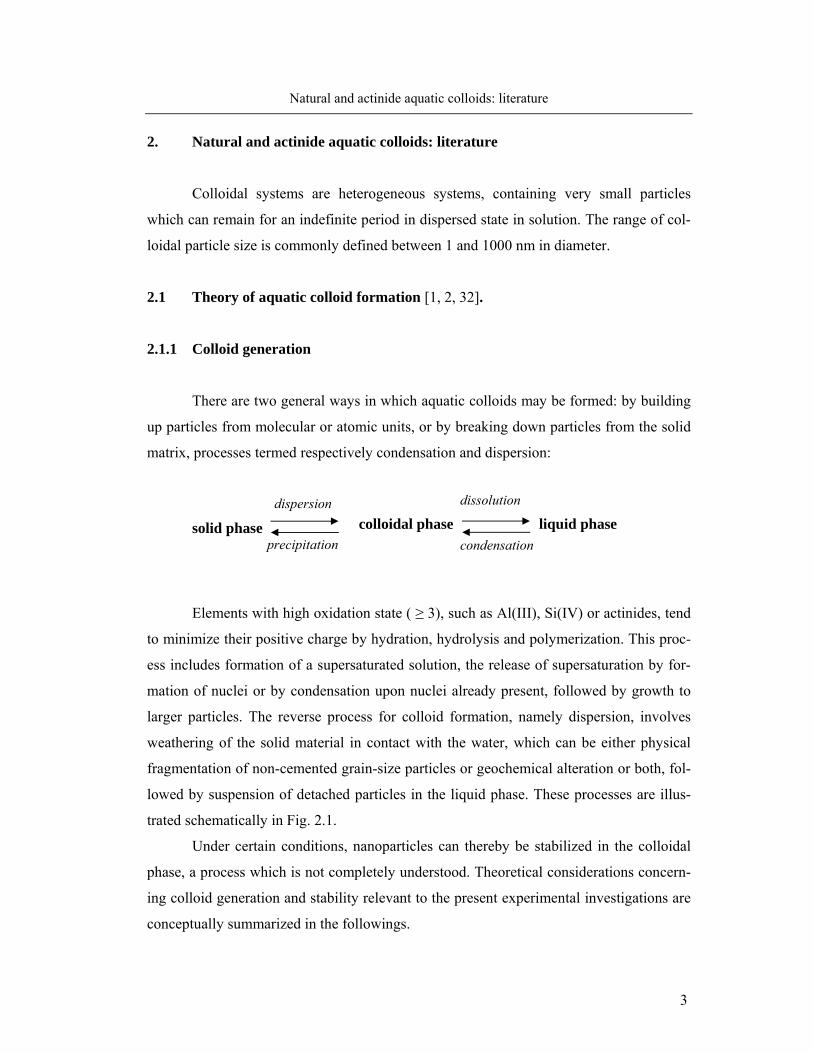
There are two general ways in which aquatic colloids may be formed: by building
up particles from molecular or atomic units, or by breaking down particles from the solid
matrix, processes termed respectively condensation and dispersion:
dispersion
solid phase precipitation
Elements with high oxidation state ( ≥ 3), such as Al(III), Si(IV) or actinides, tend
to minimize their positive charge by hydration, hydrolysis and polymerization. This proc-
ess includes formation of a supersaturated solution, the release of supersaturation by for-
mation of nuclei or by condensation upon nuclei already present, followed by growth to
larger particles. The reverse process for colloid formation, namely dispersion, involves
weathering of the solid material in contact with the water, which can be either physical
fragmentation of non-cemented grain-size particles or geochemical alteration or both, fol-
lowed by suspension of detached particles in the liquid phase. These processes are illus-
trated schematically in Fig. 2.1.
Under certain conditions, nanoparticles can thereby be stabilized in the colloidal
phase, a process which is not completely understood. Theoretical considerations concern-
ing colloid generation and stability relevant to the present experimental investigations are
conceptually summarized in the followings.
liquid phase
colloidal phase dissolution
condensation
4
Natural and actinide aquatic colloids: literature
Fig. 2.1 General pathways for the formation of inorganic aquatic colloids such as aluminosilicate colloids [25].
Colloidal interface free energy
The behavior of colloids is governed primarily by their large interfacial area. The
interface is defined as the boundary between the adjoining bulk phases that comprise the
colloid system, e.g. liquid/solid in the case of aquatic colloids. Within each bulk phase
forces acting on a molecule from all directions are balanced. The molecules at the inter-
face interact simultaneously with molecules from both liquid and solid phase. Since forces
of attraction are greater between the molecules on the solid phase than between those of
the liquid phase, the molecules at the interface are attracted more strongly towards the
solid phase. The energy input, required to compensate for this imbalance of intermolecu-
lar forces, is the origin of the colloidal free energy. The high reactivity of colloids (acti-
vated solid state) originates from the tendency to minimize the free energy.
The questions are, where does this activation energy come from, what kind of en-
ergy transfer occurs at deactivation, which mechanisms inhibit complete deactivation, so
that the colloidal state, although thermodynamically unfavorable, persists over a long time
span and how can the underlying parameters be controlled ? Theoretic thermodynamic
and kinetic approaches which are helpful to conceive appropriate experiments to answer
these questions are summarized in the followings.
5
Natural and actinide aquatic colloids: literature
Formation of colloids through condensation
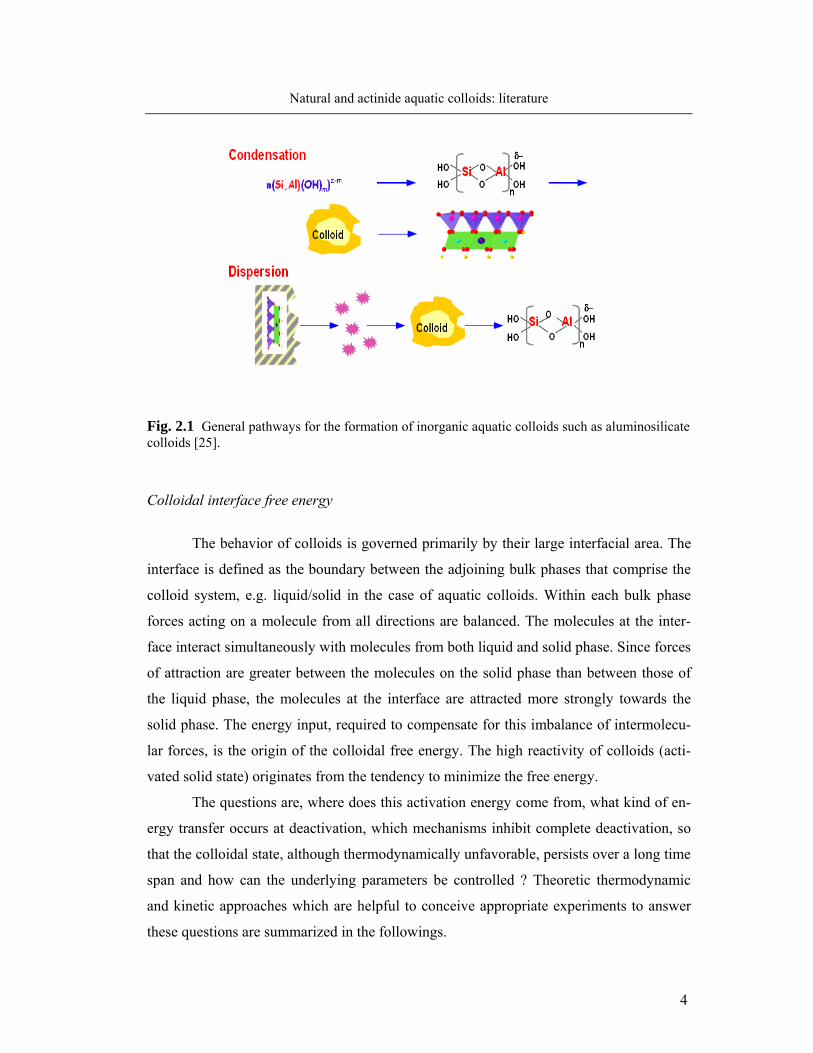
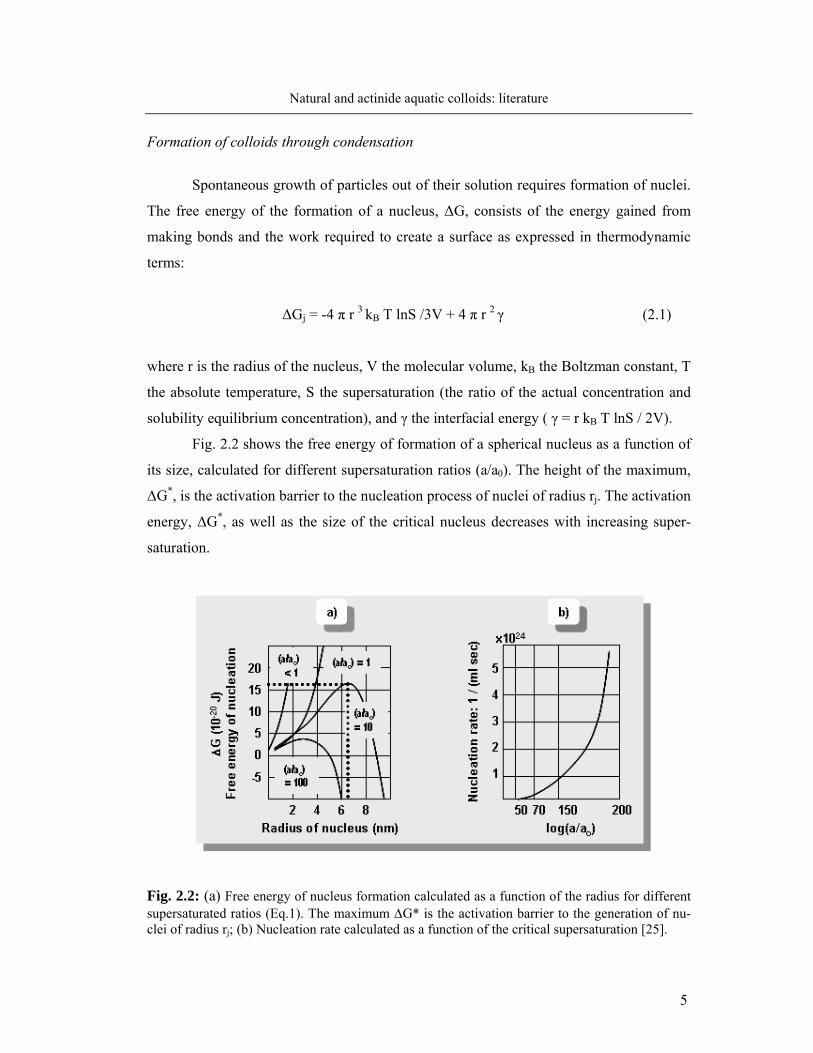
Spontaneous growth of particles out of their solution requires formation of nuclei.
The free energy of the formation of a nucleus, ΔG, consists of the energy gained from
making bonds and the work required to create a surface as expressed in thermodynamic
terms:
ΔGj = -4 π r 3 kB T lnS /3V + 4 π r 2 γ (2.1)
where r is the radius of the nucleus, V the molecular volume, kB the Boltzman constant, T
the absolute temperature, S the supersaturation (the ratio of the actual concentration and
solubility equilibrium concentration), and γ the interfacial energy ( γ = r kB T lnS / 2V).
Fig. 2.2 shows the free energy of formation of a spherical nucleus as a function of
its size, calculated for different supersaturation ratios (a/a0). The height of the maximum,
ΔG*, is the activation barrier to the nucleation process of nuclei of radius rj. The activation
energy, ΔG*, as well as the size of the critical nucleus decreases with increasing super-
saturation.
Fig. 2.2: (a) Free energy of nucleus formation calculated as a function of the radius for different supersaturated ratios (Eq.1). The maximum ΔG* is the activation barrier to the generation of nu-clei of radius rj; (b) Nucleation rate calculated as a function of the critical supersaturation [25].
6
Natural and actinide aquatic colloids: literature
Introduction of foreign solid surfaces for catalyzing the nucleation process, by reducing
the energy barrier is the principle of heterogeneous nucleation, the predominant process of
the formation of colloids and crystals in natural waters. If the foreign substrate is similar
to the product of nucleating components, the interfacial energy between the two solids is
smaller than the interfacial energy between the product and the solution and nucleation
may take place at lower supersaturation on a solid substrate than in solution. The tempera-
ture affects also the critical supersaturation ratio, which decreases with increasing tem-
perature.
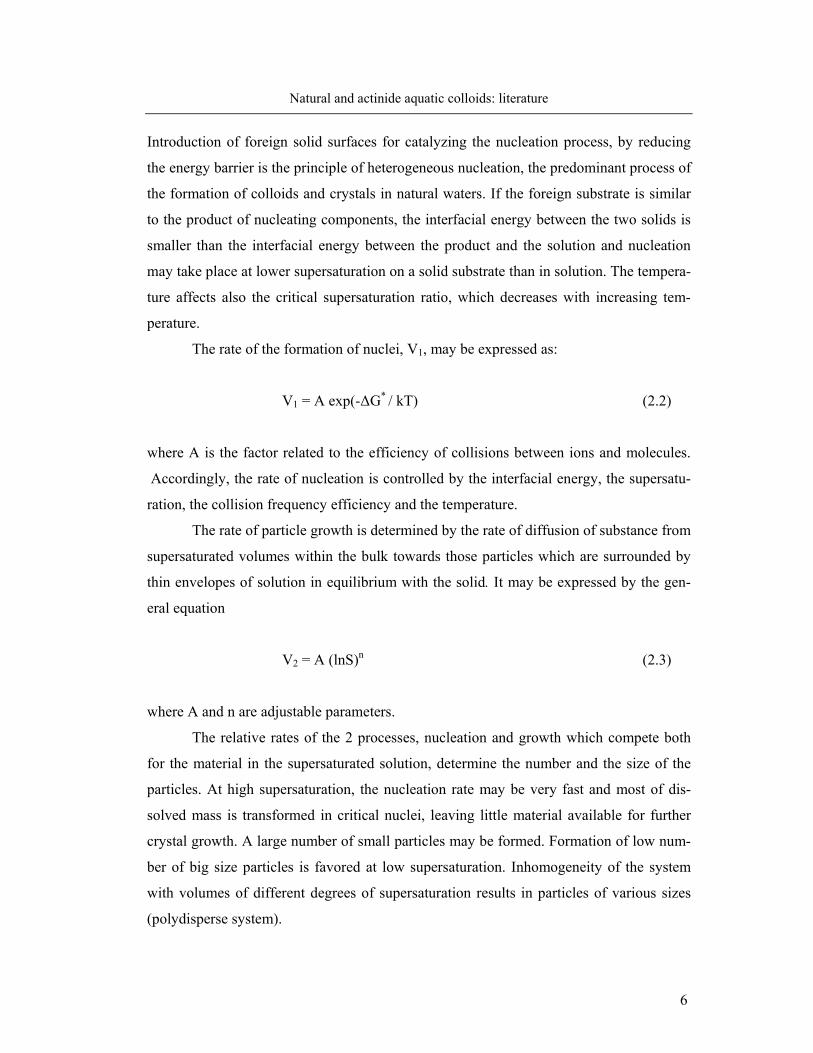
The rate of the formation of nuclei, V1, may be expressed as:
V1 = A exp(-ΔG* / kT) (2.2)
where A is the factor related to the efficiency of collisions between ions and molecules.
Accordingly, the rate of nucleation is controlled by the interfacial energy, the supersatu-
ration, the collision frequency efficiency and the temperature.
The rate of particle growth is determined by the rate of diffusion of substance from
supersaturated volumes within the bulk towards those particles which are surrounded by
thin envelopes of solution in equilibrium with the solid. It may be expressed by the gen-
eral equation
V2 = A (lnS)n (2.3)
where A and n are adjustable parameters.
The relative rates of the 2 processes, nucleation and growth which compete both
for the material in the supersaturated solution, determine the number and the size of the
particles. At high supersaturation, the nucleation rate may be very fast and most of dis-
solved mass is transformed in critical nuclei, leaving little material available for further
crystal growth. A large number of small particles may be formed. Formation of low num-
ber of big size particles is favored at low supersaturation. Inhomogeneity of the system
with volumes of different degrees of supersaturation results in particles of various sizes
(polydisperse system).
7
Natural and actinide aquatic colloids: literature
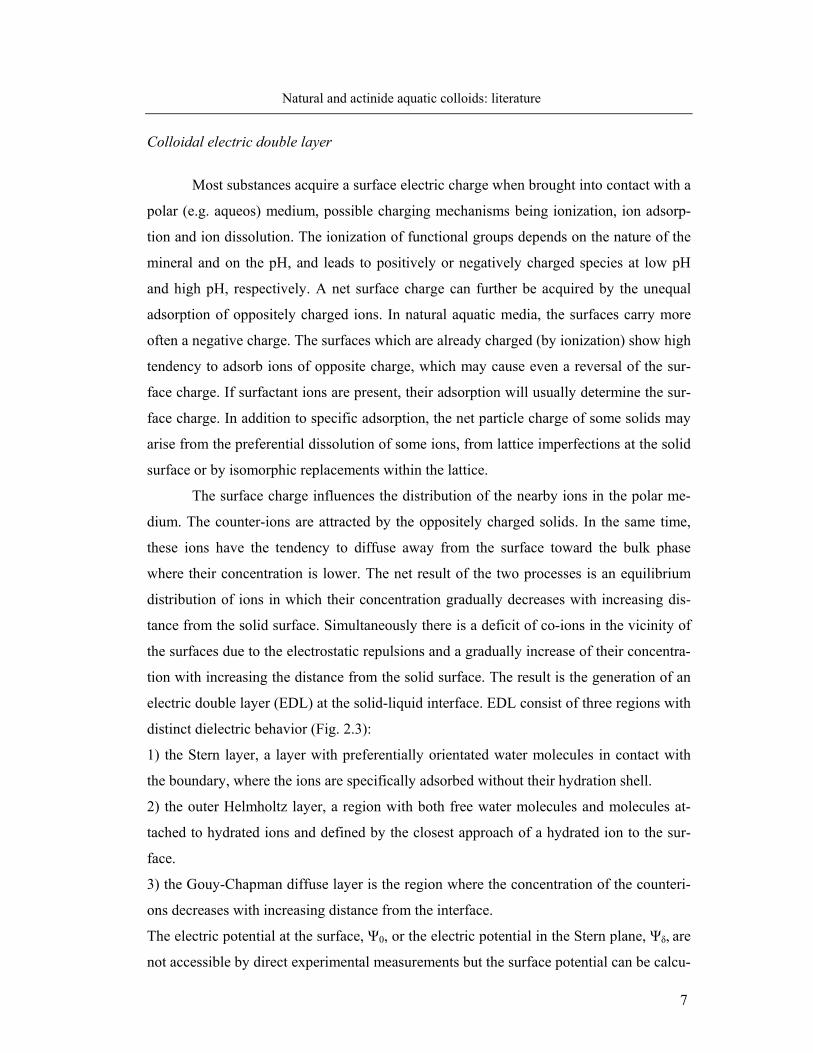
Colloidal electric double layer
Most substances acquire a surface electric charge when brought into contact with a
polar (e.g. aqueos) medium, possible charging mechanisms being ionization, ion adsorp-
tion and ion dissolution. The ionization of functional groups depends on the nature of the
mineral and on the pH, and leads to positively or negatively charged species at low pH
and high pH, respectively. A net surface charge can further be acquired by the unequal
adsorption of oppositely charged ions. In natural aquatic media, the surfaces carry more
often a negative charge. The surfaces which are already charged (by ionization) show high
tendency to adsorb ions of opposite charge, which may cause even a reversal of the sur-
face charge. If surfactant ions are present, their adsorption will usually determine the sur-
face charge. In addition to specific adsorption, the net particle charge of some solids may
arise from the preferential dissolution of some ions, from lattice imperfections at the solid
surface or by isomorphic replacements within the lattice.
The surface charge influences the distribution of the nearby ions in the polar me-
dium. The counter-ions are attracted by the oppositely charged solids. In the same time,
these ions have the tendency to diffuse away from the surface toward the bulk phase
where their concentration is lower. The net result of the two processes is an equilibrium
distribution of ions in which their concentration gradually decreases with increasing dis-
tance from the solid surface. Simultaneously there is a deficit of co-ions in the vicinity of
the surfaces due to the electrostatic repulsions and a gradually increase of their concentra-
tion with increasing the distance from the solid surface. The result is the generation of an
electric double layer (EDL) at the solid-liquid interface. EDL consist of three regions with
distinct dielectric behavior (Fig. 2.3):
1) the Stern layer, a layer with preferentially orientated water molecules in contact with
the boundary, where the ions are specifically adsorbed without their hydration shell.
2) the outer Helmholtz layer, a region with both free water molecules and molecules at-
tached to hydrated ions and defined by the closest approach of a hydrated ion to the sur-
face.
3) the Gouy-Chapman diffuse layer is the region where the concentration of the counteri-
ons decreases with increasing distance from the interface.
The electric potential at the surface, Ψ0, or the electric potential in the Stern plane, Ψδ, are
not accessible by direct experimental measurements but the surface potential can be calcu-
8
Natural and actinide aquatic colloids: literature
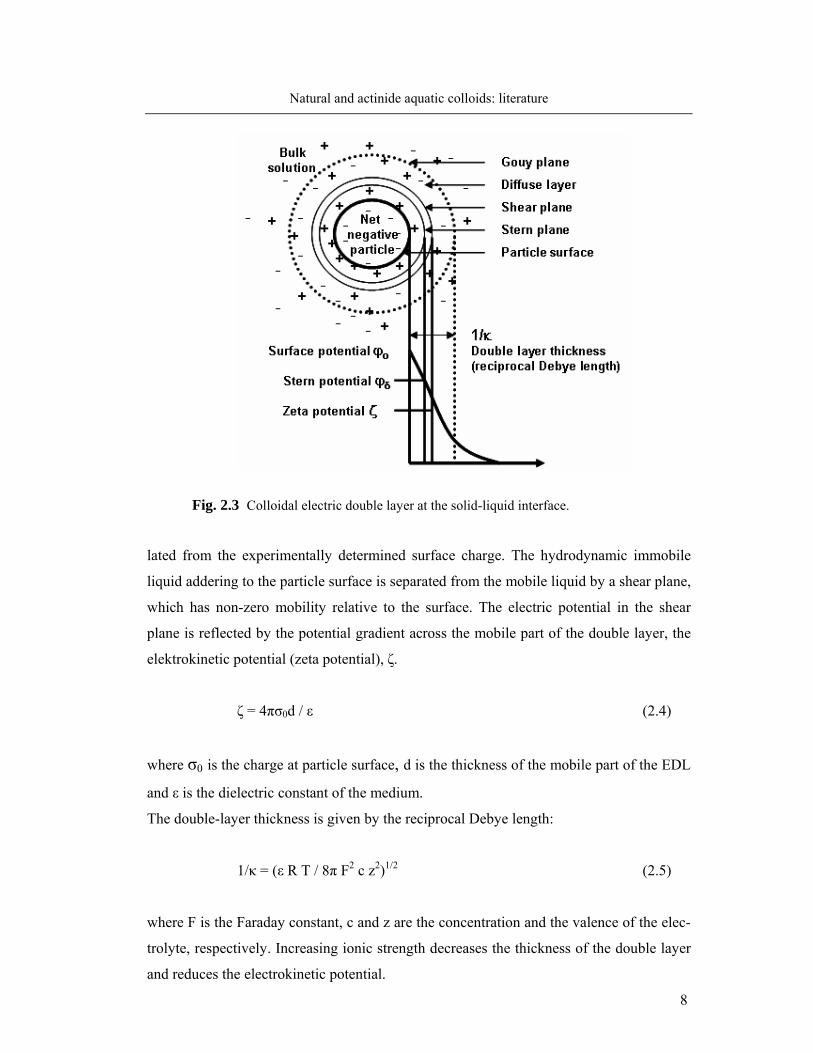
Fig. 2.3 Colloidal electric double layer at the solid-liquid interface.
lated from the experimentally determined surface charge. The hydrodynamic immobile
liquid addering to the particle surface is separated from the mobile liquid by a shear plane,
which has non-zero mobility relative to the surface. The electric potential in the shear
plane is reflected by the potential gradient across the mobile part of the double layer, the
elektrokinetic potential (zeta potential), ζ.
ζ = 4πσ0d / ε (2.4)
where σ0 is the charge at particle surface, d is the thickness of the mobile part of the EDL
and ε is the dielectric constant of the medium.
The double-layer thickness is given by the reciprocal Debye length:
1/κ = (ε R T / 8π F2 c z2)1/2 (2.5)
where F is the Faraday constant, c and z are the concentration and the valence of the elec-
trolyte, respectively. Increasing ionic strength decreases the thickness of the double layer
and reduces the electrokinetic potential.

9
Natural and actinide aquatic colloids: literature
2.1.2 Colloid stability
Brownian motion of colloids
Water molecules in permanent thermal movement hit the colloidal particles from
opposite sides. The smaller the particles, the less balanced is the molecular bombardment
and the more intensive will be the movement. A consequence of the Brownian movement
is the diffusion of colloidal particles. The first Fick’s law gives the the mass, dm, trans-
ferred across an area O, in the time interval dt, as a result of the concentration gradient,
dc/dx, when a certain phase is dispersed along the x axis.
dm/dt = - D O (dc/dx) (2.6)
where D is the diffusion coefficient. The diffusion coefficient depends on the properties of
the dispersed phase and of the dispersing medium. For colloidal particles D is related to
the friction coefficient, B, between the particles and the dispersing medium by the expres-
sion D = kB T/B. The magnitude of B depends on the dimensions and shape of the parti-
cles. For spherical particles having a radius r, when the viscosity of the medium is η, the
diffusion coefficient becomes:
D = kB T / 6πηr (2.7)
The Brownian motion is the reason of the frequent collisions between the colloidal parti-
cles. Depending upon whether the interaction forces between the particles during such
collisions are attractive or repulsive, the colloids will agglomerate or stabilize (elaborated
below).
Colloid stability: DLVO theory
The quantitative description of the interaction between particles of like charge is
given by the generally accepted DLVO (Derjaguin, Landau, Vervey und Overback) the-
ory. According to the theory, the particle interaction is modeled as two spheres approach-
ing each other until their diffuse layers inter-penetrate, the potential energy of interaction,
10
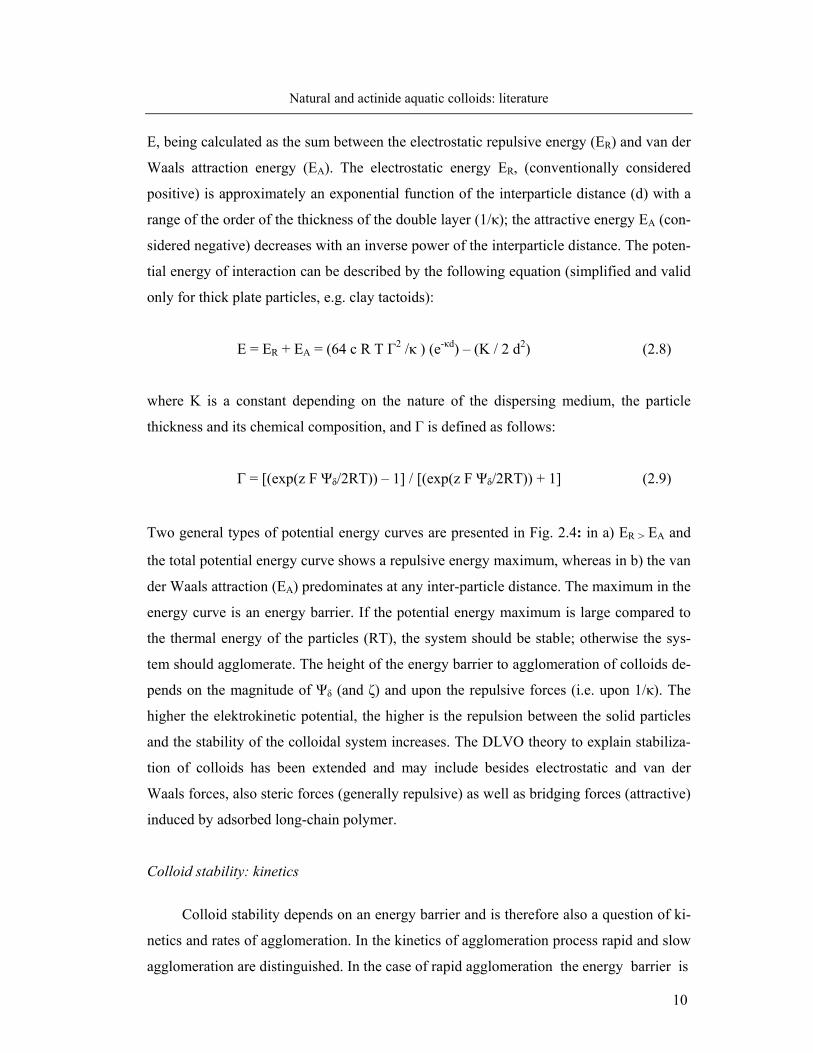
Natural and actinide aquatic colloids: literature
E, being calculated as the sum between the electrostatic repulsive energy (ER) and van der
Waals attraction energy (EA). The electrostatic energy ER, (conventionally considered
positive) is approximately an exponential function of the interparticle distance (d) with a
range of the order of the thickness of the double layer (1/κ); the attractive energy EA (con-
sidered negative) decreases with an inverse power of the interparticle distance. The poten-
tial energy of interaction can be described by the following equation (simplified and valid
only for thick plate particles, e.g. clay tactoids):
E = ER + EA = (64 c R T Г2 /κ ) (e-κd) – (K / 2 d2) (2.8)
where K is a constant depending on the nature of the dispersing medium, the particle
thickness and its chemical composition, and Г is defined as follows:
Г = [(exp(z F Ψδ/2RT)) – 1] / [(exp(z F Ψδ/2RT)) + 1] (2.9)
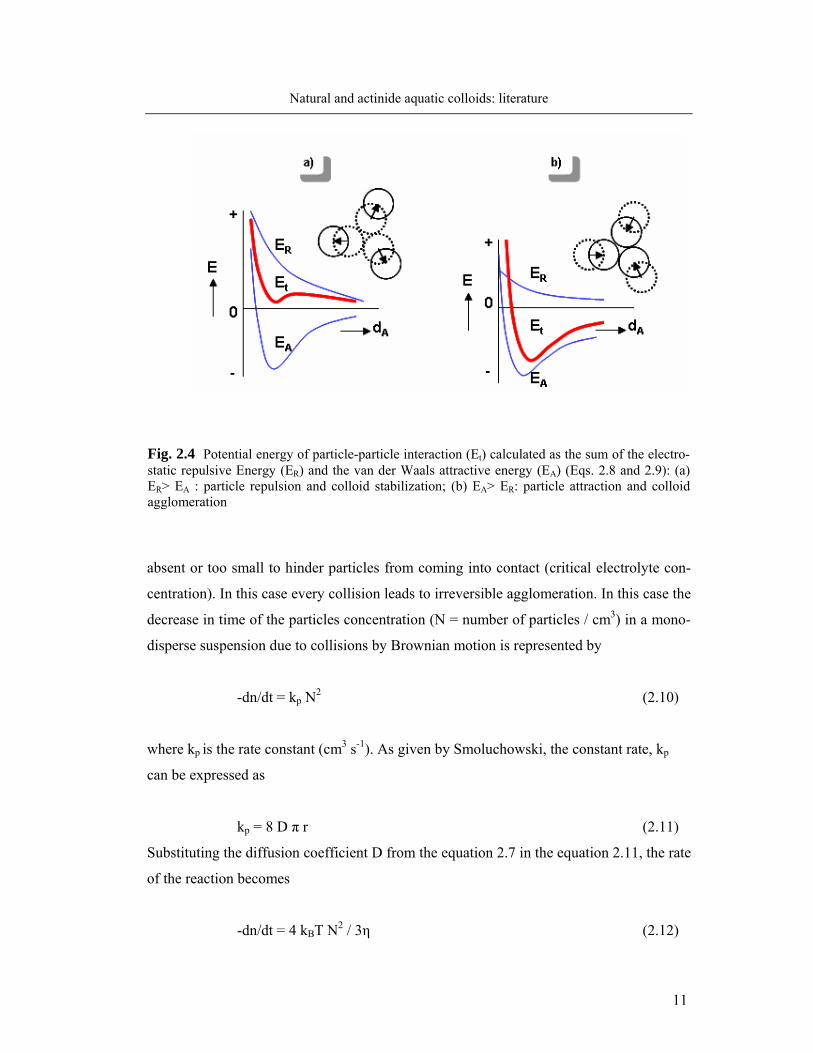
Two general types of potential energy curves are presented in Fig. 2.4: in a) ER > EA and
the total potential energy curve shows a repulsive energy maximum, whereas in b) the van
der Waals attraction (EA) predominates at any inter-particle distance. The maximum in the
energy curve is an energy barrier. If the potential energy maximum is large compared to
the thermal energy of the particles (RT), the system should be stable; otherwise the sys-
tem should agglomerate. The height of the energy barrier to agglomeration of colloids de-
pends on the magnitude of Ψδ (and ζ) and upon the repulsive forces (i.e. upon 1/κ). The
higher the elektrokinetic potential, the higher is the repulsion between the solid particles
and the stability of the colloidal system increases. The DLVO theory to explain stabiliza-
tion of colloids has been extended and may include besides electrostatic and van der
Waals forces, also steric forces (generally repulsive) as well as bridging forces (attractive)
induced by adsorbed long-chain polymer.
Colloid stability: kinetics
Colloid stability depends on an energy barrier and is therefore also a question of ki-
netics and rates of agglomeration. In the kinetics of agglomeration process rapid and slow
agglomeration are distinguished. In the case of rapid agglomeration the energy barrier is
11
Natural and actinide aquatic colloids: literature
absent or too small to hinder particles from coming into contact (critical electrolyte con-
centration). In this case every collision leads to irreversible agglomeration. In this case the
decrease in time of the particles concentration (N = number of particles / cm3) in a mono-
disperse suspension due to collisions by Brownian motion is represented by
-dn/dt = kp N2 (2.10)
where kp is the rate constant (cm3 s-1). As given by Smoluchowski, the constant rate, kp
can be expressed as
kp = 8 D π r (2.11)
Substituting the diffusion coefficient D from the equation 2.7 in the equation 2.11, the rate
of the reaction becomes
-dn/dt = 4 kBT N2 / 3η (2.12)
Fig. 2.4 Potential energy of particle-particle interaction (Et) calculated as the sum of the electro-static repulsive Energy (ER) and the van der Waals attractive energy (EA) (Eqs. 2.8 and 2.9): (a) ER> EA : particle repulsion and colloid stabilization; (b) EA> ER: particle attraction and colloid agglomeration
12
Natural and actinide aquatic colloids: literature
and it may be concluded that in monodisperse systems the rate of fast agglomeration is
independent on the size of the particles. In practice, the right hand side of the equation is
multiplied by a factor, αp, which is the fraction of collisions leading to permanent agglom-
eration. The extended Smoluchowski theory for polydisperse systems shows that the rate
of coagulation of particle with different size is much greater than the rate of coagulation
of particles of same size. The smaller particles disappear more quickly than the larger
ones.
2.2 Natural aquatic colloids in laboratory
Colloids are present in all natural waters to some extent, their amount and nature
depending on the associated geological structure. Accordingly, a wide variation appears in
their chemical composition, size distribution and number density. Aquatic colloids may be
of inorganic nature, like: clays, silica, aluminum oxide minerals, as well as hydroxides of
metal, e.g. iron, or, organic polyelectrolytes, like humic acid, with incorporation of inor-
ganic elements, depending on how the waterborne trace inorganics and organics are dis-
persed from the given geochemical composition [6, 30].
2.2.1 Aluminosilicate colloids
Aluminosilicate colloids in nature
Aluminosilicates constitute the large majority of rock and soil forming minerals in
nature, comprising clays, micas, feldspars. Clay minerals are essentially hydrous layer
aluminosilicates (phyllosilicates), which carry a permanent negative charge due to the
substitution of cations with variable valence in the phyllosilicates sheets structure, (e.g. Al
for Si and Mg, Fe for Al), charge which is balanced by the cations in the interlayer. In the
aluminosilicates structure, an additional, pH-dependent charge originates from protona-
tion/deprotonation of the –OH groups at the edges of the planes. Due to their high capac-
ity for retaining water and their cation exchange capacity, clay minerals like smectites
have been proposed as backfill material at nuclear waste disposal sites [33]. A special
type of highly hydrated, secondary aluminosilicates, are protoimogolite and imogolite,
13
Natural and actinide aquatic colloids: literature
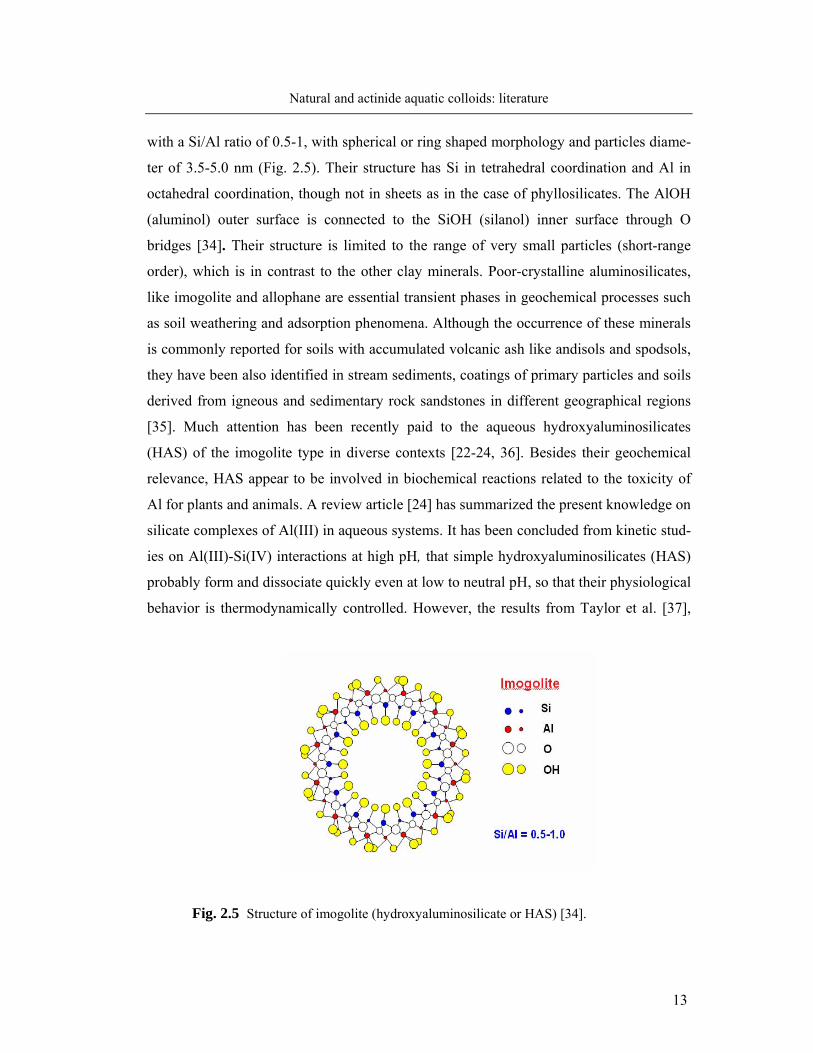
with a Si/Al ratio of 0.5-1, with spherical or ring shaped morphology and particles diame-
ter of 3.5-5.0 nm (Fig. 2.5). Their structure has Si in tetrahedral coordination and Al in
octahedral coordination, though not in sheets as in the case of phyllosilicates. The AlOH
(aluminol) outer surface is connected to the SiOH (silanol) inner surface through O
bridges [34]. Their structure is limited to the range of very small particles (short-range
order), which is in contrast to the other clay minerals. Poor-crystalline aluminosilicates,
like imogolite and allophane are essential transient phases in geochemical processes such
as soil weathering and adsorption phenomena. Although the occurrence of these minerals
is commonly reported for soils with accumulated volcanic ash like andisols and spodsols,
they have been also identified in stream sediments, coatings of primary particles and soils
derived from igneous and sedimentary rock sandstones in different geographical regions
[35]. Much attention has been recently paid to the aqueous hydroxyaluminosilicates
(HAS) of the imogolite type in diverse contexts [22-24, 36]. Besides their geochemical
relevance, HAS appear to be involved in biochemical reactions related to the toxicity of
Al for plants and animals. A review article [24] has summarized the present knowledge on
silicate complexes of Al(III) in aqueous systems. It has been concluded from kinetic stud-
ies on Al(III)-Si(IV) interactions at high pH, that simple hydroxyaluminosilicates (HAS)
probably form and dissociate quickly even at low to neutral pH, so that their physiological
behavior is thermodynamically controlled. However, the results from Taylor et al. [37],
Fig. 2.5 Structure of imogolite (hydroxyaluminosilicate or HAS) [34].
14
Natural and actinide aquatic colloids: literature
show that Al(III) may be sequestered by the oligomeric Si(IV), process which may yield
kinetically inert HAS species –indeed, their high apparent stability may reflect the slow
dissociation kinetics. This process may be physiologically more important, as the kinetic
inertness of cage or ring HAS structures, once formed, may retain Al(III) for long periods.
The inert cage aluminosilicate solutes may act merely as reservoirs for the slow hydrolytic
release of the small, active, acyclic species. The conclusions of the authors reflect not
only the very high probability that very stable aqueous aluminosilicate colloids may form
even under natural conditions but at the same time, they indicate that the current knowl-
edge regarding the mechanisms of colloid generation and stability is limited and there is
need for research. It is therefore meaningful to choose the aluminosilicates as representa-
tive examples for answering questions regarding the formation of natural aquatic colloids
as well as about their interaction with actinides.
Aluminosilicate colloids in laboratory [25-28]
As we have already seen from the theoretical considerations presented in the previ-
ous sections, inorganic aquatic colloids may form either by condensation reactions or by
dispersion from minerals. We have also seen that colloid formation and stabilization is a
very complex process depending on energy barriers and therefore not only thermodynam-
ics but also kinetic factors are involved. The most common condensation process occur-
ring in the hydrosphere is the hydrolysis of polyvalent cations (e.g. Si4+ and Al3+), the
formation of sparingly soluble hydroxides and hydrous oxides and the neoformation of
clay minerals at coprecipitation.
The key information for attaining supersaturation and thus coprecipitation of Si and
Al is derived from the thermodynamic solubility data for SiO2(am), Al(OH)3(am) and several
aluminosilicates, illustrated in Fig. 2.6. In a previous study [25, 26], the above mentioned
solubilities were calculated from literature data at constant room temperature, atmospheric
pressure and 0.03 M NaCl (background electrolyte). As can be seen in Fig. 2.6, amor-
phous Al(OH)3, silimanite and kaolinite show similar pH dependency, with minimum
solubility in the neutral pH region. Amorphous silica (SiO2) shows constant solubility
(about 2x10⁻³ M) up to pH 9, which then increases sharply through formation of
polysilicic acids. The pH range of interest, 4-9, in which colloids can form during the co-
precipitation is selected according to the low solubility region of the different aluminosili-
15
Natural and actinide aquatic colloids: literature
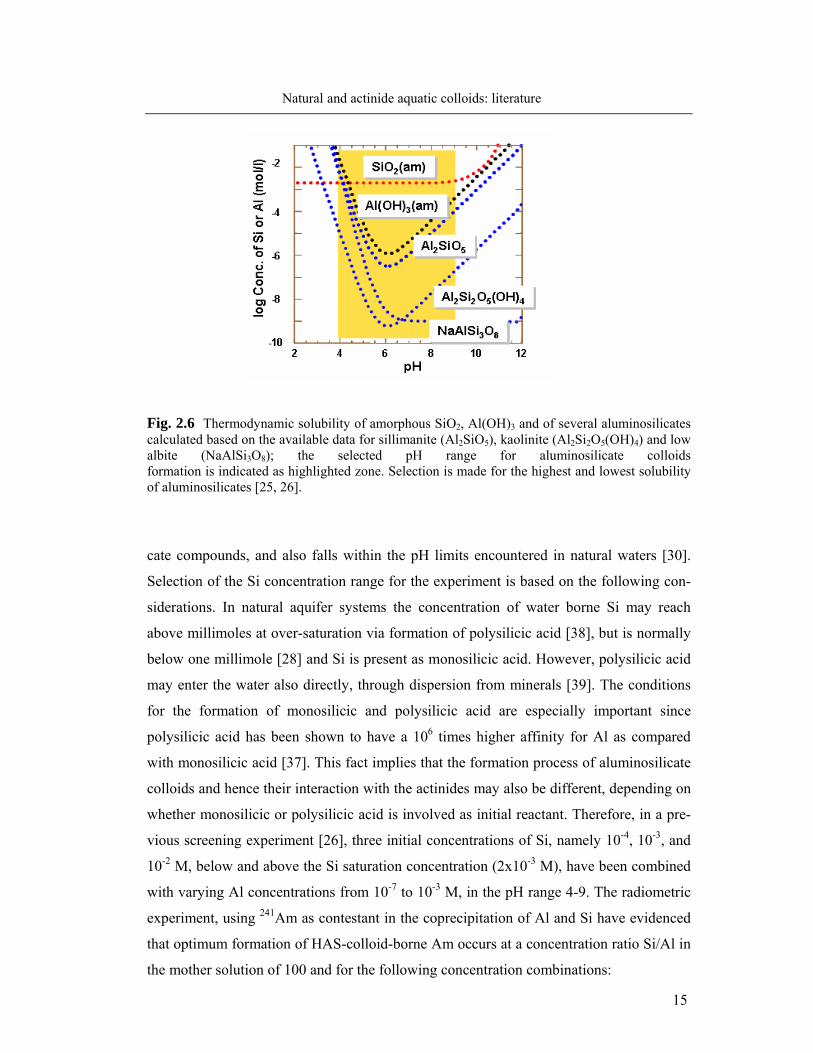
Fig. 2.6 Thermodynamic solubility of amorphous SiO2, Al(OH)3 and of several aluminosilicates calculated based on the available data for sillimanite (Al2SiO5), kaolinite (Al2Si2O5(OH)4) and low albite (NaAlSi3O8); the selected pH range for aluminosilicate colloids formation is indicated as highlighted zone. Selection is made for the highest and lowest solubility of aluminosilicates [25, 26].
cate compounds, and also falls within the pH limits encountered in natural waters [30].
Selection of the Si concentration range for the experiment is based on the following con-
siderations. In natural aquifer systems the concentration of water borne Si may reach
above millimoles at over-saturation via formation of polysilicic acid [38], but is normally
below one millimole [28] and Si is present as monosilicic acid. However, polysilicic acid
may enter the water also directly, through dispersion from minerals [39]. The conditions
for the formation of monosilicic and polysilicic acid are especially important since
polysilicic acid has been shown to have a 106 times higher affinity for Al as compared
with monosilicic acid [37]. This fact implies that the formation process of aluminosilicate
colloids and hence their interaction with the actinides may also be different, depending on
whether monosilicic or polysilicic acid is involved as initial reactant. Therefore, in a pre-
vious screening experiment [26], three initial concentrations of Si, namely 10-4, 10-3, and
10-2 M, below and above the Si saturation concentration (2x10⁻³ M), have been combined
with varying Al concentrations from 10-7 to 10-3 M, in the pH range 4-9. The radiometric
experiment, using 241Am as contestant in the coprecipitation of Al and Si have evidenced
that optimum formation of HAS-colloid-borne Am occurs at a concentration ratio Si/Al in
the mother solution of 100 and for the following concentration combinations:
16
Natural and actinide aquatic colloids: literature
I: [Si]: 10-3 M (0.7 x saturation) + [Al]: 10-5 M ([Si]/[Al] = 100) II: [Si]: 10-2 M (6.4 x saturation) + [Al]: 10-4 M ([Si]/[Al] = 100) The synthetic hydroxy-aluminosilicate colloids, generated by coprecipitation in the neu-
tral pH range as described above, have been characterized for particle number density and
morphology by several techniques: LIBD (Laser induced break-down detection) AFM
(Atomic force microscopy) and SEM-EDX (Scanning electron microscopy coupled with
X-ray energy dispersive spectrometry). The HAS colloids prepared out of mother solu-
tions with Si/Al atomic ratio of about 100 appear to be similar to the natural aquatic col-
loids of protoimogolite/allophane type (precursors of imogolite) in respect with the parti-
cle size, shape and Si/Al atomic ratio. The characteristics of the synthetic HAS colloids
[26] are summarized below.
Present system Natural system
Particle size 10-50 nm(LIBD) very often < 50 nm
5-10 nm height (AFM)
10-50 nm length (AFM)
Number density 1011 - 1014 particles/L (LIBD) 108 – 1014 particles/L
Si/Al ratio 0.7 – 1.2 imogolite 0.5-1
(AFM, SEM-EDX)
Taking into account the atomic Si/Al ratio of the HAS colloids of approximately one,
their formation from polysilicic acid has been presumed as:
n Al(OH)3-yy + SinOn-1(OH)2n+2 ↔ AlnSinO4n+2-x(OH)x
x-n-4 + (7-ny-x)H+ + (2n-y-1)H2O
In the equation , the y-values varies from -1 to +3 following the degree of Al hydrolysis in
the present experimental pH range (4-9) and the x-value determines the anionic charge of
the HAS colloids. The predominant silicic acid species appears to be H4SiO4, unless Si
concentration is oversaturated and therefore a neutral polysilicic acid species has been
proposed as reactant for the above formulated reaction. As the precise structure analysis
of the HAS colloids is not possible due to the very low mass concentration the n-value re-
17
Natural and actinide aquatic colloids: literature
mains unknown. The surface characterization of the HAS colloids has been performed by
determining of the zero point of charge (pHpzc). The colloids prepared from a mixture of
10-3 M Si and 10-4 M Al show a pHpzc of 3.53 ± 0.5 [27], which means that the HAS col-
loids have a negatively charged surface in the pH range of interest (4-9) and therefore
high potential to migrate with the water flow with little interaction with the geomatrix.
2.2.2 Humate Colloids
Humic acid as colloids in nature
Beside the inorganic colloids, humic acids (HA) are always present to some extent
in aquatic environments [1, 3, 6,] and have been shown to play an important role in the
sequestration and mobilization of trace metals [11, 40, 41]. Humic acids are operationally
defined from the extraction procedure of humic substances (HS) as the insoluble fraction
at acidic pH (pH < 2) [42]. Humic substances are thought to be produced by a combina-
tion of degradation and condensation reactions of plant breakdown products, with an im-
portant role of bacteria [43-45]. HS are composed of heterogeneous components with a
wide range of molecular weights, size and different chemical moieties. The humic skele-
ton, consisting in mainly aromatic cycles covalently linked with aliphatic moieties, is
highly substituted with oxygen containing functional groups: carboxylic and phenolic as
most important together with ketonic, enolic and amino groups. In the pH range of natural
waters (pH 4-9), humic acids are negatively charged and present mainly as colloidal spe-
cies, with particle diameter of 4-400 nm [7, 45-47], while their distribution of molecular
weights is reported to vary between 500 to 100000 Da [44, 45, 48]. In surface waters the
humic acid concentration varies between 1-10 mg/L [49], but in natural groundwater con-
centrations of 80-100 mg/L may be reached [7, 46]. Apart from their colloidal size, the
influence of humic acid on the migration of actinides in the aquatic environment arises
from its ability to bind all metals with charge z ≥ +2, and to modify the surface properties
and reactivity of minerals [29, 41, 49]. The reactive nature of humic acid is mainly the
consequence of the acidic functional groups of the humic macromolecule, giving rise to
multiple binding possibilities (electrostatic and specific, including chelate formation) as
compared with the simple ligands [10, 20]. For metal complexation, the functional groups
18
Natural and actinide aquatic colloids: literature
involved are primary carboxylic, as pointed out by spectroscopic measurements (EXAFS)
[50], phenolic groups being expected to have contribution at pH above neutral [51, 52].
The colloidal stability of the clay minerals surfaces may increase in the presence
of sorbed natural organic matter [29, 53] due to electrostatic or steric effects [54]. Several
reactions have been proposed to describe the interaction reactions between the humic ac-
ids and minerals: electrostatic to cationic sites of the mineral surface, hydrogen bonds,
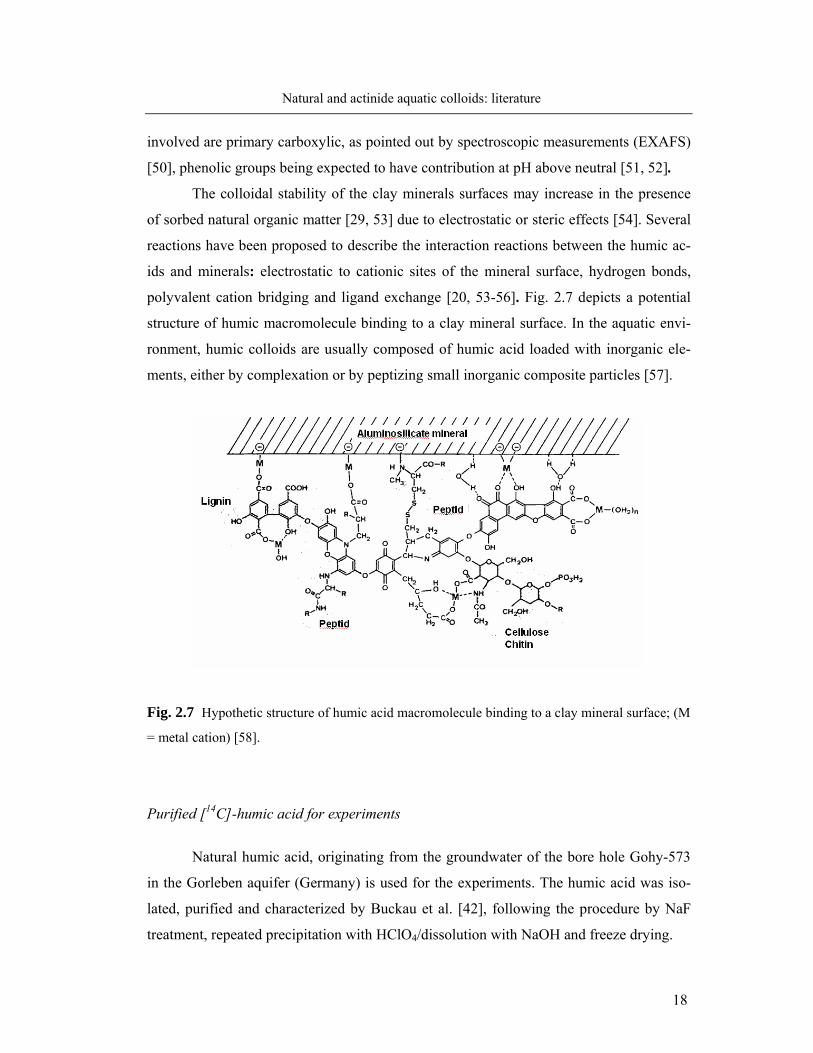
polyvalent cation bridging and ligand exchange [20, 53-56]. Fig. 2.7 depicts a potential
structure of humic macromolecule binding to a clay mineral surface. In the aquatic envi-
ronment, humic colloids are usually composed of humic acid loaded with inorganic ele-
ments, either by complexation or by peptizing small inorganic composite particles [57].
Fig. 2.7 Hypothetic structure of humic acid macromolecule binding to a clay mineral surface; (M
= metal cation) [58].
Purified [14C]-humic acid for experiments
Natural humic acid, originating from the groundwater of the bore hole Gohy-573
in the Gorleben aquifer (Germany) is used for the experiments. The humic acid was iso-
lated, purified and characterized by Buckau et al. [42], following the procedure by NaF
treatment, repeated precipitation with HClO4/dissolution with NaOH and freeze drying.
19
Natural and actinide aquatic colloids: literature
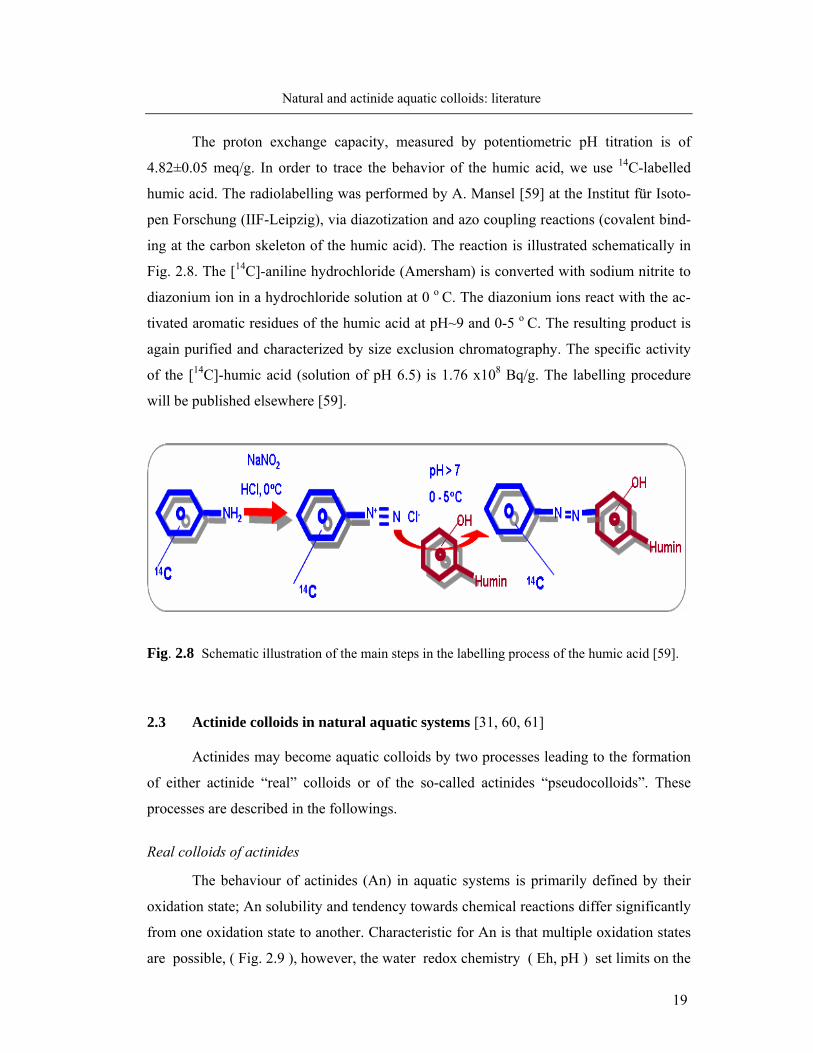
The proton exchange capacity, measured by potentiometric pH titration is of
4.82±0.05 meq/g. In order to trace the behavior of the humic acid, we use 14C-labelled
humic acid. The radiolabelling was performed by A. Mansel [59] at the Institut für Isoto-
pen Forschung (IIF-Leipzig), via diazotization and azo coupling reactions (covalent bind-
ing at the carbon skeleton of the humic acid). The reaction is illustrated schematically in
Fig. 2.8. The [14C]-aniline hydrochloride (Amersham) is converted with sodium nitrite to
diazonium ion in a hydrochloride solution at 0 o C. The diazonium ions react with the ac-
tivated aromatic residues of the humic acid at pH~9 and 0-5 o C. The resulting product is
again purified and characterized by size exclusion chromatography. The specific activity
of the [14C]-humic acid (solution of pH 6.5) is 1.76 x10⁸ Bq/g. The labelling procedure
will be published elsewhere [59].
Fig. 2.8 Schematic illustration of the main steps in the labelling process of the humic acid [59].
2.3 Actinide colloids in natural aquatic systems [31, 60, 61]
Actinides may become aquatic colloids by two processes leading to the formation
of either actinide “real” colloids or of the so-called actinides “pseudocolloids”. These
processes are described in the followings.
Real colloids of actinides
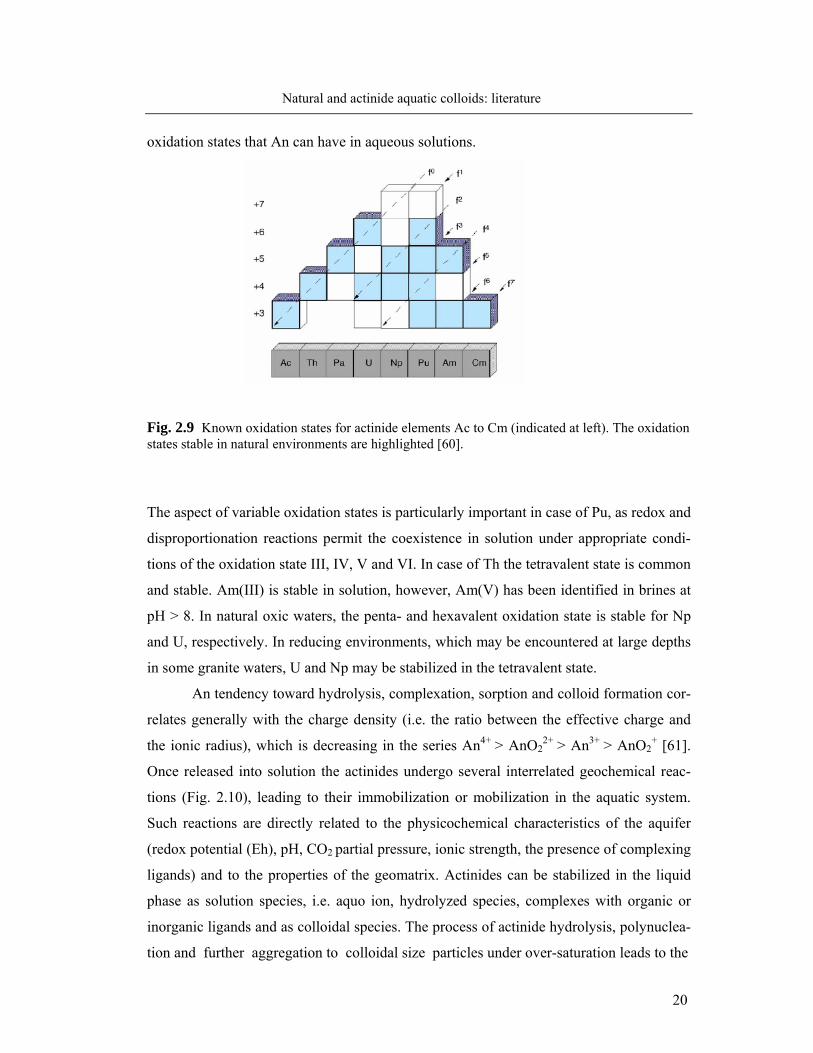
The behaviour of actinides (An) in aquatic systems is primarily defined by their
oxidation state; An solubility and tendency towards chemical reactions differ significantly
from one oxidation state to another. Characteristic for An is that multiple oxidation states
are possible, ( Fig. 2.9 ), however, the water redox chemistry ( Eh, pH ) set limits on the
20
Natural and actinide aquatic colloids: literature
oxidation states that An can have in aqueous solutions.
Fig. 2.9 Known oxidation states for actinide elements Ac to Cm (indicated at left). The oxidation states stable in natural environments are highlighted [60].
The aspect of variable oxidation states is particularly important in case of Pu, as redox and
disproportionation reactions permit the coexistence in solution under appropriate condi-
tions of the oxidation state III, IV, V and VI. In case of Th the tetravalent state is common
and stable. Am(III) is stable in solution, however, Am(V) has been identified in brines at
pH > 8. In natural oxic waters, the penta- and hexavalent oxidation state is stable for Np
and U, respectively. In reducing environments, which may be encountered at large depths
in some granite waters, U and Np may be stabilized in the tetravalent state.
An tendency toward hydrolysis, complexation, sorption and colloid formation cor-
relates generally with the charge density (i.e. the ratio between the effective charge and
the ionic radius), which is decreasing in the series An4+ > AnO22+ > An3+ > AnO2
+ [61].
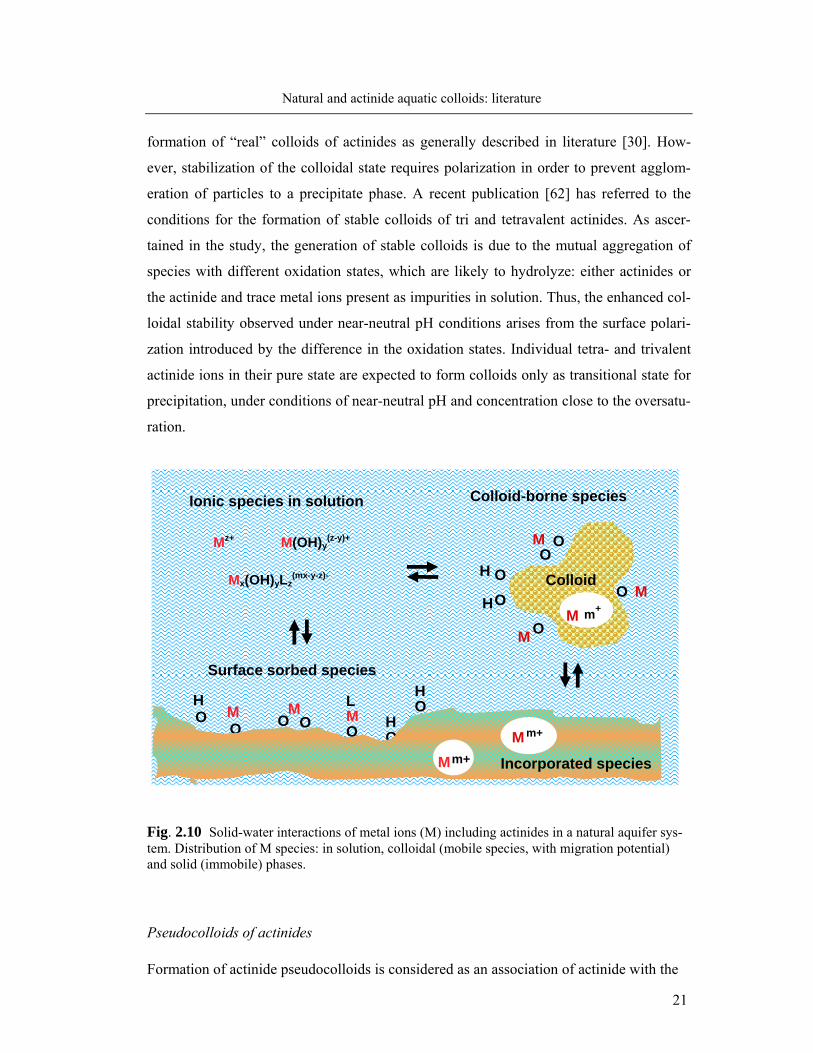
Once released into solution the actinides undergo several interrelated geochemical reac-
tions (Fig. 2.10), leading to their immobilization or mobilization in the aquatic system.
Such reactions are directly related to the physicochemical characteristics of the aquifer
(redox potential (Eh), pH, CO2 partial pressure, ionic strength, the presence of complexing
ligands) and to the properties of the geomatrix. Actinides can be stabilized in the liquid
phase as solution species, i.e. aquo ion, hydrolyzed species, complexes with organic or
inorganic ligands and as colloidal species. The process of actinide hydrolysis, polynuclea-
tion and further aggregation to colloidal size particles under over-saturation leads to the
21
Natural and actinide aquatic colloids: literature
formation of “real” colloids of actinides as generally described in literature [30]. How-
ever, stabilization of the colloidal state requires polarization in order to prevent agglom-
eration of particles to a precipitate phase. A recent publication [62] has referred to the
conditions for the formation of stable colloids of tri and tetravalent actinides. As ascer-
tained in the study, the generation of stable colloids is due to the mutual aggregation of
species with different oxidation states, which are likely to hydrolyze: either actinides or
the actinide and trace metal ions present as impurities in solution. Thus, the enhanced col-
loidal stability observed under near-neutral pH conditions arises from the surface polari-
zation introduced by the difference in the oxidation states. Individual tetra- and trivalent
actinide ions in their pure state are expected to form colloids only as transitional state for
precipitation, under conditions of near-neutral pH and concentration close to the oversatu-
ration.
Fig. 2.10 Solid-water interactions of metal ions (M) including actinides in a natural aquifer sys-tem. Distribution of M species: in solution, colloidal (mobile species, with migration potential) and solid (immobile) phases.
Pseudocolloids of actinides
Formation of actinide pseudocolloids is considered as an association of actinide with the
MO
MO O
MO
O
HO
O HO
M m+
M O
H O
HOColloid
Ionic species in solution
Surface sorbed species
Colloid-borne species
LMO
O MMx(OH)yLz
(mx-y-z)-
Mz+ M(OH)y(z-y)+
Mm+M m+
Incorporated species
H
22
Natural and actinide aquatic colloids: literature
aquatic colloids, either of inorganic or organic nature. The process includes co-nucleation,
ion exchange, complexation or isomorphic substitution of a lattice component by actinide.
Numerous studies have focused on the interaction of actinides with inorganic [15, 16, 64,
65] and humic colloids [7, 49, 65-74] under various conditions (pH, I, component concen-
tration), and on the stability [21, 71] and migration of such actinide pseudocolloids [18,
19, 64]. Other studies have concentrated on ternary systems, investigating the influence of
humic acid on the actinide interaction with mineral colloids, [49, 55, 68, 75, 76]. Despite
the extensive investigations, the underlying mechanisms for the generation of aquatic col-
loids and of the colloid-borne actinides have not been yet well understood.
Colloid-facilitated migration has been shown to be particularly important for con-
taminant species with high charge density, e.g. M4+ [13]. As such species have low solu-
bility in absence of complexation ligands, and strong sorption properties towards mineral
surfaces like rocks, they have been initially considered to be easily immobilized in envi-
ronment. Providing the colloids are mobile since in natural waters solid surfaces are gen-
erally negatively charged, and the interaction of An with the colloids is strong, the An will
have high susceptibility to be transported along with the water flow with little retardation.
2.4 Methods for the analysis of actinide colloids
Analysis of actinide aquatic colloids requires information regarding the conditions
of formation of colloids themselves, colloid concentration and morphology and, on the
nature of the actinide-colloid binding. Investigations of the geochemical behavior of spar-
ingly soluble actinides (usually below 10-6 M) in the presence of low concentrations (ppb
range or less) of small aquatic colloids (< 50 nm) require sophisticated methods which
have been developed in the last decades [8, 77]. Due to the complex chemical and physi-
cal characteristics of the actinide-colloidal systems and of the limitations of the analytical
methods, the combination of several (complementary) methods is necessary in order to
have more complete information about both physical and chemical speciation.
2.4.1 Detection and chemical speciation of colloid-borne actinides
We present in the followings a brief description of the methods that have been
used to characterize the HAS colloidal system and of colloid-borne-actinide species.
23
Natural and actinide aquatic colloids: literature
Filtration / ultrafiltration and radiometry
Filtration and ultrafiltration are classical size fractionation techniques. These are
non-destructive methods, which enable the separation of particulate matter (usually with
diameter >1000 nm) from the colloidal particles (diameter between 1-1000 nm) and from
the dissolved species. The combination of filtration using a variety of nominal filter pore
sizes with the radiometric detection of actinides is a primary tool for the investigation of
natural aquatic colloids.
Liquid Scintillation Counting (LSC) is a suitable technique for the analysis of al-
pha and beta emitters, allowing much higher detection efficiency as compared to α- or γ-
spectrometry using semiconductor detectors. Alpha emitters can be detected with almost
100% efficiency, whereas for the beta emitters having the maximum decay energy, Emax
>156 keV (C-14), the detection efficiency is higher than 96 %. Another advantage is that
LSC enables the simultaneous measurement of an alpha and beta emitting radionuclide in
the sample. The partial overlap between the beta tailing of high energy beta emitters and
the alpha spectrum can be separated manually, by choosing appropriate counting win-
dows, or electronically, by taking the advantage of the Pulse Decay Analysis which sepa-
rates the alpha and beta counts based on their different decay time [78]. The principle of
the liquid scintillation counting is based on the conversion of the decay energy of the
emitting radionuclide to light photons, by the means of a scintillation cocktail, which is
mixed with the liquid sample. The intensity of the scintillation is a function of the energy
deposited in the scintillator. A photomultiplier converts the light photons to photoelec-
trons which are further amplified and the electrical pulses are registered as counts. The
counts accumulated during this process are sorted into separate channels, with the ampli-
tude of the signal determining the energy channel into which the counts are sorted.
Spectroscopic speciation
Several spectroscopic techniques have been developed for investigations of acti-
nides speciation at molecular level, information which is necessary for macroscopic pre-
dictions. Due to the difference in physical and chemical properties among the actinides,
no single spectroscopic method can adequately probe all actinides [8]. Among the con-
24
Natural and actinide aquatic colloids: literature
ventional techniques, the absorption spectroscopy (UV-VIS-NIR) on the transitions within
the 5 f electron shell has been used to characterize the oxidation states and complexation
of actinides. The spectroscopic resolution of actinides transition bands is high, but the in-
tensity is very weak. Special methods, making use of the high intensities of laser radiation
sources have been developed for speciation of trace level actinides, which are expected in
natural waters. The enhancement of sensitivity is attained by detection of different relaxa-
tion processes of the photon excited states (Thermal lensing spectroscopy, Photoacoustic
spectroscopy, Time-resolved laser induced fluorescence), instead of transmission as in the
case of conventional absorption spectroscopy. Another powerful technique providing in-
formation at molecular level on actinide speciation is the synchrotron-based X-ray absorp-
tion spectroscopy.
Time-resolved laser florescence spectroscopy and X-ray absorption spectroscopy
are used in the present study in order to investigate the bonding state of the actinide in
aluminosilicate solutions. A description of the principle is given in the following.
Time-resolved laser florescence spectroscopy (TRLFS) [33, 79-81] is most sensi-
tive for the chemical speciation of actinides. The method is based on the selective excita-
tion combined with selective time-resolved measurements of the florescence emission.
However, the method is limited to the elements with fluorescence emission, to which be-
long only Cm(III), Am(III), Pa(IV) and U(VI) from the actinides. Speciation of Cm (III)
in aquatic environment is possible in the nanomolar concentration range. The fluorescence
emission spectrum of the aqueous uranyl ion is complex [82] and several ligands like hu-
mic acids cause strong quenching of the uranyl florescence limiting somehow the applica-
bility to natural systems.
The actinide of interest is excited at prominent absorption wavelength. Following
the absorption of light, the electron is promoted to a higher energy level. The relaxation
process, in which the electron returns to the ground state, may take place by both non-
radiative emission (energy is dissipated as heat) and emission of light. In aqueous solu-
tion, the dominating non-radiative decay occurs via energy transfer to excited vibrational
states of the surrounding ligands, like OH vibrations of the coordinated H2O or OH-.
Spectroscopic information is derived from the excitation and emission spectra and
from the fluorescence life time (reciprocal of the fluorescence decay rate). An empirical
relationship correlates the fluorescence decay rate with the number of water molecules in
the coordination sphere of Cm(III) ): n(H2O) = 0.65*kobs-0.88, where kobs is the decay rate
25
Natural and actinide aquatic colloids: literature
of the fluorescence (ms-1) and n(H2O) is the number of coordinated water molecules [33,
79, 80]. Based on this correlation structural information is gained from experimentally
determined life times of various Cm species. The spectral shifts (changes in the position
of the emission peak) and eventually splitting of the emissions band are indications about
changes in the ligand field. TRLFS has been extensively used to investigate the complexa-
tion of Cm or Am with various ligands, including humic acids as well as its interaction
with minerals [16, 33, 67, 83]. Formation of inner-sphere complexes is accompanied by a
red-shift in the fluorescence emission of Cm and an increase in the florescence emission
life time. Sensitized TRLFS, that has been previously applied for studying the complexa-
tion of Cm(III) with humic acids [66, 67, 79], is based on the energy transfer from the
photon excited organic chromophores to the complexed f-element ion, which is then able
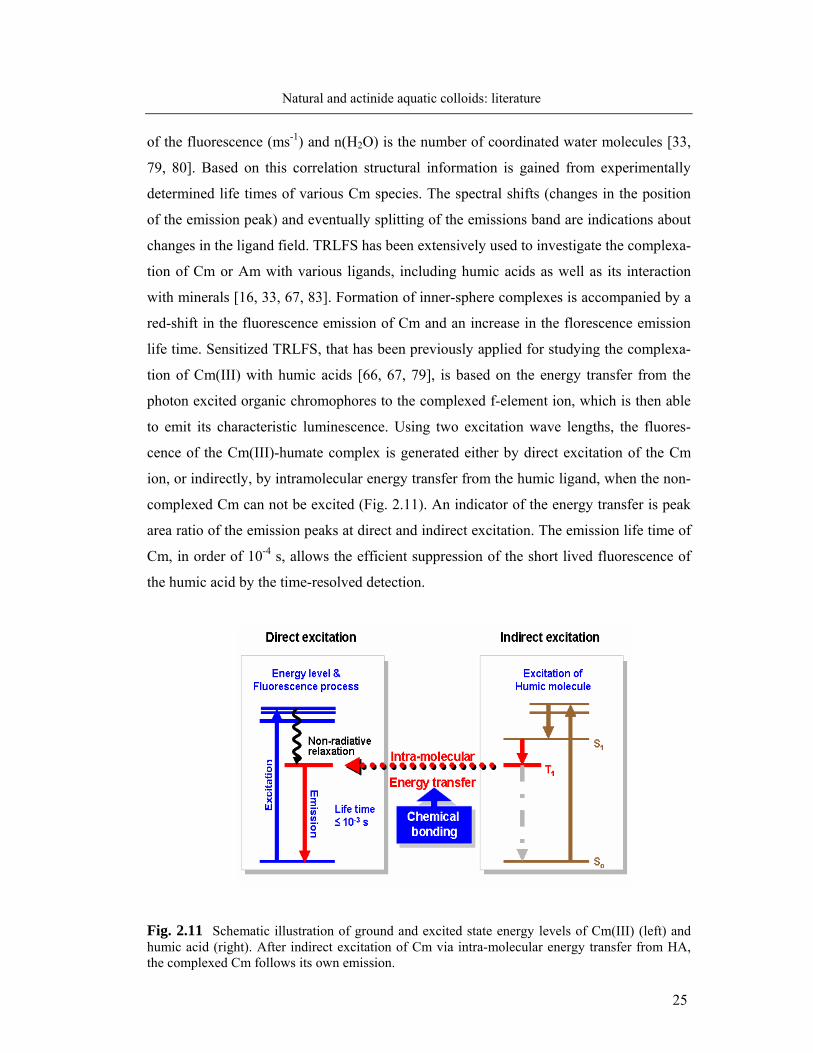
to emit its characteristic luminescence. Using two excitation wave lengths, the fluores-
cence of the Cm(III)-humate complex is generated either by direct excitation of the Cm
ion, or indirectly, by intramolecular energy transfer from the humic ligand, when the non-
complexed Cm can not be excited (Fig. 2.11). An indicator of the energy transfer is peak
area ratio of the emission peaks at direct and indirect excitation. The emission life time of
Cm, in order of 10-4 s, allows the efficient suppression of the short lived fluorescence of
the humic acid by the time-resolved detection.
Fig. 2.11 Schematic illustration of ground and excited state energy levels of Cm(III) (left) and humic acid (right). After indirect excitation of Cm via intra-molecular energy transfer from HA, the complexed Cm follows its own emission.
26
Natural and actinide aquatic colloids: literature
Synchrotron-based X-ray absorption spectroscopy (XAS) [83, 84, 85] is a non-
destructive technique, providing average information at a molecular level about the oxida-
tion state, local structure, and the identity of neighbors in the first few coordination
spheres (up to 5-6 Å) surrounding a specific absorbing element. Since XAS does not re-
quire long-range order or crystalline structures, it is particularly useful for the investiga-
tion of the actinide speciation in solution, amorphous precipitates or colloidal compounds,
which cannot be characterized with X-ray diffraction. By means of XAS technique, acti-
nides can be investigated at concentrations down to tenths of a mili molar level. The
neighbor type can be determined within Z ± 1, and the interatomic distances can be ob-
tained within ± 0.02 Å. Coordination numbers are determined with less precision, within
20-25 %.
In an XAS experiment one measures the absorption of the X-ray in a sample as a
function of the incident energy E = hν. The absorption for a given sample length x, is
given by the Lambert-Beer law: µ(E) = ln(I)/dx = ln[ I0(E)/I1(E)], where I0 and I1 repre-
sent the intensity of the incident and the transmitted photon, respectively. The absorption
coefficient, µ, generally varies smoothly with energy but also shows several regions
where it sharply increases. These regions are known as absorption edges. Absorption
edges are element specific and correspond to the transition of a core electron to higher
energy valence and continuum states via the photoelectric effect. The exact position of an
absorption edge depends on the oxidation state of the absorbing element and its shape on
the specific coordination. The LIII absorption edges for actinides arise from the dipole al-
lowed 2p→6d electron transitions. The X-ray absorption spectrum is divided into two re-
gions: the X-ray absorption near-edge structure (XANES), the region usually within about
40 eV of the main absorption edge, and the extended X-ray absorption fine structure
(EXAFS), which is the oscillating part of the spectra ranging from about 30 eV to about
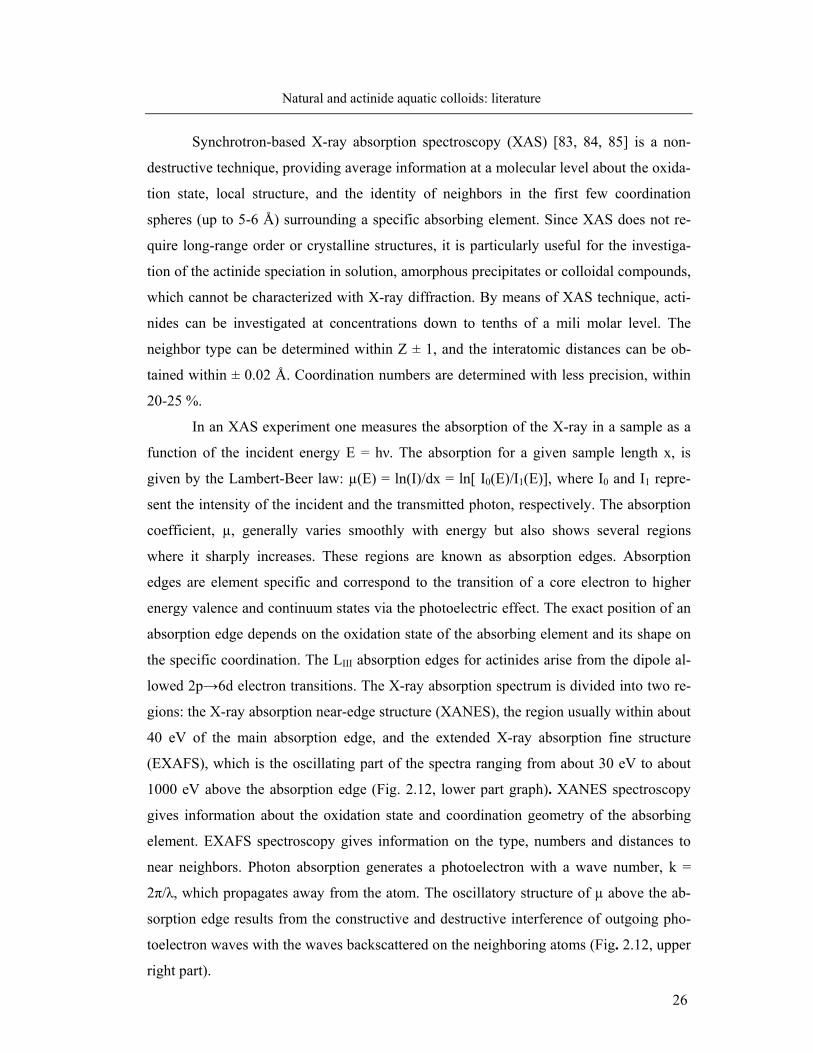
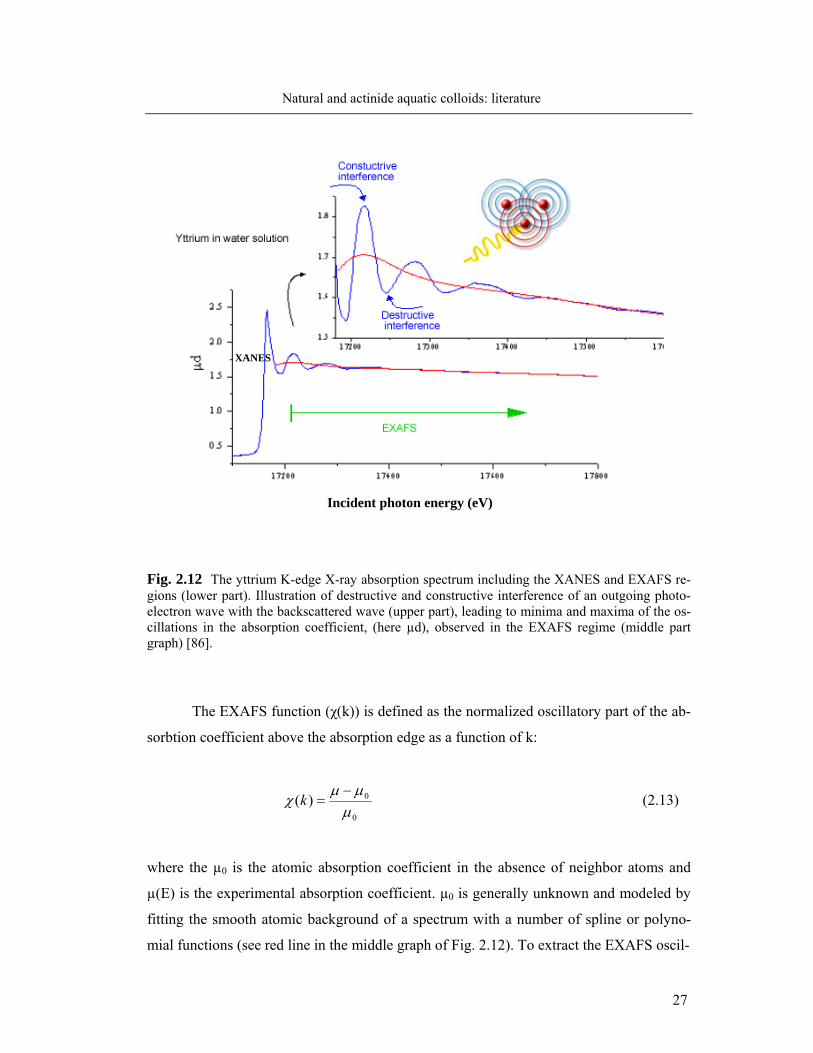
1000 eV above the absorption edge (Fig. 2.12, lower part graph). XANES spectroscopy
gives information about the oxidation state and coordination geometry of the absorbing
element. EXAFS spectroscopy gives information on the type, numbers and distances to
near neighbors. Photon absorption generates a photoelectron with a wave number, k =
2π/λ, which propagates away from the atom. The oscillatory structure of µ above the ab-
sorption edge results from the constructive and destructive interference of outgoing pho-
toelectron waves with the waves backscattered on the neighboring atoms (Fig. 2.12, upper
right part).
27
Natural and actinide aquatic colloids: literature
Incident photon energy (eV)
Fig. 2.12 The yttrium K-edge X-ray absorption spectrum including the XANES and EXAFS re-gions (lower part). Illustration of destructive and constructive interference of an outgoing photo-electron wave with the backscattered wave (upper part), leading to minima and maxima of the os-cillations in the absorption coefficient, (here µd), observed in the EXAFS regime (middle part graph) [86].
The EXAFS function (χ(k)) is defined as the normalized oscillatory part of the ab-
sorbtion coefficient above the absorption edge as a function of k:
0
0)(μ
μμχ
−=k (2.13)
where the µ0 is the atomic absorption coefficient in the absence of neighbor atoms and
µ(E) is the experimental absorption coefficient. µ0 is generally unknown and modeled by
fitting the smooth atomic background of a spectrum with a number of spline or polyno-
mial functions (see red line in the middle graph of Fig. 2.12). To extract the EXAFS oscil-
XANES
28
Natural and actinide aquatic colloids: literature
lations first the energy axis is converted to the photoelectron wave number k,
k= 20 )(2
h
EEme − (2.14)
where me is the electron mass, ħ is Plank’s constant divided by 2п. The kinetic energy of
the photoelectron is given by the difference between the energy of the incident X-ray (E)
and the ionization energy (E0). The isolated χ(k) is often weighted with kn, with n=1-3.
This accents the oscillations at higher k, where they are considerably dampened (particu-
larly of low Z elements). After the EXAFS data are converted to k space, the fine struc-
ture is related directly to the sum of dampened sinusoidal oscillations from n coordination
shells. Under the assumption that the photoelectron can be approximated by a plane wave
and the sample has a minimum of disorder, the analytical expression for the EXAFS sig-
nal, χ(k), is given by the equation (2.15):
)),(2sin(),()(1
22
)(/21
20 22
RkkReR
ekfNlk
Sk ii
n
i
k
i
kR
ii
i
φπχ σλ
+= ∑=
−−
− (2.15)
where the sum is from a contribution of each spherical shell, i of Ni equivalent neighbor-
ing atoms at a distance Ri from the absorbing atom. fi (k, π) is the backscattering ampli-
tude function for the neighboring atom type. φ (k, R) is the total phase shift of the photo-
electron. S20, the amplitude reduction factor, is introduced to describe effects of multielec-
tron excitations. l (the angular momentum quantum number), λ(k) (the mean free path
length of the photoelectron), and σ2 (Debye-Waller factor) is the average mean square
displacement from the mean bond length. The functions fi (k) and φ (k, R) are dependent
on the backscatterer type. This dependency allows identification of the type of elements
comprising a coordination shell. These functions are unknown and must be extracted em-
pirically from EXAFS data of reference compounds with known structure or theoretically
calculated. The EXAFS oscillations are Fourier transformed in order to separate the con-
tribution of each individual shell from k-space into R space. In order to obtain quantitative
information on the structure environment of the absorbing atom, either χ(k) or the Fourier
transformed data are fitted to the EXAFS equation (2.15).
29
Natural and actinide aquatic colloids: literature
EXAFS spectroscopy requires an intense polychromatic X-ray radiation and the
most suitable light source is a synchrotron radiation from an electron or positron storage
ring. The synchrotron radiation has a continuous band of wavelengths and therefore, to
record a spectrum, an appropriate double-crystal monochromator, using Bragg diffraction
is used to select and vary the wavelength around the E0 of the element of interest. An ex-
perimental set-up for the XAS is illustrated schematically in Fig. 8.1 (Appendix). To re-
cord a spectrum, measurements can be carried-out using the transmission detection, by
measuring the photon intensity in front of the sample (I0) and behind the samples (I1) at
specified energies. Another possibility is detection of proportional secondary processes
which occur when atoms relax following inner-shell excitation such as fluorescence pho-
ton emission. Fluorescence detection is required for dilute samples, i.e., where the acti-
nide concentration is less than around 1% and for samples which are totally absorbing or
impermeable for X-rays.
2.4.2 Quantification and characterization of colloids [7, 8, 87]
Colloidal systems show broad size and concentration distributions and one single
method can generally not cover the whole range with adequate sensitivity. Due to the sus-
ceptibility of the colloidal systems to disturbance, the non-invasive investigation methods
are desirable. Direct methods for the quantification of aquatic colloids are based on the
dynamic or static light scattering using laser sources like Photon Correlation Spectroscopy
(PCS) or Single Particle Counting (SPC). Intensity of the scattered light decreases with
the sixth power of the inverse particle diameter and restricts the sensitive detection of ul-
tra-trace levels to particles larger than 100 nm diameter.
LIBD (Laser induced break-down detection)
LIBD has been developed for the quantification of groundwater colloids, with low
number density and very small average size. The sensitivity of the method shows a less
pronounced colloid size dependency. Colloidal particles with a diameter down to about 10
nm, and at a concentration as low as 107 particles/L can be detected. The method is based
on the plasma generation of colloidal particles by intense laser light absorption. The
breakdown effect results from the ionization of matter in the electric field generated in the
focus area of a pulsed laser beam. The critical energy density energy to produce plasma
30
Natural and actinide aquatic colloids: literature
(the breakdown threshold) is much lower for solids than for liquids. By adjusting the laser
pulse energy density just below the breakdown threshold of the solvent, the plasma is
generated exclusively by colloidal particles present in the focus volume. The breakdown
event can be detected by measuring the plasma light emission with a charge coupled de-
vice or by detecting the photo-acoustic signal with a piezoelectric detector. Since every
event corresponds to one single colloid, the particle number density can be evaluated from
the breakdown probability, which is the number of breakdown events relative to a prede-
fined number of laser shots. Size information is gained from the determination of the
breakdown probability at different laser energy densities; the breakdown threshold de-
creases with increasing particle size and this dependency is used as a calibration curve for
particle sizing. By calibration of LIBD with reference polystyrene colloids, a mean parti-
cle diameter and a number density can be derived.
Electron Microscopy (Scanning Electron Microscopy-SEM and Transmission
Electron Microscopy-TEM) is largely applied for the investigations of the colloidal sys-
tems, including elemental composition and internal structure, but the original state of the
colloids is disturbed. The method requires high vacuum and time consuming sample
preparation. In case of TEM, the electrons passing through the sample produce a “direct
image”, whereas in case of SEM an “indirect” image of the sample is created. In the latter
case, secondary products (secondary electrons, backscattered electrons, and X-ray pho-
tons) are generated and detected, serving as a measure of the interaction strength. Particle
counting and sizing is performed by deposition of colloids onto a grid and evaluating the
pictures. The detection of the specific X-rays energy resolved by energy dispersive spec-
trometry (EDX) gives information on the elemental composition of the sample from the
characteristic spectral lines. The intensities are proportional to the mass concentration
within the interaction volume, allowing quantitative determination of the element abun-
dance.
Atomic Force Microscopy (AFM) is a non-destructive method of atomic resolu-
tion, mapping the surface of colloids. The method requires concentrated colloidal suspen-
sions and sample condensation might be necessary. Imaging is obtained by scanning the
repulsive and attractive forces between atoms of an ultra thin SiN3-tip used as a sensor
and the surface atoms of the sample at a separation distance of few Å. Moving the tip rela-
tive to the sample the surface topography is scanned. The interaction leads to elastic oscil-
lation proportional to the interaction between the cantilever tip and the sample surface.
31
Natural and actinide aquatic colloids: literature
Detection of the corresponding movements of the cantilever-tip is performed by sending a
laser light to the back of the tip and registering the reflected light by a 4-quadrant photo-
detector. The attained resolution is 0.1 Å and the sample surface is 1nm2 up to 1µm2. The
advantage over electron microscopy is that it can be operated in situ and can be used for
studying the colloid morphology even in aqueous conditions.
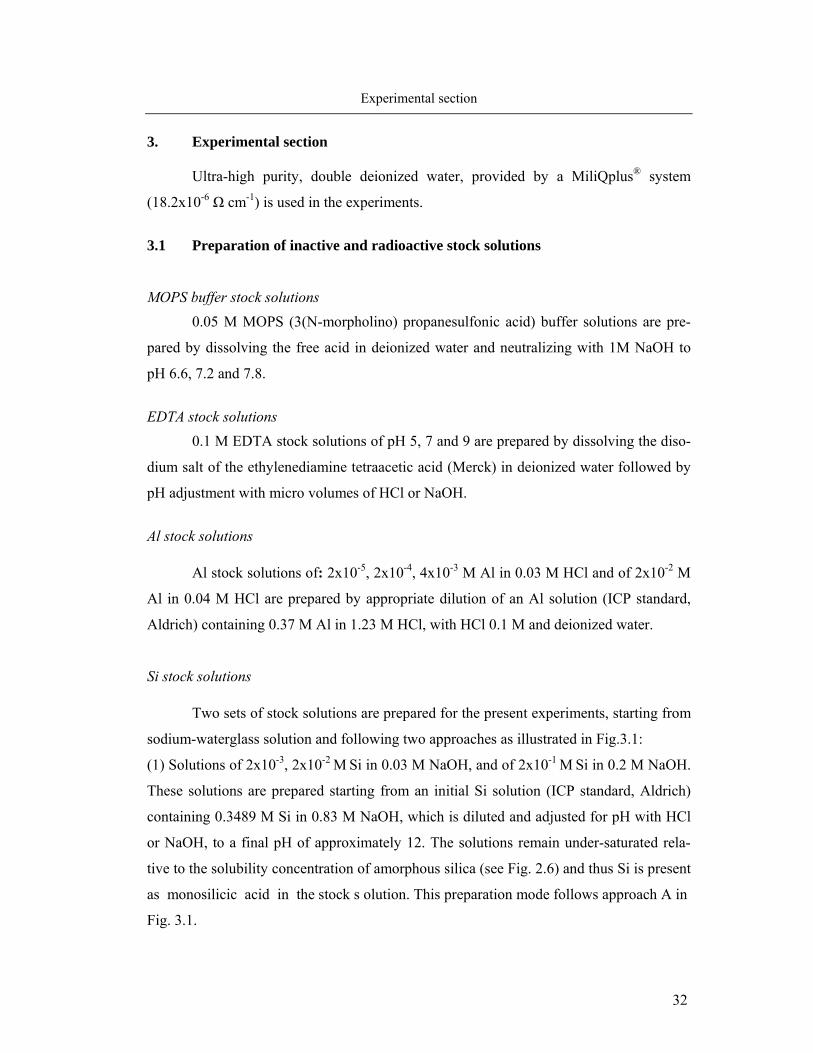
32
Experimental section
3. Experimental section
Ultra-high purity, double deionized water, provided by a MiliQplus® system
(18.2x10⁻⁶ Ω cm-1) is used in the experiments.
3.1 Preparation of inactive and radioactive stock solutions
MOPS buffer stock solutions
0.05 M MOPS (3(N-morpholino) propanesulfonic acid) buffer solutions are pre-
pared by dissolving the free acid in deionized water and neutralizing with 1M NaOH to
pH 6.6, 7.2 and 7.8.
EDTA stock solutions
0.1 M EDTA stock solutions of pH 5, 7 and 9 are prepared by dissolving the diso-
dium salt of the ethylenediamine tetraacetic acid (Merck) in deionized water followed by
pH adjustment with micro volumes of HCl or NaOH.
Al stock solutions
Al stock solutions of: 2x10⁻⁵, 2x10⁻⁴, 4x10⁻³ M Al in 0.03 M HCl and of 2x10⁻² M
Al in 0.04 M HCl are prepared by appropriate dilution of an Al solution (ICP standard,
Aldrich) containing 0.37 M Al in 1.23 M HCl, with HCl 0.1 M and deionized water.
Si stock solutions
Two sets of stock solutions are prepared for the present experiments, starting from
sodium-waterglass solution and following two approaches as illustrated in Fig.3.1:
(1) Solutions of 2x10⁻³, 2x10⁻² M Si in 0.03 M NaOH, and of 2x10⁻¹ M Si in 0.2 M NaOH.
These solutions are prepared starting from an initial Si solution (ICP standard, Aldrich)
containing 0.3489 M Si in 0.83 M NaOH, which is diluted and adjusted for pH with HCl
or NaOH, to a final pH of approximately 12. The solutions remain under-saturated rela-
tive to the solubility concentration of amorphous silica (see Fig. 2.6) and thus Si is present
as monosilicic acid in the stock s olution. This preparation mode follows approach A in
Fig. 3.1.
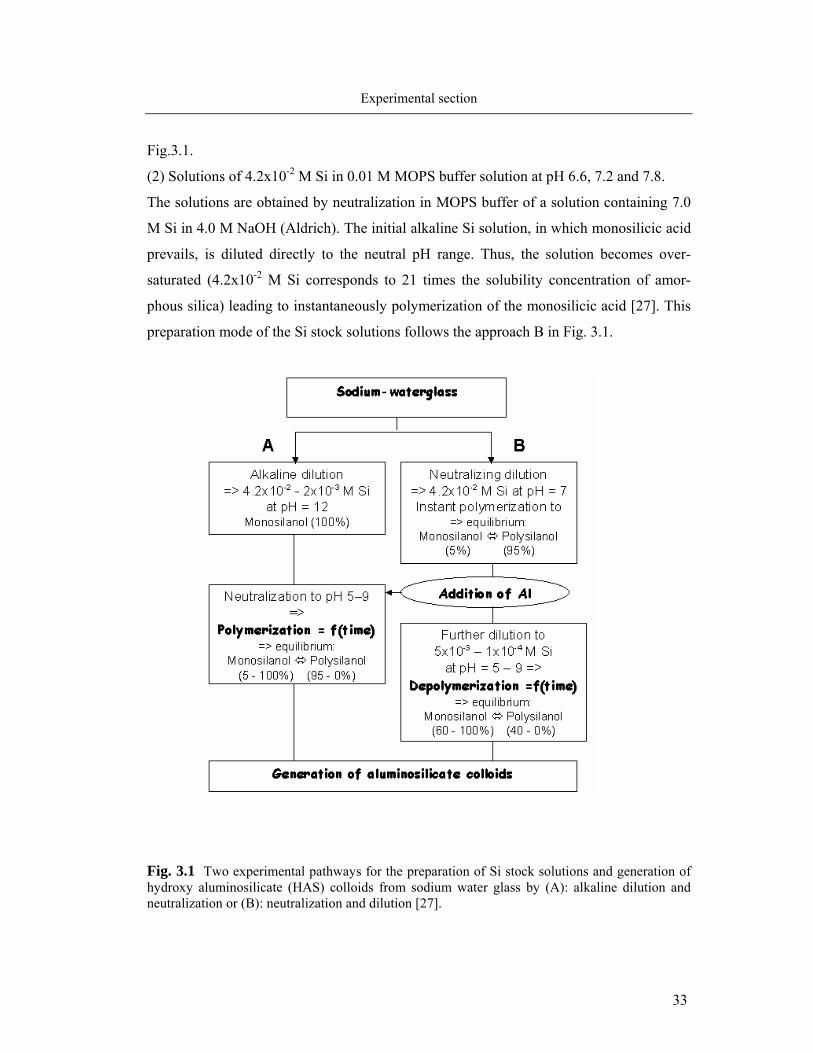
33
Experimental section
Fig.3.1.
(2) Solutions of 4.2x10⁻² M Si in 0.01 M MOPS buffer solution at pH 6.6, 7.2 and 7.8.
The solutions are obtained by neutralization in MOPS buffer of a solution containing 7.0
M Si in 4.0 M NaOH (Aldrich). The initial alkaline Si solution, in which monosilicic acid
prevails, is diluted directly to the neutral pH range. Thus, the solution becomes over-
saturated (4.2x10⁻² M Si corresponds to 21 times the solubility concentration of amor-
phous silica) leading to instantaneously polymerization of the monosilicic acid [27]. This
preparation mode of the Si stock solutions follows the approach B in Fig. 3.1.
Fig. 3.1 Two experimental pathways for the preparation of Si stock solutions and generation of hydroxy aluminosilicate (HAS) colloids from sodium water glass by (A): alkaline dilution and neutralization or (B): neutralization and dilution [27].
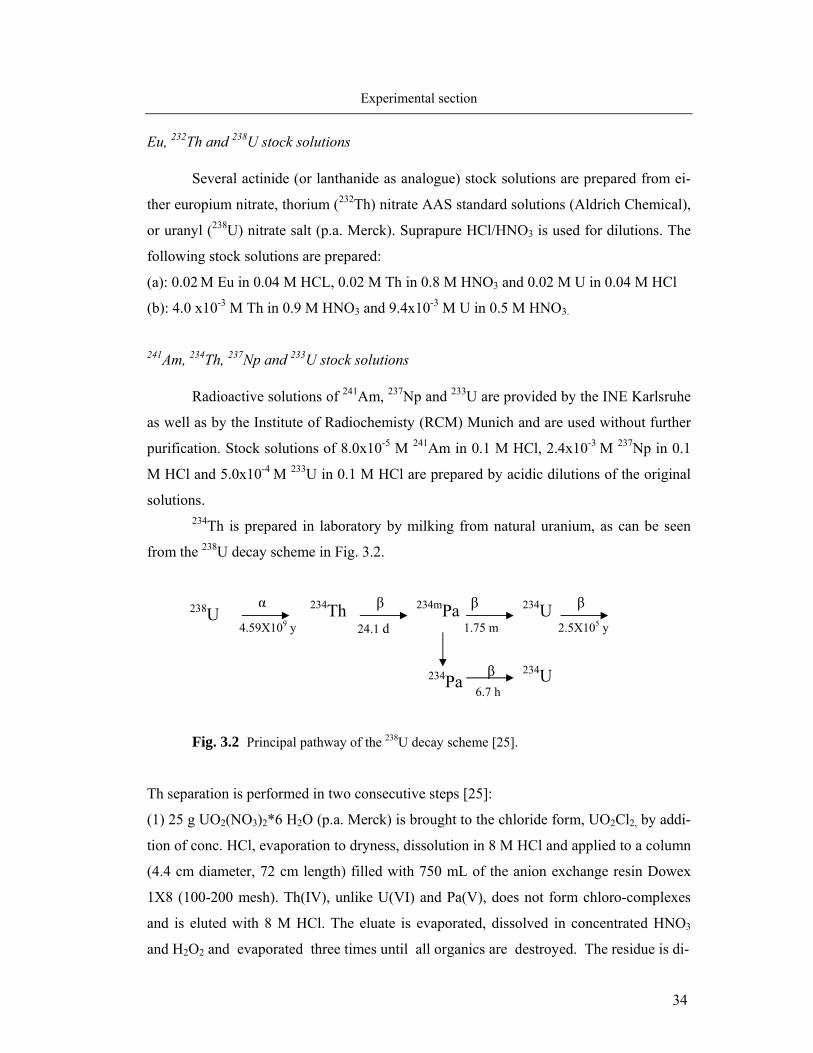
34
Experimental section
Eu, 232Th and 238U stock solutions
Several actinide (or lanthanide as analogue) stock solutions are prepared from ei-
ther europium nitrate, thorium (232Th) nitrate AAS standard solutions (Aldrich Chemical),
or uranyl (238U) nitrate salt (p.a. Merck). Suprapure HCl/HNO3 is used for dilutions. The
following stock solutions are prepared:
(a): 0.02 M Eu in 0.04 M HCL, 0.02 M Th in 0.8 M HNO3 and 0.02 M U in 0.04 M HCl
(b): 4.0 x10⁻³ M Th in 0.9 M HNO3 and 9.4x10⁻³ M U in 0.5 M HNO3.
241Am, 234Th, 237Np and 233U stock solutions
Radioactive solutions of 241Am, 237Np and 233U are provided by the INE Karlsruhe
as well as by the Institute of Radiochemisty (RCM) Munich and are used without further
purification. Stock solutions of 8.0x10⁻⁵ M 241Am in 0.1 M HCl, 2.4x10⁻³ M 237Np in 0.1
M HCl and 5.0x10⁻⁴ M 233U in 0.1 M HCl are prepared by acidic dilutions of the original
solutions. 234Th is prepared in laboratory by milking from natural uranium, as can be seen
from the 238U decay scheme in Fig. 3.2.
Fig. 3.2 Principal pathway of the 238U decay scheme [25]. Th separation is performed in two consecutive steps [25]:
(1) 25 g UO2(NO3)2*6 H2O (p.a. Merck) is brought to the chloride form, UO2Cl2, by addi-
tion of conc. HCl, evaporation to dryness, dissolution in 8 M HCl and applied to a column
(4.4 cm diameter, 72 cm length) filled with 750 mL of the anion exchange resin Dowex
1X8 (100-200 mesh). Th(IV), unlike U(VI) and Pa(V), does not form chloro-complexes
and is eluted with 8 M HCl. The eluate is evaporated, dissolved in concentrated HNO3
and H2O2 and evaporated three times until all organics are destroyed. The residue is di-
234Th 4.59X10⁹ y 24.1 d 1.75 m
234mPa
234U 234Pa
234U 2.5X10⁵ y
β 6.7 h
α β β β 238U
35
Experimental section
solved in 8 M HNO3 for the second purification step. (2): The hexanitrato complex of Th
is sorbed onto a small column filled with 80 µl anion exchange resin Dowex 1X8. The
remaining U and Pa impurities are washed out with 8 M HNO3. Th is eluted with 8 M
HCl. The eluate is evaporated several times with conc. HNO3 to dryness and re-dissolved
in approximately 0.8 M HNO3 resulting in approximately 1.5 x10⁴ Bq 234Th.
Humic acid stock solution
A stock solution of 200 mg/L humic acid is prepared by dissolving 0.0042 g puri-
fied Gohy-573 humic acid provided by INE Karlsruhe [42] in 5 mL 1 M NaOH. After 1 h
reaction time, the solution pH is adjusted to pH of ~ 12 by addition of 4.5 mL 1 M HCl
followed by further pH adjustment to pH ~ 7 with 0.1 M HCl/0.1 M NaOH.
The 14C-labelled humic acid (purified Gohy-573) stock solution of 4.8 mg/L is
provided by the IIIF Leipzig [59] and is used without further dilution.
3.2 Mother solutions for actinide/colloids interaction
HAS colloids
A typical 40 ml coprecipitation sample is prepared by titrating 20 ml Al stock so-
lution containing an aliquot of the acidic stock solution of the radionuclide under investi-
gation and eventually the actinide or lanthanide carrier, with a 20 ml Si solution (stock
solutions 1 as described in section 3.1). The actinide participates in the co-nucleation of
Al and Si, i.e. the actinide interacts with HAS in ‘statu nascendi’. The coprecipitation is
carried out to a preset pH with the aid of an automatic titrator (736 GP Titrino, Tinet 2.4
software, Metrohm). By the coprecipitation procedure, different combinations of Al/Si
concentration ratios are prepared at the initially preset pH values of 4.0, 5.0, 6.0, 7.0, 8.0,
9.0. Al concentration is varied between 0, 10-5 and 10-4 M, that of Si between 0, 10-3 and
10-2 M. At 10-3 M Si, the solution remains under-saturated and monosilicic acid prevails.
At 10-2 M Si, the initial alkaline solution (containing monosilicic acid) becomes over-
saturated by neutralization during the coprecipitation experiment which leads to the for-
mation of polysilicic acid. HAS mother solutions of 10-5 M Al/ 10-3 M Si generate the
HAS-monosilicic acid colloids, those of 10-4 M Al/ 10-2 M Si generate the HAS-polysili-
36
Experimental section
cic acid colloids.
The Eu, 232Th and 238U solutions are used with trace amounts of actinides (241Am, 234Th
and 233U) in the experiments involving higher actinide concentrations. Eu is added for fi-
nal Am+Eu concentration above 5x10⁻⁸ M; 232Th, for final Th concentration above 2x10-12
M, and 238U for final concentration of U above 8x10⁻⁶ M.
A similar coprecipitation procedure of Si and Al but without actinide addition, is
carried out for the preparation of HAS mother solutions which are then conditioned for
variable time periods (3h to 35 d). Aliquots of actinide (lanthanide) stock solutions (either 241Am+Eu, 234Th + 232Th, or 233U) are added to the aged HAS mother solutions.
HA colloids
Samples of 40 mL mother solutions containing adequate amounts of the actinide
and Al stock solutions and variable amount of [14C]-HA, are prepared in MOPS buffer at
pH 6.6, 7.2 and 7.8. In some experiments the Al solution is replaced by solutions of ei-
ther: Eu, 232Th or 238U. For the experiments regarding Th, two sets of samples are in each
case prepared: either with 234Th (and 232Th) and unlabelled humic acid to monitor Th be-
haviour, or 232Th and [14C]-humic acid for monitoring the humic acid. A high number of
mother solutions for parameter screening experiments are generated from different com-
binations of several parameters: the final concentration of Al lies between 0 and 1x10⁻⁵ M,
Eu concentration is 1x10⁻⁵ M, Th concentration varies between 5x10-12 M and 1x10⁻⁵ M
and that of U between 3x10⁻⁷ M and 1x10⁻⁵ M. Humic acid concentration is adjusted be-
tween 0 and 8 mg/L. Variable HA/Al or HA/An concentration ratios are generated. This is
achieved either by maintaining the Al or An concentration constant and increasing HA
concentration, or by decreasing the Al or An concentration while maintaining a constant
HA concentration.
HAS + HA colloids
Samples of 40 mL mother solutions are prepared in MOPS buffer, by neutralizing
the acidic solution containing variable aliquots of the actinide (241Am / 234Th +232Th / 233U
stock solution and Al stock solutions, with the Si solution. The Si stock solutions used
here (stock solutions 2 described in section 3.1) are especially important for the case that
37
Experimental section
the aluminosilicate colloids are generated from polysilicic acid, in order to overcome the
polymerization kinetics the neutralization of alkaline monosilicic acid especially at pH ≤ 7
[27]. Thus, introduction of such Si solution maintains the polysilicic acid transiently (ca 1
h) to react at once with Al and actinides. After one hour sample conditioning time, an ali-
quot of the [14C]-HA solution is added. As mentioned in case of humate colloids, for the
experiments regarding Th, parallel experiments are carried out. In the present experiment
the pH varies from 6.6 to 7.8, Al concentration lies between 0 and 1x10⁻³ M and Si con-
centration ranges from 0 to 10-2 M. HA concentration is kept constant at 6.5 mg/L.
All coprecipitation experiments are carried out at room temperature (20 ± 2 °C)
and atmospheric presssure. Calibration of the pH-meter is performed using buffer solution
standards and the accuracy of pH measurements is of ± 0.03 pH units. Magnetic stirring is
applied during the coprecipitation reaction. All coprecipitated samples are stored in tightly
closed polyethylene bottles and conditioned for time period from 3 h to 35 d. The repro-
ducibility of the coprecipitation experiments is found within 10% (1σ).
3.3 Activity partition in solution, colloids and precipitate
Consecutive filtration and ultra-filtration are performed on the coprecipitated sample
for a sequential separation of the precipitate and colloids. The first filtration is made by a
membrane filter of nominal pore size of 450 nm (Sartorius) to separate the precipitate
fraction. The second filtration is carried out on this filtrate to separate the colloids at a
pore size of 10 kDa (approximately 1.5 nm nominal pore size) (Centricon YM-10, Mili-
pore) by centrifugation in the Biofuge primo Heradeus-Kendro for 1h at 5000 x g. Activ-
ity of the radionuclide: 241Am / 234Th /237Np/ 233U, and/or of 14C is determined in the fil-
trates by liquid scintillation counting (LSC) as will be described below. The first filtrate at
450 nm contains both the colloidal and ionic species of the element under investigation.
Thus, the difference in the activity of the initial solution and the first filtrate represents the
activity of the precipitate. The activity difference between the first and the second filtrate
is then ascribed to the colloid-borne species, since the second filtrate from the 10 kDa
pore size contains only the ionic species.
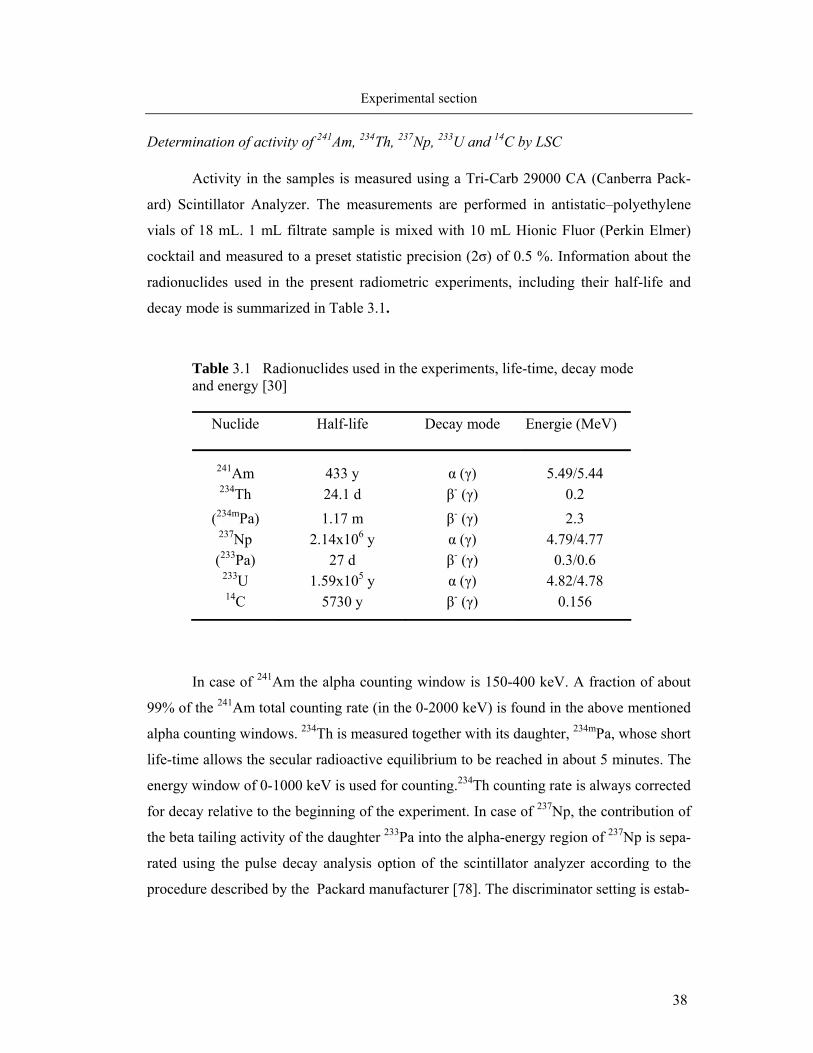
38
Experimental section
Determination of activity of 241Am, 234Th, 237Np, 233U and 14C by LSC
Activity in the samples is measured using a Tri-Carb 29000 CA (Canberra Pack-
ard) Scintillator Analyzer. The measurements are performed in antistatic–polyethylene
vials of 18 mL. 1 mL filtrate sample is mixed with 10 mL Hionic Fluor (Perkin Elmer)
cocktail and measured to a preset statistic precision (2σ) of 0.5 %. Information about the
radionuclides used in the present radiometric experiments, including their half-life and
decay mode is summarized in Table 3.1.
Table 3.1 Radionuclides used in the experiments, life-time, decay mode and energy [30]
Nuclide
Half-life Decay mode Energie (MeV)
241Am
433 y
α (γ)
5.49/5.44 234Th 24.1 d β- (γ) 0.2
(234mPa) 1.17 m β- (γ) 2.3 237Np 2.14x10⁶ y α (γ) 4.79/4.77 (233Pa) 27 d β- (γ) 0.3/0.6
233U 1.59x10⁵ y α (γ) 4.82/4.78 14C 5730 y β- (γ) 0.156
In case of 241Am the alpha counting window is 150-400 keV. A fraction of about
99% of the 241Am total counting rate (in the 0-2000 keV) is found in the above mentioned
alpha counting windows. 234Th is measured together with its daughter, 234mPa, whose short
life-time allows the secular radioactive equilibrium to be reached in about 5 minutes. The
energy window of 0-1000 keV is used for counting.234Th counting rate is always corrected
for decay relative to the beginning of the experiment. In case of 237Np, the contribution of
the beta tailing activity of the daughter 233Pa into the alpha-energy region of 237Np is sepa-
rated using the pulse decay analysis option of the scintillator analyzer according to the
procedure described by the Packard manufacturer [78]. The discriminator setting is estab-
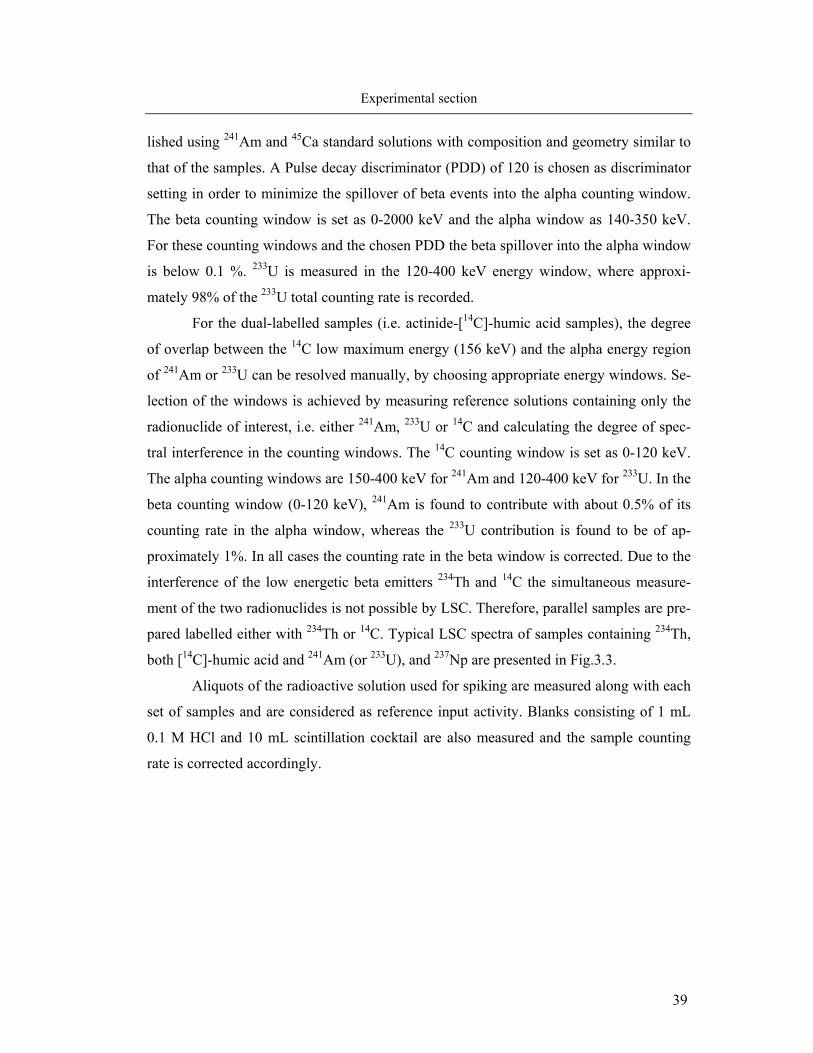
39
Experimental section
lished using 241Am and 45Ca standard solutions with composition and geometry similar to
that of the samples. A Pulse decay discriminator (PDD) of 120 is chosen as discriminator
setting in order to minimize the spillover of beta events into the alpha counting window.
The beta counting window is set as 0-2000 keV and the alpha window as 140-350 keV.
For these counting windows and the chosen PDD the beta spillover into the alpha window
is below 0.1 %. 233U is measured in the 120-400 keV energy window, where approxi-
mately 98% of the 233U total counting rate is recorded.
For the dual-labelled samples (i.e. actinide-[14C]-humic acid samples), the degree
of overlap between the 14C low maximum energy (156 keV) and the alpha energy region
of 241Am or 233U can be resolved manually, by choosing appropriate energy windows. Se-
lection of the windows is achieved by measuring reference solutions containing only the
radionuclide of interest, i.e. either 241Am, 233U or 14C and calculating the degree of spec-
tral interference in the counting windows. The 14C counting window is set as 0-120 keV.
The alpha counting windows are 150-400 keV for 241Am and 120-400 keV for 233U. In the
beta counting window (0-120 keV), 241Am is found to contribute with about 0.5% of its
counting rate in the alpha window, whereas the 233U contribution is found to be of ap-
proximately 1%. In all cases the counting rate in the beta window is corrected. Due to the
interference of the low energetic beta emitters 234Th and 14C the simultaneous measure-
ment of the two radionuclides is not possible by LSC. Therefore, parallel samples are pre-
pared labelled either with 234Th or 14C. Typical LSC spectra of samples containing 234Th,
both [14C]-humic acid and 241Am (or 233U), and 237Np are presented in Fig.3.3.
Aliquots of the radioactive solution used for spiking are measured along with each
set of samples and are considered as reference input activity. Blanks consisting of 1 mL
0.1 M HCl and 10 mL scintillation cocktail are also measured and the sample counting
rate is corrected accordingly.
40
Experimental section
Fig. 3.3 LSC spectra of samples containing: a) both 14C and 241Am, b) 234Th in equilibrium with 234mPa; c) 237Np in equilibrium with 233Pa, with separation of 237Np alpha contributions (blue re-gion) from the low energy beta tailing (green) of the daughter 233Pa; d) both 14C and 233U. Energy counting windows set as for the experiments.
233U 14C
237Np 233Pa
241Am 14C
234Th +234mPa
a)
b)
c)
d)
41
Experimental section
3.4 Colorimetric quantification of Si and Al
Monomeric silicic acid
Monomeric silicic acid is quantified by the molybdenum test (Spectroquant®
1.14794 Silicon, Merck) [25, 27]. The colorimetric method is based on the selective de-
tection of monomeric /dimeric silicic acid species, the so-called soluble silica, reacting
fast with the molybdic acid as compared to the oligomeric (colloidal) species. The method
uses the reaction between silicate ions and ammonium molybdate forming a silico-
molybdic complex which is further partially reduced to the silico-molybdenum blue form.
The latter complex shows maximum absorbance at 820 nm. Measurements are performed
in 10 mm plastic cuvettes using a Cary 5000 spectrophotometer assisted by the Cary
WinUV 3.0 Software. The precision of the method is within 1% (1σ) in the concentration
range 0.1 to 5 mg/L Si.
Soluble Al
In the present work the soluble Al is defined as the Al in a solution passing a 10
kDa pore size filter (after removal of precipitate and colloids) and that can be measured
by colorimetry using Chromazurol S as complexation agent (Merck Standard Procedure,
Spectroquant 1.14825-Al). The Al-Chromazurol complex has maximum absorbance at
548 nm. In case that Al is present in solution complexed with EDTA, an additional prepa-
ration step is required in order to destroy the Al-EDTA complex [88]. Thus, prior the
Chromazurol addition the samples are mixed with an acidic solution of 1.5 M Pb(NO3)2 in
0.1 M HCl for a final Pb concentration in the sample ten fold in excess relative to EDTA.
The exchange reaction between the EDTA complexed-Al and Pb2+ ion is found to be
complete within 1 h at pH 1 and ambient temperature. Details on the optimization of this
experimental procedure will be published elsewhere [88]. Measurements are carried out in
10 mm quartz cuvettes using a Cary 5000 spectrophotometer assisted by the Cary WinUV
3.0 Software. Al determination is possible in the linear range of 7x10⁻⁶ M up to 1x10⁻⁴ M.
The precision of the method is approximately 2% (1σ).
42
Experimental section
3.5 Spectroscopic characterization of the actinide/colloid binding
TRLFS for the speciation of colloid borne Cm
The measurements are performed by using an excimer-pumped dye laser system
(Lambda Physics, EMG 201 and FL 3002). Cm is excited directly at 375 or 383 nm and
alternately, indirect at 370 nm via excitation of humic acid [135]. Cm fluorescence emis-
sion is measured in the spectral range of 580-620 nm, using a delay time of 1.2 µs at a
gate width of 1.3 ms. An optical multichannel analyzer is used for detection, which con-
sist of a polychromator (Jobin Yvon, HR 320) with a 1200 lines/mm grating and a time-
gateable intensified photodiode array (Spectroscopy instruments, ST 180, IRY 700 G).
For the fluorescence life-time measurements, the delay time is stepwise shifted at 5-25 µs
within the time interval of 1.2-1000 µs [28, 97].
EXAFS spectroscopy for the speciation of Th(IV), Np(V) and U(VI) in aluminosilicate so-
lutions
The coprecipitated samples for X-ray absorption spectroscopy are prepared by titration.
We use aliquots of actinide stock solutions of 4 x10⁻³ M Th(IV) in 0.9 M HNO3 and
9.4x10⁻³ M U(VI) in 0.5 M HNO3 (cf. section 3.1, b) and 7.56x10⁻² M Np(V) (237Np) in
0.1 M NaClO4. An acidic solution containing a mixture of the actinide solution and Al
solution of 4.0x10⁻³ M Al3+ in 0.03 M HCl is titrated with an alkaline Si solution of 0.2 M
Si(OH)4 in 0.2 M NaOH (stock solution of set (1) in 3.1). Titration is conducted to the
preset pH of 8.5 for Th and U and to pH 12 for Np. For Th and U blank solutions are pre-
pared by titration of only the actinide solution without Al, with the alkaline Si solution.
One Th-containing sample is also prepared by titration of an acidic solution containing
both Th4+ and Al3+ with a NaOH solution, without Si addition. The coprecipitated samples
are measured without any filtration step.
From the final sample volume of about 20 mL obtained after coprecipitation, ali-
quots of 2.5 mL (in case of Np aliquot of 0.5 mL of 1.5 mL total) are transferred to Ep-
pendorf centrifuge tubes and sealed for the measurements. The sample containing only Th
and Al is measured as a wet paste separated from the liquid phase by centrifugation (15
43
Experimental section
min. at 3000 g) and placed in a 0.5 mL Eppendorf tube. None of the other samples con-
tains visible precipitate. Prior the measurement, the samples are aged for three to four
days. Sample preparation and measurement are performed at ambient temperature and at-
mosphere, but without controlling the equilibration with the atmospheric CO2.
Th -LIII (16.3 keV), Np-LIII (17.608 keV) and U-LIII (17.155 keV), X-ray absorp-
tion spectra are collected at the INE-Beamline at ANKA [89], using a Ge(422) double-
crystal monochromator, detuned to 70% of maximum flux. The measurements are per-
formed in both transmission mode, using Ar gas–filled ionization chambers for monitor-
ing the intensities of the incident and transmitted light, and, in the fluorescence mode, us-
ing a 5-element solid state Ge fluorescence detector (Canberra). Energy calibration is per-
formed relative to the first inflection point in the XANES of a Zr reference foil (Zr-K
edge at 17998 eV). Up to seven scans are collected, interpolated and averaged.
The data from the florescence detection mode are analyzed in case of Th-
aluminosilicate and Th-silicate samples, and from the transmission detection for the
Th/Al, U and Np containing samples. The isolation of the EXAFS oscillations from the
raw absorption spectrum via spline fitting and the least-squares EXAFS curve-fitting are
performed using both the WINXAS 2.3 and UWXAFS programme packages. Theoretical
backscattering amplitude and phase functions used in the fits are calculated with FEFF8.2
[85] code using simple single scattering (SS) paths for each pair of atoms.
Only single scattering paths are included in the fits of the data to the EXAFS equa-
tion (eq. 2.15). Multiple scattering (MS) paths along the Np(V)-Oaxial and U(VI)-Oaxial
bonds have been reported [90] to contribute to the EXAFS with an effective distance
twice the An-Oaxial distance. Preliminary calculations of the 4 legged (MS) path
Oaxial↔An↔Oaxial using the difference method [90] show that the MS feature does not
change significantly the remaining fit parameters. During the fits, the amplitude reduction
factor (S0) is held constant at 1. The shift in the ionization energy, ∆E0, is constrained to
be the same value for each shell (i.e. one global parameter for both O shells, another one
for the Si(Al) shell, and one for the Th shell when necessary. In case of U(VI) the number
of the axial O atoms is held constant at 2 during the final fit since preliminary fits result in
a coordination number of about 1.7.
44
Experimental section
3.6 Desorption of activity with chelating agents
The desorption experiments are conducted by addition of the 0.1 M EDTA stock
solution (see 3.1) to the actinide-aluminosilicate solutions or aluminosilicate solutions
without actinide. After EDTA addition, the pH of the sample is readjusted by slow addi-
tion of small volumes of 0.1 M NaOH solution. The EDTA concentration in the sample is
ten folds higher than that of Al. Following varied contact time period from 3 h to 35 d, the
solutions are filtered through 0.45 µm pore size to eliminate the precipitate, followed by
filtration at 10 kDa pore size combined with centrifugation (5000 g) for separation of the
colloids. Activity in the colloids is further determined as described in section 3.3. The
soluble Al is measured in the filtrate passing the 10 kDa filtrate as described in section
3.4. By difference with the Al concentration introduced initially in the sample we obtain
the Al that is not desorbed by EDTA, or what we call the EDTA resistant Al.
45
Interaction of actinide(III-VI) with aluminosilicate colloids
4. Interaction of actinide(III-VI) with aluminosilicate colloids
The investigations aim at giving a better insight into the process of the interaction
of actinides with aluminosilicate colloids in the course of their generation by conuclea-
tion. The present work is an extension of the former investigations of actinides(III, IV) to
actinides of higher oxidation states (Np(V), U(VI)), and also to the characterization of the
actinide-HAS colloid binding. Accordingly, the study concerns the following issues: iden-
tification of the conditions for the formation of stable actinide-HAS pseudocolloids in-
cluding kinetic aspects of the incorporation process, determination of the colloids capacity
to incorporate increasing amounts of actinide, characterization of the An binding state
within the HAS bulk and investigation of the stability of HAS-colloid-borne actinides.
4.1 Co-nucleation of Si, Al and actinide(III)/(IV)/(V)/(VI) 4.1.1 Formation of colloid-borne actinides: parameter screening
A radiometric screening experiment is performed in order to ascertain the condi-
tions favorable for the formation of stable actinide-HAS colloids in respect with pH, Si
and Al concentration and their concentration ratio. Following the previous experiments
regarding Am(III) and Th(IV) [25, 26], a tracer amount of either 237Np(V) or 233U(VI) is
allowed to participate in the co-nucleation process of Al and Si. The chosen Np and U
concentrations are of 7x10⁻⁶ M and 8x10⁻⁷ M, respectively. The actinides concentration
level is chosen in order to avoid the colloid formation in the actinide pure solution without
Si and Al. Thus, as can be seen in Fig. 4.1, in samples without Si and Al, most activity of
Am, Th, U is present in the precipitate at the current concentration, indicated by the
dashed line. The minimum U and Np concentration is however limited by the necessity to
achieve a good enough counting statistic of 233U and 237Np, respectively. The final con-
centration of Si and Al and their ratio are of 1x10⁻³ M Si, 1x10⁻⁵ M Al and 1x10⁻² M Si, 1x
10-4 M Al. They correspond to the optimal conditions (cf. section 2.2.1) previously deter-
mined [27] for the formation of the HAS colloids from monosilicic and polysilicic acid,
respectively. For 1x10⁻² M Si (6.4 times the over-saturation concentration) the fraction of
polysilicic acid formed during co-nucleation is expected to reach a maximum level of 85
%, cf. Fig. 3.1 (approach A), corresponding to the equilibrium dictated by the solubility of
amorphous silica. Blank mother solutions containing the actinide only, without Si and Al,
and the actinide with only Al or Si are also analyzed in order to compare the actinide be-
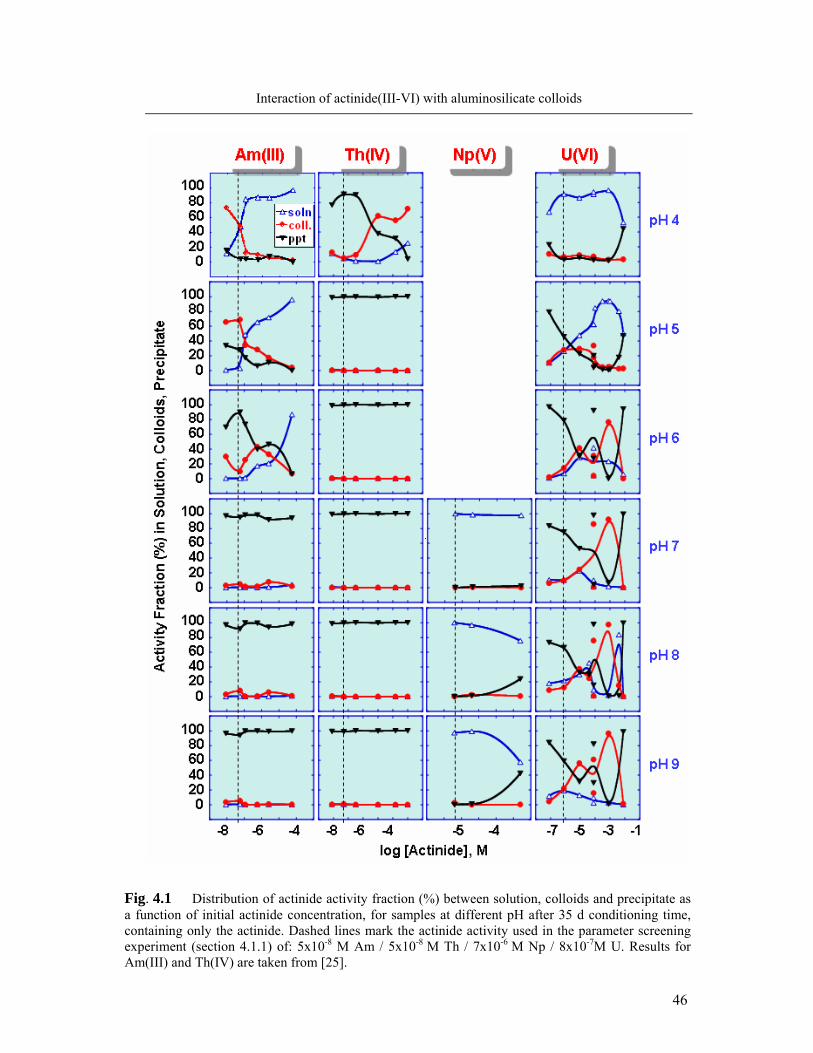
46
Interaction of actinide(III-VI) with aluminosilicate colloids
Fig. 4.1 Distribution of actinide activity fraction (%) between solution, colloids and precipitate as a function of initial actinide concentration, for samples at different pH after 35 d conditioning time, containing only the actinide. Dashed lines mark the actinide activity used in the parameter screening experiment (section 4.1.1) of: 5x10⁻⁸ M Am / 5x10⁻⁸ M Th / 7x10⁻⁶ M Np / 8x10⁻⁷M U. Results for Am(III) and Th(IV) are taken from [25].
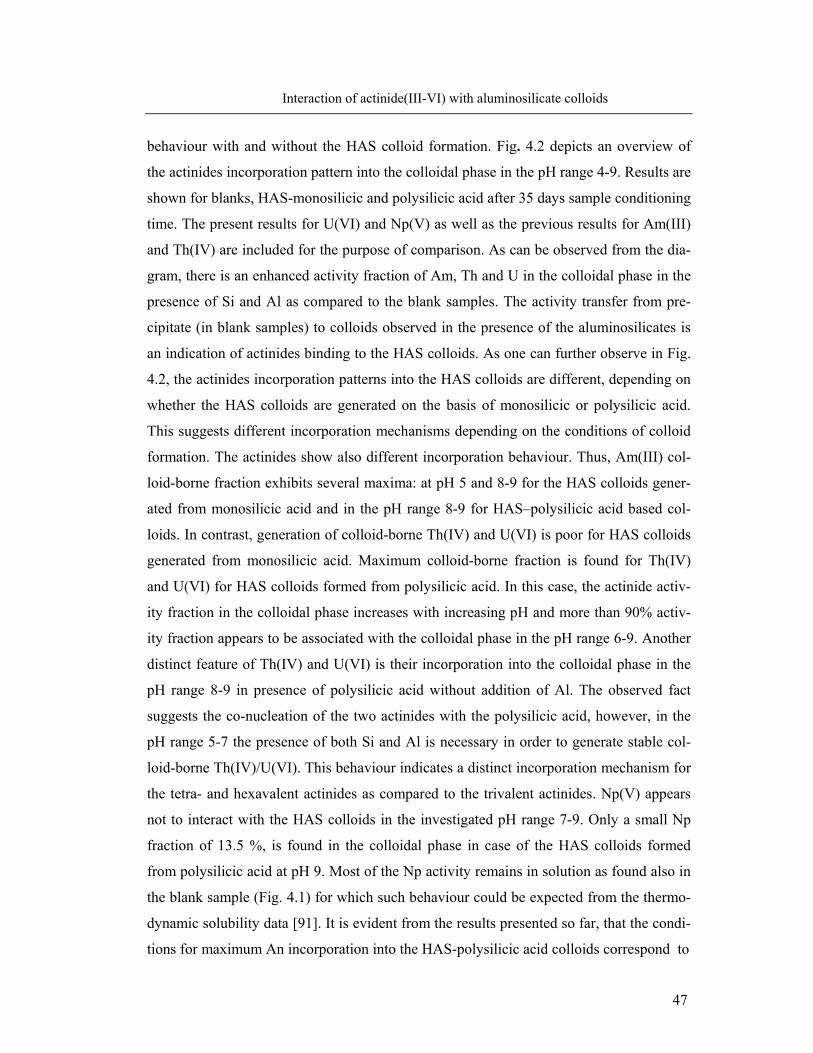
47
Interaction of actinide(III-VI) with aluminosilicate colloids
behaviour with and without the HAS colloid formation. Fig. 4.2 depicts an overview of
the actinides incorporation pattern into the colloidal phase in the pH range 4-9. Results are
shown for blanks, HAS-monosilicic and polysilicic acid after 35 days sample conditioning
time. The present results for U(VI) and Np(V) as well as the previous results for Am(III)
and Th(IV) are included for the purpose of comparison. As can be observed from the dia-
gram, there is an enhanced activity fraction of Am, Th and U in the colloidal phase in the
presence of Si and Al as compared to the blank samples. The activity transfer from pre-
cipitate (in blank samples) to colloids observed in the presence of the aluminosilicates is
an indication of actinides binding to the HAS colloids. As one can further observe in Fig.
4.2, the actinides incorporation patterns into the HAS colloids are different, depending on
whether the HAS colloids are generated on the basis of monosilicic or polysilicic acid.
This suggests different incorporation mechanisms depending on the conditions of colloid
formation. The actinides show also different incorporation behaviour. Thus, Am(III) col-
loid-borne fraction exhibits several maxima: at pH 5 and 8-9 for the HAS colloids gener-
ated from monosilicic acid and in the pH range 8-9 for HAS–polysilicic acid based col-
loids. In contrast, generation of colloid-borne Th(IV) and U(VI) is poor for HAS colloids
generated from monosilicic acid. Maximum colloid-borne fraction is found for Th(IV)
and U(VI) for HAS colloids formed from polysilicic acid. In this case, the actinide activ-
ity fraction in the colloidal phase increases with increasing pH and more than 90% activ-
ity fraction appears to be associated with the colloidal phase in the pH range 6-9. Another
distinct feature of Th(IV) and U(VI) is their incorporation into the colloidal phase in the
pH range 8-9 in presence of polysilicic acid without addition of Al. The observed fact
suggests the co-nucleation of the two actinides with the polysilicic acid, however, in the
pH range 5-7 the presence of both Si and Al is necessary in order to generate stable col-
loid-borne Th(IV)/U(VI). This behaviour indicates a distinct incorporation mechanism for
the tetra- and hexavalent actinides as compared to the trivalent actinides. Np(V) appears
not to interact with the HAS colloids in the investigated pH range 7-9. Only a small Np
fraction of 13.5 %, is found in the colloidal phase in case of the HAS colloids formed
from polysilicic acid at pH 9. Most of the Np activity remains in solution as found also in
the blank sample (Fig. 4.1) for which such behaviour could be expected from the thermo-
dynamic solubility data [91]. It is evident from the results presented so far, that the condi-
tions for maximum An incorporation into the HAS-polysilicic acid colloids correspond to
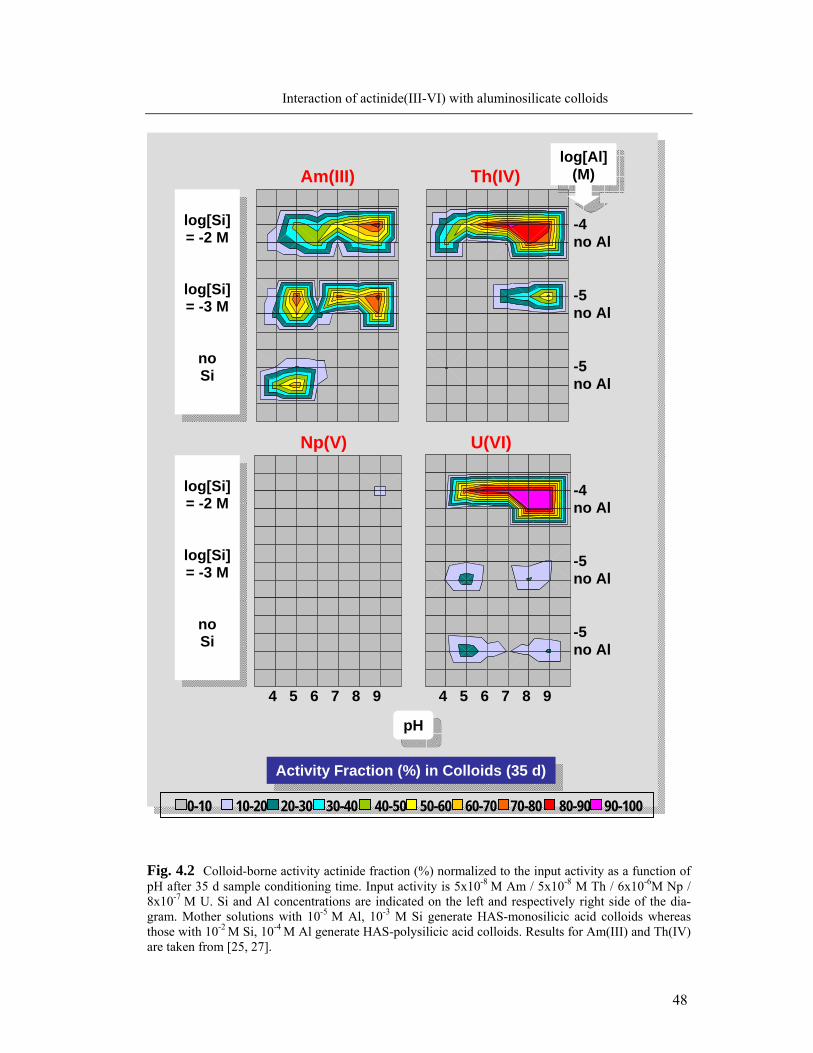
48
Interaction of actinide(III-VI) with aluminosilicate colloids
Fig. 4.2 Colloid-borne activity actinide fraction (%) normalized to the input activity as a function of pH after 35 d sample conditioning time. Input activity is 5x10⁻⁸ M Am / 5x10⁻⁸ M Th / 6x10⁻⁶M Np / 8x10⁻⁷ M U. Si and Al concentrations are indicated on the left and respectively right side of the dia-gram. Mother solutions with 10-5 M Al, 10-3 M Si generate HAS-monosilicic acid colloids whereas those with 10-2 M Si, 10-4 M Al generate HAS-polysilicic acid colloids. Results for Am(III) and Th(IV) are taken from [25, 27].
Am(III) Th(IV)
log[Si] = -2 M
log[Si] = -3 M
no Si
log[Al] (M)
-4 no Al
-5 no Al
-5 no Al
Activity Fraction (%) in Colloids (35 d)
0-10 10-20 20-30 30-40 40-50 50-60 60-70 70-80 80-90 90-100
U(VI)Np(V)
4 5 6 7 8 9
log[Si] = -2 M
log[Si] = -3 M
no Si
pH
-4 no Al
-5 no Al
-5 no Al
4 5 6 7 8 9
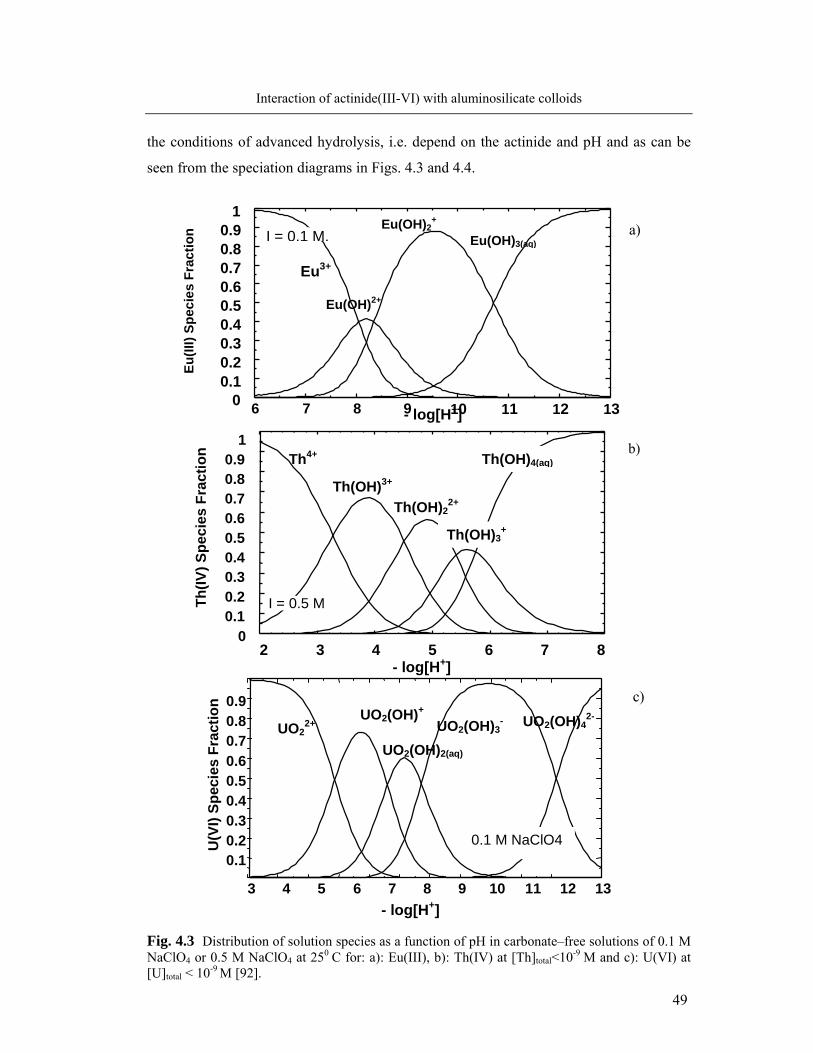
49
Interaction of actinide(III-VI) with aluminosilicate colloids
the conditions of advanced hydrolysis, i.e. depend on the actinide and pH and as can be
seen from the speciation diagrams in Figs. 4.3 and 4.4.
Fig. 4.3 Distribution of solution species as a function of pH in carbonate–free solutions of 0.1 M NaClO4 or 0.5 M NaClO4 at 250 C for: a): Eu(III), b): Th(IV) at [Th]total<10-9 M and c): U(VI) at [U]total < 10-9 M [92].
Eu(OH)2+
Eu(OH)2+
Eu(OH)3(aq)
0 0.10.20.30.40.50.60.70.80.9
1
Th(IV
) Spe
cies
Fra
ctio
n
Th4+
Th(OH)3+
Th(OH)22+
Th(OH)3+
Th(OH)4(aq)
I = 0.5 M
UO2(OH)42-
3 4 5 6 7 8 9 10 11 12 13 0.1 0.2 0.3 0.4 0.5 0.6 0.7 0.8 0.9
U(V
I) Sp
ecie
s Fr
actio
n
UO22+
UO2(OH)+
UO2(OH)2(aq)
UO2(OH)3-
0.1 M NaClO4
00.1 0.2 0.3 0.4 0.5 0.6 0.7 0.8 0.9
1
6 7 8 9 10 11 12 13
I = 0.1 M,
Eu(II
I) Sp
ecie
s Fr
actio
n
Eu3+
2
3
4
5
6
7
8
a)
c)
- log[H+]
- log[H+]
- log[H+]
b)
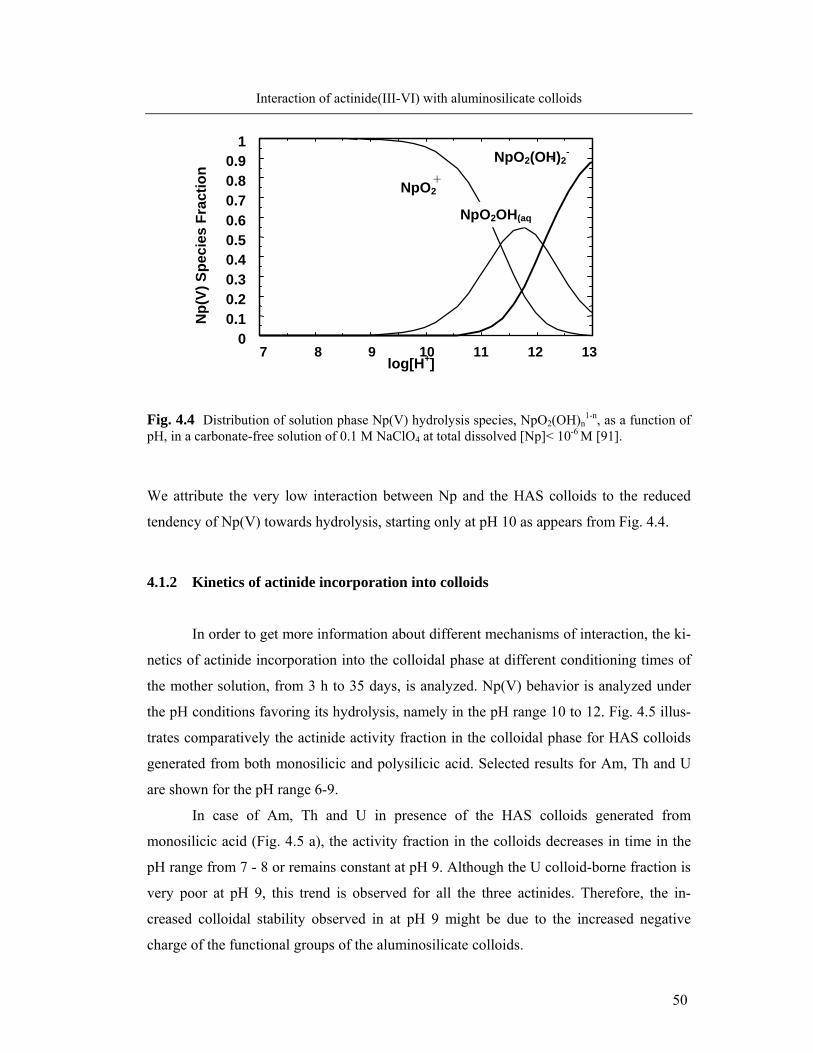
50
Interaction of actinide(III-VI) with aluminosilicate colloids
Fig. 4.4 Distribution of solution phase Np(V) hydrolysis species, NpO2(OH)n
1-n, as a function of pH, in a carbonate-free solution of 0.1 M NaClO4 at total dissolved [Np]< 10-6 M [91].
We attribute the very low interaction between Np and the HAS colloids to the reduced
tendency of Np(V) towards hydrolysis, starting only at pH 10 as appears from Fig. 4.4.
4.1.2 Kinetics of actinide incorporation into colloids
In order to get more information about different mechanisms of interaction, the ki-
netics of actinide incorporation into the colloidal phase at different conditioning times of
the mother solution, from 3 h to 35 days, is analyzed. Np(V) behavior is analyzed under
the pH conditions favoring its hydrolysis, namely in the pH range 10 to 12. Fig. 4.5 illus-
trates comparatively the actinide activity fraction in the colloidal phase for HAS colloids
generated from both monosilicic and polysilicic acid. Selected results for Am, Th and U
are shown for the pH range 6-9.
In case of Am, Th and U in presence of the HAS colloids generated from
monosilicic acid (Fig. 4.5 a), the activity fraction in the colloids decreases in time in the
pH range from 7 - 8 or remains constant at pH 9. Although the U colloid-borne fraction is
very poor at pH 9, this trend is observed for all the three actinides. Therefore, the in-
creased colloidal stability observed in at pH 9 might be due to the increased negative
charge of the functional groups of the aluminosilicate colloids.
log[H+]
0 0.1 0.2 0.3 0.4 0.5 0.6 0.7 0.8 0.9
1
Np(
V) S
peci
es F
ract
ion
NpO2
NpO2(OH)2-
NpO2OH(aq
- +
7 8 9 10 11 12 13
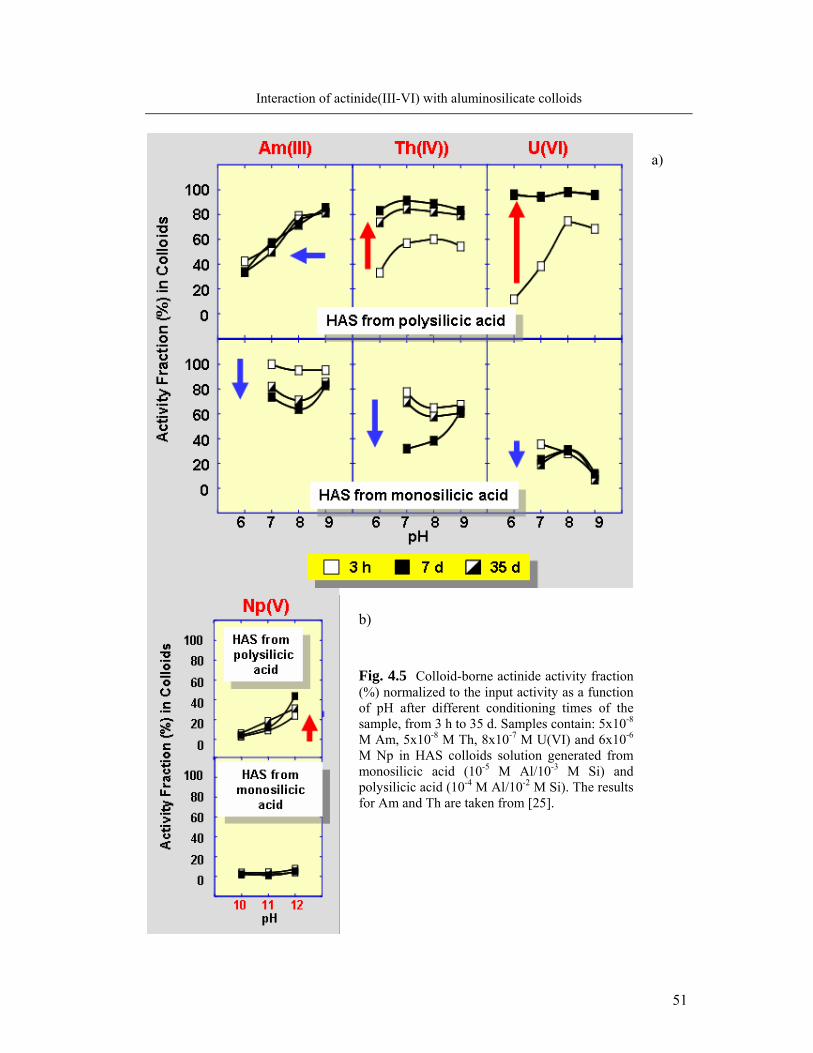
51
Interaction of actinide(III-VI) with aluminosilicate colloids
a)
Fig. 4.5 Colloid-borne actinide activity fraction (%) normalized to the input activity as a function of pH after different conditioning times of the sample, from 3 h to 35 d. Samples contain: 5x10⁻⁸ M Am, 5x10⁻⁸ M Th, 8x10⁻⁷ M U(VI) and 6x10⁻⁶ M Np in HAS colloids solution generated from monosilicic acid (10-5 M Al/10-3 M Si) and polysilicic acid (10-4 M Al/10-2 M Si). The results for Am and Th are taken from [25].
b)
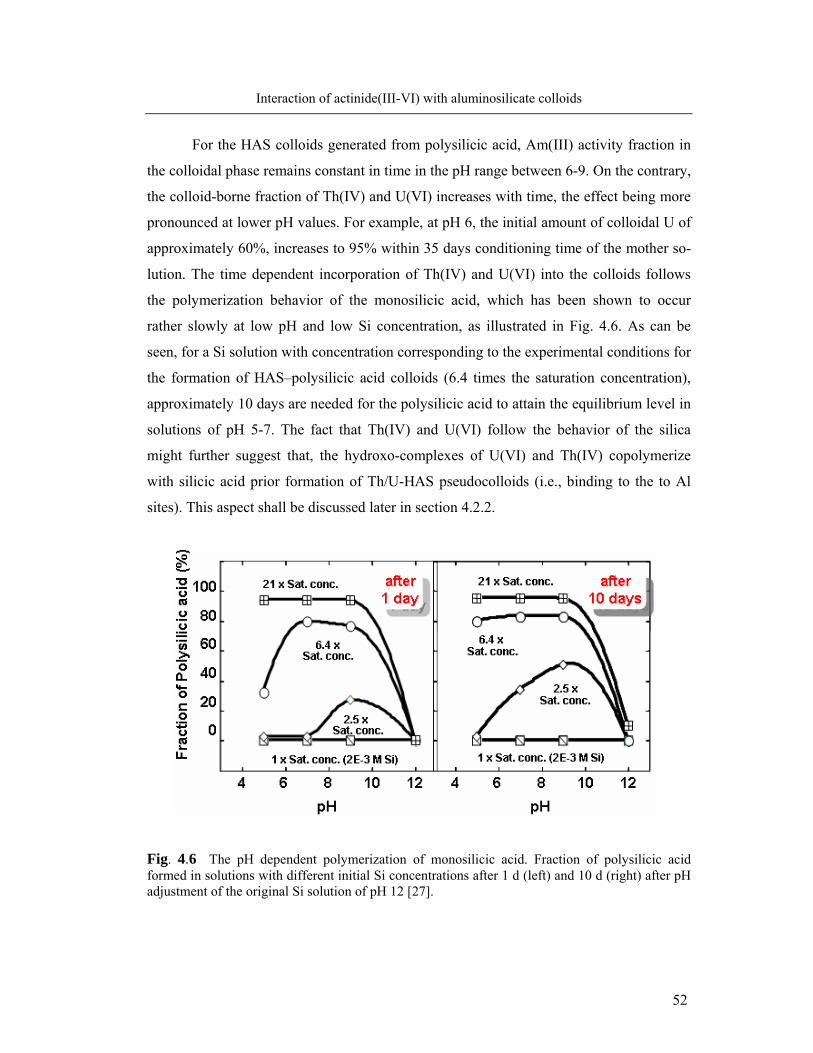
52
Interaction of actinide(III-VI) with aluminosilicate colloids
For the HAS colloids generated from polysilicic acid, Am(III) activity fraction in
the colloidal phase remains constant in time in the pH range between 6-9. On the contrary,
the colloid-borne fraction of Th(IV) and U(VI) increases with time, the effect being more
pronounced at lower pH values. For example, at pH 6, the initial amount of colloidal U of
approximately 60%, increases to 95% within 35 days conditioning time of the mother so-
lution. The time dependent incorporation of Th(IV) and U(VI) into the colloids follows
the polymerization behavior of the monosilicic acid, which has been shown to occur
rather slowly at low pH and low Si concentration, as illustrated in Fig. 4.6. As can be
seen, for a Si solution with concentration corresponding to the experimental conditions for
the formation of HAS–polysilicic acid colloids (6.4 times the saturation concentration),
approximately 10 days are needed for the polysilicic acid to attain the equilibrium level in
solutions of pH 5-7. The fact that Th(IV) and U(VI) follow the behavior of the silica
might further suggest that, the hydroxo-complexes of U(VI) and Th(IV) copolymerize
with silicic acid prior formation of Th/U-HAS pseudocolloids (i.e., binding to the to Al
sites). This aspect shall be discussed later in section 4.2.2.
Fig. 4.6 The pH dependent polymerization of monosilicic acid. Fraction of polysilicic acid formed in solutions with different initial Si concentrations after 1 d (left) and 10 d (right) after pH adjustment of the original Si solution of pH 12 [27].
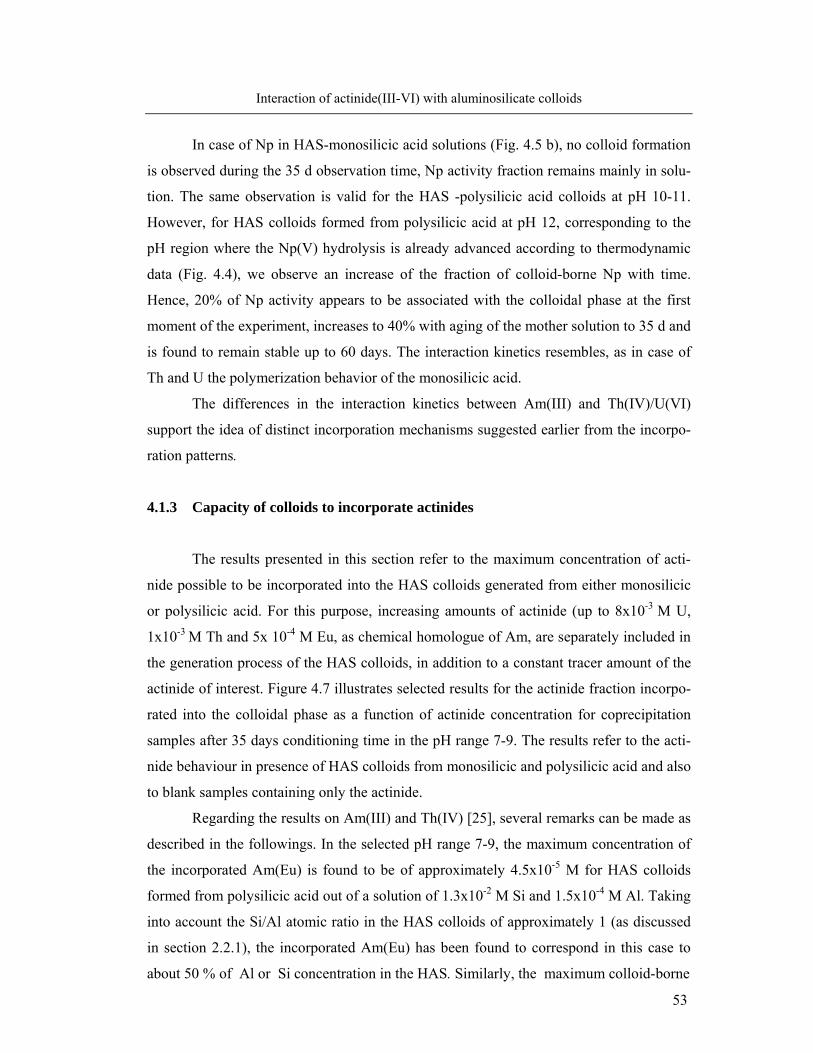
53
Interaction of actinide(III-VI) with aluminosilicate colloids
In case of Np in HAS-monosilicic acid solutions (Fig. 4.5 b), no colloid formation
is observed during the 35 d observation time, Np activity fraction remains mainly in solu-
tion. The same observation is valid for the HAS -polysilicic acid colloids at pH 10-11.
However, for HAS colloids formed from polysilicic acid at pH 12, corresponding to the
pH region where the Np(V) hydrolysis is already advanced according to thermodynamic
data (Fig. 4.4), we observe an increase of the fraction of colloid-borne Np with time.
Hence, 20% of Np activity appears to be associated with the colloidal phase at the first
moment of the experiment, increases to 40% with aging of the mother solution to 35 d and
is found to remain stable up to 60 days. The interaction kinetics resembles, as in case of
Th and U the polymerization behavior of the monosilicic acid.
The differences in the interaction kinetics between Am(III) and Th(IV)/U(VI)
support the idea of distinct incorporation mechanisms suggested earlier from the incorpo-
ration patterns.
4.1.3 Capacity of colloids to incorporate actinides
The results presented in this section refer to the maximum concentration of acti-
nide possible to be incorporated into the HAS colloids generated from either monosilicic
or polysilicic acid. For this purpose, increasing amounts of actinide (up to 8x10⁻³ M U,
1x10⁻³ M Th and 5x 10⁻⁴ M Eu, as chemical homologue of Am, are separately included in
the generation process of the HAS colloids, in addition to a constant tracer amount of the
actinide of interest. Figure 4.7 illustrates selected results for the actinide fraction incorpo-
rated into the colloidal phase as a function of actinide concentration for coprecipitation
samples after 35 days conditioning time in the pH range 7-9. The results refer to the acti-
nide behaviour in presence of HAS colloids from monosilicic and polysilicic acid and also
to blank samples containing only the actinide.
Regarding the results on Am(III) and Th(IV) [25], several remarks can be made as
described in the followings. In the selected pH range 7-9, the maximum concentration of
the incorporated Am(Eu) is found to be of approximately 4.5x10⁻⁵ M for HAS colloids
formed from polysilicic acid out of a solution of 1.3x10⁻² M Si and 1.5x10⁻⁴ M Al. Taking
into account the Si/Al atomic ratio in the HAS colloids of approximately 1 (as discussed
in section 2.2.1), the incorporated Am(Eu) has been found to correspond in this case to
about 50 % of Al or Si concentration in the HAS. Similarly, the maximum colloid-borne
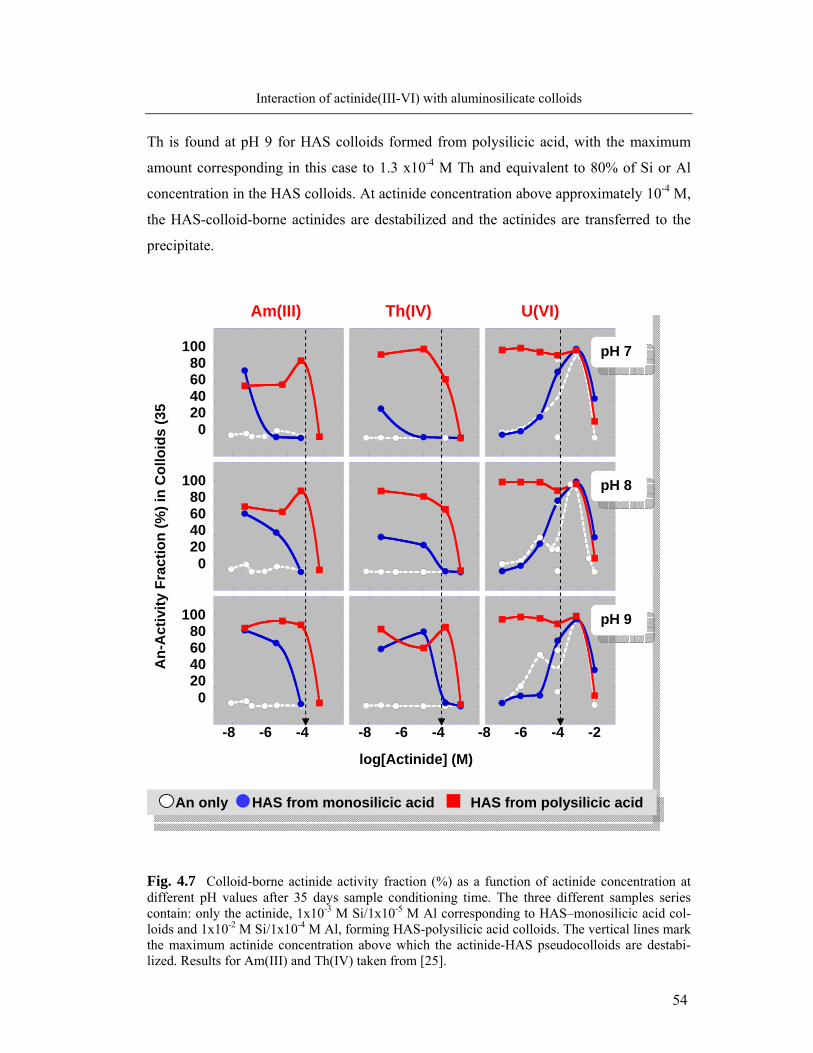
54
Interaction of actinide(III-VI) with aluminosilicate colloids
Th is found at pH 9 for HAS colloids formed from polysilicic acid, with the maximum
amount corresponding in this case to 1.3 x10⁻⁴ M Th and equivalent to 80% of Si or Al
concentration in the HAS colloids. At actinide concentration above approximately 10-4 M,
the HAS-colloid-borne actinides are destabilized and the actinides are transferred to the
precipitate.
Fig. 4.7 Colloid-borne actinide activity fraction (%) as a function of actinide concentration at different pH values after 35 days sample conditioning time. The three different samples series contain: only the actinide, 1x10⁻³ M Si/1x10-5 M Al corresponding to HAS–monosilicic acid col-loids and 1x10⁻² M Si/1x10-4 M Al, forming HAS-polysilicic acid colloids. The vertical lines mark the maximum actinide concentration above which the actinide-HAS pseudocolloids are destabi-lized. Results for Am(III) and Th(IV) taken from [25].
An only HAS from monosilicic acid HAS from polysilicic acid
-8 -6 -4
100 80 60 40 20 0
An-
Act
ivity
Fra
ctio
n (%
) in
Col
loid
s (3
5
log[Actinide] (M)
pH 7
pH 9
pH 8
Am(III) Th(IV) U(VI)
100 80 60 40 20 0
100 80 60 40 20 0
-8 -6 -4 -8 -6 -4 -2
55
Interaction of actinide(III-VI) with aluminosilicate colloids
HAS colloids generated from monosilicic acid appear to have lower capacity to
hold Am(Eu) and even much lower for Th, in the latter case a 100 times less as compared
to the HAS generated from polysilicic acid. For both HAS-monosilicic or polysilicic acid
colloids the capacity of incorporating Am and Th increases generally with increasing pH.
As can be observed in Fig. 4.7, the HAS colloids generated from polysilicic acid
in the pH range 7-9 appear to have also high capacity to incorporate U. We can unambi-
guously differentiate at pH 7-8 a maximum concentration of incorporated U of 6x10⁻⁶ M
(corresponding to approximately 78% of 8x10⁻⁶ M U migrating from the mother solution
to the HAS). The capacity of the HAS colloids formed from monosilicic acid appears to
be very low irrespective of the pH. Similar to the case of Am and Th, the maximum
amount of U migrating from solution to the HAS colloids seems to be limited by the con-
centration of Si or Al in the HAS colloids (10-4 M). Unfortunately at U concentration
around 10-4 M the generation of U real colloids becomes abundant and the fraction of col-
loid-borne U in presence of Si and Al is similar to that in blank solutions, preventing us to
draw a clear conclusion. Generation of a marginal amount of colloidal U can be observed
in the blank samples already at U concentration of approximately 8x10⁻⁶ M, which is
above the equilibrium concentration corresponding to the solubility limit of U(VI) ox-
ides/hydroxides [61]. Formation of U(VI) real colloids is documented in the literature [5].
Polynuclear complexes like (UO2)2(OH)2+2 and (UO2)3(OH)+
5 are reported to form at U
concentration above 10-6 M in the neutral pH range [31, 93-95] and further condensation
of such compounds via oxo-bridging may lead to the colloids generation. The large oscil-
lations observed in the blank curve at U concentration around 8x10⁻⁵ M U indicate the re-
gion of low stability at the onset of U colloid formation. We observe that at concentration
above 10-3 M U the colloidal phase is destabilized and U is transferred to the precipitate.
To summarize, the general observed trend is that the amount of actinide incorpo-
rable into the HAS colloids increases with pH and Si concentration and is correlated with
the presence of polysilicic acid species. Affinity of HAS colloids generated from
monosilicic acid for actinides decreases in the order Am(III) > Th(IV) ≥ U(VI).
4.2 Spectroscopic speciation of aluminosilicate colloid-borne actinides
The results presented in the previous section have evidenced the conditions (pH,
concentration of Si and Al) required for the optimum formation of An-HAS pseudocol-
56
Interaction of actinide(III-VI) with aluminosilicate colloids
loids. In the followings TRLFS and EXAFS spectroscopy are applied in order to describe
the chemical binding of the actinides to the aluminosilicate colloids. Both methods have
limitations. Thus, TRLFS cannot be applied in the case of Th(IV) and Np(V) [96] and its
application is more difficult in case of U(VI) as does not provide information about the
number of water molecules remaining in the U coordination sphere. EXAFS sensitivity is
limited to the tenths of millimolar An concentration that is beyond the level that ensures
stability of the colloidal phase. An binding state within the aluminosilicate bulk can be
investigated, but one should be aware of the fact that the type of binding may change with
concentration. EXAFS measurements are performed in order to investigate the coordina-
tion environment of An(III-VI) coprecipitating with the aluminosilicates. The questions to
be answer are: what types of bonds occur at the interaction of actinides with the alumi-
nosilicates? How many atoms of Si/Al are coordinated via oxo-bridges? In other words,
how strong is the interaction between the actinide and the aluminosilicate ligand? The
comparison of the results for Eu(III) with those obtained for Cm(III) by TRLFS is also
aimed. The essence of the previous work based on TRLFS is summarized in the next sec-
tion.
4.2.1 Cm(III): Time resolved laser florescence spectroscopy (TRLFS)
TRLFS is the method dedicated to characterize the binding state of trace amounts
of Cm(III), the chemical analogue of Am(III). This method has been applied by Panak et
al. for studying the speciation of colloid-borne Cm(III) in the HAS solutions generated
from both monosilicic and polysilicic acid and the results have been reported in [25-28,
97].
Selected speciation results are illustrated in Fig. 4.8 for Cm in HAS solution gen-
erated from polysilicic acid, which have been shown to favor formation of maximum col-
loid-borne Am(III) (Fig. 4.8 a). The graph in the upper part of Fig. 4.8 b depicts the de-
convoluted fluorescence spectra of different Cm species present in solution with increas-
ing pH, whereas the graph in the lower part illustrates the species fractions as a function
of pH. The shift of the emission peak towards higher wavelength with increasing pH is
attributed to the formation of inner-sphere complexes by an exchange of water molecules
with the complexing ligand, either aluminosilicate or silicate. In addition to the Cm aquo
ion with its characteristic emission at 593.8 nm and a life time of about 65 µs, three
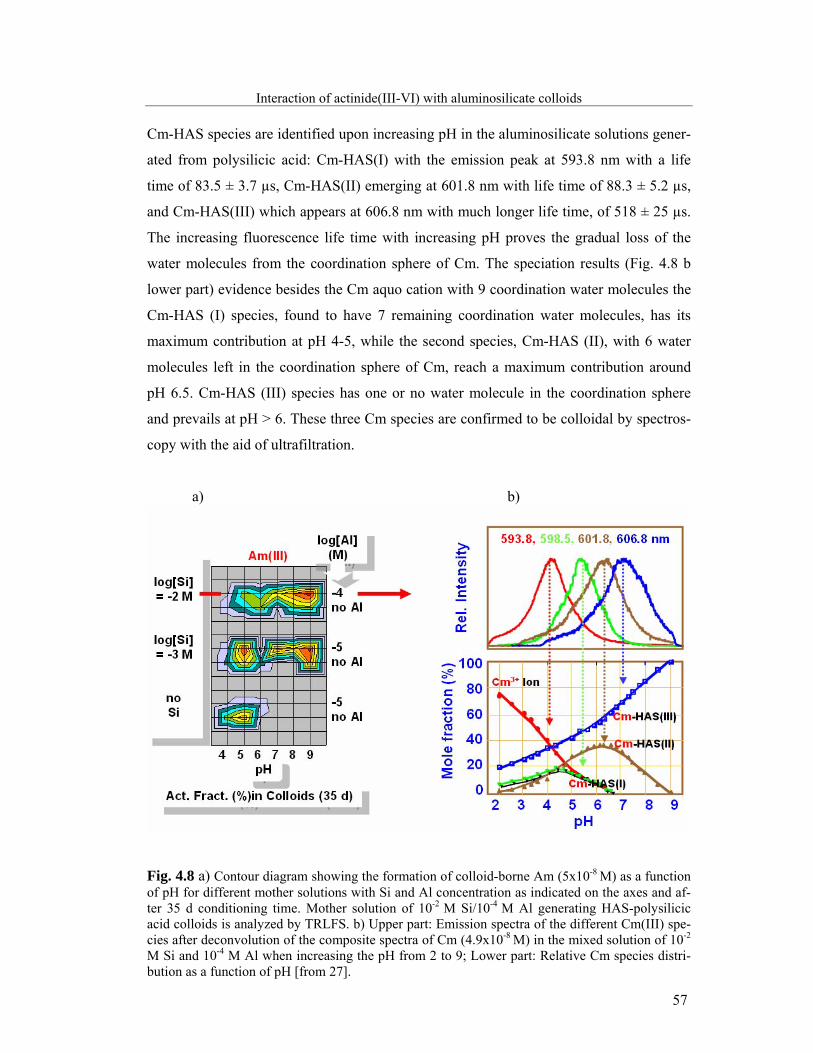
57
Interaction of actinide(III-VI) with aluminosilicate colloids Cm-HAS species are identified upon increasing pH in the aluminosilicate solutions gener-
ated from polysilicic acid: Cm-HAS(I) with the emission peak at 593.8 nm with a life
time of 83.5 ± 3.7 µs, Cm-HAS(II) emerging at 601.8 nm with life time of 88.3 ± 5.2 µs,
and Cm-HAS(III) which appears at 606.8 nm with much longer life time, of 518 ± 25 µs.
The increasing fluorescence life time with increasing pH proves the gradual loss of the
water molecules from the coordination sphere of Cm. The speciation results (Fig. 4.8 b
lower part) evidence besides the Cm aquo cation with 9 coordination water molecules the
Cm-HAS (I) species, found to have 7 remaining coordination water molecules, has its
maximum contribution at pH 4-5, while the second species, Cm-HAS (II), with 6 water
molecules left in the coordination sphere of Cm, reach a maximum contribution around
pH 6.5. Cm-HAS (III) species has one or no water molecule in the coordination sphere
and prevails at pH > 6. These three Cm species are confirmed to be colloidal by spectros-
copy with the aid of ultrafiltration.
a) b)
Fig. 4.8 a) Contour diagram showing the formation of colloid-borne Am (5x10⁻⁸ M) as a function of pH for different mother solutions with Si and Al concentration as indicated on the axes and af-ter 35 d conditioning time. Mother solution of 10-2 M Si/10-4 M Al generating HAS-polysilicic acid colloids is analyzed by TRLFS. b) Upper part: Emission spectra of the different Cm(III) spe-cies after deconvolution of the composite spectra of Cm (4.9x10⁻⁸ M) in the mixed solution of 10-2
M Si and 10-4 M Al when increasing the pH from 2 to 9; Lower part: Relative Cm species distri-bution as a function of pH [from 27].
58
Interaction of actinide(III-VI) with aluminosilicate colloids The authors also report similar spectroscopic characteristics and species distribution pat-
tern for Cm in solution containing only polysilicic acid and those for Cm in HAS gener-
ated from polysilicic acid. On this basis, the authors suggest a similar kind of chemical
binding of Cm within the HAS and the Cm-HPSi, rather with the silanol (Si-OH) moie-
ties, than with the aluminol (Al-OH) groups. This assumption appears to be supported by
the spectroscopic characteristics observed at the interaction of Cm with a suspension of Al
hydroxide, showed to be significantly different from those observed in the experiment for
the Cm-HAS formation. Based on the number of the water molecules remaining in the
coordination sphere of Cm upon the complexation with the silicate ligand, the oxo-
bridging binding state of Cm in aluminosilicate/silicate colloids is characterized as bi-
dentate for Cm-HAS (I) and tri-dentate for Cm-HAS (II), respectively. Since in case of
Cm-HAS (III) species there is virtually no coordination water molecule left in the coordi-
nation sphere of Cm, this species corresponds to the complete incorporation of Cm via
multidentate oxo-bridging into the colloidal bulk. The results for the speciation of Cm in
aluminosilicate solution generated from monosilicic acid (not shown here) have evidenced
the formation of two colloid-borne species with spectroscopic characteristics similar to
those of Cm-HAS(I) and Cm-HAS(II) for HAS generated from polysilicic acid. However,
the Cm-HAS (III) species is not observed at the speciation of Cm in HAS solutions from
monosilicic acid and therefore, its formation appears to be conditioned by the presence of
the polysilicic acid at pH > 6. The formation of this complete incorporated Cm species is
ascribed to the catalytic effect of the polysilicic acid in reducing the energy barrier of the
conucleation. Moreover, the authors observe the formation of the Cm-HAS(III) when
heating at 90° C for about 90 days the colloids generated in aluminosilicate solutions pre-
pared at pH 7.5 from monosilicic acid [25]. It appears that Cm incorporation into HAS
increases with pH, Si concentration and temperature. These are thermodynamic but also
kinetic parameters enhancing the polymerization rate of Si. As suggested by the Arrehnius
equation: ln (k2/k1) = Ea/R(1/T1-1/T2), where k1, k2 are the rate constants at temperatures
T1 and T2, Ea is the activation energy and R is the gas constant, the temperature effect
might be achieved by increasing the aging time of the mother solution. In relation to this
aspect, we shall refer in section 4.3.2 to the possible influence of the aging time on the
binding strength. Fig. 4.9 gives an overview on the Cm- HAS species identified in alumi-
nosilicate solutions under different experimental conditions.
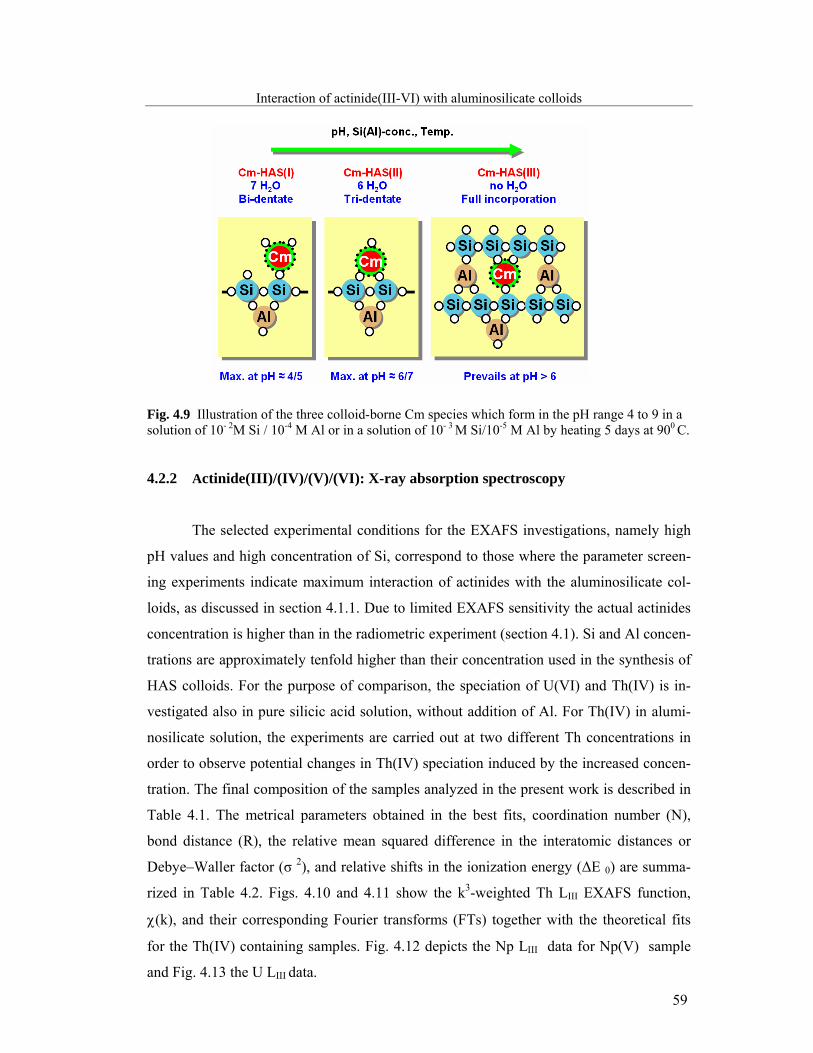
59
Interaction of actinide(III-VI) with aluminosilicate colloids
Fig. 4.9 Illustration of the three colloid-borne Cm species which form in the pH range 4 to 9 in a solution of 10- 2M Si / 10-4 M Al or in a solution of 10- 3 M Si/10-5 M Al by heating 5 days at 900 C. 4.2.2 Actinide(III)/(IV)/(V)/(VI): X-ray absorption spectroscopy
The selected experimental conditions for the EXAFS investigations, namely high
pH values and high concentration of Si, correspond to those where the parameter screen-
ing experiments indicate maximum interaction of actinides with the aluminosilicate col-
loids, as discussed in section 4.1.1. Due to limited EXAFS sensitivity the actual actinides
concentration is higher than in the radiometric experiment (section 4.1). Si and Al concen-
trations are approximately tenfold higher than their concentration used in the synthesis of
HAS colloids. For the purpose of comparison, the speciation of U(VI) and Th(IV) is in-
vestigated also in pure silicic acid solution, without addition of Al. For Th(IV) in alumi-
nosilicate solution, the experiments are carried out at two different Th concentrations in
order to observe potential changes in Th(IV) speciation induced by the increased concen-
tration. The final composition of the samples analyzed in the present work is described in
Table 4.1. The metrical parameters obtained in the best fits, coordination number (N),
bond distance (R), the relative mean squared difference in the interatomic distances or
Debye–Waller factor (σ 2), and relative shifts in the ionization energy (ΔE 0) are summa-
rized in Table 4.2. Figs. 4.10 and 4.11 show the k3-weighted Th LIII EXAFS function,
χ(k), and their corresponding Fourier transforms (FTs) together with the theoretical fits
for the Th(IV) containing samples. Fig. 4.12 depicts the Np LIII data for Np(V) sample
and Fig. 4.13 the U LIII data.
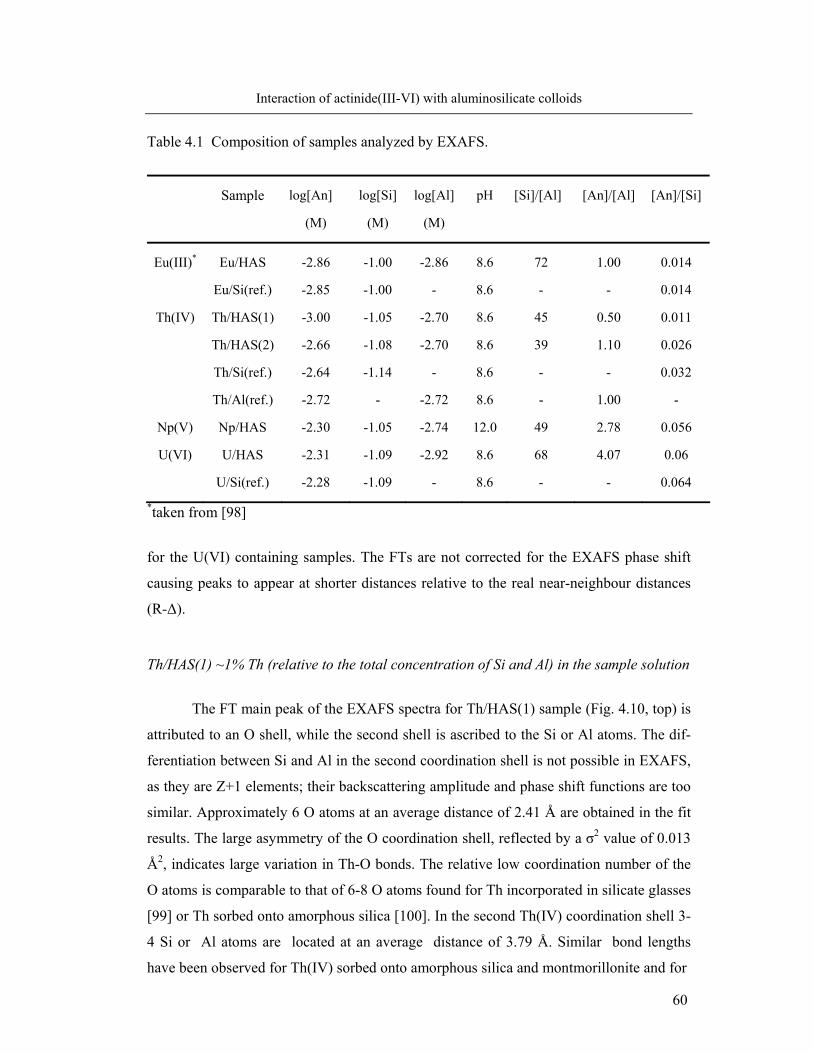
60
Interaction of actinide(III-VI) with aluminosilicate colloids
Table 4.1 Composition of samples analyzed by EXAFS.
Sample
log[An]
(M)
log[Si]
(M)
log[Al]
(M)
pH
[Si]/[Al]
[An]/[Al]
[An]/[Si]
Eu(III)*
Eu/HAS
-2.86
-1.00
-2.86
8.6
72
1.00
0.014
Eu/Si(ref.) -2.85 -1.00 - 8.6 - - 0.014
Th(IV) Th/HAS(1) -3.00 -1.05 -2.70 8.6 45 0.50 0.011
Th/HAS(2) -2.66 -1.08 -2.70 8.6 39 1.10 0.026
Th/Si(ref.) -2.64 -1.14 - 8.6 - - 0.032
Th/Al(ref.) -2.72 - -2.72 8.6 - 1.00 -
Np(V) Np/HAS -2.30 -1.05 -2.74 12.0 49 2.78 0.056
U(VI) U/HAS -2.31 -1.09 -2.92 8.6 68 4.07 0.06
U/Si(ref.) -2.28 -1.09 - 8.6 - - 0.064
*taken from [98]
for the U(VI) containing samples. The FTs are not corrected for the EXAFS phase shift
causing peaks to appear at shorter distances relative to the real near-neighbour distances
(R-Δ).
Th/HAS(1) ~1% Th (relative to the total concentration of Si and Al) in the sample solution
The FT main peak of the EXAFS spectra for Th/HAS(1) sample (Fig. 4.10, top) is
attributed to an O shell, while the second shell is ascribed to the Si or Al atoms. The dif-
ferentiation between Si and Al in the second coordination shell is not possible in EXAFS,
as they are Z+1 elements; their backscattering amplitude and phase shift functions are too
similar. Approximately 6 O atoms at an average distance of 2.41 Å are obtained in the fit
results. The large asymmetry of the O coordination shell, reflected by a σ2 value of 0.013
Å2, indicates large variation in Th-O bonds. The relative low coordination number of the
O atoms is comparable to that of 6-8 O atoms found for Th incorporated in silicate glasses
[99] or Th sorbed onto amorphous silica [100]. In the second Th(IV) coordination shell 3-
4 Si or Al atoms are located at an average distance of 3.79 Å. Similar bond lengths
have been observed for Th(IV) sorbed onto amorphous silica and montmorillonite and for
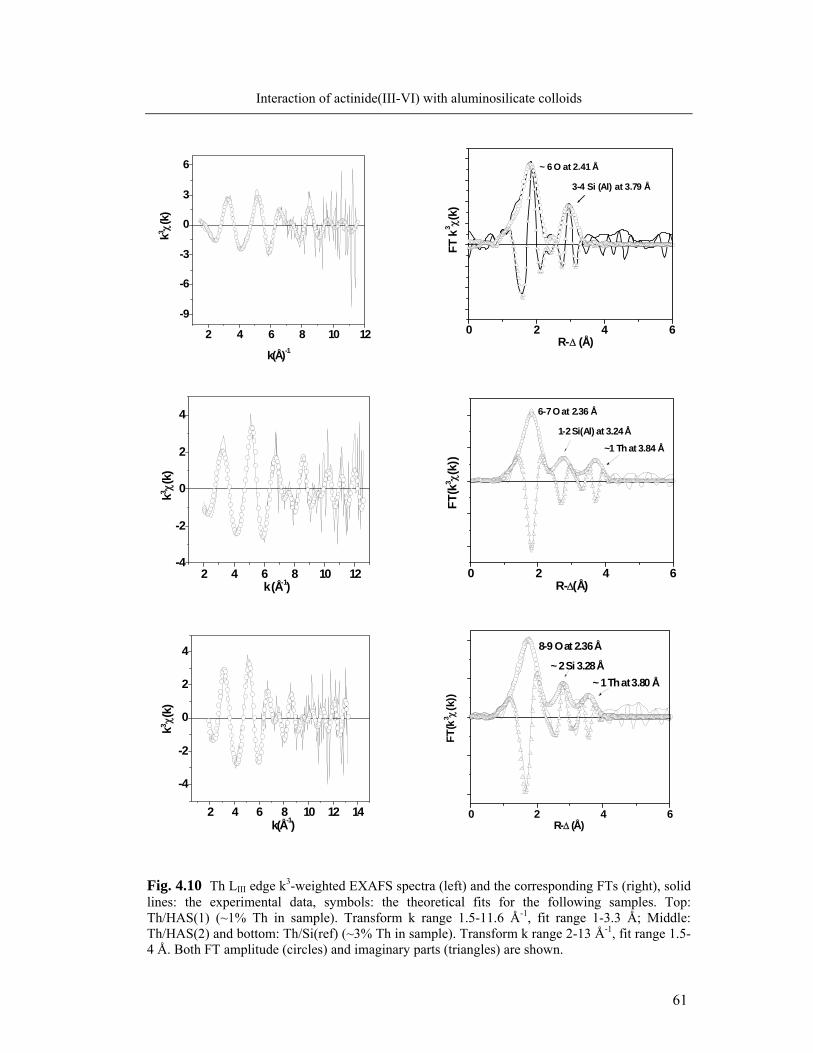
61
Interaction of actinide(III-VI) with aluminosilicate colloids
2 4 6 8 10 12
-9
-6
-3
0
3
6k3 χ(
k)
k(Å)-1
0 2 4 6
3-4 Si (Al) at 3.79 Å
~ 6 O at 2.41 Å
FT k
3 χ(k)
R-Δ (Å)
2 4 6 8 10 12-4
-2
0
2
4
k3 χ(k)
k (Å-1)
0 2 4 6
1-2 Si(Al) at 3.24 Å
~1 Th at 3.84 Å
6-7 O at 2.36 Å
FT(k
3 χ(k)
)
R-Δ(Å)
2 4 6 8 10 12 14
-4
-2
0
2
4
k3 χ(k)
k(Å-1)
0 2 4 6
~ 1 Th at 3.80 Å
~ 2 Si 3.28 Å
8-9 O at 2.36 Å
FT(k
3 χ(k)
)
R-Δ (Å)
Fig. 4.10 Th LIII edge k3-weighted EXAFS spectra (left) and the corresponding FTs (right), solid lines: the experimental data, symbols: the theoretical fits for the following samples. Top: Th/HAS(1) (~1% Th in sample). Transform k range 1.5-11.6 Å-1, fit range 1-3.3 Å; Middle: Th/HAS(2) and bottom: Th/Si(ref) (~3% Th in sample). Transform k range 2-13 Å-1, fit range 1.5-4 Å. Both FT amplitude (circles) and imaginary parts (triangles) are shown.
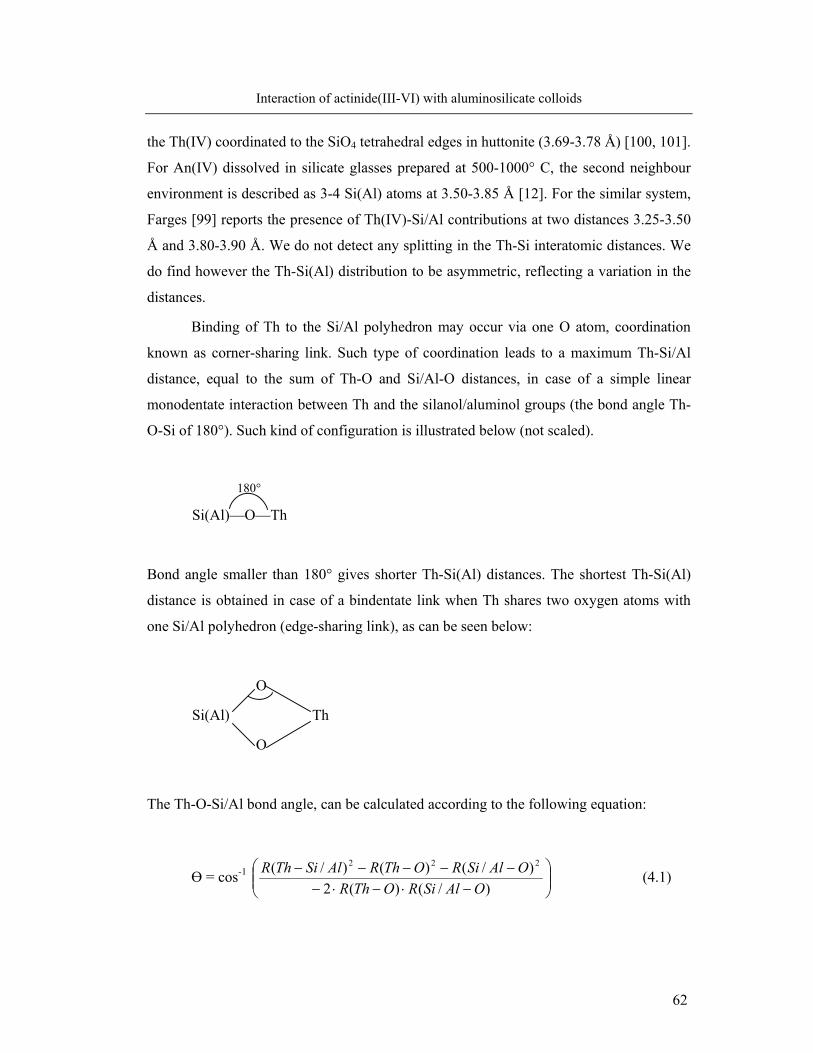
62
Interaction of actinide(III-VI) with aluminosilicate colloids
the Th(IV) coordinated to the SiO4 tetrahedral edges in huttonite (3.69-3.78 Å) [100, 101].
For An(IV) dissolved in silicate glasses prepared at 500-1000° C, the second neighbour
environment is described as 3-4 Si(Al) atoms at 3.50-3.85 Å [12]. For the similar system,
Farges [99] reports the presence of Th(IV)-Si/Al contributions at two distances 3.25-3.50
Å and 3.80-3.90 Å. We do not detect any splitting in the Th-Si interatomic distances. We
do find however the Th-Si(Al) distribution to be asymmetric, reflecting a variation in the
distances.
Binding of Th to the Si/Al polyhedron may occur via one O atom, coordination
known as corner-sharing link. Such type of coordination leads to a maximum Th-Si/Al
distance, equal to the sum of Th-O and Si/Al-O distances, in case of a simple linear
monodentate interaction between Th and the silanol/aluminol groups (the bond angle Th-
O-Si of 180°). Such kind of configuration is illustrated below (not scaled).
180°
Si(Al)—O—Th
Bond angle smaller than 180° gives shorter Th-Si(Al) distances. The shortest Th-Si(Al)
distance is obtained in case of a bindentate link when Th shares two oxygen atoms with
one Si/Al polyhedron (edge-sharing link), as can be seen below:
O
Si(Al) Th
O
The Th-O-Si/Al bond angle, can be calculated according to the following equation:
Ө = cos-1 ⎟⎟⎠
⎞⎜⎜⎝
⎛−⋅−⋅−
−−−−−)/()(2
)/()()/( 222
OAlSiROThROAlSiROThRAlSiThR (4.1)
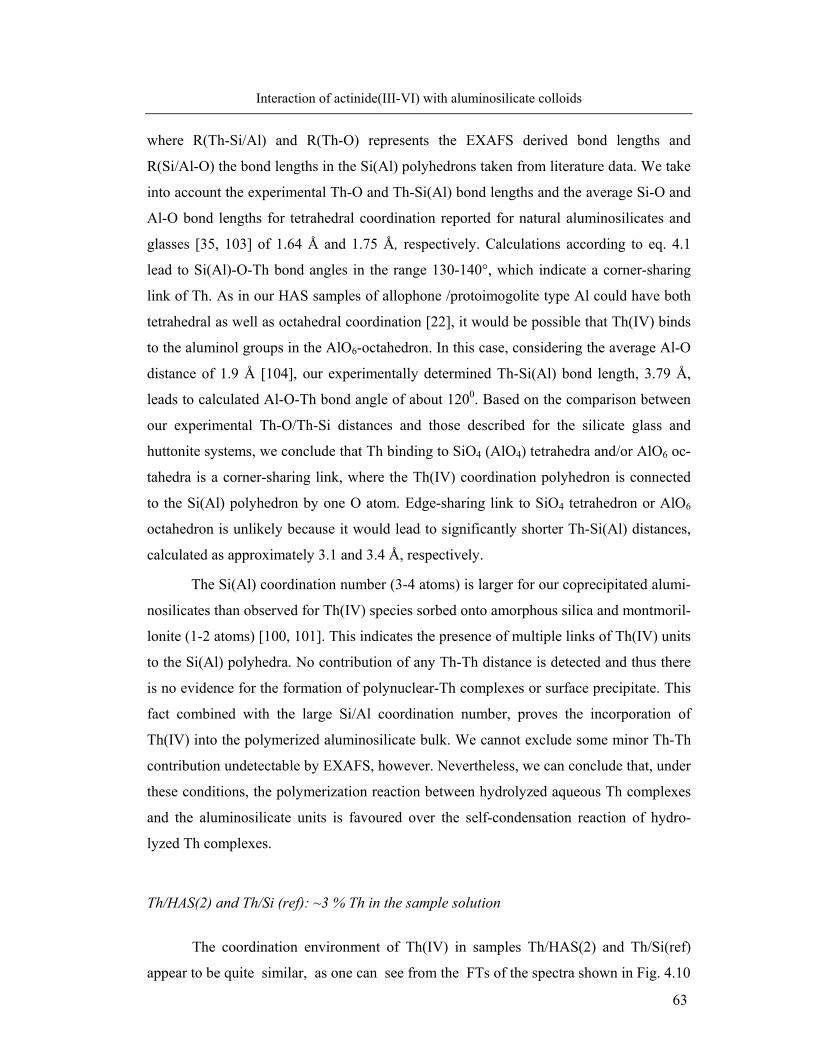
63
Interaction of actinide(III-VI) with aluminosilicate colloids
where R(Th-Si/Al) and R(Th-O) represents the EXAFS derived bond lengths and
R(Si/Al-O) the bond lengths in the Si(Al) polyhedrons taken from literature data. We take
into account the experimental Th-O and Th-Si(Al) bond lengths and the average Si-O and
Al-O bond lengths for tetrahedral coordination reported for natural aluminosilicates and
glasses [35, 103] of 1.64 Å and 1.75 Å, respectively. Calculations according to eq. 4.1
lead to Si(Al)-O-Th bond angles in the range 130-140°, which indicate a corner-sharing
link of Th. As in our HAS samples of allophone /protoimogolite type Al could have both
tetrahedral as well as octahedral coordination [22], it would be possible that Th(IV) binds
to the aluminol groups in the AlO6-octahedron. In this case, considering the average Al-O
distance of 1.9 Å [104], our experimentally determined Th-Si(Al) bond length, 3.79 Å,
leads to calculated Al-O-Th bond angle of about 1200. Based on the comparison between
our experimental Th-O/Th-Si distances and those described for the silicate glass and
huttonite systems, we conclude that Th binding to SiO4 (AlO4) tetrahedra and/or AlO6 oc-
tahedra is a corner-sharing link, where the Th(IV) coordination polyhedron is connected
to the Si(Al) polyhedron by one O atom. Edge-sharing link to SiO4 tetrahedron or AlO6
octahedron is unlikely because it would lead to significantly shorter Th-Si(Al) distances,
calculated as approximately 3.1 and 3.4 Å, respectively.
The Si(Al) coordination number (3-4 atoms) is larger for our coprecipitated alumi-
nosilicates than observed for Th(IV) species sorbed onto amorphous silica and montmoril-
lonite (1-2 atoms) [100, 101]. This indicates the presence of multiple links of Th(IV) units
to the Si(Al) polyhedra. No contribution of any Th-Th distance is detected and thus there
is no evidence for the formation of polynuclear-Th complexes or surface precipitate. This
fact combined with the large Si/Al coordination number, proves the incorporation of
Th(IV) into the polymerized aluminosilicate bulk. We cannot exclude some minor Th-Th
contribution undetectable by EXAFS, however. Nevertheless, we can conclude that, under
these conditions, the polymerization reaction between hydrolyzed aqueous Th complexes
and the aluminosilicate units is favoured over the self-condensation reaction of hydro-
lyzed Th complexes.
Th/HAS(2) and Th/Si (ref): ~3 % Th in the sample solution
The coordination environment of Th(IV) in samples Th/HAS(2) and Th/Si(ref)
appear to be quite similar, as one can see from the FTs of the spectra shown in Fig. 4.10
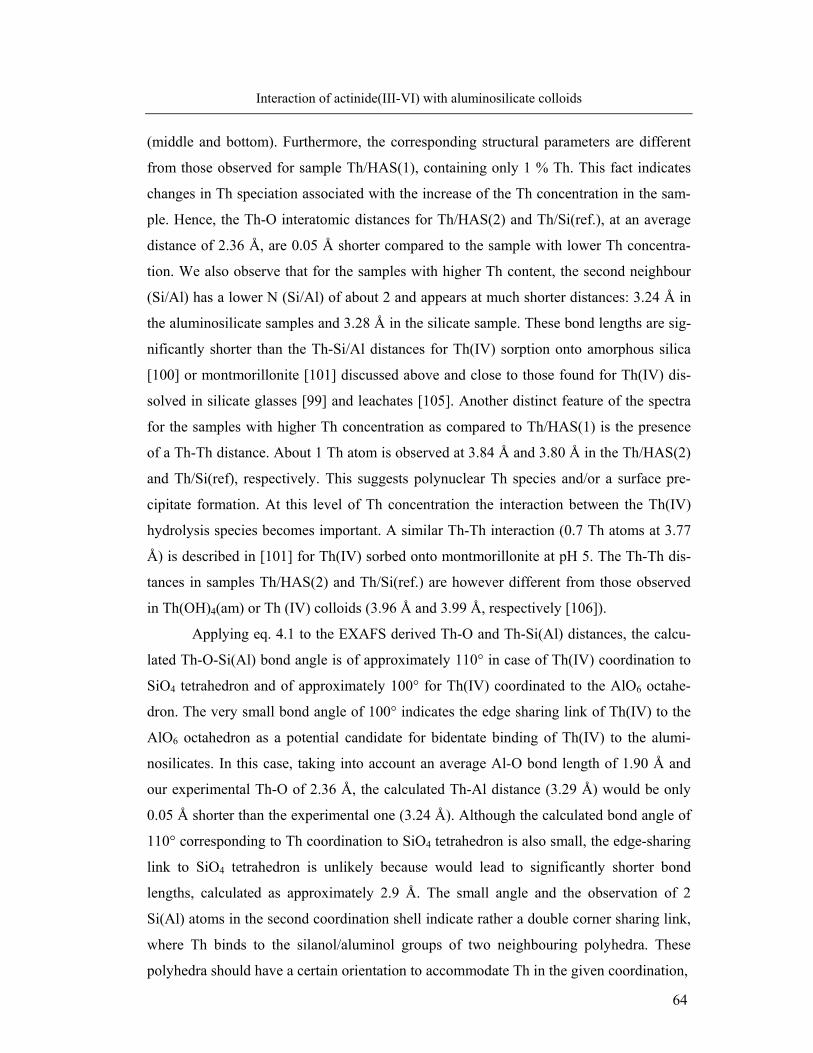
64
Interaction of actinide(III-VI) with aluminosilicate colloids
(middle and bottom). Furthermore, the corresponding structural parameters are different
from those observed for sample Th/HAS(1), containing only 1 % Th. This fact indicates
changes in Th speciation associated with the increase of the Th concentration in the sam-
ple. Hence, the Th-O interatomic distances for Th/HAS(2) and Th/Si(ref.), at an average
distance of 2.36 Å, are 0.05 Å shorter compared to the sample with lower Th concentra-
tion. We also observe that for the samples with higher Th content, the second neighbour
(Si/Al) has a lower N (Si/Al) of about 2 and appears at much shorter distances: 3.24 Å in
the aluminosilicate samples and 3.28 Å in the silicate sample. These bond lengths are sig-
nificantly shorter than the Th-Si/Al distances for Th(IV) sorption onto amorphous silica
[100] or montmorillonite [101] discussed above and close to those found for Th(IV) dis-
solved in silicate glasses [99] and leachates [105]. Another distinct feature of the spectra
for the samples with higher Th concentration as compared to Th/HAS(1) is the presence
of a Th-Th distance. About 1 Th atom is observed at 3.84 Å and 3.80 Å in the Th/HAS(2)
and Th/Si(ref), respectively. This suggests polynuclear Th species and/or a surface pre-
cipitate formation. At this level of Th concentration the interaction between the Th(IV)
hydrolysis species becomes important. A similar Th-Th interaction (0.7 Th atoms at 3.77
Å) is described in [101] for Th(IV) sorbed onto montmorillonite at pH 5. The Th-Th dis-
tances in samples Th/HAS(2) and Th/Si(ref.) are however different from those observed
in Th(OH)4(am) or Th (IV) colloids (3.96 Å and 3.99 Å, respectively [106]).
Applying eq. 4.1 to the EXAFS derived Th-O and Th-Si(Al) distances, the calcu-
lated Th-O-Si(Al) bond angle is of approximately 110° in case of Th(IV) coordination to
SiO4 tetrahedron and of approximately 100° for Th(IV) coordinated to the AlO6 octahe-
dron. The very small bond angle of 100° indicates the edge sharing link of Th(IV) to the
AlO6 octahedron as a potential candidate for bidentate binding of Th(IV) to the alumi-
nosilicates. In this case, taking into account an average Al-O bond length of 1.90 Å and
our experimental Th-O of 2.36 Å, the calculated Th-Al distance (3.29 Å) would be only
0.05 Å shorter than the experimental one (3.24 Å). Although the calculated bond angle of
110° corresponding to Th coordination to SiO4 tetrahedron is also small, the edge-sharing
link to SiO4 tetrahedron is unlikely because would lead to significantly shorter bond
lengths, calculated as approximately 2.9 Å. The small angle and the observation of 2
Si(Al) atoms in the second coordination shell indicate rather a double corner sharing link,
where Th binds to the silanol/aluminol groups of two neighbouring polyhedra. These
polyhedra should have a certain orientation to accommodate Th in the given coordination,
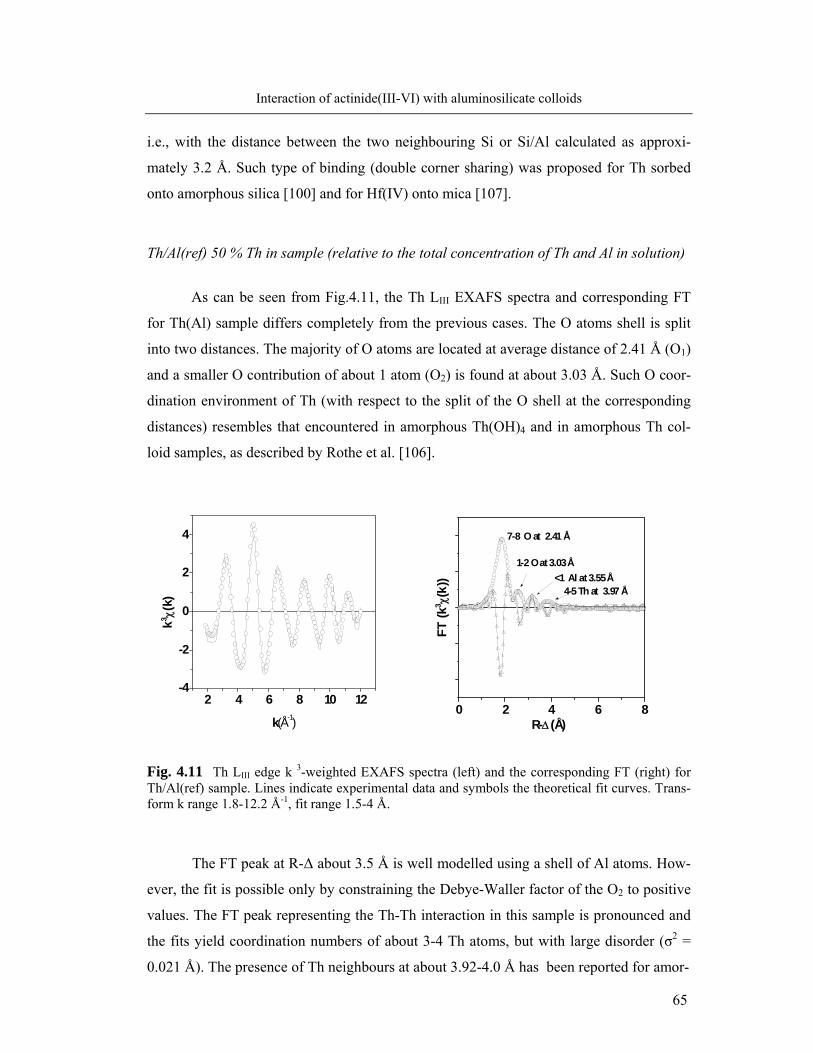
65
Interaction of actinide(III-VI) with aluminosilicate colloids
i.e., with the distance between the two neighbouring Si or Si/Al calculated as approxi-
mately 3.2 Å. Such type of binding (double corner sharing) was proposed for Th sorbed
onto amorphous silica [100] and for Hf(IV) onto mica [107].
Th/Al(ref) 50 % Th in sample (relative to the total concentration of Th and Al in solution)
As can be seen from Fig.4.11, the Th LIII EXAFS spectra and corresponding FT
for Th(Al) sample differs completely from the previous cases. The O atoms shell is split
into two distances. The majority of O atoms are located at average distance of 2.41 Å (O1)
and a smaller O contribution of about 1 atom (O2) is found at about 3.03 Å. Such O coor-
dination environment of Th (with respect to the split of the O shell at the corresponding
distances) resembles that encountered in amorphous Th(OH)4 and in amorphous Th col-
loid samples, as described by Rothe et al. [106].
2 4 6 8 10 12-4
-2
0
2
4
k3 χ(k)
k(Å-1)
0 2 4 6 8R-Δ (Å)
<1 Al at 3.55 Å 1-2 O at 3.03 Å
7-8 O at 2.41 Å
FT (k
3 χ(k)
)
4-5 Th at 3.97 Å
Fig. 4.11 Th LIII edge k 3-weighted EXAFS spectra (left) and the corresponding FT (right) for Th/Al(ref) sample. Lines indicate experimental data and symbols the theoretical fit curves. Trans-form k range 1.8-12.2 Å-1, fit range 1.5-4 Å.
The FT peak at R-Δ about 3.5 Å is well modelled using a shell of Al atoms. How-
ever, the fit is possible only by constraining the Debye-Waller factor of the O2 to positive
values. The FT peak representing the Th-Th interaction in this sample is pronounced and
the fits yield coordination numbers of about 3-4 Th atoms, but with large disorder (σ2 =
0.021 Å). The presence of Th neighbours at about 3.92-4.0 Å has been reported for amor-
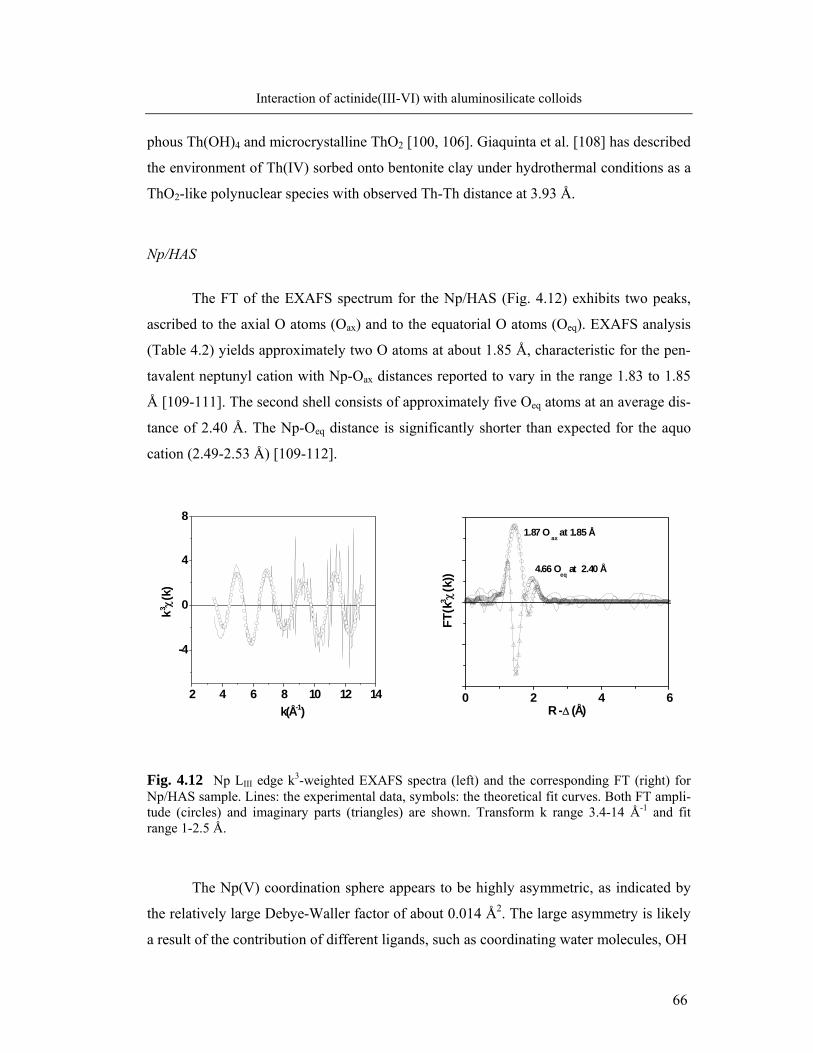
66
Interaction of actinide(III-VI) with aluminosilicate colloids
phous Th(OH)4 and microcrystalline ThO2 [100, 106]. Giaquinta et al. [108] has described
the environment of Th(IV) sorbed onto bentonite clay under hydrothermal conditions as a
ThO2-like polynuclear species with observed Th-Th distance at 3.93 Å.
Np/HAS
The FT of the EXAFS spectrum for the Np/HAS (Fig. 4.12) exhibits two peaks,
ascribed to the axial O atoms (Oax) and to the equatorial O atoms (Oeq). EXAFS analysis
(Table 4.2) yields approximately two O atoms at about 1.85 Å, characteristic for the pen-
tavalent neptunyl cation with Np-Oax distances reported to vary in the range 1.83 to 1.85
Å [109-111]. The second shell consists of approximately five Oeq atoms at an average dis-
tance of 2.40 Å. The Np-Oeq distance is significantly shorter than expected for the aquo
cation (2.49-2.53 Å) [109-112].
2 4 6 8 10 12 14
-4
0
4
8
k(Å-1)
k3 χ(k)
0 2 4 6
4.66 Oeq
at 2.40 Å
1.87 O ax
at 1.85 Å
FT(k
3 χ(k
))
R -Δ (Å)
Fig. 4.12 Np LIII edge k3-weighted EXAFS spectra (left) and the corresponding FT (right) for Np/HAS sample. Lines: the experimental data, symbols: the theoretical fit curves. Both FT ampli-tude (circles) and imaginary parts (triangles) are shown. Transform k range 3.4-14 Å-1 and fit range 1-2.5 Å.
The Np(V) coordination sphere appears to be highly asymmetric, as indicated by
the relatively large Debye-Waller factor of about 0.014 Å2. The large asymmetry is likely
a result of the contribution of different ligands, such as coordinating water molecules, OH
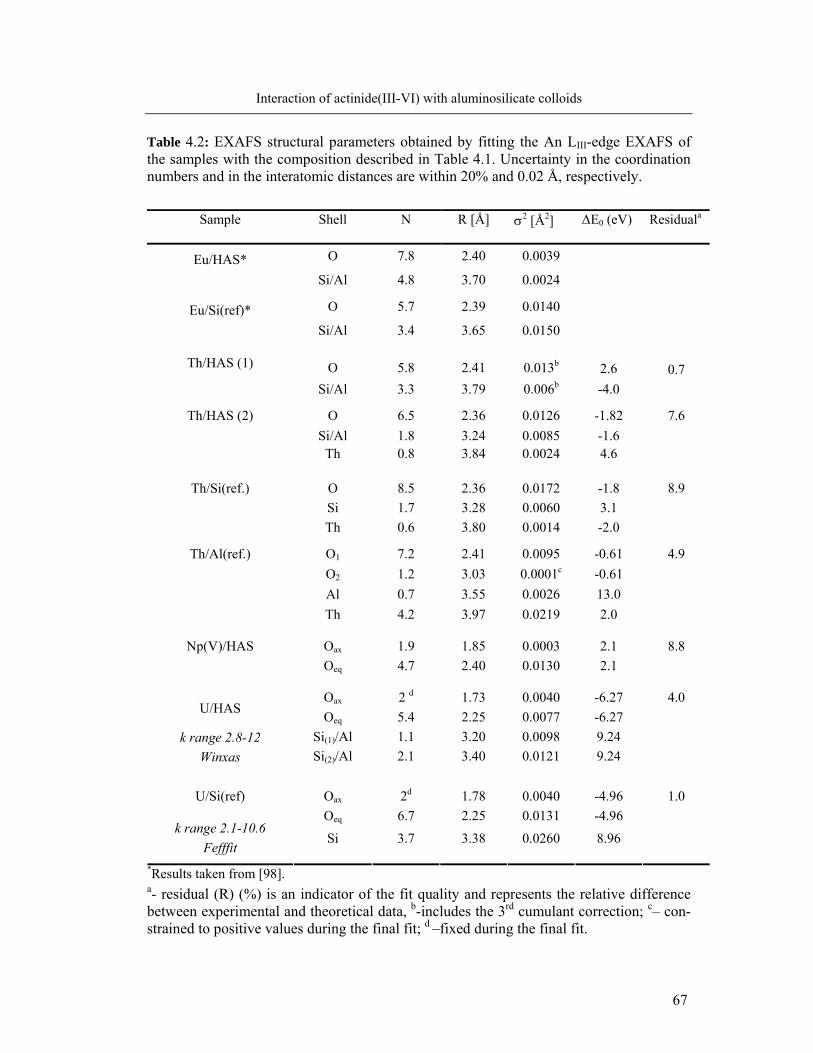
67
Interaction of actinide(III-VI) with aluminosilicate colloids
Table 4.2: EXAFS structural parameters obtained by fitting the An LIII-edge EXAFS of the samples with the composition described in Table 4.1. Uncertainty in the coordination numbers and in the interatomic distances are within 20% and 0.02 Å, respectively.
Sample Shell N R [Å] σ2 [Å2] ΔE0 (eV)
Residuala
O
7.8
2.40
0.0039
Eu/HAS* Si/Al 4.8 3.70 0.0024
O
5.7
2.39
0.0140
Eu/Si(ref)* Si/Al 3.4 3.65 0.0150
O
5.8
2.41
0.013b
2.6
0.7
Th/HAS (1) Si/Al 3.3 3.79 0.006b -4.0
O 6.5 2.36 0.0126 -1.82 7.6 Si/Al 1.8 3.24 0.0085 -1.6
Th/HAS (2)
Th 0.8 3.84 0.0024 4.6
O 8.5 2.36 0.0172 -1.8 8.9 Si 1.7 3.28 0.0060 3.1
Th/Si(ref.)
Th 0.6 3.80 0.0014 -2.0
O1 7.2 2.41 0.0095 -0.61 4.9
O2 1.2 3.03 0.0001c -0.61 Al 0.7 3.55 0.0026 13.0
Th/Al(ref.)
Th 4.2
3.97 0.0219 2.0
Oax 1.9 1.85 0.0003 2.1 8.8 Np(V)/HAS Oeq
4.7 2.40 0.0130 2.1
Oax 2 d 1.73 0.0040 -6.27 4.0 Oeq 5.4 2.25 0.0077 -6.27
Si(1)/Al 1.1 3.20 0.0098 9.24
U/HAS
k range 2.8-12 Winxas
Si(2)/Al 2.1 3.40 0.0121 9.24
Oax 2d 1.78 0.0040 -4.96 1.0 Oeq 6.7 2.25 0.0131 -4.96
U/Si(ref)
k range 2.1-10.6 Fefffit
Si 3.7 3.38 0.0260 8.96
*Results taken from [98]. a- residual (R) (%) is an indicator of the fit quality and represents the relative difference between experimental and theoretical data, b-includes the 3rd cumulant correction; c– con-strained to positive values during the final fit; d –fixed during the final fit.
68
Interaction of actinide(III-VI) with aluminosilicate colloids
groups and the aluminosilicate ligand. We do not detect any Si(Al) coordination shell as
for the other samples that would have been a direct proof of inner sphere complexation
with the aluminosilicate ligand. Also, in the absence of Np-Np interactions there is no
evidence for the formation of a surface precipitate in the sample.
However, that no Np-Si(Al) shell is observed in the FT spectrum does not neces-
sarily exclude the presence of electrostatic and/or inner-sphere interaction between the
Np(V) and the aluminosilicates. Loss in overall EXAFS oscillatory amplitude can result
through destructive interference of a number of oscillations having small differences in
their frequencies due to their small variations in bond length [33, 113]. The literature data
regarding Np(V) in inorganic matrices are rare. The result for the coordination environ-
ment of Np(V) in aluminosilicate solution is similar to that reported for Np(V) embedded
in borosilicate glasses [102]. In the glass matrix the authors observed about 4 Oeq atoms at
mean distance of 2.35 Å. Here, too, no further neighbour distances are detected. The co-
ordination environment of Np(V) sorbed onto kaolinite at pH 9 has been investigated by
Reich et al. [110]. The authors found no evidence of inner-sphere complexation of Np(V)
with the functional groups of the mineral but reported the formation of Np carbonato spe-
cies at the mineral surface. Although under the present experimental conditions of pH 12,
the carbonate concentration should be also quite high [114], the presence of the carbonate
ligand can be excluded since from the EXAFS spectrum there is no evidence of Np-C in-
teractions which have been observed in the above mentioned study at distance of 2.94 Å
[110].
At the moment one cannot draw a clear conclusion about the nature of Np(V) in-
teraction with the aluminosilicates from the EXAFS results. Np(V) association with the
aluminosilicate colloids observed in the radiometric experiments (section 4.1.1) might
have been the result of Np(V) surface complex. A polynuclear complex or surface precipi-
tate formation may be excluded due to the lack of any Np-Np distance in the FT of the
EXAFS spectrum.
U/HAS and U/Si(ref)
The U LIII EXAFS spectra and FT for samples U/HAS and U/Si(ref.) shown in Fig. 4.13
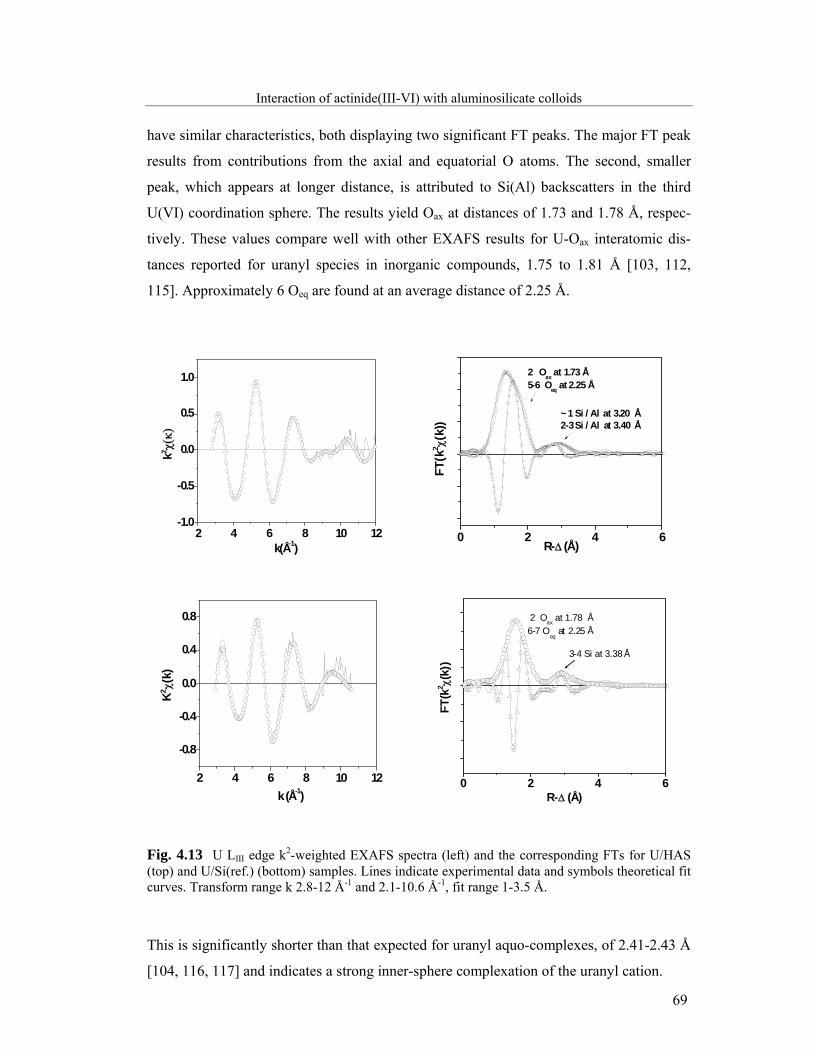
69
Interaction of actinide(III-VI) with aluminosilicate colloids have similar characteristics, both displaying two significant FT peaks. The major FT peak
results from contributions from the axial and equatorial O atoms. The second, smaller
peak, which appears at longer distance, is attributed to Si(Al) backscatters in the third
U(VI) coordination sphere. The results yield Oax at distances of 1.73 and 1.78 Å, respec-
tively. These values compare well with other EXAFS results for U-Oax interatomic dis-
tances reported for uranyl species in inorganic compounds, 1.75 to 1.81 Å [103, 112,
115]. Approximately 6 Oeq are found at an average distance of 2.25 Å.
2 4 6 8 10 12-1.0
-0.5
0.0
0.5
1.0
k2 χ(κ)
k(Å-1)
0 2 4 6
~ 1 Si / Al at 3.20 Å2-3 Si / Al at 3.40 Å
2 Oax at 1.73 Å5-6 Oeq at 2.25 Å
FT(k
2 χ(k)
)
R-Δ (Å)
2 4 6 8 10 12
-0.8
-0.4
0.0
0.4
0.8
K2 χ(k)
k (Å-1)
0 2 4 6
3-4 Si at 3.38 Å
2 Oax at 1.78 Å6-7 O
eq at 2.25 Å
FT(k
2 χ(k)
)
R-Δ (Å)
Fig. 4.13 U LIII edge k2-weighted EXAFS spectra (left) and the corresponding FTs for U/HAS (top) and U/Si(ref.) (bottom) samples. Lines indicate experimental data and symbols theoretical fit curves. Transform range k 2.8-12 Å-1 and 2.1-10.6 Å-1, fit range 1-3.5 Å. This is significantly shorter than that expected for uranyl aquo-complexes, of 2.41-2.43 Å
[104, 116, 117] and indicates a strong inner-sphere complexation of the uranyl cation.
70
Interaction of actinide(III-VI) with aluminosilicate colloids U-Oeq distances near 2.25 Å are 0.09 Å shorter than that reported for the inner-sphere
complexes of uranyl in naturally occuring Al-Si gels found in uranium deposits (2.34 Å),
0.06 Å shorter than that in silicate minerals such as soddyte (2.31 Å), and comparable to
that in U(VI) oxides precipitates formed at pH values above 7 and in uranyl hydroxides
formed under alkaline conditions (2.26 Å) [104, 117-121]. The present results compare
best to the oxygen coordination environment reported for the uranyl cation in silicate
glasses and melts, where approximately 5 O atoms at distance of 2.23 -2.25 Å are ob-
served [103, 122].
The coordination numbers and the average interatomic distances obtained in the
preliminary fit for the second neighbor, Si or Al in the aluminosilicate sample and Si in
the silicate sample, suggest that both samples have a similar U(VI) coordination environ-
ment. However, a significant better fit of the data for the U/HAS sample is obtained with
the third shell split into two distances Si/Al(1) and Si/Al(2). In case of the U/Si(ref) sam-
ple, there is not enough resolution in the interatomic distance due to the limited k range in
this case. The fits using the split shell model yields interatomic distances of about 3.2 and
3.4 Å. The splitting of the Si(Al) shell into two distances observed in the aluminosilicate
sample indicates the possibility that U(VI) exists in different coordination environments.
The U-Si distances are comparable to the U-Si distances observed in uranyl silicate min-
erals: soddyte or uranophane (3.1-3.2 Å) and boltwoodite (3.5-3.6 Å) [116-118, 123]. The
uranyl species sorbed onto silica containing compounds and clay minerals, where the
complexation is attributed to a bidentate binding to the the silanol sites, show generally
shorter U-Si distances, between 2.77-3.16 Å [104, 113, 115, 117, 123]. Crystallographic
data on compounds with direct binding of U(VI) to the Al-O sites appear not to be avail-
able in the literature; several EXAFS studies have either failed to detect any U-Al interac-
tion, or characterize it as weak [115, 116, 121, 124]. U-Si(Al) distances of 3.3 Å have
been found by Henning et al. [104] and Arai et al. [35], for U(VI) sorbed onto montmoril-
lonite at pH 5-7, and onto imogolite, respectively. In both studies, the observed distances
have been ascribed to edge-sharing coordination of U(VI) to the alumina octahedron.
Using the U-Oeq and U-Si(Al) bond lengths of 2.25 Å and (3.2-3.4 Å), respec-
tively, determined from EXAFS analysis the Si(Al)-O-U bond angle is calculated in a
manner similar to that used for Th(IV) discussed above (eq. 4.1). The short distance of
3.20 Å observed in the U/HAS sample gives a calculated bond angle of 100° and 110°
considering U(VI) binding to the AlO6 octahedron and Si(Al)O4 tetrahedron, respectively.
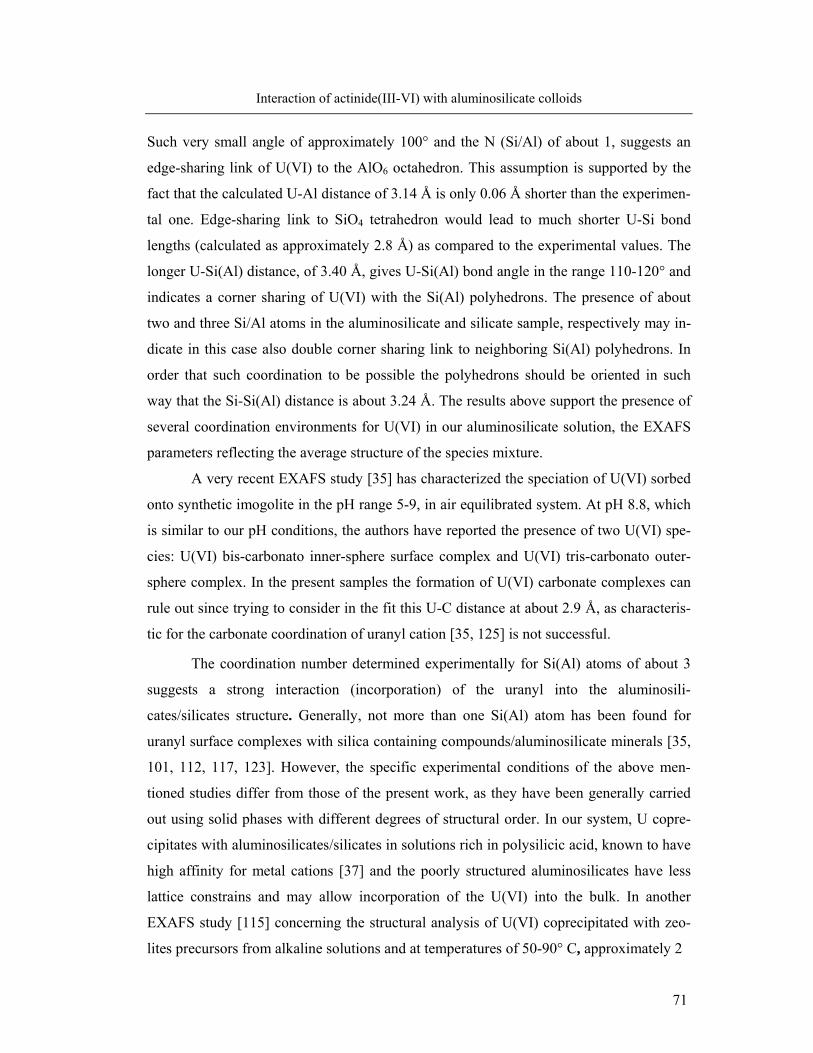
71
Interaction of actinide(III-VI) with aluminosilicate colloids
Such very small angle of approximately 100° and the N (Si/Al) of about 1, suggests an
edge-sharing link of U(VI) to the AlO6 octahedron. This assumption is supported by the
fact that the calculated U-Al distance of 3.14 Å is only 0.06 Å shorter than the experimen-
tal one. Edge-sharing link to SiO4 tetrahedron would lead to much shorter U-Si bond
lengths (calculated as approximately 2.8 Å) as compared to the experimental values. The
longer U-Si(Al) distance, of 3.40 Å, gives U-Si(Al) bond angle in the range 110-120° and
indicates a corner sharing of U(VI) with the Si(Al) polyhedrons. The presence of about
two and three Si/Al atoms in the aluminosilicate and silicate sample, respectively may in-
dicate in this case also double corner sharing link to neighboring Si(Al) polyhedrons. In
order that such coordination to be possible the polyhedrons should be oriented in such
way that the Si-Si(Al) distance is about 3.24 Å. The results above support the presence of
several coordination environments for U(VI) in our aluminosilicate solution, the EXAFS
parameters reflecting the average structure of the species mixture.
A very recent EXAFS study [35] has characterized the speciation of U(VI) sorbed
onto synthetic imogolite in the pH range 5-9, in air equilibrated system. At pH 8.8, which
is similar to our pH conditions, the authors have reported the presence of two U(VI) spe-
cies: U(VI) bis-carbonato inner-sphere surface complex and U(VI) tris-carbonato outer-
sphere complex. In the present samples the formation of U(VI) carbonate complexes can
rule out since trying to consider in the fit this U-C distance at about 2.9 Å, as characteris-
tic for the carbonate coordination of uranyl cation [35, 125] is not successful.
The coordination number determined experimentally for Si(Al) atoms of about 3
suggests a strong interaction (incorporation) of the uranyl into the aluminosili-
cates/silicates structure. Generally, not more than one Si(Al) atom has been found for
uranyl surface complexes with silica containing compounds/aluminosilicate minerals [35,
101, 112, 117, 123]. However, the specific experimental conditions of the above men-
tioned studies differ from those of the present work, as they have been generally carried
out using solid phases with different degrees of structural order. In our system, U copre-
cipitates with aluminosilicates/silicates in solutions rich in polysilicic acid, known to have
high affinity for metal cations [37] and the poorly structured aluminosilicates have less
lattice constrains and may allow incorporation of the U(VI) into the bulk. In another
EXAFS study [115] concerning the structural analysis of U(VI) coprecipitated with zeo-
lites precursors from alkaline solutions and at temperatures of 50-90° C, approximately 2
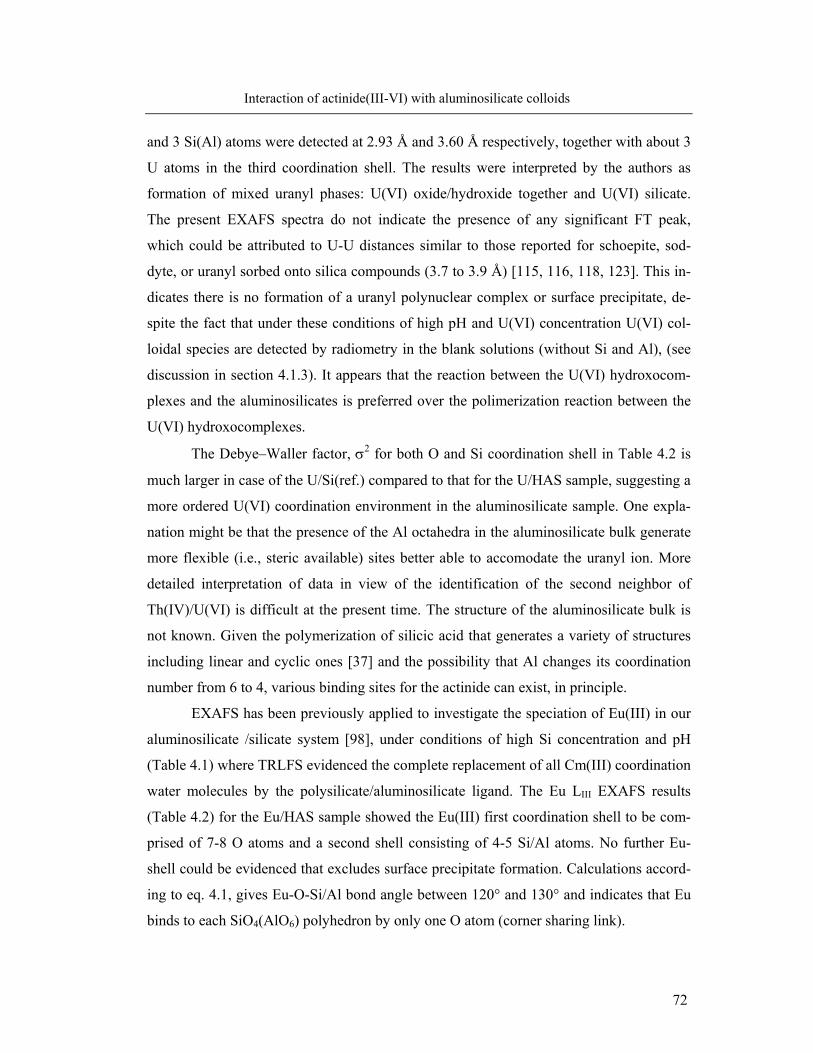
72
Interaction of actinide(III-VI) with aluminosilicate colloids
and 3 Si(Al) atoms were detected at 2.93 Å and 3.60 Å respectively, together with about 3
U atoms in the third coordination shell. The results were interpreted by the authors as
formation of mixed uranyl phases: U(VI) oxide/hydroxide together and U(VI) silicate.
The present EXAFS spectra do not indicate the presence of any significant FT peak,
which could be attributed to U-U distances similar to those reported for schoepite, sod-
dyte, or uranyl sorbed onto silica compounds (3.7 to 3.9 Å) [115, 116, 118, 123]. This in-
dicates there is no formation of a uranyl polynuclear complex or surface precipitate, de-
spite the fact that under these conditions of high pH and U(VI) concentration U(VI) col-
loidal species are detected by radiometry in the blank solutions (without Si and Al), (see
discussion in section 4.1.3). It appears that the reaction between the U(VI) hydroxocom-
plexes and the aluminosilicates is preferred over the polimerization reaction between the
U(VI) hydroxocomplexes.
The Debye–Waller factor, σ2 for both O and Si coordination shell in Table 4.2 is
much larger in case of the U/Si(ref.) compared to that for the U/HAS sample, suggesting a
more ordered U(VI) coordination environment in the aluminosilicate sample. One expla-
nation might be that the presence of the Al octahedra in the aluminosilicate bulk generate
more flexible (i.e., steric available) sites better able to accomodate the uranyl ion. More
detailed interpretation of data in view of the identification of the second neighbor of
Th(IV)/U(VI) is difficult at the present time. The structure of the aluminosilicate bulk is
not known. Given the polymerization of silicic acid that generates a variety of structures
including linear and cyclic ones [37] and the possibility that Al changes its coordination
number from 6 to 4, various binding sites for the actinide can exist, in principle.
EXAFS has been previously applied to investigate the speciation of Eu(III) in our
aluminosilicate /silicate system [98], under conditions of high Si concentration and pH
(Table 4.1) where TRLFS evidenced the complete replacement of all Cm(III) coordination
water molecules by the polysilicate/aluminosilicate ligand. The Eu LIII EXAFS results
(Table 4.2) for the Eu/HAS sample showed the Eu(III) first coordination shell to be com-
prised of 7-8 O atoms and a second shell consisting of 4-5 Si/Al atoms. No further Eu-
shell could be evidenced that excludes surface precipitate formation. Calculations accord-
ing to eq. 4.1, gives Eu-O-Si/Al bond angle between 120° and 130° and indicates that Eu
binds to each SiO4(AlO6) polyhedron by only one O atom (corner sharing link).
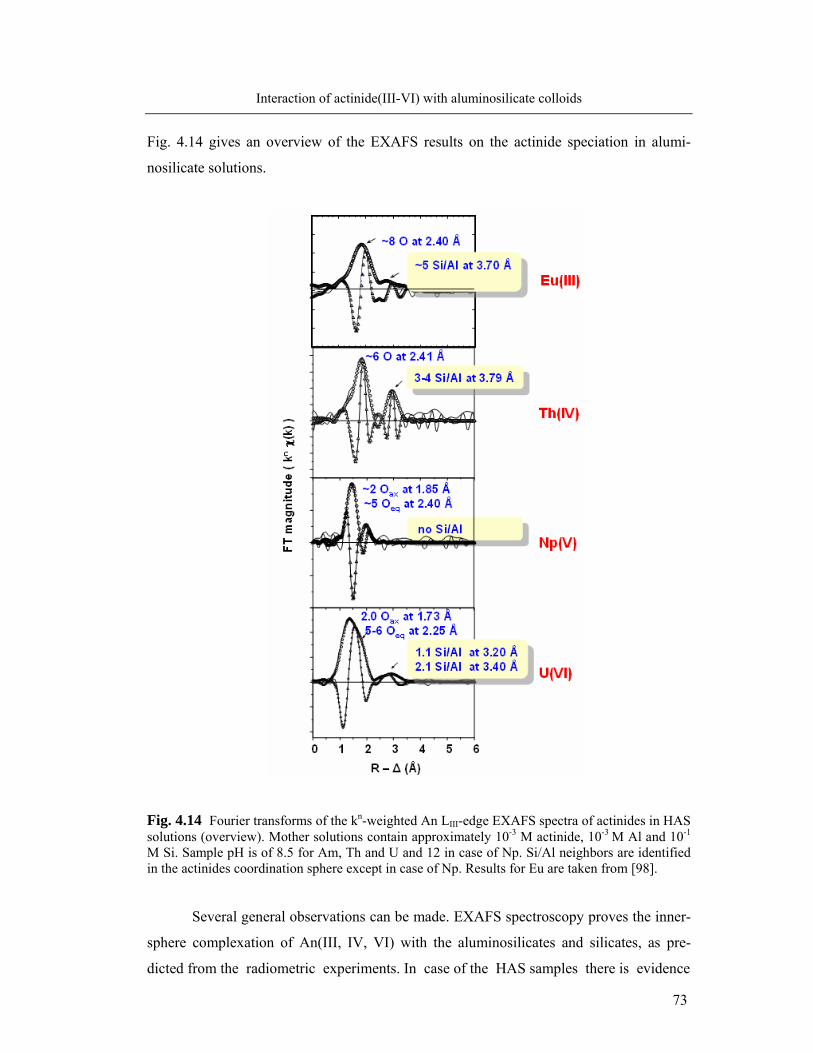
73
Interaction of actinide(III-VI) with aluminosilicate colloids
Fig. 4.14 gives an overview of the EXAFS results on the actinide speciation in alumi-
nosilicate solutions.
Fig. 4.14 Fourier transforms of the kn-weighted An LIII-edge EXAFS spectra of actinides in HAS solutions (overview). Mother solutions contain approximately 10-3 M actinide, 10-3 M Al and 10-1 M Si. Sample pH is of 8.5 for Am, Th and U and 12 in case of Np. Si/Al neighbors are identified in the actinides coordination sphere except in case of Np. Results for Eu are taken from [98].
Several general observations can be made. EXAFS spectroscopy proves the inner-
sphere complexation of An(III, IV, VI) with the aluminosilicates and silicates, as pre-
dicted from the radiometric experiments. In case of the HAS samples there is evidence
74
Interaction of actinide(III-VI) with aluminosilicate colloids
that the An(III, IV, VI) binding to each SiO4/AlO6 polyhedron occur via one O atom (cor-
ner-sharing link) and that U(VI) could also bind to an AlO6 polyhedron via two O atoms
(edge-sharing link). If one further considers the number of Si/Al atoms relative to the
number of O atoms in the actinide coordination shell, rough calculations indicate ap-
proximately 60-70 % of the O atoms to be contributions from the aluminosilicate ligand
and support the idea that the actinides are incorporated into the polymerized aluminosili-
cate bulk. The An-aluminosilicate interaction appears to be preferred over the formation
of An(IV,VI) polynuclear complex/surface precipitate. Within the HAS bulk, the An(IV,
VI) binding might be directed to both Si and/or Al, at the present limited knowledge of
the HAS structure. There is no evidence for the formation of inner-sphere complexes of
Np(V) with the aluminosilicates under the pH conditions where radiometric experiments
show maximum Np-HAS colloids interaction, but however, formation of Np surface pre-
cipitate can be excluded based on the EXAFS measurements.
4.3 Stability of aluminosilicate colloid-borne actinides
The stability of actinide binding to colloids is one of the relevance criteria for the
colloidal facilitated migration of actinides. Stable incorporation of actinides into stable
aquatic colloids promotes the colloids as carrier for actinide migration with the water flow
without substantial geochemical hindrance. Stability of actinide-colloids binding refers to
the actinide ability to remain as colloid-borne species upon changes in the environmental
conditions. Therefore, the binding stability is operationally defined by the selected condi-
tions like variations in pH, temperature, ionic strength, the presence of anionic ligands, as
potential changes that may occur in the natural environment.
The present work considers the stability of the colloid-borne actinides and of the
colloid-borne Al (Al-O-Si binding in the HAS) relative to the pH decrease and EDTA as
competitive ligand.
4.3.1. pH reversibility of the colloid-borne Al and actinide(III)
The pH reversibility has been previously investigated for Cm-HAS colloid borne
species formed in HAS solutions generated from polysilicic acid at pH 9 [27]. As discus-
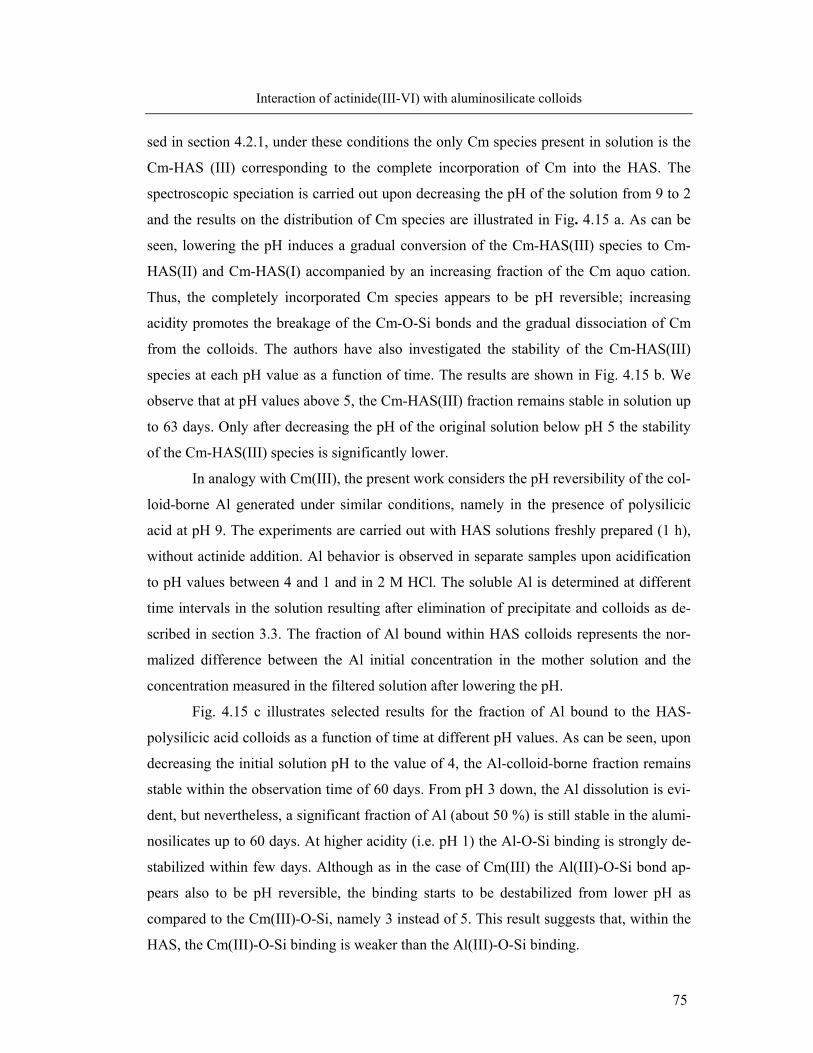
75
Interaction of actinide(III-VI) with aluminosilicate colloids
sed in section 4.2.1, under these conditions the only Cm species present in solution is the
Cm-HAS (III) corresponding to the complete incorporation of Cm into the HAS. The
spectroscopic speciation is carried out upon decreasing the pH of the solution from 9 to 2
and the results on the distribution of Cm species are illustrated in Fig. 4.15 a. As can be
seen, lowering the pH induces a gradual conversion of the Cm-HAS(III) species to Cm-
HAS(II) and Cm-HAS(I) accompanied by an increasing fraction of the Cm aquo cation.
Thus, the completely incorporated Cm species appears to be pH reversible; increasing
acidity promotes the breakage of the Cm-O-Si bonds and the gradual dissociation of Cm
from the colloids. The authors have also investigated the stability of the Cm-HAS(III)
species at each pH value as a function of time. The results are shown in Fig. 4.15 b. We
observe that at pH values above 5, the Cm-HAS(III) fraction remains stable in solution up
to 63 days. Only after decreasing the pH of the original solution below pH 5 the stability
of the Cm-HAS(III) species is significantly lower.
In analogy with Cm(III), the present work considers the pH reversibility of the col-
loid-borne Al generated under similar conditions, namely in the presence of polysilicic
acid at pH 9. The experiments are carried out with HAS solutions freshly prepared (1 h),
without actinide addition. Al behavior is observed in separate samples upon acidification
to pH values between 4 and 1 and in 2 M HCl. The soluble Al is determined at different
time intervals in the solution resulting after elimination of precipitate and colloids as de-
scribed in section 3.3. The fraction of Al bound within HAS colloids represents the nor-
malized difference between the Al initial concentration in the mother solution and the
concentration measured in the filtered solution after lowering the pH.
Fig. 4.15 c illustrates selected results for the fraction of Al bound to the HAS-
polysilicic acid colloids as a function of time at different pH values. As can be seen, upon
decreasing the initial solution pH to the value of 4, the Al-colloid-borne fraction remains
stable within the observation time of 60 days. From pH 3 down, the Al dissolution is evi-
dent, but nevertheless, a significant fraction of Al (about 50 %) is still stable in the alumi-
nosilicates up to 60 days. At higher acidity (i.e. pH 1) the Al-O-Si binding is strongly de-
stabilized within few days. Although as in the case of Cm(III) the Al(III)-O-Si bond ap-
pears also to be pH reversible, the binding starts to be destabilized from lower pH as
compared to the Cm(III)-O-Si, namely 3 instead of 5. This result suggests that, within the
HAS, the Cm(III)-O-Si binding is weaker than the Al(III)-O-Si binding.
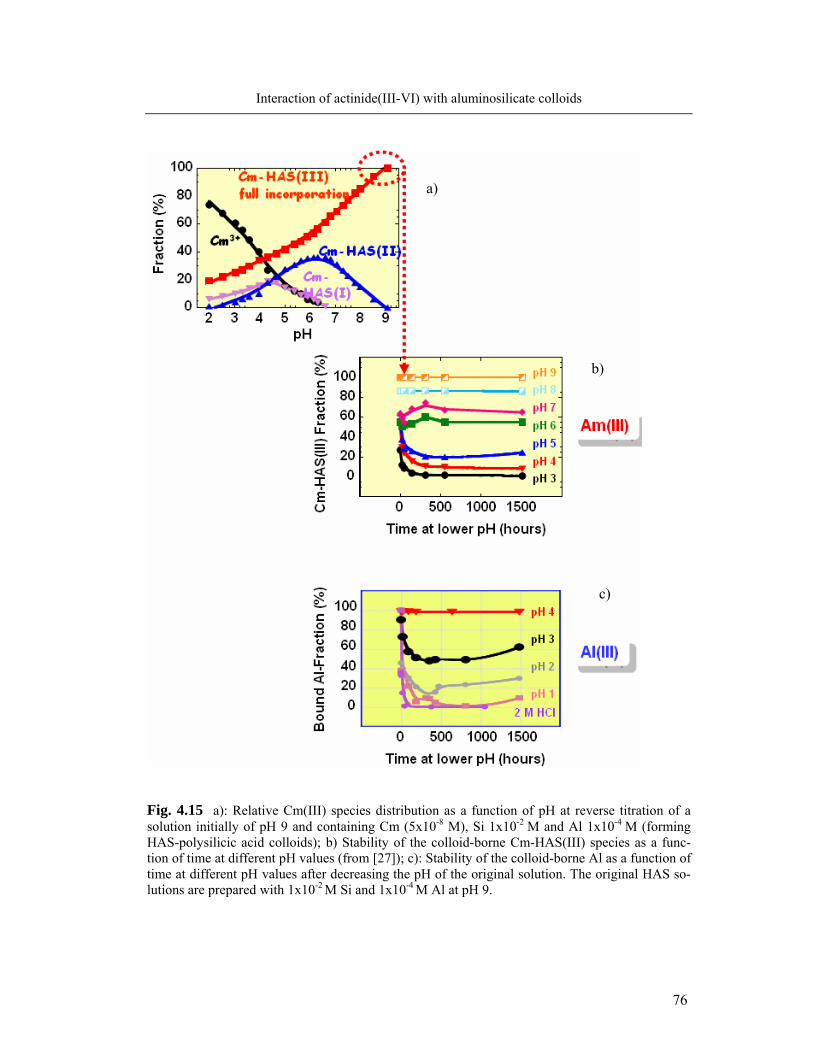
76
Interaction of actinide(III-VI) with aluminosilicate colloids
Fig. 4.15 a): Relative Cm(III) species distribution as a function of pH at reverse titration of a solution initially of pH 9 and containing Cm (5x10⁻⁸ M), Si 1x10⁻² M and Al 1x10⁻⁴ M (forming HAS-polysilicic acid colloids); b) Stability of the colloid-borne Cm-HAS(III) species as a func-tion of time at different pH values (from [27]); c): Stability of the colloid-borne Al as a function of time at different pH values after decreasing the pH of the original solution. The original HAS so-lutions are prepared with 1x10⁻² M Si and 1x10⁻⁴ M Al at pH 9.
c)
a)
b)
77
Interaction of actinide(III-VI) with aluminosilicate colloids
4.3.2 EDTA resistance of colloid-borne Al and actinide(III)/(IV)/(V)/(VI)
In order to get a relative assessment of the actinide-colloid binding strength under
the condition of maximum formation of colloid-borne actinides, a ligand competition ex-
periment is we further carried out, with the aid of EDTA as competitor for the HAS. The
stability of colloid-borne Al (the Al-O-Si binding within the HAS) is also considered.
EDTA is a well known chelating agent which forms in solution very stable complexes
with most metal ions. As example, the stability constants of several complexes formed
between EDTA and actinides and Al are summarized in Table 8.1 (Appendix). For the
experiment, two modes of the generation of actinides pseudocolloids in natural systems
are considered: the co-nucleation of actinides with Al and Si, and the interaction of An
with aged HAS colloids.
Actinides interacting with HAS colloids in statu nascendi (conucleating Si and Al)
The desorption experiments are carried out on 3 series of samples corresponding
to Am(III), Th(IV) and U(VI). Each series of sample consists of 8.6x10⁻⁷ M actinide and
10-2 M Si / 10-4 M Al corresponding to the synthesis of HAS from polysilicic acid at pH 7
and 9. The samples are conditioned for 1 day, enough to ensure the formation of maxi-
mum colloid-borne fraction of Th(IV) and U(VI) which have been shown to have fast ki-
netic of incorporation at these pH and Si concentration. In case of trivalent actinides, as
outlined in section 4.2.1 the “complete incorporated Cm”, (Cm-HAS(III) species), forms
during co-nucleation process and prevails under the experimental conditions. After the 1
day conditioning time with actinides, EDTA is added at a final concentration of 1x10⁻³ M.
The partition of actinide activity fraction in the three phases is monitored before EDTA
addition and at different intervals thereafter.
EDTA competes with the HAS for binding the actinides and promotes their de-
sorption from the HAS colloids by formation of complexes in solution. The experimental
EDTA concentration, one order of magnitude higher than that of Al, is in larger excess to
the actinide ensuring its complete complexation. The stability constants of such com-
plexes are shown in Table 8.1 but, once in solution, the actinides tend to hydrolyze with
formation of hydroxo complexes and hydroxide solid phases, reaction which will compete
with the complexation by EDTA. Therefore, blank experiments are performed by adding
78
Interaction of actinide(III-VI) with aluminosilicate colloids
EDTA to solutions of pH 5, 7 and 9 containing only the actinide. The results show that the
activity fraction is transferred completely to the solution and the precipitation of hydroly-
sis species is not attained. Selected results are given in Tables 8.2 and 8.3 (Appendix).
Tables 8.4, 8.5 and 8.6 (Appendix) give the results on the actinide partition be-
tween the three phases in presence of HAS as a function of EDTA contact time. Fig. 4.16
illustrates comparatively selected results regarding the colloid-borne actinide activity frac-
tion remaining in the colloidal phase at pH 9. As can be seen, Am activity fraction in the
colloidal phase decreases rapidly upon contact with EDTA. About 90 % of the initially
colloid-borne Am is desorbed from the colloids within 2 days contact time with EDTA. It
is obvious that under the conditions ensuring the strongest An(III) binding to the HAS
(i.e. incorporation of Cm(III) into the HAS colloids), the HAS colloid-borne Am is not
EDTA resistant. In contrast, Th(IV) and U(VI) activity fraction in the colloidal phase re-
main unchanged, the actinides can not be displaced by EDTA within 35 days. The fact
that Th and U remain as colloid borne species in presence of EDTA suggests that the HAS
colloids (i.e. the Al-O-Si binding) are stable, since as outlined in the section 4.1.1, maxi-
mum and stable incorporation of Th/U into the colloidal phase requires the presence of
both Si and Al.
Therefore, the EDTA resistance of the Al-O-Si binding is analyzed in the follow-
ings, not for only HAS generated from polysilicic acid but also for HAS generated from
monosilicic acid. For this purpose HAS solutions are prepared in absence of actinides at
pH 5 and 9. After a conditioning time varying between 3 hours and 9 months, the HAS
solutions are brought into contact with EDTA at a final concentration of 10-4 and 10-3 M
for the HAS-monosilicic acid and HAS-polysilicic acid, respectively. At different time
intervals, the soluble Al is determined in the solution remaining after removal of precipi-
tate and colloids, as described in section 3.3. The EDTA resistant Al is obtained by sub-
tracting the concentration of soluble Al from the Al concentration initially introduced in
the sample. A separate experiment is carried out under identical concentration conditions
but with changed sequence of component addition, namely: Al solution is first contacted
with EDTA followed by addition of Si (either monosilicic or polysilicic acid) after 3
hours conditioning time. Separate experiments show that, in freshly prepared samples
containing only Al at pH 5 and 9 in the presence of EDTA, Al is present entirely in solu-
tion resulting after elimination of the precipitate and colloids. It means that, in the pres-
ence of EDTA the formation of the solid Al hydroxide species is not attained. On this ba-
79
Interaction of actinide(III-VI) with aluminosilicate colloids
sis one can say that the EDTA resistance exhibited by Al in the presence of HAS is due to
the Al binding to the silicic acid.
Fig. 4.17 illustrates the results for the EDTA-resistant Al fraction as a function of
EDTA contact time. For the HAS generated from polysilicic acid at pH 9 (Fig. 4.17 b),
meaning under the conditions which ensuring maximum actinide binding to the HAS col-
loids, the colloid-borne Al appears to be EDTA resistant even for only 3 hours aged alu-
minosilicate solutions (the blue curve). At pH 5 (Fig. 4.17 a), the colloid-borne Al is less
stable. After an initial slightly increase of the stable Al fraction, most Al appears to be
complexed by EDTA and transferred to the solution within 5 days. A marginal amount of
about 20% colloid-borne Al can be still observed up to 20 days. For the HAS-monosilicic
acid samples with 3 hours conditioning time (Fig. 4.17 c, d-blue curve), two step dissolu-
tion kinetics of Al is observed. After an initial very fast dissolution step when about 50%
of the initially bound Al is brought into the solution within few hours, the dissolution ki-
netics becomes very slow especially at pH 9. Nevertheless, at similar pH conditions, the
Al-O-Si binding is less stable as compared to the HAS formed from polysilicic acid. An-
other observation, valid for both HAS generated from monosilicic and polysilicic acid, is
the increase of the EDTA resistant-Al fraction with increasing the conditioning time of
the HAS mother solution from 3 hours to 9 months. The results are indicated in Fig. 4.17
by the red curves. The increased Al stability with sample ageing can be due to the changes
in the binding state of Al within the HAS. As discussed in section 4.2.1, and suggested by
the Arrehnius equation, during prolonged conditioning time the activation energy of the
reaction is overcome. One should also take into account possible changes in the geometry
(aggregation) of the solid phase resulting in a smaller surface area in contact with the so-
lution and, consequently lower Al dissolution rates. However, as can be seen from the dis-
solution kinetics, at a given pH, the stability of the colloid-borne Al remains higher for the
HAS generated from polysilicic acid as compared to the HAS-monosilicic acid. In Fig.
4.17 the black curves illustrate the results obtained at the reverse order of reactant addi-
tion. After addition of the polysilicic acid to the soluble EDTA complexed-Al (fig. 4.17 a,
b), Al is immediately converted to the EDTA resistant form. At pH 5, however, the Al
fraction is afterwards rapidly destabilized. This behavior might be explained by an initial
rapid sorption process of the Al-EDTA complex onto the surface of the polysilicic acid as
at pH 5 the EDTA is not fully deprotonated and retains residual protons which may bind
to the polysilicic acid surface. During re-equilibration, desorption of the Al-EDTA com-
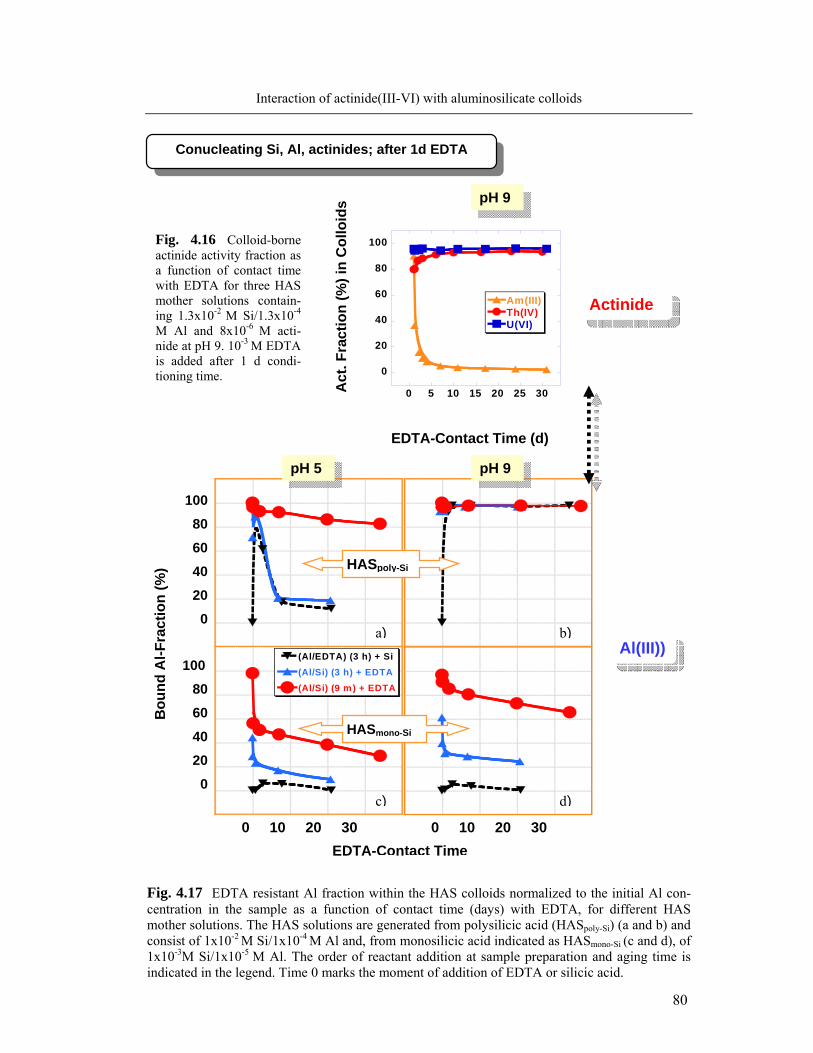
80
Interaction of actinide(III-VI) with aluminosilicate colloids
Fig. 4.17 EDTA resistant Al fraction within the HAS colloids normalized to the initial Al con-centration in the sample as a function of contact time (days) with EDTA, for different HAS mother solutions. The HAS solutions are generated from polysilicic acid (HASpoly-Si) (a and b) and consist of 1x10⁻² M Si/1x10-4 M Al and, from monosilicic acid indicated as HASmono-Si (c and d), of 1x10⁻³M Si/1x10-5 M Al. The order of reactant addition at sample preparation and aging time is indicated in the legend. Time 0 marks the moment of addition of EDTA or silicic acid.
Actinide
EDTA-Contact Time
EDTA-Contact Time (d)
Act
. Fra
ctio
n (%
) in
Col
loid
s
(Al/EDTA) (3 h) + Si(Al/Si) (3 h) + EDTA(Al/Si) (9 m) + EDTA
Al(III))
Bou
nd A
l-Fra
ctio
n (%
)
0 10 20 30 0 10 20 30
100 80 60
40 20
0
100 80 60 40 20
0 a)
d) c)
b)
pH 9
pH 9 pH 5
HASpoly-Si
HASmono-Si
0
20
40
60
80
100
0 5 10 15 20 25 30
Am(III)Th(IV)U(VI)
Fig. 4.16 Colloid-borne actinide activity fraction as a function of contact time with EDTA for three HAS mother solutions contain-ing 1.3x10⁻² M Si/1.3x10-4
M Al and 8x10⁻⁶ M acti-nide at pH 9. 10-3 M EDTA is added after 1 d condi-tioning time.
Conucleating Si, Al, actinides; after 1d EDTA
81
Interaction of actinide(III-VI) with aluminosilicate colloids
plex occurs and Al is released again into the solution. For the samples prepared at pH 9,
the Al fraction remains stable within the observation time. At this pH we expect that
EDTA does not interact with polysilicic acid, both molecules being negatively charged
[130]. It means that at pH 9 polysilicic acid is a stronger complexing ligand and can dis-
place the EDTA in the Al coordination sphere. This fact is not observed for the alumi-
nosilicate solutions generated from monosilicic acid (Fig. 4.17 c, d) as Al remains in solu-
tion complexed with EDTA.
The results confirm the higher affinity towards Al exhibited by the polysilicic acid
at pH 9 as compared with the monosilicic acid. On the basis of this result together with
those regarding the EDTA stability of the Am-HAS colloids binding, one can conclude
that within the HAS formed from polysilicic acid at pH 9, the Si-O- moieties have higher
binding affinity for Al as for Am.
The stability constants for the complexation of EDTA with the actinide cations
(Table 8.1) indicates much stronger interaction of Th(IV) with EDTA as compared to
Am(III) and Al(III). Due to its stereochemistry, U(VI) forms less stable complexes with
EDTA as compared to Am(III), Th(IV), Al(III) [129]. The result of the ligand competition
experiment showing Th and Al to be EDTA resistant, while Am not, suggests that the de-
sorption kinetics is determined by the actinide lability within the HAS-polysilicic acid.
Actinides interacting with aged HAS colloids
Coprecipitated HAS samples are generated from polysilicic and monosilicic acid
at pH 5, 7 and 9 and are conditioned for 7 days. Aging time of the colloids (7 days) is
chosen on the basis of previous studies results. As already outlined in section 4.1.2 (Fig.
4.6) in solutions of 1x10⁻² M Si at pH 7 and 9 the polymerization of silicic acid is com-
pleted within 7 days, so that formation of the HAS colloids generated under these condi-
tions is expected to be complete. After the 7 days conditioning time of the mother solu-
tions, the actinide is introduced at a final concentration of 8.7 x10⁻⁶ M. Following another
conditioning time of 5 days to ensure that a steady state of actinide sorption is reached,
EDTA is added to an end concentration of 1x10⁻⁴ M in case of the HAS prepared from
monosilicic acid and 1x10⁻³ M in case of the HAS-polysilicic acid. The results for the ac-
tinides activity distribution between the precipitate, colloids and solution at different in-
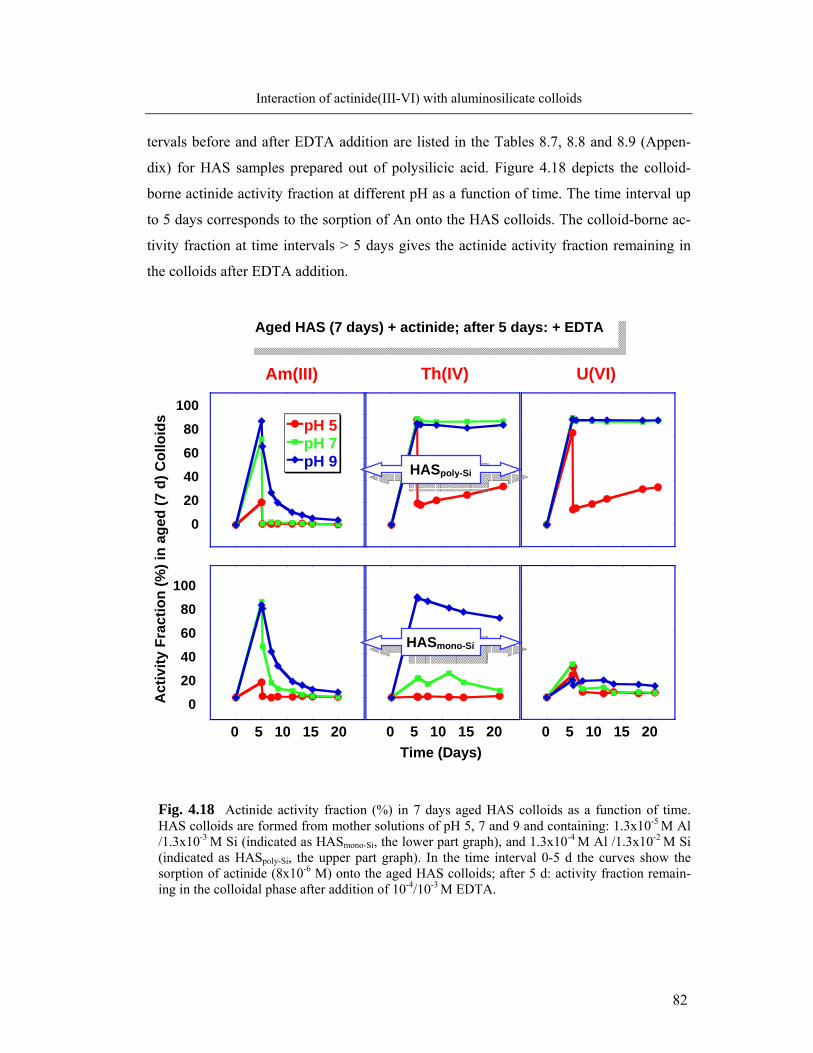
82
Interaction of actinide(III-VI) with aluminosilicate colloids
tervals before and after EDTA addition are listed in the Tables 8.7, 8.8 and 8.9 (Appen-
dix) for HAS samples prepared out of polysilicic acid. Figure 4.18 depicts the colloid-
borne actinide activity fraction at different pH as a function of time. The time interval up
to 5 days corresponds to the sorption of An onto the HAS colloids. The colloid-borne ac-
tivity fraction at time intervals > 5 days gives the actinide activity fraction remaining in
the colloids after EDTA addition.
Fig. 4.18 Actinide activity fraction (%) in 7 days aged HAS colloids as a function of time. HAS colloids are formed from mother solutions of pH 5, 7 and 9 and containing: 1.3x10⁻⁵ M Al /1.3x10-3 M Si (indicated as HASmono-Si, the lower part graph), and 1.3x10⁻⁴ M Al /1.3x10-2 M Si (indicated as HASpoly-Si, the upper part graph). In the time interval 0-5 d the curves show the sorption of actinide (8x10⁻⁶ M) onto the aged HAS colloids; after 5 d: activity fraction remain-ing in the colloidal phase after addition of 10-4/10-3 M EDTA.
pH 5pH 7pH 9
Aged HAS (7 days) + actinide; after 5 days: + EDTA
0 5 10 15 20 0 5 10 15 20 0 5 10 15 20
100 80 60 40 20
0
100 80 60 40 20
0
HASpoly-Si
HASmono-Si
Am(III) Th(IV) U(VI)
Act
ivity
Fra
ctio
n (%
) in
aged
(7 d
) Col
loid
s
Time (Days)
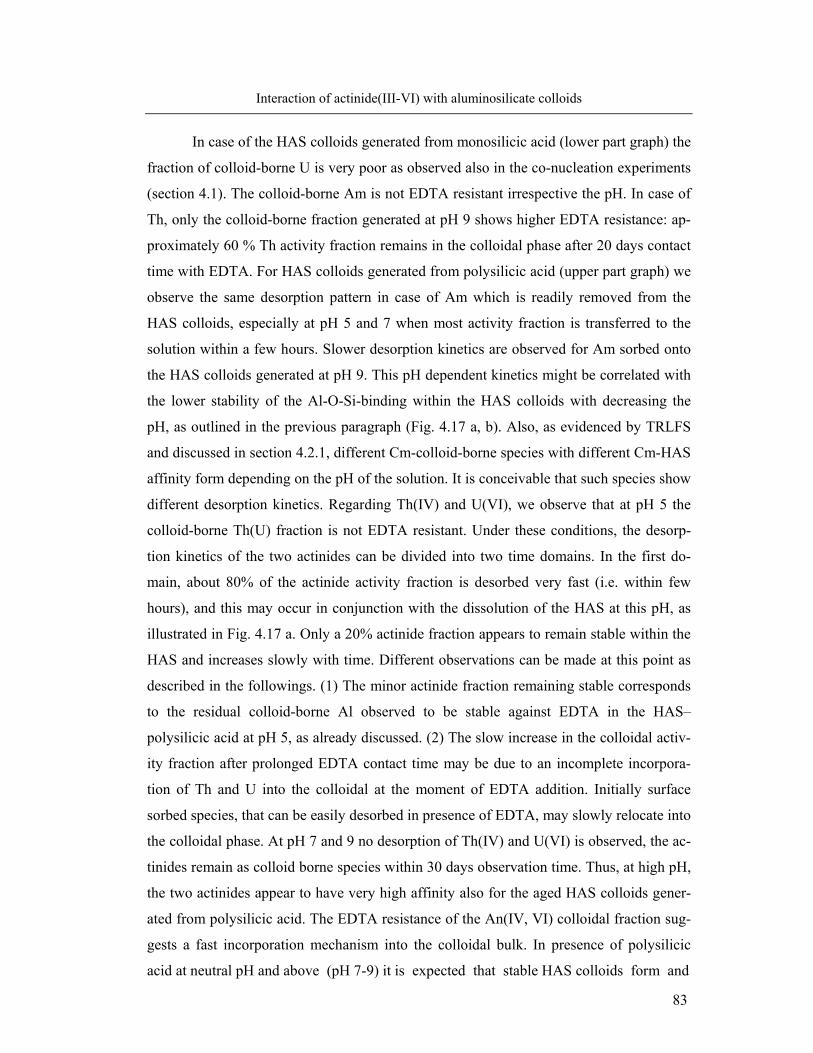
83
Interaction of actinide(III-VI) with aluminosilicate colloids
In case of the HAS colloids generated from monosilicic acid (lower part graph) the
fraction of colloid-borne U is very poor as observed also in the co-nucleation experiments
(section 4.1). The colloid-borne Am is not EDTA resistant irrespective the pH. In case of
Th, only the colloid-borne fraction generated at pH 9 shows higher EDTA resistance: ap-
proximately 60 % Th activity fraction remains in the colloidal phase after 20 days contact
time with EDTA. For HAS colloids generated from polysilicic acid (upper part graph) we
observe the same desorption pattern in case of Am which is readily removed from the
HAS colloids, especially at pH 5 and 7 when most activity fraction is transferred to the
solution within a few hours. Slower desorption kinetics are observed for Am sorbed onto
the HAS colloids generated at pH 9. This pH dependent kinetics might be correlated with
the lower stability of the Al-O-Si-binding within the HAS colloids with decreasing the
pH, as outlined in the previous paragraph (Fig. 4.17 a, b). Also, as evidenced by TRLFS
and discussed in section 4.2.1, different Cm-colloid-borne species with different Cm-HAS
affinity form depending on the pH of the solution. It is conceivable that such species show
different desorption kinetics. Regarding Th(IV) and U(VI), we observe that at pH 5 the
colloid-borne Th(U) fraction is not EDTA resistant. Under these conditions, the desorp-
tion kinetics of the two actinides can be divided into two time domains. In the first do-
main, about 80% of the actinide activity fraction is desorbed very fast (i.e. within few
hours), and this may occur in conjunction with the dissolution of the HAS at this pH, as
illustrated in Fig. 4.17 a. Only a 20% actinide fraction appears to remain stable within the
HAS and increases slowly with time. Different observations can be made at this point as
described in the followings. (1) The minor actinide fraction remaining stable corresponds
to the residual colloid-borne Al observed to be stable against EDTA in the HAS–
polysilicic acid at pH 5, as already discussed. (2) The slow increase in the colloidal activ-
ity fraction after prolonged EDTA contact time may be due to an incomplete incorpora-
tion of Th and U into the colloidal at the moment of EDTA addition. Initially surface
sorbed species, that can be easily desorbed in presence of EDTA, may slowly relocate into
the colloidal phase. At pH 7 and 9 no desorption of Th(IV) and U(VI) is observed, the ac-
tinides remain as colloid borne species within 30 days observation time. Thus, at high pH,
the two actinides appear to have very high affinity also for the aged HAS colloids gener-
ated from polysilicic acid. The EDTA resistance of the An(IV, VI) colloidal fraction sug-
gests a fast incorporation mechanism into the colloidal bulk. In presence of polysilicic
acid at neutral pH and above (pH 7-9) it is expected that stable HAS colloids form and
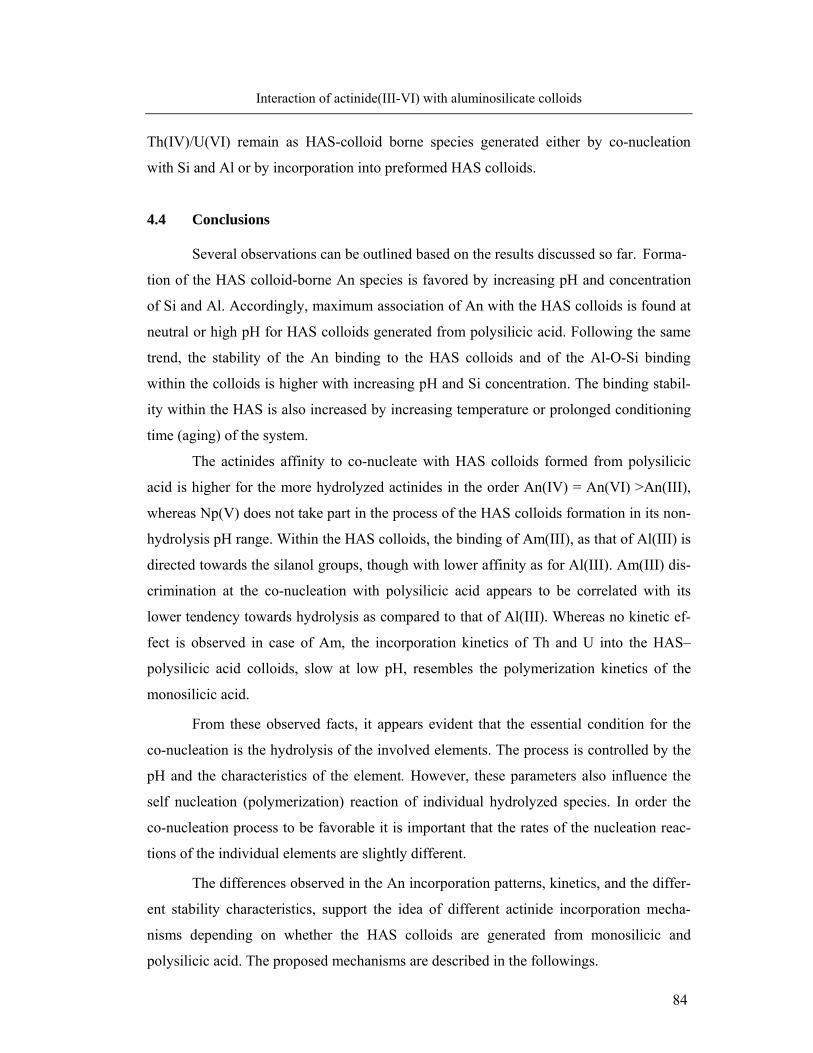
84
Interaction of actinide(III-VI) with aluminosilicate colloids
Th(IV)/U(VI) remain as HAS-colloid borne species generated either by co-nucleation
with Si and Al or by incorporation into preformed HAS colloids.
4.4 Conclusions
Several observations can be outlined based on the results discussed so far. Forma-
tion of the HAS colloid-borne An species is favored by increasing pH and concentration
of Si and Al. Accordingly, maximum association of An with the HAS colloids is found at
neutral or high pH for HAS colloids generated from polysilicic acid. Following the same
trend, the stability of the An binding to the HAS colloids and of the Al-O-Si binding
within the colloids is higher with increasing pH and Si concentration. The binding stabil-
ity within the HAS is also increased by increasing temperature or prolonged conditioning
time (aging) of the system.
The actinides affinity to co-nucleate with HAS colloids formed from polysilicic
acid is higher for the more hydrolyzed actinides in the order An(IV) = An(VI) >An(III),
whereas Np(V) does not take part in the process of the HAS colloids formation in its non-
hydrolysis pH range. Within the HAS colloids, the binding of Am(III), as that of Al(III) is
directed towards the silanol groups, though with lower affinity as for Al(III). Am(III) dis-
crimination at the co-nucleation with polysilicic acid appears to be correlated with its
lower tendency towards hydrolysis as compared to that of Al(III). Whereas no kinetic ef-
fect is observed in case of Am, the incorporation kinetics of Th and U into the HAS–
polysilicic acid colloids, slow at low pH, resembles the polymerization kinetics of the
monosilicic acid.
From these observed facts, it appears evident that the essential condition for the
co-nucleation is the hydrolysis of the involved elements. The process is controlled by the
pH and the characteristics of the element. However, these parameters also influence the
self nucleation (polymerization) reaction of individual hydrolyzed species. In order the
co-nucleation process to be favorable it is important that the rates of the nucleation reac-
tions of the individual elements are slightly different.
The differences observed in the An incorporation patterns, kinetics, and the differ-
ent stability characteristics, support the idea of different actinide incorporation mecha-
nisms depending on whether the HAS colloids are generated from monosilicic and
polysilicic acid. The proposed mechanisms are described in the followings.
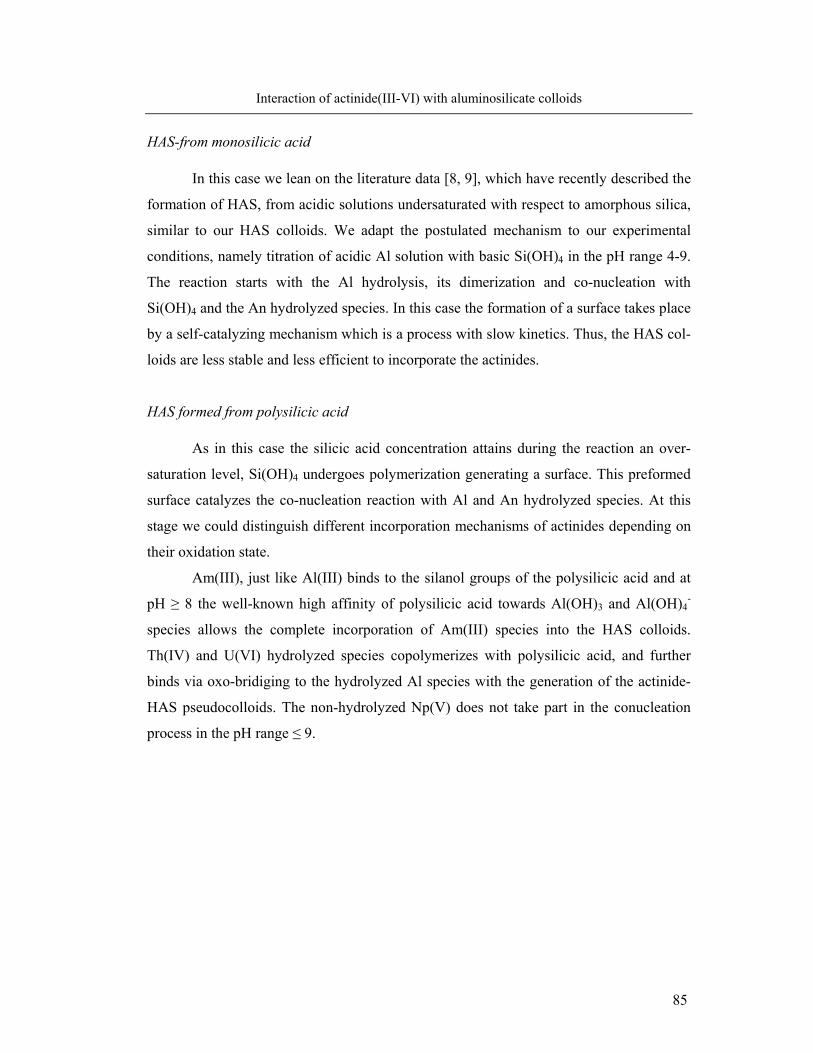
85
Interaction of actinide(III-VI) with aluminosilicate colloids
HAS-from monosilicic acid
In this case we lean on the literature data [8, 9], which have recently described the
formation of HAS, from acidic solutions undersaturated with respect to amorphous silica,
similar to our HAS colloids. We adapt the postulated mechanism to our experimental
conditions, namely titration of acidic Al solution with basic Si(OH)4 in the pH range 4-9.
The reaction starts with the Al hydrolysis, its dimerization and co-nucleation with
Si(OH)4 and the An hydrolyzed species. In this case the formation of a surface takes place
by a self-catalyzing mechanism which is a process with slow kinetics. Thus, the HAS col-
loids are less stable and less efficient to incorporate the actinides.
HAS formed from polysilicic acid
As in this case the silicic acid concentration attains during the reaction an over-
saturation level, Si(OH)4 undergoes polymerization generating a surface. This preformed
surface catalyzes the co-nucleation reaction with Al and An hydrolyzed species. At this
stage we could distinguish different incorporation mechanisms of actinides depending on
their oxidation state.
Am(III), just like Al(III) binds to the silanol groups of the polysilicic acid and at
pH ≥ 8 the well-known high affinity of polysilicic acid towards Al(OH)3 and Al(OH)4-
species allows the complete incorporation of Am(III) species into the HAS colloids.
Th(IV) and U(VI) hydrolyzed species copolymerizes with polysilicic acid, and further
binds via oxo-bridiging to the hydrolyzed Al species with the generation of the actinide-
HAS pseudocolloids. The non-hydrolyzed Np(V) does not take part in the conucleation
process in the pH range ≤ 9.
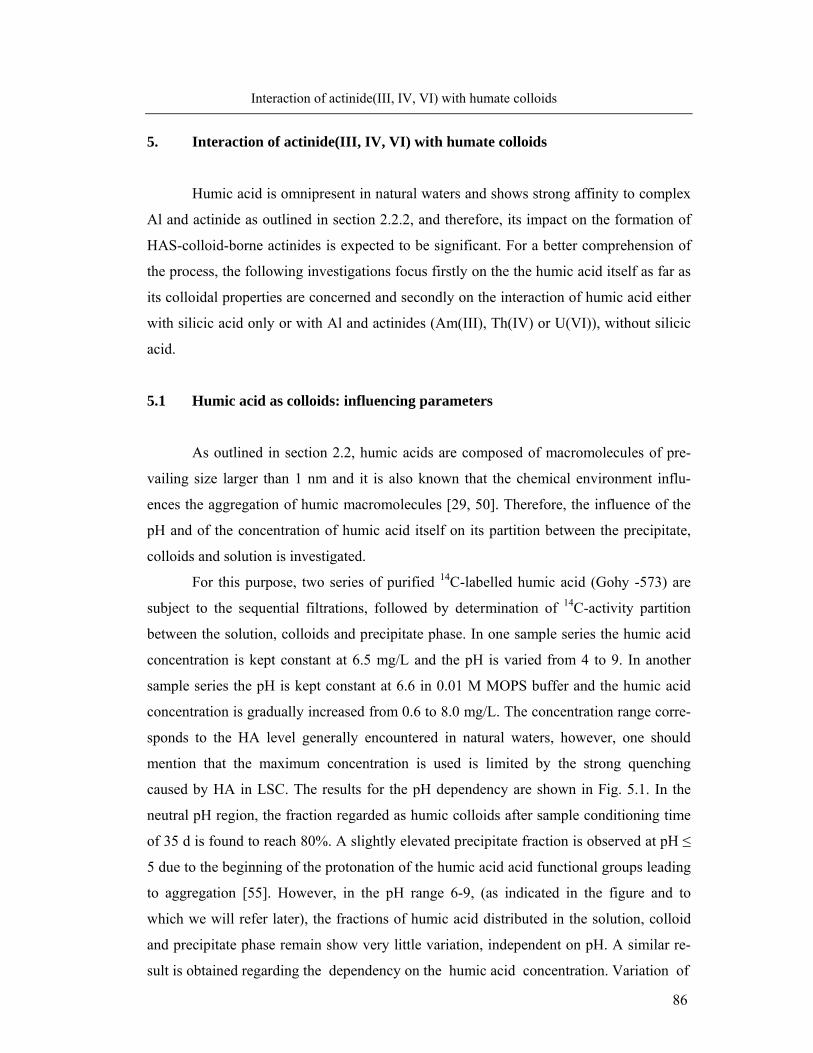
86
Interaction of actinide(III, IV, VI) with humate colloids
5. Interaction of actinide(III, IV, VI) with humate colloids
Humic acid is omnipresent in natural waters and shows strong affinity to complex
Al and actinide as outlined in section 2.2.2, and therefore, its impact on the formation of
HAS-colloid-borne actinides is expected to be significant. For a better comprehension of
the process, the following investigations focus firstly on the the humic acid itself as far as
its colloidal properties are concerned and secondly on the interaction of humic acid either
with silicic acid only or with Al and actinides (Am(III), Th(IV) or U(VI)), without silicic
acid.
5.1 Humic acid as colloids: influencing parameters
As outlined in section 2.2, humic acids are composed of macromolecules of pre-
vailing size larger than 1 nm and it is also known that the chemical environment influ-
ences the aggregation of humic macromolecules [29, 50]. Therefore, the influence of the
pH and of the concentration of humic acid itself on its partition between the precipitate,
colloids and solution is investigated.
For this purpose, two series of purified 14C-labelled humic acid (Gohy -573) are
subject to the sequential filtrations, followed by determination of 14C-activity partition
between the solution, colloids and precipitate phase. In one sample series the humic acid
concentration is kept constant at 6.5 mg/L and the pH is varied from 4 to 9. In another
sample series the pH is kept constant at 6.6 in 0.01 M MOPS buffer and the humic acid
concentration is gradually increased from 0.6 to 8.0 mg/L. The concentration range corre-
sponds to the HA level generally encountered in natural waters, however, one should
mention that the maximum concentration is used is limited by the strong quenching
caused by HA in LSC. The results for the pH dependency are shown in Fig. 5.1. In the
neutral pH region, the fraction regarded as humic colloids after sample conditioning time
of 35 d is found to reach 80%. A slightly elevated precipitate fraction is observed at pH ≤
5 due to the beginning of the protonation of the humic acid acid functional groups leading
to aggregation [55]. However, in the pH range 6-9, (as indicated in the figure and to
which we will refer later), the fractions of humic acid distributed in the solution, colloid
and precipitate phase remain show very little variation, independent on pH. A similar re-
sult is obtained regarding the dependency on the humic acid concentration. Variation of
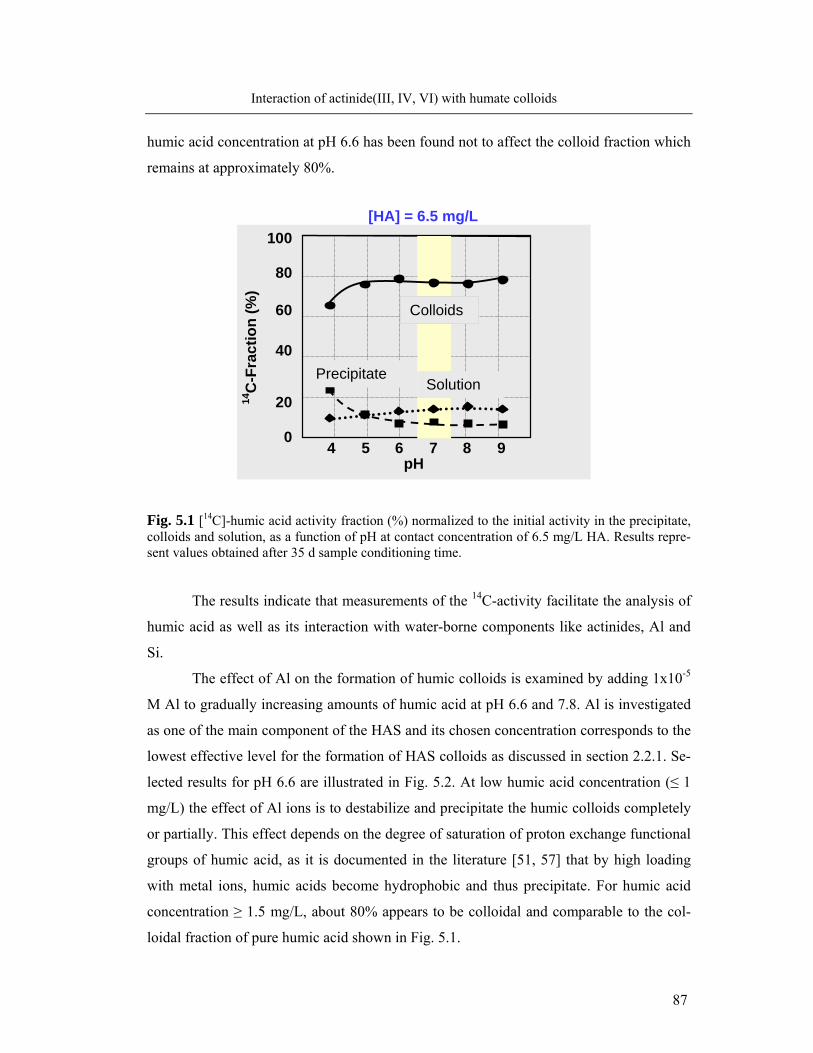
87
Interaction of actinide(III, IV, VI) with humate colloids
humic acid concentration at pH 6.6 has been found not to affect the colloid fraction which
remains at approximately 80%.
Fig. 5.1 [14C]-humic acid activity fraction (%) normalized to the initial activity in the precipitate, colloids and solution, as a function of pH at contact concentration of 6.5 mg/L HA. Results repre-sent values obtained after 35 d sample conditioning time.
The results indicate that measurements of the 14C-activity facilitate the analysis of
humic acid as well as its interaction with water-borne components like actinides, Al and
Si.
The effect of Al on the formation of humic colloids is examined by adding 1x10⁻⁵
M Al to gradually increasing amounts of humic acid at pH 6.6 and 7.8. Al is investigated
as one of the main component of the HAS and its chosen concentration corresponds to the
lowest effective level for the formation of HAS colloids as discussed in section 2.2.1. Se-
lected results for pH 6.6 are illustrated in Fig. 5.2. At low humic acid concentration (≤ 1
mg/L) the effect of Al ions is to destabilize and precipitate the humic colloids completely
or partially. This effect depends on the degree of saturation of proton exchange functional
groups of humic acid, as it is documented in the literature [51, 57] that by high loading
with metal ions, humic acids become hydrophobic and thus precipitate. For humic acid
concentration ≥ 1.5 mg/L, about 80% appears to be colloidal and comparable to the col-
loidal fraction of pure humic acid shown in Fig. 5.1.
4 5 6 7 8 9
Colloids
Precipitate Solution
pH
100
80
60
40
20
0
14C
-Fra
ctio
n (%
)
[HA] = 6.5 mg/L
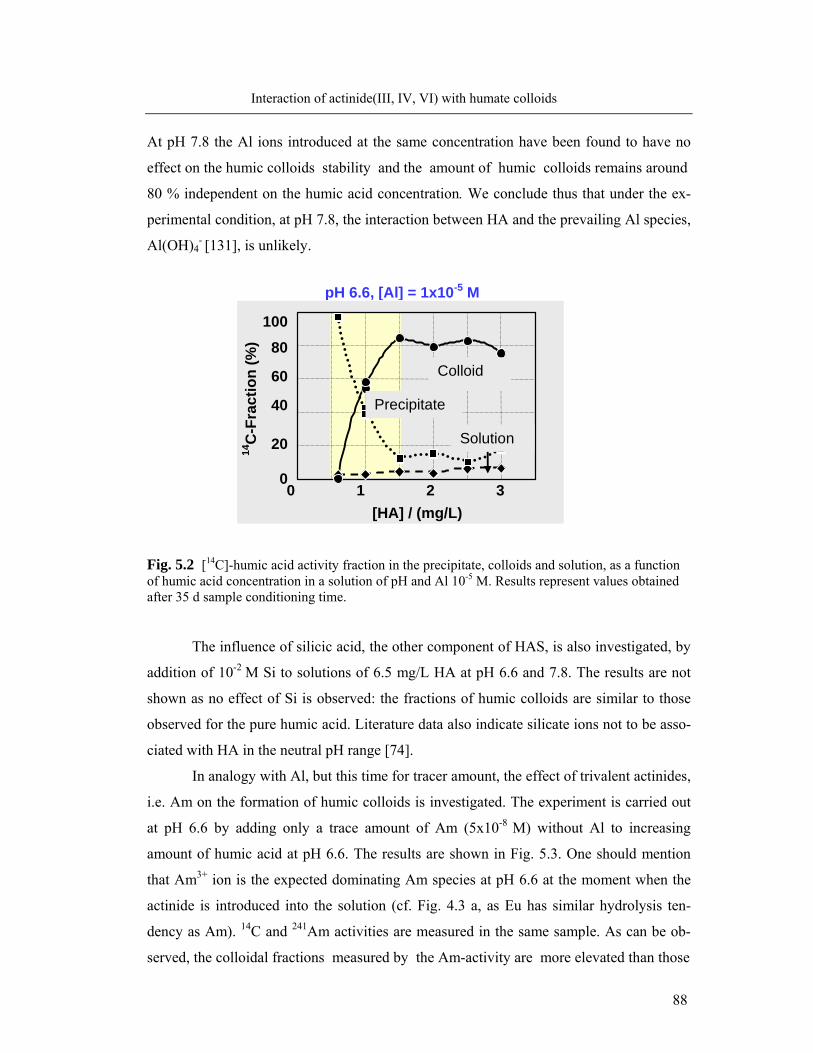
88
Interaction of actinide(III, IV, VI) with humate colloids
At pH 7.8 the Al ions introduced at the same concentration have been found to have no
effect on the humic colloids stability and the amount of humic colloids remains around
80 % independent on the humic acid concentration. We conclude thus that under the ex-
perimental condition, at pH 7.8, the interaction between HA and the prevailing Al species,
Al(OH)4- [131], is unlikely.
Fig. 5.2 [14C]-humic acid activity fraction in the precipitate, colloids and solution, as a function of humic acid concentration in a solution of pH and Al 10-5 M. Results represent values obtained after 35 d sample conditioning time. The influence of silicic acid, the other component of HAS, is also investigated, by
addition of 10-2 M Si to solutions of 6.5 mg/L HA at pH 6.6 and 7.8. The results are not
shown as no effect of Si is observed: the fractions of humic colloids are similar to those
observed for the pure humic acid. Literature data also indicate silicate ions not to be asso-
ciated with HA in the neutral pH range [74].
In analogy with Al, but this time for tracer amount, the effect of trivalent actinides,
i.e. Am on the formation of humic colloids is investigated. The experiment is carried out
at pH 6.6 by adding only a trace amount of Am (5x10⁻⁸ M) without Al to increasing
amount of humic acid at pH 6.6. The results are shown in Fig. 5.3. One should mention
that Am3+ ion is the expected dominating Am species at pH 6.6 at the moment when the
actinide is introduced into the solution (cf. Fig. 4.3 a, as Eu has similar hydrolysis ten-
dency as Am). 14C and 241Am activities are measured in the same sample. As can be ob-
served, the colloidal fractions measured by the Am-activity are more elevated than those
0 1 2 3[HA] / (mg/L)
Colloid
Precipitate
Solution
14C
-Fra
ctio
n (%
)
100
80
60
40
20
0
pH 6.6, [Al] = 1x10⁻⁵ M
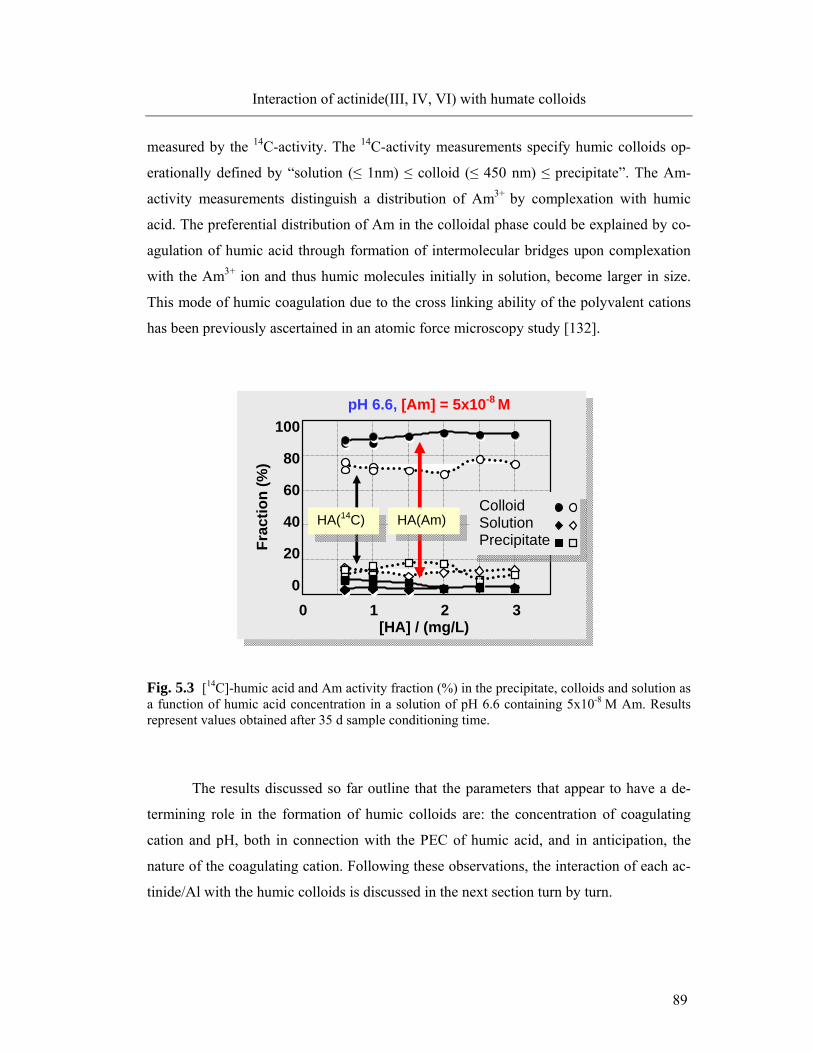
89
Interaction of actinide(III, IV, VI) with humate colloids
measured by the 14C-activity. The 14C-activity measurements specify humic colloids op-
erationally defined by “solution (≤ 1nm) ≤ colloid (≤ 450 nm) ≤ precipitate”. The Am-
activity measurements distinguish a distribution of Am3+ by complexation with humic
acid. The preferential distribution of Am in the colloidal phase could be explained by co-
agulation of humic acid through formation of intermolecular bridges upon complexation
with the Am3+ ion and thus humic molecules initially in solution, become larger in size.
This mode of humic coagulation due to the cross linking ability of the polyvalent cations
has been previously ascertained in an atomic force microscopy study [132].
Fig. 5.3 [14C]-humic acid and Am activity fraction (%) in the precipitate, colloids and solution as a function of humic acid concentration in a solution of pH 6.6 containing 5x10⁻⁸ M Am. Results represent values obtained after 35 d sample conditioning time. The results discussed so far outline that the parameters that appear to have a de-
termining role in the formation of humic colloids are: the concentration of coagulating
cation and pH, both in connection with the PEC of humic acid, and in anticipation, the
nature of the coagulating cation. Following these observations, the interaction of each ac-
tinide/Al with the humic colloids is discussed in the next section turn by turn.
[HA] / (mg/L)0 1 2 3
HA(14C) HA(Am)
Frac
tion
(%)
100
80
60
40
20
0
pH 6.6, [Am] = 5x10⁻⁸ M
Colloid Solution Precipitate
90
Interaction of actinide(III, IV, VI) with humate colloids
5.2 Complexation of Al and actinide(III)/(IV)/(VI) with humic acid
5.2.1 Formation of colloid-borne actinides: parameter screening
A parameter screening experiment is carried-out in order to assess the general
conditions for generation of humate-colloid-borne actinides as a function of pH in pres-
ence of variable amounts of Al. Trace amounts of actinide either 5x10⁻⁸ M Am/(Th), or
8x10⁻⁷ M U are added to solutions of pH 6.6, 7.2 and 7.8 containing 6.5 mg/L HA and Al
concentration from 0 to 10-4 M. The Al concentration range includes the concentrations
corresponding to the formation of HAS colloids. The chosen concentration of HA with its
PEC (4.8x10⁻³ eq/g) corresponds to the equivalent concentration required for full com-
plexation (neutralization of the functional groups) with a trivalent cation (charge 3+) at
concentration of 10-5 M. Blank samples, prepared under similar conditions but without
HA are also analyzed for comparison. The contour profiles for the formation of colloid-
borne An obtained from actinide activity measurements are illustrated in Fig. 5.4.
As can be observed in the diagram, in absence of humic acid, Am and Th are en-
tirely present in the precipitate phase. A marginal colloidal fraction is generated in case of
U and mainly at pH 6.6 and 7.2 in absence of Al. The increase of Al concentration to
over-saturation (cf. Fig. 2.6) causes destabilization of the U colloidal fraction, accompa-
nied by the activity transfer to the precipitate. Upon addition of 6.5 mg/L HA (upper part
contours), we observe an enhanced actinide activity fraction in the colloidal phase. The
transfer of initially precipitated actinides to the colloidal phase in presence of humic acid
proves the actinides complexation with humic acid. Formation of humate-colloid-borne
actinides is generally very efficient up to 10-5 M Al. Several differences between the acti-
nides incorporation patterns can be distinguished in the diagram. Hence, the generation of
humate-colloid-borne actinides appears to be most favorable in case of Am for the inves-
tigated pH and Al concentration range. Maximum Am activity fraction in the colloidal
phase of approximately 90 % can be observed. Formation of humate-colloid-borne species
appears to be less favorable for Th at pH 6.6 and in case of U at pH 7.8, with approxi-
mately 70% of actinide activity remaining in the colloidal phase. At Al concentration of
1x10⁻⁴ M, the proton exchange groups of HA are become saturated and the colloidal phase
is destabilized and the precipitation of the actinide/Al-humate complexes takes place.
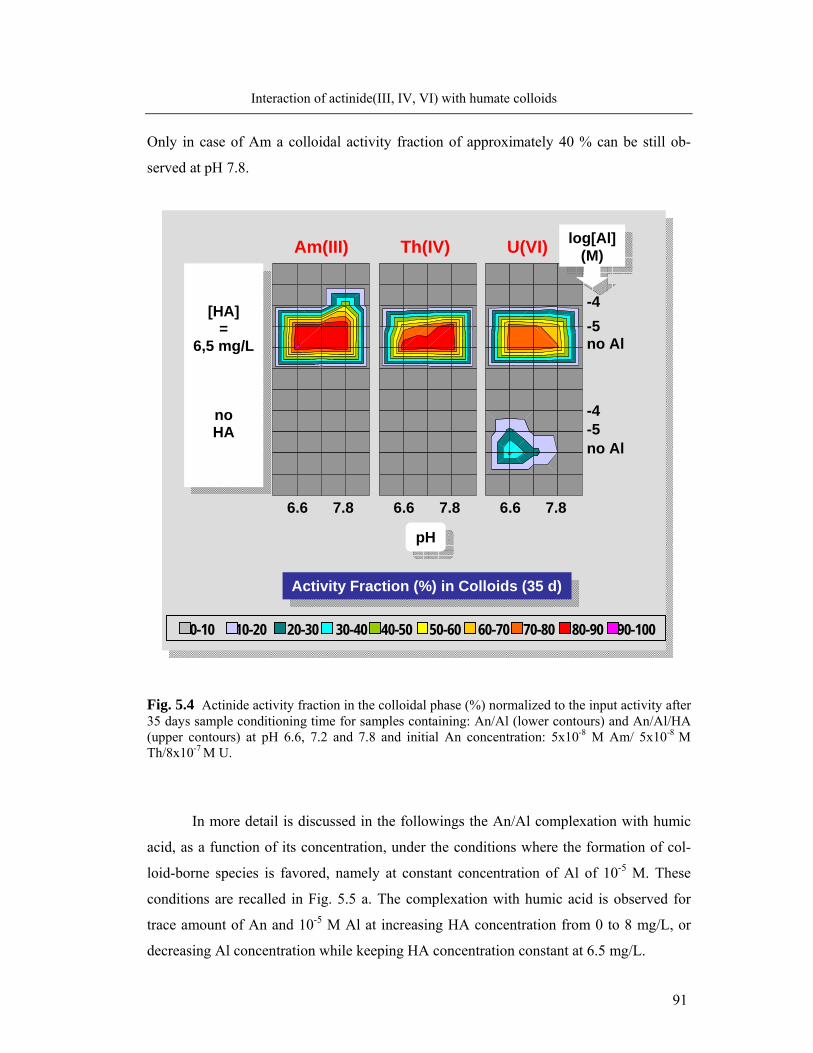
91
Interaction of actinide(III, IV, VI) with humate colloids
Only in case of Am a colloidal activity fraction of approximately 40 % can be still ob-
served at pH 7.8.
Fig. 5.4 Actinide activity fraction in the colloidal phase (%) normalized to the input activity after 35 days sample conditioning time for samples containing: An/Al (lower contours) and An/Al/HA (upper contours) at pH 6.6, 7.2 and 7.8 and initial An concentration: 5x10⁻⁸ M Am/ 5x10⁻⁸ M Th/8x10-7 M U.
In more detail is discussed in the followings the An/Al complexation with humic
acid, as a function of its concentration, under the conditions where the formation of col-
loid-borne species is favored, namely at constant concentration of Al of 10-5 M. These
conditions are recalled in Fig. 5.5 a. The complexation with humic acid is observed for
trace amount of An and 10-5 M Al at increasing HA concentration from 0 to 8 mg/L, or
decreasing Al concentration while keeping HA concentration constant at 6.5 mg/L.
log[Al] (M)
Activity Fraction (%) in Colloids (35 d)
pH
0-10 10-20 20-30 30-40 40-50 50-60 60-70 70-80 80-90 90-100
-4
-5
no Al
-4
-5 no Al
[HA] =
6,5 mg/L
no HA
6.6 7.8 6.6 7.8 6.6 7.8
Am(III) Th(IV) U(VI)
92
Interaction of actinide(III, IV, VI) with humate colloids
5.2.2 Complexation behaviour of Al and actinides: comparison
The samples are prepared by adding increasing humic acid concentration up to 8
mg/L, to solutions containing either 5x10⁻⁸ M Am, 5x10⁻⁸ M Th, or 8x10⁻⁷ M U and Al at
constant concentration of 1x10⁻⁵ M. The equivalent of further higher HA concentration is
obtained by decreasing Al from 1x10⁻⁵ M to 5x10⁻⁸ M (in case of Th) or to 5x10⁻⁷ M (in
case of U), while the HA concentration is maintained at 6.5 mg/L. 14C and actinide activi-
ties are measured in the same sample and the results are illustrated in Fig. 5.5 b.
At pH 6.6, as can be seen in Fig. 5.5 b, in the HA low concentration range (< 1
mg/L), the actinides and HA are precipitated due to the saturation of the HA proton ex-
change functional group by the Al ions. Upon increasing HA concentration above ap-
proximately 1 mg/L, the actinide activity begins to be transferred to the colloidal phase.
The complexation of actinides and Al with HA is proved by a similar increase in the col-
loidal fraction obtained from 14C measurements. We can also observe some differences
between the actinides patterns for the formation of humate-colloid-borne species. In case
of Am, the colloids appear to be promptly generated with increasing HA concentration
and at HA ≥ 1.5 mg/L. 80% of Am activity is found in the colloidal phase. A similar be-
haviour is observed for U. In case of Th, one needs higher HA concentration (i.e. about 8
mg/L) in order to reach a fraction of about 80 % Th activity in the colloidal phase. That
trace amount of actinides species present in solution undergo complexation with HA is
evident from the similar pattern of the colloids generation observed from both actinide
and 14C-activity measurements. In addition, in the low HA concentration range ( ≤ 1 mg/L
HA) the colloidal fractions from 14C measurements are smaller than those observed at the
formation of humic colloids in presence of only Al at concentration of 10-5 M at pH 6.6, as
discussed for Fig. 5.2.
When increasing pH to 7.8, we observe that in case of Am and Th the conversion
of the precipitate to the colloidal phase starts at lower HA concentration (i.e. below 0.6
mg/L), as compared to pH 6.6. With increasing pH deprotonation of humic acid functional
groups takes place and more sites become available for complexation. Also, with increas-
ing pH, the element (An/Al) hydrolysis advances as illustrated for example for Al in Fig.
5.6 a. For this reason, the observed shift to lower HA concentration with increasing pH
might be correlated to a lower positive charge carried by the ionic species at this pH as for
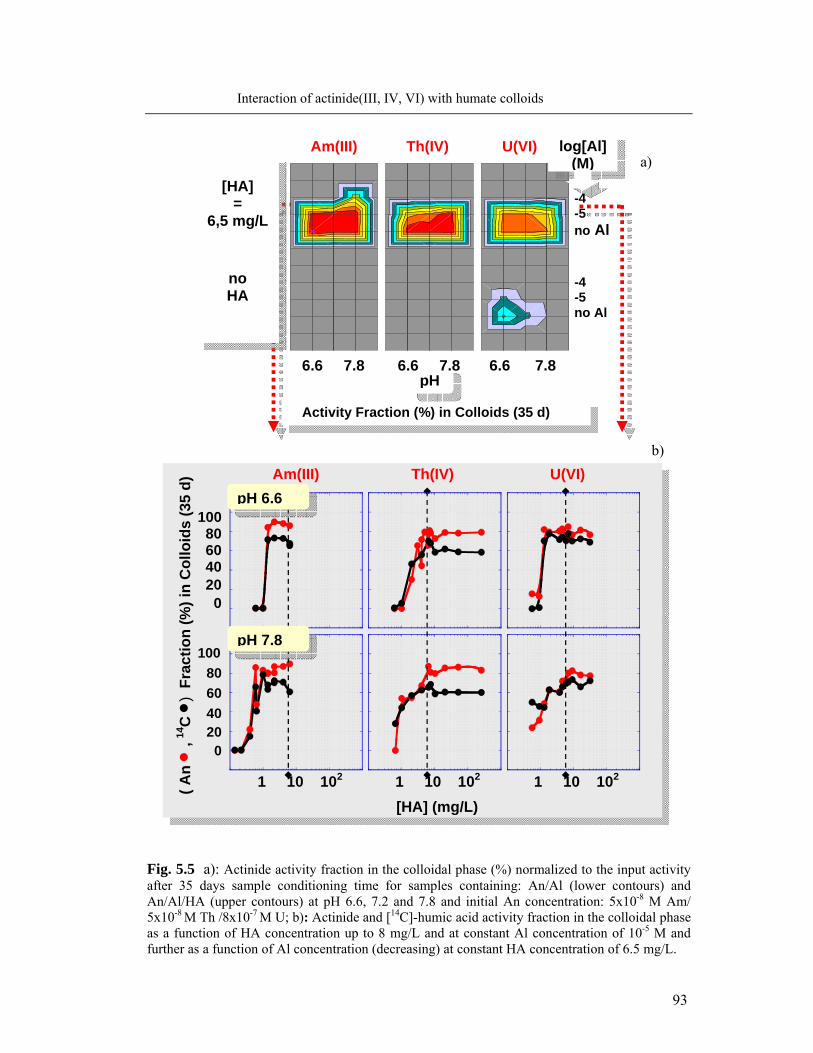
93
Interaction of actinide(III, IV, VI) with humate colloids
Fig. 5.5 a): Actinide activity fraction in the colloidal phase (%) normalized to the input activity after 35 days sample conditioning time for samples containing: An/Al (lower contours) and An/Al/HA (upper contours) at pH 6.6, 7.2 and 7.8 and initial An concentration: 5x10⁻⁸ M Am/ 5x10⁻⁸ M Th /8x10-7 M U; b): Actinide and [14C]-humic acid activity fraction in the colloidal phase as a function of HA concentration up to 8 mg/L and at constant Al concentration of 10-5 M and further as a function of Al concentration (decreasing) at constant HA concentration of 6.5 mg/L.
[HA] (mg/L)
100
80
60
40
20
0
( A
n •
, 14C
•)
Frac
tion
(%) i
n C
ollo
ids
(35
d)
1 10 102 1 10 102 1 10 102
Am(III) Th(IV) U(VI)
100 80 60 40
20
0
pH 6.6
pH 7.8
log[Al] (M)
Activity Fraction (%) in Colloids (35 d)
pH
-4 -5 no Al
-4 -5 no Al
[HA]
= 6,5 mg/L
no HA
6.6 7.8 6.6 7.8 6.6 7.8
Am(III) Th(IV) U(VI) a)
b)
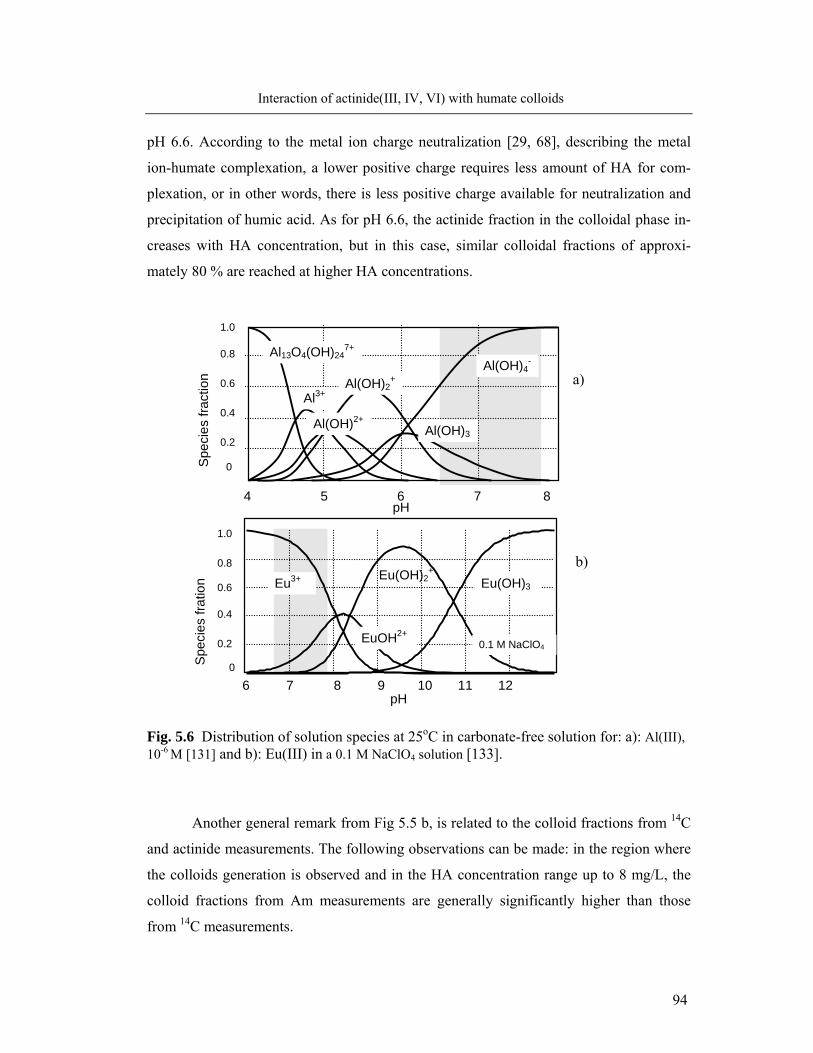
94
Interaction of actinide(III, IV, VI) with humate colloids
pH 6.6. According to the metal ion charge neutralization [29, 68], describing the metal
ion-humate complexation, a lower positive charge requires less amount of HA for com-
plexation, or in other words, there is less positive charge available for neutralization and
precipitation of humic acid. As for pH 6.6, the actinide fraction in the colloidal phase in-
creases with HA concentration, but in this case, similar colloidal fractions of approxi-
mately 80 % are reached at higher HA concentrations.
Fig. 5.6 Distribution of solution species at 25oC in carbonate-free solution for: a): Al(III), 10-6 M [131] and b): Eu(III) in a 0.1 M NaClO4 solution [133].
Another general remark from Fig 5.5 b, is related to the colloid fractions from 14C
and actinide measurements. The following observations can be made: in the region where
the colloids generation is observed and in the HA concentration range up to 8 mg/L, the
colloid fractions from Am measurements are generally significantly higher than those
from 14C measurements.
Al13O4(OH)247+
Al3+
Al(OH)2+
Al(OH)2+
Al(OH)3
Al(OH)4-
4 5 6 7 8 pH
1.0 0.8 0.6 0.4 0.2 0 S
peci
es fr
actio
n
Spe
cies
frat
ion
1.0 0.8 0.6 0.4 0.2 0
Eu3+
EuOH2+
Eu(OH)2+ Eu(OH)3
6 7 8 9 10 11 12 pH
0.1 M NaClO4
a)
b)
95
Interaction of actinide(III, IV, VI) with humate colloids
This behaviour is distinct as compared to that observed for Th and U, for which
the colloid fractions from Th/U measurements are lower or equal to that from 14C for the
above mentioned HA concentration range. However, Th/U colloid fractions tend to be-
come more elevated than those from 14C measurements with increasing the ratio HA/Al
concentration (i.e. decreasing Al concentration). Under the experimental conditions the 14C-activity measurements reflect the distribution of humic colloids at complexation with
Al and therefore might be considered as an indicator of the Al effect at the interaction
with humic colloids. Providing this assumption is correct, the more elevated colloidal
fractions obtained from Am measurements as compared to those from 14C, may reflect a
higher affinity of Am for binding to humic colloids as compared to that of Al.
5.3 Identification of humate colloid-borne actinide species
An attempt is made in the followings in order to investigate the underlying reasons
for the suggested different quality of Al and Am complexation with humic colloids.
Therefore, the effects of Al and Am on the humic colloids formation are examined in
more detail in a similar experiment but eliminating the concentration difference between
the two elements. Thus, Al is replaced through Eu (as analogue of Am). Maintaining Eu
concentration at 1x10⁻⁵ M and adding in each case 5x10⁻⁸ M Am as monitoring tracer, hu-
mic acid concentration is gradually increased. Fig. 5.7 illustrates comparatively selected
results for the formation of humate-colloid-borne Am monitored as a function of HA con-
centration, in presence of either Eu or Al, at pH 6.6 (Fig. 5.7 a, b) and at pH 7.8 (Fig. 5.7
c, d). Only the colloid fractions obtained from Am activity measurements are shown. The
experimental concentration of Eu is at the solubility limit of Eu hydroxide [133] whereas
that of Al is above the solubility of its amorphous hydroxide [131] at pH 6.6.
Eu appears to be precipitated in the low humic acid concentration range, where
humic acid has been also found to be precipitated upon saturation of functional groups by
the Eu3+ ion. By further increasing the humic acid concentration, the precipitate is
promptly transferred to the colloidal phase beginning with 6.5 mg/L humic acid as can be
seen in Fig. 5.7 a. Al is also coprecipitated with humic acid in the very low humic acid
concentration range as shown in Fig. 5.7 b. The conversion of the precipitate to the colloi-
dal phase starts at approximately 1.0 mg/L humic acid. The humic acid concentration re-
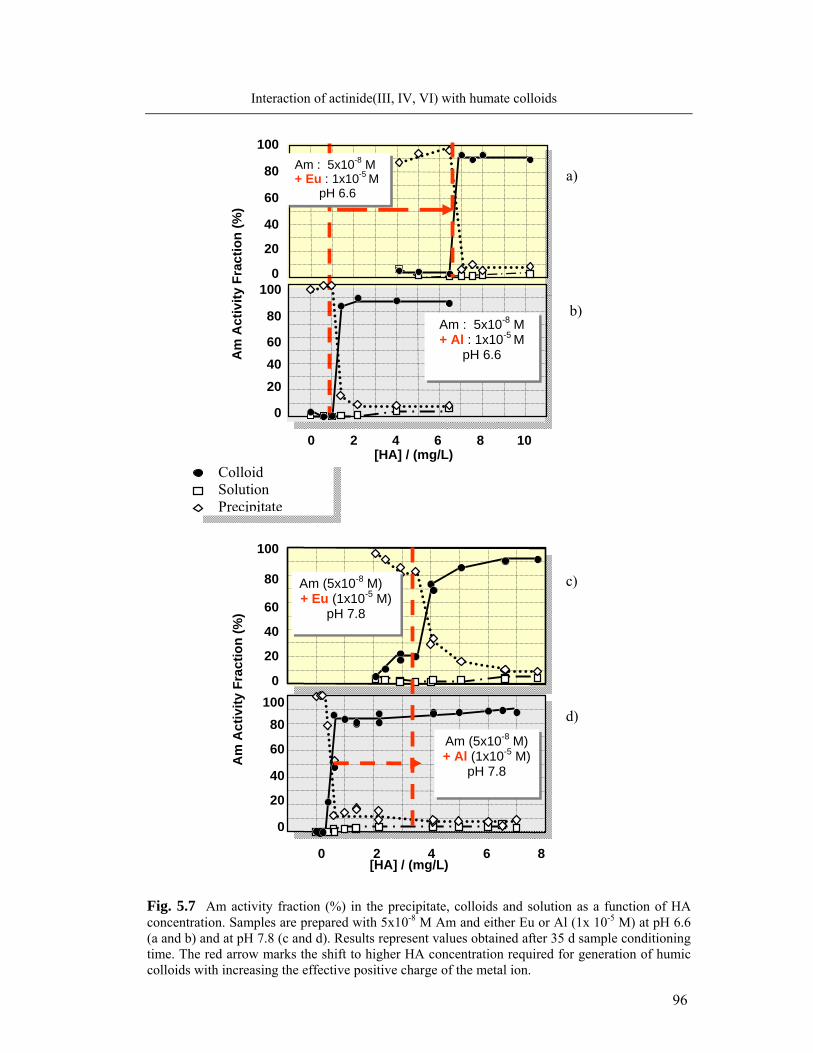
96
Interaction of actinide(III, IV, VI) with humate colloids
Fig. 5.7 Am activity fraction (%) in the precipitate, colloids and solution as a function of HA concentration. Samples are prepared with 5x10⁻⁸ M Am and either Eu or Al (1x 10⁻⁵ M) at pH 6.6 (a and b) and at pH 7.8 (c and d). Results represent values obtained after 35 d sample conditioning time. The red arrow marks the shift to higher HA concentration required for generation of humic colloids with increasing the effective positive charge of the metal ion.
100
80
60
40
20
0
0 2 4 6 8 10
Am : 5x10⁻⁸ M + Eu : 1x10⁻⁵
M pH 6.6
[HA] / (mg/L)
Am
Act
ivity
Fra
ctio
n (%
)
100
80
60
40
20
0
100
80
60
40
20
0
0 2 4 6 8
Am (5x10⁻⁸ M) + Al (1x10⁻⁵ M)
pH 7.8
Am (5x10⁻⁸ M) + Eu (1x10⁻⁵ M)
pH 7.8
[HA] / (mg/L)
Am
Act
ivity
Fra
ctio
n (%
)
100
80
60
40
20
0
Colloid Solution Precipitate
Am : 5x10⁻⁸ M + Al : 1x10⁻⁵
M pH 6.6
a)
b)
c)
d)
97
Interaction of actinide(III, IV, VI) with humate colloids
quired for the conversion of precipitate to colloids is much lower for Al than for Eu, al-
though the same concentration is maintained for both elements. The differences can be
correlated to the speciation of both elements given in Figs. 5.6 a and 5.6 b and explained
by a numerical comparison of equivalent concentrations of the given reactants.
At pH 6.6, the equivalent concentration of 6.5 mg/L humic acid with proton ex-
change capacity of 4.8x10⁻³eq/g and 1x10⁻⁵ M Eu are calculated to be
Humic acid: 4.8x10⁻³ (eq/g) x 6.5 x 10⁻³(g/L) = 3.1x10⁻⁵ (eq/L)
Eu3+ ion: 1x10⁻⁵ (mol/L) x 3 = 3.0x10⁻⁵ (eq/L)
The data show that once Eu3+ loads completely the functional groups of humic acid the
precipitation prevails as is apparent from Fig. 5.7 a. Thus, for the given Eu3+ concentra-
tion (1x10⁻⁵ M) at pH 6.6, the precipitate becomes colloidal with increasing the humic
acid concentration above 6.5 mg/L. The process can be regarded as a complexation of the
Eu3+ ion with humic acid, leading either to precipitate at saturation or to colloids at under-
saturation of functional groups.
A similar calculation can be made for Al in accordance to its speciation and the
1.0 mg/L HA required.
Humic acid: 4.8x10⁻³ (eq/g) x 1.0x10⁻³(g/L) = 4.8 x10⁻⁶ (eq/L)
If we take into consideration the speciation in absence of humic acid given in Fig. 5.6 b,
i.e., 10% for Al(OH)2+, and 20 %Al(OH)3, the concentration of the reactive Al species is
estimated to be:
Al(OH)2++ Al(OH)3: 1x10⁻⁵ (mol/L) x 0.3 = 3.0x10⁻⁶ (eq/L)
This value is somewhat lower than the humic acid concentration at which the humic col-
loids begins to be generated as shown in Fig. 5.7 b. The reason might be that the fraction
of the Al(OH)2+ species reacting with humic acid is slightly higher than predicted by the
thermodynamic speciation data for Al in absence of humic acid.
The results indicate the formation of ternary complexes of Al with humic acid,
whereas the reaction of Eu concluded from Fig. 5.7 a represents formation of a binary
98
Interaction of actinide(III, IV, VI) with humate colloids
complex at pH 6.6. It is apparent from Fig. 5.7, that humic colloids are formed when
metal ions do not saturate by complexation all available functional sites of humic acid
which can thus remain stable in the hydrophilic state.
As shown in Fig. 5.7, when increasing pH to 7.8, the formation of humic colloids
requires less humic acid concentrations than at pH 6.6. At pH 7.8, as indicated in the
speciation diagram (Fig. 5.6 a), three different Eu species are possibly involved in the re-
action with humic acid: Eu3+, Eu(OH)2+ and Eu(OH)2+. Previously published data regard-
ing the complexation of Am and Cm with humic acid [65, 66, 134] reported the formation
of binary humate and ternary An-hydroxohumate complexes in the same pH range as in
the present experiment. In analogy with the stability constants derived in the above men-
tioned studies for the Am(Cm)-complexes, each of the Eu species present in solution at
pH 7.8 is expected to have its own affinity towards complexation with humic acid. As
shown in Fig. 5.7 c, the formation of humic colloids via complexation with Eu starts at
2.2 mg/L humic acid, progressing slowly at the beginning and then increasing abruptly for
humic acid concentration ≥ 3.6 mg/L. This non-smooth correlation with the humic acid
concentration describes the plausible reactions of different Eu species as can be correlated
with Fig. 5.6 b. The ternary complexation of Eu forming its hydroxohumate species re-
quires less humic acid according to the metal ion charge neutralization model [29, 67]
where the metal ion occupies a number of proton sites equal to its effective charge. The
present observation in Fig. 5.7 c follows closely this approach. As a result, formation of
humic colloids progresses step-forwards via complexation of different Eu species. Ac-
cording to the speciation given in Fig. 5.6 a, the equivalent concentration of Eu species
involved in complexation with humic acid can be estimated at pH 7.8:
Eu3+(55%) + Eu(OH)2+(35%) + Eu(OH)2+(10%): 1x10⁻⁵(3x0.55 + 2x0.35 + 1x0.1)
= 2.45x10⁻⁵ (eq/L)
The equivalent concentration of Eu species suggests that formation of humic colloids re-
quires a concentration higher than 5 (2.45x10⁻⁵/4.8x10-3) mg/L humic acid to include all
Eu species present in solution, concentration which is certainly lower than with Eu3+ alone
observed at pH 6.6. The value > 5 mg/L corresponds well to the experimental results
showed in Fig. 5.7.
In case of humic colloid formation in the presence of Al at pH 7.8, the colloids
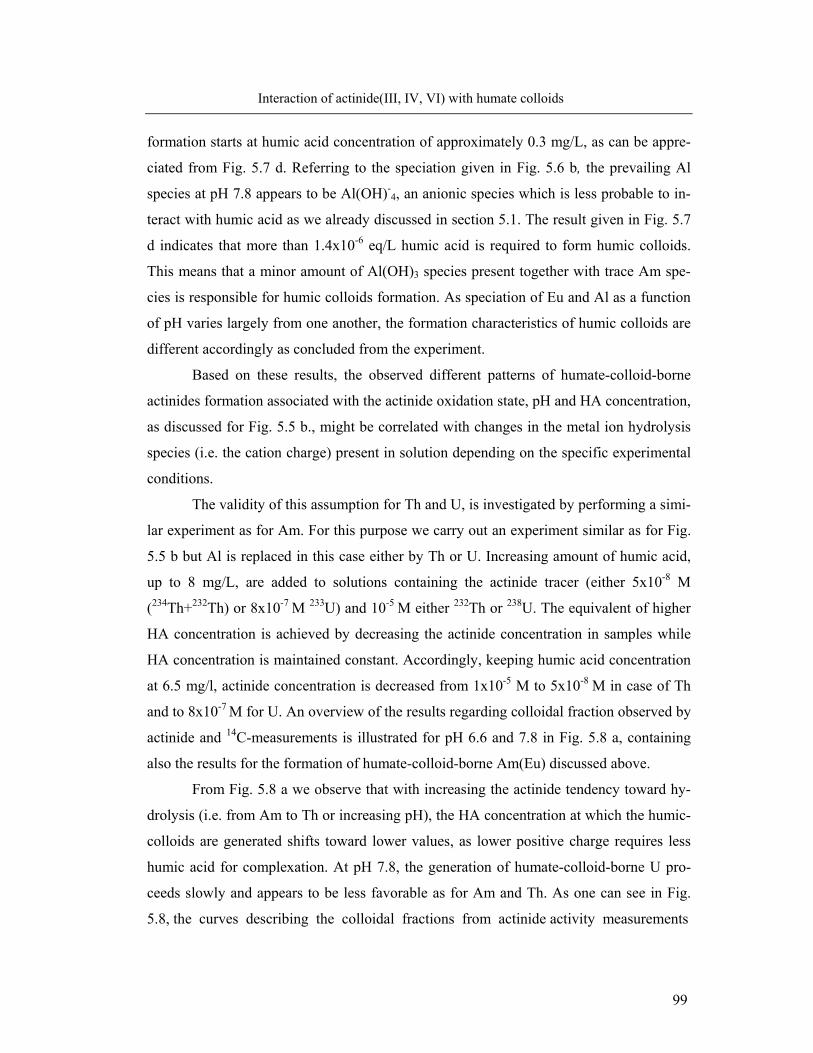
99
Interaction of actinide(III, IV, VI) with humate colloids
formation starts at humic acid concentration of approximately 0.3 mg/L, as can be appre-
ciated from Fig. 5.7 d. Referring to the speciation given in Fig. 5.6 b, the prevailing Al
species at pH 7.8 appears to be Al(OH)-4, an anionic species which is less probable to in-
teract with humic acid as we already discussed in section 5.1. The result given in Fig. 5.7
d indicates that more than 1.4x10⁻⁶ eq/L humic acid is required to form humic colloids.
This means that a minor amount of Al(OH)3 species present together with trace Am spe-
cies is responsible for humic colloids formation. As speciation of Eu and Al as a function
of pH varies largely from one another, the formation characteristics of humic colloids are
different accordingly as concluded from the experiment.
Based on these results, the observed different patterns of humate-colloid-borne
actinides formation associated with the actinide oxidation state, pH and HA concentration,
as discussed for Fig. 5.5 b., might be correlated with changes in the metal ion hydrolysis
species (i.e. the cation charge) present in solution depending on the specific experimental
conditions.
The validity of this assumption for Th and U, is investigated by performing a simi-
lar experiment as for Am. For this purpose we carry out an experiment similar as for Fig.
5.5 b but Al is replaced in this case either by Th or U. Increasing amount of humic acid,
up to 8 mg/L, are added to solutions containing the actinide tracer (either 5x10⁻⁸ M
(234Th+232Th) or 8x10⁻⁷ M 233U) and 10-5 M either 232Th or 238U. The equivalent of higher
HA concentration is achieved by decreasing the actinide concentration in samples while
HA concentration is maintained constant. Accordingly, keeping humic acid concentration
at 6.5 mg/l, actinide concentration is decreased from 1x10⁻⁵ M to 5x10⁻⁸ M in case of Th
and to 8x10⁻⁷ M for U. An overview of the results regarding colloidal fraction observed by
actinide and 14C-measurements is illustrated for pH 6.6 and 7.8 in Fig. 5.8 a, containing
also the results for the formation of humate-colloid-borne Am(Eu) discussed above.
From Fig. 5.8 a we observe that with increasing the actinide tendency toward hy-
drolysis (i.e. from Am to Th or increasing pH), the HA concentration at which the humic-
colloids are generated shifts toward lower values, as lower positive charge requires less
humic acid for complexation. At pH 7.8, the generation of humate-colloid-borne U pro-
ceeds slowly and appears to be less favorable as for Am and Th. As one can see in Fig.
5.8, the curves describing the colloidal fractions from actinide activity measurements
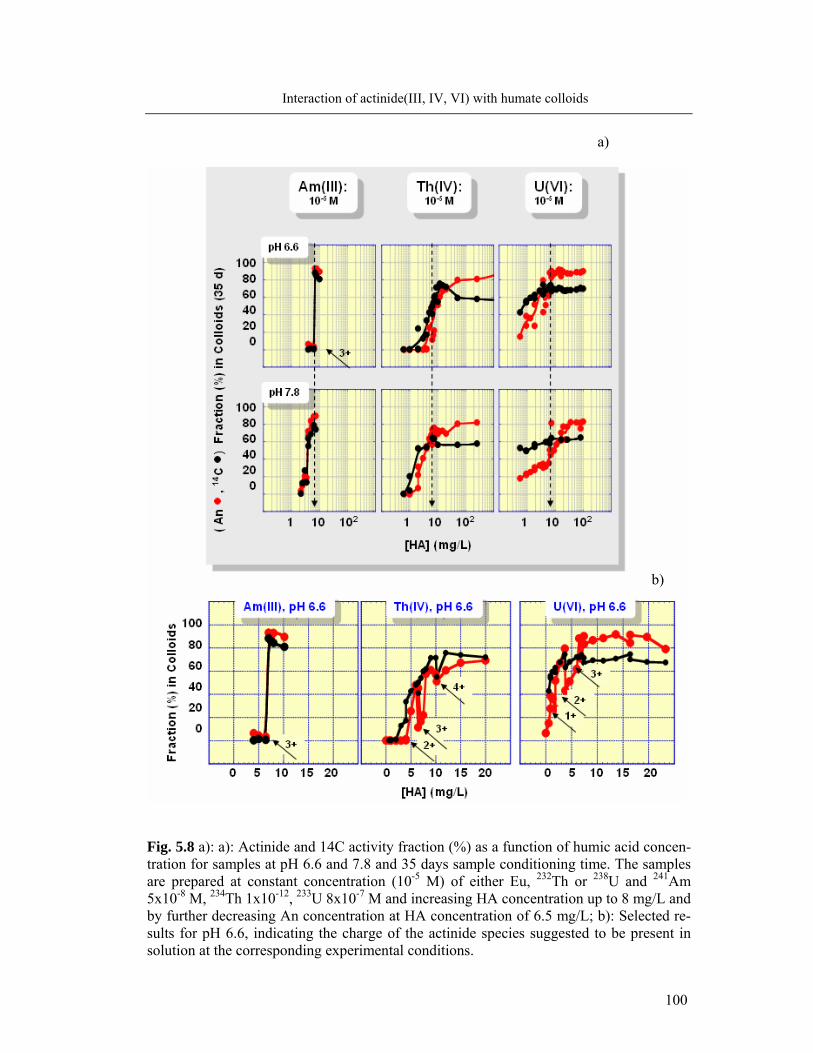
100
Interaction of actinide(III, IV, VI) with humate colloids
a)
Fig. 5.8 a): a): Actinide and 14C activity fraction (%) as a function of humic acid concen-tration for samples at pH 6.6 and 7.8 and 35 days sample conditioning time. The samples are prepared at constant concentration (10-5 M) of either Eu, 232Th or 238U and 241Am 5x10⁻⁸ M, 234Th 1x10-12, 233U 8x10⁻⁷ M and increasing HA concentration up to 8 mg/L and by further decreasing An concentration at HA concentration of 6.5 mg/L; b): Selected re-sults for pH 6.6, indicating the charge of the actinide species suggested to be present in solution at the corresponding experimental conditions.
b)
101
Interaction of actinide(III, IV, VI) with humate colloids
become equal and further exceed those from 14C-measurements when increasing HA con-
centration or decreasing the An/HA concentration ratio, respectively. In association with
the previous results for Am/Al, the changes in the relative position of the two curves
might suggest an increasing affinity of Th/U species toward complexation with humic-
colloids when the experimental conditions change as mentioned above. One can further
observe from Fig. 5.8 a, that at pH 6.6, in case of both Th and U, the colloid fractions ex-
hibits oscillations with several minima corresponding to HA concentration where the col-
loids begins to form out of the precipitate. The effect appears to be reproducible as ob-
served at repeated experiments. Such minima could be taken as indicators of experimental
conditions where distinct Th(U) ionic species are neutralized by humic acid. This hy-
pothesis is analyzed in the followings for pH 6.6. For a better view, reference is made to
the Fig. 5.8 b, illustrating the results for a limited HA concentration range, up to 20 mg/L.
Th concentration of 10-5 M is above the solubility limit of the amorphous Th(OH)4
[135] and in absence of HA, Th activity fraction is found in the precipitate. As can be
seen in Fig 5.8 b in the region of low HA concentration, there is no colloid formation, Th
and HA remain in the precipitate phase. The generation of colloid-borne Th via complexa-
tion with HA starts at 4 mg/L HA, that is lower as needed as for the same concentration of
Am(Eu) (species with charge 3+) at the same pH. We carry out similar calculation as in
case of Am(Eu) for the reactant equivalent concentration involved in the complexation
reaction. For 4 mg/L HA and its PEC of 4.8x10⁻³ (eq/g), the equivalent concentration is
Humic acid: 4.8x10⁻³ (eq/g) x 4.0x10⁻³ (g/L) = ~ 1.9x10⁻⁵ (eq/L)
Taking this as equivalent concentration as in the neutralization reaction with the
Th(OH)y4-y species assumed to be present in solution at the concentration of 10-5 M a re-
verse calculation is carried out. This leads to a value of approximately 2 (1.9x10⁻⁵ M
/1x10-5 M) for the charge of Th species involved in the complexation reaction. According
to the speciation data, in absence of HA, the expected species in solution are Th(OH)4 and
Th(OH)3+ (Fig. 8.2 a). The result indicates that in presence of 4 mg/L HA, Th hydrolysis
is inhibited and Th(OH)y4-y species with charge 2+ should be the reactive species in solu-
tion. With increasing HA concentration formation of Th colloids proceeds rapidly. The
next points (minima) associated with the formation of colloids from the precipitate are
observed to occur at 6 and 8 mg/L HA. Similar calculations as described above suggest
102
Interaction of actinide(III, IV, VI) with humate colloids
that the equivalent HA concentrations correspond to the complexation (neutralization) of
Th species with effective charge of approximately 3+ (2.9) and 4+ (3.8), respectively,
with the latter value corresponding to the non-hydrolyzed Th4+. The result suggests that
with increasing the HA concentration, the complexation takes place with the less hydro-
lyzed species. The complexation of Th with HA in the neutral pH range is reported in the
literature [74], but the available thermodynamic data are poor for the ternary complexa-
tion [11].
A similar pattern of colloid-formation is observed in case of U. At pH 6.6 the U
concentration of 1x10⁻⁵ M is above the saturation concentration of the U(VI) hydroxide:
metaschopite [61]. As can be seen in Fig. 5.8 b, in absence of humic acid U activity is
present in the precipitate phase. Upon addition of humic acid, the formation of humate-
colloid-borne U proceeds slowly. The first point associated to the colloid generation out
of precipitate occurs at 2 mg/L HA. The speciation data shown in Fig. 8.2 b, indicate that
in absence of HA at pH 6.6 the expected species in solution are (UO2)3(OH)5+ and
UO2OH+. Based on the equivalent HA concentration and assuming the concentration of U
reactive species in solution is 10-5 M, the charge of the U species involved in the reaction
in this case is found to be approximately 1+, in agreement with the U speciation data in
absence of HA. The literature documents the interaction of HA with the above mentioned
species [7, 46]. Increasing HA concentration follows the minima at 4 and 6 mg/L HA,
corresponding to reactive U species with charge 2+ and 3+, respectively. The charge 3+
for U(VI) is conceivable since it is known that in the linear structure of UO22+ the effec-
tive charge available for complexation (specific binding) is 3.2+ [46, 73]. The results in-
dicate once more that increasing the humic acid concentration induces an inhibition of the
actinide hydrolysis with preferential formation of higher positively charged species, with
higher affinity towards complexation with humic colloid. For both Th and U we observe
from Fig. 5.8 that at increasing the HA/An concentration ratio (decreasing An concentra-
tion), the An tend to be preferentially distributed to the colloidal phase.
5.4 Conclusions
The present results show that interaction of trace amount of actinides with humic
colloids is very efficient in the neutral pH range 6.6-7.8. The complexation of An and Al
103
Interaction of actinide(III, IV, VI) with humate colloids
with the humic-colloids is correlated to their hydrolysis tendency. Hence, the generation
of humate-colloid-borne species is distinctively favored for the non-hydrolyzed ionic spe-
cies. Accordingly, among actinides present at tracer concentration, the less hydrolyzed
Am(III) shows higher affinity as compared to Th(IV) and U(VI) for the formation of hu-
mate-colloid-borne species in the neutral pH range and for humic acid concentration at the
average level of natural waters. Al, with higher tendency to hydrolyze is less favored at
the interaction with humic colloids. However, apart from the element intrinsic hydrolysis
behaviour, the prevailing species will be also influenced by the specific conditions: e.g., at
increasing HA concentration the hydrolysis is expected to be suppressed by humate com-
plexation.
104
Competitive interaction of actinide(III-VI) with aluminosilicate and humate colloids
6. Competitive interaction of actinide(III-VI) with aluminosilicate and humate
colloids
The results discussed in chapters 4 and 5 have given a better insight on the interac-
tion of actinides (An) either with the HAS or with HA. The study is continued for investi-
gating the behaviour of Al and the actinides, either Am, Th or U, in the mixed system
humic acid-aluminosilicate. Thus, the actinides may undergo complexation with humate
colloids, conucleate with silicic acid with formation of An-HAS pseudocolloids, and in-
teract with both HAS and HA with formation of mixed HAS-humic colloidal species or a
mixture of An-HAS and An-humic colloids. The formation of colloid-borne An in the
presence of both HAS and humic acid (14C-HA) is examined within the neutral pH range
6.6 to 7.8. The pH range, for which the An-humate complexation has been discussed in
chapter 5, is chosen to follow the low solubility regions of Al(OH)3 and aluminosilicate
minerals in which the HAS colloid formation is not pronounced due to precipitation [26,
27] and thus the eventual influence of HA on the colloid formation becomes visible. HAS
solutions are prepared from both undersaturated and oversaturated silica to observe col-
loid formation from both monosilicic and polysilicic acid, respectively. Based on the re-
sults from section 5.2, humic acid concentration is kept constant at 6.5 mg/L appeared to
be appropriate to appraise the humic acid effect. Trace amounts of actinides are used in
the experiment: [241Am]: 5x10⁻⁸ M, [234Th + 232Th]: 5x10⁻⁸ M and [233U]: 8x10⁻⁷ M.
6.1 Complexation of Al and An(III) with silicic and humic acid
6.1.1 Formation of colloid-borne actinide(III): parameter screening
A parameter screening experiment is carried out to characterize the conditions for
formation of colloid-borne Am in presence of both HAS and humic colloids for the above
mentioned experimental conditions. Fig. 6.1 depicts the results for colloid formation as-
certained by 241Am and 14C measurements. Colloidal fractions are distinguished after a
sample conditioning time of 35 days as a function of the relevant parameters, namely pH,
concentration and concentration ratio of Si and Al. The figure contains three contour dia-
grams for the interaction of Am with different colloid types: (a) HAS colloids synthesized
from Si and Al; (b) humic colloids complexed with Al; (c) composite HAS and humate
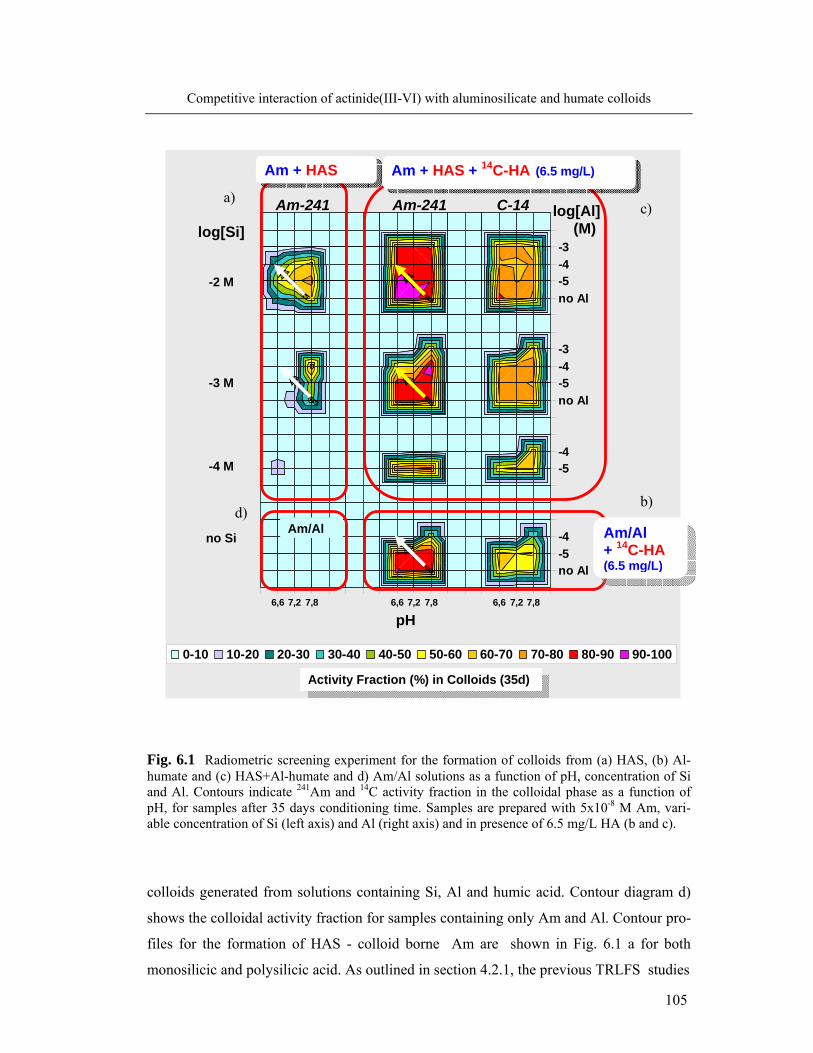
105
Competitive interaction of actinide(III-VI) with aluminosilicate and humate colloids
Fig. 6.1 Radiometric screening experiment for the formation of colloids from (a) HAS, (b) Al-humate and (c) HAS+Al-humate and d) Am/Al solutions as a function of pH, concentration of Si and Al. Contours indicate 241Am and 14C activity fraction in the colloidal phase as a function of pH, for samples after 35 days conditioning time. Samples are prepared with 5x10⁻⁸ M Am, vari-able concentration of Si (left axis) and Al (right axis) and in presence of 6.5 mg/L HA (b and c).
colloids generated from solutions containing Si, Al and humic acid. Contour diagram d)
shows the colloidal activity fraction for samples containing only Am and Al. Contour pro-
files for the formation of HAS - colloid borne Am are shown in Fig. 6.1 a for both
monosilicic and polysilicic acid. As outlined in section 4.2.1, the previous TRLFS studies
6,6 7,2 7,8 6,6 7,2 7,8 6,6 7,2 7,8
no Al-5-4
-5-4
no Al-5-4-3
no Al-5-4-3
pH
0-10 10-20 20-30 30-40 40-50 50-60 60-70 70-80 80-90 90-100
log[Si]
-2 M
-3 M
-4 M
no Si
log[Al] (M)
Am/Al + 14C-HA (6.5 mg/L)
Am + HAS + 14C-HA (6.5 mg/L) Am + HAS
Am-241 Am-241 C-14
Activity Fraction (%) in Colloids (35d)
Am/Al
b)
c) a)
d)
106
Competitive interaction of actinide(III, IV, VI) with aluminosilicate and humate colloids
have shown that in the pH range of the current experiment, Cm binds to the HAS-colloids
by coordination with the silicate ligand via partial or full displacement of water molecules
of Cm. The formation depends whether the HAS are produced from monosilicic or
polysilicic acid. Fractions of HAS-colloid borne Am are relatively low because of low
solubilities of HAS in the present pH region.
Addition of humic acid converts precipitates to the colloids, as shown in Fig. 6.1 c,
colloidal fractions are thus increased in broad ranges of Al concentration and pH. The in-
crease of colloidal fractions by addition of HA (from Fig. 6.1 a to c) suggests a conversion
of HAS precipitate to HAS-humic colloids. As shown in Fig. 6.1 c, the colloidal fractions
measured by 241Am (left part) are somewhat higher than those of humic colloids (right)
although the patterns of colloids formation are similar for similar Al concentration and
pH. These observations implicate that during conversion of HAS precipitate to HAS-
humic colloids, Am appears to be preferentially incorporated into the colloidal fraction.
Fig. 6.1 b shows contour profiles of the humic colloid formation in the presence of Al but
without Si. Fractions of humic colloid-borne Am (left side) are again somewhat higher
than those of humic colloids (right side) whereas both profiles are comparable. This pref-
erential incorporation of Am into the colloidal phase at complexation with HA has been
already mentioned in section 5.2. Once the silicic acid is present, the colloid formation
patterns change (from 6.1 b to 6.1 c) and the colloid formation is overall enhanced. Both
changes from Figs. 6.1 a, and 6.1 b to 6.1 c can be considered as synergic formation of
HAS-humic colloids incorporating Am efficiently.
The behaviour of Am is further analyzed under particular conditions indicated in
Fig. 6.1 by arrows, where the formation of colloid-borne Am depends sensitively on the
individual components under consideration, Si, Al and HA. Concentration of 10-4 M Al is
chosen because at this concentration level, the effects of Si and HA can be better com-
pared for recognition of their ligand competition. Fig. 6.2 illustrates formation of colloid-
borne Am under different conditions.
In blank Al(Am) solution (Fig. 6.2 a) Am is precipitated in the given pH range and
no colloid formation is observed. Addition of HA results in the formation of a marginal
fraction of humic colloid-borne Am only at pH 7.8. The result can be expected, because as
discussed in the previous section, the formation of Am/Al-humate colloids at Al concen-
tration of 1x10⁻⁵ M requires HA concentration of at least 1 mg/L HA at pH 6.6 (Fig. 5.7 b)
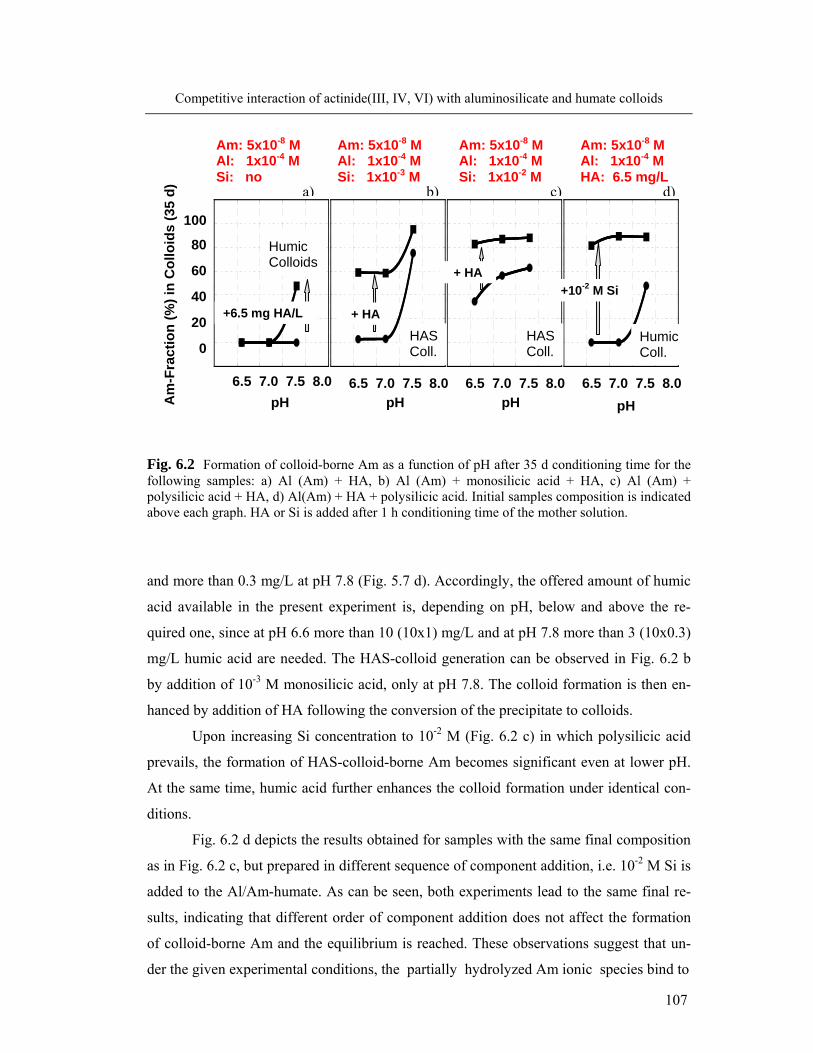
107
Competitive interaction of actinide(III, IV, VI) with aluminosilicate and humate colloids
Fig. 6.2 Formation of colloid-borne Am as a function of pH after 35 d conditioning time for the following samples: a) Al (Am) + HA, b) Al (Am) + monosilicic acid + HA, c) Al (Am) + polysilicic acid + HA, d) Al(Am) + HA + polysilicic acid. Initial samples composition is indicated above each graph. HA or Si is added after 1 h conditioning time of the mother solution.
and more than 0.3 mg/L at pH 7.8 (Fig. 5.7 d). Accordingly, the offered amount of humic
acid available in the present experiment is, depending on pH, below and above the re-
quired one, since at pH 6.6 more than 10 (10x1) mg/L and at pH 7.8 more than 3 (10x0.3)
mg/L humic acid are needed. The HAS-colloid generation can be observed in Fig. 6.2 b
by addition of 10-3 M monosilicic acid, only at pH 7.8. The colloid formation is then en-
hanced by addition of HA following the conversion of the precipitate to colloids.
Upon increasing Si concentration to 10-2 M (Fig. 6.2 c) in which polysilicic acid
prevails, the formation of HAS-colloid-borne Am becomes significant even at lower pH.
At the same time, humic acid further enhances the colloid formation under identical con-
ditions.
Fig. 6.2 d depicts the results obtained for samples with the same final composition
as in Fig. 6.2 c, but prepared in different sequence of component addition, i.e. 10-2 M Si is
added to the Al/Am-humate. As can be seen, both experiments lead to the same final re-
sults, indicating that different order of component addition does not affect the formation
of colloid-borne Am and the equilibrium is reached. These observations suggest that un-
der the given experimental conditions, the partially hydrolyzed Am ionic species bind to
100
80
60
40
20
0 6.5 7.0 7.5 8.0 6.5 7.0 7.5 8.0 6.5 7.0 7.5 8.0 6.5 7.0 7.5 8.0
pH pH pH
pH Am
-Fra
ctio
n (%
) in
Col
loid
s (3
5 d)
Am: 5x10⁻⁸ M Al: 1x10⁻⁴ M Si: 1x10⁻³ M
Am: 5x10⁻⁸ M Al: 1x10⁻⁴ M Si: 1x10⁻² M
Am: 5x10⁻⁸ M Al: 1x10⁻⁴ M HA: 6.5 mg/L
Am: 5x10⁻⁸ M Al: 1x10⁻⁴ M Si: no
+ HA
+10-2 M Si
a)
+6.5 mg HA/L
b) c) d)
Humic Colloids
HAS Coll.
HAS Coll.
Humic Coll.
+ HA
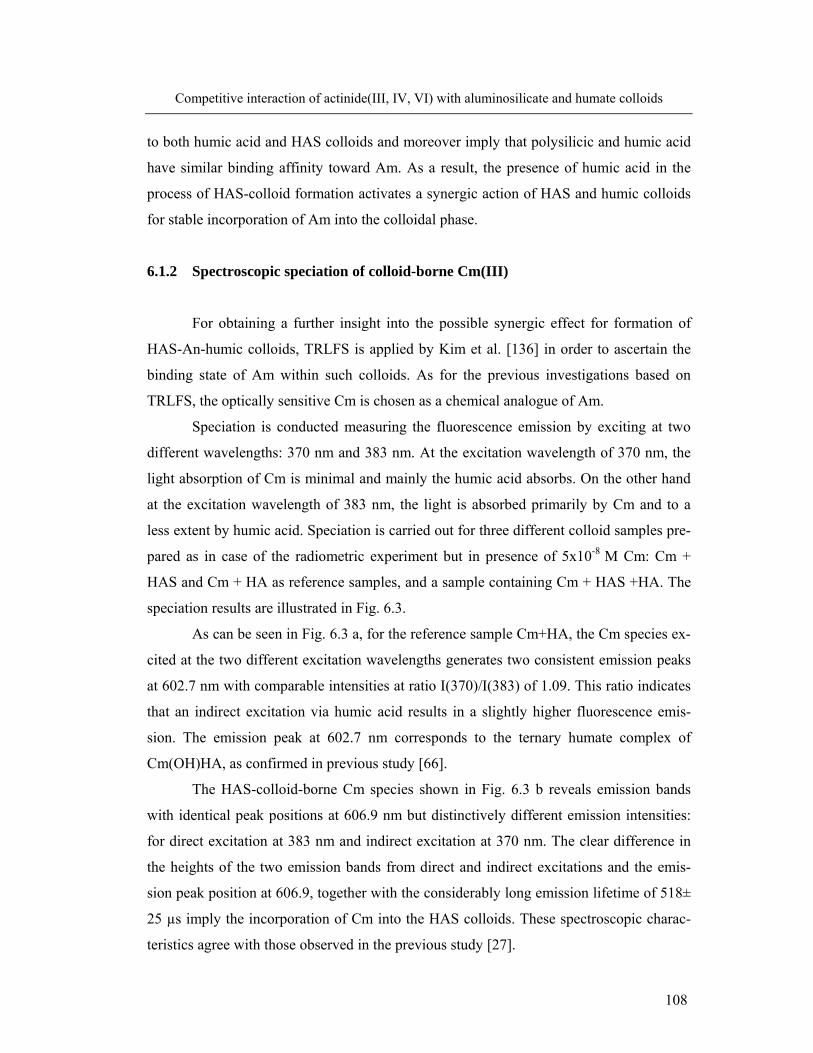
108
Competitive interaction of actinide(III, IV, VI) with aluminosilicate and humate colloids
to both humic acid and HAS colloids and moreover imply that polysilicic and humic acid
have similar binding affinity toward Am. As a result, the presence of humic acid in the
process of HAS-colloid formation activates a synergic action of HAS and humic colloids
for stable incorporation of Am into the colloidal phase.
6.1.2 Spectroscopic speciation of colloid-borne Cm(III)
For obtaining a further insight into the possible synergic effect for formation of
HAS-An-humic colloids, TRLFS is applied by Kim et al. [136] in order to ascertain the
binding state of Am within such colloids. As for the previous investigations based on
TRLFS, the optically sensitive Cm is chosen as a chemical analogue of Am.
Speciation is conducted measuring the fluorescence emission by exciting at two
different wavelengths: 370 nm and 383 nm. At the excitation wavelength of 370 nm, the
light absorption of Cm is minimal and mainly the humic acid absorbs. On the other hand
at the excitation wavelength of 383 nm, the light is absorbed primarily by Cm and to a
less extent by humic acid. Speciation is carried out for three different colloid samples pre-
pared as in case of the radiometric experiment but in presence of 5x10⁻⁸ M Cm: Cm +
HAS and Cm + HA as reference samples, and a sample containing Cm + HAS +HA. The
speciation results are illustrated in Fig. 6.3.
As can be seen in Fig. 6.3 a, for the reference sample Cm+HA, the Cm species ex-
cited at the two different excitation wavelengths generates two consistent emission peaks
at 602.7 nm with comparable intensities at ratio I(370)/I(383) of 1.09. This ratio indicates
that an indirect excitation via humic acid results in a slightly higher fluorescence emis-
sion. The emission peak at 602.7 nm corresponds to the ternary humate complex of
Cm(OH)HA, as confirmed in previous study [66].
The HAS-colloid-borne Cm species shown in Fig. 6.3 b reveals emission bands
with identical peak positions at 606.9 nm but distinctively different emission intensities:
for direct excitation at 383 nm and indirect excitation at 370 nm. The clear difference in
the heights of the two emission bands from direct and indirect excitations and the emis-
sion peak position at 606.9, together with the considerably long emission lifetime of 518±
25 µs imply the incorporation of Cm into the HAS colloids. These spectroscopic charac-
teristics agree with those observed in the previous study [27].
109
Competitive interaction of actinide(III, IV, VI) with aluminosilicate and humate colloids
Fig. 6.3 TRLFS speciation of Cm(III) in different solutions. Figures a-c show the fluorescence emission by direct (blue) and indirect (red) excitation of Cm in the following samples: a) humate-colloid-borne Cm in a sample containing 10-4 M Al and 10 mg/L HA, b): HAS colloid-borne Cm in a sample containing 10-4 M Al and 10-2 M Si, c): HAS-humate colloid-borne Cm in a sample containing 10-4 M Al, 10-2 M Si and 10 mg/L HA. Samples are prepared at pH 8.5 with 4.9 x10⁻⁸
M Cm. The graph in the lower part shows the emission spectra measured at different delay time as indicated on the right part of the graph.
570 580 590 600 610 620 630 Wavelength (nm)
0
0.4
0.8
1.2
1.6 I (383nm) = 13.8 I (370nm) = 15.0 Ratio = 1.09
a)Cm + HA pH 8.5
Reference
0
0.4
0.8 1.2
1.6 I (383nm) = 15.3 I (370nm) = 1.9 Ratio = 0.13
b)Cm + Al/SipH 8.5
Reference
00.4
0.8
1.2
1.6 Cm + Al/Si
+ HA pH 8.5
I (383nm) = 16.4 I (370nm) = 11.5 Ratio = 0.70
c)
606.9
606.9
602.7
604.3
604.3
R
elat
ive
flore
scen
ce in
tens
ity (n
orm
aliz
ed)
110
Competitive interaction of actinide(III, IV, VI) with aluminosilicate and humate colloids
The chemical state of HAS-colloid-borne Cm is different in presence of humic
acid, as shown in Fig. 6.3 c. The emission peak position shifts to 604.3 nm, which is dif-
ferent from those corresponding to humic-colloid-borne Cm (602.7 nm) and HAS–
colloid-borne Cm (606.9 nm). The emission intensity from indirect excitation is 70% of
the value corresponding to direct excitation. The life time of the emission, although not
shown here, has been also found to change: from 518 ± 25 µs for the HAS-colloid-borne
Cm (606.9 nm) to 329±15 µs in presence of humic acid (604.3 nm). The life time value
observed in the mixed colloid sample is however longer than that corresponding to the
humate-colloid-borne Cm of 106 µs [137]. Moreover, one can observe that the position of
the emission peak does not change at increasing the delay times during the lifetime meas-
urements. If a mixture of the two species, i.e. the humate-borne Cm and the HAS-borne
Cm would be present in the solution, than the short lived humate–borne Cm would be no
longer detected during the measurements at longer delay time and one would observe an
emission peak at higher wavelength characteristic to the HAS-borne Cm. The fact that this
is not observed in the composite sample together with the previously mentioned character-
istics regarding the emission intensity, peak position and fluorescence life time, prove that
Cm, initially incorporated in the HAS-colloids undergoes partially chemical bonding to
humic acid, hence forming a composite structure of the HAS-humic colloid-borne species.
6.1.3 Kinetics of actinide(III) incorporation into the colloid mixture
The kinetics of the formation of colloid-borne Am is examined for the parameter
screening experiment described in section 6.1.1. Formation of the colloid-borne Am at
different conditioning times of the mother solutions between 3h to 35 d is illustrated in
Fig. 6.4. The colloid formation in presence of both HAS and HA is compared with the
case when only one of the components is present, either HAS or HA. The general obser-
vation is that for samples containing only HA (Fig. 6.4 a) or only HAS (c, e), the fraction
of colloid-borne Am decreases generally with time and is accompanied by the activity
transfer to the precipitate. In contrast, in samples containing both HAS and HA (Fig. 6.4
b, d), the colloid-borne Am fraction increases within the observation time of 35 d.
The effect is more evident for samples generated in presence of polysilicic acid and
10-4-10-3 M Al at pH 6.6-7.8, conditions indicated by the white lines in Fig. 6.4 d.
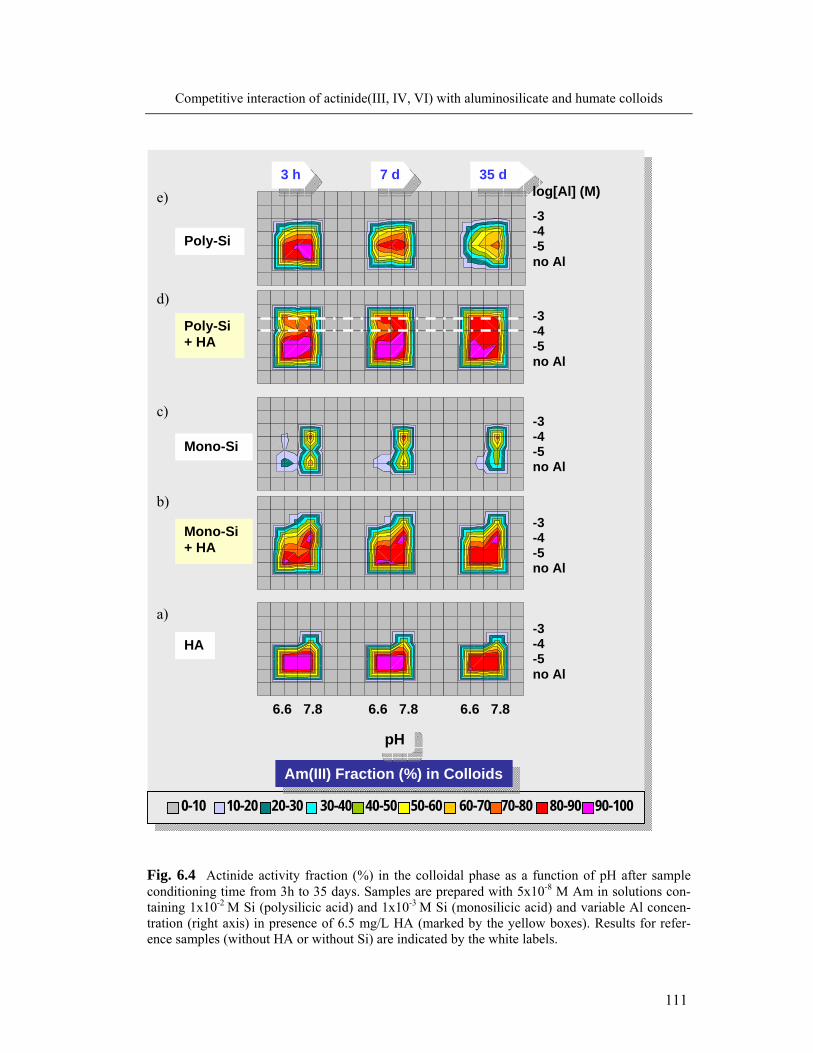
111
Competitive interaction of actinide(III, IV, VI) with aluminosilicate and humate colloids
Fig. 6.4 Actinide activity fraction (%) in the colloidal phase as a function of pH after sample conditioning time from 3h to 35 days. Samples are prepared with 5x10⁻⁸ M Am in solutions con-taining 1x10⁻² M Si (polysilicic acid) and 1x10⁻³ M Si (monosilicic acid) and variable Al concen-tration (right axis) in presence of 6.5 mg/L HA (marked by the yellow boxes). Results for refer-ence samples (without HA or without Si) are indicated by the white labels.
0-10 10-20 20-30 30-40 40-50 50-60 60-70 70-80 80-90 90-100
Am(III) Fraction (%) in Colloids
pH
6.6 7.8 6.6 7.8 6.6 7.8
3 h 7 d 35 d log[Al] (M)
-3 -4 -5 no Al
-3 -4 -5 no Al
-3 -4 -5 no Al
-3 -4 -5 no Al
-3 -4 -5 no Al
Poly-Si
Poly-Si + HA
Mono-Si + HA
Mono-Si
HA
e)
d)
c)
b)
a)
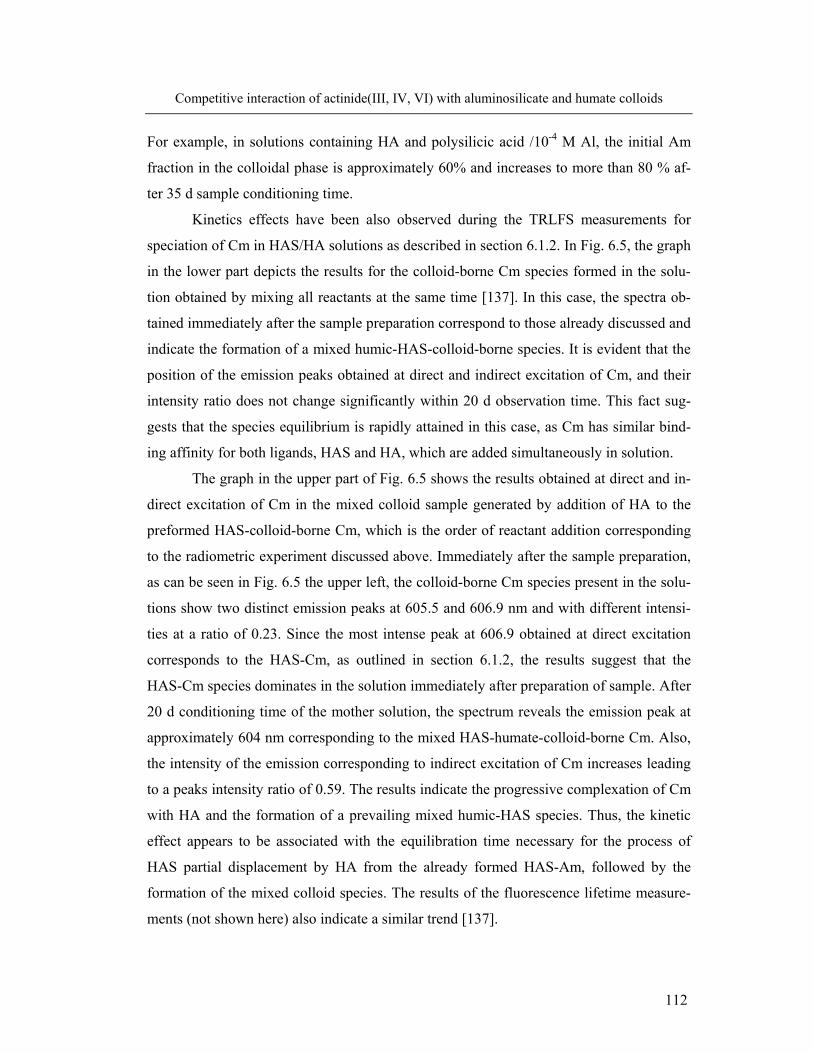
112
Competitive interaction of actinide(III, IV, VI) with aluminosilicate and humate colloids
For example, in solutions containing HA and polysilicic acid /10-4 M Al, the initial Am
fraction in the colloidal phase is approximately 60% and increases to more than 80 % af-
ter 35 d sample conditioning time.
Kinetics effects have been also observed during the TRLFS measurements for
speciation of Cm in HAS/HA solutions as described in section 6.1.2. In Fig. 6.5, the graph
in the lower part depicts the results for the colloid-borne Cm species formed in the solu-
tion obtained by mixing all reactants at the same time [137]. In this case, the spectra ob-
tained immediately after the sample preparation correspond to those already discussed and
indicate the formation of a mixed humic-HAS-colloid-borne species. It is evident that the
position of the emission peaks obtained at direct and indirect excitation of Cm, and their
intensity ratio does not change significantly within 20 d observation time. This fact sug-
gests that the species equilibrium is rapidly attained in this case, as Cm has similar bind-
ing affinity for both ligands, HAS and HA, which are added simultaneously in solution.
The graph in the upper part of Fig. 6.5 shows the results obtained at direct and in-
direct excitation of Cm in the mixed colloid sample generated by addition of HA to the
preformed HAS-colloid-borne Cm, which is the order of reactant addition corresponding
to the radiometric experiment discussed above. Immediately after the sample preparation,
as can be seen in Fig. 6.5 the upper left, the colloid-borne Cm species present in the solu-
tions show two distinct emission peaks at 605.5 and 606.9 nm and with different intensi-
ties at a ratio of 0.23. Since the most intense peak at 606.9 obtained at direct excitation
corresponds to the HAS-Cm, as outlined in section 6.1.2, the results suggest that the
HAS-Cm species dominates in the solution immediately after preparation of sample. After
20 d conditioning time of the mother solution, the spectrum reveals the emission peak at
approximately 604 nm corresponding to the mixed HAS-humate-colloid-borne Cm. Also,
the intensity of the emission corresponding to indirect excitation of Cm increases leading
to a peaks intensity ratio of 0.59. The results indicate the progressive complexation of Cm
with HA and the formation of a prevailing mixed humic-HAS species. Thus, the kinetic
effect appears to be associated with the equilibration time necessary for the process of
HAS partial displacement by HA from the already formed HAS-Am, followed by the
formation of the mixed colloid species. The results of the fluorescence lifetime measure-
ments (not shown here) also indicate a similar trend [137].
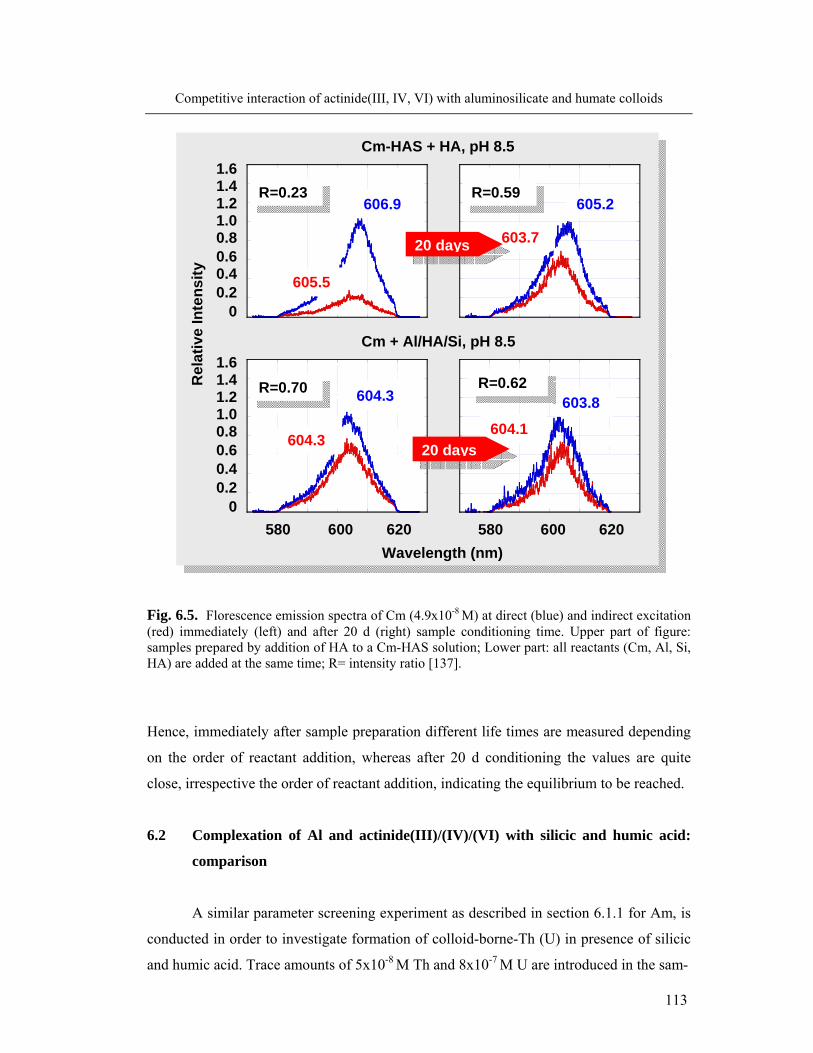
113
Competitive interaction of actinide(III, IV, VI) with aluminosilicate and humate colloids
Fig. 6.5. Florescence emission spectra of Cm (4.9x10⁻⁸ M) at direct (blue) and indirect excitation (red) immediately (left) and after 20 d (right) sample conditioning time. Upper part of figure: samples prepared by addition of HA to a Cm-HAS solution; Lower part: all reactants (Cm, Al, Si, HA) are added at the same time; R= intensity ratio [137].
Hence, immediately after sample preparation different life times are measured depending
on the order of reactant addition, whereas after 20 d conditioning the values are quite
close, irrespective the order of reactant addition, indicating the equilibrium to be reached.
6.2 Complexation of Al and actinide(III)/(IV)/(VI) with silicic and humic acid:
comparison
A similar parameter screening experiment as described in section 6.1.1 for Am, is
conducted in order to investigate formation of colloid-borne-Th (U) in presence of silicic
and humic acid. Trace amounts of 5x10⁻⁸ M Th and 8x10⁻⁷ M U are introduced in the sam-
1.6 1.4 1.2 1.0 0.8
0.6 0.4
0.2
0
1.6 1.4 1.2 1.0 0.8
0.6
0.4
0.2
0 580 600 620 580 600 620
606.9 605.2
604.3 603.8
605.5
603.7
604.3 604.1
Wavelength (nm)
Rel
ativ
e In
tens
ity
R=0.23
R=0.62R=0.70
R=0.59
Cm-HAS + HA, pH 8.5
Cm + Al/HA/Si, pH 8.5
20 days
20 days
114
Competitive interaction of actinide(III, IV, VI) with aluminosilicate and humate colloids
ples. Fig. 6.6 gives an overview of the colloid formation for actinides interacting with the
different colloid types: HAS colloids (left side of each diagram), composite of HAS and
humic colloids generated in solutions containing silicic acid, Al and HA (right side, the
upper and middle contours) and humic colloids complexed with Al (right side, the lowest
contours). Reference samples, containing only the actinide are also indicated (left side,
lowest contours). The contours show the actinide incorporation into the colloidal phase
separated by ultrafiltration.
From the contour profiles for formation of HAS-colloid borne actinides (left parts
of Fig. 6.6) one can observe that Th and U colloidal fractions are abundant for the entire
pH range in presence of polysilicic acid. As outlined in section 4.3, as compared with Am,
Th and U have been shown to have higher affinity towards polysilicic acid. However,
even in this case, Al concentration of 10-3 M destabilizes the HAS colloids and the acti-
nides precipitate. In HAS solutions formed from monosilicic acid the actinde fraction in
the colloids is generally poor, except for Am and Th at pH 7.8. In presence of humic acid,
as illustrated by the contours on the right side of the diagram, one can observe an en-
hanced activity fraction in the colloidal phase. As previously discussed for Am, addition
of HA converts the precipitated An-HAS to colloids. The formation of colloid-borne acti-
nides becomes promoted for the entire pH range and Al concentration range.
In presence of humic colloids and Al but without silicic acid (the contours at the
bottom of the right side diagram), formation of colloid-borne actinides is favored except
for Al concentration exceeding the proton exchange capacity of HA. These conditions oc-
cur for 10-4-10-3 M Al, for which the An/Al-humate complexes precipitate.
At addition of silicic acid we observe the incorporation patterns change (from the
lowest part contours to those at the top and middle part of the diagram). Hence, formation
of colloid-borne actinides is enhanced under all conditions mentioned above causing ini-
tial precipitation of actinides. Only in case of U, the presence of both HAS-monosilicic
acid (10-3 M Si/ 10-5 M Al) and humic colloids appears to be less favorable for colloids
formation as compared to the reaction with humate colloids. As discussed in the previous
section (Fig. 5.4), in absence of HAS, U complexation with humic colloids is favorable at
these HA and Al concentration. The presence of monosilicic acid, which does not favor
formation of colloid-borne U, leads to a decrease of the fraction of colloid-borne U. How-
ever, as in case of Am, the results for Th and U show that the simultaneous presence of
both HAS and HA enhances generally the actinide colloid fractions. As discussed in the
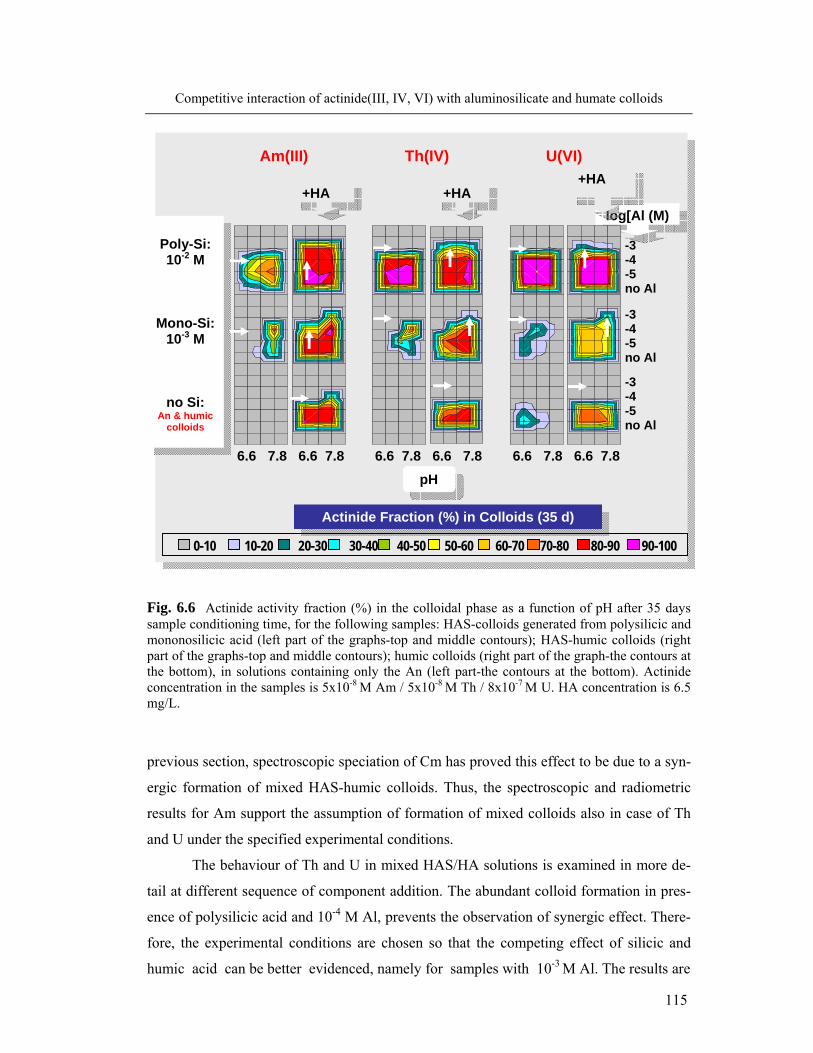
115
Competitive interaction of actinide(III, IV, VI) with aluminosilicate and humate colloids
Fig. 6.6 Actinide activity fraction (%) in the colloidal phase as a function of pH after 35 days sample conditioning time, for the following samples: HAS-colloids generated from polysilicic and mononosilicic acid (left part of the graphs-top and middle contours); HAS-humic colloids (right part of the graphs-top and middle contours); humic colloids (right part of the graph-the contours at the bottom), in solutions containing only the An (left part-the contours at the bottom). Actinide concentration in the samples is 5x10⁻⁸ M Am / 5x10⁻⁸ M Th / 8x10⁻⁷ M U. HA concentration is 6.5 mg/L.
previous section, spectroscopic speciation of Cm has proved this effect to be due to a syn-
ergic formation of mixed HAS-humic colloids. Thus, the spectroscopic and radiometric
results for Am support the assumption of formation of mixed colloids also in case of Th
and U under the specified experimental conditions.
The behaviour of Th and U in mixed HAS/HA solutions is examined in more de-
tail at different sequence of component addition. The abundant colloid formation in pres-
ence of polysilicic acid and 10-4 M Al, prevents the observation of synergic effect. There-
fore, the experimental conditions are chosen so that the competing effect of silicic and
humic acid can be better evidenced, namely for samples with 10-3 M Al. The results are
log[Al (M)
-3 -4 -5 no Al
-3 -4 -5 no Al
-3 -4 -5
no Al
Actinide Fraction (%) in Colloids (35 d)
pH 6.6 7.8 6.6 7.8
0-10 10-20 20-30 30-40 40-50 50-60 60-70 70-80 80-90 90-100
Poly-Si: 10-2 M
Mono-Si: 10-3 M
no Si: An & humic
colloids
6.6 7.8 6.6 7.8 6.6 7.8 6.6 7.8
Am(III) Th(IV) U(VI)
+HA +HA
+HA
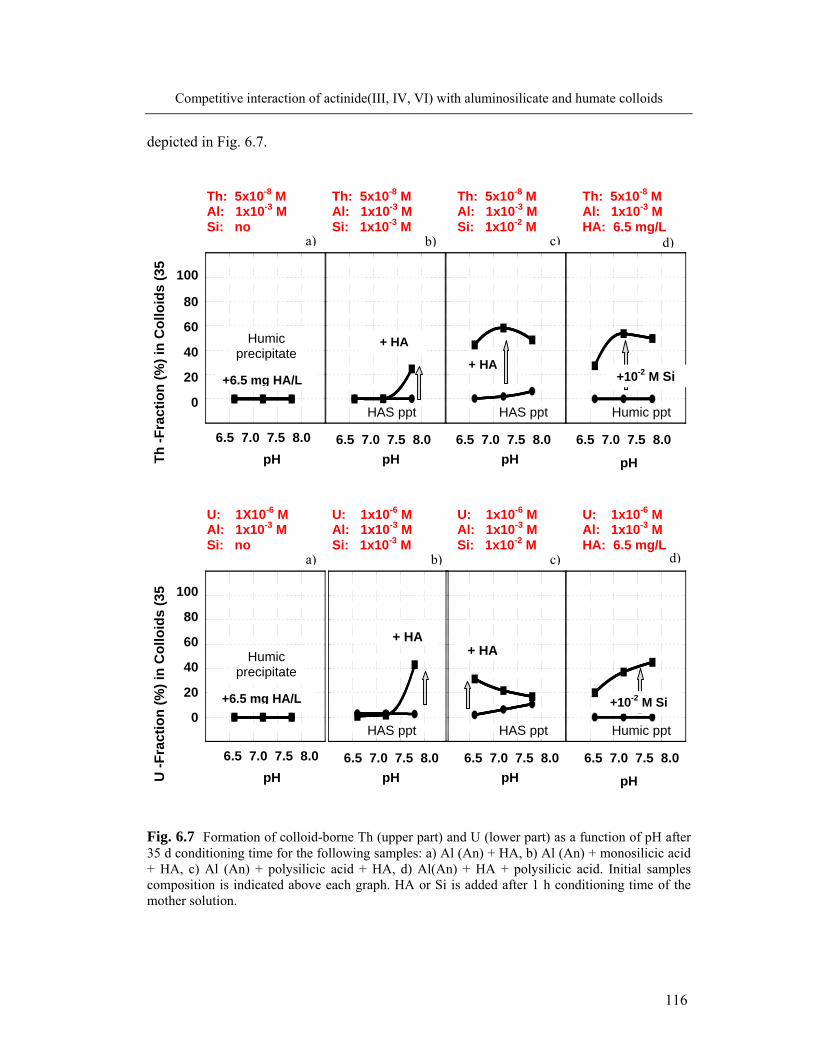
116
Competitive interaction of actinide(III, IV, VI) with aluminosilicate and humate colloids
depicted in Fig. 6.7.
Fig. 6.7 Formation of colloid-borne Th (upper part) and U (lower part) as a function of pH after 35 d conditioning time for the following samples: a) Al (An) + HA, b) Al (An) + monosilicic acid + HA, c) Al (An) + polysilicic acid + HA, d) Al(An) + HA + polysilicic acid. Initial samples composition is indicated above each graph. HA or Si is added after 1 h conditioning time of the mother solution.
HAS ppt
HAS ppt Humic ppt HAS ppt
100
80
60
40
20
0 6.5 7.0 7.5 8.0 6.5 7.0 7.5 8.0 6.5 7.0 7.5 8.0 6.5 7.0 7.5 8.0
pH pH pH pH Th -F
ract
ion
(%) i
n C
ollo
ids
(35
Th: 5x10⁻⁸ M Al: 1x10⁻³ M Si: 1x10⁻³ M
Th: 5x10⁻⁸ M Al: 1x10⁻³ M Si: 1x10⁻² M
Th: 5x10⁻⁸ M Al: 1x10⁻³ M HA: 6.5 mg/L
Th: 5x10⁻⁸ M Al: 1x10⁻³ M Si: no
+ HA
a)
+6.5 mg HA/L
b) c) d)
Humic precipitate
+ HA+10-2 M Si
100
80
60
40
20
0
Humic ppt HAS ppt
6.5 7.0 7.5 8.0 6.5 7.0 7.5 8.0 6.5 7.0 7.5 8.0 6.5 7.0 7.5 8.0 pH pH pH pH U
-Fra
ctio
n (%
) in
Col
loid
s (3
5
U: 1x10⁻⁶ M Al: 1x10⁻³ M Si: 1x10⁻³ M
U: 1x10⁻⁶ M Al: 1x10⁻³ M Si: 1x10⁻² M
U: 1x10⁻⁶ M Al: 1x10⁻³ M HA: 6.5 mg/L
U: 1X10⁻⁶ M Al: 1x10⁻³ M Si: no
+ HA
a)
+6.5 mg HA/L
b) c) d)
Humic precipitate
+ HA
+10-2 M Si
117
Competitive interaction of actinide(III, IV, VI) with aluminosilicate and humate colloids
In the blank samples containing Al/Th (U) (Fig. 6.7 a) the actinides are in the pre-
cipitate phase and after addition of HA the actinides remain as humate precipitate. As dis-
cussed in section 5.2.2 (Fig. 5.5), the offered HA concentration of 6.5 mg/L is much be-
low the required one for the formation of Al/Th(U)-humate colloids at the present Al con-
centration.
In HAS solutions prepared out of monosilicic acid (Fig. 6.7 b) Th(U)-HAS are
precipitated. After addition of HA, the conversion of the precipitate to colloid-borne acti-
nide species can be observed for both Th and U at pH 7.8. In HAS solutions prepared
from polysilicic acid (Fig. 6.7 c), minor fractions of colloids form only at pH 7.8. HA ad-
dition enhances significantly the fraction of colloid-borne Th in the entire pH range. In
case of U, the HA effect is pronounced only at pH 6.6. The results indicate the synergic
action of HAS and HA at binding the actinide.
Fig. 6.7 d illustrates the results obtained for the experimental solutions having the
same final composition as those described in 6.7 c but prepared by reverse sequence of
reactant addition. The initial precipitated Al/Th(U)-humate are partially converted to col-
loids by addition of polysilcic acid. At this point a different behaviour of Th and U can be
distinguished. In case of Th, as can be seen from the upper graphs of the Fig. 6.7 c and d,
the increase of the colloid-borne Th fraction appears to be generally the same irrespective
the sequence of reactant addition. In contrast, in case of U, the order of reactant addition
appears to affect the formation of colloids at pH 7.2 and 7.8. Under these conditions, the
fraction of colloid-borne U is larger at addition of polysilicic acid to the humic precipitate.
This indicates that for U the equilibrium of the colloid formation is not attained within the
35 d observation time. The reason might be a slow kinetics associated to the conversion of
the precipitate to the colloids.
However, in all other cases the process of actinide colloid formation appears no to
be affected by the order of reactant addition and supports the hypothesis of formation of
mixed HAS-humic colloid species under the present experimental conditions.
Consequently, the formation of mixed HAS-humic-colloidal Th(U), further sup-
ports the results of section 5.2.2 suggesting the formation under the selected experimental
conditions of partially hydrolyzed Th(U) species, interacting with both HAS and HA.

118
Competitive interaction of actinide(III, IV, VI) with aluminosilicate and humate colloids
6.3 Colloid stability and average particle size
The mixed HAS-humic colloids have been analyzed by LIBD [136] for monitor-
ing their average size and number density as a function of time. HAS colloids are gener-
ated with or without addition of Eu in a solution containing 1x10⁻⁴ M Al, 1x10⁻² M Si and
8 mg/L HA at pH 8.5, following the conditions applied for generating composite colloids
as proved by TRLFS. The average size of the predominant colloids is found to be of ap-
proximately 20 nm immediately after generation, either with or without Eu. After 10 days
colloids become dispersed somewhat as the average size decreased slightly to about 10
nm which remains nearly consistent up to 58 days. According to these results, trivalent
actinides incorporated into such composed colloids are expected to remain stable in aqui-
fer system.
6.4 Conclusions
The simultaneous presence of HA and HAS is found to enlarge the region of col-
loids stability. The observed fact can be ascribed to different and complementary mecha-
nisms of HAS and HA for binding the An. The type of the colloid-borne An species
which forms is determined by the An hydrolysis behaviour. Accordingly, An can be in-
corporated into HAS colloids of aluminosilicate composition via co-nucleation of hydro-
lyzed species (Al, An and Si) or bound to humic colloids made of humic acid via com-
plexation with the ionic species metal/An. Eventually, partially-hydrolyzed metal(An) ion
species can be simultaneously bound to HAS-humic colloids through synergic bond cou-
pling with humic molecules and HAS colloids. Nevertheless the equilibrium between the
non-hydrolyzed ionic and hydrolyzed actinide species, determining which kind of colloid-
borne species forms is finally governed by the specific conditions, i.e. the oxidation state
of the An and its concentration together with the environmental characteristics (e.g. pH).
The synergic colloid effect is mostly pronounced if the conditions of pH, concentration of
Al, An and humic acid are such that Al is fully hydrolyzed, whereas the An becomes par-
tially hydrolyzed, thus conucleating with Si and Al (HAS colloids) on the one side and
complexing with humic colloids on the other side. A schematic illustration for the pro-
posed behaviour of An at the interaction with HAS and humic colloids is shown in Fig.
6.8.
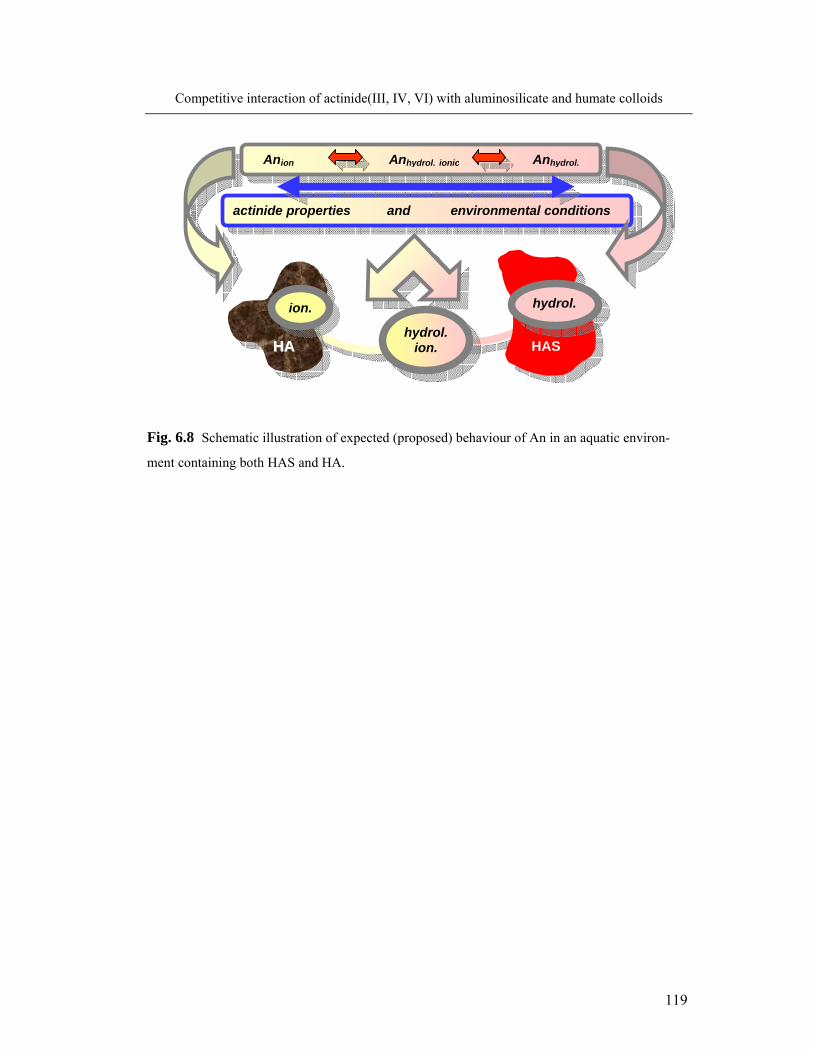
119
Competitive interaction of actinide(III, IV, VI) with aluminosilicate and humate colloids
Fig. 6.8 Schematic illustration of expected (proposed) behaviour of An in an aquatic environ-
ment containing both HAS and HA.
hydrol. ion.
HHAA
ion.
HAS
hydrol.
actinide properties and environmental conditions
Anion Anhydrol. ionic Anhydrol.
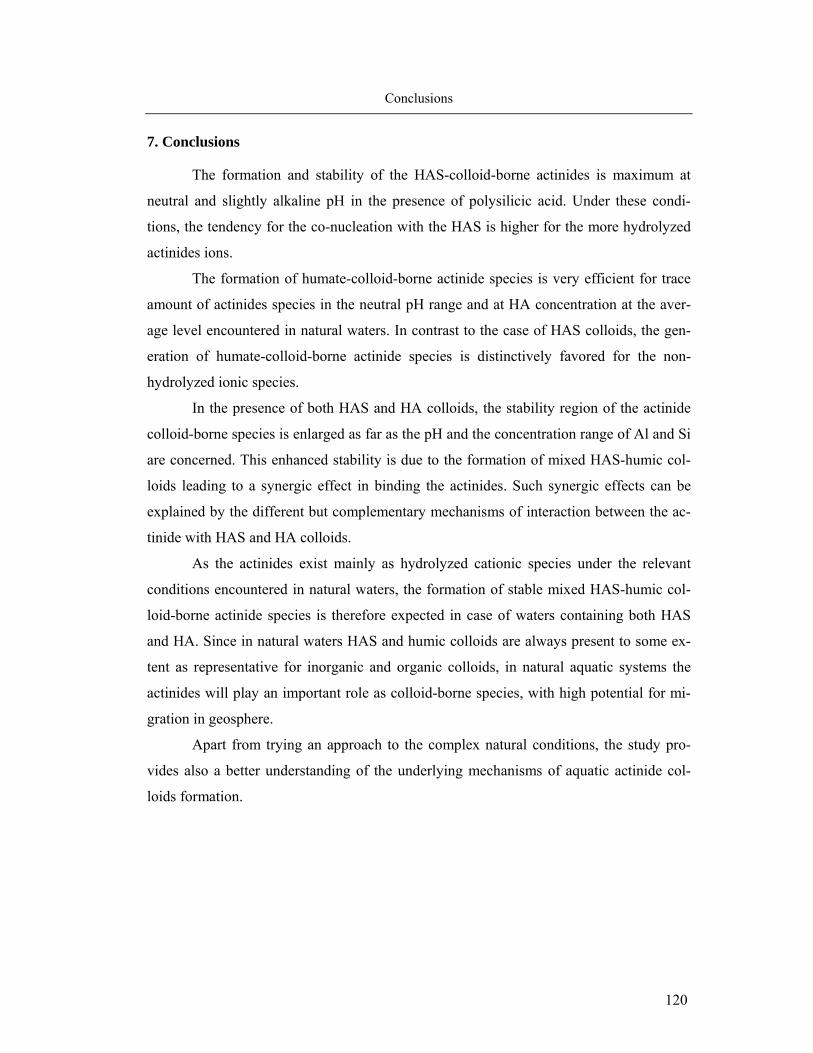
120
Conclusions
7. Conclusions
The formation and stability of the HAS-colloid-borne actinides is maximum at
neutral and slightly alkaline pH in the presence of polysilicic acid. Under these condi-
tions, the tendency for the co-nucleation with the HAS is higher for the more hydrolyzed
actinides ions.
The formation of humate-colloid-borne actinide species is very efficient for trace
amount of actinides species in the neutral pH range and at HA concentration at the aver-
age level encountered in natural waters. In contrast to the case of HAS colloids, the gen-
eration of humate-colloid-borne actinide species is distinctively favored for the non-
hydrolyzed ionic species.
In the presence of both HAS and HA colloids, the stability region of the actinide
colloid-borne species is enlarged as far as the pH and the concentration range of Al and Si
are concerned. This enhanced stability is due to the formation of mixed HAS-humic col-
loids leading to a synergic effect in binding the actinides. Such synergic effects can be
explained by the different but complementary mechanisms of interaction between the ac-
tinide with HAS and HA colloids.
As the actinides exist mainly as hydrolyzed cationic species under the relevant
conditions encountered in natural waters, the formation of stable mixed HAS-humic col-
loid-borne actinide species is therefore expected in case of waters containing both HAS
and HA. Since in natural waters HAS and humic colloids are always present to some ex-
tent as representative for inorganic and organic colloids, in natural aquatic systems the
actinides will play an important role as colloid-borne species, with high potential for mi-
gration in geosphere.
Apart from trying an approach to the complex natural conditions, the study pro-
vides also a better understanding of the underlying mechanisms of aquatic actinide col-
loids formation.
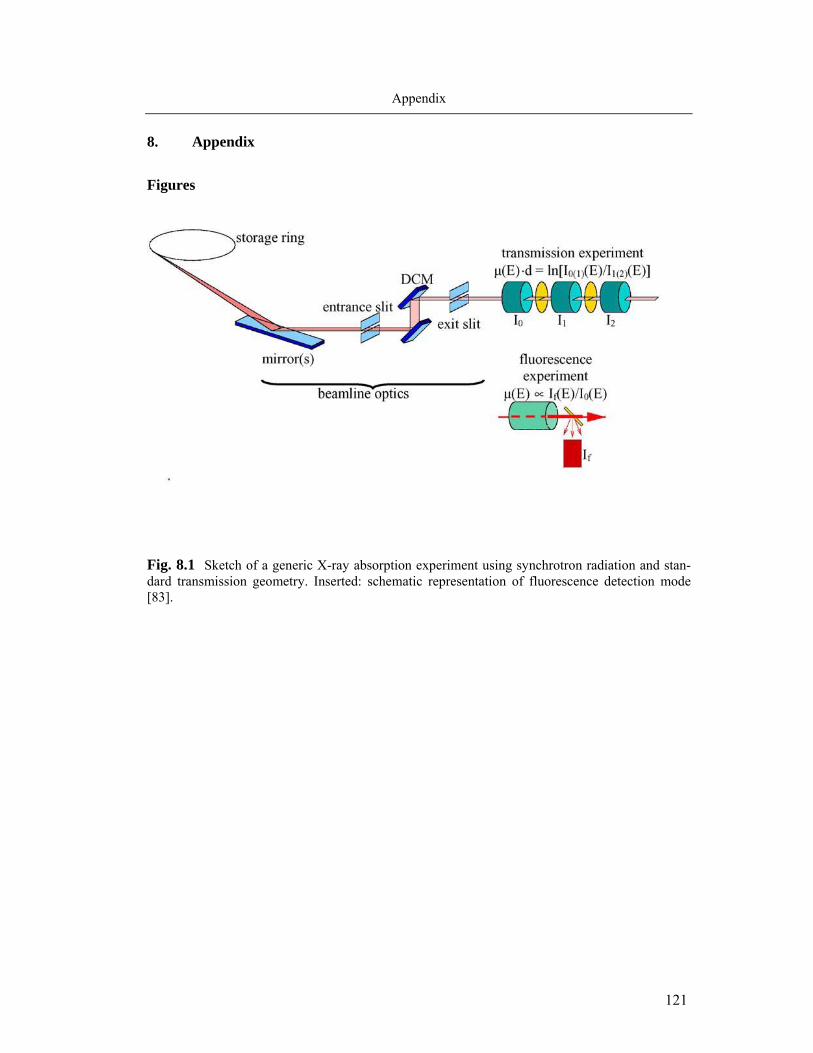
121
Appendix
8. Appendix
Figures
Fig. 8.1 Sketch of a generic X-ray absorption experiment using synchrotron radiation and stan-dard transmission geometry. Inserted: schematic representation of fluorescence detection mode [83].
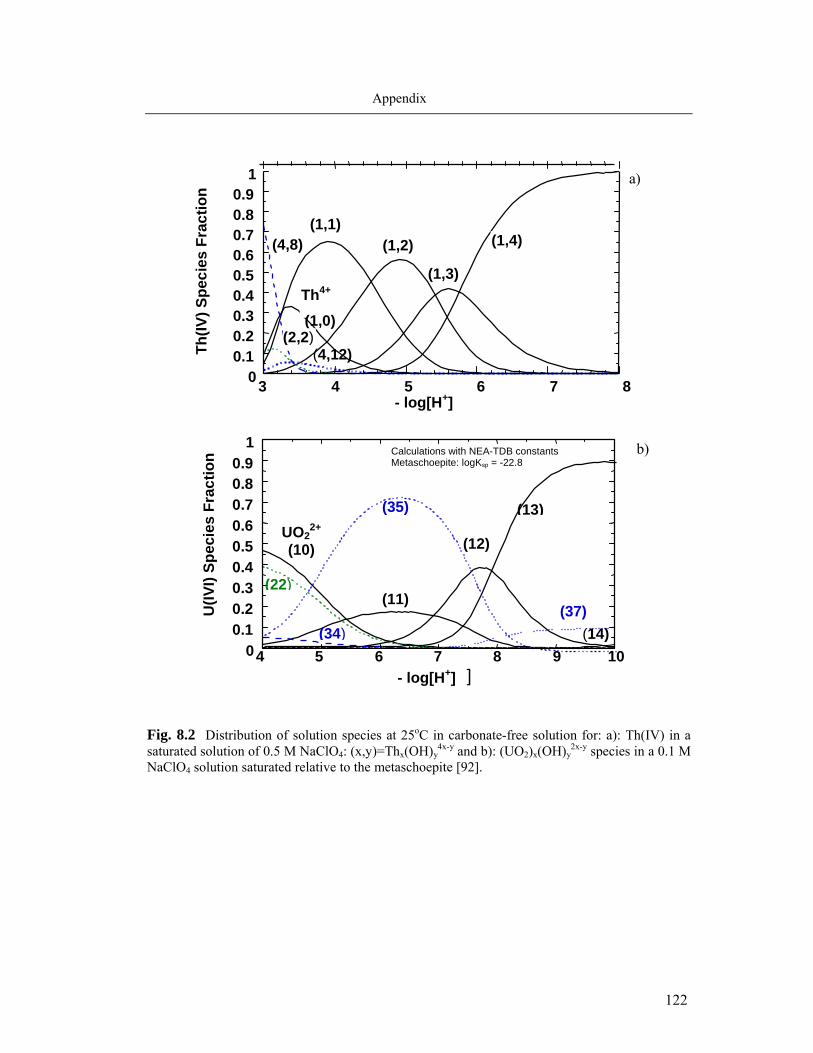
122
Appendix
Fig. 8.2 Distribution of solution species at 25oC in carbonate-free solution for: a): Th(IV) in a saturated solution of 0.5 M NaClO4: (x,y)=Thx(OH)y
4x-y and b): (UO2)x(OH)y2x-y species in a 0.1 M
NaClO4 solution saturated relative to the metaschoepite [92].
UO22+
(10)
U(IV
I) Sp
ecie
s Fr
actio
n
- log[H+]
0 0.1 0.2 0.3 0.4 0.5 0.6 0.7 0.8 0.9
1
4 5 6 7 8 9 10]
(22)
(35)
(11)
(12)
(37)
(13)
(14) (34)
Calculations with NEA-TDB constants Metaschoepite: logKsp = -22.8
0 0.1 0.2 0.3 0.4 0.5 0.6 0.7 0.8 0.9
1
3 4 5 6 7 8
Th(IV
) Spe
cies
Fra
ctio
n (1,1)
(4,8)
Th4+
(1,0)(2,2)
(4,12)
(1,2)
(1,3)
(1,4)
- log[H+]
a)
b)
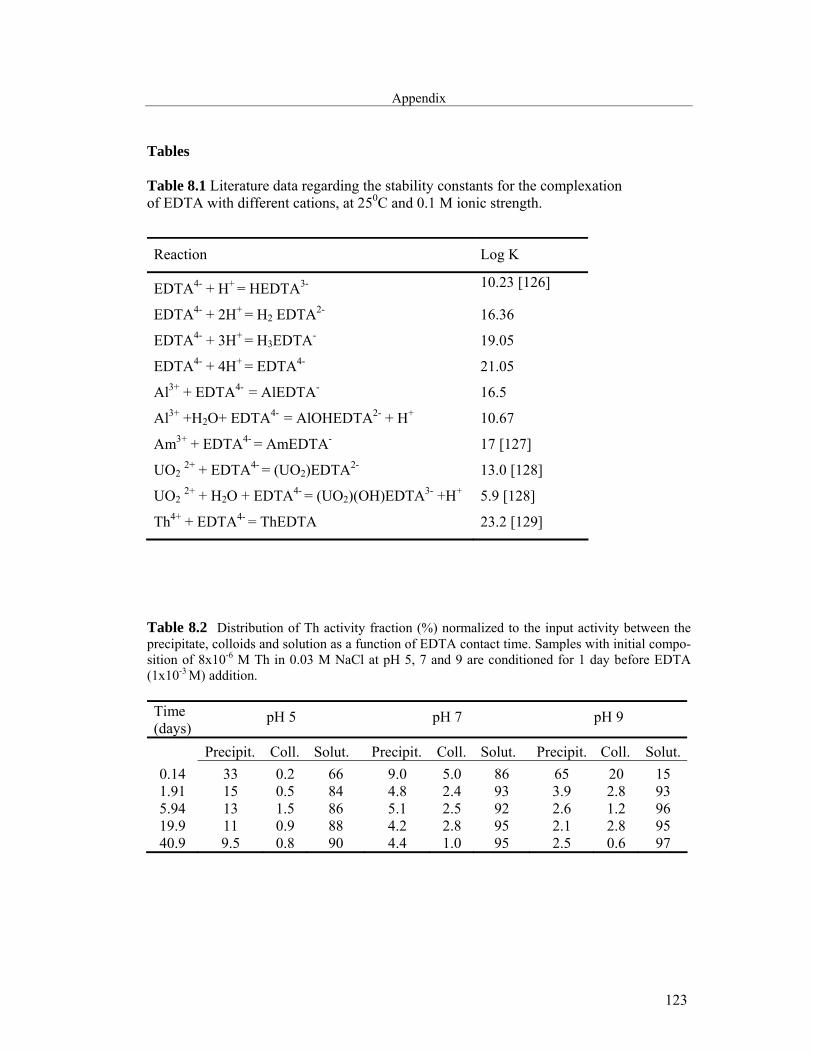
123
Appendix Tables Table 8.1 Literature data regarding the stability constants for the complexation of EDTA with different cations, at 250C and 0.1 M ionic strength.
Reaction
Log K
EDTA4- + H+ = HEDTA3- 10.23 [126]
EDTA4- + 2H+ = H2 EDTA2- 16.36
EDTA4- + 3H+ = H3EDTA- 19.05
EDTA4- + 4H+ = EDTA4- 21.05
Al3+ + EDTA4- = AlEDTA- 16.5
Al3+ +H2O+ EDTA4- = AlOHEDTA2- + H+ 10.67
Am3+ + EDTA4- = AmEDTA- 17 [127]
UO2 2+ + EDTA4- = (UO2)EDTA2- 13.0 [128]
UO2 2+ + H2O + EDTA4- = (UO2)(OH)EDTA3- +H+ 5.9 [128]
Th4+ + EDTA4- = ThEDTA 23.2 [129]
Table 8.2 Distribution of Th activity fraction (%) normalized to the input activity between the precipitate, colloids and solution as a function of EDTA contact time. Samples with initial compo-sition of 8x10⁻⁶ M Th in 0.03 M NaCl at pH 5, 7 and 9 are conditioned for 1 day before EDTA (1x10⁻³ M) addition. Time (days)
pH 5
pH 7
pH 9
Precipit.
Coll.
Solut.
Precipit.
Coll.
Solut.
Precipit.
Coll.
Solut.
0.14
33
0.2
66
9.0
5.0
86
65
20
15 1.91 15 0.5 84 4.8 2.4 93 3.9 2.8 93 5.94 13 1.5 86 5.1 2.5 92 2.6 1.2 96 19.9 11 0.9 88 4.2 2.8 95 2.1 2.8 95 40.9 9.5 0.8 90 4.4 1.0 95 2.5 0.6 97
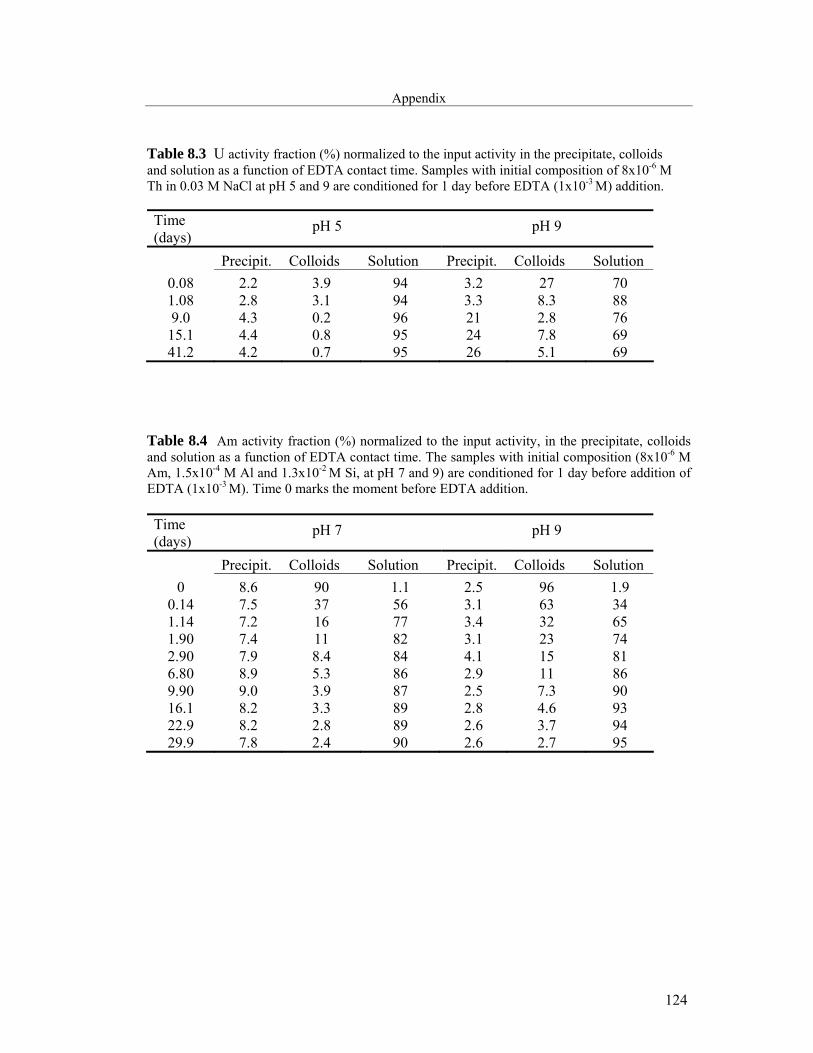
124
Appendix Table 8.3 U activity fraction (%) normalized to the input activity in the precipitate, colloids and solution as a function of EDTA contact time. Samples with initial composition of 8x10⁻⁶ M Th in 0.03 M NaCl at pH 5 and 9 are conditioned for 1 day before EDTA (1x10⁻³ M) addition. Time (days)
pH 5
pH 9
Precipit.
Colloids
Solution
Precipit.
Colloids
Solution
0.08
2.2
3.9
94
3.2
27
70 1.08 2.8 3.1 94 3.3 8.3 88 9.0 4.3 0.2 96 21 2.8 76 15.1 4.4 0.8 95 24 7.8 69 41.2 4.2 0.7 95 26 5.1 69
Table 8.4 Am activity fraction (%) normalized to the input activity, in the precipitate, colloids and solution as a function of EDTA contact time. The samples with initial composition (8x10⁻⁶ M Am, 1.5x10⁻⁴ M Al and 1.3x10⁻² M Si, at pH 7 and 9) are conditioned for 1 day before addition of EDTA (1x10⁻³ M). Time 0 marks the moment before EDTA addition. Time (days)
pH 7
pH 9
Precipit.
Colloids
Solution
Precipit.
Colloids
Solution
0
8.6
90
1.1
2.5
96
1.9 0.14 7.5 37 56 3.1 63 34 1.14 7.2 16 77 3.4 32 65 1.90 7.4 11 82 3.1 23 74 2.90 7.9 8.4 84 4.1 15 81 6.80 8.9 5.3 86 2.9 11 86 9.90 9.0 3.9 87 2.5 7.3 90 16.1 8.2 3.3 89 2.8 4.6 93 22.9 8.2 2.8 89 2.6 3.7 94 29.9 7.8 2.4 90 2.6 2.7 95
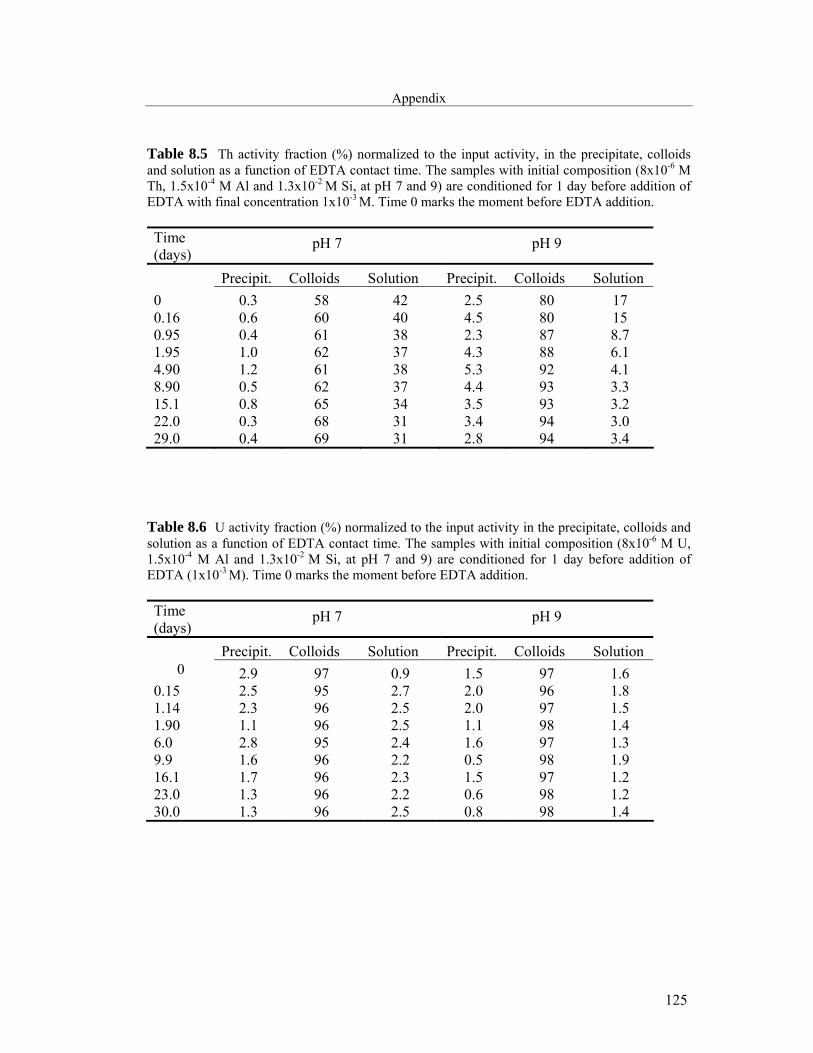
125
Appendix
Table 8.5 Th activity fraction (%) normalized to the input activity, in the precipitate, colloids and solution as a function of EDTA contact time. The samples with initial composition (8x10⁻⁶ M Th, 1.5x10⁻⁴ M Al and 1.3x10⁻² M Si, at pH 7 and 9) are conditioned for 1 day before addition of EDTA with final concentration 1x10⁻³ M. Time 0 marks the moment before EDTA addition.
Time (days)
pH 7
pH 9
Precipit.
Colloids
Solution
Precipit.
Colloids
Solution
0
0.3
58
42
2.5
80
17 0.16 0.6 60 40 4.5 80 15 0.95 0.4 61 38 2.3 87 8.7 1.95 1.0 62 37 4.3 88 6.1 4.90 1.2 61 38 5.3 92 4.1 8.90 0.5 62 37 4.4 93 3.3 15.1 0.8 65 34 3.5 93 3.2 22.0 0.3 68 31 3.4 94 3.0 29.0 0.4 69 31 2.8 94 3.4
Table 8.6 U activity fraction (%) normalized to the input activity in the precipitate, colloids and solution as a function of EDTA contact time. The samples with initial composition (8x10⁻⁶ M U, 1.5x10⁻⁴ M Al and 1.3x10⁻² M Si, at pH 7 and 9) are conditioned for 1 day before addition of EDTA (1x10⁻³ M). Time 0 marks the moment before EDTA addition.
Time (days)
pH 7
pH 9
Precipit.
Colloids
Solution
Precipit.
Colloids
Solution 0
2.9
97
0.9
1.5
97
1.6 0.15 2.5 95 2.7 2.0 96 1.8 1.14 2.3 96 2.5 2.0 97 1.5 1.90 1.1 96 2.5 1.1 98 1.4 6.0 2.8 95 2.4 1.6 97 1.3 9.9 1.6 96 2.2 0.5 98 1.9 16.1 1.7 96 2.3 1.5 97 1.2 23.0 1.3 96 2.2 0.6 98 1.2 30.0 1.3 96 2.5 0.8 98 1.4
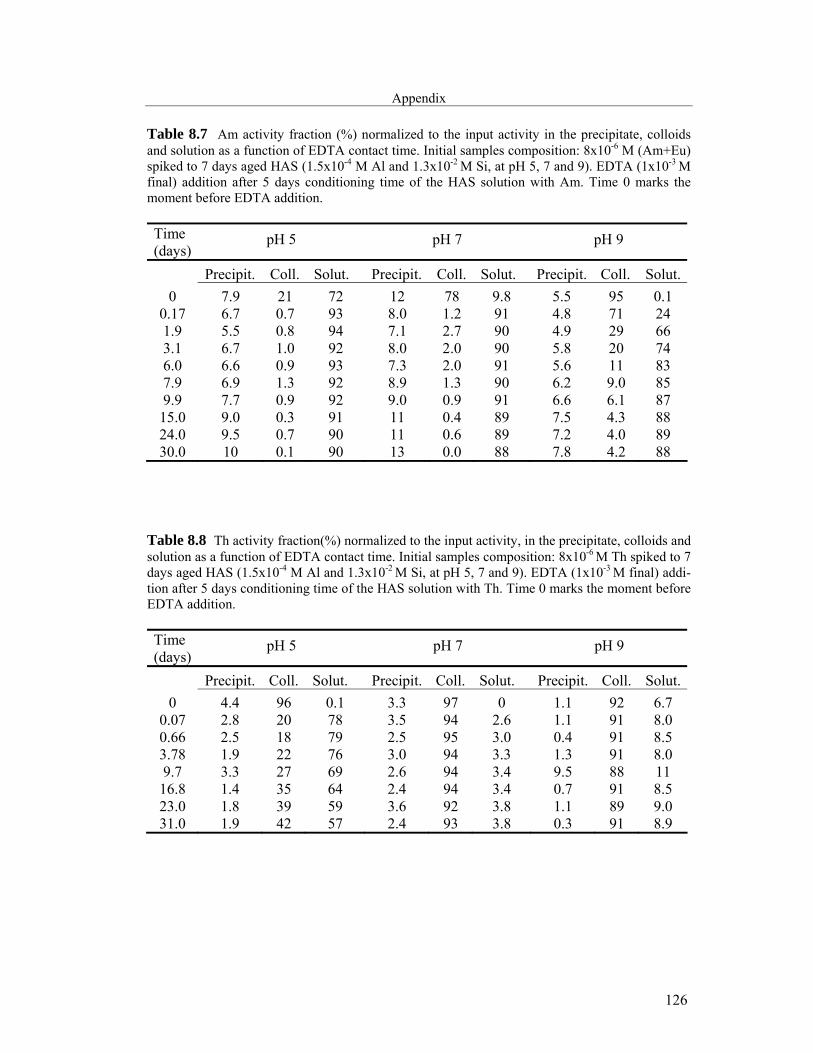
126
Appendix Table 8.7 Am activity fraction (%) normalized to the input activity in the precipitate, colloids and solution as a function of EDTA contact time. Initial samples composition: 8x10⁻⁶ M (Am+Eu) spiked to 7 days aged HAS (1.5x10⁻⁴ M Al and 1.3x10⁻² M Si, at pH 5, 7 and 9). EDTA (1x10⁻³ M final) addition after 5 days conditioning time of the HAS solution with Am. Time 0 marks the moment before EDTA addition. Time (days)
pH 5
pH 7
pH 9
Precipit.
Coll.
Solut.
Precipit.
Coll.
Solut.
Precipit.
Coll.
Solut.
0
7.9
21
72
12
78
9.8
5.5
95
0.1 0.17 6.7 0.7 93 8.0 1.2 91 4.8 71 24 1.9 5.5 0.8 94 7.1 2.7 90 4.9 29 66 3.1 6.7 1.0 92 8.0 2.0 90 5.8 20 74 6.0 6.6 0.9 93 7.3 2.0 91 5.6 11 83 7.9 6.9 1.3 92 8.9 1.3 90 6.2 9.0 85 9.9 7.7 0.9 92 9.0 0.9 91 6.6 6.1 87 15.0 9.0 0.3 91 11 0.4 89 7.5 4.3 88 24.0 9.5 0.7 90 11 0.6 89 7.2 4.0 89 30.0 10 0.1 90 13 0.0 88 7.8 4.2 88
Table 8.8 Th activity fraction(%) normalized to the input activity, in the precipitate, colloids and solution as a function of EDTA contact time. Initial samples composition: 8x10⁻⁶ M Th spiked to 7 days aged HAS (1.5x10⁻⁴ M Al and 1.3x10⁻² M Si, at pH 5, 7 and 9). EDTA (1x10⁻³ M final) addi-tion after 5 days conditioning time of the HAS solution with Th. Time 0 marks the moment before EDTA addition. Time (days)
pH 5
pH 7
pH 9
Precipit.
Coll.
Solut.
Precipit.
Coll.
Solut.
Precipit.
Coll.
Solut.
0
4.4
96
0.1
3.3
97
0
1.1
92
6.7 0.07 2.8 20 78 3.5 94 2.6 1.1 91 8.0 0.66 2.5 18 79 2.5 95 3.0 0.4 91 8.5 3.78 1.9 22 76 3.0 94 3.3 1.3 91 8.0 9.7 3.3 27 69 2.6 94 3.4 9.5 88 11 16.8 1.4 35 64 2.4 94 3.4 0.7 91 8.5 23.0 1.8 39 59 3.6 92 3.8 1.1 89 9.0 31.0 1.9 42 57 2.4 93 3.8 0.3 91 8.9
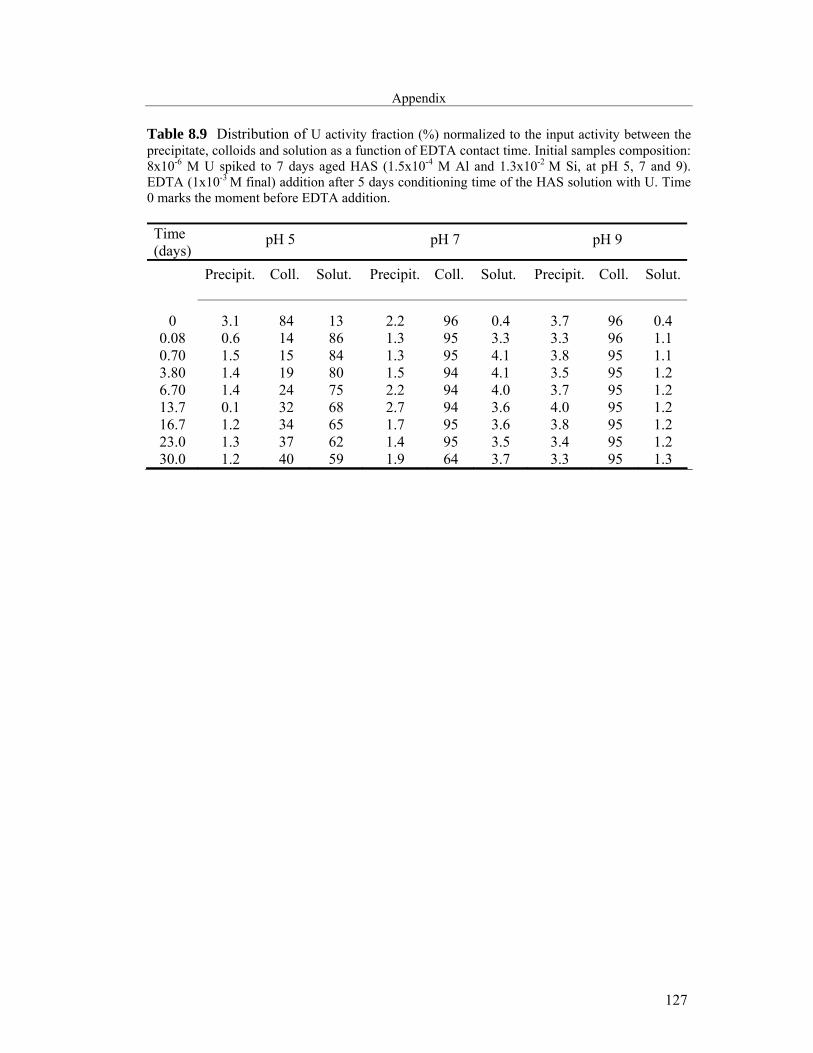
127
Appendix Table 8.9 Distribution of U activity fraction (%) normalized to the input activity between the precipitate, colloids and solution as a function of EDTA contact time. Initial samples composition: 8x10⁻⁶ M U spiked to 7 days aged HAS (1.5x10⁻⁴ M Al and 1.3x10⁻² M Si, at pH 5, 7 and 9). EDTA (1x10⁻³ M final) addition after 5 days conditioning time of the HAS solution with U. Time 0 marks the moment before EDTA addition. Time (days)
pH 5
pH 7
pH 9
Precipit.
Coll.
Solut.
Precipit.
Coll.
Solut.
Precipit.
Coll.
Solut.
0
3.1
84
13
2.2
96
0.4
3.7
96
0.4
0.08 0.6 14 86 1.3 95 3.3 3.3 96 1.1 0.70 1.5 15 84 1.3 95 4.1 3.8 95 1.1 3.80 1.4 19 80 1.5 94 4.1 3.5 95 1.2 6.70 1.4 24 75 2.2 94 4.0 3.7 95 1.2 13.7 0.1 32 68 2.7 94 3.6 4.0 95 1.2 16.7 1.2 34 65 1.7 95 3.6 3.8 95 1.2 23.0 1.3 37 62 1.4 95 3.5 3.4 95 1.2 30.0 1.2 40 59 1.9 64 3.7 3.3 95 1.3
128
Appendix
Nomenclature AFM Atomic Force Microscopy
An Actinide
Da Dalton
DLVO theory Derjaguin-Landau-Verwey-Overback theory
d day
E photon energy
E0 ionization energy
EDTA Ethylenediamine tetraacetic acid
EDX Energy dispersive X-ray
Eh Redox potential
EXAFS Extended X-ray absorption fine structure
FT Fourier transform
g gravitational accelaration
h hour
HA Humic acid
HAS Hydroxyaluminosilicate
HS Humic substances
I0, I Intensity of incident and transmitted light
IEP Isoelectric point
IIIF Institut für Interdisziplinäre Isotopen Forschung
INE Institut für Nukleare Entsorgung
k photoelectron wave number
LC Loading capacity
LIBD Laser Induced Breakdown Detection
129
Appendix
LSC Liquid Scintillation Counting
MOPS 3-[N-morpholino] propanesulfonic acid
MS multiple scattering
Nd:YAG-Laser Solid corp laser with Nd-dotted Ytrium-Aluminium-Granat Wirt-
skristall (Y3Al5O12)
N coordination number
PEC proton exchange capacity
ppb parts per billion (10-9g/g)
ppm parts per million (10-6g/g)
ppt parts per trillion (10-12 g/g)
pHpzc pH value (-log[H+]) at zero surface charge
PCS photon correlation spectroscopy
R interatomic distance
S supersaturation
SEM scanning electron microscopy
SPC single particle counting
SS single scattering
TEM transmitted electron microscopy
TRLFS time resolved laser fluorescence spectroscopy
UV-VIS Ultraviolet-Visible domain of light
V molecular volume
XANES X-ray absorbtion near edge structure
z ionic charge
y year
130
Appendix
Greek symbols
Å Ångstrøm; 1 Å = 10-10 m
λ wavelength
λ(k) photoelectron mean free path
µ absorption coefficient
µ0 absorption coefficient of an isolated atom
σ2 mean square average displacement (Debye-Waller factor)
χ(k) EXAFS function
Φ(k, R) total phase shift
131
Figures captions
9. Figures captions: Fig. 2.1 Formation of colloids through condensation or dispersion. Fig. 2.2 Free energy of nucleus. Fig. 2.3 Electrical double layer at the solid-liquid interface Fig. 2.4 Potential energy of particle-particle interaction. Fig. 2.5 Structure of the imogolite-type hydroxyaluminosilicate (HAS). Fig. 2.6 Thermodynamic solubilities of several aluminosilicates, SiO2(am) and Al(OH)3(am). Fig. 2.7 Structure of humic acid macromolecule interacting with aluminosilicate min-
erals. Fig. 2.8 Humic acid labelling scheme. Fig. 2.9 Known actinides oxidation states. Fig. 2.10 Solid-water interaction of metal species (actinides) in natural aquifer. Fig. 2.11 TRLFS: Direct and indirect excitation of Cm. Fig. 2.12 XAS: XANES and EXAFS region of the absorption spectra. Fig. 3.1 Schematic illustration of the approach for preparation of Si solutions and of HAS. Fig. 3.2 Principal decay chain of 238U. Fig. 3.3 LSC spectra of the radionuclides used in the experiments.
Fig. 4.1 Distribution of actinide activity fraction between solution, colloids and precipi-tate phase as a function of actinide concentration and pH for samples containing only ac-tinides. Fig. 4.2 Overview contour diagram of the colloid-borne activity fraction for Am, Th, Np and U in the parameter screening experiment. Fig. 4.3 Distribution of Eu(III), Th(IV) and U(VI) solution species as a function of pH. Fig. 4.4 Distribution of Np(V) solution species as a function of pH. Fig. 4.5 Am/Th/U activity fraction as a function of time in HAS colloids generated from monosilicic and polysilicic acid at different pH.
132
Figures captions
Fig. 4.6 Polymerization kinetics of monosilicic acid. Fig. 4.7 Actinide activity fraction in the colloidal phase as a function of actinide con-centration at different pH for different samples: blank, HAS- monosilicic acid colloids and HAS-polysilicic acid colloids. Fig. 4.8 a): Am activity fraction in the colloidal phase in HAS or blank samples; b):Cm(III) species distribution in HAS-polysilicic acid solution by TRLFS. Fig. 4.9 Illustration of colloid-borne Cm species forming in HAS solutions depending on the experimental conditions. Fig. 4.10 Th LIII edge k3-weighted EXAFS spectra and the corresponding FTs for Th in: a) and b) aluminosilicate solution and c) in silicate solution Fig. 4.11 Th LIII edge k3-weighted EXAFS spectra and the corresponding FT for Th pre-cipitated with Al(OH)3. Fig. 4.12 Np LIII edge k3-weighted EXAFS spectra and the corresponding FT for Np in HAS solution of pH 12. Fig. 4.13 U LIII edge k2-weighted EXAFS spectra and the corresponding FTs for U in HAS and silicate solution of pH 8.5. Fig. 4.14 FTs of the actinide LIII edge kn-weighted EXAFS spectra (overview) and the EXAFS derived structural parameters for Eu, Th, Np and U in HAS solutions. Fig. 4.15 a) Cm species distribution as a function of pH upon decreasing pH of a HAS –polysilicic acid mother solution from 9 to 2; b) Fraction of Cm-HAS(III) species as a function of time at different pH values; c) Fraction of Al remaining in the HAS-polysilicic acid colloids upon decreasing the solution pH. Fig. 4.16 Activity fraction of Am, Th and U in the colloidal phase as a function of time upon contact of the HAS-polysilicic acid solution of pH 9 with EDTA. Fig. 4.17 Fraction of Al remaining in the HAS colloids as a function of contact time with EDTA. a), b): HAS solutions prepared from polysilicic acid at pH 5 and 9; c), d): HAS solutions prepared from monosilicic acid at pH 5 and 9. Fig. 4.18 Activity fraction of Am, Th and U in the colloidal phase as a function of time upon contact of the 7 days aged HAS mother solutions of pH 5, 7 and 9 with EDTA. Fig. 5.1 Partition of [14C]-HA between the precipitate, colloids and solution as function of pH. Fig. 5.2 Partition of [14C]-HA between the precipitate, colloids and solution as function of the HA concentration in presence of 10-5 M Al at pH 6.6.
133
Figures captions
Fig. 5.3 Partition of [14C]-HA and 241Am (8x10⁻⁵ M) between the precipitate, colloids and solution as a function of the HA concentration at pH 6.6. Fig. 5.4 Am/Th/U activity fraction in the colloidal phase as a function of pH in absence and in presence of 6.5 mg/L HA. Fig. 5.5 Am/Th/U and [14C]-HA activity fractions in the colloidal phase as a function of HA concentration in presence of 10-5 M Al in solutions at pH 6.6 and 7.8. Fig. 5.6 Distribution of Eu and Al solution species as a function of pH. Fig. 5.7 Am activity fraction in the colloidal phase at pH 6.6 and 7.8 as a function of HA concentration in presence of 10-5 M Eu or 10-5 M Al. Fig. 5.8 Am/Th/U activity fraction in the colloidal phase at pH 6.6 and 7.8 as a func-tion of HA concentration at actinide concentration of 10-5 M. Fig. 6.1 Radiometric screening experiment for formation of colloid-borne Am in pres-ence of a) HAS, b): HAS and HA, c) HA and Al, from Am and 14C activity measure-ments. Fig. 6.2 Am activity fraction in the colloidal phase in presence of HAS (from monosilicic and polysilicic acid) and HA at different pH and at different sequence of component addition. Fig. 6.3 TRLFS spectroscopic speciation of Cm in HAS, HA and HAS + HA solutions. Fig. 6.4 Am activity fraction as a function of time in the colloidal phase in HAS, HA and HAS+ HA solutions of different pH. Fig. 6.5 TRLFS spectroscopic speciation of Cm immediately and after 20 d sample conditioning time, in solutions containing HAS + HA, prepared at different sequence of component addition. Fig. 6.6 Am/Th/U activity fraction in the colloidal phase for samples containing only HAS (from monosilicic and polysilicic acid) and HAS+HA at different pH. Fig. 6.7 Th and U activity fraction in the colloidal phase in samples containing both HAS (from monosilicic and polysilicic acid) and HA at different pH and at different se-quence of component addition. Fig. 6.8 Schematic illustration of expected behaviour of An in an aquatic system con-taining both HAS and HA. Fig. 8.1 Sketch of a generic XAS experiment using synchrotron radiation. Fig. 8.2 Solution species distribution as a function of pH for Th(IV) and U(VI) in solu-tions over-saturated relative to their hydroxides.
134
References
10. References [1] Stumm, W and Morgan, J., Aquatic Chemistry, John Wiley & Sons, New York,
1981.
[2] Degueldre, C., Grauer, M., Laube, A., Oess, A., Silby, H., Appl. Geochem. 11
(1996) 697.
[3] Kim, J.I., Mater. Res. Soc. Symp. Proc. 294 (1993) 3.
[4] Duan, J., Gregory, J., Colloids Surf. A: Physicochem. Eng. Aspects 107 (1996)
309.
[5] Degueldre, C., Triay, I., Kim, J.I., Vilks, P., Laaksoharju, M., Miekeley, N., Appl.
Geochem. 15 (2000) 1043.
[6] Kim, J.I, Rhee, D.S., Buckau, G., Morgenstern, A., Radiochim. Acta 79 (1997)
173.
[7] Kim, J.I, Zeh, P., Delakowitz, B., Radiochim. Acta 58/59 (1992) 147.
[8] Runde, W., Los Alamos Science 26 (2000) 412.
[9] Kim, J.I, Radiochim. Acta 52/52 (1991) 71.
[10] Kim, J. I., MRS Bulletin, December 1994, 47.
[11] Kim, J.I., Nucl. Eng. Des. 202 (2000) 143.
[12] McCarthy, J.F., McKay, L.D., Vadose Zone Journal 3 (2004) 326.
[13] Kersting, A.B., Efurd, D. W., Finnegan, D. L., Rokop, D. J., Smith, D.
K.Thompson, J.L., Nature 397 (1999) 56.
[14] Litaor, M.I., Health Physics 76 (1999) 171.
[15] Stumpf, Th., Bauer, A., Coppin, F., Environ. Sci. Technol. 35 (2001) 3691.
[16] Rabung, Th., Stumpf, Th., Geckeis, H., Klenze, R., Kim, J.I., Radiochim. Acta 88
(2000) 711.
[17] Geckeis, H., Klenze, R., Kim, J.I., Radiochim. Acta 87 (1999) 13.
[18] Artinger, R., Schüβler, W., Schäfer, T., Kim, J.I., Environ. Sci. Technol. 36 (2002)
4358.
[19] Artinger, R., Rabung, Th., Kim, J.I., Sachs, S., Schmeide, K., Heise, K.H.,
Bernhard, G., Nitsche, H., J. Contam. Hydrol. 58 (2002) 1.
[20] Moulin, V. and Moulin, Ch., Radiochim. Acta 89 (2001) 773.
[21] Geckeis, H., Rabung, Th., Ngo Manh, T., Kim, J.I., Beck, H.P., Environ. Sci.
Technol. 36 (2002) 2946.
135
References
[22] Doucet, F., Schneider, C., Bones, S. J., Kretchmer, A., Moss, I., Tekely, P., Exley,
Ch., Geochim. Cosmochim. Acta 65(15) (2001) 2461.
[23] Doucet, F., Rotov, M., Exley, Ch., J. Inorg. Biochem. 87 (2001) 71.
[24] Swaddle, Th., Coord. Chem. Rev. 219-221 (2001) 665.
[25] Kim, M.A., Panak, P.J., Yun, J.I., Kim, J.I., Priemyshev, A., Köhler, K., Ab-
schlussbericht, RCM 012004.
[26] Kim, M.A., Panak, P.J., Yun, J.I., Kim, J.I., Klenze, R., Köhler, K., Coll. Surf. A:
Physiochem. Eng. Aspects 216 (2003) 97.
[27] Kim, M.A., Panak, P.J., Yun, J.I., Priemyshev, J.I., Kim., Coll. Surf. A: Physio-
chem. Eng. Aspects 254 (2005) 137.
[28] Panak, P. J., Kim, M.A., Yun, J.I., Kim, J.I, Fanghänel, Th., Radiochim. Acta 93
(2005) 133.
[29] Jones, M.N., Bryan, N.D., Advances in Colloid and Interf. Sci. 78 (1998) 48.
[30] Silva, R.J. and Nitsche, H., Radiochim. Acta 70/71 (1995) 377.
[31] Choppin, G., Liljenzin, J-O., Rydberg, J., Radiochemistry and Nuclear Chemistry,
Butterworth Heinemann, USA, 2002.
[32] Shaw, D. J., Introduction to Colloid and Surface Chemistry, Butterworth, London,
1970.
[33] Stumpf, Th., Henning, C., Bauer, A., Denecke, M.A., Fanghänel, Th., Radiochim.
Acta 92 (2004) 133.
[34] Farmer, V.C., Adams, M.J., Fraser, A.R., Palmieri, F., Clay Miner. 18 (1983) 459.
[35] Arai, Y., McBeath, M., Bargar, J.R., Joye, J., Davis, J.A., Geochim. Cosmochim.
Acta 70 (2006) 2492.
[36] North, M., and Swaddle, Th., Inorg. Chem. 39 (2000) 2661.
[37] Taylor, P., Jugdaohsingh, R., Powell, J. J., J. Am. Chem. Soc. 119 (1997) 8852.
[38] Iler, R.K., The chemistry of silica. Solubility, polymerization, colloid and surface
properties and biochemistry. J.W. Sons, Wiley-Interscience, 1979.
[39] Dietzel, M., Geochim. Cosmochim. Acta 64 (19) (2000) 3275.
[40] Kim, J.I., Grambow, B. Eng. Geol. 52 (1999) 221.
[41] Hur, J., Schlautman, M.A., J. Colloid Interf. Sci. 264 (2003) 313.
[42] Buckau, G. FZKA-Report 6969, Forschungszentrum Karlsruhe, 2004.
136
References
[43] Kerner, M., Hohenberg, H., Ertl, S., Reckermann, M., Spitzy, A., Nature 422
(2003) 150.
[44] Beckett, R., Zhang, J., Giddings, J., Environ. Sci. Technol. 21 (1987) 289.
[45] Sutton, R., and Sposito, G., Environ. Sci. Technol. 39/23 (2005) 9009.
[46] Zeh, P., Czerwinski, K. R., Kim, J.I., Radiochim. Acta 76 (1997) 37.
[47] Van De Weerd, H., Van Riemsdijk, W.H., Leijnse, A., Environ. Sci. Technol. 33
(1999) 1675.
[48] Zeh, P. Ph.D Thesis. Institut für Radiochemie der Technischen Universität
München, 1993.
[49] Labonne-Wall, N., Moulin, V., Vilarem, J.P., Radiochim. Acta 79 (1997) 37.
[50] Rothe, J., Plaschke, M., Denecke, M.A., J. Phys. IV France 104 (2003) 421.
[51] Marquardt, C.M., FZKA-Report 6999, Forschungszentrum Karlsruhe, 2004
[52] Sutheimer, S.H., Cabaniss, S.E., Geochim. Cosmochim. Acta 61(1) (1997) 1.
[53] Fairhurst, A., Warwick, P., Richardson, S., Colloids Surf. A: Physicochem. Eng.
Aspects 99 (1995) 187.
[54] Heidmann, I., Christl., I., Kretzschmar, R., Environ. Sci. Technol. 39 (2005) 807.
[55] Righetto, L., Bidoglio, G., Azimonti, G., Bellobone, I.R., Environ. Sci. Tchnol. 25
(11) (1991) 1913.
[56] Righetto, L., Bidoglio, G., Marcandalli, B., Bellobone, I.R., Radiochim. Acta
44/45 (1988) 73.
[57] Bouby, M., Ngo Manh, T., Geckeis, H., Scherbaum, F., Kim, J.I., Radiochim.
Acta 90 (2002) 727.
[58] Stevenson, F.J., Humus Chemistry, Wiley, New York, 1982.
[59] Mansel, A., to be published.
[60] Klenze, R., Fanghänel, Th., Langzeitsicherheit der Endlagerung: Aquatische
Chemie der Actiniden, Nachrichten aus der Chemie 53 (2005) 1004.
[61] Fanghänel, Th., Pure Appl. Chem. 74 (10) (2002) 1895.
[62] Yun, J.I., Kim, M.A., Panak, P.J., Kim, J.I., Fanghänel, Th. J. Phys. Chem. B 110
(2006) 5416.
[63] Nagasaki, S., Tanaka, S., Suzuki, A., Colloids Surf. A: Physicochem. Eng. As-
pects 155 (1999) 137.
137
References
[64] Wang, X., Zhou, X., Du, J., Hu, W., Chen, Ch., Chen, Y., Surface Science 600
(2006) 478.
[65] Panak, P.J., Klenze, R., Kim, J.I., Radiochim. Acta 74 (1996) 141.
[66] Morgenstern, M., Klenze, R., Kim, J.I., Radiochim. Acta 88 (2000) 7.
[67] Kim, J.I., Czerwinski, K.R., Radiochim. Acta 73 (1996) 5.
[68] Singhal, R.K., J., Radioanal. Nucl. Chem. 265(3) (2005) 405.
[69] Murphy, R.J., Lenhart, J., Honeyman, D., Colloids Surf. A: Physicochem. Eng.
Aspects 157 (1999) 47.
[70] Quigley, M., Santschi, P.H., Guo, L., Honeymann, B.D., Marine Chemistry 76
(2001) 27.
[71] Marquardt, C., Kim, J.I., Radiochim. Acta 80 (1998) 129.
[72] Seibert, A., Mansel, A., Marquardt, C.M., Keller, H., Kratz, J.V., Trautman, V.,
Radiochim. Acta 89 (2001) 505.
[73] Rao, L., Choppin, G., Clark, S.B., Radiochim. Acta 66/67 (1994) 141.
[74] Reiller, P., Moulin, V., Casanova, F., Dautel, Ch., Radiochim. Acta 91 (2003) 513.
[75] Reiller, P., Moulin, V., Casanova, F., Dautel, Ch., Appl. Geochem. 17 (2002)
1551.
[76] Scherbaum, F.J., Knopp, R., Kim, J.I., Appl. Phys. B 63 (1996) 299.
[77] Passo, C.J, Cook, G. Handbook of Environmental Liquid Scintillation
Spectrometry. Packard Instrument Company, USA 1995.
[78] Panak, P, Klenze, R., Kim, J.I., Wimmer, H., J. Alloys Compd. 225 (1995) 261.
[79] Kim, J.I., Klenze, R., Wimmer, H. J. Solid State Inorg. Chem. 28 (1991) 347.
[80] Fanghänel, Th., Kim, J.I., J. Alloys. Compd. 271-273 (1998) 728.
[81] Kitamura, A., Yamamura, T., Hase, H., Yamamoto, T., Radiochim. Acta 82
(1998) 147.
[82] Monsalier, J., Choppin, G.R., Radiochim. Acta 91 (2003) 135.
[83] Denecke, M.A., Coord. Chem. Rev. 250 (2006) 730.
[84] Vlaic, G, Olivi, L., Croatica Chemica Acta CCACAA 77 (3) (2004) 427.
[85] Newville, M. Fundamentals of EXAFS, An internet tutorial, 2004.
[86] EXAFS: material available at www.p-g.si/~arcon/xas/exafs/exafs.htm.
[87] Walther, C., Colloids Surf. A: Physicochem. Eng. Aspects 217 (2003) 81.
[88] Kim, M.A., RCM-Report 2006, in preparation.
138
References
[89] Denecke, M.A., Physika Scripta XX (2006).
[90] Hudson, E.A., Allen, P.G., Terminello, L.J., Physical Review B, 54 (1) (1996)
156.
[91] Neck, V., Runde, W, Kim, J.I., Kanellakopoulos, B., Radiochim. Acta 65 (1994)
29.
[92] Guillaumont, R., Fanghänel, Th., Fuger, J., Grenthe, I., Neck, W., Palmer, D.A.,
Rand, M.H. OECD-NEA TDB, Update on the chemical thermodynamics of Ura-
nium, Neptunium, Plutonium, Americium and Technetium, Elsevier, 2003.
[93] Meinrath, G., Kato, Y., Kimura, T., Yoshida, Z., Radiochim. Acta 75 (1996) 159.
[94] Prikryl, J.D., Jain, A., Turner, D.R., Pabalan, R. T. J., Contam. Hydrol. 47 (2001)
241.
[95] Gabriel, U., Charlet, L., Schläpfer, C.W., Vial, C.V., Brachmann, A., Geipel, G.J.,
Colloid Interf. Sci. 239 (2001) 358.
[96] Geipel, G., Coord. Chem. Rev. 250 (2006) 844.
[97] Panak, P. J., Kim, M.A., Yun, J.I., Kim, J.I., Colloids Surf. A: Physiochem. Eng.
Aspects 227 (2003) 93.
[98] P.J. Panak, P. Loiseau, P., K. Dardenne, J. Rothe, M.A. Denecke, R. Klenze, M.A.
Kim, J.I. Kim, Th. Fanghänel, ANKA/FZK Annual Report 2003, 51.
[99] Farges, F., Geochimica et Cosmochimica Acta 11(55) (1991) 3303.
[100] Oesthols, E., Manceau, A., Farges, F., Charlet, L. J., Coll. Interf. Sci. 194 (1997)
10.
[101] Dähn, R., Scheidegger, A. M., Manceau, A., Baeyens, B., Bradbury, M.H. Pro-
ceedings of the 1-st ACTINIDE-XAS-2000 Workshop on Speciation, Technolo-
gies and Facilities of Radioactive Materials at Synchrotron Light Sources, Greno-
ble, France, 2000, 75.
[102] Petit-Maire, D., Petiau, J., Calas, G., Jacquet-Francillon, M., Physica B 158 (1989)
56.
[103] Brown, J.E. Jr., Farges, F., Bargar, J.R., Thompson Berbeco, H. Proceedings of
the 1-st ACTINIDE-XAS-2000 Workshop on Speciation, Technologies and Facili-
ties of Radioactive Materials at Synchrotron Light Sources, Grenoble, France,
2000, 15.
139
References
[104] Hennig, C., Reich, T., Dähn, R., Scheidegger, A.M., Radiochim. Acta 90 (2002)
653.
[105] Rai, D., Yui, M., Hess, N., Felmy, A.R., Moore, D.A., Radiochim. Acta 93 (2005)
443.
[106] Rothe, J., Denecke, M.A., Neck, W., Müller, R. Kim, J.I., Inorg. Chem. 41 (2002)
249.
[107] Denecke, M.A., Rothe, J., Dardenne, K., Lindquist-Reis, P., Phys. Chem. Chem.
Phys. 5 (2003) 939.
[108] Giaquinta, D.M., Soderholm, L., Yuchs, S.E., Wasserman, S.R., J., Alloys Compd.
249 (1997) 142.
[109] Reich, T., Bernhard, G., Geipel, G., Funke, H., Hennig, C., Rossberg, A., Matz,
W., Schell, N., Nitsche, H., Radiochim. Acta 88 (2000) 633.
[110] Reich, T., Amayri, S., Reich, Ta., Drebert, J., Jermolajev, A., Thoerle, P.,
Trautmann, N., Hennig, C., Sachs, S. Annual Report 2004, Forschungszentrum
Rossendorf.
[111] Combes, J-M., Chisholm-Brause, Brown, G.E. Jr., Parks, G.A., Environ. Sci.
Technol. 26 (1992) 376.
[112] Allen, P.G., Shuh, D.K., Bucher, J.J., Edelstein, N.M., Reich, T., Denecke, M.A.,
Nitsche, H., Inorg. Chem. 36 (1997) 4676.
[113] Denecke, M.A., Marquardt, Ch.M., Rothe, J., Dardenne, K., Jensen, M. J., Nucl.
Sci. Technol., Suppl. 3 (2002) 410.
[114] Neck, W., Kim, J.I., Kanellakopoulos, B., Radiochim. Acta 56 (1992) 25.
[115] Duff, M.C., Hunter, D.B., Oji, L.N., Wilmarth, W.R. Characterization of uranium
solids precipitated with aluminosilicates, WM’04 Conference, 29 Febr-4 March
2004, Tuscon, Arizona, available at at http://www.osti.gov/bridge.
[116] Sylwester, E.E., Hudson, E.A., Allen, P.G., Geochim. Cosmochim. Acta, 64(14)
(2000) 2431.
[117] Reich, T., Moll, H., Arnold, T., Denecke, M.A., Hennig, C., Geipel, G., Bernhard,
G., Nitsche, H., Allen, P.G., Bucher, J.J., Edelstein, N.M., Shuh, D.K., J. Electron
Spectroscopy and Related Phenomena 96 (1998) 237.
140
References
[118] Reich, T., Moll, H., Denecke, M.A., Geipel, G., Bernhard, G., Nitsche, H., Allen,
P.G., Bucher, J.J., Kaltsoyannis, N., Edelstein, N.M., Shuh, D.K., Radiochim.
Acta 74 (1996) 219.
[119] Wahlgren, U., Moll, H., Schimmelpfennig, B., Maron, L., Vallet, V., Gropen, O.J.,
Phys. Chem. A 103 (1999) 8257.
[120] Allen, P.G., Shuh, D.K., Bucher, J.J., Edelstein, N.M., Palmer, C.E.A., Silva, R.J.,
Nguyen, S.N., Marquez, L.N., Hudson, E.A., Radiochim. Acta 75 (1996) 47.
[121] Allard, T., Ildefonse, P., Beaucaire, C., Calas, G., Chem. Geology 158 (1999) 81.
[122] Farges, F., Ponader, C.W., Calas, G., Brown, G.E. Jr., Geochim. Cosmochim.
Acta 56 (12) (1992) 4205.
[123] Walter, M., Arnold, Th., Geipel, G., Scheinost, A., Bernhard, G. J., Colloid Interf.
Sci. 282(2) (2005) 293.
[124] Moyes, L.N., Parkman, R., Charnock, J.M., Vaughan, D.J., Livens, F.R., Hughes,
C.R., Braithwaite, A. Environ. Sci. Technol. 34 (2000) 1062.
[125] Bargar, J.R., Reitmeyer, R., Lenhart, J.J., Davis, J.A., Geochim. Cosmochim.
Acta 64 (16) (2000) 2737.
[126] Kent, D.B., Davis, J.A., Anderson, L., Rea, B., Coston, J., Geochim. Cosmochim.
Acta 66/17 (2002) 3017.
[127] Cernochova, K, Mathur, J., Choppin, G.R., Radiochim. Acta 93 (2005) 733.
[128] Read, D., Ross, D., Sims R.J., J. Contam. Hydrol. 35 (1998) 235.
[129] Katz, J.J., Seaborg, G.T., Morss, L.R. The Chemistry of the Actinide Elements,
Vol.1., Chapmann and Hall Ltd, London 1986.
[130] Nagy, N. M., Konya, J., Wazelischen-Kun, G., Coll. Surf. A: Physicochem. Eng.
Eng.Aspects 152 (1999) 245.
[131] Lindsay, W.I. Chemical Equilibria in Soils, Wiley-Interscience, New York, 1979.
[132] Plaschke, M., Roemer, J., Klenze, R., Kim, J.I., Surf. Interface Anal. 30 (2000)
297.
[133] Neck, V., Fanghänel, Th., Kim, J.I, Aquatische Chemie und Thermodynamische
Modellierung von trivalenten Actiniden, FZKA-Report 6110, Forschungszentrum
Karlsruhe, 1998.
[134] Sakuragi, T, Stao, S., Kozaki, T., Mitsugashira, T., Hara, M., Suzuki, Y., J.
Radioanal. Nucl. Chem. 265(3) (2005) 349.
141
References
[135] Neck, V., Kim, J.I., Radiochim. Acta 89 (2001) 1.
[136] Kim, M.A., Panak, P.J., Breban, D., Priemyshev, A., Yun, J.I., Kim., J.I., submit-
ted to Coll. Surf. A: Physiochem. Eng. Aspects.
[137] Panak, P.J., Kim, M.A., Yun, J.I., Kim., J.I., Fanghänel, Th. 10th International
Conference on Chemistry and Migration Behaviour of Actinides and Fission
Products in the Geosphere, Avignon, France, 18-23 September 2005.
Eidesstattliche Erklärung
Ich erkläre hiermit, dass ich die vorgelegte Dissertation selbst verfasst und mich keiner
anderen als der von mir ausdrücklich bezeichnerten Quellen und Hilfen bedient habe.
Domnica Cristina Breban