inaugural dissertation zur erlangung der doktorwürde...
TRANSCRIPT

INAUGURAL ‐ DISSERTATION
Zur Erlangung der Doktorwürde der
Naturwissenschaftlich-Mathematischen Gesamtfakultät der
Ruprecht - Karls - Universität Heidelberg
vorgelegt von
MRes Biomedical Science – Sahana Suresh Babu
aus Tumkur, India

Molecular mechanism of wall tension-induced
zyxin activation in endothelial cells
Gutachter: Prof. Dr. Stephan Frings
PD Dr. Marco Cattaruzza
Tag der Mündlichen Prüfung:................................

ZZUUSSAAMMMMEENNFFAASSSSUUNNGG
ZUSAMMENFASSUNG Eine chronische arterielle Hypertonie führt aufgrund mechanischer Überlastung zu
dysfunktionalen Blutgefäßen, d. h. auf Zellebene zu einer endothelialen Dysfunktion
und zu einem synthetischen Phänotyp glatter Gefäßmuskelzellen. Nicht überraschend
ist deshalb, dass sie ein klassischer Risikofaktor für Arteriosklerose und
hypertophen/hyperplastischen Gefäßwandumbau ist. Trotz ihrer klinischen Bedeutung
sind die Mechanismen früher Phasen druckinduzierter Phänotypänderungen vaskulärer
Zellen bisher wenig untersucht.
In dieser Arbeit wurden zum ersten Mal die molekularen Mechanismen der druck-
bzw. dehnungsinduzierten Aktivierung des spezifischen Mechanotransducer-Proteins
Zyxin in vitro und in situ untersucht. Darüber hinaus konnte gezeigt werden, dass
Zyxin eigene Transkriptionsfaktoraktivität besitzt.
Die Aktivierung von Zyxin wird durch eine hierarchisch organisierte
Signaltransduktionskaskade induziert, an deren Anfang die Aktivierung des
Kationenkanals TRPC3 steht. Dies führt zu einer Ausschüttung von Endothelin-1 (ET-
1) und danach, vermittelt durch den B-Typ Rezeptor von ET-1, von atrialem
natriuretischem Peptid (ANP). ANP schließlich aktiviert seinen Guanylatzyklase-
rezeptor GC-A was zu einer cGMP-vermittelten Phosphorylierung von Zyxin an Serin
142 durch die cGMP-abhängige Proteinkinase G führt. Diese Phosphorylierung ist
notwendig für die Translokation von Zyxin in den Zellkern. Die wahrscheinlich
zentrale Bedeutung von Zyxin für den (frühen) druckinduzierten Gefäßwandumbau
wird dadurch unterstrichen, dass das Protein annähernd 70% aller dehnungssensitiven
Gene reguliert indem es an ein neues Bindungsmotiv dehnungssensitiver
Genpromotoren, die PyPu-box, bindet.
Die detaillierte Charakterisierung dieses komplexen dehnungsspezifischen
Signalweges eröffnet in Zukunft die Möglichkeit schon während früher Phasen des
druckinduzierten Gefäßumbaus in den Prozess einzugreifen. Neben eher pleiotropen
Möglichkeiten die Zyxinaktivierung zu unterbinden, etwa eine pharmakologische
Hemmung des B-Typ ET-1 Rezeptors, soll vor allem eine direkte Hemmung der
Transkriptionsfaktoraktivität von Zyxin durch Decoy-Oligonukleotide versucht
werden.

SSUUMMMMAARRYY
SUMMARY Hypertension is a major predisposing factor for developing chronic endothelial
dysfunction and a predominantly synthetic vascular smooth muscle cell phenotype.
Therefore, the disease is one of the classical risk factors for atherosclerosis, arterial
hypertrophy/hyperplasia and, consequently, cardiac hypertrophy.
Despite these severe clinical consequences, surprisingly little is known about the
primary signalling events leading to pressure or wall tension-induced phenotype
changes of vascular cells.
For the first time, the mechanisms of wall tension or stretch-induced activation of the
specific mechanotransducer protein zyxin and its action as a transcription factor could
be delineated in endothelial cells in vitro and in situ at the molecular level. Activation
of zyxin is mediated by a hierarchical chain of events starting with the cation channel
TRPC3, TRPC3-mediated or reinforced release of the autacoids ET-1 and,
consecutively, ANP and, finally, the ANP receptor GC-A/cyclic GMP/ protein kinase
G mediated phosphorylation of zyxin at serine-142. This phosphorylation enables
zyxin to translocate to the nucleus where it affects the expression of approximately
70% of all stretch-sensitive genes in endothelial and smooth muscle cells by binding to
a novel stretch-sensitive promoter motif, the PyPu-box. This motif is found in all
zyxin-dependent genes so far analysed.
The detailed characterization of this complex pathway, specifically activated in
response to mechanical overload in vascular cells, opens the possibility to interfere
with early phases of pressure-/stretch-induced vascular remodelling process in vivo at
several levels. Besides targeting the, quite pleiotropic, main mediators of zyxin
activation, ET-1 and ANP, zyxin may be targeted directly, e.g., by use of decoy-
oligonucleotides that specifically prevent it from acting as a transcription factor.
PPUUBBLLIICCAATTIIOONNSS
PUBLICATIONS Journal articles Wójtowicz A*, Babu SS*, Li L, Gretz N, Hecker M, Cattaruzza M (2010). Zyxin mediation of stretch-induced gene expression in human endothelial cells. Circ Res 107(7): 898-902.
Babu SS, Wojtowicz A, Freichel M, Birnbaumer L, Hecker M, Cattaruzza M. Molecular mechanism of stretch-induced cellular mechanotransduction. Submitted.
Conference presentations
Suresh S, Wojtowicz A, Kuhn M, Hecker M and Cattaruzza M. Role of focal adhesion protein zyxin in wall-tension induced endothelial signaling. Experimental Biology 2011, Washington DC, US (April 2011).
Suresh S, Wojtowicz A, Kuhn M, Hecker M and Cattaruzza M. Role of focal adhesion protein zyxin in wall-tension induced endothelial signaling. 90th Annual German Physiological conference, Regensburg, Germany (March 2011).
Suresh S, Wojtowicz A, Hecker M, Cattaruzza M. Mechanisms of wall tension induced vascular signaling. Joint meeting of Scandinavian and German Physiological Societies, Copenhagen, Denmark (March 2010).
Suresh S, Wojtowicz A, Hecker M, Cattaruzza M. Wall tension-induced signaling in endothelial cells. 88th Annual German Physiological Conference, Giessen, Germany (March 2009).

CCOONNTTEENNTTSS
I
CONTENTS
Abbreviations ........................................................................................................ V
1. INTRODUCTION.............................................................................................. 1
1.1 Hemodynamic forces and vascular homeostasis............................................ 1
1.2 Pathways of mechanically induced cardiovascular disease ........................... 2
1.3 Short term vs. chronic increases in wall tension ............................................ 4
1.4 Known molecular mediators of wall tension-induced signalling .................. 4
1.4.1 Stretch-induced transcription factors and pro-inflammatory
gene expression in endothelial and smooth muscle cells ........................ 4
1.4.2 Endothelin-1 (ET-1) ................................................................................ 5
1.4.3 Atrial natriuretic peptide (ANP) ............................................................. 6
1.4.4 Transient receptor potential channels (TRP channels) ........................... 7
1.4.5 Specific versus non-specific vascular stretch-signalling ........................ 9
1.5 Focal adhesions in mechanotransduction..................................................... 10
1.6 Structure of zyxin ......................................................................................... 11
1.7 Zyxin in vascular mechanotransduction ...................................................... 12
1.8 Aims of the project....................................................................................... 12
2. MATERIALS ................................................................................................... 13
2.1 Synthetic oligonucleotide primers for PCR ................................................. 13
2.2 Kits ............................................................................................................... 15
2.3 Bacterial strains and plasmids ...................................................................... 16
2.4 Cell culture ................................................................................................... 17
2.5 Reagents ....................................................................................................... 17
2.6 Buffers and solutions ................................................................................... 18
2.7 Microbiological media ................................................................................. 19
2.8 Small interfering RNAs ............................................................................... 19
2.9 Antibodies .................................................................................................... 20
2.10 Mouse strains ............................................................................................. 21
2.11 Software ..................................................................................................... 22

CCOONNTTEENNTTSS
II
3. METHODS ....................................................................................................... 23
3.1 Molecular techniques ................................................................................... 23
3.1.1 Expression plasmids.............................................................................. 23
3.1.2 Site-directed mutagenesis ..................................................................... 23
3.1.3 Plasmid cloning for RT-PCR standards ................................................ 24
3.1.4 TOPO cloning ....................................................................................... 24
3.1.4.1 Transformation of competent bacteria ............................................... 24
3.1.4.2 Plasmid mini/maxi-cultures and plasmid purification ....................... 25
3.1.5 Polymerase chain reaction (PCR) ......................................................... 25
3.1.6 Reverse transcription PCR (RT-PCR) .................................................. 25
3.1.7 PCR amplification of DNA fragments .................................................. 26
3.1.8 Quantitative real-time PCR ................................................................... 26
3.1.9 Agarose gel electrophoresis .................................................................. 27
3.1.10 Isolation of total DNA from cultured cells and mouse tails ............... 28
3.1.11 Isolation of total RNA from cultured cells and femoral arteries ........ 29
3.1.12 Measurement of RNA/cDNA concentration ....................................... 29
3.2 Cell culture ................................................................................................... 29
3.2.1 Isolation and culture of human umbilical vein endothelial cells
(HUVEC) .............................................................................................. 29
3.2.2. Culture of mouse smooth muscle cells ................................................ 30
3.2.3 siRNA transfection into HUVEC.......................................................... 30
3.2.4 Transfection of zyxin expression plasmids into HUVEC ..................... 31
3.2.5 Incubation of cells with various drugs .................................................. 32
3.2.6 Application of mechanical strain .......................................................... 32
3.3 Immunofluorescence analysis ...................................................................... 33
3.3.1 Cell fixation .......................................................................................... 33
3.3.2 Immunostaining of fixed cells .............................................................. 33
3.4 Immunohistochemistry ................................................................................ 34
3.4.1 Tissue preparation for paraffin embedding ........................................... 34
3.4.2 Staining of paraffin sections ................................................................. 34
3.5 Confocal microscopy ................................................................................... 35
3.6 Chromatin immunoprecipitation (ChIP). ..................................................... 35
3.7 Protein biochemistry .................................................................................... 36
3.7.1 Isolation of total cellular protein ........................................................... 36
3.7.1 Separation of cytoplasmic and nuclear proteins ................................... 36
3.7.2 Sodium dodecylsulfate polyacrylamide gel electrophoresis
(SDS-PAGE) ......................................................................................... 36
CCOONNTTEENNTTSS
III
3.7.3 Western blot analysis ............................................................................ 38
3.7.4 Enzyme-linked immunosorbent assay (ELISA) ................................... 39
3.8 Ex-vivo blood vessel perfusion .................................................................... 39
3.8.1 Isolation and preparation of murine femoral arteries for perfusion ...... 39
3.8.2 Perfusion of isolated murine femoral arteries ....................................... 39
3.9 Statistical analysis ........................................................................................ 41
4. RESULTS ......................................................................................................... 42
4.1 Effect of cyclic stretch on cellular localisation of zyxin (in vitro) .............. 42
4.2 Pressure-induced zyxin translocation in mouse arteries (in situ) ................. 44
4.3 Role of zyxin in stretch-induced gene expression ....................................... 45
4.4 Mechanism of zyxin-induced gene expression ............................................ 47
4.4.1 Zyxin association with the PyPu box: ................................................... 48
4.4.2 PyPu box mimicking decoy oligonucleotide (decoy ODN) ................. 50
4.4.3 Optimisation of the stretch protocol ..................................................... 51
4.5 Components of the signalling cascade activated by wall tension ................ 53
4.5.1 Effect of mechanosensitive pathway inhibitors on zyxin translocation 53
4.5.2 Effect of ANP and ET-1 on zyxin translocation ................................... 56
4.5.3 Effect of the TRP blocker gadolinium on stretch induced
ANP and ET-1 expression in endothelial cells ..................................... 56
4.6 Hierarchy of TRPs, ANP and ET-1 in zyxin translocation pathway in
endothelial cells ........................................................................................... 58
4.7 Zyxin translocation in smooth muscle cells ................................................. 61
4.8 TRP channels in endothelial cells ................................................................ 62
4.9 In situ perfusion analysis of femoral arteries derived from
TRP- deficient mice ..................................................................................... 63
4.10 TRPC3 mediates zyxin activation .............................................................. 64
4.10.1 In situ analysis of TRP KO femoral arteries ....................................... 64
4.10.2 Analysis of TRP deficient SMC for zyxin translocation .................... 64
4.11 GC-A mediates zyxin phosphorylation by PKG ........................................ 67
4.11.1 In situ analysis of GC-A deficient femoral arteries ............................ 67
4.11.2 Analysis of GC-A deficient smooth muscle cell................................. 68
4.12 Analysis of phosphorylated amino acid residues in zyxin
targeted by PKG ......................................................................................... 70
4.12.1 Generation eGFP-zyxin constructs ..................................................... 71
4.12.2 Transfection of zyxin expression plasmids into HUVEC ................... 71
CCOONNTTEENNTTSS
IV
4.12.3 Effects of ANP on cells transfected with zyxin-wildtype and mutant constructs ................................................................................ 71
4.12.4 Effect of cyclic stretch on cells transfected with
zyxin-wildtype and mutant constructs ................................................ 73
4.13 Effect of Rho associated protein kinase (ROCK) on zyxin translocation . 75
5. DISCUSSION ................................................................................................... 77
5.1 Models used to apply wall tension ............................................................... 77
5.2 Gene expression regulated by zyxin ............................................................ 78
5.3 The endothelial cell response to stretch – a defined signalling cascade ...... 80
5.4 Stretch-induced zyxin activation and pressure-induced
vascular remodelling .................................................................................... 86
5.5 Perspective ................................................................................................... 86
6. REFERENCES ................................................................................................. 88
APPENDIX ........................................................................................................... 96
ACKNOWLEDGEMENTS ................................................................................ 98

AABBBBRREEVVIIAATTIIOONNSS
V
Abbreviations ANOVA analysis of variance
ANP atrial natriuretic peptide
BNP brain natiuretic peptide
BSA bovine serum albumin
cGMP cyclic guanosine monophosphate
ChIP chromatin immune precipitation
CNP c-type natriuretic peptide
D142 aspartate 142
DMEM Dulbecco’s modification of eagle’s medium
DNA deoxyribonucleic acid
DTT dithtiotreitol
EC endothelial cells
EDTA ethylene diamine tetraacetic acid
EGTA ethylene glycol tetra acetic acid
ELISA enzyme-linked immunosorbent assay
ET-1 endothelin-1
ETB-R Endothelin-1 receptor B type
FA focal adhesion
FBS fetal bovine serum
FSS fluid shear stress
GAPDH glyceraldehyde-3-phosphate dehydrogenase
GC-A/B guanylyl cyclase receptor type A/B
Gd3+ gadolinium
GSEA gene set enrichment analysis
HRP horseradish peroxidase
HUVEC human umbilical vein endothelial cells
ICAM-1 intercellular adhesion molecule-1
IFA
IL-8
immunofluorescence analysis
interleukin 8
MCP-1 monocyte chemoattractant protein-1
NES nuclear export signal
ng nano-gram
NO nitric oxide
NOS-3 type 3 (endothelial) nitric oxide synthase
NPR-C C-type ANP receptor
Nu nucleus
PBS phosphate buffered saline

AABBBBRREEVVIIAATTIIOONNSS
VI
PCR polymerase chain reaction
PKG protein kinase G
PVDF polyvinylidenefluorid
RNA ribonucleic acid
ROCK rho-associated protein kinase
Rp8pGPT-cGMPS guanosine, 3´,5´-cyclic monophosphorothioate, 8--(4-chlorophenylthio)-, Rp-isomer
RPM revolutions per minute
RT reverse transcriptase
RT-PCR reverse transcription-polymerase chain reaction
S142 serine -142
S-1-P spingocine-1-phosphate
SDS sodium dodecylsulfate
SDS-PAGE sodium dodecylsulfate-polyacrylamide gel electrophoresis
SF stress fibres
siRNA small interfering RNA
SMA smooth muscle actin
SMC smooth muscle cell
TRP transient receptor potential channel
VASP vasodilator-stimulated phosphoprotein
VCAM-1 vascular cell adhesion molecule-1
VEGF vascular endothelial growth factor
WT wall tension
IINNTTRROODDUUCCTTIIOONN
1
1. INTRODUCTION
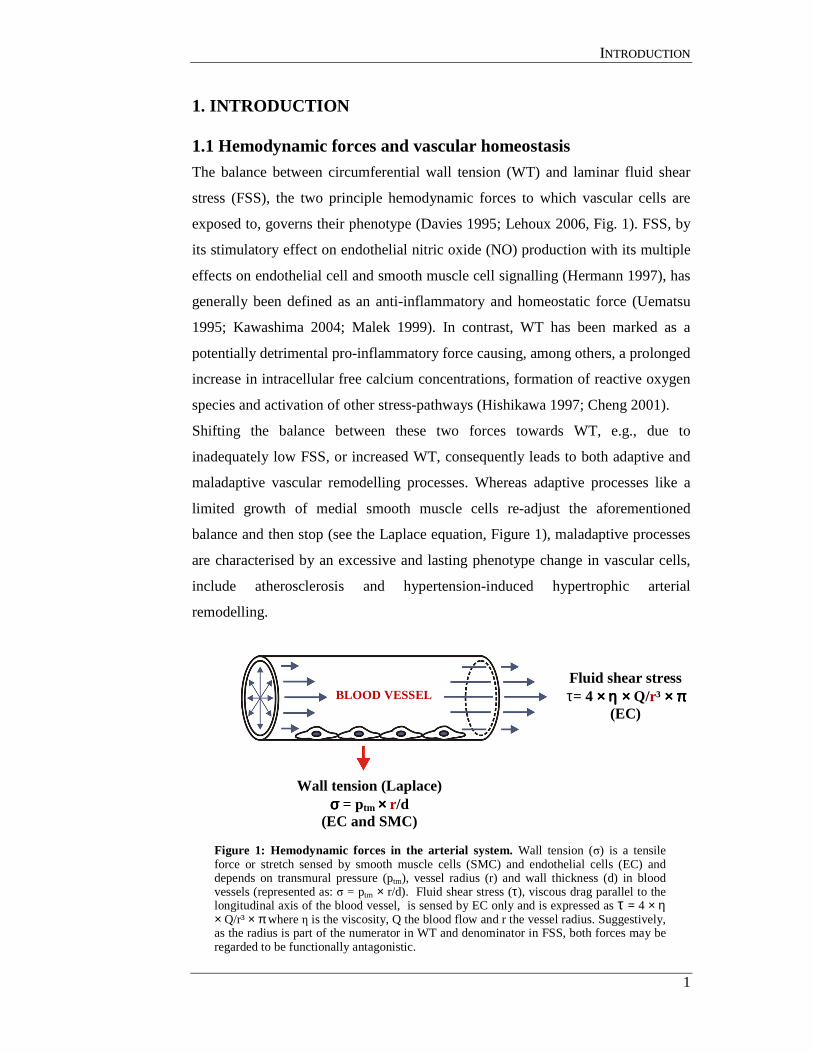
1.1 Hemodynamic forces and vascular homeostasis The balance between circumferential wall tension (WT) and laminar fluid shear
stress (FSS), the two principle hemodynamic forces to which vascular cells are
exposed to, governs their phenotype (Davies 1995; Lehoux 2006, Fig. 1). FSS, by
its stimulatory effect on endothelial nitric oxide (NO) production with its multiple
effects on endothelial cell and smooth muscle cell signalling (Hermann 1997), has
generally been defined as an anti-inflammatory and homeostatic force (Uematsu
1995; Kawashima 2004; Malek 1999). In contrast, WT has been marked as a
potentially detrimental pro-inflammatory force causing, among others, a prolonged
increase in intracellular free calcium concentrations, formation of reactive oxygen
species and activation of other stress-pathways (Hishikawa 1997; Cheng 2001).
Shifting the balance between these two forces towards WT, e.g., due to
inadequately low FSS, or increased WT, consequently leads to both adaptive and
maladaptive vascular remodelling processes. Whereas adaptive processes like a
limited growth of medial smooth muscle cells re-adjust the aforementioned
balance and then stop (see the Laplace equation, Figure 1), maladaptive processes
are characterised by an excessive and lasting phenotype change in vascular cells,
include atherosclerosis and hypertension-induced hypertrophic arterial
remodelling.
Figure 1: Hemodynamic forces in the arterial system. Wall tension (σ) is a tensile force or stretch sensed by smooth muscle cells (SMC) and endothelial cells (EC) and depends on transmural pressure (ptm), vessel radius (r) and wall thickness (d) in blood vessels (represented as: σ = ptm × r/d). Fluid shear stress (τ), viscous drag parallel to the longitudinal axis of the blood vessel, is sensed by EC only and is expressed as τ = 4 × η × Q/r³ × π where η is the viscosity, Q the blood flow and r the vessel radius. Suggestively, as the radius is part of the numerator in WT and denominator in FSS, both forces may be regarded to be functionally antagonistic.
Wall tension (Laplace) σσσσ = ptm ×××× r /d
(EC and SMC)
BLOOD VESSEL Fluid shear stress τ= 4 ×××× ηηηη ×××× Q/r³ ×××× ππππ
(EC)
IINNTTRROODDUUCCTTIIOONN
2
1.2 Pathways of mechanically induced cardiovascular disease Although several vascular pathologies caused by an imbalance of FSS and WT
possess similar or even identical patho-mechanisms at the cellular level, the
primary cause of the imbalance, low FSS or high WT, mostly defines the actual
nature of vascular dysfunction. This may be due to the fact that FSS has a direct
effect only on endothelial cells (EC), whereas increased WT acts on both SMC
and EC.
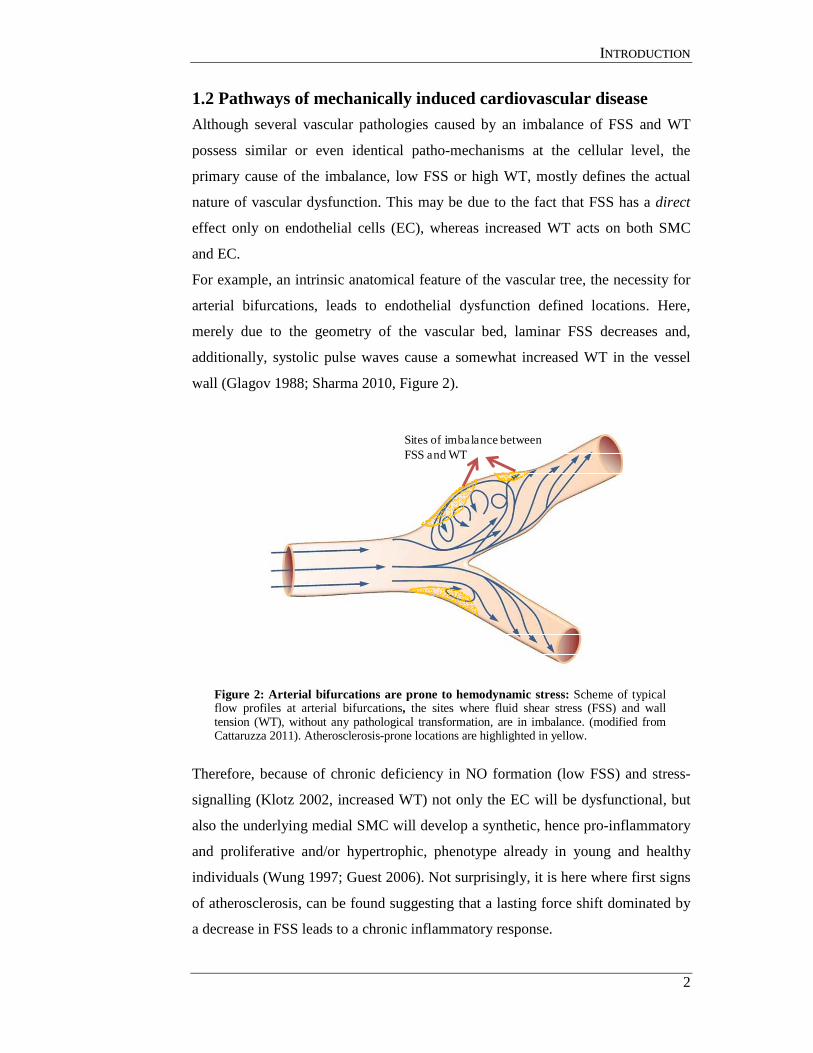
For example, an intrinsic anatomical feature of the vascular tree, the necessity for
arterial bifurcations, leads to endothelial dysfunction defined locations. Here,
merely due to the geometry of the vascular bed, laminar FSS decreases and,
additionally, systolic pulse waves cause a somewhat increased WT in the vessel
wall (Glagov 1988; Sharma 2010, Figure 2).
Figure 2: Arterial bifurcations are prone to hemodynamic stress: Scheme of typical flow profiles at arterial bifurcations, the sites where fluid shear stress (FSS) and wall tension (WT), without any pathological transformation, are in imbalance. (modified from Cattaruzza 2011). Atherosclerosis-prone locations are highlighted in yellow.
Therefore, because of chronic deficiency in NO formation (low FSS) and stress-
signalling (Klotz 2002, increased WT) not only the EC will be dysfunctional, but
also the underlying medial SMC will develop a synthetic, hence pro-inflammatory
and proliferative and/or hypertrophic, phenotype already in young and healthy
individuals (Wung 1997; Guest 2006). Not surprisingly, it is here where first signs
of atherosclerosis, can be found suggesting that a lasting force shift dominated by
a decrease in FSS leads to a chronic inflammatory response.
Sites of imbalance between FSS and WT
IINNTTRROODDUUCCTTIIOONN
3
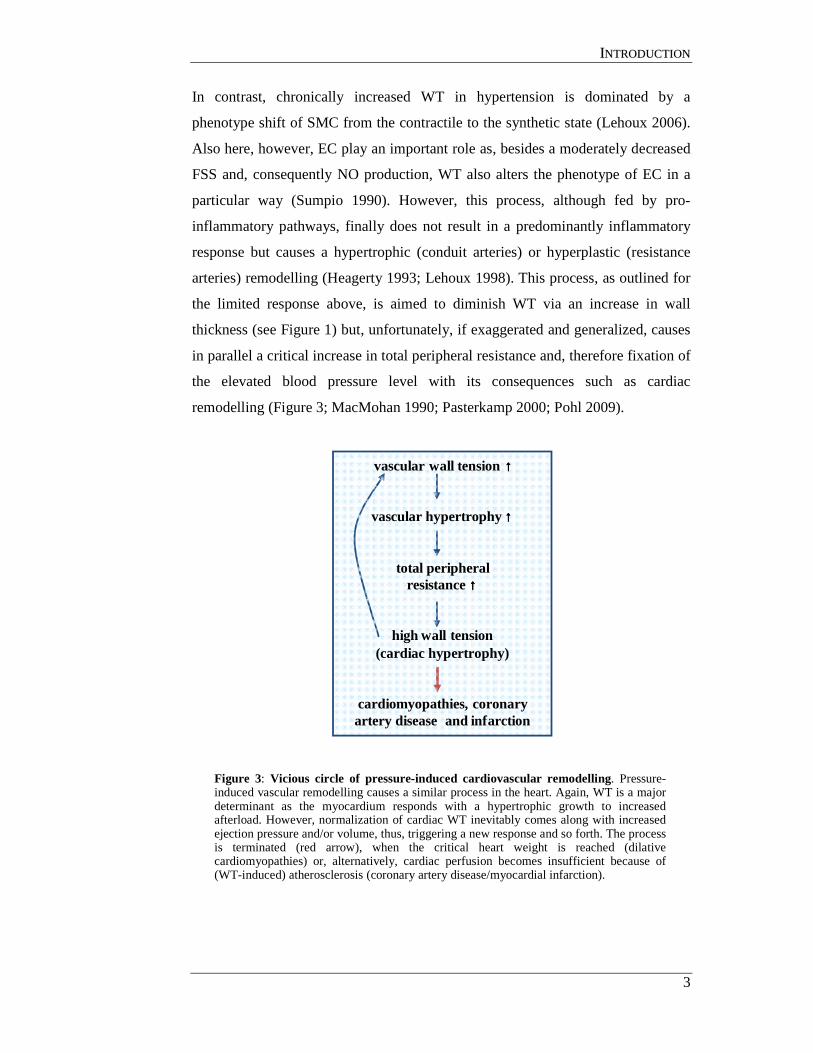
In contrast, chronically increased WT in hypertension is dominated by a
phenotype shift of SMC from the contractile to the synthetic state (Lehoux 2006).
Also here, however, EC play an important role as, besides a moderately decreased
FSS and, consequently NO production, WT also alters the phenotype of EC in a
particular way (Sumpio 1990). However, this process, although fed by pro-
inflammatory pathways, finally does not result in a predominantly inflammatory
response but causes a hypertrophic (conduit arteries) or hyperplastic (resistance
arteries) remodelling (Heagerty 1993; Lehoux 1998). This process, as outlined for
the limited response above, is aimed to diminish WT via an increase in wall
thickness (see Figure 1) but, unfortunately, if exaggerated and generalized, causes
in parallel a critical increase in total peripheral resistance and, therefore fixation of
the elevated blood pressure level with its consequences such as cardiac
remodelling (Figure 3; MacMohan 1990; Pasterkamp 2000; Pohl 2009).
Figure 3: Vicious circle of pressure-induced cardiovascular remodelling. Pressure-induced vascular remodelling causes a similar process in the heart. Again, WT is a major determinant as the myocardium responds with a hypertrophic growth to increased afterload. However, normalization of cardiac WT inevitably comes along with increased ejection pressure and/or volume, thus, triggering a new response and so forth. The process is terminated (red arrow), when the critical heart weight is reached (dilative cardiomyopathies) or, alternatively, cardiac perfusion becomes insufficient because of (WT-induced) atherosclerosis (coronary artery disease/myocardial infarction).
vascular wall tension ↑↑↑↑
vascular hypertrophy ↑↑↑↑
total peripheral resistance ↑↑↑↑
high wall tension(cardiac hypertrophy)
cardiomyopathies, coronary artery disease and infarction

IINNTTRROODDUUCCTTIIOONN
4
As in this thesis WT and the specific signalling mechanism activated in EC and
SMC by this force are the major focus, the vascular response to acute and lasting
increases in WT will be shortly discussed. A critical point in this discussion will
be that actually little is known about specific WT-induced mechanotransduction in
EC and SMC and, hence, the early phase of WT-induced vascular remodelling.
1.3 Short term vs. chronic increases in wall tension A first line response of arteries to pressure-induced supra-physiological WT levels
is the release of vasoactive mediators such as the vasoconstrictor endothelin-1
(ET-1) from endothelial cells aimed at offloading the overt mechanical strain by
active vasoconstriction (Schiffrin 1999). However, when this initial response is
insufficient, i.e., local regulation of the vascular tone cannot be reinstated against
the high transmural pressure, a next phase is initiated. Then, the lasting WT-
induced release of ET-1 and many other trophic factors released from EC as well
as SMC such as chemokines like IL-8 or MCP-1 (Yue 1994; Porecca 1997), or
platelet-derived growth factor (Kida 2010) cause the above mentioned pressure-
induced remodelling process. However, what is the switch from constriction to
remodelling? What is the initial signal?
1.4 Known molecular mediators of wall tension-induced signalling Wall tension is basically a tensile force which is experienced as stretch exerted at
the cellular level. Therefore, stretch will further on be used synonymous to wall
tension.
1.4.1 Stretch-induced transcription factors and pro-inflammatory gene expression in endothelial and smooth muscle cells
As mentioned above, chronic increases in cyclic stretch possess a marked pro-
inflammatory component and, thus, promote the expression of several pro-
inflammatory gene products such as vascular endothelial growth factors (VEGF;
Black 2004), cell adhesion molecules (ICAM-1, VCAM-1; Sung 2007) and
chemokines (interleukin-8, MCP-1, Schepers 2006).
This change in pro-inflammatory gene expression has been thought to be mainly
caused by the activation of several kinases such as c-Jun N-terminal kinases and
p38 MAPK (mitogen activated protein kinase p38; Tsuda 2002; Li 2003). These
IINNTTRROODDUUCCTTIIOONN
5
and other kinases are known to activate transcription factors such as activator
protein-1 (AP-1), CAAT/enhancer binding protein (C/EBP) or nuclear factor-κB
(NF-κB) (Hishikawa 1997: Wagner 2000; De Martin 2000; Li 2003; Demicheva
2008). Indeed, the stretch-dependent activation of AP-1 is critical for the up-
regulation of preproET-1 gene expression, the precursor of ET-1 (Lauth 2000)
pointing towards a role of these common proliferation and inflammation-related
pathways in stretch-induced activation of vascular cells.
Another well defined factor in stretch-induced endothelial and smooth muscle cell-
signalling is NADPH oxidase, an enzyme that catalyses the formation of
superoxide anions (Molavi and Mehta, 2004). Superoxide anions and degradation
products of this reactive oxygen derivative, NO-derived peroxynitrite (Kawashima
and Yokoyama 2004) and hydrogen peroxide have all been implicated in stretch-
induced remodelling (Kinlay 2001; Libby 2007). Indeed, several of the above
mentioned transcription factors can be indirectly activated by these mediators
suggesting oxidative stress as a factor in stretch-induced gene expression and
phenotype changes in vascular cells. Nevertheless, NADPH-oxidase, most of the
transcription factors and gene products discussed above have been shown to be
activated and play a role in several cellular stress responses (Schiffrin 2003; Black
2004), especially in inflammation (Griendling 2000).
Thus, although principally the stretch-induced activation of these factors is not
controversial, all these factors are not specific for stretch or WT and cannot
explain the unique response of vascular cells to chronic stretch.
So, what specific stretch-induced factors are known?
1.4.2 Endothelin-1 (ET-1)
The local vasoconstrictor peptide ET-1 is secreted by endothelial cells in response
to increased WT (Yamasaki 1995, Sadoshima & Izumo 1997). It is expressed by
endothelial cells as a precursor peptide (preproET-1) that is first cleaved to bigET-
1 and then to the mature 21-amino acid peptide. Although the cellular mechanism
of action via two G protein-coupled receptors, ETA-R and ETB-R, appears to be
similar to systemic vasoconstrictors such as angiotensin II and norepinephrine, its
expression is controlled exclusively at the local level defining ET-1 as the major
local vasoconstrictor (Yanagisawa 1994; Salvator 2010). Besides its short-time
IINNTTRROODDUUCCTTIIOONN
6
vasoconstrictor effects, chronically increased ET-1 secretion has trophic effects on
SMC (Touyz 2004; Piechota 2010). Interestingly, ET-1 is able to induce cardiac
ANP release (Mäntymaa 1990, Shirakami 1993) linking these two stretch-
inducible autacoids together (see below).
1.4.3 Atrial natriuretic peptide (ANP)
ANP is known as the heart-derived hormone that is released by the atrial
cardiomyocytes in response to supra-physiological distension of the atria thus
stretch caused by hypervolemia. The stretch-sensing cells seem to be the atrial
endothelial cells (Mäntymaa 1990, Shirakami 1993) which, in response to that
stimulus release ET-1. ET-1, in turn, seems to bind to myocyte ETA-R (Thibault
1994) which, then, causes ANP secretion (Taskinen 2000). The increased
secretion of ANP results in reduced sodium (Na+) and water retention by
increasing the rate of glomerular filtration, inhibiting sodium re-absorption by the
kidney (natriuresis) and decreasing hypothalamic release of the anti-diuretic
hormone/vasopressin. Consequently, the reduced salt/water re-absorption causes a
volume loss in this way helping to return blood volume, hence, atrial wall tension,
back to normal (Guyton & Hall 1996).
ANP, B-type natriuretic peptide (BNP) and C-type natriuretic peptide (CNP) are
the types of natriuretic peptides found in mammals. Natriuretic peptides bind to
three functionally distinct receptors, two membrane-bound guanylyl cyclases, GC-
A, GC-B, and NPR-C, a receptor coupled to trimeric G-proteins (Stults 1994;
Schulz 2005; Potter 2006). The physiological effects of natriuretic peptides are
mostly elicited through the cGMP formed by activation of the two guanylate
cyclase receptors and cGMP binding proteins namely the cGMP-dependent
effector-kinase PKG (Airhart 2003; Suga 1992). Whereas, ANP and BNP
preferentially bind to GC-A resulting in natriuresis and vasorelaxation effects in
vascular cells and epithelia (Potter 2006), CNP binds to GC-B resulting in growth
regulation in bone cells and fibroblasts (Chrisman 1999). All three peptides bind
to NPR-C which seems to mostly act as a clearance receptor by mediating
lysosomal degradation of all three natriuretic peptides (Garbers 1991; Cohen 1996;
Nussenzveig 1990).
Thus, ANP as ET-1 may be interesting for stretch-induced signalling because of
two reasons: the peptide is known to have effects on EC and SMC and ANP is one

IINNTTRROODDUUCCTTIIOONN
7
of the factors known to be genuinely and specifically released in response to
increases in wall tension/stretch.
1.4.4 Transient receptor potential channels (TRP channels)
TRP channels are a complex superfamily of non-selective cation channels which
are implicated in a wide range of functions from nociception to the vascular
myogenic response (Figure 4; Davis and Hill 1999; Minke 2002; Vennekens
2010). TRP channels have been found in many cell types, including both neuronal
cells, such as sensory and primary afferent neurons and non-neuronal tissues such
as vascular endothelial cells, epithelial cells, and smooth muscle cells.
Figure 4: Phylogenetic tree of the mammalian transient receptor potential (TRP) channel superfamily. The 28 mammalian TRP channels can be subdivided into six main subfamilies: TRPC (canonical), TRPM (melastatin), TRPV (vanilloid), TRPA (ankyrin), TRPP (polycystin), and TRPML (mucolipin; adapted from Nilius 2007). TRP channels previously characterised to be expressed in EC and/or SMC are encircled in red.

IINNTTRROODDUUCCTTIIOONN
8
TRP channel structure
The structure of TRP channels relates them to the superfamily of voltage-gated
channel proteins characterised by six transmembrane segments (S1-S6), a pore
region (between S5 and S6), and a voltage sensor. The N-terminus of several
members of the TRP channel family exhibits ankyrin domains and a coiled-coil
domain. The cytosolic C-terminus domain, depending on the TRP subfamily, may
display phosphoinositide (PIP2) and/or calmodulin-binding (CAM) domains. In
addition, the C-terminal domain may also exhibit a TRP domain that contributes to
the association of several single receptor molecules which may build up a “super-
channel” (Minke 2002; Figure 5). The molecular domains that are conserved in all
members of the TRP family constitute parts of the transmembrane domains and in
most members also the ankyrin-like repeats. All of the above features suggest that
members of the TRP family are multifunctional “special assignment” channels,
which are recruited to diverse signalling pathways (Cases and Montiel 2007).
Figure 5: Molecular structure of TRP channels. The Figure displays a membrane domain composed of six transmembrane segments (S1–S6) with an amphipathic region between the fifth and sixth segment that forms the channel conductive pore. The additional domains shown are discussed in the text.
TRP channels in mechanotransduction
TRPM3 was found to be activated by hyper osmotic (“swelling”) stimuli when it
was first characterised and it has been suggested to have a role in calcium
homeostasis because of its high calcium conductance (Grimm 2003). TRPV1 has
been implicated in controlling the response of the bladder urothelium to stretch
and TRPV1 knockout mice have defects in bladder voiding (Birder 2002), a

IINNTTRROODDUUCCTTIIOONN
9
process largely controlled by WT of the bladder. TRPC3 and TRPC6, along with
TRPV2 and TRPM4, are implicated in mediating the arterial myogenic response, a
major WT-controlled mechanism by which arteries rapidly compensate sudden
increases in perfusion pressure (Davis 1999). Knockdown of these TRP channel
genes in vascular SMC decreases the mechanically responsive current that is
observed in response to experimentally stretching of these cells (Welsh 2002;
Dietrich 2005).
TRPM7 has also been implicated in mechanosensing in native vascular SMC at
higher pressures (Oancea 2006). However, although involved in the specific
response to stretch in several cell types, up to now it is not clear whether TRP
channels are real mechanosensors or are only indirectly activated by stretch.
Endothelial TRP channels
Several members of the TRP superfamily have been identified and characterised in
the endothelium (for review see Nilius 2007). TRPC1, C4, C6, and M7 have been
linked to endothelial barrier dysfunction and perturbed angiogenic processes,
TRPC3, C4, M2, and M7 have been suggested to be responsible for oxidative
damage and cell death. TRPM2 mediates H2O2-induced increases in endothelial
permeability through activation of calcium entry (Dietrich 2008; Hecquet 2008).
TRPA1 has been implicated as a player in endothelium-dependent vasorelaxation
via activation of the endothelial NO synthase (Earley 2009).
1.4.5 Specific versus non-specific vascular stretch-signalling
Thus, the response of EC and SMC to supra-physiological stretch includes several
non-specific stress-responses (1.4.1). These signalling pathways may play a role in
later phases of vascular remodelling or may be activated by (a) specific response-
pathway(s). However, it is difficult to imagine how these (mostly pro-
inflammatory) stress-pathways can be responsible for the onset of pressure-
induced vascular remodelling. On the other hand, not many really specific stretch-
response factors are known or, at least, suspected (1.3.2 to 1.3.4). Moreover, these
molecules do not necessarily act together.
In this context, the focal adhesion protein zyxin was identified as a highly specific
transducer of a stretch-stimulus to the nucleus of SMC (Cattaruzza 2004) and EC
IINNTTRROODDUUCCTTIIOONN
10
(Wojtowicz 2010 and doctoral thesis of Agnieszka Wojtowicz, Heidelberg, 2008).
Moreover, focal adhesion complexes have been shown to integrate a multitude of
signal transduction cascades leading to functional changes within the cell
(Christopher 2004; Samarel 2005; Lehoux 2006). Using zyxin as the first specific
mechanotransducer characterised in EC and SMC, it may be possible to
characterise the stretch-induced signalling cascade in these cells.
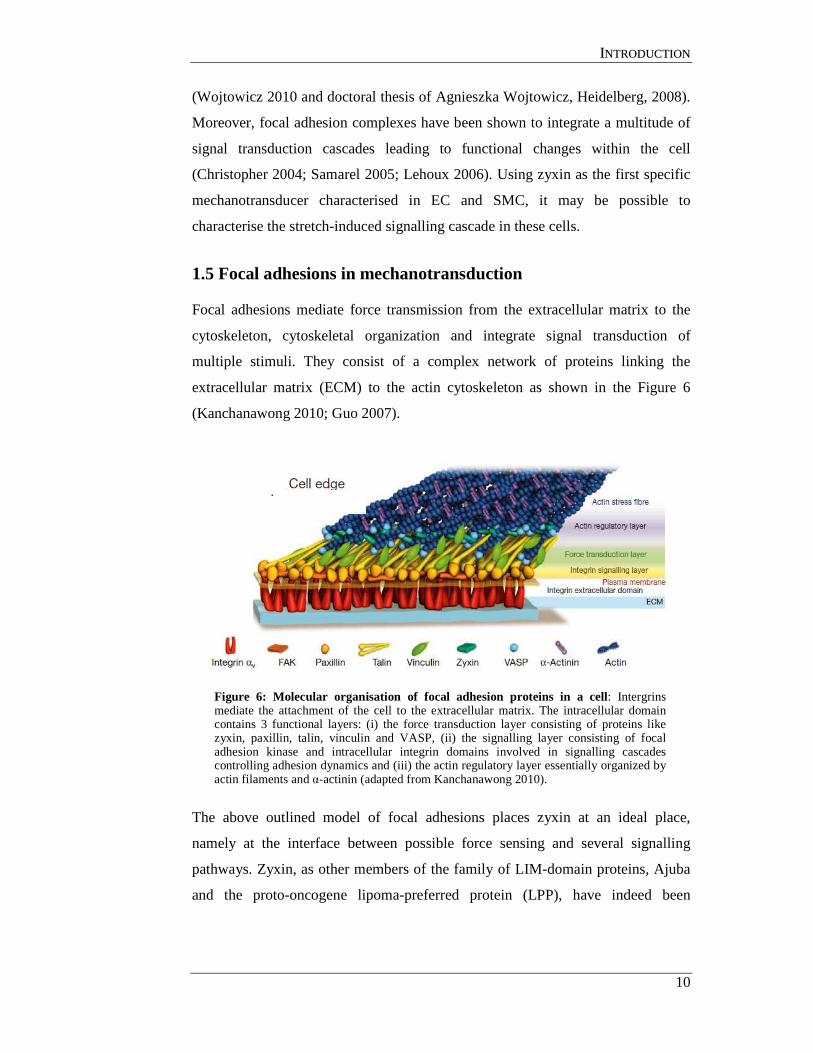
1.5 Focal adhesions in mechanotransduction
Focal adhesions mediate force transmission from the extracellular matrix to the
cytoskeleton, cytoskeletal organization and integrate signal transduction of
multiple stimuli. They consist of a complex network of proteins linking the
extracellular matrix (ECM) to the actin cytoskeleton as shown in the Figure 6
(Kanchanawong 2010; Guo 2007).
Figure 6: Molecular organisation of focal adhesion proteins in a cell: Intergrins mediate the attachment of the cell to the extracellular matrix. The intracellular domain contains 3 functional layers: (i) the force transduction layer consisting of proteins like zyxin, paxillin, talin, vinculin and VASP, (ii) the signalling layer consisting of focal adhesion kinase and intracellular integrin domains involved in signalling cascades controlling adhesion dynamics and (iii) the actin regulatory layer essentially organized by actin filaments and α-actinin (adapted from Kanchanawong 2010).
The above outlined model of focal adhesions places zyxin at an ideal place,
namely at the interface between possible force sensing and several signalling
pathways. Zyxin, as other members of the family of LIM-domain proteins, Ajuba
and the proto-oncogene lipoma-preferred protein (LPP), have indeed been

IINNTTRROODDUUCCTTIIOONN
11
discussed to be involved in signalling processes due to their domain structure
(Beckerle 1997; Kanungo 2000; Petit 2000).
1.6 Structure of zyxin Zyxin is a zinc-binding phospho-protein originally identified in chicken fibroblasts
as a protein associated with the actin cytoskeleton, cell-cell adherens junctions and
integrins at sites of cell–substratum attachment (Macalma 1996; Reinhard 1999;
Rottner 2001). A proline-rich region of zyxin mediates its association with α-
actinin, three consecutive actA-domains interact with proteins of the Ena/VASP
family that are important for the assembly and integrity of the actin cytoskeleton.
At the C-terminus of zyxin three specific zinc finger structures, LIM domains,
have been characterised. These domains have been shown to participate in specific
protein–protein interactions, signal transduction and may also have the capacity to
bind nucleic DNA (Figure 7; Wang and Gilmore 2003, Nix 1997). The functional
nuclear export signal in the conserved leucine-rich region of zyxin (corresponding
to the amino acids 322-331) is required to exclude zyxin from the nucleus (Nix
1997). Zyxin and its partners have been implicated in the spatial control of actin
filament assembly as well as in pathways important for cell differentiation
(Reinhard 1999). Thus, zyxin displays a tandem array of domains that mediate
protein-protein interactions (Schmeichel and Beckerle, 1994).
Figure 7: Molecular structure of zyxin indicating different domains required to interact with other focal adhesion proteins such as VASP. Zyxin is composed of three C-terminal zinc finger containing LIM domains, a proline-rich N-terminal region and at least one nuclear export signal (Nix 1997; taken from the doctoral thesis of Agnieszka Wojtowicz, Heidelberg, 2008).
αααα-actinin C N actA actA actA
L I
M
L I M
L I
M
V A S P
V A S P
V A S P
actin polymerization
IINNTTRROODDUUCCTTIIOONN
12
1.7 Zyxin in vascular mechanotransduction
Several expression constructs of zyxin missing the nuclear export signal were
found to shuttle between focal adhesions and the nucleus when overexpressed in
chicken fibroblasts (Nix 1997). In cardiomyocytes, zyxin as whole protein is
capable of translocating into the nucleus (Kato et al, 2005).
For a signalling protein to be a specific transducer of WT (i) the molecule must be
associated with the actual sensor for WT, e.g. integrin-containing structures like
focal adhesions, (ii) this ‘mechanotransducer’ has to be sensitive to activation and
capable of transducing the signal, i.e. an increase in WT must lead to a signal to
the cell nucleus and (iii) a specific mechanotransducer should orchestrate the first
steps in adapting the cellular phenotype to the altered haemodynamic situation.
Zyxin in response to stretch is phosphorylated (doctoral thesis of Agnieszka
Wojtowicz, Heidelberg, 2008) and enters the nucleus in its phosphorylated state in
order to regulate the expression of several stretch-induced gene products.
Therefore, the protein fulfils the above criteria to be a true mechanotransducer
(Cattaruzza 2004; doctoral thesis of Agnieszka Wojtowicz, Heidelberg, 2008,
Wojtowicz 2010).
1.8 Aims of the project
Zyxin is a specific mechanotransducer protein in EC and SMC. Using zyxin
activation and zyxin-induced gene expression in stretched EC and SMC as
functional read-outs, the following questions have been addressed to elucidate the
specific mechanotransduction pathway in EC and SMC in which zyxin is
implicated:
1. Additionally, what is the mechanism through which zyxin alters gene
expression in these cells.
2. What is the causal chain of events leading to wall tension-induced zyxin
activation in EC?
3. Which is the amino acid residue in zyxin that is phosphorylated during
wall tension/stretch?

MMAATTEERRIIAALLSS
13
2. MATERIALS
2.1 Synthetic oligonucleotide primers for PCR Synthetic oligonucleotides used for cloning, chromatin immunoprecipitation
(ChIP) and for real time (r.t.) RT-PCR and genotype analysis are listed in table 1
along with Fragment size/position and gene identification numbers (Gene ID).
Oligonucleotides were dissolved in water to a final concentration of 1 nmol/µl.
Table 1. Synthetic oligonucleotide primers
Gene product Sequence (5’- 3’)
Official Symbol/ Gene ID position (size)
Calponin (RT-PCR)
GAGGAGGGAAGAGTGTGCAG GTTGGCCTCAAAAATGTCGT
CNN1/ID: 1264 72/491 (420 bp)
Clusterin (CLU) (ChIP)
ACCAAACGTGGATCTGCAAG GTTGTGGGCACTGGGAGG
NC_000008.10 81/-632 (713 bp)
Endothelin-1 (ET-1) AGCCGGCAGAGAGCTGTCCA GAGAAGGCAGCGAGCGGAGC
NM_001955.3 42/170 (129 bp)
e-Selectin CGCCATCCCTCAGCCTCAGA GGCCCCTGCAACGTGAAACT
NM_011345.2 1054/1170 (117 bp)
ET-1 (ChIP) CCGCGTGCGCCTGCAGAC TCATGAGCAAATAATCCATTC
NC_000006.11 19/-202 (221 bp)
ET-1 receptor B type (ETB-R)
TCCCACTGGCGCGCAAACTT GGTCAGCTGCCCGAGCCAAG
NM_001122659.1 70/171 (102 bp)
GAPDH (RT-PCR, all species)
TCACCATCTTCCAGGAGCG CTGCTTCACCACCTTCTTGA
GAPDH/ID: 2597 273/844 (582 bp)
Glyceraldehyde dehydrogenase (GAPDH) (r.t. RT-PCR)
GACCACAGTCCATGCCATCACTGC ATGACCTTGCCCACAGCCTTGG
GAPDH/ID: 2597 627/764 (138 bp)
guanylate cyclase-1β (Gucy1B3) (ChIP)
AGGCACTGGAGCGCAGCAGC CATGGTGTCTGCACCGGGGAG
NC_000004.11 2/-275 (277 bp)
hairy/enhancer-of-split related (HEY-1)
TGAGAAGCAGGTAATGGAGC AAGTAACCTTTCCCTCCTGC
NM_012258.3 440/550 (111 bp)
Hemicentin GATGTGCTAGTTCCACCCAC ATATCAGGAAAGGGAGTGCC
NM_031935.2 4568/4683 (115 bp)
Hemicentin (ChIP)
GTAGGATTCAAACTGCTCAG CTCTCAGCCCACAACTCGGC
NC_000001.10 -776/-1146 (371 bp)
Hey-1 (ChIP)
CTGGTGGCCACTGTGGACG CTCTGTCCAGCCTGCACTC
NC_000008.10 -395/-991 (597 bp)
HMG-CoA reductase HMGCR (ChIP)
CATTTCAGAGAGAATCCAG CAGTAGGAGGCAGTGATAG
NC_000005.9 -657/-957 (301 bp)
ICAM-1 (ChIP) GTGCATGAGCCTGGGTTC GGCGTCCTCTCTCTACAC
NC_000019.9 -699/-1043 (345 bp)
Inter-Cellular Adhesion Molecule 1 (ICAM-1)
TGATGGGCAGTCAACAGCTA GGGTAAGGTTCTTGCCCACT
NM_000201.2 610/716 (107 bp)
Interleukin-6 (CXCL-6; Chemokine CXC ligand6) (RT-PCR; mouse)
CTGATGCTGGTGACAACCACGG TTAAGCCTCCGACTTGTGAAGTGGT
IL6/ID: 16193 20/134 (115 bp)
Interleukin-8 (r.t. RT-PCR; human)
TAGCCAGGATCCACAAGTCC GCTTCCACATGTCCTACAA
IL8/ID: 3576 879/995 (117 bp)

MMAATTEERRIIAALLSS
14
Gene product Sequence (5’- 3’)
Official Symbol/ Gene ID position (size)
JAM-2 (ChIP)
CTCAGCTTCGCCCGTTGGGC CTCTGAGGAGGTCGAGGGTC
NC_000021.8 -24/-623 (600 bp)
Junctional adhesion molecule -2 (JAM2)
ATCCGGATCAAAAATGTGAC GCTGGAGCCACTAATACTTCC
NM_021219.2 825/949 (125 bp)
Laminin-γ ATCTGATGGACCAGCCTCTC CCTCTCTTCCAGCTCTGACA
NM_005562.2 3634/3758 (125 bp)
Matrix Metalloproteinase-3 (MMP-3;RT-PCR, mouse)
TGGGAGGAGGTGACCCCACT AGCCAAGACTGTTCCAGGCCC
Mmp3/ID: 17392 423/548 (126 bp)
Mice NEO zyxin (genotyping) GACCGCTTCCTCGTGCTTTAC TGGACGAAGTTTCCGTGTGTTG
ZYX/ID: 7791 N.A (473 bp)
Mice TRPC3 Knockout (genotyping)
GAATCCACCTGCTTACAACCATGTG GGTGGAGGTAACACACAGCTAAGCC
TRPC3/ID: 7222 N.A (300 bp)
Mice TRPC6 Knockout (genotyping)
ACGAGACTAGTGAGACGTGCTACTTCC GGGTTTAATGTCTGTATCACTAAAGCCTCC
TRPC6/ID: 7225 N.A (339 bp)
Mice WT TRPC3 (genotyping)
GCTATGATTAATAGCTCATACCAAGAGATC GGTGGAGGTAACACACAGCTAAGCC
TRPC3/ID: 7222 N.A (300 bp)
Mice WT TRPC3 (genotyping)
GAATCCACCTGCTTACAACCATGTG GGTGGAGGTAACACACAGCTAAGCC
TRPC3/ID: 7222 N.A (800 bp)
Mice WT TRPC6 (genotyping)
CAGATCATCTCTGAAGGTCTTTATGC TGTGAATGCTTCATTCTGTTTTGCGCC
TRPC6/ID: 7225 N.A (234 bp)
Mice WT zyxin (genotyping) TACAAGGGCGAAGTCAGGGCGAGTG TGGACGAAGTTTCCGTGTGTTG
ZYX/ID: 7791 N.A (327 bp)
Thrombomodulin (RT-PCR, mouse)
ATGAACCCAGATGCCTCTGCCC ATGCTCGCAGAGTTCGTTGCAC
Thbd/ID: 21824 771/871 (101 bp)
Transient Receptor Potential Channel (Canonical) 3- TRPC3 (RT-PCR)
GATCTGGAATCAGCAGAGCC GTTGGGATGAGCCACAAACT
TRPC3/ID: 7222 871/988 (108 bp)
TRPC4 (RT-PCR)
CAGGCTGGAGGAGAAGACAC GACCTGTCGATGTGCTGAGA
TRPC4/ID: 7223 1191/1404 (214 bp)
TRPC5 (RT-PCR)
GACAGCCTGCGCCACTCTCG GAGCTCCCAGCCCAGACGGA
TRPC5/ID: 7224 1481/1600 (120 bp)
TRPC6 (RT-PCR)
TTTGCTGAAGCAAGAGGTT TGGAGTCACATCATGGGAGA
TRPC6/ID: 7225 981/1091 (111 bp)
TRPC7 (RT-PCR)
CGAGCTGAAGGAAATCAAGC CTTGTTCACCCTCAGGTGGT
TRPC7/ID:57113 2295/2448 (154 bp)
TRPV4 (RT-PCR)
CGGATTCCAGCGAAGGCCCC CGGTGAGGGCGAAAGGGAGC
TRPV4/ID:59341 36/184(149 bp)
Vascular cell Adhesion Molecule (VCAM-1)
CATGGAATTCGAACCCAAACA GACCAAGACGGTTGTATCTCTGG
NM_001078.2 1593/1674 (82 bp)
VCAM-1 (ChIP)
GATTCCAGACCTCAGCTATG GTATTCAGCTCCTGAAGCC
NC_000001.10 -77/-1430 (1506 bp)
Zyxin (Full length cDNA)
CAGCCCGGCCCGGCCATGGC CTGAAGAGGGCCTGTCCTCACTCAGGT
ZYX/ID: 7791 143-1895 (1753)
Zyxin (S142G)
CAGGGAGAAGGTGGGCAGTATTGATTTG CAAATCAATACTGCCCACCTTCTCCCTG
ZYX/ID: 7791 566 N.A.
Zyxin (S142D)
CAGGGAGAAGGTGGACAGTATTGATTTG CAAATCAATACTGTCCACCTTCTCCCTG
ZYX/ID: 7791 566 N.A.
Zyxin (S142E)
CAGGGAGAAGGTGGAGAGTATTGATTTG CAAATCAATACTCTCCACCTTCTCCCTG
ZYX/ID: 7791 566 N.A.
Zyxin (S344A)
AACCAGGTGCGCGCCCCTGGGGCCC GGGCCCCAGGGGCGCGCACCTGGTT
ZYX/ID: 7791 1173 N.A.
Zyxin (S344D)
AACCAGGTGCGCGACCCTGGGGCCC GGGCCCCAGGGTCGCGCACCTGGTT
ZYX/ID: 7791 1173 N.A.
Zyxin (S344E)
AACCAGGTGCGCGAGCCTGGGGCCC GGGCCCCAGGCTCGCGCACCTGGTT
ZYX/ID: 7791 1173 N.A.
Zyxin (T352A)
CCAGGGCCCCTGGCTCTGAAGGAGGTG CACCTCCTTCAGAGCCAGGGGCCCTGG
ZYX/ID: 7791 1197 N.A.
Zyxin (T352D)
CCAGGGCCCCTGGATCTGAAGGAGGTG CACCTCCTTCAGATCCAGGGGCCCTGG
ZYX/ID: 7791 1197 N.A.
Zyxin (r.t. RT-PCR, human)
CTGTCCTCACTGCTGGATG GAGTTGGACCTGAGGCTTG
ZYX/ID: 7791 609/867 (259 bp)
MMAATTEERRIIAALLSS
15
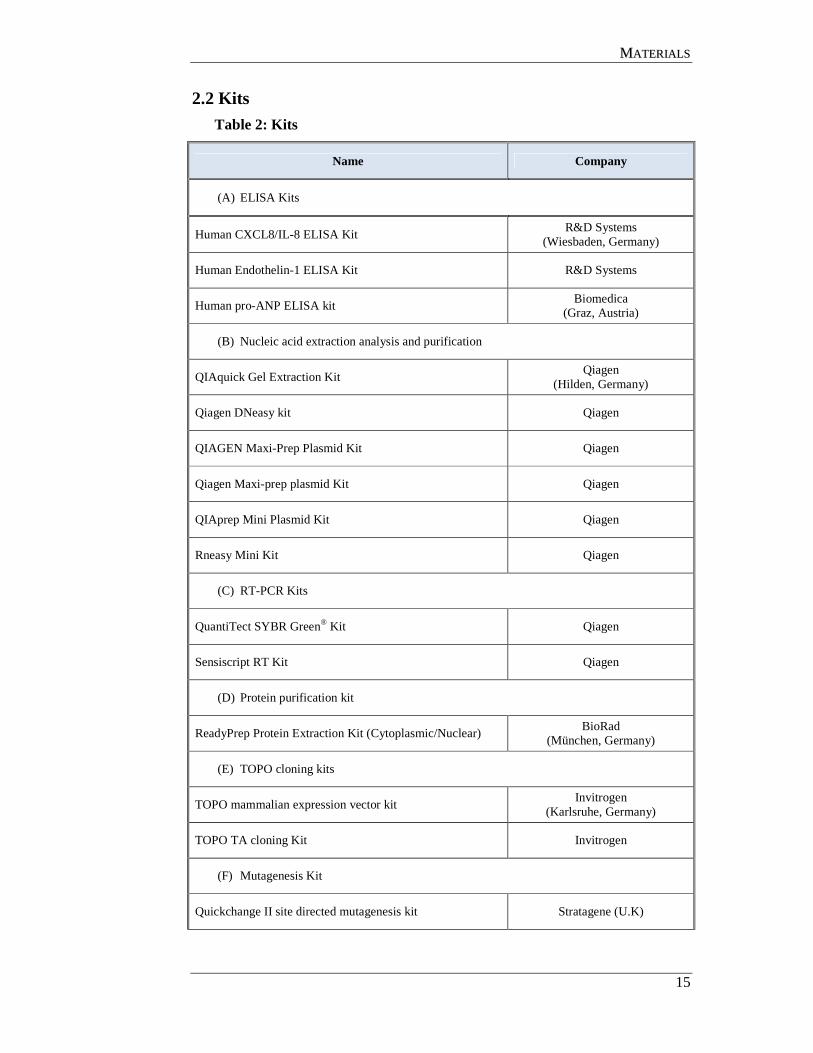
2.2 Kits
Table 2: Kits
Name Company
(A) ELISA Kits
Human CXCL8/IL-8 ELISA Kit R&D Systems
(Wiesbaden, Germany)
Human Endothelin-1 ELISA Kit R&D Systems
Human pro-ANP ELISA kit Biomedica
(Graz, Austria)
(B) Nucleic acid extraction analysis and purification
QIAquick Gel Extraction Kit Qiagen
(Hilden, Germany)
Qiagen DNeasy kit Qiagen
QIAGEN Maxi-Prep Plasmid Kit Qiagen
Qiagen Maxi-prep plasmid Kit Qiagen
QIAprep Mini Plasmid Kit Qiagen
Rneasy Mini Kit Qiagen
(C) RT-PCR Kits
QuantiTect SYBR Green® Kit Qiagen
Sensiscript RT Kit Qiagen
(D) Protein purification kit
ReadyPrep Protein Extraction Kit (Cytoplasmic/Nuclear) BioRad
(München, Germany)
(E) TOPO cloning kits
TOPO mammalian expression vector kit Invitrogen
(Karlsruhe, Germany)
TOPO TA cloning Kit Invitrogen
(F) Mutagenesis Kit
Quickchange II site directed mutagenesis kit Stratagene (U.K)

MMAATTEERRIIAALLSS
16
Name Company
(G) DNA and Protein Standards/Markers
DNA standards- O’GeneRulerTM DNA Ladder Fermentas (Germany)
Protein standard – Precision Plus ProteinTM standards (Dual colour)
Biorad
2.3 Bacterial strains and plasmids Bacterial strains and plasmid vectors used for cloning and maintenance of
plasmids constructs are listed in Table 3 and 4.
Table 3: Plasmids
Vector Characteristic Source
pCR 2.1-TOPO
3.9 kb
pUC origin, lacZα reporter fragment; T7 promoter/priming site, f1 origin; ampiciline resistance ORF; kanamycin resistance ORF
Invitrogen
(Karlsruhe, Germany)
pcDNA 6.2/N-
EmGFP/YFP
TOPO 5.9 kb
N-terminal GFP expression vector. pUC origin, CMV promoter/priming site, f1 origin; ampiciline resistance ORF
Invitrogen
pcDNA 6.2/C-
EmGFP/YFP
TOPO 5.8 kb
C-terminal GFP expression vector. pUC origin, CMV promoter/priming site, f1 origin; ampiciline resistance ORF
Invitrogen
Table 4: Chemically competent E. coli cells
Bacterial cells Genotype Source
One Shot TOP10F´ mcrA ∆(mrr-hsdRMS-mcrBC) Φ80lacZ∆M15 ∆lacX74 recA1 araD139 ∆(ara-leu)7697 galU galK rpsL endA1 nupG
Invitrogen (Karlsruhe, Germany)

MMAATTEERRIIAALLSS
17
2.4 Cell culture Table 5: Cell culture media, buffers, antibiotics and supplements
Name of product Company
Collagenase Sigma Aldrich
(Steinheim, Germany)
Dispase Böhringer
(Mannheim, Germany)
D-MEM + GlutaMAX-I Invitrogen
(Karlsruhe, Germany)
Endothelial cell growth medium Promocell
(Karlsruhe, Germany)
Endothelial cell growth supplement (ECGS) Promocell
FBS Invitrogen
Gelatine Sigma Aldrich
Hank’s BSS PAA
(Cölbe, Germany)
M199 + GlutaMAX-I Invitrogen
OPTIMEM I Promocell
Penicillin Invitrogen
SMC growth media Promocell
Streptomycin Invitrogen
Supplemental Mix Promocell
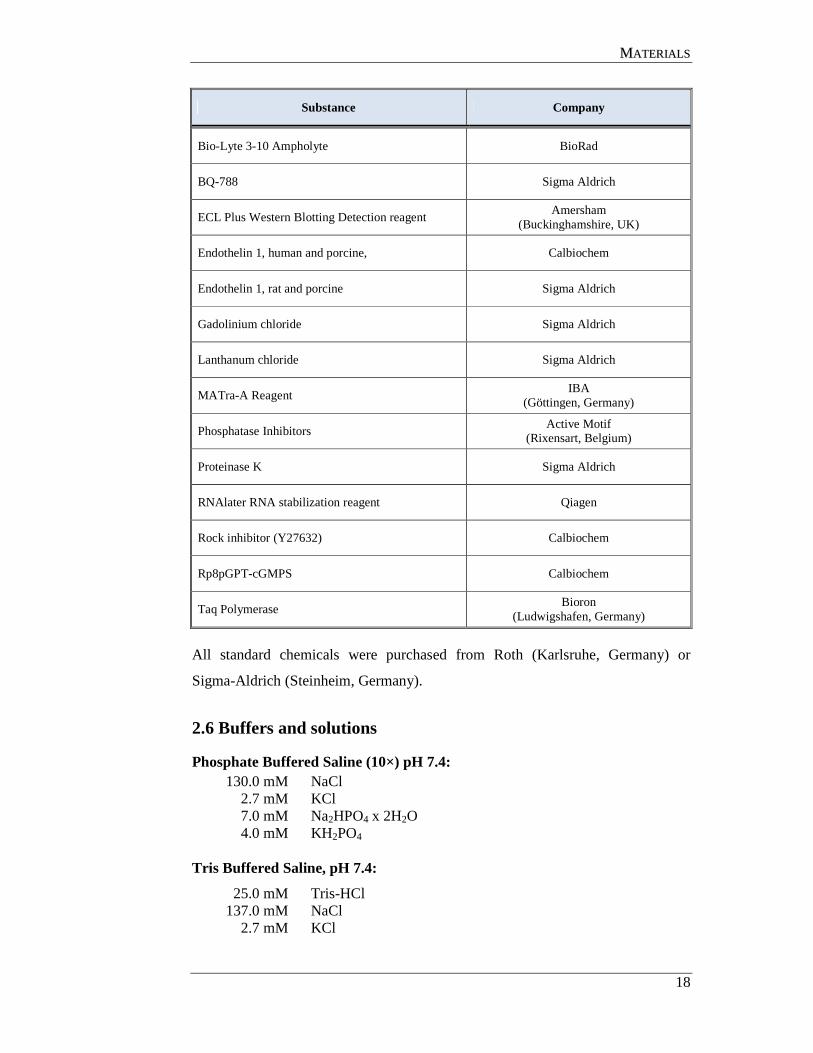
2.5 Reagents
Table 6: Regularly used reagents and substances
Substance Company
®-(-)Phenylephrine hydrochloride Sigma Aldrich
Acetylcholine chloride, minimum 99% TLC Sigma Aldrich
Atrial Natiuretic Factor 1-28, human Calbiochem
MMAATTEERRIIAALLSS
18
Substance Company
Bio-Lyte 3-10 Ampholyte BioRad
BQ-788 Sigma Aldrich
ECL Plus Western Blotting Detection reagent Amersham
(Buckinghamshire, UK)
Endothelin 1, human and porcine, Calbiochem
Endothelin 1, rat and porcine Sigma Aldrich
Gadolinium chloride Sigma Aldrich
Lanthanum chloride Sigma Aldrich
MATra-A Reagent IBA
(Göttingen, Germany)
Phosphatase Inhibitors Active Motif
(Rixensart, Belgium)
Proteinase K Sigma Aldrich
RNAlater RNA stabilization reagent Qiagen
Rock inhibitor (Y27632) Calbiochem
Rp8pGPT-cGMPS Calbiochem
Taq Polymerase Bioron
(Ludwigshafen, Germany)
All standard chemicals were purchased from Roth (Karlsruhe, Germany) or
Sigma-Aldrich (Steinheim, Germany).
2.6 Buffers and solutions
Phosphate Buffered Saline (10×) pH 7.4: 130.0 mM NaCl 2.7 mM KCl 7.0 mM Na2HPO4 x 2H2O 4.0 mM KH2PO4
Tris Buffered Saline, pH 7.4:
25.0 mM Tris-HCl 137.0 mM NaCl 2.7 mM KCl

MMAATTEERRIIAALLSS
19
2.7 Microbiological media
Luria-Bertani (LB) Medium, pH 7.0:
1.0 % (w/v) Bacto-tryptone 0.5 % (w/v) Yeast extracts 1.0 % (w/v) NaCl
LB-Agar Plates:
1.0 % (w/v) Bacto-tryptone 0.5 % (w/v) Yeast extracts 1.0 % (w/v) NaCl 1.5 % (w/v) Agar
The Luria-Bertani medium was prepared with distilled water, autoclaved and
stored at room temperature. LB agar was melted at 50°C using a microwave and
the temperature was brought down to 37°C. The warm media were supplemented
with 50 µg/ml ampicillin and poured into Petri dishes. The dishes were stored at
4°C.
2.8 Small interfering RNAs Table 7: siRNA target sequences constructed by Qiagen
siRNA Target sequence Source
Hs_ZYX_1_HP Validated
AAG GTG AGC AGT ATT GAT TTG Qiagen
(Hilden, Germany)
All Stars Negative Control (scrambled siRNA)
N/A Qiagen

MMAATTEERRIIAALLSS
20
2.9 Antibodies Table 8: Primary antibodies: WB: antibodies used for Western blot, ICC: antibodies used for Immunocytochemistry, IHC: antibodies used for Immunohistochemistry,
Primary antibody and specification
Use Dilution Source
Mouse anti-human eNOS /NOS-3
WB 1:1000 BD Transduction
Laboratories (California, USA)
Rat anti-mouse CD31 clone MEC 13.3, polyclonal
IHC 1:25 Santa Cruz
Biotechnology (Heidelberg, Germany)
Mouse anti - β-actin WB 1:5000 Sigma Aldrich
Rabbit anti-human B72 LH-ZyxinPLAG (against peptide CDFPLPPPPLAGDGDDAEGAL, zyxin amino acids 70 to 89)
WB/ICC/IHC 1:2500/1:250
Mary Beckerle, (Huntsman Cancer Research Centre,
University of Utah) Rabbit anti-human B71 LH-ZyxinNES (against peptide CSPGAPGPLTKEVEELEQLT, zyxin amino acids 344 to 363)
ICC/IHC 1:250
Mary Beckerle, Huntsman Cancer Research Centre,
University of Utah
Mouse anti-human Atrial Natiuretic Peptide, monoclonal
ICC 1:50 Chemicon Europe (Hampshire, UK)
Mouse anti- Paxillin (165 Paxillin,monoclonal)
WB/ICC 1:1000/1:100 BD Transduction
Laboratories
Mouse anti- Vinculin (SPM227, monoclonal)
ICC 1:100 Abcam
Mouse anti-smooth muscle actin (1A4, asm-1,monoclonal)
ICC 1:50 Dianova
Mouse anti-Zyxin 164 ID4 ICC 1:100
Mary Beckerle, Huntsman Cancer Research Centre,
University of Utah Rabbit- Transient Receptor Potential Channel 3 (TRPC3, polyclonal)
WB 1:250 Alomone labs
Mouse anti-GAPDH (Clone GAPDH - 71.1, monoclonal)
WB 1:1000 Sigma
Mouse anti-human CD31 ICC 1:50 Dako
(Glostrup, Denmark)
Mouse anti-Ku80 (Ku15, monoclonal)
WB/ICC 1:1000/1:100 Novus biological (Cambridge, UK)
Sheep anti-TRPM6 (polyclonal) WB 1:300 Novus Biologicals

MMAATTEERRIIAALLSS
21
Table 9: Regularly used secondary antibodies WB: antibodies used for Western blot, ICC: antibodies used for Immunocytochemistry, IHC: antibodies used for Immunohistochemistry,
Secondary antibody and specification
Use Dilution Source
Cy2 donkey anti-mouse and anti-rat IgG
ICC 1:50 Jackson laboratories via
Dianova (Hamburg, Germany)
Cy3 donkey anti-rabbit IgG
ICC 1:50 Jackson laboratories via
Dianova (Hamburg, Germany)
Goat anti-rabbit IgG peroxidase
WB 1:5000 Sigma
Goat anti-mouse IgG peroxidase
WB 1:5000 Sigma
2.10 Mouse strains C57BL/6J mice were initially ordered from Charles River Laboratories, Sulzfeld,
Germany.
Table 10: Mouse strains
Strain Source
C57BL/6J Charles River Laboratories, Sulzfeld, Germany
C57BL/6J zyxin (-/-) null (line 185) Dr. Laura Hoffman and Prof. Mary Beckerle Huntsman Cancer Research Centre, University of Utah, Salt Lake City /JBF
TRPC3(-/-), TRPC6(-/-), TRPC3/C6 double knockout, TRPC1/C4/C5 triple knockout mice
Dr. Marc Freichel Experimental and Clinical Pharmacology and toxicology, University of Saarland, Homburg, Germany
GC-A (-/-) mice Prof. Michaela Kuhn Institute of Physiology, University of Würzburg, Germany
MMAATTEERRIIAALLSS
22
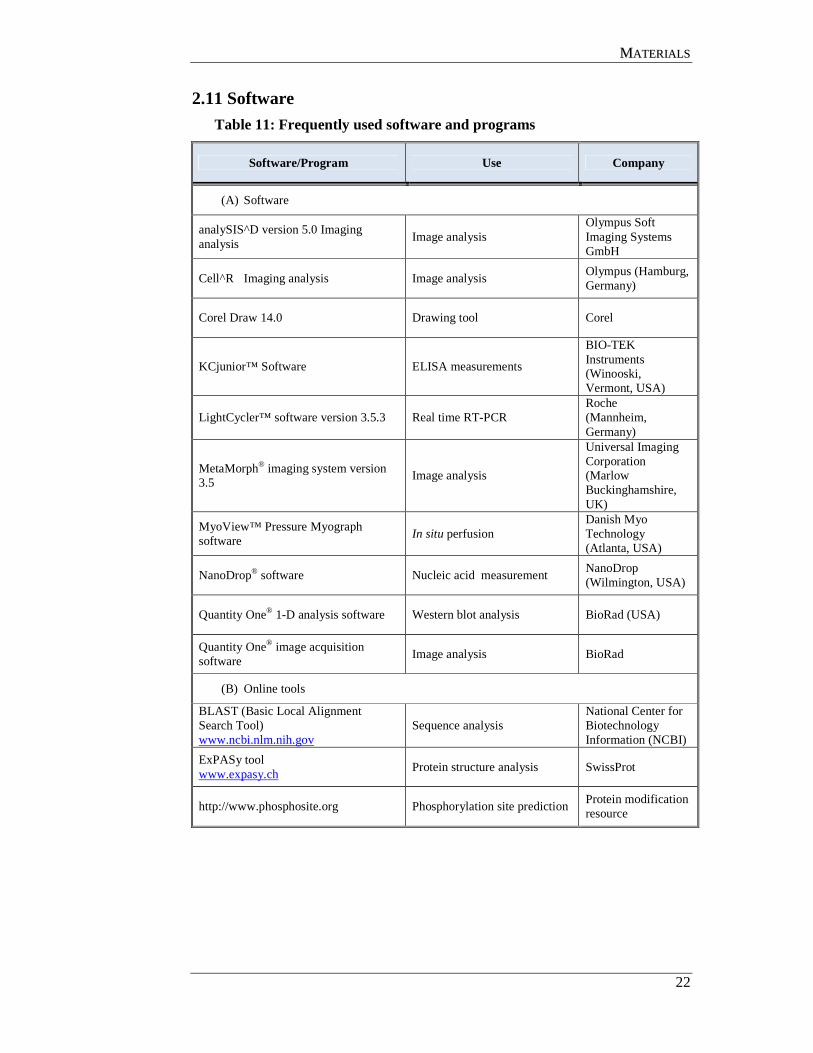
2.11 Software
Table 11: Frequently used software and programs
Software/Program Use Company
(A) Software
analySIS^D version 5.0 Imaging analysis
Image analysis Olympus Soft Imaging Systems GmbH
Cell^R Imaging analysis Image analysis Olympus (Hamburg, Germany)
Corel Draw 14.0 Drawing tool Corel
KCjunior™ Software ELISA measurements
BIO-TEK Instruments (Winooski, Vermont, USA)
LightCycler™ software version 3.5.3 Real time RT-PCR Roche (Mannheim, Germany)
MetaMorph® imaging system version 3.5
Image analysis
Universal Imaging Corporation (Marlow Buckinghamshire, UK)
MyoView™ Pressure Myograph software
In situ perfusion Danish Myo Technology (Atlanta, USA)
NanoDrop® software Nucleic acid measurement NanoDrop (Wilmington, USA)
Quantity One® 1-D analysis software Western blot analysis BioRad (USA)
Quantity One® image acquisition software
Image analysis BioRad
(B) Online tools
BLAST (Basic Local Alignment Search Tool) www.ncbi.nlm.nih.gov
Sequence analysis National Center for Biotechnology Information (NCBI)
ExPASy tool www.expasy.ch
Protein structure analysis SwissProt
http://www.phosphosite.org Phosphorylation site prediction Protein modification resource

MMEETTHHOODDSS
23
3. METHODS
3.1 Molecular techniques
3.1.1 Expression plasmids
Zyxin expression plasmids were constructed by sub-cloning the PCR amplified
fragment into EmGFP-Topo-vector. To enable directional cloning, primers were
designed for human Zyxin (the complete coding region from pos. 143 to pos. 1895
with a stop codon can be found in appendix) PCR was carried out at 94 ºC (90 s),
63 ºC (30 s), and 72 ºC (4 min) for 35 cycles. After amplification with Taq
polymerase, the fragment was cloned into the N-terminal GFP- fluorescing vector
(pcDNA 6.2/N-EmGFP/YFP TOPO 5.9 kb) using TOPO cloning reaction
according to the manufacturer's recommendations (TOPO mammalian expression
vector kit, Invitrogen).
3.1.2 Site-directed mutagenesis
Site-directed mutagenesis was performed to generate phoshorylation-resistant
mutants by converting serine to glycine/alanine (S142G/S344A/T352A). These
constructs were further converted to phosphorylation-mimetic mutants by
replacing a glycine or alanine residue by negatively charged residue such as
glutamate/aspartate (S142E/S344E/T352D). The primers used for mutagenesis is
listed in Table 1. The QuickChange II site directed mutagenesis kit was used
according to the manufacturer’s protocol (Strategene, UK). Briefly, for the mutant
strand synthesis, the expression plasmids were subjected to PCR with appropriate
primer pair containing the mutation of interest. The high fidelity DNA
polymerase, Pfu Turbo DNA polymerase was used to extend and incorporate the
mutagenic primers (Table 1). The reaction mixture as follows;
5 µl 10 × reaction buffer
50 ng dsDNA template
125 ng oligonucleotide primers carrying the mutation
1 µl of dNTP mix
50 µl ddH2O to a final volume
1 µl of Pfu Turbo DNA polymerase (2.5 U/µl)
The reaction mixture was then subjected to the PCR reaction (Table 12).

MMEETTHHOODDSS
24
Table 12: PCR program for site-directed mutagenesis
PCR step Temperature ( in °C) Time
Pre-denaturation 95°C 5 minutes
Denaturation 95°C 30 seconds
Annealing 55°C 1 minute 18
cycles
Synthesis 68°C
7 minutes
(1 minute/Kb of plasmid
length)
Following temperature cycling, the reaction was placed on ice for 2 minutes to
cool the reaction to ≤37°C. To digest all non-mutated parental supercoiled
dsDNA, 1 µl DpnI (10 U/µl) restriction enzyme was added to the amplification
reaction and incubated at 37 °C for 1 hour. The reaction was then used for the
transformation into the competent bacteria.
3.1.3 Plasmid cloning for RT-PCR standards
For the construction of specific real-time RT-PCR standards (ref 3.1.8), PCR
fragments were ligated into the pCR® TOPO 2.1 vector (3.9 Kb) using the TOPO
TA Cloning® Kit according to the manufacturer’s instructions. Plasmids
containing the inserts were amplified further (3.1.5.4).
3.1.4 TOPO cloning
TOPO cloning was used to clone the amplified DNA fragments in to the vectors.
Briefly, 2 µl of PCR product was mixed with 1 µl of the appropriate topo vector
and 1 µl salt solution (200 mM NaCl, 10 mM MgCl2) to prevent topisomerase I
from rebinding to DNA and to obtain higher transformation efficiency. The
mixture was diluted to a final volume of 6 µl and incubated on ice for 30 minutes
for ligation of the DNA to the topo vector. The reaction mixture was further taken
for transformation into competent bacteria.
3.1.4.1 Transformation of competent bacteria
2 µl of the reaction mixtures containing the topo vector with the fragment were
mixed with 20 µl of Top10FTM competent cells and incubated on ice for 30 min.
Thereafter, cells were subjected to the heat shock at 42°C for 40 s, and

MMEETTHHOODDSS
25
immediately placed on ice. 250 µl of SOC medium was added to the cells and the
suspension was incubated at 37°C for 1 h with shaking at 300 rpm. Sterile LB-agar
medium with 20 µg/ml of ampicillin in petri-dishes was pre-warmed to 37°C.
30 µl and 230 µl of transformed competent cells were plated onto the separate
petri-dishes. Plates were then incubated at 37°C overnight to allow bacterial
colonies to grow.
3.1.4.2 Plasmid mini/maxi-cultures and plasmid purification
Transformed colonies of Top10FTM competent cells were picked by using a sterile
pipette tip and added to 7 ml of LB Broth (with appropriate antibiotic) in 15 ml
falcon tubes. Caps of the falcon tubes were perforated to allow air to circulate
through the tube. These cultures were then incubated at 37°C with shaking
overnight. Plasmids grown in mini-cultures were purified using the QIAPrep®
Spin Miniprep Kit according to the manufacturer’s instructions.
200 µl of the mini-culture broth was then transferred in to 250 ml LB Broth (with
appropriate antibiotic) in 500 ml conical flasks for maxi culture. Plasmids grown
in maxi-cultures were purified using the QIAPrep® Maxiprep Kit according to the
manufacturer’s instructions. All clones were sequenced.
3.1.5 Polymerase chain reaction (PCR)
The polymerase chain reaction (PCR) is a sensitive and powerful technique used
to exponentially amplify a specific DNA sequence in vitro by using sequence-
specific synthetic oligonucleotides and a thermo-stable DNA-polymerase (Mullis
1983). This method was used for the amplification of cDNA for determination of
mRNA expression levels of stretch-inducible gene products.
3.1.6 Reverse transcription PCR (RT-PCR)
RT-PCR was performed to synthesize cDNA from RNA templates from cultured
cells. 0.5-2 µg of total RNA was mixed with RNase free water to a total volume of
13 µl. The mixture was heated to 70°C for 10 minutes following the addition of 1
µl of oligo (dT) 18 primer (10 pmol/µl) to facilitate hybrid formation of the oligo
dT-primers with polyA-tails of mRNA.
MMEETTHHOODDSS
26
For the first strand cDNA synthesis, the following was added to the mixture:
4 µl of 5x First strand buffer
1 µl of 0.1 M reverse transcriptase enzyme (RT)
1 µl of 10 mM dNTPs
The content of the tube was mixed and incubated at 42°C for 50 minutes. Then,
the reaction was inactivated by incubating the mixture at 70°C for 10 minutes, and
180 µl of RNase-free water was added to dilute the resulting cDNA. Sensiscript kit
(Qiagen) was used to generate cDNA from the isolated mouse arteries according
to the manufacturer’s instructions. These samples were further used for the PCR
reactions.
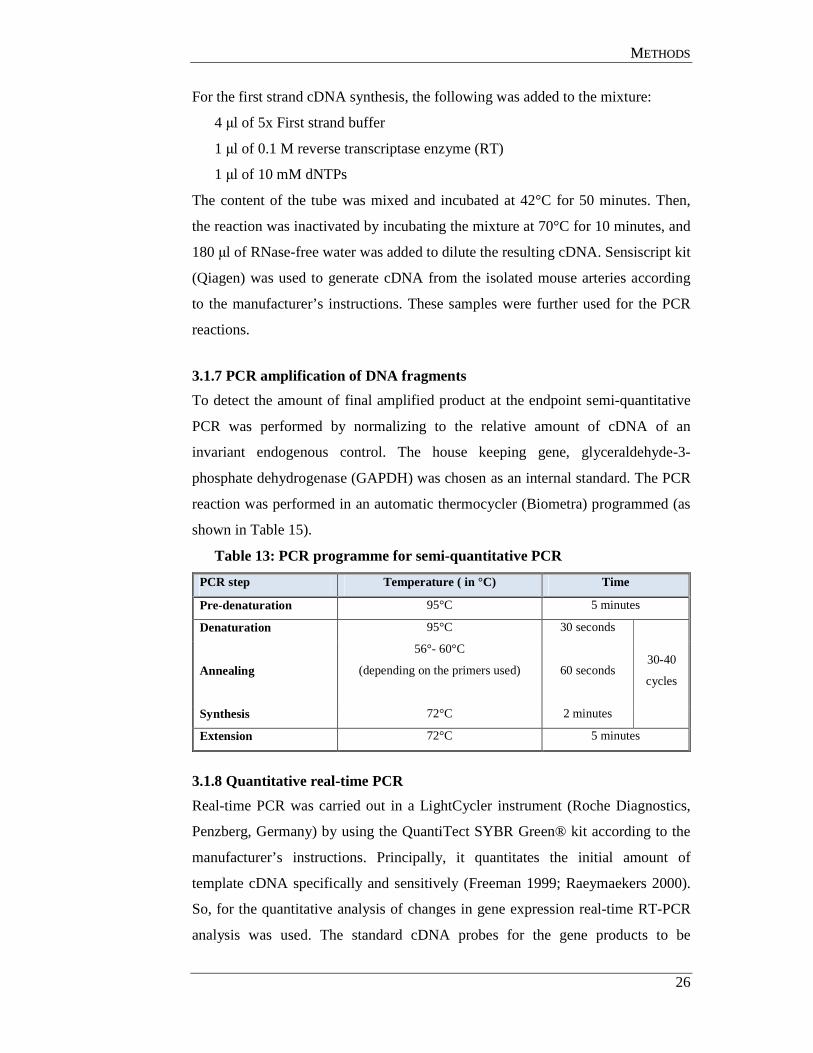
3.1.7 PCR amplification of DNA fragments
To detect the amount of final amplified product at the endpoint semi-quantitative
PCR was performed by normalizing to the relative amount of cDNA of an
invariant endogenous control. The house keeping gene, glyceraldehyde-3-
phosphate dehydrogenase (GAPDH) was chosen as an internal standard. The PCR
reaction was performed in an automatic thermocycler (Biometra) programmed (as
shown in Table 15).
Table 13: PCR programme for semi-quantitative PCR
PCR step Temperature ( in °C) Time
Pre-denaturation 95°C 5 minutes
Denaturation 95°C 30 seconds
Annealing
56°- 60°C
(depending on the primers used)
60 seconds 30-40
cycles
Synthesis 72°C 2 minutes
Extension 72°C 5 minutes
3.1.8 Quantitative real-time PCR
Real-time PCR was carried out in a LightCycler instrument (Roche Diagnostics,
Penzberg, Germany) by using the QuantiTect SYBR Green® kit according to the
manufacturer’s instructions. Principally, it quantitates the initial amount of
template cDNA specifically and sensitively (Freeman 1999; Raeymaekers 2000).
So, for the quantitative analysis of changes in gene expression real-time RT-PCR
analysis was used. The standard cDNA probes for the gene products to be

MMEETTHHOODDSS
27
measured were cloned into TOPO vectors (ref 3.1.3) and the number of molecules
per reaction was calculated according to size (bp) and uv-absorption. The number
of plasmid templates used as standards per reaction varied between 101 to 108
depending on the expected abundance of the gene product to be determined as
number of copies per ng of total RNA. As control gene products for the
normalization of the cDNA amount added to the reaction, GAPDH was used.
3.1.9 Agarose gel electrophoresis
Agarose gel electrophoresis was used for the separation of nucleic acids.
Depending on the size of the DNA fragment to be analysed 1-2% agarose gels
were used along with 4% of the ethidium bromide for the visualization of the
DNA fragment. Agarose was melted in 100 ml TBE buffer followed by the
addition of 4 µl ethidium bromide and poured onto an electrophoresis chamber.
Samples were mixed with 0.2 volumes of 5X of loading buffer before loading.
Electrophoresis was carried out at a steady voltage of 110-140 V. The size of the
DNA fragments in the agarose gels was determined using appropriate size
standards (O’GeneRulerTM DNA Ladder, Fermentas). The band intensities were
analysed using a GelDoc XR unit and the Quantity One software package version
4.06 (Biorad, Munich, Germany) and normalized to the respective intensities of
GAPDH expression.
5X TBE buffer
450 mM Tris base 450 mM Boric acid 20 mM EDTA, pH 8.0
6X Glycerol loading buffer
10 mM Tris/HCl, pH 7.5 10 mM EDTA, pH 8.0 30.00 % Glycerol 0.01 % Bromophenol blue 0.01 % Xylene green

MMEETTHHOODDSS
28
3.1.10 Isolation of total DNA from cultured cells and mouse tails
To isolate total DNA from cultured cells Qiagen DNeasy kit was used according
to the manufacturer’s protocol. Genotyping of the TRP deficient smooth muscle
cells were performed with the primers (Table 1; WT TRPC and TRPC KO) using
the following PCR programme.
Table 14: PCR program for genotyping (TRP knockout mice)
PCR step Temperature ( in °C) Time
Pre-denaturation 95°C 90 seconds
Denaturation 95°C 30 seconds
Annealing 60°C 30 seconds 36 cycles
Synthesis 72°C 60 seconds
Final Elongation 72°C 5 minutes
DNA isolation from the mouse tails was performed according to a standard
protocol (Hogan 1993). The mouse tail of 0.7-1 cm length was incubated in 150 µl
digestion buffer containing proteinase K (1 mg/ml) at 55°C overnight to facilitate.
Thereafter, the digestion mixture was incubated at 95°C for 10 – 20 minutes,
gently mixed and centrifuged at 13000 rpm for 10 minutes at ambient temperature
to collect undigested tail debris. Finally, the DNA containing supernatant was
stored at -20°C for further PCR analysis (see 3.1.4). The genotype analysis zyxin
mice were performed with the primers (Table 1; mice WT zyxin and mice NEO
zyxin) using the following programme;
Table 15: PCR programme for genotyping (zyxin knockout mice)
PCR step Temperature ( in °C) Time
Denaturation 95°C 60 seconds
Annealing 58°C 30 seconds 30 cycles
Synthesis 72°C 50 seconds
95°C 1 minute
Final elongation 72°C 3 minutes
MMEETTHHOODDSS
29
Digestion buffer for tail DNA:
670.0 mM Tris/HCl, pH 8.8 166.0 mM Ammonium sulphate 65.0 mM MgCl2 1.0 % β-mercaptoethanol 0.5 % Triton X-100
3.1.11 Isolation of total RNA from cultured cells and femoral arteries
Total RNA was isolated from cultured cells and individually excised mouse
femoral arteries using the RNeasy kit according to the manufacturer’s instructions.
In order to avoid any RNase activity, RNase-free water and RNase-free reaction
tubes were used. Total RNA was extracted by adding 350 µl and 250 µl of lysis
buffer containing 1% β-mercaptoethanol to the cultured cells and femoral artery
respectively. The femoral artery was then homogenized by a short (~25 seconds)
sonification (cycle 1, 100%, Dr. Hielscher GmbH). An equal volume of 70%
ethanol was added to the homogenized lysates and the samples were carefully
mixed. The mixture was then transferred to the mini spin column, centrifuged for
25 seconds at 13000 rpm followed by two washing steps. Finally, the RNA was
eluted with 30 µl RNase-free water. An aliquot of 13 µl of RNA was used to
generate single-stranded (ss) cDNA for RT-PCR reactions.
3.1.12 Measurement of RNA/cDNA concentration
Measurement of RNA and cDNA concentrations was performed by using the
NanoDrop ND-1000 spectrophotometer. For quantitative real-time PCR analysis
1-20 ng of cDNA was used.
3.2 Cell culture
3.2.1 Isolation and culture of human umbilical vein endothelial cells (HUVEC)
Human umbilical vein endothelial cells were routinely isolated from freshly
collected umbilical cords (closed with a clip) with the consent of parents.
Umbilical veins were flushed with Hank’s buffer solution until the veins were
blood-free. The veins were then filled with dispase solution (3.1 g/l) until the
cords were swollen (~10 ml) and incubated for 30 minutes at 37°C. Veins were
again flushed with Hank’s buffer and the isolated cells were collected in a 50-ml
tube and centrifuged at 1000 rpm for 5 min. The pellet containing the HUVEC

MMEETTHHOODDSS
30
was re-suspended in endothelial cell growth medium (Promega, Germany)
medium containing 5% fetal bovine serum, 50 U/ml penicillin, 50 µg/ml
streptomycin and 0.25 µg/ml Fungizone® antimycotic. The cells were routinely
cultured on standard plastic dishes or collagen type I BioFlex elastomer plates
(Flexcell® International Corporation) additionally coated with 2% (w/v) gelatine
in 0.1 N HCl. Culture medium was changed every other day.
3.2.2. Culture of mouse smooth muscle cells
Mouse smooth muscle cells were isolated from mouse aortic artery. The artery
was dissected, cut into to fragments, washed several times with Hank’s BSS
solution and transferred to a 40 mm petri-dish containing 1.4 ml D-MEM/SMC
growth medium 2 (1:1, Promocell, Heidelberg, Germany) supplemented with 5%
FBS and containing 250 µl collagenase solution (1%, Sigma). The tissue was
digested overnight at 37°C, 5% CO2. The resulting cell suspension was
centrifuged for 5 minutes at 1000 rpm. The pellet was resuspended in 2 ml of
SMC growth medium (50% D-MEM + GlutaMAX-I Medium, 50% Smooth
Muscle Cell Growth Medium, supplemented with 5% FBS, 50 U/ml penicillin, 50
µg/ml streptomycin and 0.25 µg/ml fungizone antimycotic) and seeded into a 6 cm
petri-dish. After passage one, the SMC growth medium was replaced by SMC
culture medium (D-MEM, supplemented with 15% FBS, 50 U/ml penicillin, 50
µg/ml streptomycin and 0.25 µg/ml fungizone antimycotic). Cells were incubated
at 37ºC, 5% CO2, in a humidified atmosphere. Every batch of isolated and cultured
mouse aortic smooth muscle cells was tested for the expression of the specific
SMC marker, α-actin by immunofluorescence analysis. Routinely, 95% were
found to be α-actin positive.
3.2.3 siRNA transfection into HUVEC
To transfect one well of a 6-well plate, 3 µg of plasmid was diluted in OPTIMEM
I medium to give a final volume of 200 µl for each well to be transfected. For the
formation of the transfection complex, 3 µl of MATra-si reagent (IBA, Göttingen)
was added to the diluted siRNA, carefully mixed and allowed to incubate at
ambient temperature for 20-30 minutes. HUVEC were once washed in OPTIMEM
I, the medium was discarded and then fresh OPTIMEM I (2 ml per well) was
added to the cells. The siRNA/magnetic beads were then layered drop wise onto

MMEETTHHOODDSS
31
the cells (200 µl per well). Cells were incubated with the transfection complex on
a custom-made magnetic plate (Universal Magnet Plate, IBA) for 30 minutes in
the cell incubator to allow beads to penetrate the target cells. A sufficient
knockdown of zyxin (80 ± 5% of control) was achieved after 72 hours of
transfection (Figure 8).
Figure 8: Representative confocal immunofluorescence analysis (IFA) showing reduction in zyxin protein level after magnetofection. Endothelial cells (HUVEC) were transfected using the MaTra transfection reagent with siRNA directed against zyxin. Seventy two hours post transfection the protein was analysed by IFA. Zyxin levels in the siRNA zyxin transfected cells were reduced by 75-85% as compared to the untransfected control cells, scrambled siRNA transfected cells and the cells treated with just transfection reagents. The cells were stained with using the B72 antiserum, Paxillin and DAPI. Scale bar: 50 µm.
3.2.4 Transfection of zyxin expression plasmids into HUVEC
Transient transfection of HUVEC with the wild type or mutant eGFP-Zyxin
constructs (ref 3.1) was performed using polyethylenimine (PEI). PEI has
polycationic property. DNA, as a poly-anion, forms complexes with PEI driven by
electrostatic interaction. For each well to be transfected plasmid (2 µg) was
incubated with PEI (0.32 g/l) in OptiMEM I (Invitrogen, Darmstadt, Germany) to
scrambled siRNA Transfection reagent
Control Zyxin siRNA
DAPI Paxillin Zyxin
50µm 50µm
50µm 50µm

MMEETTHHOODDSS
32
a final volume of 200µl at ambient temperature for 30 minutes. HUVEC were
washed in Hank’s BSS solution for 2 times and incubated with fresh Endothelial
cell media without antibiotics and FCS (1 ml/well). The transfection mixture was
then layered drop wise onto the HUVEC followed by the 6 hours incubation at 37
°C and 5% CO2. After termination of the procedure by adding normal EC growth
media (2 ml/well), transfection efficiency was found to be 35 ± 5%. 24 hours post
transfection, HUVEC were transferred to a BioFlex membrane for stretch
experiments; the amount of transfected cells on the Bioflex plates typically
dropped to 15 ± 5%.
3.2.5 Incubation of cells with various drugs
Upon reaching confluence, the HUVEC were incubated with or without 1 nM
Atrial Natriuretic Peptide (Calbiochem, San Diego USA), 10 nM Endothelin-1
(Calbiochem), 100 µM Rp8GPT-cGMP (Calbiochem), 1 µM BQ-788 (Sigma
Aldrich, Deisenhofen, Germany) and 200 µM Gadolinium (Sigma). After
treatment, cells were kept at static conditions or exposed to mechanical strain
(cyclic stretch).
3.2.6 Application of mechanical strain
EC and SMC were plated on BioFlexTM collagen I elastomers (Flexercell Inc.,
Hillsborough, NC, USA) and exposed to cyclic stretch of elongation with 10% and
15% respectively at 0.5 Hz with a sinusoidal profile in a Flexercell FX-3000 strain
unit (Figure 9). This protocol is well established method to mimic an increase in
circumferential wall tension as previously described (Cattaruzza 2004). The cells
were incubated to the stretch medium (M199 medium supplemented with 120 mM
TES-HEPES pH 7.3, 20% fetal bovine serum, 50 U/ml penicillin, 50 µg/ml
streptomycin, 0.25 µg/ml Fungizone antimycotic) and the required drugs (3.2.5)
before the application of mechanical strain.
After the stretch protocol, cell culture media were collected and frozen at -80°C
for further analysis. Cells were either lysed with RLT buffer (Qiagen) for mRNA
isolation fixed (with acetone:methanol or 4% paraformaldehyde, ref 3.3.1) for
fluorescence analysis or collected by centrifugation (3000 rpm, 4°C) for cell
fractionation and Western blot analysis.

MMEETTHHOODDSS
33
Figure 9: Schematic diagram of the FlexCell model. (A) The computer-controlled flex device applies mechanical strain to the cells by using regulated vacuum pressure to deform the flexible-bottomed culture plates producing substrate elongation and (B) a typical strain profile applied to EC or SMC in culture.
3.3 Immunofluorescence analysis
3.3.1 Cell fixation
For analysis of the localisation of zyxin and other proteins, cells grown on BioFlex
membranes or coverslips were fixed in methanol/acetone (1:1) for 20 minutes at -
20°C. Thereafter, the cells were dried for 2hrs. Enhanced-GFP-Zyxin transfected
cells were fixed with 4% paraformaldehyde for 20 minutes at room temperature
and futher processed for immunostaining.
3.3.2 Immunostaining of fixed cells
The fixed cells were permeabilized with 0.1% Triton X-100/PBS and nonspecific
binding was blocked using Casein blocking serum for 45 minutes. The
membranes/coverslips were then incubated cell side down with 15 µL of primary
antibodies (Table 8) diluted in casein blocking serum for 2 hours at room
temperature. After 5 wash steps (5 minutes each, PBS), cells were incubated cell
side down with Cy2- and/or Cy3-conjugated secondary antibodies (Table 9)
depending on the primary antibodies used for 1 hour at room temperature. The
cells were then washed 2 times with PBS followed by a nuclear stain with DAPI
(1 µg/mL) for 10 minutes at room temperature). After the final wash step (PBS, 2
times for 5 minutes), the cells were mounted on to a large coverslip with ProLong
(Invitrogen, Oregon, USA).
10
0.5 Hz
10
0
5
elon
gatio
n (%
)EC or SMC
Cyclic stretch
MMEETTHHOODDSS
34
Permiabilisation buffer
Phosphate-buffered saline per L: pH 7.6 8.0 g NaCl 0.2 g KCl 1.44 g Na2HPO4 0.24 g KH2PO4
Casein blocking serum
0.25 % Casein 0.1 % BSA 15 mM NaN3 50 mM Tris pH 7.6
3.4 Immunohistochemistry
3.4.1 Tissue preparation for paraffin embedding
The freshly isolated femoral arteries were fixed in zinc to retain their
morphological structure and dehydrated by passing the tissue through an
increasing alcohol gradient i.e. 70%, 80% and 96% ethanol for 90 minutes in each
ethanol gradient. The ethanol was removed from the tissue by incubating the
femoral artery in isopropanol for 1 hour. Finally, the tissue was embedded in
melted paraffin (Sigma Aldrich) and incubated at 60°C overnight. The tissue in the
paraffin was poured on to a metal preheated at 60°C to form a block. The tissue
embedded in the paraffin block was allowed to cool down and was further
processed for sectioning. The paraffin block was cut into sections (5 µm thick)
using a microtome. The tissue sections were transferred on to a glass slides and
were dried at 40°C overnight. The tissue sections were then processed further for
immunohistological analyses.
Zinc fixation
0.1 M Tris HCl, pH 7.4 3.2 mM Ca(CH3COO)2 X H2O 22.8 mM Zn(O2CCH3)2(H2O)2 35.9 mM ZnCl2
3.4.2 Staining of paraffin sections
For staining, paraffin sections (5 µm) were de-paraffinised by a standard protocol
and incubated for 10 minutes in 4% hydrogen peroxide to eliminate endogenous
peroxidase activity. The procedure was continued by permeabilisation of tissue for
45 minutes and blocked for 1 hour with the casein blocking serum followed by

MMEETTHHOODDSS
35
incubation with the primary antibody for 12 hours at 4°C (Table 8). The cells were
then incubated with a Cy3-coupled secondary antibody (Table 9) for 2 hours
diluted 1:100 in blocking buffer. The procedure was terminated by DAPI
counterstaining (1 µg/mL) for 10 minutes and mounting in ProLong (Invitrogen).
3.5 Confocal microscopy For confocal microscopy analysis of immunostained tissue sections and cultured
cells, a IX81 microscope equipped with a IX-DSU disk unit and the MT20 multi-
wavelength illumination system was used in combination with the cell^R software
package (Olympus, Hamburg, Germany).
3.6 Chromatin immunoprecipitation (ChIP). ChIP assays were performed by using the ChIP-IT Express Kit (Active Motif;
Rixensart, Belgium) according to the manufacturers’ instructions (all buffers and
enzymes not defined were provided by the manufacturer). In brief, EC were
exposed to cyclic stretch (10% 0.5 Hz for 6 h) as described above. Thereafter,
cells were fixed and cross-linked with formaldehyde (1% in PBS), the DNA was
isolated and digested with the provided restriction enzyme cocktail and subjected
to immunoprecipitation. The antibodies used for this procedure were from Santa
Cruz Biotechnology, Heidelberg, Germany (zyxin: rabbit antiserum B71; the
antiserum (B72) used for Western blot and other procedures did not yield any
reproducible results), Sigma-Aldrich (mouse α-actin as a negative control) and
Active Motif (RNA polymerase II/ChIP-certified). The resulting precipitated DNA
was subjected to gene-specific PCR and the amount of amplified DNA was
densitometrically analysed after agarose gel electrophoresis (Molecular Imager
Gel Doc XR System and the Density One densitometry software version 4.6,
Biorad Munich, Germany). The optimal number of PCR cycles (95°C/30 s
denaturation, 60°C/30 s annealing and 72°C/1 minute synthesis) varied between
28 (Clusterin after RNA polymerase II precipitation) and 37 (most genes after
precipitation with B72). The primers were chosen in a way that putatively
functional PyPu-boxes were included in the amplified region.

MMEETTHHOODDSS
36
3.7 Protein biochemistry
3.7.1 Isolation of total cellular protein
The cells were collected with a cell scraper (Sarstedt Inc.) in 250µl PBS and
transferred into a microcentrifuge tube and centrifuged at 3000 rpm for 3 minutes.
The pellet was resuspended in 50µl protein lysis buffer and was incubated on ice
for 30 minutes. The mixture was vortex every 10 minutes. The non-ionic
detergent, 0.1% triton-x was added for 10 minutes for permiabilisation of cell
membrane.
Components of hypotonic protein lysis buffer
10 mM Hepes, pH 7.9 10 mM KCl 0.1 mM EDTA 0.1 mM EGTA 0.1 M DTT 50 µM Pefablock 25 µM Protease inhibitors
3.7.1 Separation of cytoplasmic and nuclear proteins
For enrichment of the cytoplasmic and nuclear protein fraction from cultured cells,
the ReadyPrep protein extraction kit (Cytoplasmic/nuclear; BioRad) was used
according to the manufacturer’s protocol. Briefly, the cells were collected in 250µl
PBS and centrifuged at 3000 rpm for 3 minutes. The cell pellet was suspended in
CPEB buffer and the cell membrane was disrupted mechanically with the syringe
needle (20 gauge). The CPEB buffer containing the cells with disrupted cell
membrane was subjected to centrifugation at 1000 × g for 10mins at 4°C to collect
the cytoplasmic protein. The remaining cell pellet containing the nuclear fraction
was re-suspended in protein solubilization buffer (PSB) followed by centrifugation
at 16000 × g for 20 minutes at room temperature to obtain the nuclear protein.
Thus separated cytoplasmic and nuclear proteins were further used in the SDS-
PAGE analysis.
3.7.2 Sodium dodecylsulfate polyacrylamide gel electrophoresis (SDS-PAGE)
SDS-PAGE separates proteins exclusively on the basis of their size (Laemmali
1970). Therefore, analysis of complex protein samples was performed using SDS-
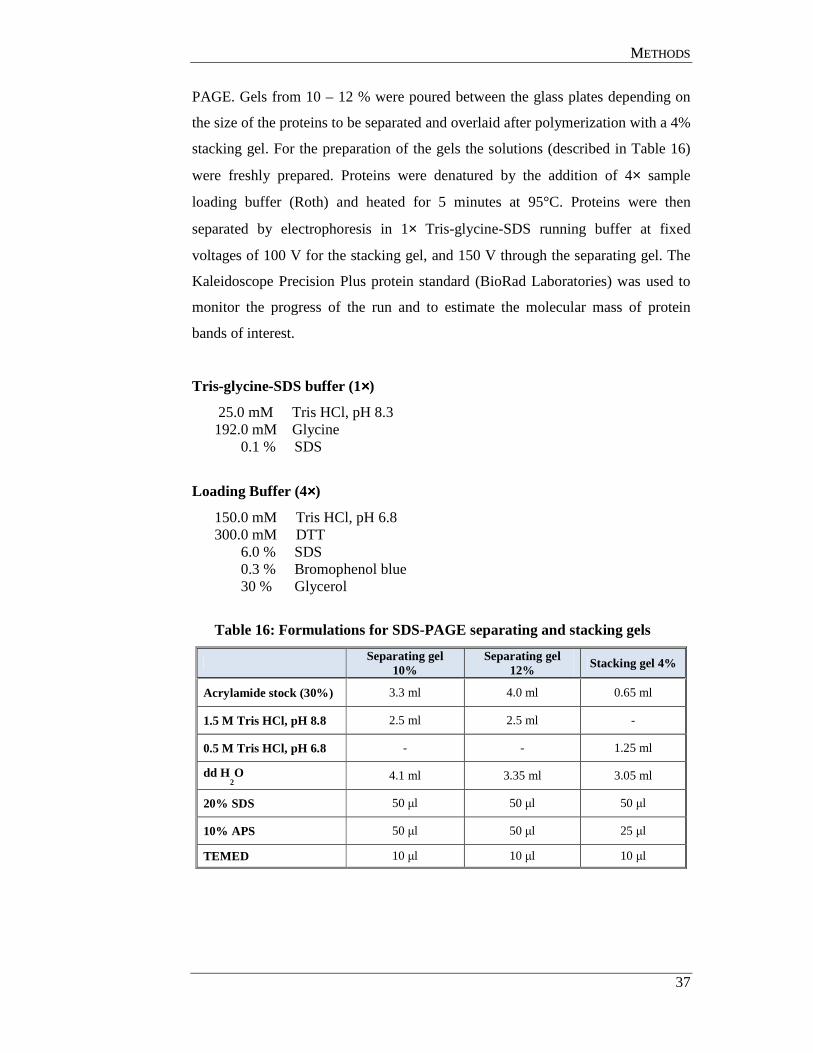
MMEETTHHOODDSS
37
PAGE. Gels from 10 – 12 % were poured between the glass plates depending on
the size of the proteins to be separated and overlaid after polymerization with a 4%
stacking gel. For the preparation of the gels the solutions (described in Table 16)
were freshly prepared. Proteins were denatured by the addition of 4× sample
loading buffer (Roth) and heated for 5 minutes at 95°C. Proteins were then
separated by electrophoresis in 1× Tris-glycine-SDS running buffer at fixed
voltages of 100 V for the stacking gel, and 150 V through the separating gel. The
Kaleidoscope Precision Plus protein standard (BioRad Laboratories) was used to
monitor the progress of the run and to estimate the molecular mass of protein
bands of interest.
Tris-glycine-SDS buffer (1××××)
25.0 mM Tris HCl, pH 8.3 192.0 mM Glycine 0.1 % SDS
Loading Buffer (4××××)
150.0 mM Tris HCl, pH 6.8 300.0 mM DTT 6.0 % SDS
0.3 % Bromophenol blue 30 % Glycerol
Table 16: Formulations for SDS-PAGE separating and stacking gels
Separating gel
10% Separating gel
12% Stacking gel 4%
Acrylamide stock (30%) 3.3 ml 4.0 ml 0.65 ml
1.5 M Tris HCl, pH 8.8 2.5 ml 2.5 ml -
0.5 M Tris HCl, pH 6.8 - - 1.25 ml
dd H2O 4.1 ml 3.35 ml 3.05 ml
20% SDS 50 µl 50 µl 50 µl
10% APS 50 µl 50 µl 25 µl
TEMED 10 µl 10 µl 10 µl
MMEETTHHOODDSS
38
3.7.3 Western blot analysis
The proteins separated by SDS-PAGE were transferred onto a PVDF
(Polyvinylidene fluoride) membrane in the transfer buffer using trans-blot transfer
cell system (Bio-Rad) at a constant current of 350 mA for 45 minutes. To allow
the efficient transfer of all the proteins from gel on to the membrane, both the gel
and the membrane was sandwiched between the filter papers and sponges. The
PVDF membrane was incubated with 100% methanol for 5 minutes and pre-
hydrated in ddH2O before the protein transfer for 30 minutes to facilitate binding
of proteins on to the membrane.
After the transfer, the PVDF membrane was immersed in blocking buffer and
rocked for 1 hour at room temperature to block the nonspecific binding. The
membrane was then incubated with the appropriate primary antibody (Table 8)
diluted in the ratio 1:500 to 1:2500 with blocking buffer for 2hrs at ambient
temperature. Thereafter the membrane was washed 3 times for 10 minutes with
washing buffer. The blot was then incubated with secondary antibody conjugated
to horseradish peroxidase (Table 9) diluted in the ratio 1:5000 for 60 minutes at
ambient temperature.
The blot was then washed 3 times with wash buffer for 10 minutes whilst shaking.
The membrane was then developed with ECL (equal quantities of ECL reagent A
and B- Enhanced Chemiluminescence, substrate; Amersham Pharmacia Biotech,
Freiburg, Germany), according to the manufacturer’s instructions. The light
generated by the enzymatic reaction was detected in a ChemiDoc chamber
(BioRad) and the molecular mass of protein bands of interest were analysed.
Transfer buffer
25.0 mM Tris 19.2 mM Glycine 20 % Methanol
Washing Buffer
2.5 g Triton X-100 1.0 L PBS 1××××
Washing Buffer
5% milk powder in washing buffer
MMEETTHHOODDSS
39
3.7.4 Enzyme-linked immunosorbent assay (ELISA)
Pre-coated enzyme-linked immunosorbent assay (ELISA) was used for
quantitative determination of interleukin-8 (R&D Systems, Wiesbaden, Germany),
endothelin-1 (R&D Systems) and atrial natiuretic peptide (Biomedica, Graz,
Austria) concentrations in cell culture supernatants. All samples were thawed only
once at the time of testing and analysed according to the manufacturer’s protocol.
3.8 Ex-vivo blood vessel perfusion Ex-vivo blood vessel perfusion was performed according to rules of the Regional
Council Karlsruhe and conformed to the Guide for the Care and Use of Laboratory
Animals (NIH Publication No. 85-23, revised 1996) Wild type mice (C57BL/6)
and mice with the indicated gene defect (zyxin, GC-A, TRP-C1/3/4/5/6
deficiencies) were euthanized in CO2 chambers.
3.8.1 Isolation and preparation of murine femoral arteries for perfusion
For the isolation of femoral arteries, the hind limb of euthanized mice was excised
and immersed under perfusion buffer (ref Table 17). The femoral artery was then
separated from the accompanying vein and dissected from connective tissue.
Segments of the femoral artery (0.5 - 1 cm) were cut and mounted onto glass
capillaries (diameter 120 µm) fitted for the use in the Pressure Myograph System
110P.
The glass capillaries used for perfusion experiments were prepared using a P-87
Flaming/Brown micropipette puller (Sutter Instrument Company, Novato, USA).
The capillaries were pulled from 0.15 mm glass cannulas (GB150-8P, Science
products GmbH, Hofheim, Germany) with the program optimized according to an
operation manual provided by the manufacturer to achieve a final tip-diameter of
120 µm. Thereafter, the capillaries were cut to the appropriate length
(approximately 1.5 cm).
3.8.2 Perfusion of isolated murine femoral arteries
The femoral arteries were subjected to in situ perfusion using Pressure Myograph
System Model 110P (Danish Myo Technology, Copenhagen, Denmark, Figure
10). The pressure transducer together with the MyoView™ system and software
allowed continuous control of temperature, pressure and vessel diameter.
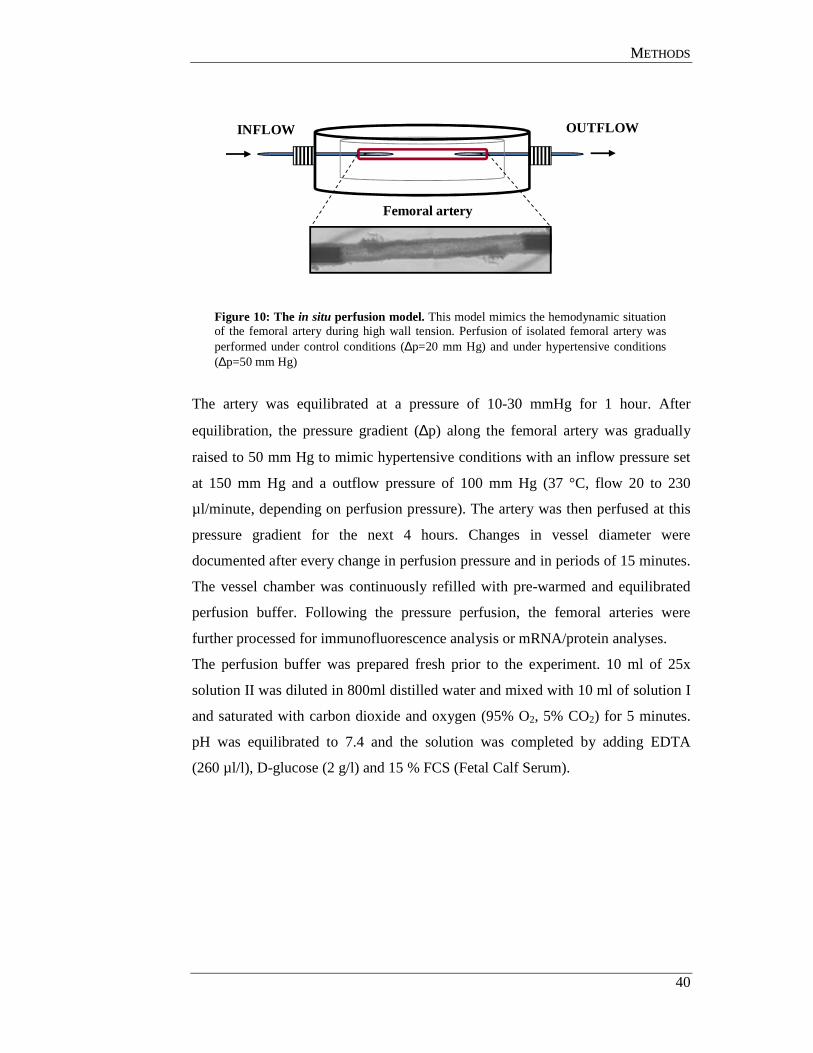
MMEETTHHOODDSS
40
Figure 10: The in situ perfusion model. This model mimics the hemodynamic situation of the femoral artery during high wall tension. Perfusion of isolated femoral artery was performed under control conditions (∆p=20 mm Hg) and under hypertensive conditions (∆p=50 mm Hg)
The artery was equilibrated at a pressure of 10-30 mmHg for 1 hour. After
equilibration, the pressure gradient (∆p) along the femoral artery was gradually
raised to 50 mm Hg to mimic hypertensive conditions with an inflow pressure set
at 150 mm Hg and a outflow pressure of 100 mm Hg (37 °C, flow 20 to 230
µl/minute, depending on perfusion pressure). The artery was then perfused at this
pressure gradient for the next 4 hours. Changes in vessel diameter were
documented after every change in perfusion pressure and in periods of 15 minutes.
The vessel chamber was continuously refilled with pre-warmed and equilibrated
perfusion buffer. Following the pressure perfusion, the femoral arteries were
further processed for immunofluorescence analysis or mRNA/protein analyses.
The perfusion buffer was prepared fresh prior to the experiment. 10 ml of 25x
solution II was diluted in 800ml distilled water and mixed with 10 ml of solution I
and saturated with carbon dioxide and oxygen (95% O2, 5% CO2) for 5 minutes.
pH was equilibrated to 7.4 and the solution was completed by adding EDTA
(260 µl/l), D-glucose (2 g/l) and 15 % FCS (Fetal Calf Serum).
INFLOW
Femoral artery
OUTFLOW
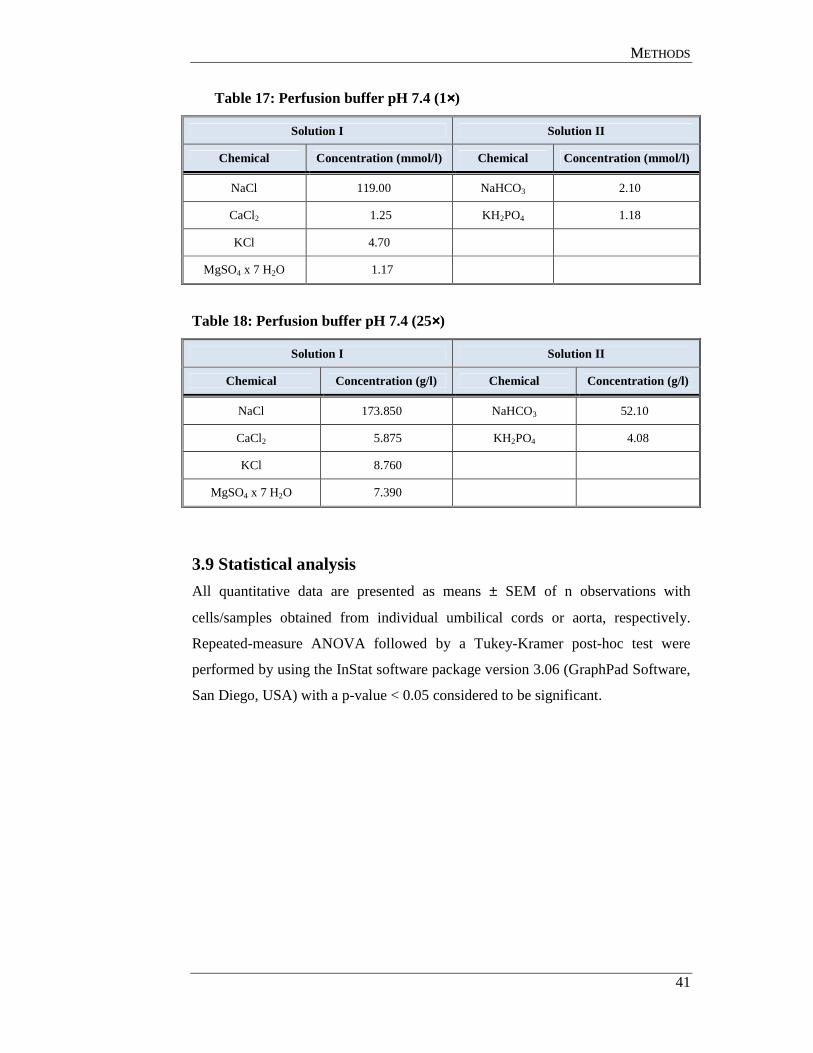
MMEETTHHOODDSS
41
Table 17: Perfusion buffer pH 7.4 (1××××)
Solution I Solution II
Chemical Concentration (mmol/l) Chemical Concentration (mmol/l)
NaCl 119.00 NaHCO3 2.10
CaCl2 1.25 KH2PO4 1.18
KCl 4.70
MgSO4 x 7 H2O 1.17
Table 18: Perfusion buffer pH 7.4 (25××××)
Solution I Solution II
Chemical Concentration (g/l) Chemical Concentration (g/l)
NaCl 173.850 NaHCO3 52.10
CaCl2 5.875 KH2PO4 4.08
KCl 8.760
MgSO4 x 7 H2O 7.390
3.9 Statistical analysis
All quantitative data are presented as means ± SEM of n observations with
cells/samples obtained from individual umbilical cords or aorta, respectively.
Repeated-measure ANOVA followed by a Tukey-Kramer post-hoc test were
performed by using the InStat software package version 3.06 (GraphPad Software,
San Diego, USA) with a p-value < 0.05 considered to be significant.

RREESSUULLTTSS
42
4. RESULTS
Zyxin localisation and function in stretch induced gene expression
The first part of the results deals with the transcriptional changes in human
cultured EC in response to stretch, which is induced by zyxin after its translocation
to the nucleus and the mechanism of zyxin-induced gene expression.
4.1 Effect of cyclic stretch on cellular localisation of zyxin (in vitro)
Human umbilical vein endothelial cells (HUVEC) grown on collagen-coated
BioFlex plates were subjected to cyclic stretch (10% elongation, 0.5 Hz, 6 hours)
using the Flexercell strain unit to mimic wall tension.
(A)
(B)
Figure 11: Representative confocal immunofluorescence analysis (IFA) images of zyxin in static and stretched cells. (A) Zyxin is localised in the focal adhesions (FA) in quiescent cells while the nucleus (Nu, inset) is mostly free of zyxin. Cyclic stretch of 6 hours causes nuclear translocation of zyxin. (Cy3/red: Zyxin, Cy2/green: Paxillin). Nuclei were counterstained with DAPI (6-fluoro-diamidin-2-phenylindol: blue). Paxillin colocalises with zyxin exclusively in focal adhesions (FA: yellow) but not in stress fibres (SF) or in the nucleus (after stretch). (B) Partial stretch dependent colocalisation of the nuclear protein Ku80 (Cy2/green) with zyxin (Cy3/red). Whereas nuclei in static cells are virtually devoid of zyxin, significant colocalisation occurs in response to stretch. (insets with magnified exemplary nuclei). For exemplary zyxin negative and zyxin-positive nuclei also see Figure 45 (page 97). Scale bar: 50 µm.
Static control Stretch
Nu
SF
FANu
SF
FA
DAPI Paxillin Zyxin
50µm
50 µm 50 µm 5 0 µm
50µm
5 0µm 5 0µm 50 µm
Static control Stretch
Nu
SF FA
Nu
SF
DAPI Ku80 Zyxin50 µm 5 0 µm 5 0 µm 5 0µm 5 0µm 50 µm
50µm 50µm

RREESSUULLTTSS
43
To localise zyxin, the EC were stained with the zyxin specific rabbit antiserum
B72 (Figure 11). In quiescent EC, zyxin localises to focal adhesions and stress
fibres. After exposure to cyclic stretch, although partly remaining in the focal
adhesions, zyxin migrates to the nucleus. In the nucleus, it partially colocalises
with the nuclear protein Ku80.
(A)
(B)
Figure 12: Representative confocal IFA images of zyxin in static and stretched aortic EC (A) and coronary EC (B). In both the cell types, zyxin is localised in the focal adhesions (FA) of quiescent cells. Cyclic stretch causes nuclear (Nu) translocation of zyxin. Paxillin colocalises with zyxin exclusively in focal adhesions (FA) (yellow) but not in the nucleus (after stretch). The cells were stained for zyxin (Cy3/red), paxillin (Cy2/green) and nuclei (DAPI/blue). Scale bar: 50 µm.
In order to exclude HUVEC-specific effects, because of their venous and
embryonic origin, immunofluorescence analysis of coronary and aortic cultured
endothelial cells was performed that showed zyxin translocation to the nucleus
upon stretch in these cell types too (Figure 12).
Static control
Nu
FA
Stretch
Nu
FA
DAPI Paxillin Zyxin
50µm50µm
50 µm5 0 µm5 0µm50 µm5 0 µm5 0µm
Static control
Nu
FAStretch
Nu
FA
50µm 50µm
5 0µm5 0 µm5 0µm 5 0µm50 µm5 0 µm
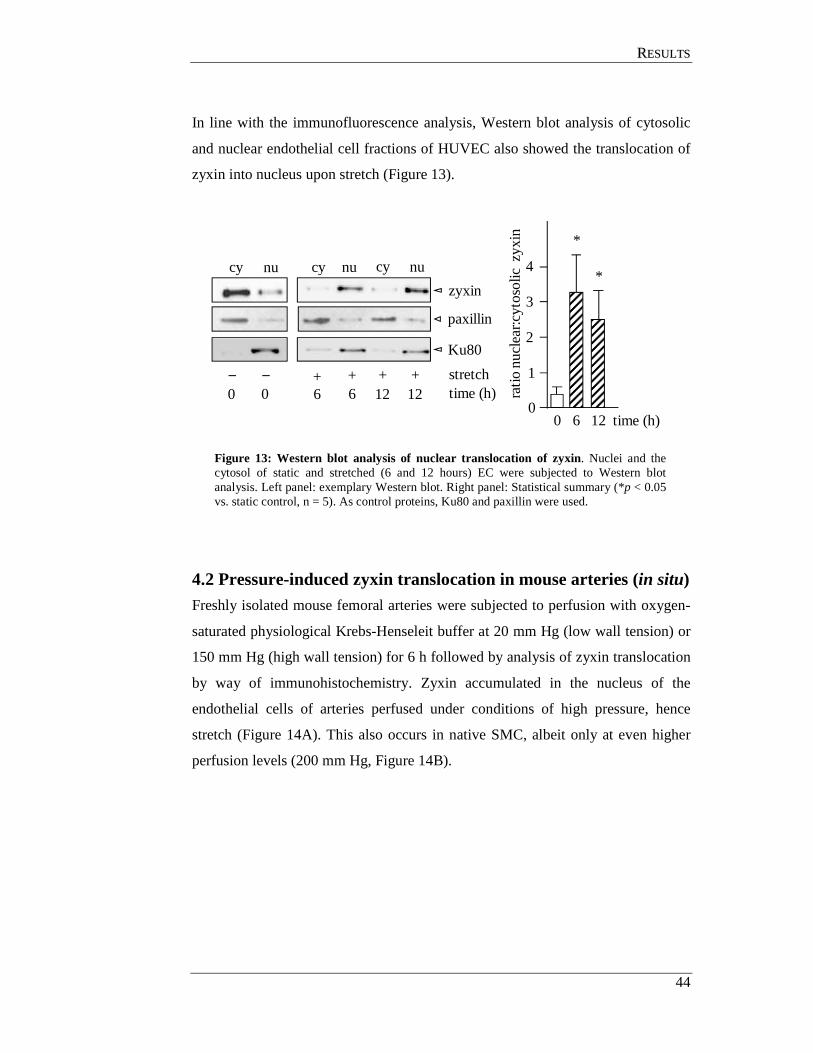
RREESSUULLTTSS
44
In line with the immunofluorescence analysis, Western blot analysis of cytosolic
and nuclear endothelial cell fractions of HUVEC also showed the translocation of
zyxin into nucleus upon stretch (Figure 13).
Figure 13: Western blot analysis of nuclear translocation of zyxin. Nuclei and the cytosol of static and stretched (6 and 12 hours) EC were subjected to Western blot analysis. Left panel: exemplary Western blot. Right panel: Statistical summary (*p < 0.05 vs. static control, n = 5). As control proteins, Ku80 and paxillin were used.
4.2 Pressure-induced zyxin translocation in mouse arteries (in situ) Freshly isolated mouse femoral arteries were subjected to perfusion with oxygen-
saturated physiological Krebs-Henseleit buffer at 20 mm Hg (low wall tension) or
150 mm Hg (high wall tension) for 6 h followed by analysis of zyxin translocation
by way of immunohistochemistry. Zyxin accumulated in the nucleus of the
endothelial cells of arteries perfused under conditions of high pressure, hence
stretch (Figure 14A). This also occurs in native SMC, albeit only at even higher
perfusion levels (200 mm Hg, Figure 14B).
zyxin
nu
stretchtime (h)
paxillin
Ku80
cy nucy nucy
0 0 66 12 12++ + +
ratio
nuc
lea
r:cyt
osol
ic z
yxin
time (h)0
0 6 12
*
*
2
1
3
4

RREESSUULLTTSS
45
(A)
(B)
Figure 14: Representative confocal IFA showing localisation of zyxin in situ. (A) EC surrounding the lumen of the unperfused femoral artery showing nuclei free of zyxin. Pressure perfused femoral arteries (150 mm Hg) showed zyxin localisation in the nucleus. (B) Enlarged pictures of exemplary SMC in segments perfused at 20 mm Hg (left) and segments perfused at 200 mm Hg (only single cells are shown as, under these conditions, the segments are strongly dilated and partially destroyed). Whereas under low pressure conditions zyxin is located at the cell borders similar to the appearance in cultured cells under static conditions, nuclear accumulation of zyxin is much more prominent in SMC exposed to high wall tension. The arrowheads depict zyxin-positive sites at the cell border (left) and in the nucleus (right). Scale bar: (A) 50 µm (B) 10 µm.
4.3 Role of zyxin in stretch-induced gene expression The downregulation of zyxin affects stretch-induced-gene expression in rat
vascular smooth muscle cells (Cattaruzza 2004). Testing of genes known to be
stretch-sensitive revealed that chemokines like interleukin-8 (IL-8) and CXCL1
but not endothelin-1-receptor ETB-R were regulated by zyxin in cultured EC
(doctoral thesis of Agnieszka Wojtowicz, Heidelberg, 2008). To get the full
picture of stretch-induced changes in gene expression and the role of zyxin
therein, a genome-wide microarray analysis was performed (Wojtowicz 2010)
comparing quiescent and stretched HUVEC with and without siRNA-mediated
knockdown of zyxin. A total of 592 genes (with P<0.02) turned out to be stretch-
sensitive of which 402 (67.9%) were regulated by zyxin. The outcome of this
microarray analysis revealed that zyxin is involved in the regulation of rather
distinct pathways such as suppression of apoptosis or chemokine release. A similar
EC
Wild type/20 mm Hg
EC
Wild type/150 mm Hg
50µm50µm
Wild type/200 mm HgWild type/20 mm Hg
10µm10µm

RREESSUULLTTSS
46
analysis of mouse aortic primary cultured SMC from wildtype and zyxin-deficient
mice revealed an even more complex albeit partially similar pattern of zyxin
controlled genes in stretched SMC. As an overview a comparison of zyxin
regulated pathways in SMC and EC is given in Table 19.
Table 19. Comparison of zyxin-controlled stretch-sensitive genes (pathways defined by KEGG or Gene Ontology) in EC and SMC with and without zyxin expression. Only pathways regulated in a highly significant manner in at least one cell type have been included. + to +++: moderately to strongly induced pathways; - to ---: moderately to strongly repressed pathways; ∅: pathway not altered. Pathways regulated only in one cell type are highlighted in blue, pathways regulated differentially between cell types are highlighted in green.
Pathway Functional Description EC SMC Stretch-induced pathways activated by zyxin 1 CYTOKINE_CYTOKINE_RECEPTOR_INTERACTION +++ +++ 2 LEUKOCYTE_MIGRATION + +++ 3 CHEMOKINE_RECEPTOR_BINDING +++ +++ 4 CHEMOKINE_ACTIVITY +++ +++ 5 CYTOKINE_ACTIVITY +++ +++ 6 PROTEIN_KINASE_ACTIVITY +++ ++ 7 NEGATIVE_REGULATION_OF_PROGRAMMED_CELL_DEATH ++ +++ 8 FOCAL_ADHESION +++ ++ 9 AMINO_ACID_TRANSMEMBRANE_TRANSPORTER_AC. +++ ++ 10 G_PROTEIN_COUPLED_RECEPTOR_BINDING ++ +++
11 TRANSCRIPTION_COREPRESSOR_ACTIVITY +++ ++ 12 COMPLEMENT_AND_COAGULATION_CASCADES ++ ∅ 13 TOLL_LIKE_RECEPTOR_SIGNALLING_PATHWAY ++ ∅ 14 TGF_BETA_SIGNALLING_PATHWAY ++ ∅ 15 PROTEIN_SECRETION ∅ +++
16 SMOOTH_MUSCLE_CONTRACTION ∅ +++
17 CALCIUM_MEDIATED_SIGNALLING ∅ +++
18 POSITIVE_REGULATION_OF_CELL_ADHESION ∅ +++
19 POLYMERASE_II_TRANSCRIPTION_FACTOR_ACTIVITY +++ ---
Stretch-induced pathways repressed by zyxin 20 LIPID_TRANSPORTER_ACTIVITY --- --- 21 OXIDOREDUCTASE_ACTIVITY --- --- 22 CELL_CYCLE* --- --- 23 DNA_POLYMERASE --- --- 24 PYRIMIDINE_METABOLISM -- ---
25 STRUCTURAL_CONSTITUENT_OF_CYTOSKELETON --- --- 26 GAP_JUNCTION -- ∅ 27 LYASE_ACTIVITY --- ∅ 28 P53_SIGNALLING_PATHWAY --- ∅ 29 ORGANELLE_LOCALISATION ∅ ---
30 NEGATIVE_REGULATION_OF_PHOSPHORYLATION ∅ ---
31 VALINE_LEUCINE _ISOLEUCINE_DEGRADATION --- +++

RREESSUULLTTSS
47
As an example for zyxin-regulated stretch-sensitive genes in SMC,
thrombomodulin (TM) and calponin (Cal) have been analysed here. The
expression of thrombomodulin significantly increased upon stretch in the wildtype
SMC whereas in the zyxin knockout SMC, stretch-induced expression was
suppressed. In contrast, calponin expression was generally decreased upon stretch.
However, in the zyxin-deficient SMC, the gene is no more stretch-sensitive
indicating that zyxin is necessary for stretch-dependent repression of calponin
expression (Figure 15).
(A) (B)
Figure 15: Real time RT-PCR analysis of SMC for thrombomodulin (TM) and calponin (Cal). Cal (*p < 0.01 vs. static control, n = 5) and TM (*p < 0.01 vs. static control, n = 5) mRNA expression in response to stretch (12%, 0.5 Hz for 6 h) in cells with (A) a wild type genome (WT) (B) zyxin deficiency.
4.4 Mechanism of zyxin-induced gene expression
To evaluate the mechanism of zyxin-dependent stretch-mediated gene expression,
promoter regions of genes identified to be stretch-sensitive were analysed. As
described before, zyxin appears to associate with the proximal promoter of the
human thrombomodulin gene at a stretch of pyrimidines (PyPu box; position -453
to -481, unpublished observation). On analyzing the promoter regions of stretch-
sensitive genes in EC, a comparable motif close to the transcription start site was
found solely in the 13 stretch-sensitive genes controlled by zyxin but not in the 11
zyxin-independent genes (Table 20).
0
100
300
200
mR
NA
exp
ress
ion
(% c
ontr
ol)
*
Stretch+ +
TM Cal
*
0
100
300
200m
RN
A e
xpre
ssio
n (%
con
trol
)
*
Stretch+
+
Cal.
+
WTZyx-KO
TM
*
++

RREESSUULLTTSS
48
Table 20: Alignment of stretch-response element-like sequences. This sequence was found in the subset of zyxin-dependent genes: hairy/enhancer-of-split related with YRPW motif 1 (Hey1), interleukin-8 (IL-8), hemicentin-1 (HMCN1), E74-like factor 4 (ELF4), prepro-endothelin-1 (ET-1), laminin C3 (LAMC3), the transcription factor forkhead box O1 (FOXO1), notch homolog-2 (Notch2), HMG-CoA reductase (HMGCR), E-selectin (SEL-E), ICAM-1, VCAM-1, integrin-6 (ITGB6). Stretch-inducible zyxin-independent genes which have been unsuccessfully analysed for this motif, code for matrix metalloproteases-1 and 12 (MMP-1/12), von Willebrand factor (vWF), clusterin (CLU), guanylate cyclase-1β (GUCY1B3), frizzled-like-8 (FZD8), heme oxygenase-1 (HMOX1), CD34, the transcription factor forkhead box C1 (FOXC1), leptin receptor (LEPR), matrilin-2 (MATN2), prominin-1 (PROM1) and sulfatase-1 (SULF1).
Zyxin-activated genes
ELF4 (-266): 5’-CTCCCTCCGG CTCTTCCCTC CCTCCCGA-3’
ET-1 (-136): 5’-GGCAGGCGCT TCCTTTTCTC CCCGTAAG-3’
HMCN1 (-670): 5’-GCGTTGTCCT CCCTTCCTTC CCTGCAGA-3’
IL-8 (-685): 5’-GTCCTTACAT TCTTTCTTCT TCTGATAG-3’
LAMC2 (-76): 5’-CCCGGAGCCC TCCTTCTCTC CCGGGGTG-3’
FOXO1 (-597): 5’-AGATTCTGTT TCTCCTTCTC AGAGGTTC-3’
Notch2 (-446): 5’-ATGTGAAATC CTTCCCTTTC TGAGCTGA-3’
HMGCR (-475): 5’-CCGTCGCCGC CTCCTTCCCT TTTTTTAT-3’
Zyxin-repressed genes
SEL-E (-230): 5’-CTAAAACCTG TCTTTTCTCT TTGACCTG-3’
ICAM-1 (-473): 5’-TCACGCAGCT TCCTTCCTTT TTCTGGGA-3’
VCAM-1 (-315): 5’-TGTCTCCATT TTTTCTCTCC CCACCCCC-3’
ITGB6 (-606): 5’-CTTTCCCTAG CCTTCCTTCT CATTTACT-3’
Hey-1 (-228): 5’-CCGCGCCTCC TCCTTCCCCT GAGTGCAG-3’
Although not comprehensive yet, the PyPu box is found in zyxin-regulated genes
in SMC such as, e.g. the motif at the position -113 to -99 (5’CCT TCC CCT CCC
CTT 3’) of the calponin gene.
4.4.1 Zyxin association with the PyPu box:
To test whether zyxin really interacts with this PyPu motif, chromatin
immunoprecipitation (ChIP) was performed for 9 stretch-sensitive genes, i.e. IL-8,
Hey1, HMCN1, ET-1, ELF4, LAMC3, FOXO1, Notch2 and HMGCR. ChIP
analysis revealed that zyxin in fact interacts with the promoter region around the
PyPu box of these genes. Genes that are expressed independently of zyxin did not
emerge with the B72 anti-sera employed for this assay (Figure 16).

RREESSUULLTTSS
49
(A)
(B)
Figure 16: Zyxin-DNA interactions. Chromatin immunoprecipitation (antibodies used were against RNA polymerase II (positive control) and zyxin) analysis of 9 gene products. (A) Summary of 3 independent analyses (relative densitometric ratio of DNA bands from stretched vs static cells). Besides the zyxin-dependent genes IL-8, VCAM-1, HMNC1, Hey-1, HMGCR and ICAM-1, zyxin-independent gene products guanylate cylcase-1B3 (GUCY-1B3), clusterin/apolipoprotein J (CLU) and JAM2) and ET-1 are shown in exemplary agarose gels (B).
5
1
10
Fol
d in
tens
ity (
arb
itrar
y un
its)
Quiescent
Hey-1
IL-8
CLU,GUCY
HMNC
VCAM-1
ET-1
HMGCRICAM-1
Stretch(0.5 Hz/10%)
JAM2
Clusterin
VCAM-1
ICAM-1
HMNC1
HMGCR
JAM2
Stretch+ +
IL-8
α-pol 2 α-zyxin
Hey-1
ET-1
GUCY-1B3
α-pol 2 α-zyxin
Stretch + +

RREESSUULLTTSS
50
4.4.2 PyPu box mimicking decoy oligonucleotide (decoy ODN)
To further corroborate the above finding, cultured EC were pre-incubated with a
decoy ODN that mimic the PyPu box sequence in the human prepro-endothelin-1
(ET-1) gene; edn1, 5’-GCA CTT CCT TCC TTT TCC CGA A- 3’; position -163
to -136. As expected, the decoy ODN virtually abolished the stretch-induced
expression of IL-8, as well as that of prepro-ET-1, another well-known stretch-
sensitive gene whereas the scrambled control ODN did not show any effect on
expression of these two stretch-sensitive genes (Figure 17).
Figure 17: Effects of a PyPu-dODN on zyxin-dependent gene expression. Real time-PCR analysis of static and stretch-induced (6 hours) IL-8 and prepro-ET-1 mRNA expression in the absence (open columns) or presence of a decoy ODN (10 µmol/L; 1 hour pre-incubation) mimicking the PyPu box of the edn1 gene (PyPu; filled columns) or a scrambled control ODN (scr; hatched columns) (*p < 0.05 vs. static control, #p < 0.05 vs. stretched control; n = 6).
Moreover, an electrophoretic mobility shift assay (EMSA) using a probe with a
sequence identical to that of the decoy ODN finally confirmed that in human
cultured EC exposed to cyclic stretch a nuclear protein–DNA complex forms that
according to supershift analysis with two different zyxin-specific antibodies
contain zyxin (Figure 18).
mR
NA
(105 ×
copi
es/µg
RN
A)
IL-8 ET-1
stretchdODN (PyPu)dODN (scr)
0
*
*
#
* #
5
10
+ ++ +
+ +
+ ++ +
+ +
++
*
*
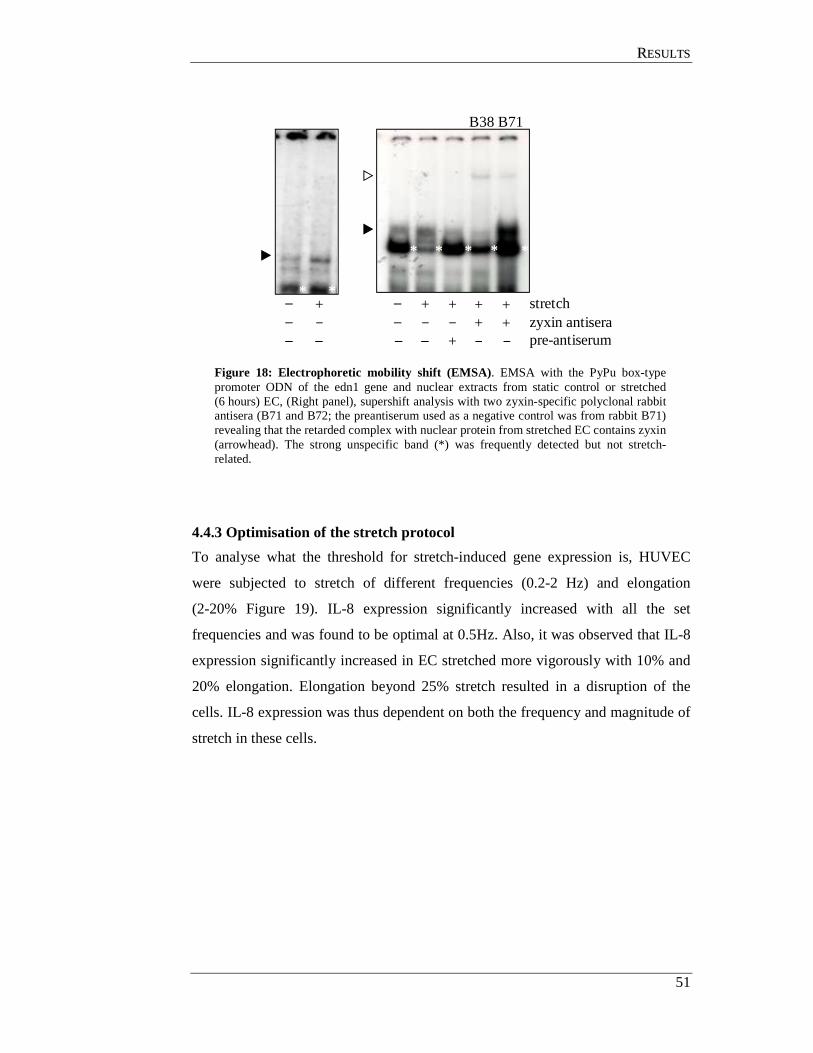
RREESSUULLTTSS
51
Figure 18: Electrophoretic mobility shift (EMSA). EMSA with the PyPu box-type promoter ODN of the edn1 gene and nuclear extracts from static control or stretched (6 hours) EC, (Right panel), supershift analysis with two zyxin-specific polyclonal rabbit antisera (B71 and B72; the preantiserum used as a negative control was from rabbit B71) revealing that the retarded complex with nuclear protein from stretched EC contains zyxin (arrowhead). The strong unspecific band (*) was frequently detected but not stretch-related.
4.4.3 Optimisation of the stretch protocol
To analyse what the threshold for stretch-induced gene expression is, HUVEC
were subjected to stretch of different frequencies (0.2-2 Hz) and elongation
(2-20% Figure 19). IL-8 expression significantly increased with all the set
frequencies and was found to be optimal at 0.5Hz. Also, it was observed that IL-8
expression significantly increased in EC stretched more vigorously with 10% and
20% elongation. Elongation beyond 25% stretch resulted in a disruption of the
cells. IL-8 expression was thus dependent on both the frequency and magnitude of
stretch in these cells.
+ + ++
stretchzyxin antiserapre-antiserum
++
+
+
B38B71
**
* * * * *
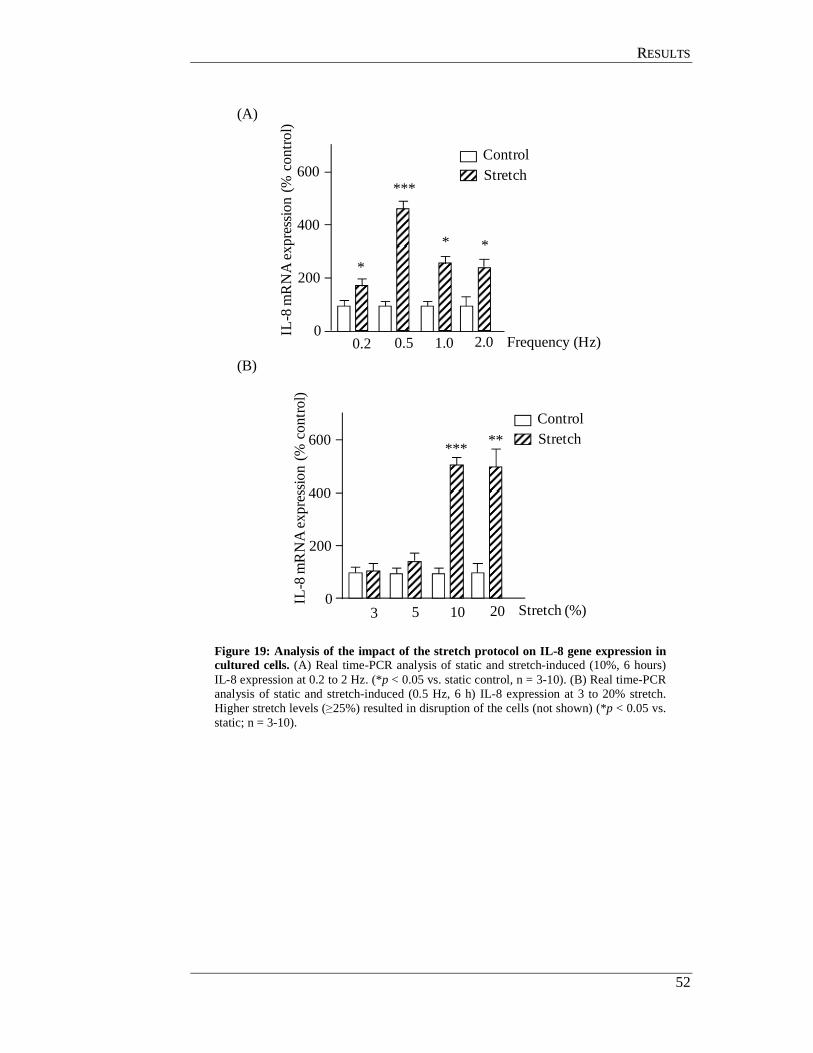
RREESSUULLTTSS
52
(A)
(B)
Figure 19: Analysis of the impact of the stretch protocol on IL-8 gene expression in cultured cells. (A) Real time-PCR analysis of static and stretch-induced (10%, 6 hours) IL-8 expression at 0.2 to 2 Hz. (*p < 0.05 vs. static control, n = 3-10). (B) Real time-PCR analysis of static and stretch-induced (0.5 Hz, 6 h) IL-8 expression at 3 to 20% stretch. Higher stretch levels (≥25%) resulted in disruption of the cells (not shown) (*p < 0.05 vs. static; n = 3-10).
0
200
600
400
IL-8
mR
NA
exp
ress
ion
(% c
ontr
ol)
*
Frequency (Hz)0.2
***
* *
0.5 1.0 2.0
ControlStretch
Stretch (%)0
200
600
400
IL-8
mR
NA
exp
ress
ion
(% c
ontr
ol)
3
*****
5 10 20
ControlStretch

RREESSUULLTTSS
53
Mechanism of stretch-induced zyxin activation
After confirming that zyxin is crucial for stretch-induced gene expression in EC
and SMC, the signalling events leading to stretch-induced zyxin activation moved
into the focus of the project.
4.5 Components of the signalling cascade activated by wall tension
4.5.1 Effect of mechanosensitive pathway inhibitors on zyxin translocation
Initially, several inhibitors/agonists that are known to interact with
mechanosensitive pathways in EC, SMC or cardiomyocytes were used for a
preliminary analysis of components potentially involved in stretch-induced
signalling in EC. The zyxin tanslocation dependent expression of the chemokine,
interleukin-8 (IL-8) was used as read-out.
Table 21: Potential stretch induced pathways mediators and their blockers or stimulators. The above indicated concentration of each stimulator and/or inhibitor was used in cell culture.
Potential mediators Blockers/Stimulators Concentration
TRP channel blocker Gadolinium chloride (Gd3+) 100 µmol/l B-type endothelin-1 (ET-1) receptor-specific antagonist
BQ788 10 nmol/l
protein kinase G (PKG) blocker
8-(4-Chlorophenylthio)-guanosine 3′,5′-cyclic monophosphoro-thioate (Rp8)
100 µmol/l
Rho associated protein kinase (ROCK) inhibitor
Y27632 3 µmol/l
Endothelin-1 (ET-1) - 10 nmol/l Atrial natriuretic peptide (ANP)
- 1 nmol/l
Whereas most generic inhibitors or activators of these pathways (e.g., nitric oxide
synthesis, p38-MAP kinase or ERK1/2, not shown) had no effect, the broad
spectrum inhibitor of TRP channels blocker, gadolinium, the B-type ET-1 receptor
antagonist BQ788 and the protein kinase G inhibitor, Rp8 all prevented zyxin
translocation to the nucleus in EC (Figure 20).
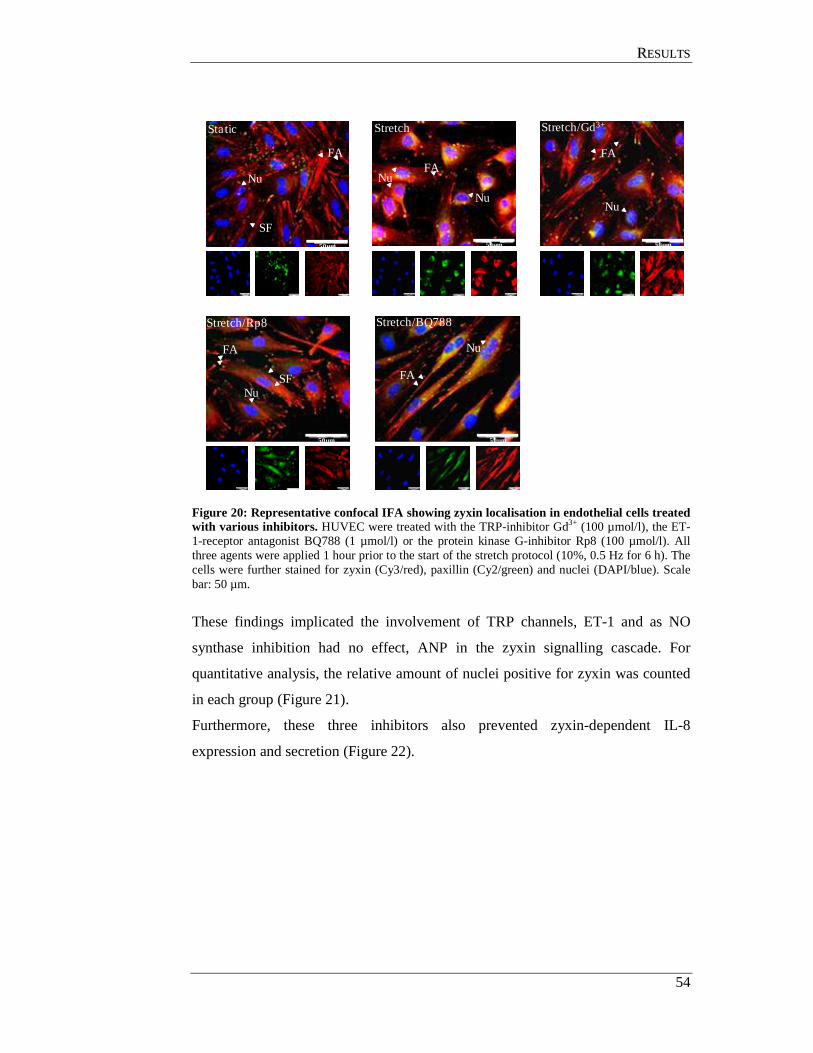
RREESSUULLTTSS
54
Figure 20: Representative confocal IFA showing zyxin localisation in endothelial cells treated with various inhibitors. HUVEC were treated with the TRP-inhibitor Gd3+ (100 µmol/l), the ET-1-receptor antagonist BQ788 (1 µmol/l) or the protein kinase G-inhibitor Rp8 (100 µmol/l). All three agents were applied 1 hour prior to the start of the stretch protocol (10%, 0.5 Hz for 6 h). The cells were further stained for zyxin (Cy3/red), paxillin (Cy2/green) and nuclei (DAPI/blue). Scale bar: 50 µm.
These findings implicated the involvement of TRP channels, ET-1 and as NO
synthase inhibition had no effect, ANP in the zyxin signalling cascade. For
quantitative analysis, the relative amount of nuclei positive for zyxin was counted
in each group (Figure 21).
Furthermore, these three inhibitors also prevented zyxin-dependent IL-8
expression and secretion (Figure 22).
Static
Stretch/BQ788
FA
Nu
Stretch/Rp8
FA
SFNu
Stretch
Nu
Nu
FA
Stretch/Gd3+
Nu
FAFA
SF
Nu
50µm 50µm 50µm
50µm 50µm

RREESSUULLTTSS
55
Figure 21: Statistical summary of zyxin localisation in stretched EC treated with Gd3+, the ET-1 receptor antagonist BQ788 or the protein kinase G-inhibitor Rp8. Nuclei were counted in 3 independent experiments (200 nuclei per experiment). As indicated in the diagram, blank columns represent zyxin-negative nuclei and hatched columns represent zyxin-positive nuclei. (*p < 0.01 vs. static control).
(A) (B)
Figure 22: Effects of Gd3+, BQ788 and Rp8 on IL-8 expression and release in stretched EC. Analysis of stretch-induced IL-8 mRNA (A, real time RT-PCR) and protein (B, ELISA) expression. All agents were applied as described in Table 22. All three inhibitors repressed the stretch-induced release of IL-8 (*p < 0.01 vs. static control, #p < 0.01 vs. stretched cells, n = 3).
nucl
ei (
%
of c
ount
ed)
0
40
100
80
60
20
StretchGd3+
BQ788Rp8+
++
+ +++
Zyxin-
Zyxin+*
*
#
StretchGd3+
BQ788Rp8
+ ++
IL-8
pro
tein
(10
3×p
g/m
l)
0
2.0
6.0
4.0
3.0
1.0
5.0
7.0
StretchsiRNAGd3+
BQ788Rp8
*
++
+
+
+ ++++
##
# #
IL-8
mR
NA
(×10
2co
pie
s/ng
RN
A)
0
10
5
15
20
#
+
+
#
+
+

RREESSUULLTTSS
56
4.5.2 Effect of ANP and ET-1 on zyxin translocation
As inhibition of nitric oxide synthesis, another source of PKG-activation had no
inhibitory effect, we hypothesized, that an endogenous (thus endothelium-derived)
natriuretic peptide acting via one of its particulate guanylyl cyclase receptors (GC-
A/B) might be responsible for stretch-induced PKG activation in an autocrine
manner. As atrial natriuretic peptide (ANP) and the receptors GC-A and GC-B but
not the brain (B-type) or C-type peptides or the C-type receptor are expressed in
significant amounts in the cultured EC, the effects of ANP and ET-1 on zyxin
activation were tested. In fact, both ET-1 (10 nmol/l) and ANP (1 nmol/l)
mimicked the effects of stretch on the EC by leading to translocation of zyxin to
the nucleus in a BQ788- and Rp8-inhibitable manner (doctoral thesis of Agnieszka
Wojtowicz, Heidelberg, 2008).
To confirm these findings, EC were additionaly treated with ET-1 and/or ANP,
and immunofluorescence analysis was carried out to test if they mediate zyxin
translocation to the nucleus. Indeed, ET-1 (10 nmol/l) as well as ANP (1 nmol/l)
mimicked this effect of stretch on the endothelial cell phenotype, leading to
nuclear accumulation of zyxin. This was inhibitable by BQ788 and Rp8
(Figure 23).
4.5.3 Effect of the TRP blocker gadolinium on stretch induced ANP and ET-1 expression in endothelial cells
To observe if gadolinium has an effect on stretch induced ET-1 and ANP mRNA
expression, EC were treated with gadolinium as described before. Interestingly,
gadolinium did not influence the stretch-induced expression of both mediators
(Figure 24) suggesting that ET-1 and ANP mRNA expression in these cells is
stretch but not gadolinium dependent and, hence, zyxin-dependent.

RREESSUULLTTSS
57
Figure 23: Representative confocal IFA of zyxin localisation in HUVEC. (A) The cells were treated with ET-1 (10 nmol/l), ANP (1 nmol/l), BQ788 (10 nmol/l), Rp8 (100 µmol/l) alone or in combination for 6 hours. ET-1 (10 nmol/l) and ANP (1 nmol/l) caused the nuclear translocation of zyxin which was inhibited by BQ788 and Rp8, respectively. Scale bar: 50 µm.
Figure 24: Real time PCR analysis of the effects of stretch and TRP channel inhibition on ET-1 and ANP mRNA expression in EC. Both, ET-1 and ANP expression is stretch-sensitive but insensitive to Gd3+(100 µmol/l). The cells were treated with Gd3+ and subjected to stretch protocol (10%, 0.5 Hz, 6 h). The mRNA expression of pro-ANP and ET-1 was analysed by real time PCR (*p < 0.01 vs. static control, n = 5).
Static/ET-1
SF
Nu
FA
Static/ET-1/BQ788
SF
NuFA
DAPI Paxillin Zyxin
Static/ANP/Rp8
FA
SF
Nu
Static/ANP
FA
SFNu
50µm50µm
50µm 50µm
0
200
500
400
300
100
mR
NA
exp
ress
ion
(% c
ontr
ol)
*
ET-1 ANP
*
StretchGd3+
+ +++
+ +++
*
*

RREESSUULLTTSS
58
In contrast, at the protein level, the release of both peptides was strongly inhibited
by gadolinium (Figure 25). In conjugation with the mRNA expression data this
suggests that the stretch-induced synthesis of both mediators but not their release
from the EC is independent from zyxin. As both peptides are implicated in the
stretch induced activation of zyxin, this outcome is not unexpected.
(A) (B)
Figure 25: ELISA revealing the effects of gadolinium on stretch-induced proANP and ET-1 release from the EC. The cells were treated with Gd3+ and subjected to stretch protocol (10%, 0.5 Hz, 6 h). The supernatant was collected immediately after the stretch protocol and ELISA was performed for (A) pro-ANP and (B) ET-1 (*p< 0.05 vs. static control, n = 3).
4.6 Hierarchy of TRPs, ANP and ET-1 in zyxin translocation pathway in endothelial cells
To further understand how TRP channels, ET-1 and ANP are involved in zyxin
activation, complementation experiments were performed for zyxin translocation.
Stretch-induced nuclear accumulation of zyxin was inhibited by gadolinium.
However, gadolinium did not have an effect on stretch-induced migration of zyxin
when the cells were treated with exogenous ET-1 and ANP, suggesting that TRP
channels are upstream of ET-1 and ANP in the zyxin signalling cascade. Similarly,
the ETB-R antagonist BQ788 blocked zyxin translocation in stretched cells but
exogenous ANP was able to bypass the BQ788 blockade of zyxin translocation
0
0.4
1.0
0.8
0.6
0.2
proA
NP
pro
tein
(nm
ol/L
)
*
StretchGd3+
+ +++
0
40
100
80
60
20ET-
1 pr
otei
n (n
mol
/L)
*
StretchGd3+
+ +++
**
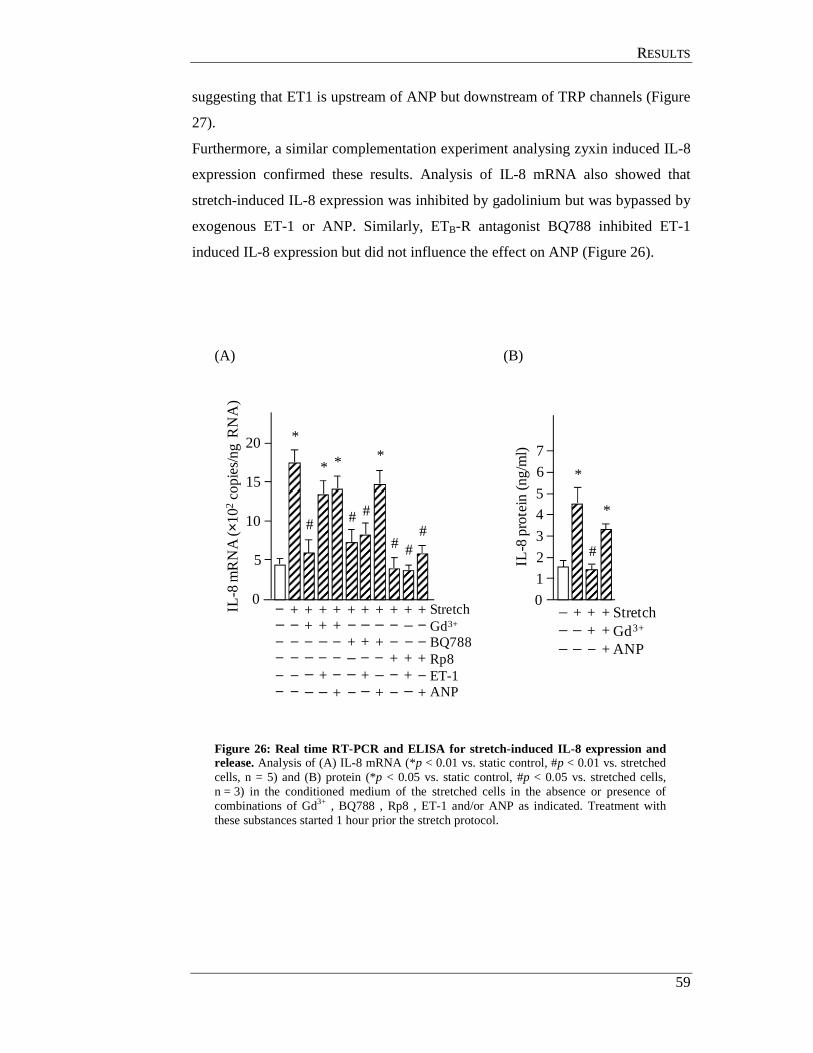
RREESSUULLTTSS
59
suggesting that ET1 is upstream of ANP but downstream of TRP channels (Figure
27).
Furthermore, a similar complementation experiment analysing zyxin induced IL-8
expression confirmed these results. Analysis of IL-8 mRNA also showed that
stretch-induced IL-8 expression was inhibited by gadolinium but was bypassed by
exogenous ET-1 or ANP. Similarly, ETB-R antagonist BQ788 inhibited ET-1
induced IL-8 expression but did not influence the effect on ANP (Figure 26).
(A) (B)
Figure 26: Real time RT-PCR and ELISA for stretch-induced IL-8 expression and release. Analysis of (A) IL-8 mRNA (*p < 0.01 vs. static control, #p < 0.01 vs. stretched cells, n = 5) and (B) protein (*p < 0.05 vs. static control, #p < 0.05 vs. stretched cells, n = 3) in the conditioned medium of the stretched cells in the absence or presence of combinations of Gd3+ , BQ788 , Rp8 , ET-1 and/or ANP as indicated. Treatment with these substances started 1 hour prior the stretch protocol.
10
5
15
20
*
StretchGd3+
ANP+
+
IL-8
pro
tein
(ng
/ml)
0
2
6
4
3
1
5
7
*
++++
StretchGd3+
BQ788Rp8ET-1 ANP+
+
*
+ ++
+
+
*
+++
#
+
++
+
*
+
#
+ ++
+
+
#
+
+
+ + +
*
# ##
IL-8
mR
NA
(×10
2co
pie
s/ng
RN
A)
0
#
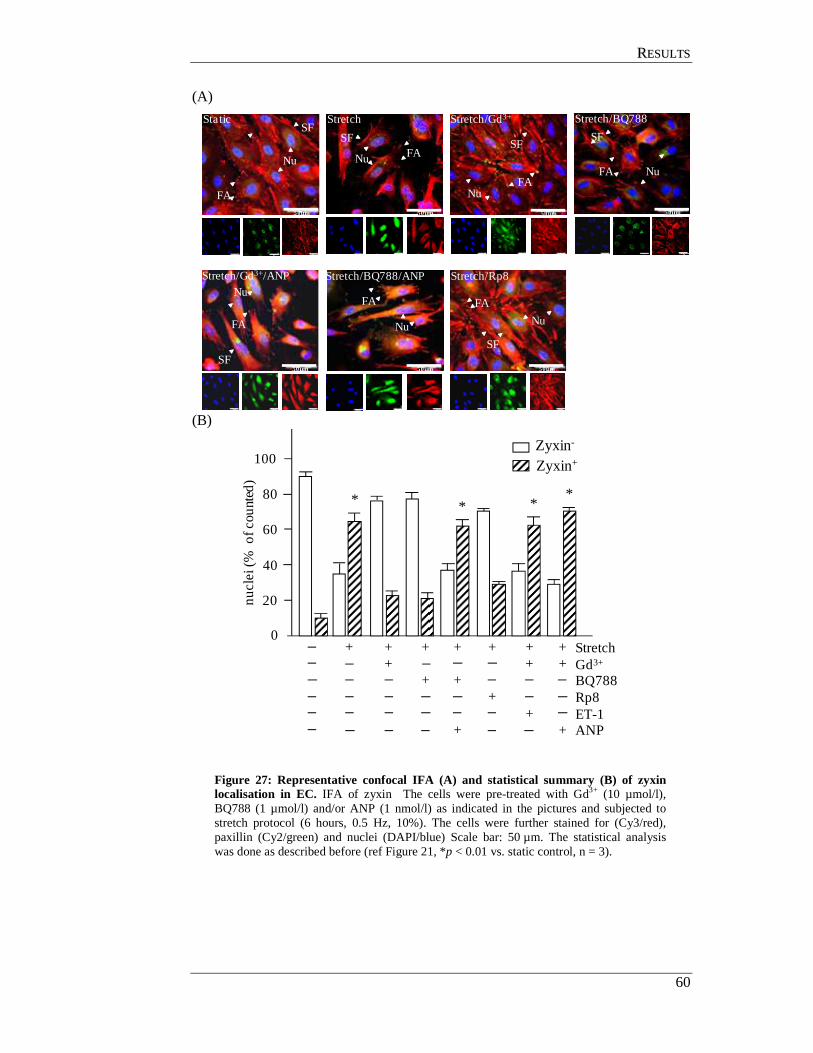
RREESSUULLTTSS
60
(A)
(B)
Figure 27: Representative confocal IFA (A) and statistical summary (B) of zyxin localisation in EC. IFA of zyxin The cells were pre-treated with Gd3+ (10 µmol/l), BQ788 (1 µmol/l) and/or ANP (1 nmol/l) as indicated in the pictures and subjected to stretch protocol (6 hours, 0.5 Hz, 10%). The cells were further stained for (Cy3/red), paxillin (Cy2/green) and nuclei (DAPI/blue) Scale bar: 50 µm. The statistical analysis was done as described before (ref Figure 21, *p < 0.01 vs. static control, n = 3).
Static
FA
SF
NuFA
SF
Nu
Stretch Stretch/BQ788
FA
SF
Nu
Stretch/Gd3+/ANPNu
FA
SF
Stretch/BQ788/ANP
Nu
FA
Stretch/Rp8
Nu
FA
SF
FA
SF
Nu
Stretch/Gd3+
50µm 50µm 50µm 50µm
50µm 50µm50µm
StretchGd3+
BQ788Rp8ET-1ANP
* * **
nu
cle
i (%
of c
ount
ed)
0
40
100
80
60
20
+ + + + ++
+
++
+
+
+
+
+
+
+
Zyxin-
Zyxin+
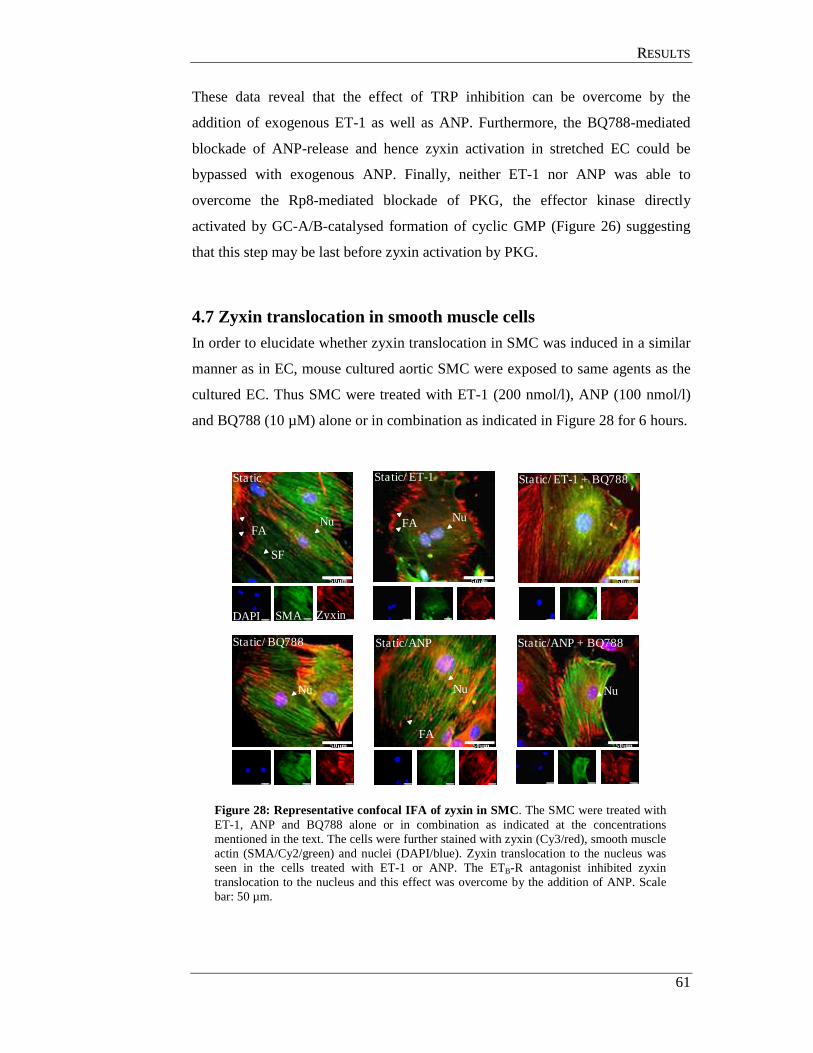
RREESSUULLTTSS
61
These data reveal that the effect of TRP inhibition can be overcome by the
addition of exogenous ET-1 as well as ANP. Furthermore, the BQ788-mediated
blockade of ANP-release and hence zyxin activation in stretched EC could be
bypassed with exogenous ANP. Finally, neither ET-1 nor ANP was able to
overcome the Rp8-mediated blockade of PKG, the effector kinase directly
activated by GC-A/B-catalysed formation of cyclic GMP (Figure 26) suggesting
that this step may be last before zyxin activation by PKG.
4.7 Zyxin translocation in smooth muscle cells In order to elucidate whether zyxin translocation in SMC was induced in a similar
manner as in EC, mouse cultured aortic SMC were exposed to same agents as the
cultured EC. Thus SMC were treated with ET-1 (200 nmol/l), ANP (100 nmol/l)
and BQ788 (10 µM) alone or in combination as indicated in Figure 28 for 6 hours.
Figure 28: Representative confocal IFA of zyxin in SMC. The SMC were treated with ET-1, ANP and BQ788 alone or in combination as indicated at the concentrations mentioned in the text. The cells were further stained with zyxin (Cy3/red), smooth muscle actin (SMA/Cy2/green) and nuclei (DAPI/blue). Zyxin translocation to the nucleus was seen in the cells treated with ET-1 or ANP. The ETB-R antagonist inhibited zyxin translocation to the nucleus and this effect was overcome by the addition of ANP. Scale bar: 50 µm.
Static
Static/ANPStatic/ BQ788
Static/ ET-1 Static/ ET-1 + BQ788
FANu
SF
Nu
FA
Static/ANP + BQ788
Nu
FA Nu
Nu
DAPI SMA Zyxin
50µm 50µm 50µm
50µm50µm50µm
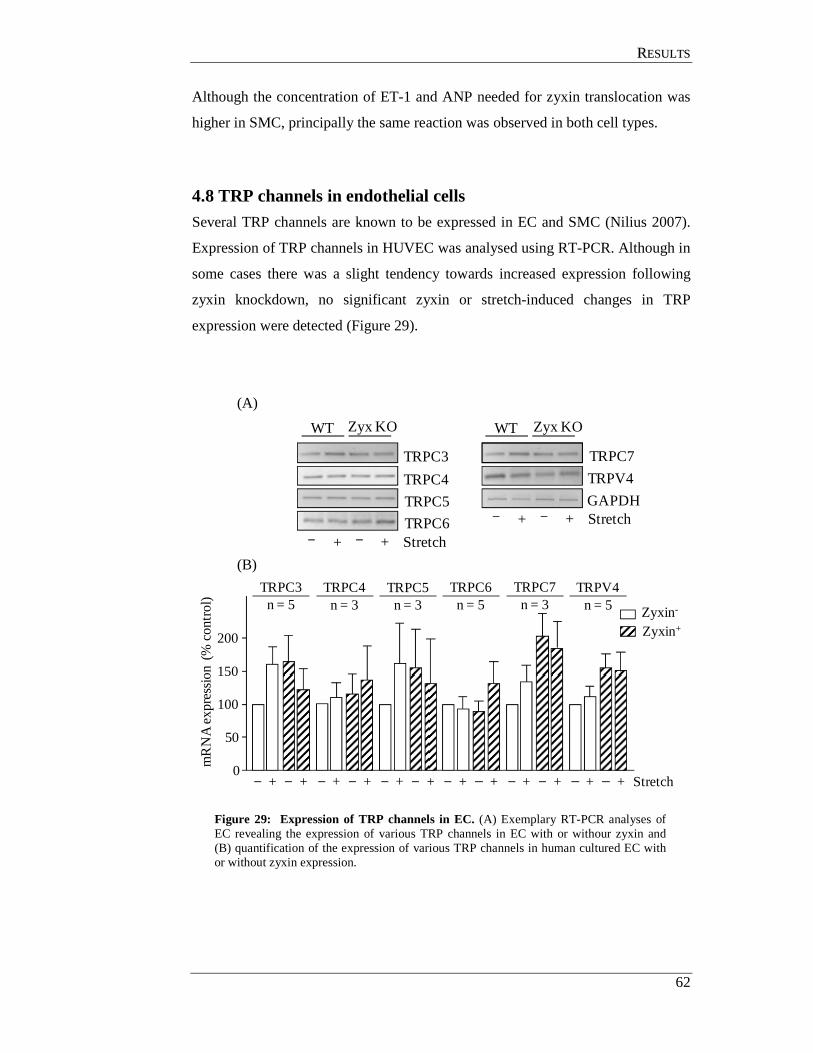
RREESSUULLTTSS
62
Although the concentration of ET-1 and ANP needed for zyxin translocation was
higher in SMC, principally the same reaction was observed in both cell types.
4.8 TRP channels in endothelial cells Several TRP channels are known to be expressed in EC and SMC (Nilius 2007).
Expression of TRP channels in HUVEC was analysed using RT-PCR. Although in
some cases there was a slight tendency towards increased expression following
zyxin knockdown, no significant zyxin or stretch-induced changes in TRP
expression were detected (Figure 29).
(A)
(B)
Figure 29: Expression of TRP channels in EC. (A) Exemplary RT-PCR analyses of EC revealing the expression of various TRP channels in EC with or withour zyxin and (B) quantification of the expression of various TRP channels in human cultured EC with or without zyxin expression.
GAPDH
TRPC3
TRPC6
TRPC7
TRPV4TRPC4
TRPC5
WT Zyx KO
Stretch+ +
Stretch+ +
WT Zyx KO
0
50
200
100
mR
NA
exp
ress
ion
(% c
ontr
ol)
Stretch+ +
TRPC3n = 5
150
+ +
TRPC4n = 3
+ +
TRPC5n = 3
+ +
TRPC6n = 5
+ +
TRPC7n = 3
+ +
TRPV4n = 5 Zyxin-
Zyxin+

RREESSUULLTTSS
63
4.9 In situ perfusion analysis of femoral arteries derived from TRP- deficient mice Although the effect of Gd3+ suggests the involvement of TRP channels, it was not
clear whether a single or several channels are responsible for zyxin activation nor
which potential candidate may be the stretch-inducible channel. Therefore, the
effects of stretch on zyxin translocation in native EC of femoral arteries derived
from mice deficient in TRPC1,4,5 as well in those deficient in TRPC3,6 were
analysed (Figure 30).
Immunofluorescence analysis of cross sections of the perfused vessels from
wildtype mice showed a clear nuclear translocation of zyxin in EC which was also
observed in the femoral arteries of TRPC1,4,5 triple knockout animals. In contrast,
there was no prominent nuclear translocation of zyxin with the corresponding
vessel of TRPC3,6 double knockout mice after pressure perfusion (Figure 30)
indicating that either TRPC3 or TRPC6 is necessary for translocation of zyxin to
the nucleus during stretch.
Figure 30: Representative confocal IFA images of zyxin localisation in mouse femoral arterial EC. Pressure perfusion (150 mm Hg) caused nuclear translocation of zyxin in arterial EC of the (A) wildtype and (B) TRPC1,4,5 deficient but not in the (C) TRPC3,6 deficient mice. Parffin sections of these arteries were stained for zyxin (Cy3/red) and nuclei (DAPI/blue). The green channel depicts the auto-fluorescence of elastic vessel fibres. Scale bar: 50 µm.
TRPC1,4,5 -/-/ 150 mm TRPC3,6 -/-/ 150 mm
EC
SMC EC
SMC EC
SMC
50µm 50µm50µm
TRPC1,4,5 -/-/ 20 mm Hg TRPC3,6 -/-/ 20 mm Hg
Zyxin /Dapi
Wildtype/ 20 mm Hg
Wildtype/150 mm Hg
50µm 50µm50µm
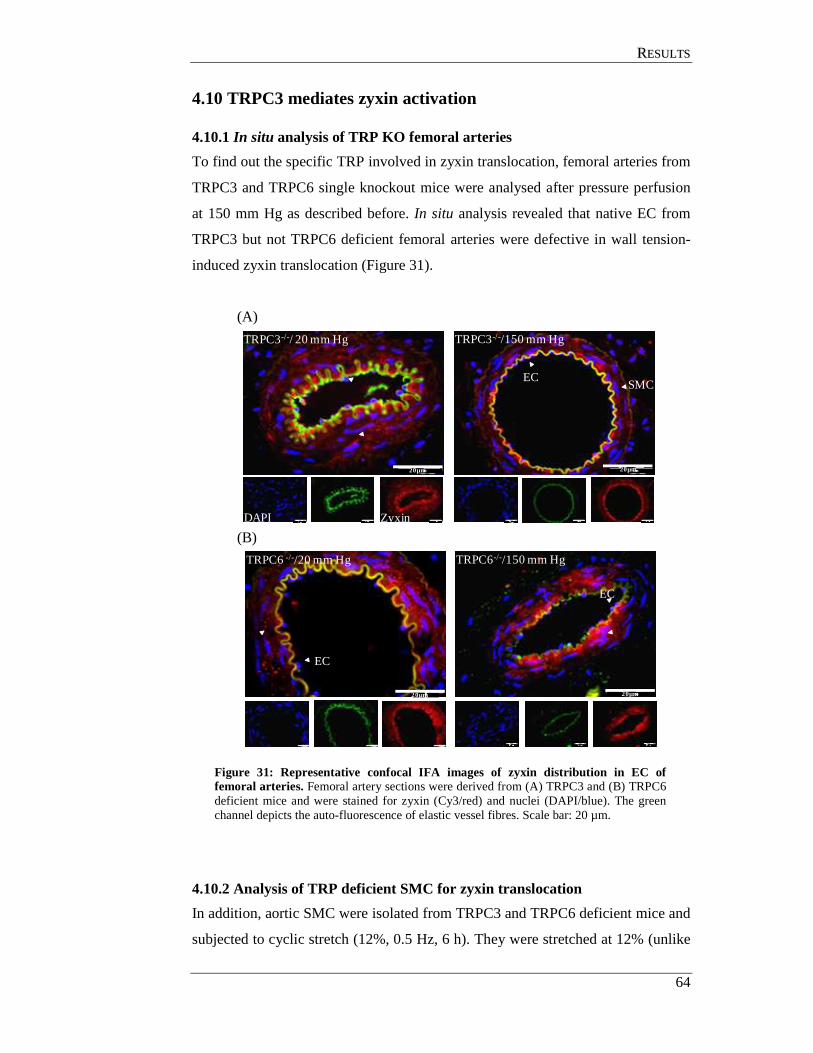
RREESSUULLTTSS
64
4.10 TRPC3 mediates zyxin activation
4.10.1 In situ analysis of TRP KO femoral arteries
To find out the specific TRP involved in zyxin translocation, femoral arteries from
TRPC3 and TRPC6 single knockout mice were analysed after pressure perfusion
at 150 mm Hg as described before. In situ analysis revealed that native EC from
TRPC3 but not TRPC6 deficient femoral arteries were defective in wall tension-
induced zyxin translocation (Figure 31).
(A)
(B)
Figure 31: Representative confocal IFA images of zyxin distribution in EC of femoral arteries. Femoral artery sections were derived from (A) TRPC3 and (B) TRPC6 deficient mice and were stained for zyxin (Cy3/red) and nuclei (DAPI/blue). The green channel depicts the auto-fluorescence of elastic vessel fibres. Scale bar: 20 µm.
4.10.2 Analysis of TRP deficient SMC for zyxin translocation
In addition, aortic SMC were isolated from TRPC3 and TRPC6 deficient mice and
subjected to cyclic stretch (12%, 0.5 Hz, 6 h). They were stretched at 12% (unlike
TRPC3-/-/150 mm HgTRPC3-/-/ 20 mm Hg
ZyxinDAPI
ECSMC
20µm 20µm
TRPC6 -/-/20 mm Hg TRPC6-/-/150 mm Hg
EC
EC
20µm20µm

RREESSUULLTTSS
65
the EC which were normally stretched between 0 and 10%) because they are more
resistant to stretch than EC (Figure 32).
(A)
(B)
(C)
Figure 32: Representative confocal IFA images of zyxin in SMC derived from TRP deficient mice. SMC derived from aorta of (A) wild type mice and (B) TRPC3 deficient mice were subjected to the stretch protocol as described in the text and IFA was performed for zyxin (Cy3/red), α-actin (Cy2/green), nuclei (DAPI/blue). Scale bar: 50 µm. (C) For the statistical summary, 100 randomly selected nuclei were counted. (*p < 0.01 vs. static control, n = 3).
Static/Wild type Stretch/Wild type
Dapi SMA Zyxin
Nu
FA Nu
FA
50µm 50µm
Static/TRPC3-/- Stretch/TRPC3-/-
FA
Nu FA Nu
50µm 50µm
+ +
WT C3-/-
*
Stretch+
C6-/-
*
Zyxin-
Zyxin+
nucl
ei (
%
of c
ount
ed)
0
40
100
80
60
20

RREESSUULLTTSS
66
In line with the vessel data, aortic SMC derived from TRPC3-deficient animals
neither displayed stretch-induced zyxin translocation (Figure 32) nor expression of
stretch-sensitive gene products in SMC such as calponin or thrombomodulin
(Figure 33).
The expression of thrombomodulin increased upon stretch in the wildtype SMC
whereas in the TRPC3 deficient mice, stretch-induced expression was suppressed.
Furthermore, the stretch induced regulation of calponin expression was absent in
TRPC3 deficient SMC.
(A)
(B)
Figure 33: Real time RT-PCR analysis of (A) calponin and (B) thrombomodulin in SMC. The stretch-induced regulation of calponin and thrombomodulin was absent in the SMC derived from TRPC3,6 and TRPC3 deficient mice. Calponin (*p < 0.01 vs. static control, n = 5) and thrombomodulin (*p < 0.01 vs. static control, n = 5) mRNA expression was analysed in response to stretch (12%, 0.5 Hz for 6 h) in cells with a wild type genome (WT), deficiency in TRPC3,6 (C3C6), or deficiency in one of the channels (C3 and C6, respectively).
Stretch0
25
100
75
Ca
lpon
in m
RN
A e
xpre
ssio
n (%
con
trol
)
*
+ + + +
*
WT C3C6 C3 C6
50
0
100
300
200
Thr
ombo
mod
ulin
mR
NA
expr
essi
on (
% c
ontr
ol) *
Stretch+ + + +
*
WT C3C6 C3 C6
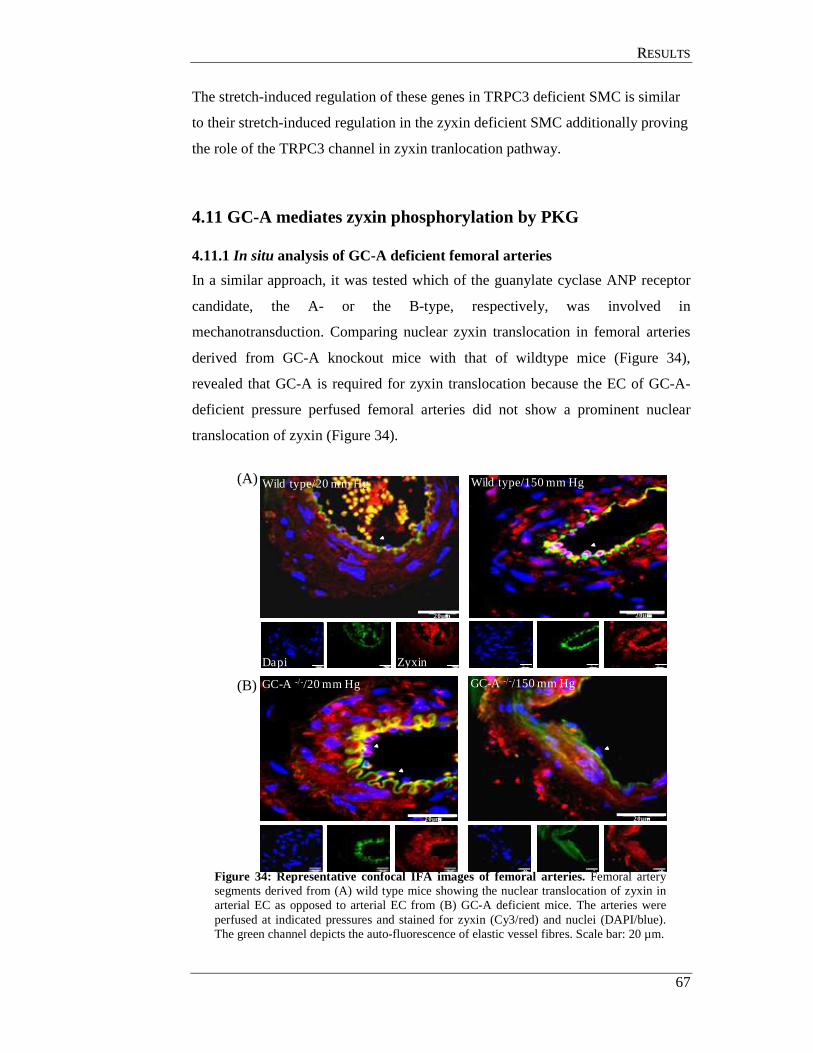
RREESSUULLTTSS
67
The stretch-induced regulation of these genes in TRPC3 deficient SMC is similar
to their stretch-induced regulation in the zyxin deficient SMC additionally proving
the role of the TRPC3 channel in zyxin tranlocation pathway.
4.11 GC-A mediates zyxin phosphorylation by PKG
4.11.1 In situ analysis of GC-A deficient femoral arteries
In a similar approach, it was tested which of the guanylate cyclase ANP receptor
candidate, the A- or the B-type, respectively, was involved in
mechanotransduction. Comparing nuclear zyxin translocation in femoral arteries
derived from GC-A knockout mice with that of wildtype mice (Figure 34),
revealed that GC-A is required for zyxin translocation because the EC of GC-A-
deficient pressure perfused femoral arteries did not show a prominent nuclear
translocation of zyxin (Figure 34).
(A)
(B)
Figure 34: Representative confocal IFA images of femoral arteries. Femoral artery segments derived from (A) wild type mice showing the nuclear translocation of zyxin in arterial EC as opposed to arterial EC from (B) GC-A deficient mice. The arteries were perfused at indicated pressures and stained for zyxin (Cy3/red) and nuclei (DAPI/blue). The green channel depicts the auto-fluorescence of elastic vessel fibres. Scale bar: 20 µm.
Wild type/150 mm HgWild type/20 mm Hg
ZyxinDapi
20µm 20µm
GC-A -/-/20 mm Hg GC-A -/-/150 mm Hg
20µm 20µm

RREESSUULLTTSS
68
Additionally, the reactivity of pressure perfused GC-A knockout femoral arteries
to vasoactive agents such as epinephrine, acetylcholine and ET-1 was similarly
blunted as in the zyxin knockout arteries suggesting that a similar defect in stretch-
induced signalling occurs in these vessels (Figure 35).
Figure 35: Response of GC-A or zyxin deficient femoral arteries to changes in hydrostatic pressure or to vasoactive agents: Intraluminal pressure was set to 50 mm Hg in order to allow both dilator and constrictor responses. Phenylephrine (at 10 nmol/l, 100 nmol/l and 1 µmol/l, respectively), ET-1 (at 10 nmol/l, 100 nmol/l and 1 µmol/l, respectively) and acetylcholine (10 nmol/l, 100 nmol/l and 1 µmol/l) were consecutively added extra-luminally. The femoral arteries were isolated from 5-12 week old mice (*p < 0.05 vs. control, n = 5).
4.11.2 Analysis of GC-A deficient smooth muscle cell
Further, aortic SMC derived from GC-A knock-out mice were analysed in the
same way as SMC derived from TRPC knockout mice (ref 4.10.2). The analysis
revealed that the translocation of zyxin to the nucleus of stretched GC-A knockout
SMC was significantly low as compared to the wild type SMC further confirming
the role for GC-A in zyxin translocation to the nucleus in response to stretch
(Figure 36).
WTGC-A KO
0
50
100
150
200
250
- + - - - - - - - - - - - - 20 mm Hg- - + - - - - - - - - - - - 30 mm Hg- - - + - - - - - - - - - - 40 mm Hg- - - - + + + + + + + + + + 50 mm Hg- - - - - -8 -7 -6 - - - - - - Epinephrine- - - - - - - - -8 -7 -6 - - - Achetylcholine- - - - - - - - - - - -8 -7 -6 ET-1
Ves
sel d
iam
eter
(%
uni
ts) Zyxin KO
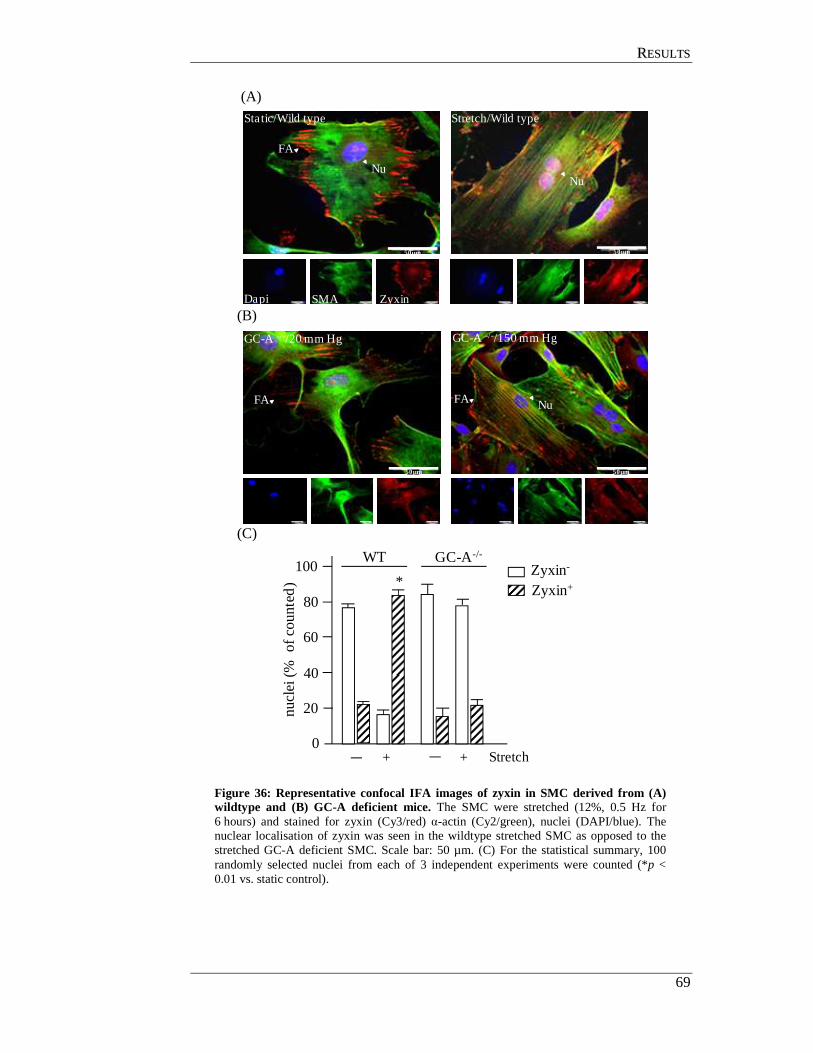
RREESSUULLTTSS
69
(A)
(B)
(C)
Figure 36: Representative confocal IFA images of zyxin in SMC derived from (A) wildtype and (B) GC-A deficient mice. The SMC were stretched (12%, 0.5 Hz for 6 hours) and stained for zyxin (Cy3/red) α-actin (Cy2/green), nuclei (DAPI/blue). The nuclear localisation of zyxin was seen in the wildtype stretched SMC as opposed to the stretched GC-A deficient SMC. Scale bar: 50 µm. (C) For the statistical summary, 100 randomly selected nuclei from each of 3 independent experiments were counted (*p < 0.01 vs. static control).
Static/Wild type Stretch/Wild type
SMA ZyxinDapi
Nu
FA
Nu
50µm50µm
FA FA Nu
50µm 50µm
GC-A -/-/20 mm Hg GC-A -/-/150 mm Hg
Stretch+ +
WT GC-A-/-
*Zyxin-
Zyxin+
nucl
ei (
%
of c
ount
ed)
0
40
100
80
60
20

RREESSUULLTTSS
70
Moreover, stretch-induced calponin (Cal) and thrombomodulin (TM) expression
was blunted in these cells similar to SMC derived from zyxin-knockout mice
(Figure 37).
Figure 37: Real time RT-PCR analysis of thrombomodulin (TM) and calponin (Cal) in SMC. Stretch-dependent repression of calponin mRNA expression and up-regulation of thrombomodulin mRNA expression in SMC derived from age-matched wild type (WT) or GC-A-deficient animals (*p < 0.001 vs. static control, n = 5).
In summary, a hierarchical chain of signalling events starting with TRP activation
leading to ET-1 release leading to ANP-release and concomitant activation of
PKG could be defined not only by physiological inhibitors but also by genetic
knockout of the key players of this cascade, TRPC3, GC-A and zyxin itself.
4.12 Analysis of phosphorylated amino acid residues in zyxin targeted by PKG Presumably, ANP via its receptor GC-A leads to PKG mediated phosphorylation
of zyxin. 2D gel-electrophoresis analysis of EC lysates and nuclear extracts were
performed to characterise the stretch and ANP-induced phosphorylation pattern of
zyxin through PKG. Stretching of EC in fact caused shift in pI of zyxin that was
prevented by the broad range phosphatase (not shown). Moreover, zyxin was
phosphorylated and co-purified with nuclear proteins only in extracts of stretched
EC, whereas pre-treatment with the PKG-inhibitor Rp8 resulted in inhibition of
both phosphorylation and translocation. Accordingly, ANP alone caused a PKG-
dependent accumulation of zyxin in the nucleus (doctoral thesis of Agnieszka
Wojtowicz, Heidelberg, 2008).
0
100
300
200
mR
NA
exp
ress
ion
(% c
ontr
ol)
*
Stretch+
+
Cal.
+
WTGC-A-KO
TM
*
++

RREESSUULLTTSS
71
4.12.1 Generation eGFP-zyxin constructs
To probe for putative PKG target sites in the zyxin amino acid sequence, an in-
silico phosphorylation site analysis was performed (http://www.phosphosite.org).
Among others serine-142 (S142), serine-344 (S344) and threonine-352 (T352)
were selected for mutation (ref Figure 38 and Table 22). To analyse which of these
residues were in fact PKG targets, the eGFP-zyxin expression constructs were
generated using eGFP-pcDNA 6.2 vectors and mutated or not at the above
mentioned sites (ref 3.1.5).
Figure 38: GFP-zyxin constructs. The N-terminal GFP-zyxin constructs were cloned into TOPO vectors and mutated at S142, S344 and T352. Sequences can be found in the Table 22.
4.12.2 Transfection of zyxin expression plasmids into HUVEC
Initially magnetofection was used to transfect HUVEC with the zyxin expression
plasmids but the observed transfection efficiency was very low (1 - 3%) and
alternative transfection methods with Lipofectamine (Invitrogen), Hi-perfect
(Qiagen) and jetPRIME (poly-plus) were performed unsuccesfully. Finally, using
polyethylenimine (PEI) transfection (ref 3.2.3) yielded a sufficient number of cells
expressing eGFP-zyxin which was adequate for the analysis.
4.12.3 Effects of ANP on cells transfected with zyxin-wildtype and mutant constructs
The HUVEC were transfected with zyxin-wildtype and mutant constructs using
PEI. As a first step to charactarise the amino acid residue phosphorylated in
response to stretch, eGFP-zyxin transfected HUVEC were exposed to ANP
(Figure 39) as a surrogate stimulus for stretch. Fourty eight hours post
transfection, cells were exposed to ANP for 6 hours and fixed thereafter. Total
zyxin was stained together with a nuclear counterstain (DAPI) to distinguish
transfected from non-transfected cells. It was observed that transfected eGFP-
wildtype zyxin was expressed in the focal adhesions, which coincides with the
pHA GFP
S142 S344
Zyxin (1724 bp)
T352

RREESSUULLTTSS
72
endogenous zyxin and upon addition of ANP, zyxin translocated to the nucleus,
which also matches the behaviour of endogenous zyxin.
Table 22: Wildtype and mutated zyxin constructs. The sequence of the mRNA with a single nucleotide mutation and the resulting amino acid is shown in the table. The official one letter nucleotide and amino acid code is given.
ID Mutation
S142 Serine 142
mRNA: 570 agg gag aag gtg agc agt att gat ttg gag a 599 amino acid: R E K V S S I D L E 142
S142G Serine142 (AGC) to Glycine 142 (GGC)
570 agg gag aag gtg ggc agt att gat ttg gag a 599 R E K V G S I D L E 142
S142D Glycine-142 (GGC) to Aspartate-142 (GAC) Phospho-mimetic
570 agg gag aag gtg gac agt att gat ttg gag a 599 R E K V D S I D L E 142
S142E Aspartate-142 (GAC) to Glutamate-142 (GAG) Phospho-mimetic
570 agg gag aag gtg gag agt att gat ttg gag a 600 R E K V E S I D L E 142
S344 Serine 344
1170 aac caa aac cag gtg cgc tcc cct ggg gcc c 1200 N Q N Q V R S P G A 344
S344A Serine-344 (TCC) to Alanine-344 (GCC) Phospho-resistant
1170 aac caa aac cag gtg cgc gcc cct ggg gcc c 1200 N Q N Q V R A P G A 344
S344D Alanine-344 (GCC) to Aspartate-344 (GAC) Phospho-mimetic
1170 aac caa aac cag gtg cgc gac cct ggg gcc c 1200 N Q N Q V R D P G A 344
S344E Aspartate-344 (GAC) to Glutamate-344 (GAG) Phospho-mimetic
1170 aac caa aac cag gtg cgc gag cct ggg gcc c 1200 N Q N Q V R E P G A 344
T352 Threonine 352
1200 cca ggg ccc ctg act ctg aag gag gtg gag g 1230 P G P L T L K E V E 352
T352A Threonine 352 (ACT) to Alanine 352 (GCT) Phosho-resistant
1200 cca ggg ccc ctg gct ctg aag gag gtg gag g 1230 P G P L A L K E V E 352
T352D Alanine 352 (GCT) to Aspartate 352 (GAT) Phosho-resistant
1200 cca ggg ccc ctg gat ctg aag gag gtg gag g 1230 P G P L D L K E V E 352
In contrast to glycine or alanine mutants of S344 and T352 (not shown), the
correspondingly modified S142 construct did not reveal any nuclear translocation
upon addition of ANP, indicating that this amino acid residue is in fact the target
of PKG in response to stretch. Moreover, conversion of S142 to glutamate residue
partially mimicked the effect of endogenous S142 phosphorylation (Figure 39,
right panel).
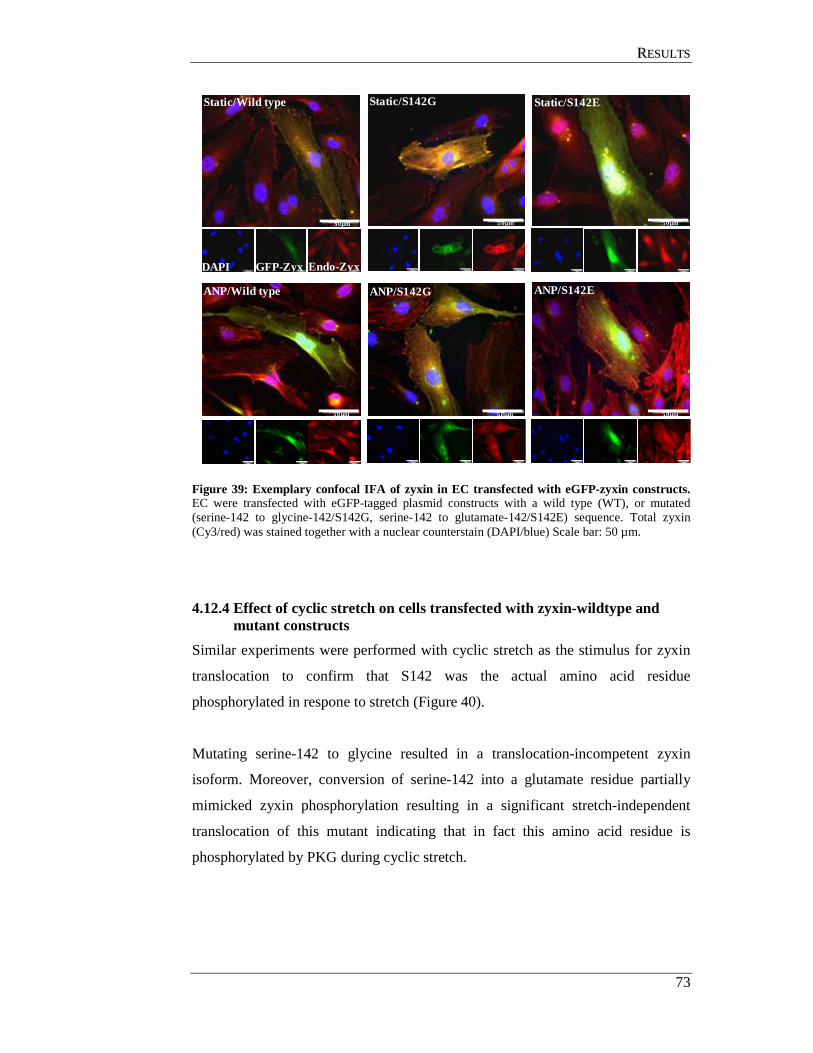
RREESSUULLTTSS
73
Figure 39: Exemplary confocal IFA of zyxin in EC transfected with eGFP-zyxin constructs. EC were transfected with eGFP-tagged plasmid constructs with a wild type (WT), or mutated (serine-142 to glycine-142/S142G, serine-142 to glutamate-142/S142E) sequence. Total zyxin (Cy3/red) was stained together with a nuclear counterstain (DAPI/blue) Scale bar: 50 µm.
4.12.4 Effect of cyclic stretch on cells transfected with zyxin-wildtype and mutant constructs
Similar experiments were performed with cyclic stretch as the stimulus for zyxin
translocation to confirm that S142 was the actual amino acid residue
phosphorylated in respone to stretch (Figure 40).
Mutating serine-142 to glycine resulted in a translocation-incompetent zyxin
isoform. Moreover, conversion of serine-142 into a glutamate residue partially
mimicked zyxin phosphorylation resulting in a significant stretch-independent
translocation of this mutant indicating that in fact this amino acid residue is
phosphorylated by PKG during cyclic stretch.
DAPI GFP-Zyx Endo-Zyx
Static/Wild type Static/S142G Static/S142E
ANP/Wild type ANP/S142G ANP/S142E
50µm 50µm 50µm
50µm50µm50µm
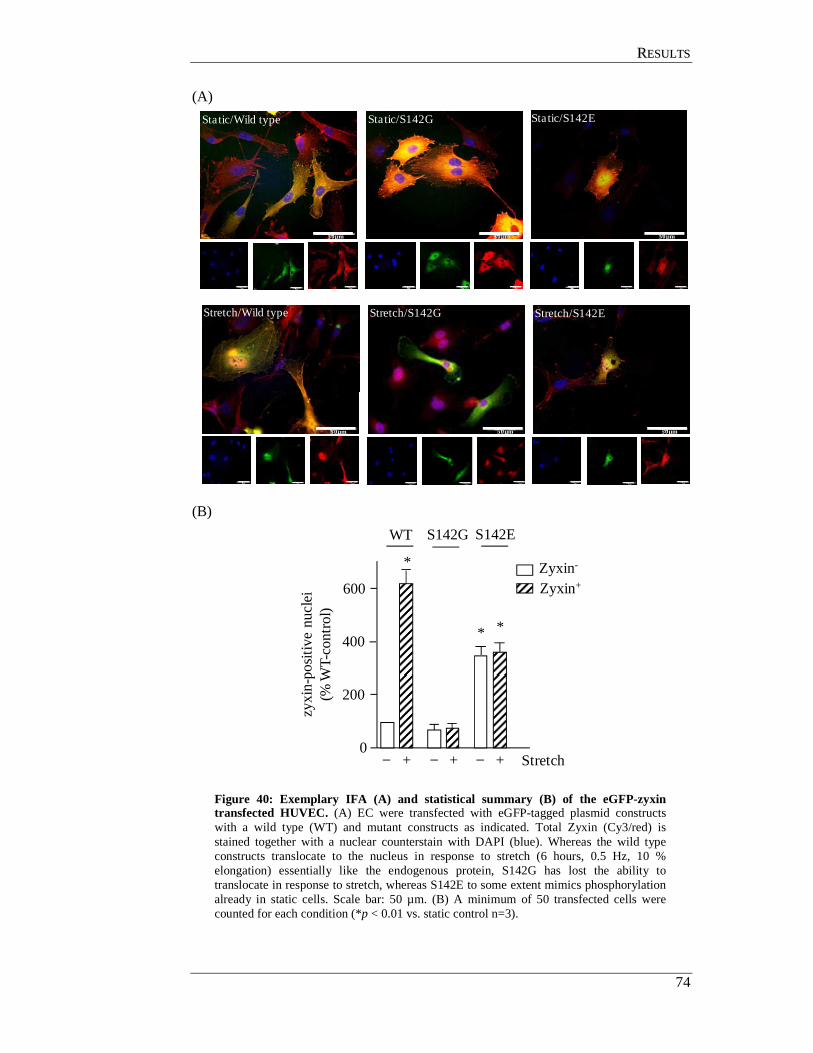
RREESSUULLTTSS
74
(A)
(B)
Figure 40: Exemplary IFA (A) and statistical summary (B) of the eGFP-zyxin transfected HUVEC. (A) EC were transfected with eGFP-tagged plasmid constructs with a wild type (WT) and mutant constructs as indicated. Total Zyxin (Cy3/red) is stained together with a nuclear counterstain with DAPI (blue). Whereas the wild type constructs translocate to the nucleus in response to stretch (6 hours, 0.5 Hz, 10 % elongation) essentially like the endogenous protein, S142G has lost the ability to translocate in response to stretch, whereas S142E to some extent mimics phosphorylation already in static cells. Scale bar: 50 µm. (B) A minimum of 50 transfected cells were counted for each condition (*p < 0.01 vs. static control n=3).
Stretch/S142GStretch/Wild type Stretch/S142E
Static/Wild type Static/S142G Static/S142E
50µm50µm50µm
50µm 50µm 50µm
zyxi
n-po
sitiv
e nu
clei
(% W
T-co
ntro
l)
Stretch0
200
600
+ + +
400
*
* *
WT S142GS142E
Zyxin-
Zyxin+

RREESSUULLTTSS
75
Furthermore, to understand how the zyxin constructs mutated at S344 and T352
act in response to stretch, these constructs were transfected into the HUVEC as
described before. Independently of the respective mutation, these constructs were
localised in focal adhesions under static condition and translocated to the nucleus
upon exposure to stretch indicating that these amino acid residues do not play a
role in stretch-induced nuclear translocation of zyxin (Figure 41).
Figure 41: Statistical summary of cells transfected with S344 (A) and T352 (B). Both wild type and mutated S344 and T352 constructs translocated to the nucleus of the endothelial cells in response to stretch (6 hours, 0.5 Hz, 10%). A minimum of 50 transfected cells were counted for each condition (*p < 0.01 vs. static control n=3).
4.13 Effect of Rho associated protein kinase (ROCK) on zyxin translocation Rho kinases, being the effectors of Rho play an important role in the formation of
stress fibres and focal adhesions due to their effects on myosin light chain
phosphorylation. To find out if ROCK plays a role in zyxin translocation, HUVEC
were incubated with the ROCK inhibitor Y27632 and then subjected to the
standard stretch protocol. The mRNA analysis of IL-8 revealed that Y27632
slightly inhibited stretch- induced IL-8 expression (Figure 42).
zyxi
n-p
osi
tive n
ucl
ei
(% W
T-co
ntr
ol)
Stretch0
300
800
+ + +
WT S344A S344E
600
*Zyxin-
Zyxin+
Zyxin-
Zyxin+
zyxi
n-p
osi
tive n
ucl
ei
(% W
T-co
ntr
ol)
Stretch0
200
600
+ + +
400*
WT T352A T352D

RREESSUULLTTSS
76
Figure 42: Real time RT-PCR analysis of stretch-dependent IL-8 expression. The cells were treated with the ROCK inhibitor Y27632 (3 µmol/l) and subjected to standard stretch protocol. The rock inhibitor showed a moderate but insufficient repression of stretch induced IL-8 expression (*p < 0.05 vs. static control n=4).
0
2
6
4
IL-8
mR
NA
exp
ress
ion
(x10
2co
pie
s/ng
RN
A)
Stretch+
++++ Y27632
*
*

DDIISSCCUUSSSSIIOONN
77
5. DISCUSSION
Wall tension and vascular disease
Hypertension is a major risk factor for potentially fatal diseases such as stroke,
congestive heart failure, myocardial infarction and kidney disease (Bahiru 2008).
The reason for this causal relationship is that the chronically elevated transmural
pressure leads to an increase in wall tension that causes stretching of both arterial
EC and SMC and disables the contractile capacity of the affected blood vessels. In
addition this increase in wall tension elicits certain phenotype changes in both cell
types aimed at antagonizing the mechanical overload and, consequently, regain
control on vascular tone.
Although the clinical manifestations of this pressure-induced vascular
remodelling, a fixed increase in total peripheral resistance and a pro-inflammatory
and synthetic SMC phenotype facilitating the development of atherosclerosis, are
well described even in molecular details, little is known about the onset of this
process. Consequently one aim of the present work was to characterise primary,
thus specific, mechanisms of mechanotransduction in EC and SMC.
5.1 Models used to apply wall tension As outlined in the introduction, wall tension is derived from the transmural
pressure gradient, the diameter/radius and thickness of the vessel wall (see Fig. 1).
Thus, an increase in either pressure or radius results in increased wall tension.
Wall tension translates to stretch in cultured cells
It is highly difficult to expose cultured cells to increased transmural pressure
gradients. Therefore, EC as well as SMC used in this project were stressed via
increasing the “radius-component” of WT, thus stretching them in a Flexercell
unit. This model is well established and widely used to mimic wall tension in vitro
(e.g., Shrinsky 1989; Cattaruzza 2004; Kakisis 2004; Lacolley 2004, Wojtowicz
2010). Data presented in these reports show that there is a good correlation with
data derived from in situ- or in vivo-models.
The rhythmic or cyclic component of the stretch protocols used, however
suggestive, should not be mistaken as an attempt to mimic the pulsatility of regular

DDIISSCCUUSSSSIIOONN
78
blood flow. This manoeuver is solely used to prevent a compensatory reaction of
the cultured cells observed under conditions of static stretch, i.e., evasion of
stretch by adhesion to new attachment points. Indeed, using the Flexercell unit,
frequencies near to human (>1 Hz) or even mouse (5+ Hz) heart rate were found
to be lethal, most probably due to the mechanical properties of the membranes
used and development of heat.
Wall tension in perfused vessels
To mimic wall tension in situ, perfusion of freshly isolated mouse femoral arteries
was used using a pressure myograph system, which allowed continuous control of
temperature, pressure and vessel diameter. In this model, transmural pressure is
used to also increase the vessel diameter and decrease wall thickness considerably,
thus very efficiently increase wall tension. Perfusion in this model does not show
any pulsatile component underlining the fact that maybe in vivo pulsatility of
blood flow plays a role, e.g., at arterial bifurcations, but that wall tension per se
must not be pulsatile to be effective as a stimulus for mechanotransduction.
In vivo analyses of zyxin-induced gene expression.
In this thesis no in vivo experiments have been performed; this was due to an
insufficient supply of zyxin-deficient mice. However, as after extensive back-
crossing with wild type mice, meanwhile mating of zyxin-deficient mice is
successful, a major focus will be set in the future to confirm the importance of
zyxin-induced gene expression after induction of hypertension in the living animal
(see also below).
5.2 Gene expression regulated by zyxin The zyxin-regulated transcriptome in EC and SMC
Microarray analyses comparing quiescent with stretched EC with or without
siRNA-mediated zyxin knockdown (Wojtowicz 2010) and of aortic cultured
smooth muscle cells derived from wild type and zyxin-deficient mice (in this
thesis only a comparison of zyxin-controlled pathways in EC and SMC is given,
see Table 19 and below) confirmed that in both cell types around 70% of all
DDIISSCCUUSSSSIIOONN
79
stretch-sensitive genes in fact are controlled by zyxin. Most of these gene products
can be arranged in pathways which are of special importance for pressure-induced
vascular remodelling, e.g. cell migration, proliferation, differentiation or
apoptosis. Many of the pathways regulated are very similar in EC and SMC (Table
19). In both cell types after 6 hours of stretch zyxin suppresses apoptosis as well as
proliferation, and thus seems to stabilize a differentiated phenotype at least for
relatively short periods of supra-physiological stretch. It will be of great interest to
analyse the impact of zyxin on these pathways in vivo (see above) and after longer
periods of time in cultured cells.
However, some pathways, e.g., muscle contraction (SMC) or TOLL-like receptor
signalling (EC), are regulated in a cell type-specific manner. From a teleological
point of view this seems comprehensible. From a mechanistic point of view, this
finding suggests a more complex regulatory function of zyxin. At least, zyxin-
dependent gene expression is not independent of the cell type-specific
transcription machinery, but must interact with other, at this stage of the project
unknown, transcription factors.
Interestingly, only two pathways are regulated antidromic in EC and SMC. Both
are suggestive and might hint to a different assignment of EC and SMC during
early phases of supra-physiological stretch. Whereas in SMC transcriptional
activity is generally down-regulated, EC respond with an overall increase in
transcription. Vice versa, besides increasing sugar and fatty acid metabolism,
SMC seem to degrade several amino acids (the pathway depicted is just an
example), whereas EC will even decrease protein turn over/amino acid
metabolism. This may hint towards a more regulatory function of EC aimed to
control SMC activity and metabolically highly active SMC trying to regulate
vascular tone. However, at this point, this is quite speculative.
In conclusion, these microarray analyses are highly suggestive as for zyxin-
dependent transcriptome that is similar to that in dysfunctional EC and/or
synthetic SMC.
Zyxin as a transcription factor?
Zyxin binds to a promoter motif, a stretch of pyrimidine bases termed pyrimidine-
purine box (PyPu box). This motif, which is not defined by an exact sequence but

DDIISSCCUUSSSSIIOONN
80
by the base content, could be found in all gene promoters shown to be regulated by
zyxin. Moreover, using specific decoy-ODN and EMSA, this motif could be
shown to be functional. Thus, zyxin may act as a true transcription factor, most
probably via its zinc finger LIM-domains, but it cannot be ruled out that the
protein is coordinated to the PyPu-box by an up to now not unknown factor.
Potential candidates may be the poly-pyrimidin tract binding protein (Sawicka
2008) and matrin 3 (Matsushima 1996; Valencia 2007; both proteins are known to
bind to a stretch of pyrimidine bases.
5.3 The endothelial cell response to stretch – a defined signalling cascade
Analysis of the localisation of zyxin revealed that the protein was in fact localised
exclusively to focal adhesions and stress fibres in both EC and SMC under basal
conditions. However, upon exposure to cyclic stretch, zyxin associates more
prominently with stress fibres (Cattaruzza 2004; Yoshigi et al, 2006) and, most
intriguingly, rapidly translocates to the nucleus (Cattaruzza 2004, Wojtowicz
2010). Subsequently, this stretch-induced nuclear translocation of zyxin results in
distinct changes of gene expression corroborating our assumption that zyxin in
fact specifically transduces changes in wall tension to the nucleus.
In the course of this study the signalling events leading to the release of zyxin
from focal adhesion contacts and its redistribution to the nucleus could be
elucidated. A hierarchical chain of events leads to the nuclear translocation of
zyxin in response to stretch namely, stretch-induced activation of TRPC3 induces
ET-1 release from EC which through the ETB–R elicits the subsequent release of
ANP. ANP in turn elicits a GC-A-mediated rise in intracellular cGMP leading to
protein kinase G (PKG) activation. Subsequent PKG phosphorylation of zyxin at
serine-142 enables its dissociation from the focal adhesions and trans-location to
the nucleus. This cascade it outlined below (Figure 43).
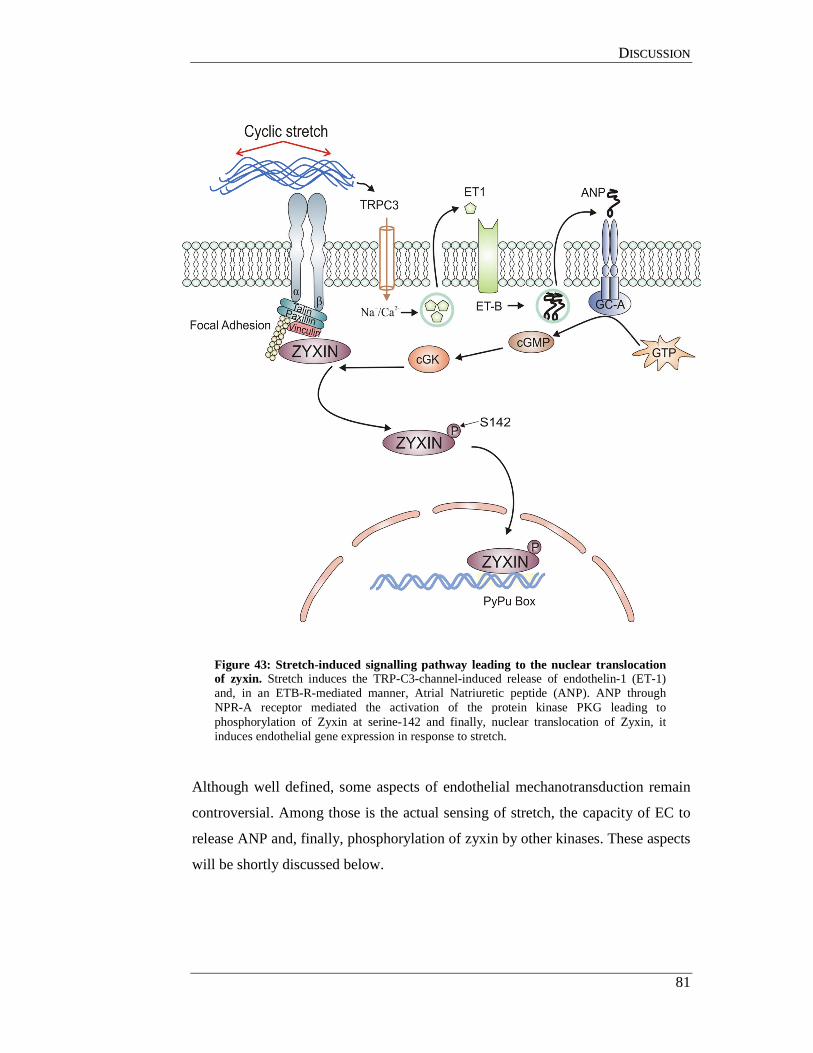
DDIISSCCUUSSSSIIOONN
81
Figure 43: Stretch-induced signalling pathway leading to the nuclear translocation of zyxin. Stretch induces the TRP-C3-channel-induced release of endothelin-1 (ET-1) and, in an ETB-R-mediated manner, Atrial Natriuretic peptide (ANP). ANP through NPR-A receptor mediated the activation of the protein kinase PKG leading to phosphorylation of Zyxin at serine-142 and finally, nuclear translocation of Zyxin, it induces endothelial gene expression in response to stretch.
Although well defined, some aspects of endothelial mechanotransduction remain
controversial. Among those is the actual sensing of stretch, the capacity of EC to
release ANP and, finally, phosphorylation of zyxin by other kinases. These aspects
will be shortly discussed below.

DDIISSCCUUSSSSIIOONN
82
TRPC3 as a mechanosensor
Although the role of TRP channels in the pressure-induced myogenic response
(Bayliss 1902; Davis & Hill 1999; Vennekens 2010) is well characterised, nothing
is known about their role in early phases of pressure-induced vascular
remodelling. Here we have analysed the role of TRPC3 in stretch-induced
endothelial mechanotransduction. However, it could not be shown, whether
TRPC3 is a genuine mechanosensor or whether the cannel is activated by the true
(upstream) sensor of stretch.
Principally, TRP channels can be mechanically gated and, thus, act as force
sensors themselves (shown for TRPM3) or are mechanically sensitive, thus
activated by second messengers downstream of the true force sensor(s) (TRPC6,
Voets 2005; Shimizu 2007; Christensen 2007; Nilius 2007).
Some evidence suggests that mechanically sensitive channels are activated by
signalling pathways downstream of a G-protein, namely Gq-protein-coupled
receptors such as the angiotensin II type-2 receptor (AT2) that may in fact be a real
mechanosensor (Laher 1993; Schnitzler 2008). Intriguingly, the AT2 receptor in
this case is activated without its generic ligand-angiotensin II, leading to activation
of phospholipase C and release of diacylglycerol, the TRPC-activating agent in
this signalling process (Clapham, 2003, Hofmann et al, 1999; Schnitzler 2008).
In case of EC, TRPC3 and stretch it is an attractive speculation that a similar
mechanism as described for TRPC6 and AT2 may exist, placing the ETB-R up-
and/or downstream of TRPC3 (Figure 44).
Figure 44: Model of a dual function of the ETB-R in endothelial mechanotransduction. ETB-R might play a role upstream of the TRPC3 channel via Gαq and also downstream to TRPC3 channel in eliciting the release of ANP.
Ca2+
TRPC3
ET-1 Zyxinactivation
ETB-Rα 12/13
ETB-R
αq11/PLC/DAG
ANP/GC-A/PKG
?
Stretch?

DDIISSCCUUSSSSIIOONN
83
Another attractive hypothesis how TRPC3 may be activated by stretch without
being the actual mechanosensor is the recruitment of the receptor to the cell
membrane. Again, this mechanism up to now cannot be analysed because no
antibodies for, e.g. immunofluorescence analysis are available.
However, TRPC6 has been shown to respond to pressure stimuli in patches even
in the presence of phospholipase-C blockers, arguing against the DAG-mediated
activation (Spassova 2006). Therefore, the mechanism through which a TRP
channel is activated and regulated is still controversial.
Endothelial release of ANP and the endothelial ANP system
Three natriuretic peptides (ANP, BNP, CNP) with three functionally distinct
membrane receptors the guanylate cyclases GC-A and GC-B and the G-protein-
coupled receptor NPR-C are known in mammalians. Besides the systemic function
of ANP, a decrease in blood volume via renal sodium/water secretion (described
in the introduction), local ANP-systems have been characterised, predominantly in
bone (Schulz 2005) and brain (Shirakami 1993).
Interestingly, the atrial release of ANP and BNP into the blood stream involves a
wall tension-induced release of ET-1 from atrial endothelial cells that, in turn,
causes ANP release from the cardiac myocytes by activation of the ETA-R
(Thibault 1994). ANP binds then to GC-A and GC-B in the kidney, the brain and
several other tissues including the vasculature (Suga 1992; Abraham 1994). Thus,
multiple cell types are involved in ANP-mediated volume control.
Intriguingly, systemic volume control by ET-1/ANP seems to be perfectly
mimicked at the single cell level in EC with the exception of the effector
mechanisms, sodium secretion vs. zyxin activation. However, endothelial release
of proANP and its conversion to ANP is controversial as normally (pro)CNP
(Chen 1998) is regarded to be the endothelial variant of natriuretic peptides,
whereas ANP is thought to be strictly derived from the heart (Cody 1986; Dietz
2005). In contrast, our group was able to demonstrate proANP mRNA expression
by and proANP-release from human cultured endothelial cells. This, however, was
exclusively restricted to conditions of stretch. As in the literature, our EC did
neither express nor release noteworthy amounts of ANP under static conditions.
Therefore, it is comprehensible that our findings only seemingly contradict the
commonly accepted view of EC as cells without ANP expression. However, as

DDIISSCCUUSSSSIIOONN
84
HUVEC, used throughout the project are venous endothelial cells, it cannot be
ruled out that in endothelial cells from other sources CNP may as well be
responsible for mechanotransduction. Taken together, although the type of EC-
derived natriuretic peptide may be controversial, this is of little consequence for
the actual signalling pathway defined in this thesis.
The control of salt and water homeostasis and local vascular mechanotransduction
thus seem to share basic signalling mechanisms in order to respond to the same
stimulus: stretch.
Phosphorylation of zyxin by PKG at serine 142
Phosphorylation is a dynamic regulatory mechanism that affects the function of a
protein (Cohen 2001; Pondugula 2009). During stretch, zyxin phosphorylation
leads to its dissociation from the focal adhesions and translocation to the nucleus.
Zyxin was found to be phosphorylated at serine-142 by PKG using transfection-
based expression of phosphorylation-incompetent and phosho-mimetic zyxin
isoforms. To render the zyxin translocation-incompetent, a phosphorylation
resistant amino acid residue such as glycine was introduced instead of the wild
type amino acid residue. The constructs mutated at S142 to G142 did not
translocate to the nucleus upon addition of ANP or stretch (Figure 39 and 40). To
confirm that this is not an unspecific reaction, the constructs were further mutated
to phosphorylation-mimetic mutants by introducing an acidic residue such as
glutamate (E142). Moreover, other mutations at serine-344 and threonine-352 did
not have any effect on zyxin activation further confirming the specificity of serine-
142 as the amino acid addressed by PKG.
As zyxin has been characterised as a phospho-protein previously, other kinases
may be functionally interesting for zyxin activation. Among those, the kinase Akt
(Chan 2007) stands out as it has been shown to phosphorylate zyxin at serine-142.
Akt itself has been shown to be activated in response to fluid shear stress
(Dimmeler 1998). Moreover, NO is well characterised to cause an increase in
intracellular cGMP levels and, thus, activate PKG (Martin 1999). Surprisingly,
recent experiments showed that HUVEC subjected to fluid shear stress do not
respond with zyxin translocation while NO-donors, on the contrary, as a shear
stress surrogate, inhibit zyxin translocation.This apparant paradox – expected from
DDIISSCCUUSSSSIIOONN
85
a teleological point of view but surprising from the molecular perspective needs
further experimental evaluation. At this point in time differential
compartmentalization and up to now unknown protein-protein interactions seem to
be the best hypotheses to explain these puzzling findings.
Rho-associated Protein Kinase (ROCK)
ROCK, a downstream effector kinase of the small GTPase Rho, plays an
important role in EC signalling in response to inflammation (Mong 2009) and also
in stretch (Tsuda 2002). Moreover, ET-1 activates the Rho-ROCK pathway via the
G-protein Gα12/13 in SMC leading to contraction via phosphorylation of myosin
light chain (Riento 2003).
The role of ROCK in endothelial mechanotransduction was tested using its
inhibitor Y27632. Although to some extent effective in inhibiting stretch-induced
IL-8 expression in EC, the results were not fully conclusive so that at this stage it
cannot be decided whether the ETB-R-mediated release of ANP is induced via
activation of Gαq11 or Gα12/13 or maybe both G-proteins together (see also Figure
44 above).
The stretch response in other cell types
The experiments conducted on SMC using ANP, ET-1 and the same set of
inhibitors revealed that SMC have the same signalling cascade for zyxin
activation. Although this makes sense from a teleological point of view and,
moreover, in vivo endothelium-derived ET-1 and ANP will be available, a
question remains open:
How can SMC alone possess stretch-induced zyxin activation as these cells do not
express ANP? This question is further substantiated as also epithelial cells and
primary cultured SMC derived from the urinary bladder show stretch-induced
zyxin activation as we could show in the group.
Besides technical reasons, as, e.g., EC co-cultured with primary SMC in our
model (isolated perfused artery), it might be that (i) these cell types indeed can
respond with ET-1/ANP expression in response to stretch (as at least known for
epithelial cells (Novaira 2006) or that (ii) alternative kinases and, thus,
endogenous stimuli may account for zyxin activation in these cells. The overall
DDIISSCCUUSSSSIIOONN
86
mechanism, give or take molecular details, however, seems to be similar in many
cell types experiencing high levels of wall tension in vivo such as lung epithelia,
bladder SMC and, naturally vascular EC and SMC.
5.4 Stretch-induced zyxin activation and pressure-induced vascular remodelling What is the impact of zyxin translocation on pressure-induced vascular
remodelling? Although the results presented here and in other reports (Cattaruzza
2004; Wojtowicz 2010; Kato 2005; Nix 1997) plus preliminary findings from our
group comparing vessels, the lung and the urinary bladder from wild type and
zyxin-deficient mice hint towards a general role of zyxin in wall tension-induced
signalling and organ-homeostasis in the face of mechanical (over)load, systematic
analysis of the role of zyxin in hypertension and pressure-induced remodelling are
necessary to proof the transferability of the in vitro data presented here into the in
vivo situation. However, analyzing the changes in gene expression brought about
by zyxin, a dual role of zyxin in early wall tension-induced signalling is highly
suggestive. On the one hand, proliferation as well as apoptosis are attenuated and
SMC are rendered more susceptible to exogenous constrictors such as ET-1 or
norepinephrine and, on the other hand, pro-inflammatory and, in the long run,
growth-promoting and de-differentiating pathways are activated.
5.5 Perspective The present study provides a conclusive description of a specific wall tension-
induced mechanotransduction mechanism in endothelial cells. Moreover, a stretch-
sensitive promoter element (the PyPu-box) that coordinates zyxin-induced gene
expression could be identified and characterised.
Based on these findings, several questions arise that will be addressed in the
future:
1. What is the functional impact of zyxin activation in vivo? Having
overcome the insufficient supply of zyxin-deficient mice in the last few
months, this question will be approached by employing a simple
hypertension model with wild type and zyxin-deficient mice.

DDIISSCCUUSSSSIIOONN
87
2. What is the real mechanosensor? Although technically demanding, it will
be attempted to analyse stretch-induced TRPC3 activation in EC.
3. Functional antagonism between fuid shear stress and wall tension. As
shortly discussed above, the inhibitory effect of NO, hence fluid shear
stress, on zyxin activation will be further explored: How do both
hemodynamic forces interact at the level of mechanotransduction in EC?

RREEFFEERREENNCCEESS
88
6. REFERENCES
Abraham, WT and Schrier RW (1994). Body fluid volume regulation in health and disease. Adv Intern Med 39: 23-47.
Airhart N, Yang YF, Roberts Jr CT, Silberbach M (2003). ANP induces natriuretic peptide receptor-PKG interaction. J Biol Chem 278: 38693–38698.
Bahiru E and Kloner RA (2008). A Comparative Literature Review Exploring Hypertension Drugs that Lower Target Organ Damage Above and Beyond Reducing Blood Pressure Based on Research Studies Between 1992 and 2006. Current Hypertension Reviews 4: 167-176.
Beckerle MC (1997). Zyxin: zinc fingers at sites of cell adhesion. Bioessays 19(11): 949-957.
Birder LA (2002). Altered urinary bladder function in mice lacking the vanilloid receptor TRPV1. Nature Neurosci 5: 856–860.
Black SM, Grobe A, Mata-Greenwood E, Noskina Y (2004). Cyclic stretch increases VEGF expression in pulmonary arterial smooth muscle cells via TGF-1 and reactive oxygen species: a requirement for NAD(P)H oxidase. Conf Proc IEEE Eng Med Biol Soc. 7: 5053-5056.
Cattaruzza M, Lattrich C, Hecker M (2004). Focal adhesion protein zyxin is a mechanosensitive modulator of gene expression in vascular smooth muscle cells. Hypertension 43: 726-730.
Cattaruzza M, Wagner AH, Hecker M (2011) Mechanosensitive pro-inflammatory gene expression in vascular cells. In: Mechanosensitivity and Cytokines volume 5, Kamkin A, Kiseleva I (Eds.). ISBN 978-94-007-2003-9.
Chan CB, Liu X, Tang X, Fu H, Ye K (2007). Akt phosphorylation of zyxin mediates its interaction with acinus-S and prevents acinus-triggered chromatin condensation. Cell Death Differ 14: 1688-1699.
Chen HH, Burnett JC Jr (1998). C-type natriuretic peptide: the endothelial component of the natriuretic peptide system. J Cardiovasc Pharmacol 32 Suppl 3:S22-S28.
Cheng JJ, Wung BS, Chao YJ, Wang DL (2001) Sequential activation of protein kinase C (PKC)-α and PKC-ε contributes to sustained Raf/ERK1/2 activation in endothelial cells under mechanical strain. J Biol Chem 276: 31368-31375.
Chrisman TD, Garbers DL (1999). Reciprocal antagonism coordinates C-type natriuretic peptide and mitogen-signalling pathways in fibroblasts. J Biol Chem 274: 4293–4299.
Cody R J, Atlas SA, Laragh JH, Kubo SH, Covit AB, Ryman KS, Shaknovich A, Pondolfino K, Clark M, and y Camargo MJ (1986). Atrial natriuretic factor in

RREEFFEERREENNCCEESS
89
normal subjects and heart failure patients. Plasma levels and renal, hormonal, and hemodynamic responses to peptide infusion. J. Clin. Invest 78: 1362–1374.
Cohen D, Koh GY, Nikonova LN, Porter JG, Maack T (1996). Molecular determinants of the clearance function of type C receptors of natriuretic peptides. J Biol Chem 271: 9863–9869.
Crawford AW, Michelsen JW, Beckerle MC (1992). An interaction between zyxin and α-actinin. J Cell Biol 116: 1381-1393.
Davies PF (1995), Flow-mediated endothelial mechanotransduction, Physiol Rev, 75: 519–560.
Davis MJ & Hill MA (1999). Signalling mechanisms underlying the vascular myogenic response. Physiol Rev 79: 387–423.
De Martin R, Hoeth M, Hofer-Warbinek R, Schmid JA (2000). The transcription factor NF- B and the regulation of vascular cell function. Arterioscler Thromb Vasc Biol. 20: E83–E88.
Demicheva E, Hecker M, Korff T (2008) Stretch-induced activation of the transcription factor activator protein-1 controls monocyte chemoattractant protein-1 expression during arteriogenesis. Circ Res 103: 477-484.
Dietrich A (2005). Increased vascular smooth muscle contractility in TRPC6–/– mice. Mol. Cell Biol 25: 6980–6989.
Dietrich A and Gudermann T (2008). Another TRP to Endothelial Dysfunction TRPM2 and Endothelial Permeability. Circ Res. 102: 275-277.
Dietz, J.R (2005). Mechanisms of atrial natriuretic peptide secretion from the atrium. Cardiovasc Res 68: 8-17.
Dimmeler S, Assmus B, Hermann C, Haendeler J, Zeiher AM (1998). Fluid shear stress stimulates phosphorylation of Akt in human endothelial cells: involvement in suppression of apoptosis. Circ Res 83: 334-41.
Earley S, Gonzales AL, Crnich R (2009). Endothelium-dependent cerebral artery dilation mediated by TRPA1 and Ca2+-Activated K+ channels. Circ Res 104: 987-994.
Garbers DL (1991). Guanyl cyclase-linked receptors. Pharmacol Ther. 50: 337- 345.
Glagov S, Zarins C, Giddens DP, Ku DN (1988) Hemodynamics and atherosclerosis. Insights and perspectives gained from studies of human arteries. Arch Pathol Lab Med 112: 1018-1031.
Griendling KK, Sorescu D, Ushio-Fukai M (2000). NAD(P)H oxidase: role in cardiovascular biology and disease. Circ Res. 86: 494-501.

RREEFFEERREENNCCEESS
90
Grimm C, Kraft R, Sauerbruch S, Schultz G and Harteneck C (2003). Molecular and functional characterization of the melastatin-related cation channel TRPM3. J. Biol. Chem 278: 21493–21501.
Guest TM, Vlastos G, Alameddine FM, Taylor WR (2006) Mechanoregulation of monocyte chemoattractant protein-1 expression in rat vascular smooth muscle cells. Antioxid Redox Signal 8: 1461-1471.
Guo WH, Wang YL (2007). Retrograde fluxes of focal adhesion proteins in response to cell migration and mechanical signals. Mol Biol Cell 18: 4519-27.
Heagerty, AM, Aalkjaer C, Bund SJ, Korsgaard N, Mulvany MJ (1993). Small artery structure in hypertension. Dual processes of remodelling and growth. Hypertension 21: 391-397.
Hecquet CM, Ahmmed GU, Vogel SM, Malik AB (2008). Role of TRPM2 Channel in Mediating H2O2-Induced Ca2 Entry and Endothelial Hyperpermeability. Circ Res. 102: 347-355.
Hermann C, Zeiher AM, Dimmeler S (1997). Shear stress inhibits H2O2-induced apoptosis of human endothelial cells by modulation of the glutathione redox cycle and nitric oxide synthase. Arterioscler. Thromb Vasc Biol 17: 3588-3592.
Hishikawa, K., Oemar B.S., Yang Z., Luscher T.F (1997). Pulsatile stretch stimulates superoxide production and activates nuclear factor-{kappa}B in human coronary smooth muscle. Circ Res. 81: 797–803.
Kakisis JD, Liapis Ch.D, Sumpio BE (2004). "Effects of cyclic strain on vascular cells. Endothelium 11: 17-28.
Kanchanawong P, Shtengel G, Pasapera AM, Ramko EB, Davidson MW, Hess HF, Waterman CM (2010). Nanoscale architecture of integrin-based cell adhesions. Nature 468: 580-584.
Kanungo J, Pratt SJ, Marie H, Longmore GD (2000). Ajuba, a cytosolic LIM protein, shuttles into the nucleus and affects embryonal cell proliferation and fate decisions. Mol Biol Cell 11: 3299-3313.
Kato T, Muraski J, Chen Y, Tsujita Y, Wall J, Glembotski CC, Schaefer E, Beckerle M, Sussman MA (2005). Atrial natriuretic peptide promotes cardiomyocyte survival by cGMP-dependent nuclear accumulation of zyxin and Akt. J Clin Invest 115: 2716-2730.
Kawashima S and Yokoyama M (2004). Dysfunction of endothelial nitric oxide synthase and atherosclerosis. Arterioscler Thromb Vasc Biol 24: 998-1005.
Kida T, Chuma H, Murata T, Yamawaki H, Matsumoto S, Hori M, Ozaki H (2010) Chronic treatment with PDGF-BB and endothelin-1 synergistically induces vascular hyperplasia and loss of contractility in organ-cultured rat tail artery. Atherosclerosis. 214: 288-294.

RREEFFEERREENNCCEESS
91
Kinlay S, Libby P, Ganz P (2001) Endothelial function and coronary artery disease. Curr Opin Lipidol 12: 383-389.
Klotz LO, Schroeder P, Sies H (2002) Peroxynitrite signalling: receptor tyrosine kinases and activation of stress-responsive pathways. Free Radic Biol Med 33: 737-743.
Lacolley P (2004). Mechanical influence of cyclic stretch on vascular endothelial cells. Cardiovascular Res 63: 577-579.
Lauth M, Wagner AH, Cattaruzza M, Orzechowski HD, Paul M, Hecker M (2000) Transcriptional control of deformation-induced preproendothelin-1 gene expression in endothelial cells. J Mol Med 78: 441-450.
Lehoux S, Castier Y, Tedgui A (2006), Molecular mechanisms of vascular responses to heamodynamic forces, J Int Med 259: 381-392.
Lehoux, S., Tedgui A (1998). Signal transduction of mechanical stresses in the vascular wall. Hypertension 32: 338-345.
Li, S., Moon J.J., Miao H., Jin G., Chen B.P., Yuan S., Hu Y., Usami S., Chien S (2003). Signal transduction in matrix contraction and the migration of vascular smooth muscle cells in three-dimensional matrix. J Vasc Res 40: 378-388.
Libby P (2007). Inflammatory mechanisms: the molecular basis of inflammation and disease. Nutr Rev 65:S140-S146.
Macalma T, Otte J, Hensler ME, Bockholt SM, Louis HA, Kalff-Suske M, Grzeschik KH, von der Ahe D and Beckerle MC (1996). Molecular characterization of human zyxin. J Biol Chem. 271: 31470-31478.
MacMahon S, Peto R, Cutler J, Collins R, Sorlie P, Neaton J, Abbott R, Godwin J, Dyer A, Stamler J (1990). Blood pressure, stroke, and coronary heart disease. Part 1, Prolonged differences in blood pressure: prospective observational studies corrected for the regression dilution bias. Lancet. 335: 765-774.
Malek AM, Alper SL, Izumo S (1999). Hemodynamic shear stress and its role in atherosclerosis. JAMA 282: 2035-2042.
Mäntymaa, P, Leppaluoto J, Ruskoaho H (1990). Endothelin stimulates basal and stretch-induced atrial natriuretic peptide secretion from the perfused rat heart. Endocrinology 126: 587-595.
Matsushima Y, Ohshima M, Sonoda M, Kitagawa Y (1996). A family of novel DNA-binding nuclear proteins having polypyrimidine tract-binding motif and arginine/serine-rich motif. Biochem Biophys Res Commun 223: 427-433.
Minke B and Cook B. (2002), TRP Channel Proteins and Signal Transduction, Physiol Rev, 82: 429-472.

RREEFFEERREENNCCEESS
92
Molavi B and Mehta JL (2004). Oxidative stress in cardiovascular disease: molecular basis of its deleterious effects, its detection, and therapeutic considerations. Curr Opin Cardiol 19: 488-493.
Mong PY, Wang Q (2009). Activation of Rho kinase isoforms in lung endothelial cells during inflammation. J Immunol 182: 2385-2394.
Mullis KB., F. F. A. (1987). Specific synthesis of DNA in vitro via a polymerase catalyzed chain reaction. Methods Enzymol 155: 335-350.
Nilius B, Owsianik G, Voets T, Peters JA (2007). Transient Receptor Potential Cation Channels in Disease. Physiol Rev. 87: 165–217.
Nix DA, Beckerle MC (1997). Nuclear-cytoplasmic shuttling of the focal contact protein, zyxin: a potential mechanism for communication between sites of cell adhesion and the nucleus. J Cell Biol 138: 1139-1147.
Novaira HJ, Ornellas DS, Ortiga-Carvalho TM, Zhang XM, Souza-Menezes J, Guggino SE, Guggino WB, Morales MM (2006). Atrial natriuretic peptide modulates cystic fibrosis transmembrane conductance regulator chloride channel expression in rat proximal colon and human intestinal epithelial cells. J Endocrinol 189: 155-165.
Nussenzveig DR, Lewicki JA, Maack T (1990). Cellular mechanisms of the clearance function of type C receptors of atrial natriuretic factor. J Biol Chem 265: 20952–20958.
Oancea E, Wolfe JT and Clapham DE (2006). Functional TRPM7 channels accumulate at the plasma membrane in response to fluid flow. Circ. Res 98: 245–253.
Pasterkamp G, de Kleijn DP, Borst C (2000). Arterial remodelling in atherosclerosis, restenosis and after alteration of blood flow: potential mechanisms and clinical implications Cardiovasc. Res. 45: 843-852.
Petit MM, Fradelizi J, Golsteyn RM, Ayoubi TA, Menichi B, Louvard D, Van de Ven WJ, Friederich E (2000). LPP, an actin cytoskeleton protein related to zyxin, harbors a nuclear export signal and transcriptional activation capacity. Mol Biol Cell 11: 117-129.
Piechota A, Polańczyk A, Goraca A (2010). Role of endothelin-1 receptor blockers on hemodynamic parameters and oxidative stress Pharmacol Rep. 62: 28-34.
Planells-Cases R, Ferrer-Montiel A (2007). TRP Channel Trafficking. In: Liedtke WB, Heller S, editors. TRP Ion Channel Function in Sensory Transduction and Cellular Signaling Cascades. Boca Raton (FL): CRC Press; Chapter 23.
Pohl U (2009). Vascular Remodelling: In Situ vs. Ex Vivo. Physiology 24: 270.
RREEFFEERREENNCCEESS
93
Potter LR, Abbey-Hosch S, Dickey (2006). Natriuretic peptides, their receptors, and cyclic guanosine monophosphate-dependent signalling functions. Endocr Rev 27: 47-72.
Reinhard M, Zumbrunn J, Jaquemar D, Kuhn M, Walter U, Trueb B (1999). An alpha-actinin binding site of zyxin is essential for subcellular zyxin localisation and alpha-actinin recruitment. J Biol Chem 274: 13410-13418.
Riento K and Ridley AJ (2003). Rocks: multifunctional kinases in cell behaviour Nat Rev Mol Cell Biol 4: 446-456.
Rottner K, Krause M, Gimona M, Small JV, Wehland J (2001). Zyxin is not colocalised with vasodilator-stimulated phosphoprotein (VASP) at lamellipodial tips and exhibits different dynamics to vinculin, paxillin, and VASP in focal adhesions. Mol Biol Cell. 12: 3103-3013.
Sadoshima J and Izumo S (2007). The cellular and molecular response of cardiac myocytes to mechanical stress. Annual Review of Physiology 59: 551-571.
Salvatore S, Vingolo EM (2011). Endothelin-1 role in human eye: a review. J Ophthalmol. PMID 354645, Epub ahead of print].
Sawicka K, Bushell M, Spriggs KA, Willis AE (2008). Polypyrimidine-tract-binding protein: a multifunctional RNA-binding protein. Biochem Soc Trans 4: 641-647.
Schepers A, Eefting D, Bonta PI, Grimbergen JM, de Vries MR, van Weel V, de Vries CJ, Egashira K, van Bockel JH, Quax PH (2006). Anti-MCP-1 gene therapy inhibits vascular smooth muscle cells proliferation and attenuates vein graft thickening both in vitro and in vivo. Arterioscler Thromb Vasc Biol 26: 2063-2069.
Schiffrin, EL (1999). State-of-the -Art lecture. Role of the endothelin-1 in hypertension. Hypertension 34: 876-881.
Schulz S (2005). C-type natriuretic peptide and guanylyl cyclase B receptor. Peptides 26: 1024-1034.
Sharma SK, Sweeny J, Kini AS (2010) Coronary bifurcation lesions: a current update. Cardiol Clin 28: 55-70.
Shirakami G, Magaribuchi T, Shingu K, Suga S, Tamai S, Nakao K, Mori K (1993). Positive end-expiratory pressure ventilation decreases plasma atrial and brain natriuretic peptide levels in humans. Anesth Analg 77: 1116-1121.
Shrinsky VP, Antonov AS, Birukov K.G, Sobolevsky AV., Romanov YA, Kabeva N.V., Antonova G.N., Smirnov V.N (1989). Mechano-chemical control of human endothelium orientation and size. J Cell Biol 109: 331-339.
Stults JT, O’Connell KL, Garcia C, Wong S, Engel AM, Garbers DL, Lowe DG (1994). The disulfide linkages and glycosylation sites of the human natriuretic peptide receptor-C homodimer. Biochemistry 33: 11372–11381.
RREEFFEERREENNCCEESS
94
Suga S, Nakao K, Hosoda K, Mukoyama M, Ogawa Y, Shirakami G, Arai H, Saito Y, Kambayashi Y, Inouye K, Imura H (1992). Receptor selectivity of natriuretic peptide family, atrial natriuretic peptide, brain natriuretic peptide, and C-type natriuretic peptide. Endocrinology 130: 229–239.
Sumpio BE, Banes AJ, Link GW, Iba T (1990). Modulation of endothelial cell phenotype by cyclic stretch: inhibition of collagen production. J Surg Res 48: 415-420.
Sung HJ, Yee A, Eskin SG, McIntire LV (2007). Cyclic strain and motion control produce opposite oxidative responses in two human endothelial cell types. Am J Physiol Cell Physiol. 293: C87-C94.
Taskinen P., Toth M., Ruskoaho H. (1994). Effects of genistein on cardiac contractile force and atrial natriuretic peptide secretion in the isolated perfused rat heart. Eur J Pharmacol 256: 251–261.
Thibault G, Doubell AF, Garcia R, Larivière R, Schiffrin EL (1994). Endothelin-stimulated secretion of natriuretic peptides by rat atrial myocytes is mediated by endothelin A receptors. Circ Res 74: 460-70.
Thubrikar MJ and Robicsek F (1995). Pressure-Induced Arterial Wall Stress and Atherosclerosis. Ann Thorac Surg 59: 1594-1603.
Touyz RM, Yao G, Viel E, Amiri F, and Schiffrin EL (2004). Angiotensin II and endothelin-1 regulate MAP kinases through different redox-dependent mechanisms in human vascular smooth muscle cells. J Hypertens 22: 1141-1149.
Tsuda YOM, Uezono Y, Osajima A, Kato H, Okuda H, Oishi Y, Yashiro A, Nakashima Y (2002). Activation of extracellular signal-regulated kinases is essential for pressure-induced proliferation of vascular smooth muscle cells. Eur J Pharmacol 446: 15-24.
Uematsu M, Ohara Y, Navas JP, Nishida K, Murphy TJ, Alexander RW, Nerem RM, Harrison DG (1995) Regulation of endothelial cell nitric oxide synthase mRNA expression by shear stress. Am J Physiol 269: C1371-C1378.
Valencia CA, Ju W, Liu R (2007). Matrin 3 is a Ca2+/calmodulin-binding protein cleaved by caspases. Biochem Biophys Res Commun 361: 281-286.
Vennekens R (2011). Emerging concepts for the role of TRP channels in the cardiovascular system. J Physiol 589: 1527-1534.
Wang Y, Gilmore TD (2003). Zyxin and paxillin proteins: focal adhesion plaque LIM domain proteins go nuclear. Biochem Biophys Acta 1593: 115-120.
Welsh DG, Morielli AD, Nelson MT and Brayden JE (2002). Transient receptor potential channels regulate myogenic tone of resistance arteries. Circ. Res. 90: 248–250.

RREEFFEERREENNCCEESS
95
Wojtowicz A (2008). The focal adhesion protein zyxin mediates wall tension-induced signalling in vascular cells. Dissertation, University of Heidelberg.
Wójtowicz A, Babu SS, Li L, Gretz N, Hecker M, Cattaruzza M (2010). Zyxin mediation of stretch-induced gene expression in human endothelial cells. Circ Res 107: 898-902.
Yamazaki T, Komuro I & Yazaki Y (1995). Molecular mechanism of cardiac cellular hypertrophy by mechanical stress. J Mol Cell Cardiol 27: 133-140.
Yanagisawa M, Kurihara H, Kimura S, Tomobe Y, Kobayashi M, Mitsui Y, Yazaki Y, Goto K & Masaki T (1988) A novel potent vasoconstrictor peptide produced by vascular endothelial cells. Nature 332: 411-415.
Yoshigi M, Hoffman LM, Jensen CC, Yost HJ, Beckerle MC (2005). Mechanical force mobilizes zyxin from focal adhesions to actin filaments and regulates cytoskeletal reinforcement. J Cell Biol 171: 209–215.
Yue TL, Wang X, Sung CP, Olson B, McKenna PJ, Gu JL, Feuerstein GZ (1994) Interleukin-8, A mitogen and chemoattractant for vascular smooth muscle cells. Circ Res. 75: 1-7.

AAPPPPEENNDDIIXX
96
APPENDIX
Sequence analysis of zyxin mRNA and the corresponding amino acid. The
amino acids targeted for mutation are highligted in yellow.
1 cccgccccct ctcttctccc tccctcctcc ttccgtgtgt ccctccccgc ccggctggag 61 gctgctccgg accgggacgc agagtctgcg gacccggcgc cgaggcggcc acccgagacg 121 cggcgcgcac gctccggcct gcgcagcccg gcccggccat ggcggccccc cgcccgtctc M A A P R P S 181 ccgcgatctc cgtttcggtc tcggctccgg ctttttacgc cccgcagaag aagttcggcc P A I S V S V S A P A F Y A P Q K K F G 241 ctgtggtggc cccaaagccc aaagtgaatc ccttccggcc cggggacagc gagcctcccc P V V A P K P K V N P F R P G D S E P P 301 cggcacccgg ggcccagcgc gcacagatgg gccgggtggg cgagattccc ccgccgcccc P A P G A Q R A Q M G R V G E I P P P P 361 cggaagactt tcccctgcct ccacctcccc ttgctgggga tggcgacgat gcagagggtg P E D F P L P P P P L A G D G D D A E G 421 ctctgggagg tgccttcccg ccgccccctc ccccgatcga ggaatcattt ccccctgcgc A L G G A F P P P P P P I E E S F P P A 481 ctctggagga ggagatcttc ccttccccgc cgcctcctcc ggaggaggag ggagggcctg P L E E E I F P S P P P P P E E E G G P 541 aggcccccat accgccccca ccacagccca gggagaaggt gagcagtatt gatttggaga E A P I P P P P Q P R E K V S S I D L E 142 601 tcgactctct gtcctcactg ctggatgaca tgaccaagaa tgatcctttc aaagcccggg I D S L S S L L D D M T K N D P F K A R 661 tgtcatctgg atatgtgccc ccaccagtgg ccactccatt cagttccaag tccagtacca V S S G Y V P P P V A T P F S S K S S T 721 agcctgcagc cgggggcaca gcacccctgc ctccttggaa gtccccttcc agctcccagc K P A A G G T A P L P P W K S P S S S Q 781 ctctgcccca ggttccggct ccggctcaga gccagacaca gttccatgtt cagccccagc P L P Q V P A P A Q S Q T Q F H V Q P Q 841 cccagcccaa gcctcaggtc caactccatg tccagtccca gacccagcct gtgtctttgg P Q P K P Q V Q L H V Q S Q T Q P V S L 901 ctaacaccca gccccgaggg cccccagcct catctccggc tccagcccct aagttttctc A N T Q P R G P P A S S P A P A P K F S 961 cagtgactcc taagtttact cctgtggctt ccaagttcag tcctggagcc ccaggtggat P V T P K F T P V A S K F S P G A P G G 1021 ctgggtcaca accaaatcaa aaattggggc accccgaagc tctttctgct ggcacaggct S G S Q P N Q K L G H P E A L S A G T G 1081 cccctcaacc tcccagcttc acctatgccc agcagaggga gaagccccga gtgcaggaga S P Q P P S F T Y A Q Q R E K P R V Q E 1141 agcagcaccc cgtgccccca ccggctcaga accaaaacca ggtgcgctcc cctggggccc K Q H P V P P P A Q N Q N Q V R S P G A 344 1201 cagggcccct gactctgaag gaggtggagg agctggagca gctgacccag cagctaatgc P G P L T L K E V E E L E Q L T Q Q L M 352 1261 aggacatgga gcatcctcag aggcagaatg tggctgtcaa cgaactctgc ggccgatgcc Q D M E H P Q R Q N V A V N E L C G R C 1321 atcaacccct ggcccgggcg cagccagccg tccgcgctct agggcagctg ttccacatcg H Q P L A R A Q P A V R A L G Q L F H I 1381 cctgcttcac ctgccaccag tgtgcgcagc agctccaggg ccagcagttc tacagtctgg A C F T C H Q C A Q Q L Q G Q Q F Y S L 1441 agggggcgcc gtactgcgag ggctgttaca ctgacaccct ggagaagtgt aacacctgcg E G A P Y C E G C Y T D T L E K C N T C 1501 gggagcccat cactgaccgc atgctgaggg ccacgggcaa ggcctatcac ccgcactgct G E P I T D R M L R A T G K A Y H P H C 1561 tcacctgtgt ggtctgcgcc cgccccctgg agggcacctc cttcatcgtg gaccaggcca F T C V V C A R P L E G T S F I V D Q A 1621 accggcccca ctgtgtcccc gactaccaca agcagtacgc cccgaggtgc tccgtctgct N R P H C V P D Y H K Q Y A P R C S V C

AAPPPPEENNDDIIXX
97
1681 ctgagcccat catgcctgag cctggccgag atgagactgt gcgagtggtc gccctggaca S E P I M P E P G R D E T V R V V A L D 1741 agaacttcca catgaagtgt tacaagtgtg aggactgcgg gaagcccctg tcgattgagg K N F H M K C Y K C E D C G K P L S I E 1801 cagatgacaa tggctgcttc cccctggacg gtcacgtgct ctgtcggaag tgccacactg A D D N G C F P L D G H V L C R K C H T 1861 ctagagccca gacctgagtg aggacaggcc ctcttcagac cgcagtccat gccccattgt A R A Q T 1921 ggaccaccca cactgagacc acctgccccc acctcagtta ttgttttgat gtctagcccc 1981 tcccatttcc aacccctccc tagcatccca ggtgccctga cccaggaccc aacatggtct 2041 agggatgcag gatccccgcc ctggggtctg gtcctcgccc atcctgcagg gattgcccac 2101 cgtcttccag acaccccacc tgaggggggc accaggttta gtgctgctgc tttcactgct 2161 gcacccgcgc cctcggccgg ccccccgagc agcctttgta ctctgcttgc ggagggctgg 2221 gagaccctcc aggacattcc caccctcccc catgctgcca agttgtagct atagctacaa 2281 ataaaaaaaa accttgtttt ccagaaaaaa aaaaaaaaaa aaaaa
Examplary figures showing the nuclei of the cells considered for
quantification.
(A) (B)
Figure 45: Representative confocal immunofluorescence analysis of zyxin localisation in (A) quiescent and (B) stretched HUVEC. The arrows depicting non-nuclear stress fibres over the nuclei of quiescent cells (thus, such nuclei are counted as negative) and the freckle-like pattern in the stretched nucleus (counted as zyxin-positive). The left panel always is an overview (Bar: 50 µm), the right pictures are enlargements of nuclei. Scale bar: 10 µm.
Positive nucleusStretchQuiescent Negative nucleus

AACCKKNNOOWWLLEEDDGGEEMMEENNTTSS
98
ACKNOWLEDGEMENTS I would like to sincerely acknowledge Prof. Dr. Markus Hecker, firstly for providing
me the opportunity to pursue my PhD studies at the department of cardiovascular
physiology, and secondly for his consistent guidance throughout my thesis. I
particularly thank him for our regular group discussions, which had a major influence
on this thesis. His leadership, attention to details and urge for perfection has set an
example that I would like to match some day.
The present thesis was simply not possible without the enthusiastic supervision of my
mentor PD. Dr. Marco Cattaruzza. He virtually taught me everything; from making
me understand the basic concepts of cardiovascular physiology, to having a perfect
final draft of the thesis. The enthusiasm and dedication he has for research was highly
motivational, especially during the tough times when I went for weeks without good
results. I am indebted to him for showing confidence in me and always urging me to
achieve greater heights.
I sincerely thank Prof. Dr. Stephan Frings for being my formal supervisor. I also thank
PD. Dr. Andreas Wagner, PD. Dr. Thomas Korff and Dr. Oliver Drews for their
valuable discussion and suggestions during the course of my PhD. I also thank Dr.
Victor Ciocotisan for PEI transfection reagent. I warmly thank Kerstin Moeller and
Cordula Rumig for their help with proof-reading the thesis.
It is my pleasure to acknowledge Renate Cattaruzza and Anja Feldner for their
valuable guidance through different phases of my PhD. Technical expertise of
Danijela Heide is deeply appreciated. Her precision and speed went a long way in
getting my experiments done on time. I also thank my present and former colleagues,
Mathilde Lorenz, Franziska Mohr, Larissa Pfisterer, Hannes Otto, Ender Serbest,
Sviatlana Yakubenia, Oliver Adolph, Barbara Richards, Michaela Neidig, Juergen
Czachurski, Agnieszka Wojtowicz, Jennifer Braun and Beate Berghoefer.
I am thankful to my best friends Santhosh Jayaraju, Sheethal Panchakshari, Deepa
Damodaran, Hui Liu, and my roommate Pia Schmidt for always being there through
my good and bad times.
Lastly, and most importantly, my utmost gratitude is reserved to my family: parents,
Suresh Babu and Sujatha for their constant support and encouragement and sister;
Sanjana Suresh for her keeping me light hearted with her jolly-well attitude towards
life.