including multi-echelon inventory in your siop cycle - our vision at solventure
TRANSCRIPT
Multi-Echelon Inventory OptimizationOur vision at Solventure
Solventure © Proprietary and Confidential+32 (0) 3 685 70 03 or [email protected]
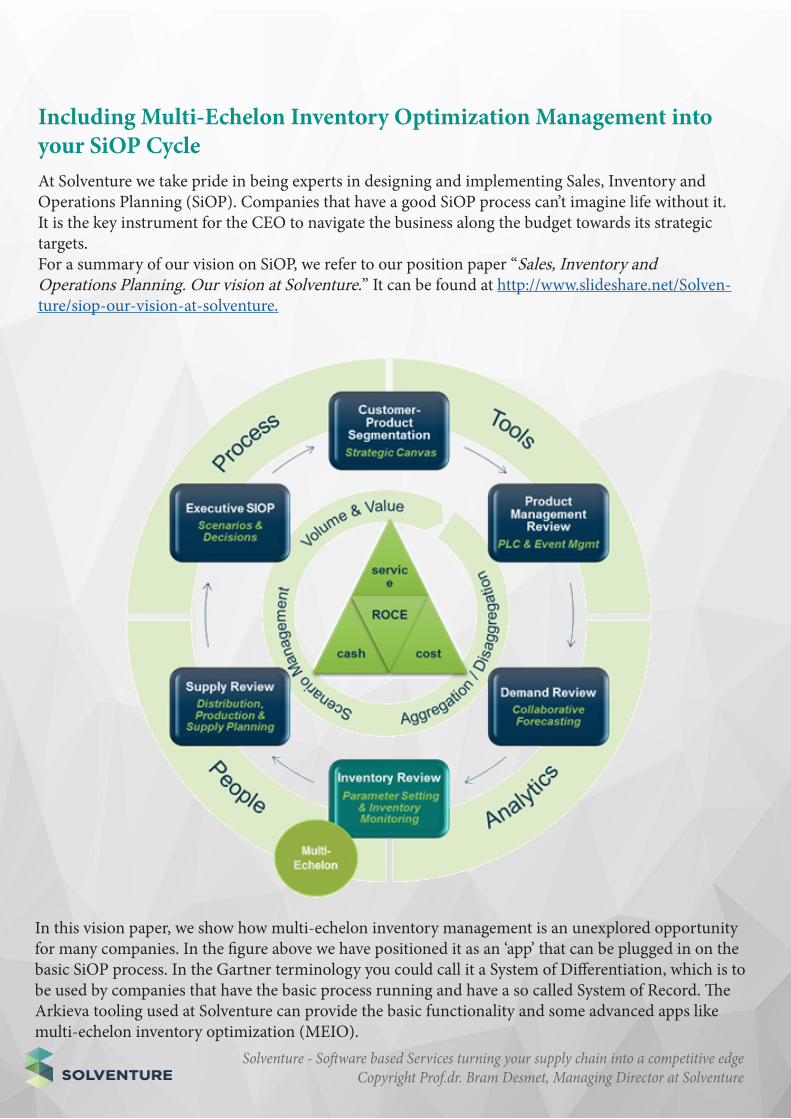
Including Multi-Echelon Inventory Optimization Management into your SiOP Cycle
Solventure - Software based Services turning your supply chain into a competitive edgeCopyright Prof.dr. Bram Desmet, Managing Director at Solventure
At Solventure we take pride in being experts in designing and implementing Sales, Inventory and Operations Planning (SiOP). Companies that have a good SiOP process can’t imagine life without it. It is the key instrument for the CEO to navigate the business along the budget towards its strategic targets. For a summary of our vision on SiOP, we refer to our position paper “Sales, Inventory and Operations Planning. Our vision at Solventure.” It can be found at http://www.slideshare.net/Solven-ture/siop-our-vision-at-solventure.
In this vision paper, we show how multi-echelon inventory management is an unexplored opportunity for many companies. In the figure above we have positioned it as an ‘app’ that can be plugged in on the basic SiOP process. In the Gartner terminology you could call it a System of Differentiation, which is to be used by companies that have the basic process running and have a so called System of Record. The Arkieva tooling used at Solventure can provide the basic functionality and some advanced apps like multi-echelon inventory optimization (MEIO).
Solventure - Software based Services turning your supply chain into a competitive edgeCopyright Prof.dr. Bram Desmet, Managing Director at Solventure
In our experience, the pressure on working capital has increased since the financial crisis. Working capital is composed of Accounts Payable, Accounts Receivable and Inventory. You try to extend payment terms to suppliers, shorten those of customers, and improve discipline to collect due invoices.
Inventory is much more difficult to manage. At the center of our SiOP framework you will find the Supply Chain Triangle. Reducing inventory is a balance between service, cost and inventory. I’ve heard CEO’s telling their board “I can easily halve the inventory … but we’ll be out of business in 2 years”. A blind cut in inventories will have a negative impact on service towards the customer, and service is a driver for top-line. The resulting service issues will also increase operational costs because of firefighting. We will break the optimal sequence in production and we will expedite orders trying to fight the service issues. We describe the delicate balancing act and how companies struggle with it in more detail in our vision paper “Balancing Service, Cost and Cash in the Supply Chain Triangle”, which can also be found on www.slideshare.net/solventure.
The trick of ‘escaping’ the pressure in the triangle is to find ways to improve on all 3 dimensions at the same time: reduce inventory, while at the same time improving service and cost. As we will argue multi-echelon inventory management is one of those silver bullets that is still overlooked by many companies. We will explain what it is and why companies have failed to fully adopt it so far.
Companies are under pressure to reduce inventory
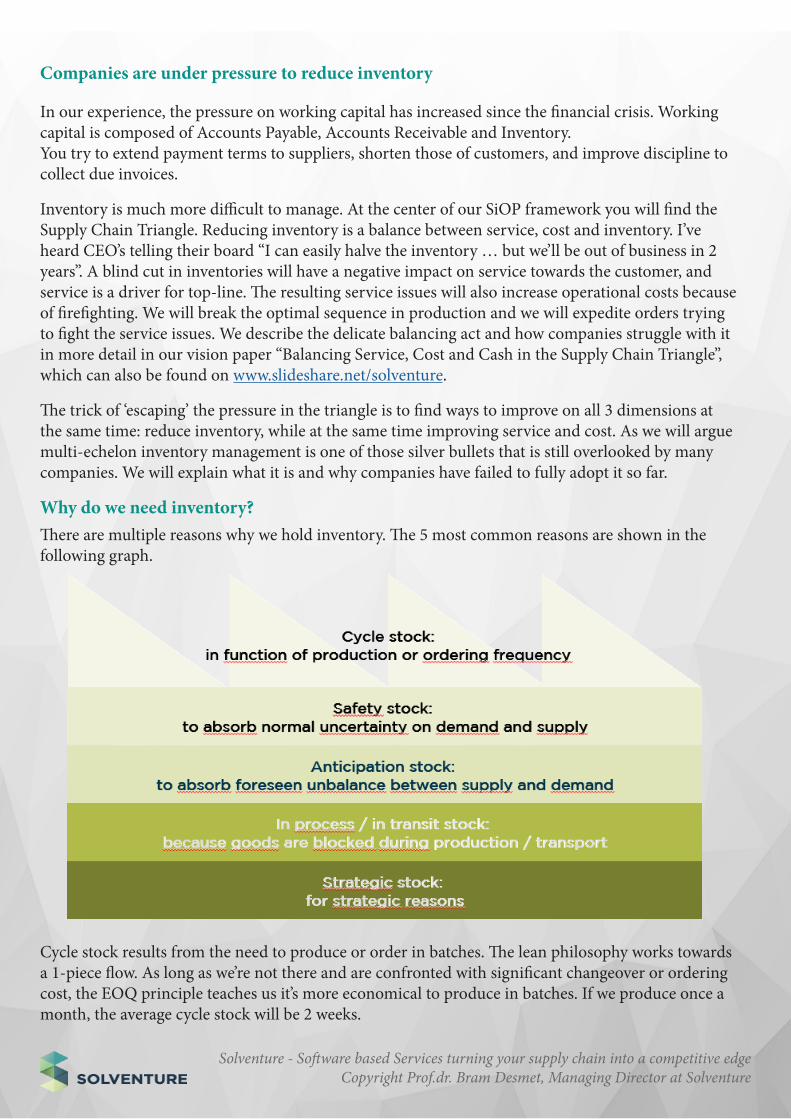
Why do we need inventory?There are multiple reasons why we hold inventory. The 5 most common reasons are shown in the following graph.
Cycle stock results from the need to produce or order in batches. The lean philosophy works towards a 1-piece flow. As long as we’re not there and are confronted with significant changeover or ordering cost, the EOQ principle teaches us it’s more economical to produce in batches. If we produce once a month, the average cycle stock will be 2 weeks.
Solventure - Software based Services turning your supply chain into a competitive edgeCopyright Prof.dr. Bram Desmet, Managing Director at Solventure
If we produce once a week, the average cycle stock will be half a week. The EOQ teaches us that batch sizes go up as the change-over/order costs go up or the product cost goes down. They are primary drivers of the amount of cycle stock.
Safety stock is a buffer against uncertainty. It will typically look at the forecast error, the average lead time and the variance on that lead time. More advanced variants will look at factors like yield or quality loss. A second element in the safety stock is the service level. The service levels are typically converted into a k- or z-factor that defines how many times we will cover for the uncertainty. They are 2 separate things. We can have a product with low uncertainty but require a very high service level. We can have products with a high uncertainty but accept a low service level, for instance if there are multiple substitutes available.
Anticipation stock is typically the result from your supply planning process. I may build up stock to anticipate a seasonal peak, a tender or a shutdown. These types of planning decisions lead to so-called anticipation stock.
As long as we have lead times we will have inventory sitting on the production floor or sitting on trucks, trains or boats. We call this the work-in-process or transit stock. Improving flow in production can reduce the work-in-process. Optimizing transport routes can reduce the stock in transit.
Strategic stock is carried to manage potential risks, e.g. an expected price increase or a shortage in a key raw material. As opposed to a plant shutdown these events are not sure. That makes the difference between anticipation and strategic. You can consider strategic stock more as hedging and part of risk management in the supply chain.
There are many other reasons companies carry inventory. An example in retail is ‘presentation stock’. We may need 5 pieces at minimum to fill the shelves and make the product sell. This behaves like a Minimum Order Quantity at the supply side. All extra drivers for inventory. As a company it is important that you list your key inventory drivers. Adapt the classification to something that works for you.
We see many companies where inventories increase with 20-30% over a 2-3 month period without knowing the reason. The only way to explain is to look for and monitor the underlying drivers. If you decide to keep extra stock for strategic reasons, then document it accordingly in your inventory plan!If you decide to keep producing during a period of lower demand, document the according stock increase in your inventory plan. Show what you expect as inventory evolution and show which drivers take it up or down!
Single-Echelon versus Multi-Echelon
While the above figure helps in understanding the different drivers of inventory, it looks at only 1 inventory point. It is the so-called single-echelon view.
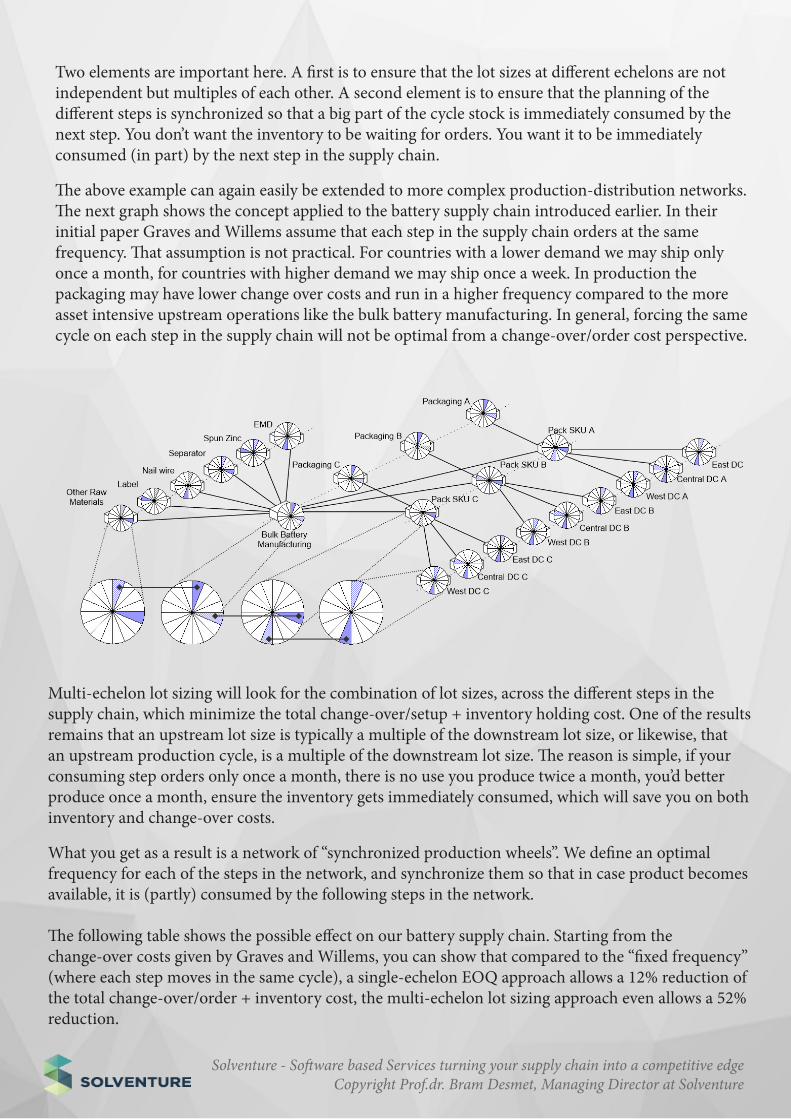
In practice, we hold inventory at different echelons in the supply chain, as shown in the battery supply chain below, taken from the research of Stephen Graves and Sean Willems1.
1Graves, S.C., Willems, S.P., “Optimizing Strategic Safety Stock Placement in Supply Chains”, Manufacturing & Service Operations Management,
2000, 2, 68-83
Solventure - Software based Services turning your supply chain into a competitive edgeCopyright Prof.dr. Bram Desmet, Managing Director at Solventure
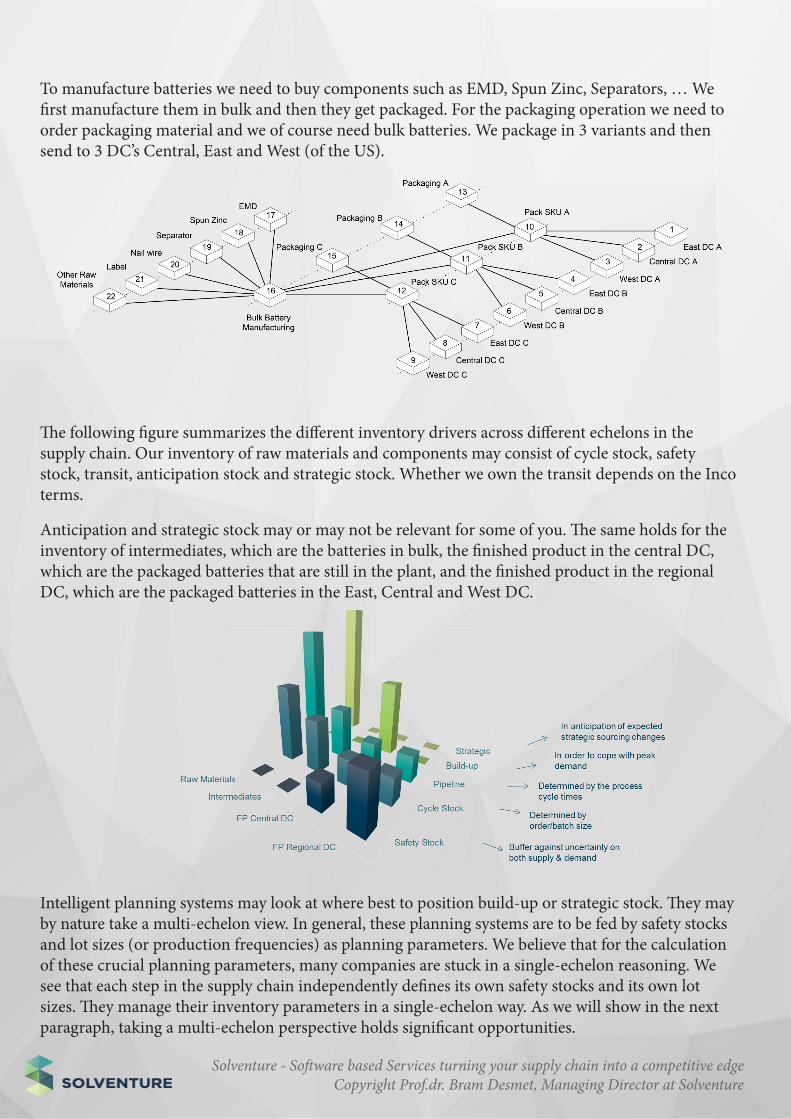
To manufacture batteries we need to buy components such as EMD, Spun Zinc, Separators, … We first manufacture them in bulk and then they get packaged. For the packaging operation we need to order packaging material and we of course need bulk batteries. We package in 3 variants and then send to 3 DC’s Central, East and West (of the US).
The following figure summarizes the different inventory drivers across different echelons in the supply chain. Our inventory of raw materials and components may consist of cycle stock, safety stock, transit, anticipation stock and strategic stock. Whether we own the transit depends on the Inco terms.
Anticipation and strategic stock may or may not be relevant for some of you. The same holds for the inventory of intermediates, which are the batteries in bulk, the finished product in the central DC, which are the packaged batteries that are still in the plant, and the finished product in the regional DC, which are the packaged batteries in the East, Central and West DC.
Intelligent planning systems may look at where best to position build-up or strategic stock. They may by nature take a multi-echelon view. In general, these planning systems are to be fed by safety stocks and lot sizes (or production frequencies) as planning parameters. We believe that for the calculation of these crucial planning parameters, many companies are stuck in a single-echelon reasoning. We see that each step in the supply chain independently defines its own safety stocks and its own lot sizes. They manage their inventory parameters in a single-echelon way. As we will show in the next paragraph, taking a multi-echelon perspective holds significant opportunities.
Solventure - Software based Services turning your supply chain into a competitive edgeCopyright Prof.dr. Bram Desmet, Managing Director at Solventure
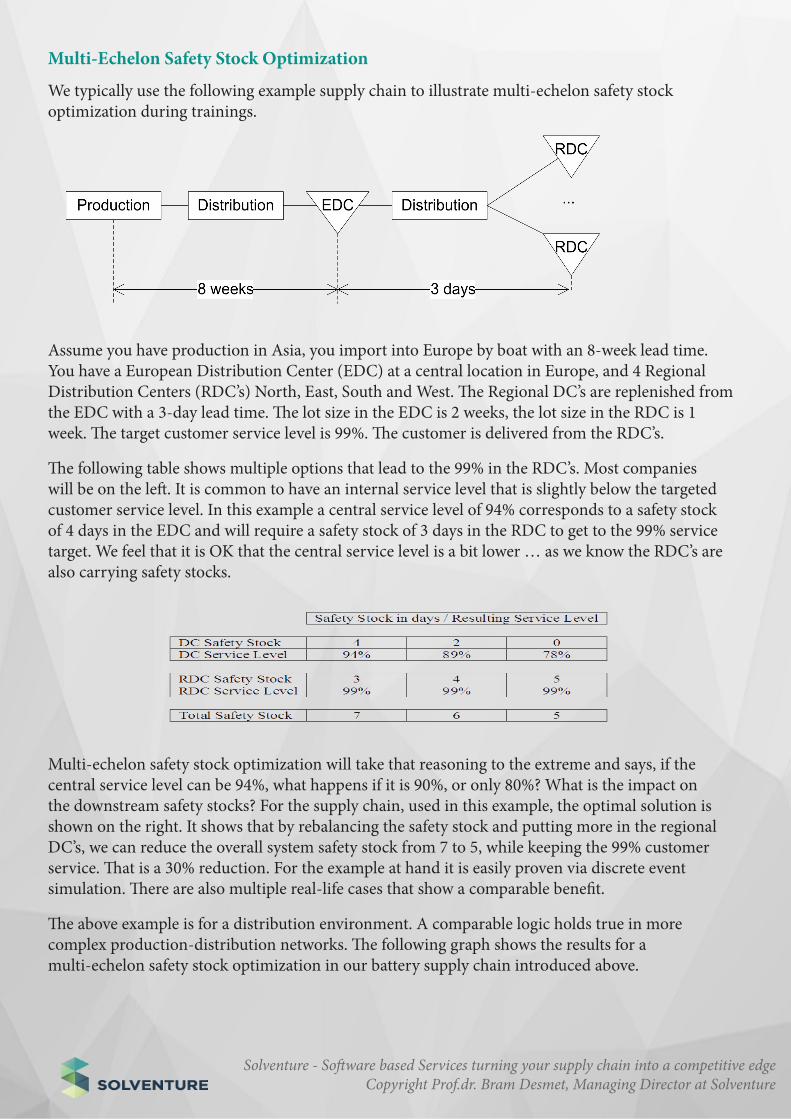
We typically use the following example supply chain to illustrate multi-echelon safety stock optimization during trainings.
Multi-Echelon Safety Stock Optimization
Assume you have production in Asia, you import into Europe by boat with an 8-week lead time. You have a European Distribution Center (EDC) at a central location in Europe, and 4 Regional Distribution Centers (RDC’s) North, East, South and West. The Regional DC’s are replenished from the EDC with a 3-day lead time. The lot size in the EDC is 2 weeks, the lot size in the RDC is 1 week. The target customer service level is 99%. The customer is delivered from the RDC’s.
The following table shows multiple options that lead to the 99% in the RDC’s. Most companies will be on the left. It is common to have an internal service level that is slightly below the targeted customer service level. In this example a central service level of 94% corresponds to a safety stock of 4 days in the EDC and will require a safety stock of 3 days in the RDC to get to the 99% service target. We feel that it is OK that the central service level is a bit lower … as we know the RDC’s are also carrying safety stocks.
Multi-echelon safety stock optimization will take that reasoning to the extreme and says, if the central service level can be 94%, what happens if it is 90%, or only 80%? What is the impact on the downstream safety stocks? For the supply chain, used in this example, the optimal solution is shown on the right. It shows that by rebalancing the safety stock and putting more in the regional DC’s, we can reduce the overall system safety stock from 7 to 5, while keeping the 99% customer service. That is a 30% reduction. For the example at hand it is easily proven via discrete event simulation. There are also multiple real-life cases that show a comparable benefit.
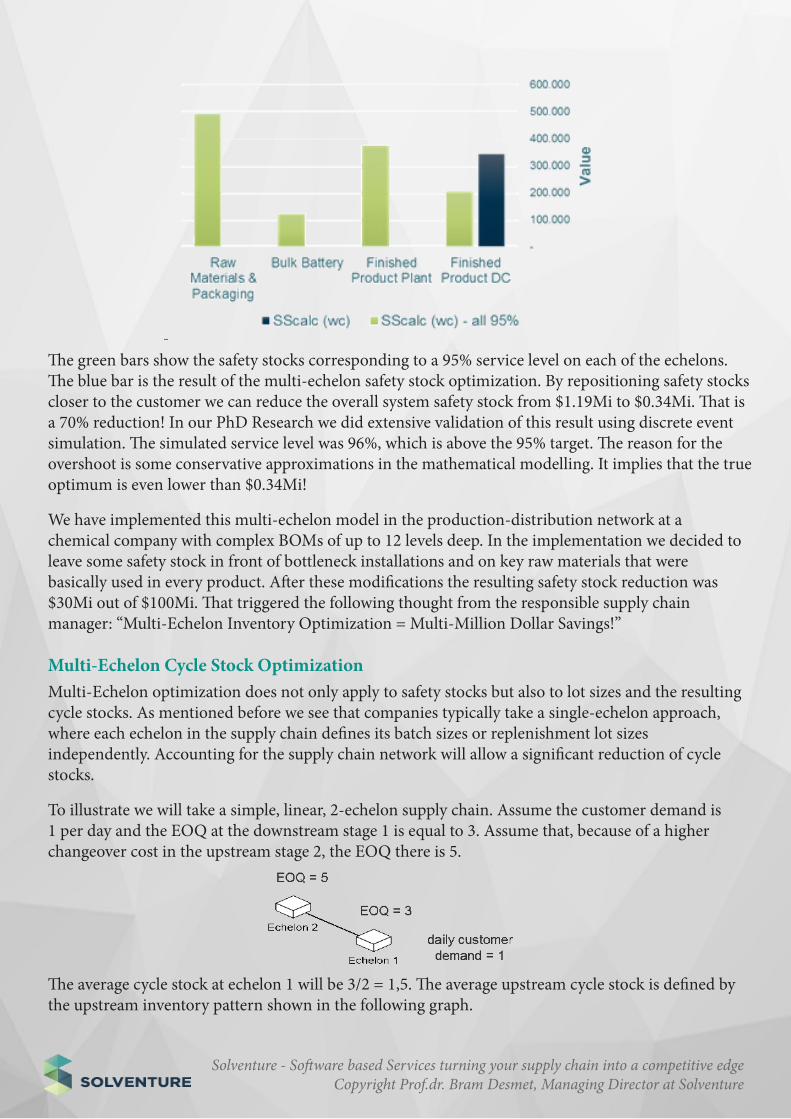
The above example is for a distribution environment. A comparable logic holds true in more complex production-distribution networks. The following graph shows the results for a multi-echelon safety stock optimization in our battery supply chain introduced above.
Solventure - Software based Services turning your supply chain into a competitive edgeCopyright Prof.dr. Bram Desmet, Managing Director at Solventure
The green bars show the safety stocks corresponding to a 95% service level on each of the echelons. The blue bar is the result of the multi-echelon safety stock optimization. By repositioning safety stocks closer to the customer we can reduce the overall system safety stock from $1.19Mi to $0.34Mi. That is a 70% reduction! In our PhD Research we did extensive validation of this result using discrete event simulation. The simulated service level was 96%, which is above the 95% target. The reason for the overshoot is some conservative approximations in the mathematical modelling. It implies that the true optimum is even lower than $0.34Mi!
We have implemented this multi-echelon model in the production-distribution network at a chemical company with complex BOMs of up to 12 levels deep. In the implementation we decided to leave some safety stock in front of bottleneck installations and on key raw materials that were basically used in every product. After these modifications the resulting safety stock reduction was $30Mi out of $100Mi. That triggered the following thought from the responsible supply chain manager: “Multi-Echelon Inventory Optimization = Multi-Million Dollar Savings!”
Multi-Echelon Cycle Stock OptimizationMulti-Echelon optimization does not only apply to safety stocks but also to lot sizes and the resulting cycle stocks. As mentioned before we see that companies typically take a single-echelon approach, where each echelon in the supply chain defines its batch sizes or replenishment lot sizes independently. Accounting for the supply chain network will allow a significant reduction of cycle stocks.
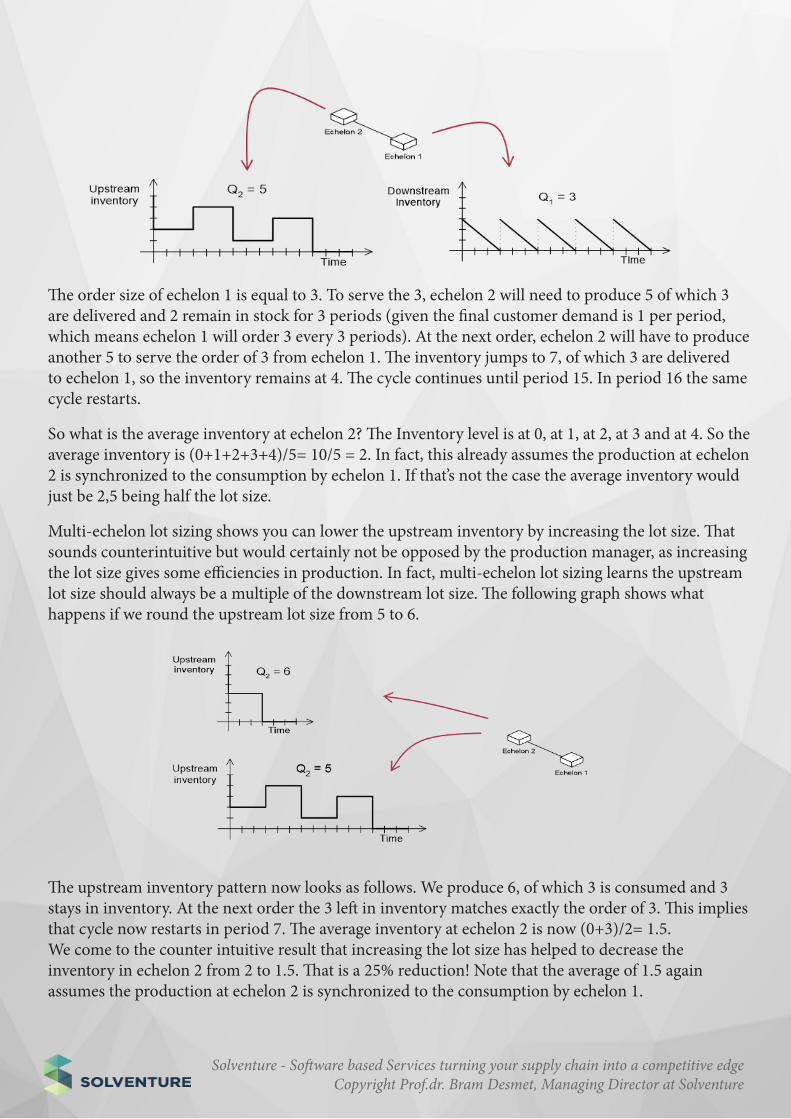
To illustrate we will take a simple, linear, 2-echelon supply chain. Assume the customer demand is 1 per day and the EOQ at the downstream stage 1 is equal to 3. Assume that, because of a higher changeover cost in the upstream stage 2, the EOQ there is 5.
The average cycle stock at echelon 1 will be 3/2 = 1,5. The average upstream cycle stock is defined by the upstream inventory pattern shown in the following graph.
Solventure - Software based Services turning your supply chain into a competitive edgeCopyright Prof.dr. Bram Desmet, Managing Director at Solventure
The order size of echelon 1 is equal to 3. To serve the 3, echelon 2 will need to produce 5 of which 3 are delivered and 2 remain in stock for 3 periods (given the final customer demand is 1 per period, which means echelon 1 will order 3 every 3 periods). At the next order, echelon 2 will have to produce another 5 to serve the order of 3 from echelon 1. The inventory jumps to 7, of which 3 are delivered to echelon 1, so the inventory remains at 4. The cycle continues until period 15. In period 16 the same cycle restarts.
So what is the average inventory at echelon 2? The Inventory level is at 0, at 1, at 2, at 3 and at 4. So the average inventory is (0+1+2+3+4)/5= 10/5 = 2. In fact, this already assumes the production at echelon 2 is synchronized to the consumption by echelon 1. If that’s not the case the average inventory would just be 2,5 being half the lot size.
Multi-echelon lot sizing shows you can lower the upstream inventory by increasing the lot size. That sounds counterintuitive but would certainly not be opposed by the production manager, as increasing the lot size gives some efficiencies in production. In fact, multi-echelon lot sizing learns the upstream lot size should always be a multiple of the downstream lot size. The following graph shows what happens if we round the upstream lot size from 5 to 6.
The upstream inventory pattern now looks as follows. We produce 6, of which 3 is consumed and 3 stays in inventory. At the next order the 3 left in inventory matches exactly the order of 3. This implies that cycle now restarts in period 7. The average inventory at echelon 2 is now (0+3)/2= 1.5. We come to the counter intuitive result that increasing the lot size has helped to decrease the inventory in echelon 2 from 2 to 1.5. That is a 25% reduction! Note that the average of 1.5 again assumes the production at echelon 2 is synchronized to the consumption by echelon 1.
Solventure - Software based Services turning your supply chain into a competitive edgeCopyright Prof.dr. Bram Desmet, Managing Director at Solventure
Multi-echelon lot sizing will look for the combination of lot sizes, across the different steps in the supply chain, which minimize the total change-over/setup + inventory holding cost. One of the results remains that an upstream lot size is typically a multiple of the downstream lot size, or likewise, that an upstream production cycle, is a multiple of the downstream lot size. The reason is simple, if your consuming step orders only once a month, there is no use you produce twice a month, you’d better produce once a month, ensure the inventory gets immediately consumed, which will save you on both inventory and change-over costs.
What you get as a result is a network of “synchronized production wheels”. We define an optimal frequency for each of the steps in the network, and synchronize them so that in case product becomes available, it is (partly) consumed by the following steps in the network.
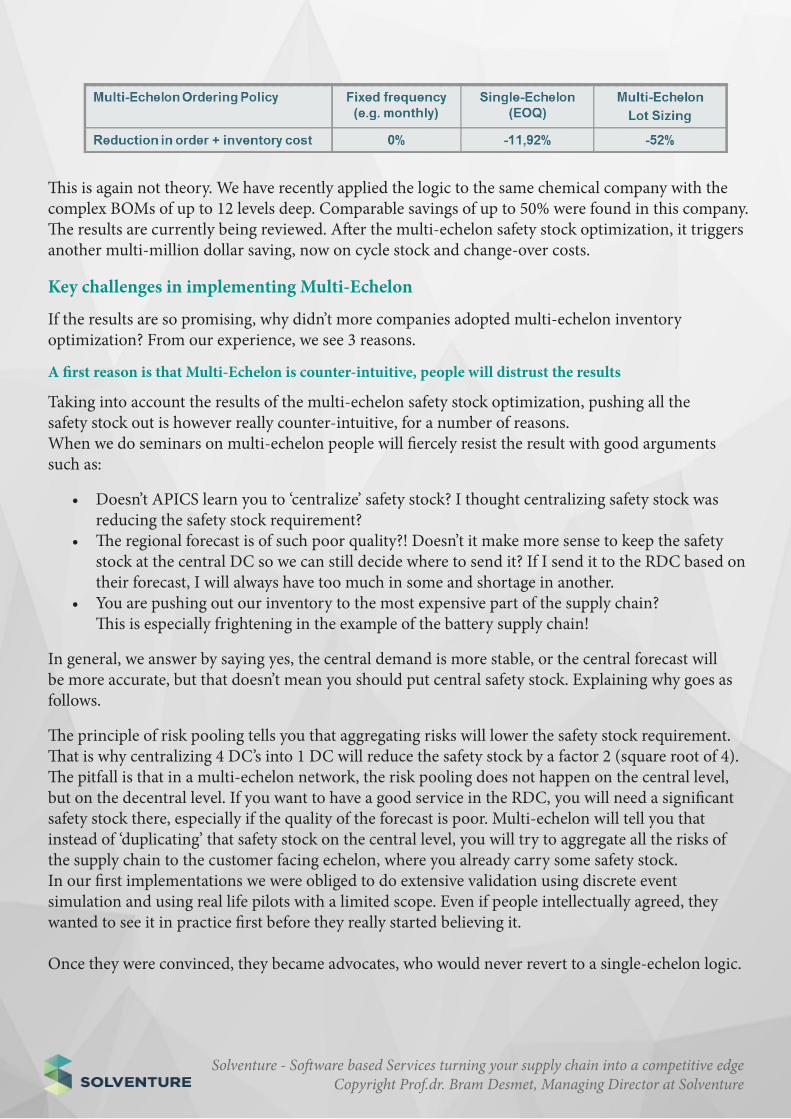
The following table shows the possible effect on our battery supply chain. Starting from the change-over costs given by Graves and Willems, you can show that compared to the “fixed frequency” (where each step moves in the same cycle), a single-echelon EOQ approach allows a 12% reduction of the total change-over/order + inventory cost, the multi-echelon lot sizing approach even allows a 52% reduction.
Two elements are important here. A first is to ensure that the lot sizes at different echelons are not independent but multiples of each other. A second element is to ensure that the planning of the different steps is synchronized so that a big part of the cycle stock is immediately consumed by the next step. You don’t want the inventory to be waiting for orders. You want it to be immediately consumed (in part) by the next step in the supply chain.
The above example can again easily be extended to more complex production-distribution networks. The next graph shows the concept applied to the battery supply chain introduced earlier. In their initial paper Graves and Willems assume that each step in the supply chain orders at the same frequency. That assumption is not practical. For countries with a lower demand we may ship only once a month, for countries with higher demand we may ship once a week. In production the packaging may have lower change over costs and run in a higher frequency compared to the more asset intensive upstream operations like the bulk battery manufacturing. In general, forcing the same cycle on each step in the supply chain will not be optimal from a change-over/order cost perspective.
Solventure - Software based Services turning your supply chain into a competitive edgeCopyright Prof.dr. Bram Desmet, Managing Director at Solventure
If the results are so promising, why didn’t more companies adopted multi-echelon inventory optimization? From our experience, we see 3 reasons.
This is again not theory. We have recently applied the logic to the same chemical company with the complex BOMs of up to 12 levels deep. Comparable savings of up to 50% were found in this company. The results are currently being reviewed. After the multi-echelon safety stock optimization, it triggers another multi-million dollar saving, now on cycle stock and change-over costs.
Key challenges in implementing Multi-Echelon
A first reason is that Multi-Echelon is counter-intuitive, people will distrust the results
Taking into account the results of the multi-echelon safety stock optimization, pushing all the safety stock out is however really counter-intuitive, for a number of reasons. When we do seminars on multi-echelon people will fiercely resist the result with good arguments such as:
• Doesn’t APICS learn you to ‘centralize’ safety stock? I thought centralizing safety stock was reducing the safety stock requirement?
• The regional forecast is of such poor quality?! Doesn’t it make more sense to keep the safety stock at the central DC so we can still decide where to send it? If I send it to the RDC based on their forecast, I will always have too much in some and shortage in another.
• You are pushing out our inventory to the most expensive part of the supply chain? This is especially frightening in the example of the battery supply chain!
In general, we answer by saying yes, the central demand is more stable, or the central forecast will be more accurate, but that doesn’t mean you should put central safety stock. Explaining why goes as follows.
The principle of risk pooling tells you that aggregating risks will lower the safety stock requirement. That is why centralizing 4 DC’s into 1 DC will reduce the safety stock by a factor 2 (square root of 4). The pitfall is that in a multi-echelon network, the risk pooling does not happen on the central level, but on the decentral level. If you want to have a good service in the RDC, you will need a significant safety stock there, especially if the quality of the forecast is poor. Multi-echelon will tell you that instead of ‘duplicating’ that safety stock on the central level, you will try to aggregate all the risks of the supply chain to the customer facing echelon, where you already carry some safety stock.In our first implementations we were obliged to do extensive validation using discrete event simulation and using real life pilots with a limited scope. Even if people intellectually agreed, they wanted to see it in practice first before they really started believing it.
Once they were convinced, they became advocates, who would never revert to a single-echelon logic.
Solventure - Software based Services turning your supply chain into a competitive edgeCopyright Prof.dr. Bram Desmet, Managing Director at Solventure
A second important hurdle to take in implementing multi-echelon is setting up appropriate incentive systems and overcoming a deep distrust within the supply chain
Let’s go back to the results of the distribution example. The CFO will love multi-echelon as it allows to reduce the total safety stock with 30% while keeping the same customer service. The manager of the regional DC will have a different view. He needs to increase his safety stock from 3 to 5 days, that’s a 66% increase. And for what type of reason? Because the central DC is taking away their safety stock, and he as the poor regional DC manager needs to pay for that. Imagine how this type of debate goes if each of the DC managers has received his own target to reduce inventory by 10-15%?!
We have done comparable calculations for retailers where we see the following. The shops will de-mand a high service level from the central DC for their replenishment. As a result, the central DC will need to keep significant safety stock. The central DC will demand a high service level from its sup-plier, sometimes even without sharing any forecast. As a result, the supplier will need to carry a high safety stock. From the above examples it is clear you can easily halve the safety stock in this type of supply chain by putting it closer to the customer. Even if the shops would not be able to take the full increase, the result will never be that each step in the supply chain keeps on carrying a high safety stock. Even if retailers would intellectually agree and if we’ve proven the result via something like discrete event simulation, they will still be reluctant to implement the result although Multi-echelon would drastically shift their inventories downstream. Again each of the echelons may have its own targets on inventory.
There is also a problem of ownership, as the retailer would need to take more inventory and all of the inventory benefits would be on the supplier’s side. Moreover, what would the supplier do if he has a major outage? How would I be sure he would deliver me instead of a competitor? Next to KPI’s part of the issue is distrust. We feel more comfortable with a situation where each of the steps in the supply chain ‘takes care of his own’ instead of going to a true end-to-end optimization.
A third, but less important reason, is that multi-echelon requires more advanced tooling
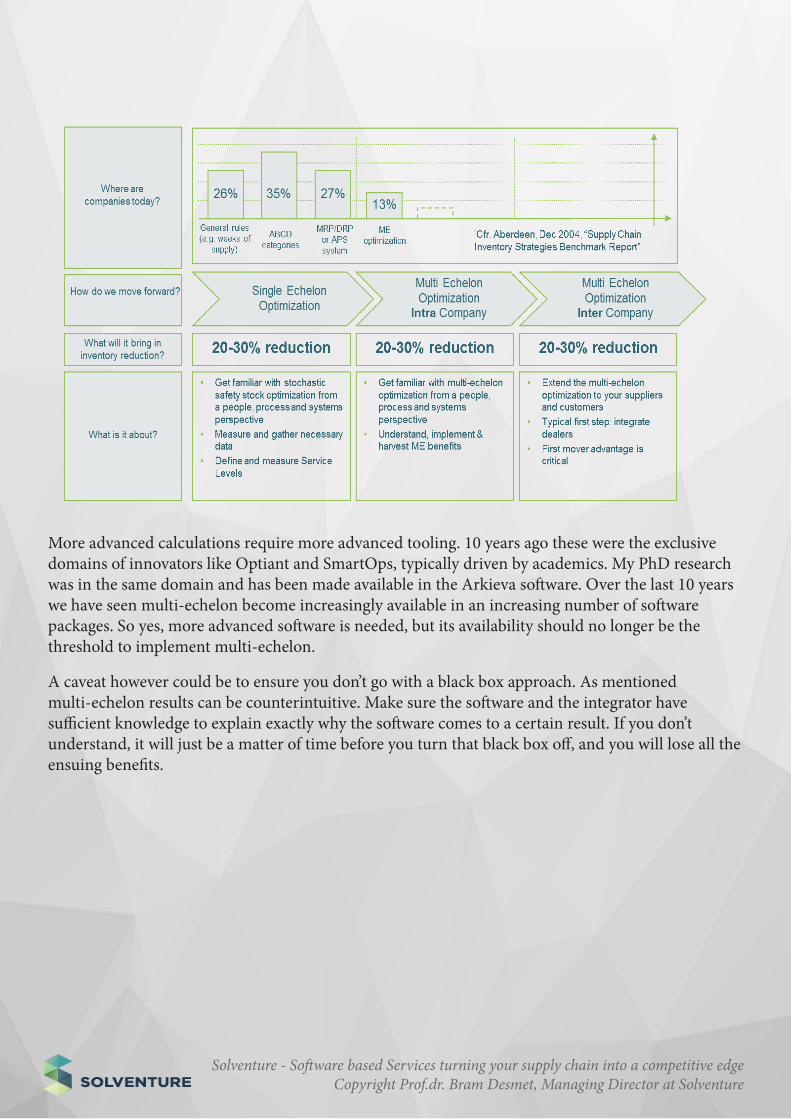
Many companies still use simplistic policies to set safety stock or lot size targets. Some just carry 2 weeks of safety stock for all items. Some refine that based on an ABC/XYZ classification. The more advanced companies calculate their safety stocks based on a formula, accounting for lead times, forecast error, lead time variability and a target service level. An Aberdeen report from 2004, cfr. below, shows that only 13% of companies have adopted a multi-echelon approach. Reasons for that can be the above.
Solventure - Software based Services turning your supply chain into a competitive edgeCopyright Prof.dr. Bram Desmet, Managing Director at Solventure
More advanced calculations require more advanced tooling. 10 years ago these were the exclusive domains of innovators like Optiant and SmartOps, typically driven by academics. My PhD research was in the same domain and has been made available in the Arkieva software. Over the last 10 years we have seen multi-echelon become increasingly available in an increasing number of software packages. So yes, more advanced software is needed, but its availability should no longer be the threshold to implement multi-echelon.
A caveat however could be to ensure you don’t go with a black box approach. As mentioned multi-echelon results can be counterintuitive. Make sure the software and the integrator have sufficient knowledge to explain exactly why the software comes to a certain result. If you don’t understand, it will just be a matter of time before you turn that black box off, and you will lose all the ensuing benefits.
Solventure - Software based Services turning your supply chain into a competitive edgeCopyright Prof.dr. Bram Desmet, Managing Director at Solventure
In summary we believe that multi-echelon optimization of safety stock and lot sizes or production frequencies, is still an overlooked opportunity for many companies. Both come with high rewards of a 30-50% inventory reduction.
Multi-echelon inventory was the topic of my PhD which I finished in 2009. I’ve always been puzzled why it has not been more largely adopted by companies given the significant impact and the pressure on inventory since the financial crisis.As a first reason I see that the results are counterintuitive. I have been explaining multi-echelon for 10 years and I still encounter the same disbelief and objections as I did 10 years ago in my first implementation.
Secondly, I feel that different steps in the supply chain feel more comfortable when each step of the supply chain ‘takes care of his own’ instead of going to a true end-to-end optimization. There is a deep divide and mutual distrust in our global supply chains. You wouldn’t trust that supplier to actually produce on time, nor would you trust the forecast of that region to actually make sense. Depending on where you are in the supply chain, there are always good reasons and examples not to trust each other. Multi-echelon does require some central control, or at least orchestration. That’s a thought which we, in general, don’t like.
A last reason could be technology, though we’ve discussed technology is increasingly available. The caveat is to avoid a black box. Make sure the software provider and the integrator both have sufficient knowledge to explain exactly why the software comes to a certain result. The technology is increasingly available; the knowledge may still be an issue.
As the pressure on inventory keeps on increasing, I’m sure companies will slowly but surely overcome the above limitations. Having spent 5 years of my life working on this topic, it will be an exciting moment!
In summary
Solventure - Software based Services turning your supply chain into a competitive edgeCopyright Prof.dr. Bram Desmet, Managing Director at Solventure
We’d like to hear from you!
Let us know your thoughts. We’re curious on which aspects you’d agree or disagree. Where are you in the SiOP journey? Which challenges are you facing? Together we can make it even more exciting and rewarding!
About Prof.dr. Bram DesmetProf.dr. Bram Desmet is the Managing Director of Solventure, a Europe based expert in designing and implementing SiOP processes using the Arkieva software. Bram is also an adjunct professor in Operations and Supply Chain at the Vlerick Business School.
He obtained his PhD at Gent University on the topic of “Safety stock optimization in multi-echelon production-distribution networks”. He is working on a book on the “Supply Chain Triangle”.
Look out for more at http://www.slideshare.net/Solventure. We welcome your feedback at [email protected]
About Solventure
Solventure turns your supply chain into a competitive advantage and engages in long-term improvement projects. Solventure adds value by providing actionable insights through a unique combination of tools and expert resources. The Arkieva software selected and distributed by Solventure is user friendly, scalable, and proven in optimization and quantitative techniques. Solventure is Arkieva’s channel partner in Europe.
For more information please visit www.solventure.eu.
About Arkieva
Arkieva, founded in 1993, is the developer of Arkieva software solutions for global manufacturing supply chains. With headquarters in Wilmington, Delaware, USA, and offices in Antwerp, Belgium and, Mangalore, India, Arkieva is positioned to support multinational businesses around the world. Arkieva products enhance productivity and reduce operating costs in the supply chain, providing the full range of features necessary for effective Sales and Operations Planning (S&OP). Such major corporations as Momentive, INVISTA, Gates Europe, and INEOS use Arkieva solutions.
For more information, visit www.arkieva.com.
Look out for more!Visit our Slideshare page, www.slideshare.net/solventure, for our more in depth position papers on “Balancing service, cost and cash in the supply chain triangle”, “Segmenting customer in B2B environments”, “Effective Demand Planning”, “Including Product Management in your SiOP cycle” and many more.