inclusion modification in steel castings using automated
TRANSCRIPT
Scholars' Mine Scholars' Mine
Masters Theses Student Theses and Dissertations
2009
Inclusion modification in steel castings using automated Inclusion modification in steel castings using automated
inclusion analysis inclusion analysis
Vintee Singh
Follow this and additional works at: https://scholarsmine.mst.edu/masters_theses
Part of the Materials Science and Engineering Commons
Department: Department:
Recommended Citation Recommended Citation Singh, Vintee, "Inclusion modification in steel castings using automated inclusion analysis" (2009). Masters Theses. 5423. https://scholarsmine.mst.edu/masters_theses/5423
This thesis is brought to you by Scholars' Mine, a service of the Missouri S&T Library and Learning Resources. This work is protected by U. S. Copyright Law. Unauthorized use including reproduction for redistribution requires the permission of the copyright holder. For more information, please contact [email protected].


INCLUSION MODIFICATION IN STEEL CASTINGS USING AUTOMATED
INCLUSION ANALYSIS
by
VINTEE SINGH
A THESIS
Presented to the Faculty of the Graduate School of the
MISSOURI UNIVERSITY OF SCIENCE AND TECHNOLOGY
In Partial Fulfillment of the Requirements for the Degree
MASTER OF SCIENCE IN MATERIALS SCIENCE AND ENGINEERING
2009
Approved by
Kent D. Peaslee, Advisor
Von L. Richards
Simon Lekakh

© 2009
Vintee Singh
All Rights Reserved

iii
ABSTRACT
The objective of this research is to study the effects of changing the melt and ladle
practices (deoxidation, slag, refractory types, etc.) in steel foundries on the cleanliness
and toughness of steel castings. This study used an automated inclusion analyzer ASPEX
PICA-1020, which provides a rapid and accurate method for determining the
composition, size, number, and spacing of the inclusions present in steel samples.
The first step in this research was to complete a series of industrial tests to
benchmark the current foundry ladle practices with respect to cleanliness of the cast steel.
Trials were conducted at steel foundries using induction and arc furnaces of capacity 1 to
20 tons. Samples collected from the furnace, ladle, and cast products were analyzed for
inclusions, using ASPEX, and for their oxygen content, using a Leco analyzer.
The next step was to conduct industrial trials to study the effects of ladle
metallurgy (Ca-treatment through wire injection, gas stirring, etc.) on inclusions and
mechanical properties of the casting. Several 1000 lb ladles of steel were treated with
different amounts and speeds of Ca and CaSi wire injection and argon stirring. The
inclusions and the oxygen content were analyzed in the samples collected. Charpy impact
tests were conducted on the cast products to observe the relationship between inclusions
and the toughness of the cast steel. FLUENT modeling was done to understand the
effects of various parameters of the ladle-practice on flotation of inclusions.
In all the heats conducted with Ca-additions in the ladle, the fraction of area
covered by inclusions and the total oxygen was found to decrease after the Ca-treatment.
The toughness of the castings were found to be indirectly proportional to the inclusions
and increased with an increase in the amount of Ca-added in the ladle.

iv
ACKNOWLEDGMENTS
I wish to express my deepest gratitude to my advisor, Dr. Kent D. Peaslee for
providing me with an opportunity to pursue a master’s degree in Missouri University of
Science and Technology. His suggestions, guidance and personal attention have been a
great motivational factor for me to complete this research.
I would like to thank my committee members, Dr. Von L. Richards and Dr.
Simon Lekakh for their time and effort in reviewing my progress.
I acknowledge the support of U.S. Army Benet Labs for providing funding for
this research. I would also like to thank the Steel Founders Society of America and the
member companies that participated in this research.
I thank Tim Drake from Aspex Corporation for helping with the operation of the
Aspex equipment throughout this research.
Finally, I would like to thank my lab mates William Peach, Meghan McGrath,
Angella Schulte, Jared Teague, Dan Snyder, Darryl Kline and Phani Angara for their
continuous support.

v
TABLE OF CONTENTS
Page
ABSTRACT....................................................................................................................... iii
ACKNOWLEDGEMENTS……………………………………………………..………..iv
LIST OF ILLUSTRATIONS............................................................................................ vii
LIST OF TABLES............................................................................................................ xii
SECTION
1. LITERATURE SURVEY .......................................................................................... 1
1.1. SOURCE OF INCLUSIONS IN STEEL CASTINGS …………….…………..1
1.2. EFFECTS OF INCLUSIONS ON MECHANICAL PROPERTIES.................. 4
1.3. CALCIUM TREATMENT................................................................................. 6
1.3.1. Effects of Ca-treatment on Inclusions. ..................................................... 6
1.3.2. Thermodynamics of Calcium Addition.. .................................................. 9
1.3.3. Method of Ca-addition.. ......................................................................... 10
1.4. OUTLINE OF THE PROJECT ........................................................................ 13
2. BENCHMARKING CASTING PRACTICES ........................................................ 15
2.1. BACKGROUND OF ASPEX ANALYSIS...................................................... 15
2.2. EXPERIMENTAL PROCEDURE ................................................................... 18
2.3. RESULTS AND DISCUSSION....................................................................... 19
2.3.1. Plant A …………………………………………………………………19
2.3.2. Plant B …………………………………………………………………22
2.3.3. Plant C …...……………...……………………………………………..24
2.3.4. Missouri S&T Foundry ………...……...…….…………………...……33
2.3.5. Effect of Different Practices on Inclusions…...……………............…..35
2.3.5.1. Effect of Ca-addition……………......…………..…………….35
2.3.5.2. Effect of acid versus basic practice ….......……………...…....36
2.3.5.3. Effect of inclusion spacing.…..…………..………..………….38
2.3.5.4. Effect of ladle size………………...……..………..…………..39
3. FLUENT MODELING…………………………………………………………….40
3.1. DIFFERENT FLOW MODELS……………………………………………....42
vi
3.2. EFFECT OF LADLE SIZE .............................................................................. 43
3.3. EFFECT OF INCLUSION SHAPE AND SIZE............................................... 43
4. CALCIUM TREATMENT TRIALS ....................................................................... 46
4.1. EXPERIMENTAL PROCEDURE ................................................................... 46
4.1.1. Regular Practice.. ................................................................................... 46
4.1.2. Post-tap Treatment.. ............................................................................... 46
4.1.3. Speed of Wire-Injection.. ....................................................................... 48
4.1.4. Sampling and Oxygen Measurement.. ................................................... 48
4.2. RESULTS AND DISCUSSION………………………………………………49
4.2.1. Standard Practice. ................................................................................... 49
4.2.2. Effect of Ca-treatment ............................................................................ 51
4.2.3. Effect of Ar-stirring …..………………………………………………..56
4.2.4. Effect of Ca- addition Combined with Ar-stirring..………………...….58
4.2.5. Effect of Other Parameters.……………...……………………………..60
4.2.6. Comparison of All the Treatments ...…………………………….…….60
4.2.6.1. Effect on inclusions..…………………………………………..60
4.2.6.2. Effect on chemistry……………………………………..……..60
4.3. CHARPY IMPACT TESTING..……………...………………………………62
4.3.1. Procedure……………………………………………………………….62
4.3.2. Results and Discussion………………………………………………....62
4.3.3. Fractography…………………………………………………………....66
5. CONCLUSIONS…………………………………………………………………...68
6. FUTURE WORK ......................................................................................................70
APPENDICES
A. STANDARD RULES USED FOR CLASSIFYING INCLUSIONS WITH ASPEX ………………………………………………………..…………………...71
B. VISUAL BASIC CODE FOR CALCULATING INCLUSION SPACING…........74
BIBLIOGRAPHY………………………………………………………………………..77
VITA……………………………………………………………………………………..80

vii
LIST OF ILLUSTRATIONS
Figure Page
1.1. Deoxidation results of the common deoxidizers ……………………………………..2 1.2. Morphology of alumina inclusions generated during deoxidation of low carbon Al-
killed steels ................................................................................................................. 3 1.3. Graphical representation of formation of inclusions in as-cast steel deoxidized with
aluminum, with more than 0.01 % Al retained in the steel. …………………………4 1.4. Nucleation of voids on inclusions ............................................................................... 5 1.5. Schematic illustration of formation of calcium aluminates and suppression of
formation of MnS inclusions with Ca-treatment of steel. ........................................... 7 1.6. CaO- Al2O3 binary phase diagram .............................................................................. 8 1.7. Oxygen sensor readings before and after CaSi injection into Al-killed steel at 1600
+/- 15 oC . .................................................................................................................... 9 1.8. Saturation lines for calcium aluminates and CaS and liquid windows at different S
levels at 1550oC......................................................................................................... 11 1.9. Effect of external pressure on the boiling point of liquid Ca .................................... 11 1.10. The variation of the boiling point of calcium with the depth of the wire in liquid steel. ......................................................................................................................... 12 1.11. Schematic diagram of Ca wire injection into a ladle .............................................. 13 2.1. The measurement grid of the Aspex beam with both the big dots showing the
coarse step size and the small dots showing the fine step size ................................. 15 2.2. This figure shows a representative image of a feature with 8 chords drawn through
the centroid to the edges of the feature ..................................................................... 16 2.3. Ternary mapping of Mn-Ca-S in sulfide inclusions .................................................. 17 2.4. Comparison of a) inclusion volume, b) dissolved and total oxygen, c) average
inclusion size, and d) average inclusion aspect ratio measured in samples collected at various stages of the casting process (Plant A)... .................................................. 20
2.5. Comparison of a) inclusion volume, b) dissolved and total oxygen, c) average
inclusion size, and d) average inclusion aspect ratio measured in samples collected at various stages of the casting process (Plant B)…………………………………...22
2.6. a) Sulfides Mn-Ca-S and b) oxides (Mn+Si)-Ca-Al mapping for the casting
process, before and after addition of Ca in the ladle (Plant B).................................. 25 2.7. Comparison of a) inclusion volume, b) dissolved and total oxygen, c) average
inclusion size, and d) average inclusion aspect ratio measured in samples collected at various stages of the casting process (Plant C-acid).............................................. 26

viii
2.8. Comparison of a) inclusion volume, b) dissolved and total oxygen, c) average
inclusion size, and d) average inclusion aspect ratio measured in samples collected at various stages of the casting process (Plant C-basic). ........................................... 28 2.9. a) Sulfides Mn-Ca-S and b) oxides (Mn+Si)-Ca-Al mapping for casting process,
before and after addition of Ca in the ladle (Plant C, Acid process)......................... 30 2.10. Binary MnS-CaS phase diagram ............................................................................. 30 2.11. SEM and EDS image of a MnS-CaS inclusion, from the final casting sample collected from the acid process of plant C, obtained through Aspex PICA-1020... 31 2.12. a) Sulfides Mn-Ca-S and b) oxides (Mn+Si)-Ca-Al mapping for casting process, before and after addition of Ca in ladle (Plant C, basic). ........................................ 32 2.13. SEM and EDS images of non-spherical a) MnS and b) alumina inclusions from the sample collected before Ca-treatment in the ladle in the acid practice, obtained through Aspex PICA-1020....................................................................... 32 2.14. SEM and EDS images of spherical a) CaS and b) calcium aluminate inclusions from the sample collected after Ca-treatment in the ladle in the acid practice, obtained through Aspex PICA-1020........................................................................ 33 2.15. Comparison of a) inclusion volume, b) dissolved and total oxygen, c) average inclusion size, and d) average inclusion aspect ratio measured in samples collected at various stages of the casting process (MS&T foundry). ..................... 34 2.16. Comparison of inclusion a) volume, b) size and c) aspect ratio measured in samples collected at various stages of the casting process, for plant A with no calcium-treatment and plant B with CaSi added during tap. ................................... 36 2.17. Comparison of inclusion a) volume, b) size and c) aspect ratio measured in samples collected at various stages of the casting process, for plant C acid and basic practice............................................................................................................ 37 2.18. Comparison of a) inclusion volume, b) average inclusion spacing in the samples from cast products collected from the different plants. ........................................... 39 3.1. Ladle design used for modeling the flow of the liquid steel...................................... 41 3.2. Effects of gravity and natural convection on inclusion escape from the liquid steel. 42 3.3. Flow of spherical particles of size 50 µm in a 9100 kg ladle with Ar-stirring at the bottom of the ladle through a porous plug.....………….……………………………43 3.4. Calculated rate of inclusion flotation in the ladle with natural convection, with the
red arrows showing the typical molten steel hold-time for the different ladles ……44 3.5. Effect of the size of spherical particles on the particle escape-rate in the presence
of natural convection. ................................................................................................ 45 3.6. Effect of the particle shape, density and state on the inclusion escape-rate from the
molten steel in the ladle, and the formation of coalesced liquid droplets, in the presence of natural convection.. ................................................................................ 45

ix
4.1. Picture of the wire-feeder with the feeding tubes. ..................................................... 48 4.2. Comparison of a) inclusion volume, b) dissolved and total oxygen, c) average
inclusion size, and d) average inclusion aspect ratio measured in samples collected at various stages of the casting process, standard practice, no post-treatment.......... 49
4.3. Comparison of a) inclusion area and b) oxygen content measured in samples
collected at various stages of the casting, post-treated with CaSi-wire, 0.028 wt. % Ca, 12.5 ft/min feed-rate............................................................................................ 52
4.4. Comparison of inclusion a) size and b) aspect ratio measured in samples collected
at various stages of the casting, post-treated with CaSi-wire, 0.028 wt. % Ca, 12.5 ft/min feed-rate... ....................................................................................................... 53
4.5. Change in the amount of inclusions with varying wt. % of Ca-addition. .................. 53 4.6. Change in the amount of total oxygen with varying wt. % of Ca-addition.. ............. 54 4.7. Change in the amount of a) oxide inclusions and b) sulfide inclusions with
varying wt. % of Ca-addition. ................................................................................... 55 4.8. Weighted average aspect ratio of the inclusions in the sample collected from a)
ladle after Ca-treatment and b) casting with varying wt. % of Ca-addition in the different heats……………………………………………….………… ……...……56
4.9. Comparison of a) inclusion volume, b) dissolved and total oxygen, c) average
inclusion size, and d) average inclusion aspect ratio measured in samples collected at various stages of the casting process, with only Ar-stirring in the ladle ............... 57
4.10. Comparison of inclusion area measured in samples collected at various stages of the casting process with CaSi-addition, 0.043 wt. % Ca and Ar-stirring in the ladle……………………………………………………………………………….. 59 4.11. Comparison of dissolved and total oxygen at various stages of the casting process with CaSi-addition, 0.043 wt. % Ca and Ar-stirring in the ladle............................. 59 4.12. Comparison of a) inclusion volume and b) average inclusion spacing in the samples taken from the cast keel blocks from all the heats.. ................................... 61 4.13. Charpy impact energy absorbed for all the different ladle treatments..................... 63 4.14. Correlation between the toughness and the inclusions content, as measured for all the cast samples........................................................................................................ 64 4.15. Correlation between the toughness and the inclusions content for a) oxides and b) sulfides, as measured for all the cast samples.......................................................... 64 4.16. Change in the charpy impact energy absorbed with change in the a) average aspect ratio of inclusion and b) (average inclusion spacing) 1/2, as measured for all the cast samples.................................................................................................. …..66 4.17. Image of a brittle fracture at 500 X obtained through Aspex, showing the presence of alumina and MnSiO3 inclusions. .......................................................... 67

x
4.18. Image of a brittle fracture at 750 X obtained through Aspex, showing the presence of TiO2 inclusions. .................................................................................... 67

xi
LIST OF TABLES
Table Page
2.1. Melting and deoxidation practices at the four foundries. .......................................... 18 2.2. Chemistry of all the heats tested as provided by the plants. ...................................... 19 3.1. Dimensions of the theoretical ladles used for the different ladle sizes...................... 40 4.1. Post-tap treatment of each ladle in all of the heats. ................................................... 47 4.2. Chemistry of some of the heats before and after the respective post-tap treatment. . 62

1. LITERATURE SURVEY
An increase in demand for higher quality steel is forcing steelmakers to ensure
that their steel products meet more stringent ‘‘cleanliness’’ requirements. Nonmetallic
inclusions are a significant problem in cast steels because they may lead to problems in
castings that require expensive casting repairs or result in failures while in use. The
mechanical properties for steel are affected by the volume fraction, size, distribution,
composition, and morphology of inclusions. The toughness of steel is very important in
many critical applications where fracture resulting in failure could produce catastrophic
effects. Hence, the exact determination of non-metallic inclusions is essential to the
success of research aimed at increasing toughness of steel parts.
1.1. SOURCE OF INCLUSIONS IN STEEL CASTINGS
Most of the inclusions in steel are the product of the deoxidation process. The aim
of deoxidation or “killing” is to reduce the dissolved oxygen content of the steel. As the
steel solidifies, oxygen dissolved in the liquid cannot be accommodated by the solid
crystal structure and therefore reacts with dissolved carbon forming CO gas which is
trapped in the casting as porosity or pinholes. The addition of deoxidizers to molten steel
reduces the dissolved oxygen in the system through the formation of liquid or solid oxide
phases. When the steel starts to cool, there is a corresponding decrease in oxygen
solubility and inclusions precipitate to satisfy the new and constantly changing
equilibrium conditions. The inclusions which precipitate early in the cooling process have
a greater opportunity to escape through flotation. However, as the metal solidifies and
dendrites continue to grow larger, the inclusions precipitated late during solidification
become entrapped, and appear as small non-metallic phases in the finished product [1].
Elements used for deoxidation are those that have a greater affinity for oxygen
than carbon and form thermodynamically more stable oxides than iron oxide. These
elements include aluminum, silicon, manganese, calcium, zirconium, titanium,
magnesium, boron and rare earth metals (REM). Figure 1.1 summarizes the deoxidation
effects of several common deoxidizers.

2
Figure 1.1. Deoxidation results of the common deoxidizers [2]
The most common deoxidizer for steel castings is aluminum, which produces
solid particles of Al2O3. The coalescence of these particles forms agglomerates of
irregular shape called ‘alumina clusters’. The clusters significantly affect the mechanical
and fatigue properties of steel, and may also result in the generation of surface defects
[3]. Alumina inclusions are dendritic when formed in a high oxygen environment and
often form clusters as a of the collision of smaller particles, as shown in Figure 1.2(a,b)
[4].
Exogenous inclusions arise from unintended chemical and mechanical interaction
of liquid steel with its surroundings. They generally have the most deleterious effect on
mechanical properties because of their large size and location near the surface [5]. The
majority of these inclusions are formed by reoxidation in which liquid steel, having "free"
deoxidants (Al, Mn or Ca) dissolved in the molten steel, picks up oxygen from contact
with the air during pouring and transportation through the gating system. In addition,
inclusions can be formed by reaction of the liquid steel with water vaporizing from the
molding sands and debris in the gating system. The exogenous inclusions in steel are
sporadic because they are usually entrapped accidentally during tapping, pouring and

3
solidification. These inclusions act as heterogeneous nucleation sites for precipitation of
new inclusions during their motion in molten steel [6].
a) b)
Figure 1.2. Morphology of alumina inclusions generated during deoxidation of low carbon Al-killed steels a) dendritic alumina and b) alumina cluster [4]
Figure 1.3 explains the formation of inclusions by both the deoxidation and
reoxidation mechanisms, in a fully killed molten steel deoxidized with silicon and
manganese, containing more than 0.01 wt. % of aluminum. The deoxidation mechanism
is explained on the left side of the figure. The top bar represents the amount of oxygen
remaining in solution in the liquid steel after deoxidation, while the remaining bars
indicate the large amount of aluminum, along with the silicon and manganese present. As
the steel starts to cool, aluminum, being a stronger deoxidizer than silicon and
manganese, combines with oxygen to form alumina inclusions. The availability of
oxygen is limited in this reaction mechanism and once the oxygen is reduced to very low
levels, the reaction ceases. When more than 0.01 % Al is at equilibrium with the steel, the
amount of oxygen is reduced to very low levels by reacting with the aluminum to form
alumina during cooling and solidification, resulting in no Mn or Si present in the
indigenous inclusions. However, as shown in the reoxidation mechanism in the figure,
the large oxygen supply first reacts with aluminum in the steel through the formation of

4
alumina. If sufficient aluminum is present to deoxidize the steel and/or exposure time is
insufficient, then only alumina will form as the reoxidation product. But if Al is less than
0.01 wt. %, and/or the exposure is quite severe, then the aluminum deoxidation will be
followed by Si and Mn. In such a case, the formation of deoxidation products appears to
take place in stages. First alumina inclusions are formed, followed by formation of
complex alumina-manganese-silicates. If the reaction is too severe, iron oxide formation
can also take place [1].
Figure 1.3. Graphical representation of formation of inclusions in as-cast steel deoxidized with aluminum, with more than 0.01 % Al retained in the steel [1]
1.2. EFFECTS OF INCLUSIONS ON MECHANICAL PROPERTIES
The ultimate purpose of this work is to obtain steel casting with improved
mechanical properties through improved micro-cleanliness. Though the presence of
inclusions can never be entirely avoided, the quantity, size, shape, distribution and
composition can be modified to achieve better mechanical properties.
In cast steel, non-metallic inclusions are one of the primary sites at which void
nucleation occurs. Voids are nucleated at one of these second-phase particles, either by
decohesion of the particle-matrix interface or by particle fracture. The voids nucleated at
the particle sites grow until they coalesce by impingement or by the process of void sheet

5
coalescence [7]. Void sheet coalescence requires fracture of the ligament between the
voids created at the larger non-metallic inclusions. Figure 1.4 shows the fracture of steel
due to the growth and coalescence of voids nucleated at some of the inclusions.
Figure 1.4. Nucleation of voids on inclusions in (a) and b), and (c) fracture of steel [7]
The ability of a material to arrest an existing crack and prevent the onset of rapid
crack propagation at stress levels below the yield stress is called fracture toughness [8].
The characteristic inclusion volume fraction and the inclusion spacing have been shown
to greatly influence the fracture toughness of steel. Recent research has shown that
decreasing the volume fraction of inclusions that induce void nucleation and increasing
the inclusion spacing result in significant improvement in toughness [9]. Hahn et al [10]
found that fracture toughness of steel (K1C) inversely varied with the volume fraction of
the inclusions according to the equation:

6
EdVK yieldfI σπ 31
61
62 ⎟
⎠⎞
⎜⎝⎛=
− (1)
where, K1 = fracture toughness, Vf = volume fraction of the inclusions, σyield = yield
strength, E= Young’s modulus, and d= particle diameter. The fracture toughness varies
directly with the inclusion spacing according to the equation:
21
1 )2( EsK yieldσ= (2)
where, K1 = fracture toughness, σyield = yield strength, E= Young’s modulus, and s=
average spacing between the inclusions
Apart from the toughness, inclusions have been reported to be detrimental to other
physical properties of steels too. The machinability of steel is impaired by oxide
inclusions which never deform plastically at any temperature less than or equal the
highest possible temperature in the flow zone of the steel; that is those which have an
index of deformability near zero at all such temperatures. Important inclusions in this
category are corundum, escolaite, spinels and calcium-aluminates [11]. Large exogenous
inclusions also cause inferior surface appearance, poor polishability, reduced resistance to
corrosion, and, in severe cases, slag lines and laminations [12]. Inclusions adversely
affect the weldability of cast steel, causing laminations in the unmelted heat-affected
zone, burning and hot-tearing from sulfides, and crack formation from oxides [13].
1.3. CALCIUM TREATMENT
1.3.1. Effects of Ca-treatment on Inclusions. Al2O3 inclusions form clusters,
which significantly harm the mechanical and fatigue properties of steel. One technique
used to diminish the harmful effects of Al2O3 inclusions in steel is calcium treatment.
During Ca-treatment, the alumina inclusions are converted to molten calcium aluminates
which are globular in shape. The calcium aluminate inclusions retained in the steel
suppress the formation of harmful MnS stringers during solidification of steel .Ca-

7
treatment also helps in modifying MnS inclusions to spherical CaS inclusions. This
change in inclusion composition and shape due to Ca-treatment is known as inclusion
morphology control. This is demonstrated schematically in Figure 1.5.
Figure 1.5. Schematic illustration of formation of calcium aluminates and suppression of formation of MnS inclusions with Ca-treatment of steel [14]
When alumina is modified to calcium aluminate, the reaction sequence followed
is: Al2O3 -> CA6 -> CA2 -> CA -> C12A7 , where C and A denotes CaO and Al2O3,
respectively [15]. The CaO- Al2O3 phase diagram in Figure 1.6 shows the presence of
liquid calcium aluminates, CA2, CA, C12A7 at steelmaking temperatures (~ 1600 oC)
which means that unlike solid alumina inclusions, these liquid inclusions are easier to
float to the surface. Also, they do not stick to and block ladle and tundish nozzles and
solidification fronts during pouring and casting, which is a major issue in continuous
casting of steel [16].

8
Figure 1.6. CaO- Al2O3 binary phase diagram [14]
As reactions progress to form calcium aluminates richer in calcium, the activity of
the Al2O3 decreases, allowing more of the Al to react with oxygen, providing even better
deoxidation. Plant data in Figure 1.7 shows that, the deoxidation of steel with aluminum
is shifted to lower levels of residual dissolved oxygen upon subsequent calcium treatment
because of the lower alumina activity in the modified inclusions [17].
In steels not treated with calcium, the sulfur precipitates as finely dispersed MnS
particles in the interdendritic liquid that freezes last. The MnS delineate the prior
austenitic grain boundaries in the as-cast structure. During hot rolling, the MnS particles
are deformed, resulting in stringers in the rolled product. These stringers make the final
product brittle and susceptible to cracking [11].

9
Figure 1.7. Oxygen sensor readings before and after CaSi injection into Al-killed steel at 1600 +/- 15 oC [17]
In calcium-treated low sulfur steels, the grain boundary precipitation of MnS
during solidification is suppressed as a result of the precipitation of sulfur as a Ca(Mn)S
complex on the calcium aluminate inclusions by the following reaction[18]:
(CaO) + 2/3[Al] + 2[S] + [Mn] = (CaS.MnS) + 1/3 (Al2O3) (3)
The extent of sulfide shape control that can be achieved during solidification of
calcium-treated steel depends on the total oxygen, sulfur and calcium contents of the
steel. In steels with relatively high sulfur contents, e.g. > 100 ppm, sulfide shape control
by means of calcium treatment is not feasible. To minimize the occurrence of sulfide
stringers in such steels, the addition of Te or Se has been found to be beneficial [19].
1.3.2. Thermodynamics of Calcium Addition. When calcium is added, the
following series of reactions are expected to occur to a varying extent in Al-killed steels
containing alumina inclusions.

10
Ca (l) = Ca (g) (4)
Ca (g) = [Ca] (5)
[Ca] + [O] = CaO (6)
[Ca] + [S] = CaS (7)
[Ca] + (x+1/3)[ Al2O3] = CaO.x Al2O3 + 2/3 [Al] (8)
CaO + 2/3[Al] + [S] = (CaS) + 1/3 (Al2O3) (9)
If the sulfur content of the steel is above a certain limit, calcium aluminate
formation will be suppressed by CaS formation. The basic problem encountered in
thermodynamic modeling of Ca-modification of inclusions is that there are too many
variables to be considered in a two-dimensional description. A simple model was
proposed by assuming most of the variables constant with only two variables and one
parameter allowed to vary. Holappa et. al proposed a model for Ca-additions based on
this same technique. They performed calculations for a steel grade with the chemistry:
0.35% C, 0.25% Si, and 0.50% Mn. Oxygen content was assumed to be constant at 20
ppm and the temperature at 1550 oC and sulfur was the variable parameter [20, 21].
Figure 1.8 illustrates the limits of the liquid area by calculating the saturation lines of
solid calcium aluminates (CaO.Al2O3, CaO.2Al2O3) and CaS, respectively. The figure
clearly shows how the growth of sulfur content increases the stability of CaS and thus
contracts the liquid area.
In practical steelmaking, the scatter in the oxygen content before the calcium
treatment and the unpredictable yield of calcium in solution to react with Al2O3 makes
the calculation of optimum amount of Ca-addition difficult. So for the trials conducted in
this study, the amounts of Ca-addition were varied over a wide range, in order to
experimentally determine the values of calcium addition resulting in better inclusion
modification and reduction.
1.3.3 Method of Ca-addition. The boiling point of calcium is 1491oC (2716oF) at
atmospheric pressure, so it is in vapor state at steelmaking temperatures. Thus, when
adding calcium to liquid steel, special measures must be taken to ensure its proper
recovery in the steel bath. The injection of calcium below the surface of the steel through
wire injection is a more effective method of Ca- addition than bulk addition, as it

11
suppresses Ca boiling because of the higher ferrostatic pressure. When Ca is injected at a
depth, it is under a large external pressure, which increases its boiling point. Figure 1.9
shows the effect of external pressure on the boiling point of liquid calcium.
Figure 1.8. Saturation lines for calcium aluminates and CaS and liquid windows at different S levels at 1550oC [21]
0
500
1000
1500
2000
2500
3000
0 10 20 30 40 50 60 70
External Pressure (atm)
Boili
ng P
oint
(°C)
Figure 1.9. Effect of external pressure on the boiling point of liquid Ca [22]

12
The vapor pressure of liquid Ca is related to temperature by the following
equation:
TP 819067.9log −= [22] (10)
where, P is external pressure and T is temperature.
At the boiling point of a liquid, the vapor pressure is equal to the external
pressure, so if the external pressure is known, the boiling point of the liquid can be
calculated. Also, at different depths in liquid steel the external pressure is equal to the
pressure head given by:
ghP ρ= (11)
where, ρ= density of steel, g = gravity, and h= depth in liquid
Assuming the ρ for steel as 7230 kg/m3 [23], the variation of the boiling point of
calcium with the depth of the wire in liquid steel is shown in Figure 1.10. This illustrates
that a deeper injection in the ladle suppresses the boiling of calcium more, hence, giving
a better reaction with the liquid steel.
0
500
1000
1500
2000
2500
3000
0 10 20 30 40 50 60 70 80 90 100
Depth in liquid steel(m)
Boi
ling
Poi
nt (°
C)
Figure 1.10. The variation of the boiling point of calcium with the depth of the wire in liquid steel

13
Also, Ca-wire injection provides for a better Ca-reaction with the liquid metal
because of the formation of a steel shell around the wire allowing it to be injected deep
into the bath before the Ca begins to vaporize. In addition, due to the fast rate of
injection, the wire is deep in the molten steel before vaporization occurs [19]. Figure 1.11
shows a schematic diagram of Ca wire injection into a ladle.
Figure 1.11. Schematic diagram of Ca wire injection into a ladle [19]
1.4. OUTLINE OF THE PROJECT
The literature review indicates that the presence of inclusions in steel castings is
harmful for the mechanical properties of steel. These inclusions can be reduced or
modified to produce “clean” steel by using optimal deoxidation and pouring practices.
There has not been sufficient research in this area, with respect to small steel foundries,
of capacity 1 to 20 tons.
The amount, size, distribution, shape, and composition of inclusions are important
to evaluate steel cleanliness. In the past, several researchers have been measuring
inclusions in microscopic steel specimens with the help of scanning electron microscopy
(SEM) analysis combined with energy dispersive spectroscopy (EDS). However, manual

14
SEM approaches are limited by the labor intensive nature of the analysis because the
SEM operator must analyze by manually imaging the individual inclusions.
In order to increase the speed and efficiency of inclusion evaluation, this research
uses an automated inclusion analyzer, ASPEX PICA-1020. This equipment provides a
rapid and accurate method for determining the composition, size, number, spacing and
distribution of inclusions present in the steel samples. It is an integrated SEM and EDS
system and allows for automated characterization of all the inclusions (1 μm to 5 mm) in
a microscopic specimen; including the volume fraction, size and shape, inclusion spacing
and complete inclusion identification.
The main objective of this research is to suggest the optimum deoxidation and
ladle-practices in steel foundries which minimizes harmful inclusions in the steel casting.
This is done by evaluating the various steel foundry practices in terms of inclusions,
oxygen content and toughness of the cast product.

15
2. BENCHMARKING CASTING PRACTICES
2.1. BACKGROUND OF ASPEX ANALYSIS
In the Aspex system, a focused electron beam searches for features in a user
specified region. The region can be defined by a circle, a polygon or a list of stage points.
The selected region is then subdivided into smaller fields. For example, a 4x4 mm square
sample field can be broken down into 16 fields of 1x1mm square that are defined
electronically as illustrated in Figure 2.1. This figure shows the difference between the
search grid and the measurement grid. The red regions represent features, the larger black
dots represent search points and the small dots represent measurement points. The larger
spacing between search grid steps misses the upper-left feature but finds both the central
and lower-right feature. Once a feature has been found, the steps size is reduced to more
precisely measure the feature dimensions. The large search steps lead to fast searches
while the small measurement steps lead to precise measurements. This is a fast process
because the instrument only spends time collecting detailed sizing data where inclusions
are known to be present, rather than spending time capturing and analyzing vast numbers
of essentially empty pixels.
Figure 2.1. The measurement grid of the Aspex beam with both the big dots showing the coarse step size and the small dots showing the fine step size [24]

16
As the electron beam moves across each field, the brightness or intensity of the
back scattered electron detector (BSED) signal is recorded and transferred to the
computer memory as representing the brightness of a single pixel. If the signal is bright
enough to indicate that an inclusion is present at the position, the software initiates a
particle-sizing sequence using a rotating chord algorithm. Figure 2.2 shows an example
of the rotating chord algorithm. The rotating chord algorithm finds the center of the
feature and draws 16 chords through the center at approximately 11-degree intervals. A
number of metric parameters are computed from the lengths of the chords including
average, maximum and minimum diameters, orientation and centroid.
Figure 2.2. This figure shows a representative image of a feature with 8 chords drawn through the centroid to the edges of the feature [24]
After inclusions have been fully characterized for size and shape, an EDS
spectrum is acquired to determine the elemental composition of each inclusion. After the
sample had been completely analyzed and the data stored, the data was evaluated offline
by the Automated Feature Analysis software.
In order to extract meaningful interpretations from the numerous compositional
and morphological parameters, the data obtained is sorted into classes. The inclusions are
classified into various classes based on their composition as determined by user-defined
17
rules. Rules provide a mechanism to define membership classes based on chemical or
morphological properties. For example, an inclusion lying in the range of 1μm - 50μm
with Mn >= 30% and S >=20% is classified as a MnS inclusion. The standard rules
defined and used for this study are given in Appendix A.
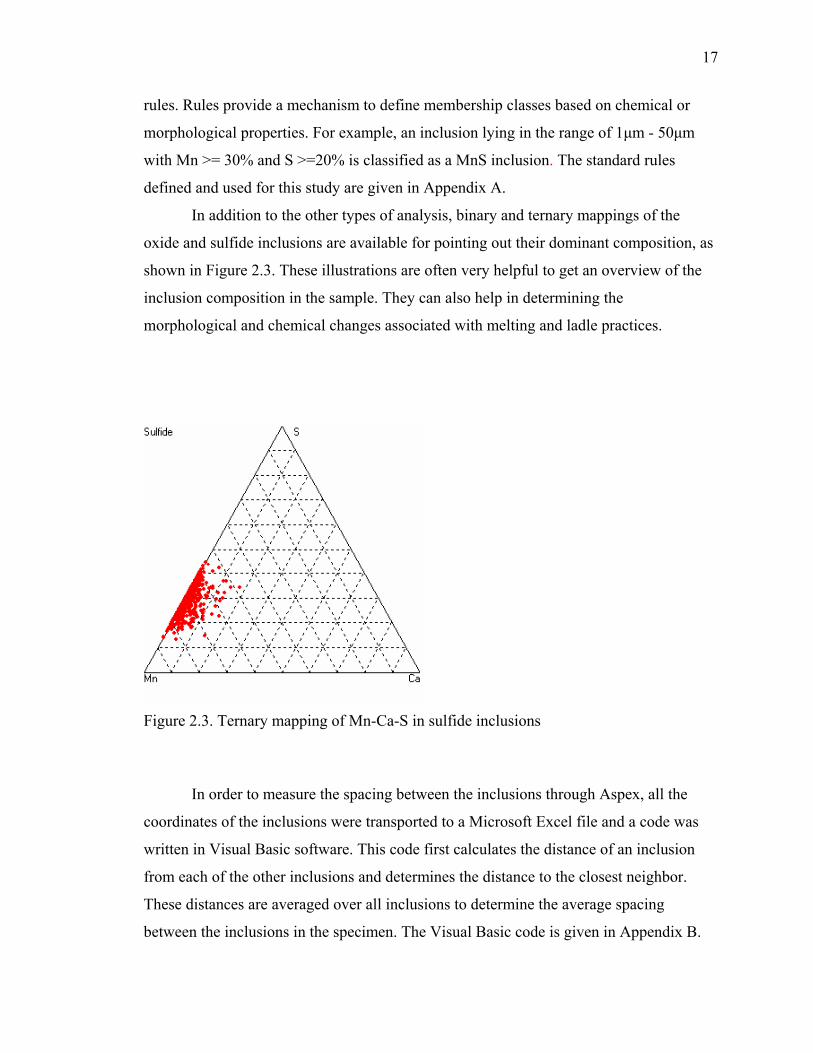
In addition to the other types of analysis, binary and ternary mappings of the
oxide and sulfide inclusions are available for pointing out their dominant composition, as
shown in Figure 2.3. These illustrations are often very helpful to get an overview of the
inclusion composition in the sample. They can also help in determining the
morphological and chemical changes associated with melting and ladle practices.
Figure 2.3. Ternary mapping of Mn-Ca-S in sulfide inclusions
In order to measure the spacing between the inclusions through Aspex, all the
coordinates of the inclusions were transported to a Microsoft Excel file and a code was
written in Visual Basic software. This code first calculates the distance of an inclusion
from each of the other inclusions and determines the distance to the closest neighbor.
These distances are averaged over all inclusions to determine the average spacing
between the inclusions in the specimen. The Visual Basic code is given in Appendix B.

18
2.2. EXPERIMENTAL PROCEDURE
Plant trials were conducted at four foundries with different deoxidation practices
in the furnace and ladle as summarized in Table 2.1. Three foundries were induction
furnace based (IF) and one foundry had acid and basic electric arc furnaces (EAF). Table
2.2 gives the chemistry of all the heats tested for the different plants, as provided by the
plants.
Table 2.1. Melting and deoxidation practices at the four foundries
Charge
Weight (lbs.)
Furnace additions (in
wt. %) Ladle additions (in wt. %)
Plant A (IF) 1000 -
Added at tap:
Al (0.1%)
FeTi (0.035% Ti)
FeSiZr (0.04% Si, 0.03%
Zr)
Plant B (IF) 1400 Al (0.08%) Added at tap:
CaSi(0.08% Ca, 0.3% Si)
Plant C (Acid
EAF) 40,000
FeMn+FeSi
Block additions
Added at tap:
Al (0.07%)
Wire fed in ladle
CaSi (0.06% Ca, 0.10% Si)
Plant C (Basic
EAF) 40,000
FeMn+FeSi
Block additions
Added at tap:
Al (0.068%)
Wire fed in ladle
CaSi (0.04% Ca, 0.08% Si)
MS&T Foundry
(IF) 100 Al (0.10%)
Added at tap:
CaSi(0.09% Ca, 0.17% Si)
During the plant trials, the dissolved oxygen content was measured directly in the
liquid steel, using Celox oxygen probes and the Celox Lab Datacast-2000. Steel samples

19
were collected from the furnace and the ladle using vacuum chemistry samplers, before
and after the addition of deoxidants. In addition, samples were cut from cast keel blocks
produced from the same heat. Microscopic specimens were prepared from these samples
and a 10 mm2 area was analyzed in each specimen for inclusions using the Aspex PICA-
1020 for automated inclusion analysis. Each sample was analysed on the Aspex five
times, in order to check the accuracy of the inclusion measurements within a single
sample. The total oxygen content was measured from each sample using Leco TC-500.
Table 2.2. Chemistry of all the heats tested as provided by the plants C Mn P S Si Cu Ni Cr Mo V Al
Plant A
(IF) 0.30 0.71 0.01 0.037 0.45 0.06 0.05 0.175 0.04 0.007 0.07
Plant B
(IF) 0.28 0.80 0.03 0.04 0.50 0.05 0.04 0.15 0.03 0.01 -
Plant C
(Acid
EAF)
0.30 0.98 0.01 0.015 0.56 0.15 0.16 0.28 0.03 0.015 0.02
Plant C
(Basic
EAF)
0.30 1.10 0.01 0.009 0.45 0.15 0.21 0.20 0.05 0.015 0.01
MS&T
Foundry
(IF)
0.41 0.70 0.01 0.037 0.48 0.15 1.6 0.82 0.23 - -
2.3. RESULTS AND DISCUSSION
2.3.1. Plant A. In the trial at Plant A, a heat of medium-carbon steel (WBC) was
produced in an induction furnace (IF) and tapped into a 1000 lb capacity ladle. The
practice included deoxidation in the IF with 1 lb Al, followed by a complex treatment of

20
1 lb of Al, 0.66 lbs of Fe70Ti alloy and 0.88 lbs of Fe51Si35Zr alloy in the ladle during
tap. Ti and Zr are both stable nitride-formers and added to minimize AlN embrittlement
[25]. Figure 2.4 (a and b) compare the area fraction covered by inclusions and the total
and dissolved oxygen, at the various stages of liquid processing. The average size and
aspect ratio of the inclusions at all the stages, as measured by Aspex, are given in Figure
2.4 (c and d).
0
0.0002
0.0004
0.0006
0.0008
0.001
0.0012
0.0014
0.0016
0.0018
Furnace, beforedeoxidants
Ladle after deoxidants
Ladle, end of pour
Final Casting
Fra
ctio
n of
incl
usio
ns
OthersMnOTiO2Al2O3MnSiO3MnS
Sulfides
Oxides
SulfidesSulfidesSulfides
Oxides
OxidesOxides
a)
0
20
40
60
80
100
120
140
160
180
200
Furnace, beforedeoxidants
Ladle, afterdeoxidants
Ladle, end of pour
Final Casting
Am
ount
of O
xyge
n (p
pm)
Dissolved O
Total O
b)
Figure 2.4. Comparison of a) inclusion volume, b) dissolved and total oxygen, c) average inclusion size, and d) average inclusion aspect ratio measured in samples collected at various stages of the casting process (Plant A)

21
0
1
2
3
4
5
6
7
8
Furnace, beforedeoxidants
Ladle after deoxidants
Ladle, end of pour
Final Casting
Siz
e of
incl
usio
ns (μ
m)
MnSMnSiO3Al2O3TiO2MnOOthers
c)
d)
Figure 2.4. Comparison of a) inclusion volume, b) dissolved and total oxygen, c) average inclusion size, and d) average inclusion aspect ratio measured in samples collected at various stages of the casting process (Plant A) (cont.)
The area fraction represents the fraction of the area covered by inclusions in a 10
mm2 microscopic specimen. The area fraction of oxide inclusions increased during the
pour and resulted in the highest area fraction of inclusions in the final casting (Figure 2.4
a). This indicates that there is significant reoxidation during pouring and in liquid metal
transport through the gating system. Also, there is insufficient time to float out inclusions
in the ladle. The dissolved oxygen dropped after deoxidation, resulting in the formation
of a large number of oxide inclusions and an increase in the total oxygen. The total
oxygen continued increasing towards the end of the pour indicating reoxidation and a
lack of inclusion flotation (Figure 2.4 b).
0
1
2
3
4
5
6
7
Furnace, beforedeoxidants
Ladle after deoxidants
Ladle, end of pour
Final Casting
Asp
ect R
atio
MnSMnSiO3Al2O3TiO2MnOOthers

22
The area of alumina and TiO2 inclusions increased after the Al and FeTi additions
in the ladle. There was some reduction in the alumina inclusions towards the end of the
pour, but TiO2 inclusions continued to increase through casting. TiO2 inclusions are
difficult to float out due to their small size and irregular shape as compared to the
agglomerate of alumina inclusions. In the sample collected from the ladle after
deoxidation, the average diameter of the TiO2 inclusions was 1.5 μm with a 4.5 aspect
ratio, significantly smaller and less round than the alumina inclusions which had an
average size of 3 μm with an aspect ratio of 1.5 (Figure 2.4 c and d). Smaller inclusions
are difficult to float out, as shown with FLUENT modeling (Figure 3.5 in Section 3.3).
2.3.2. Plant B. In this plant trial, one induction furnace heat was followed from
melting through deoxidation and pouring of a medium-carbon steel (8625 alloy) in a
1400 lb ladle. For deoxidation, Al was added in the furnace just before tap followed by
bulk CaSi addition in the tap stream.
00.00020.00040.00060.00080.001
0.00120.00140.00160.0018
Furnace,before
deoxidants
Furnace,after Al
Ladle, after Ca
Ladle, end ofpour
Final Casting
Frac
tion
of in
clus
ions
OthersMnOCAAl2O3MnSiO3CaSMnS
oxidesoxides
oxidesoxides
oxides
sulfidessulfides sulfides sulfides
a)
Figure 2.5. Comparison of a) inclusion volume, b) dissolved and total oxygen, c) average inclusion size, and d) average inclusion aspect ratio measured in samples collected at various stages of the casting process (Plant B)

23
020406080
100120140160180200
Furnace,before
deoxidants
Furnace,after Al
Ladle,after Ca
Ladle, endof pour
Final Casting
Am
ount
of O
xyge
n (p
pm)
Dissolved OTotal O
b)
012345678
Furnace,before
deoxidants
Furnace,after Al
Ladle, after Ca
Ladle, end ofpour
Final Casting
Siz
e of
incl
usio
ns (μ
m)
MnSCaSMnSiO3Al2O3CAMnOOthers
c)
0
1
2
3
4
5
6
7
Furnace,before
deoxidants
Furnace,after Al
Ladle, after Ca
Ladle, end ofpour
Final Casting
Asp
ect R
atio
MnSCaSMnSiO3Al2O3CAMnOOthers
d)
Figure 2.5. Comparison of a) inclusion volume, b) dissolved and total oxygen, c) average inclusion size, and d) average inclusion aspect ratio measured in samples collected at various stages of the casting process (Plant B) (cont.)
24
After Al treatment in the furnace, there was an increase in the alumina inclusions
and the total oxygen (Figure 2.5 a and b). The composition and number of inclusions
changed after the Ca treatment in the ladle with most of the alumina inclusions forming
calcium aluminates (CA). This modification is good because calcium aluminate
inclusions have lower aspect ratio than alumina inclusions and, hence, are less harmful to
mechanical properties of steel (Figure 2.5 d). MnS inclusions were first observed in the
furnace and remained fairly constant, in terms of number, shape and size, through the
ladle and casting. This shows that the Ca-treatment was not able to modify the MnS
inclusions. Significant reoxidation was observed with all the oxide inclusions increasing
from the ladle through casting, specially MnSiO3 inclusions show a huge increase in size
at the end of the pour and in the final casting (Figure 2.5 c).
Figure 2.6 shows the ternary chemical mapping for a) sulfides and b) oxides
before and after Ca additions in the ladle, as obtained through Aspex. The region of
calcium aluminates (CA) is marked on the ternary oxides diagram.
In the ternary oxide mapping Ca modification of the alumina inclusions was
observed, but there was limited Ca modification of the MnS inclusions, as seen in the
ternary sulfide mapping. Adding Ca in the form of a CaSi ferroalloy during tap is
inconsistent in its metallurgical effectiveness. The CaSi ferroalloy was observed to float
on the liquid metal surface often flashing indicating vaporization of Ca followed by rapid
combustion in air. Ca is highly volatile with a boiling point of 1491oC making it difficult
to add to the steel without losing it to vaporization. Injection of calcium below the surface
of the steel through wire or powder injection would be more effective as it suppresses Ca
boiling because of the higher ferrostatic pressure [19].
2.3.3. Plant C. In this study, two electric arc furnace heats of medium-carbon
steel were followed, with ladle of capacity 20 tons. The first one utilized an acid
refractory and slag practice and the second one used a basic refractory and slag practice.
Ladle treatment included preliminary deoxidation during tap followed by treatment with
Ca wire in the ladle. During the heat, chemistry samples and dissolved oxygen readings
were collected at the following locations: 1) furnace after block, 2) ladle before calcium
wire treatment, 3) ladle after calcium wire treatment, 4) ladle at mid-ladle pouring, and 5)
cast product.

25
Calcium
TreatmentBefore After
a)
Calcium
TreatmentBefore After
b)
Figure 2.6. a) Sulfides Mn-Ca-S and b) oxides (Mn+Si)-Ca-Al mapping for the casting process, before and after addition of Ca in the ladle (Plant B)
In the acid process, the area of inclusions decreased after addition of the Ca due to
the formation of calcium aluminates (CA) and MnS inclusions were modified to CaS
inclusions (Figure 2.7a). Ca-treatment helped in decreasing the oxygen content too, even
though the oxide inclusions continued increasing towards the end of the casting process
(Figure 2.7b). Figure 2.7 d) shows the effect of Ca-treatment on the aspect ratio of the
inclusions. It is interesting to see that the Ca-modified inclusions, calcium aluminate and
CaS, have a lower aspect ratio than the alumina and MnS inclusions, showing that Ca-
treatment is beneficial in not only decreasing the inclusions but also in giving the
inclusions a globular shape. Figure 2.7 c) shows that there are some huge Al2O3, MnO,
and MnSiO3 inclusions in the earlier stages of the casting process, but these inclusions
are easily floated out towards the end of the casting due to their large size.

26
In the basic process, many of the alumina and MnS inclusions were not
successfully modified by calcium (Figure 2.8 a). This can be explained as more CaSi wire
was added to the ladle in the acid process (0.06 wt. % Ca) as compared to the basic
process (0.04 wt. % Ca). The amount of Ca in the basic process was not sufficient to
cause the modification of MnS and alumina to CaS and calcium aluminate inclusions,
respectively. As a result, there is no significant reduction in total oxygen too, as seen in
Figure 2.8 b). The average size of the inclusions (Figure 2.8 c) is less here as compared to
the acid process and overall, the acid process had more inclusions than the basic process,
which is supported by the higher levels of total oxygen. Also, the small amount of
modified calcium inclusions show a low aspect ratio (Figure 2.8 d), suggesting that an
adequate amount of Ca-addition would have helped in floatation and modification of
inclusions in the basic process too.
0
0.0002
0.0004
0.0006
0.0008
0.001
0.0012
0.0014
0.0016
0.0018
Furnace, afterblock
Ladle, before Ca
Ladle, after Ca
Ladle, mid pour
Final Casting
Frac
tion
of in
clus
ions
OthersMnOCAAl2O3MnSiO3CaSMnS
oxides
sulfides
oxides
oxidesoxides
oxides
sulfidessulfides sulfides
a)
Figure 2.7. Comparison of a) inclusion volume, b) dissolved and total oxygen, c) average inclusion size, and d) average inclusion aspect ratio measured in samples collected at various stages of the casting process (Plant C-acid)

27
020406080
100120140160180200
Furnace,after block
Ladle,beforeCa
Ladle, afterCa
Ladle, mid pour
Final Casting
Am
ount
of O
xyge
n (p
pm)
Dissolved O
Total O
b)
0
1
2
3
4
5
6
7
8
Furnace,after block
Ladle,before Ca
Ladle, after Ca
Ladle, mid pour
Final Casting
Size
of i
nclu
sion
s (μ
m)
MnSCaSMnSiO3Al2O3CAMnOOthers
c)
0
1
2
3
4
5
6
7
Furnace,after block
Ladle,before Ca
Ladle, after Ca
Ladle, mid pour
Final Casting
Aspe
ct R
atio
MnSCaSMnSiO3Al2O3CAMnOOthers
d)
Figure 2.7. Comparison of a) inclusion volume, b) dissolved and total oxygen, c) average inclusion size, and d) average inclusion aspect ratio measured in samples collected at various stages of the casting process (Plant C-acid) (cont.)

28
0
0.0002
0.0004
0.0006
0.0008
0.001
0.0012
0.0014
0.0016
0.0018
Furnace, afterblock
Ladle,before Ca
Ladle, after Ca
Ladle, mid pour
Final Casting
Frac
tion
of in
clus
ions
OthersMnOCAAl2O3MnSiO3CaSMnS
oxides
sulfides
oxidesoxides oxides oxidesoxides
a)
020406080
100120140160180200
Furnace,after block
Ladle,beforeCa
Ladle, after Ca
Ladle, mid pour
Final Casting
Am
ount
of O
xyge
n (p
pm)
Dissolved O
Total O
b)
0
1
2
3
4
5
6
7
8
Furnace,after block
Ladle,beforeCa
Ladle, after Ca
Ladle, mid pour
Final Casting
Size
of i
nclu
sion
s (μ
m)
MnSCaSMnSiO3Al2O3CAMnOOthers
c)
Figure 2.8. Comparison of a) inclusion volume, b) dissolved and total oxygen, c) average inclusion size, and d) average inclusion aspect ratio measured in samples collected at various stages of the casting process (Plant C-basic)

29
0
1
2
3
4
5
6
7
Furnace,after block
Ladle,beforeCa
Ladle, after Ca
Ladle, mid pour
Final Casting
Asp
ect R
atio
MnSCaSMnSiO3Al2O3CAMnOOthers
d)
Figure 2.8. Comparison of a) inclusion volume, b) dissolved and total oxygen, c) average inclusion size, and d) average inclusion aspect ratio measured in samples collected at various stages of the casting process (Plant C-basic) (cont.)
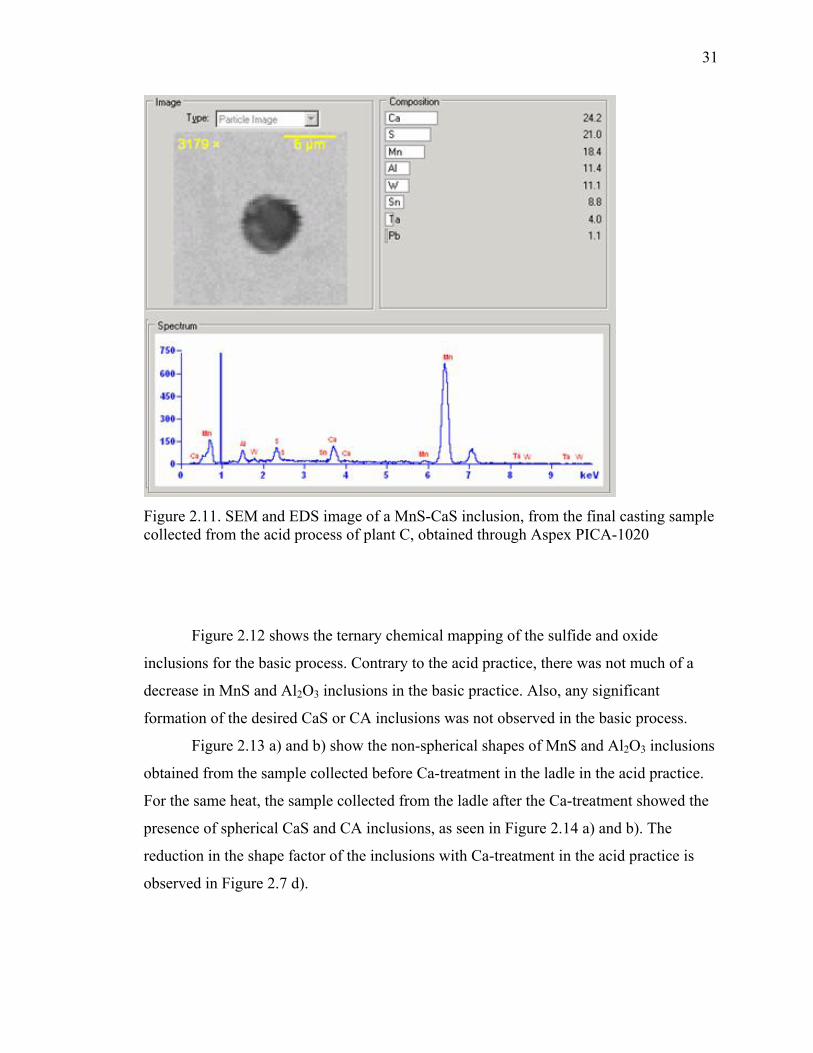
Figure 2.9 summarizes the inclusion composition for the acid process using a
ternary mapping system for sulfides and oxides. After the Ca addition, the fraction of
MnS inclusions decreased and was replaced by CaS inclusions. This is a desired
transformation due to the globular morphology of CaS, which can be observed in Figure
2.7 d). Also, a significant amount of CA formation was observed with a decrease in both
MnO and Al2O3 inclusions. Figure 2.10 presents a binary phase MnS-CaS diagram,
which shows that MnS and CaS could form a solid solution above 1150oC. Figure 2.11
verifies the presence of a MnS-CaS inclusion, which was obtained through Aspex, from
the final casting sample collected from the acid practice of this plant. This transformation
of MnS to MnS-CaS solutions and relatively pure CaS was also observed in the Mn-Ca-S
inclusion mapping (Figure 2.9 a).

30
Before After
Calcium
Treatment
a)
Calcium
TreatmentBefore After
b)
Figure 2.9. a) Sulfides Mn-Ca-S and b) oxides (Mn+Si)-Ca-Al mapping for casting process, before and after addition of Ca in the ladle (Plant C, Acid process)
Figure 2.10. Binary MnS-CaS phase diagram [26]
31
Figure 2.11. SEM and EDS image of a MnS-CaS inclusion, from the final casting sample collected from the acid process of plant C, obtained through Aspex PICA-1020
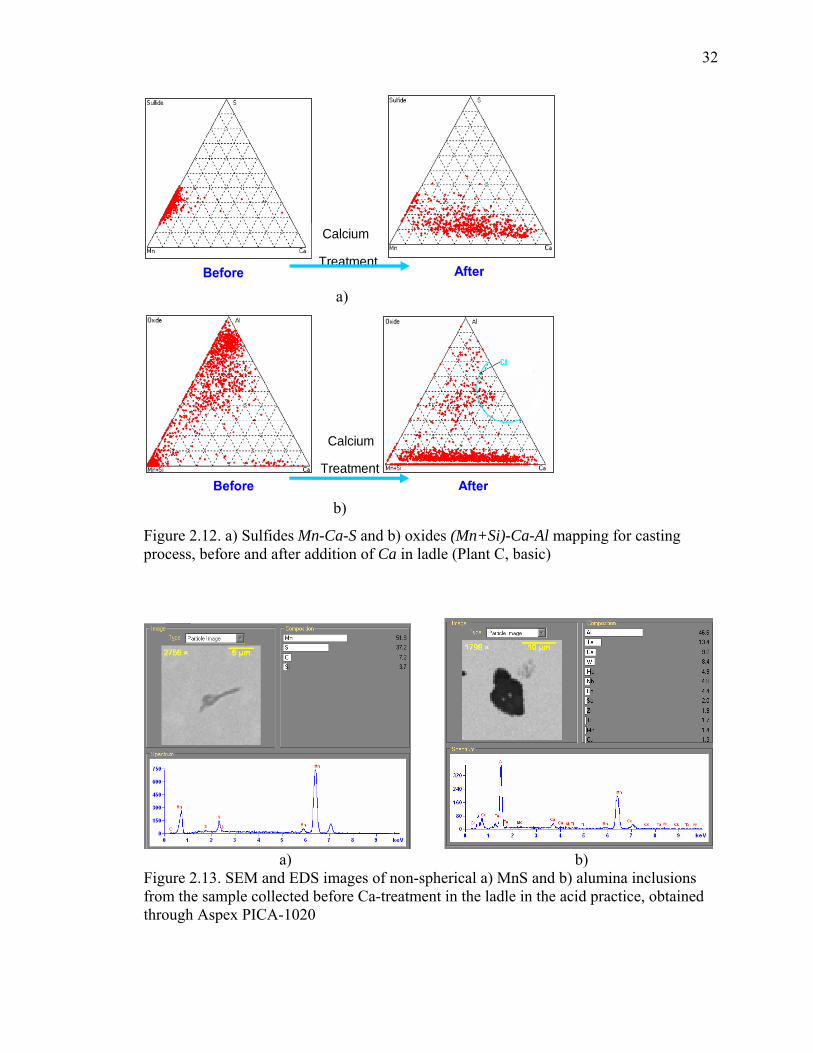
Figure 2.12 shows the ternary chemical mapping of the sulfide and oxide
inclusions for the basic process. Contrary to the acid practice, there was not much of a
decrease in MnS and Al2O3 inclusions in the basic practice. Also, any significant
formation of the desired CaS or CA inclusions was not observed in the basic process.
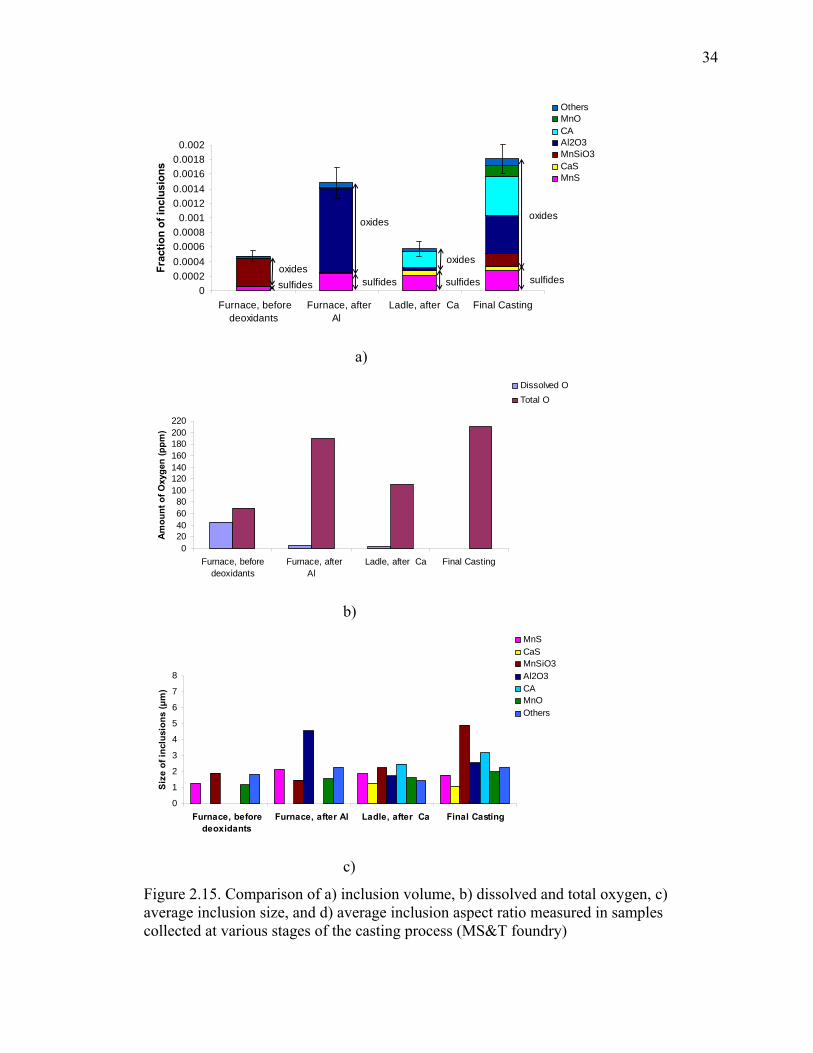
Figure 2.13 a) and b) show the non-spherical shapes of MnS and Al2O3 inclusions
obtained from the sample collected before Ca-treatment in the ladle in the acid practice.
For the same heat, the sample collected from the ladle after the Ca-treatment showed the
presence of spherical CaS and CA inclusions, as seen in Figure 2.14 a) and b). The
reduction in the shape factor of the inclusions with Ca-treatment in the acid practice is
observed in Figure 2.7 d).
32
Calcium
Treatment Before After
a)
Calcium
Treatment Before After
b)
Figure 2.12. a) Sulfides Mn-Ca-S and b) oxides (Mn+Si)-Ca-Al mapping for casting process, before and after addition of Ca in ladle (Plant C, basic)
a) b) Figure 2.13. SEM and EDS images of non-spherical a) MnS and b) alumina inclusions from the sample collected before Ca-treatment in the ladle in the acid practice, obtained through Aspex PICA-1020

33
a) b) Figure 2.14. SEM and EDS images of spherical a) CaS and b) calcium aluminate inclusions from the sample collected after Ca-treatment in the ladle in the acid practice, obtained through Aspex PICA-1020 2.3.4. Missouri S&T Foundry. A heat of medium-carbon (4340) steel was
melted in the Missouri S&T 100 lb induction furnace. Aluminum was added in the
furnace just before tap followed by a calcium silicon addition in the tap stream for
deoxidation.
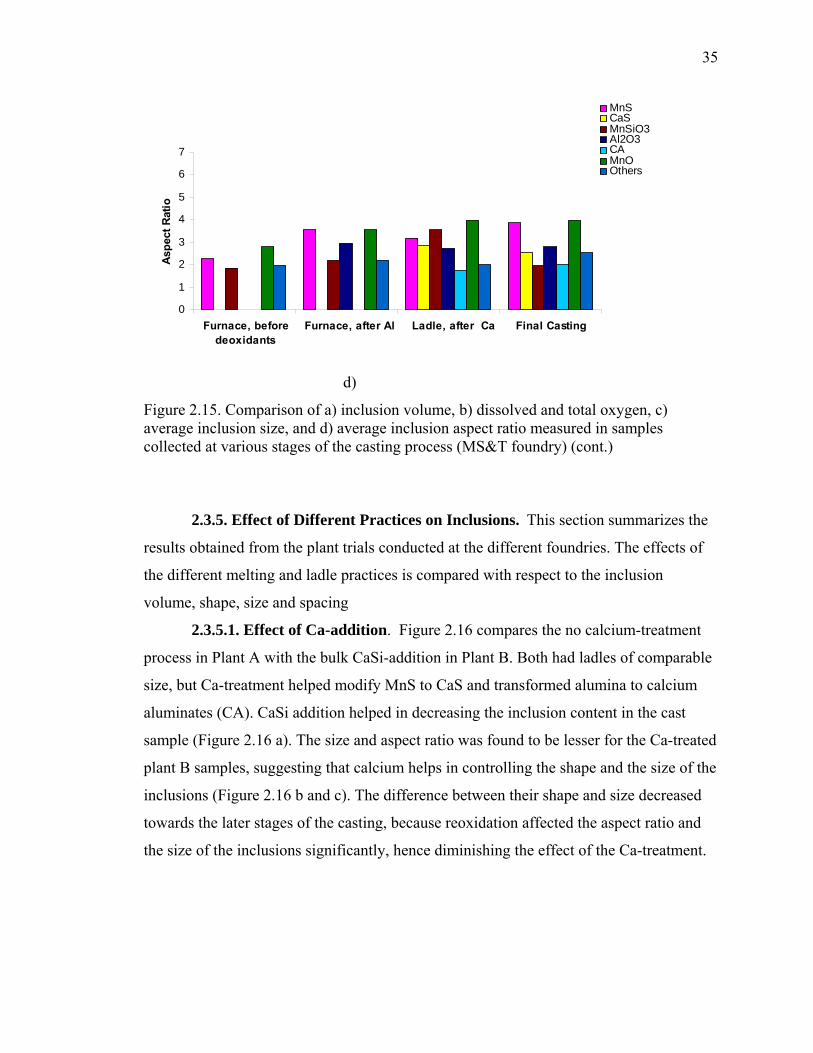
Alumina inclusions increased after the addition of Al in the furnace, with a
significant increase in the total oxygen also (Figure 2.15a and b). With Ca-treatment in
the ladle, most of the alumina inclusions form calcium aluminates (CA), but the MnS
inclusions remain almost constant and are not completely modified to CaS inclusions.
This is due to the ineffective addition of CaSi during tap in small ladle, which does not
allow the Ca to interact with the liquid steel before vaporizing. The oxide inclusions, and
the total oxygen, increased from the ladle to the casting, indicating that there was
reoxidation during the pouring. There was significant increase in the size of the MnSiO3
inclusions in the casting sample (Figure 2.15 c). The modified inclusions after Ca-
treatment, that is, the CA and CaS inclusion had aspect ratios close to 1, showing that Ca-
treatment helps in giving inclusions a spherical morphology (Figure 2.15 d).
34
00.00020.00040.00060.0008
0.0010.00120.00140.00160.0018
0.002
Furnace, beforedeoxidants
Furnace, afterAl
Ladle, after Ca Final Casting
Frac
tion
of in
clus
ions
OthersMnOCAAl2O3MnSiO3CaSMnS
oxides
oxides
oxides
oxides
sulfidessulfidessulfidessulfides
a)
020406080
100120140160180200220
Furnace, beforedeoxidants
Furnace, after Al
Ladle, after Ca Final Casting
Am
ount
of O
xyge
n (p
pm)
Dissolved OTotal O
b)
0
1
2
3
4
5
6
7
8
Furnace, beforedeoxidants
Furnace, after Al Ladle, after Ca Final Casting
Size
of i
nclu
sion
s (μ
m)
MnSCaSMnSiO3Al2O3CAMnOOthers
c)
Figure 2.15. Comparison of a) inclusion volume, b) dissolved and total oxygen, c) average inclusion size, and d) average inclusion aspect ratio measured in samples collected at various stages of the casting process (MS&T foundry)
35
0
1
2
3
4
5
6
7
Furnace, beforedeoxidants
Furnace, after Al Ladle, after Ca Final Casting
Aspe
ct R
atio
MnSCaSMnSiO3Al2O3CAMnOOthers
d)
Figure 2.15. Comparison of a) inclusion volume, b) dissolved and total oxygen, c) average inclusion size, and d) average inclusion aspect ratio measured in samples collected at various stages of the casting process (MS&T foundry) (cont.)
2.3.5. Effect of Different Practices on Inclusions. This section summarizes the
results obtained from the plant trials conducted at the different foundries. The effects of
the different melting and ladle practices is compared with respect to the inclusion
volume, shape, size and spacing
2.3.5.1. Effect of Ca-addition. Figure 2.16 compares the no calcium-treatment
process in Plant A with the bulk CaSi-addition in Plant B. Both had ladles of comparable
size, but Ca-treatment helped modify MnS to CaS and transformed alumina to calcium
aluminates (CA). CaSi addition helped in decreasing the inclusion content in the cast
sample (Figure 2.16 a). The size and aspect ratio was found to be lesser for the Ca-treated
plant B samples, suggesting that calcium helps in controlling the shape and the size of the
inclusions (Figure 2.16 b and c). The difference between their shape and size decreased
towards the later stages of the casting, because reoxidation affected the aspect ratio and
the size of the inclusions significantly, hence diminishing the effect of the Ca-treatment.

36
0
0.0002
0.0004
0.00060.0008
0.0010.0012
0.0014
0.00160.0018
Plant A Plant B Plant A Plant B Plant A Plant B Plant A Plant B
Frac
tion
of In
clus
ions
Others
MnOTiO2
CA
Al2O3MnSiO3
CaSMnS
Furnace before deoxidants
Ladle after deoxidants
Ladle end of pour
Final Casting
a)
0
0.5
1
1.5
2
2.5
Furnace, beforedeoxidants
Ladle after deoxidants
Ladle, end of pour
Final Casting
Aver
age
Incl
usio
n Si
ze(μ
m)
Plant APlant B
b)
00.5
11.5
22.5
33.5
44.5
5
Furnace, beforedeoxidants
Ladle after deoxidants
Ladle, end of pour
Final Casting
Ave
rage
Incl
usio
n As
pect
Rat
io
Plant APlant B
c)
Figure 2.16. Comparison of inclusion a) volume, b) size and c) aspect ratio measured in samples collected at various stages of the casting process, for plant A with no calcium-treatment and plant B with CaSi added during tap
2.3.5.2. Effect of acid versus basic practice. Figure 2.17 compares the samples
collected from the 20 ton acid and basic EAFs, at the same foundry. Both had similar
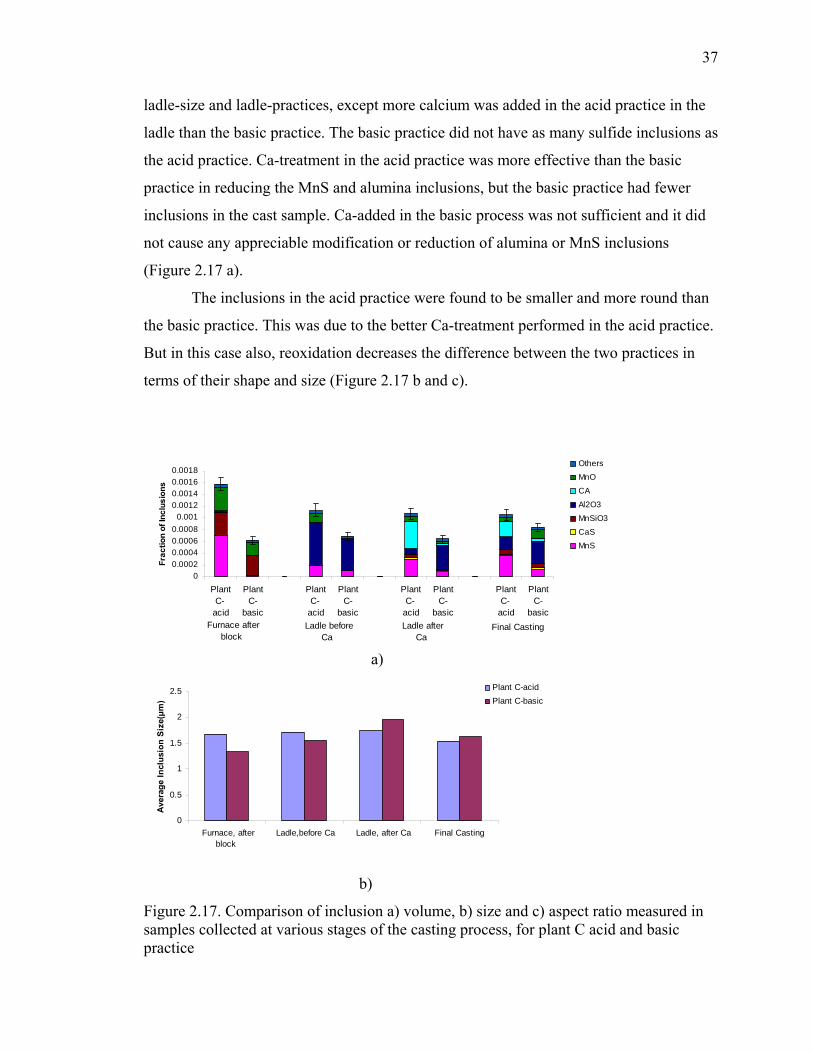
37
ladle-size and ladle-practices, except more calcium was added in the acid practice in the
ladle than the basic practice. The basic practice did not have as many sulfide inclusions as
the acid practice. Ca-treatment in the acid practice was more effective than the basic
practice in reducing the MnS and alumina inclusions, but the basic practice had fewer
inclusions in the cast sample. Ca-added in the basic process was not sufficient and it did
not cause any appreciable modification or reduction of alumina or MnS inclusions
(Figure 2.17 a).
The inclusions in the acid practice were found to be smaller and more round than
the basic practice. This was due to the better Ca-treatment performed in the acid practice.
But in this case also, reoxidation decreases the difference between the two practices in
terms of their shape and size (Figure 2.17 b and c).
00.00020.00040.00060.0008
0.0010.00120.00140.00160.0018
PlantC-
acid
PlantC-
basic
PlantC-
acid
PlantC-
basic
PlantC-
acid
PlantC-
basic
PlantC-
acid
PlantC-
basic
Frac
tion
of In
clus
ions
Others
MnO
CA
Al2O3
MnSiO3
CaSMnS
Furnace after block
Ladle before Ca
Ladle after Ca
Final Casting
a)
0
0.5
1
1.5
2
2.5
Furnace, afterblock
Ladle,before Ca Ladle, after Ca Final Casting
Aver
age
Incl
usio
n Si
ze(μ
m)
Plant C-acidPlant C-basic
b)
Figure 2.17. Comparison of inclusion a) volume, b) size and c) aspect ratio measured in samples collected at various stages of the casting process, for plant C acid and basic practice

38
00.5
11.5
22.5
33.5
44.5
5
Furnace, afterblock
Ladle,before Ca Ladle, after Ca Final Casting
Ave
rage
Incl
usio
n A
spec
t Rat
io
Plant C-acidPlant C-basic
c)
Figure 2.17. Comparison of inclusion a) volume, b) size and c) aspect ratio measured in samples collected at various stages of the casting process, for plant C acid and basic practice (cont.)
2.3.5.3. Effect of inclusion spacing. Apart from the inclusions shape, size,
number and composition, one more property affects the cleanliness and properties of
steel, which is the average spacing between the inclusions. As discussed in equation (2)
in Section 1.2, the fracture toughness of steel is directly proportional to the spacing
between the inclusions. So, “clean” steel should have widely spaced inclusions in order to
achieve high toughness [9].
Aspex measures the exact coordinates of the inclusions on the microscopic
specimen. In order to measure the spacing between the inclusions through Aspex, all the
coordinates of the inclusions were exported to a Microsoft Excel file. After enabling the
macros in Excel, a code was written using Visual Basic to calculate the distance from
each inclusion to the other inclusions and determine the distance to the closest neighbor.
These distances are averaged over all inclusions to determine the average spacing
between the inclusions in the specimen. The complete Visual Basic code is given in
Appendix B.
Figure 2.18 compares the a) area fraction covered by inclusions and b) the
average spacing between the inclusions in the final cast product from all the plants. It can
be seen that the spacing between the inclusions is indirectly proportional to the volume of
inclusions. This implies that in cleaner samples, not only do the inclusions occupy less

39
volume but they are also more spread out. Hence, the “cleanest” castings not only have
the least number of inclusions, but a smaller inclusion volume and greater inclusion
spacing.
a)
b) Figure 2.18. Comparison of a) inclusion volume, b) average inclusion spacing in the samples from cast products collected from the different plants
2.3.5.4. Effect of ladle size. As seen from Figure 2.18 a), the inclusion content in
the casting also varies with the size of the ladle. It is easier to float out inclusions from
larger ladles [2]. The ladle treatment in the MS&T foundry and Plant B was similar, but
Plant B had lesser inclusions because its ladle was almost 10 times the size of the MS&T
foundry ladle, thus, facilitating inclusion floatation.

40
3. FLUENT MODELING
In this study, inclusion flotation in industrial foundry ladles was modeled using
FLUENT CFD Version 6.3.26. The computational procedure included solving the
equations for: 1) unsteady heat transfer between the molten steel and the ladle lining, 2)
free convection flow of the molten steel as a result of the changing steel density, and 3)
particle flow in the liquid steel by applying drag forces.
The unsteady heat transfer was solved by using a “coupled” thermal boundary
between the liquid steel (1600°C) and the preheated ladle lining (900°C), and assuming
that there was radiation and convection from the open steel surface at the top. The free
convection flow of the steel was solved using the Boussinesq density model for thermally
expanded liquids [27].
Figure 3.1 shows the ladle design used for modeling the flow of the steel. The
ladle design consists of two concentric cylinders, with a refractory lining in between.
Table 3.1 gives the dimensions of the ladle, which were varied to provide different ladle
sizes. The density of the liquid steel was taken to be 7000 kg/m3, according to the
Boussinesq density model [27].
Table 3.1. Dimensions of the theoretical ladles used for the different ladle sizes Inner H
(m)
Inner D
(m)
Volume
(cubic m)
Outer H
(m)
Outer D
(m)
Thickness
(inch) Mass (kg)
0.35 0.18 0.01 0.36 0.20 0.50 58.90
0.50 0.35 0.05 0.53 0.40 1.00 336.57
1.00 0.70 0.38 1.05 0.80 2.00 2692.55
1.50 1.05 1.30 1.58 1.20 3.00 9087.36
In order to introduce inclusions into the liquid steel, particles were injected
randomly into the metal during each step of solving the energy and flow equations. The
specific drag forces were applied on the particles, assuming that they were either
spherical, non-spherical with a shape factor of 3.0 or in the form of a second phase liquid

41
droplet. In the case of liquid droplets, the possibility of collision and coalescence of
droplets was also taken into account. It was assumed that the injected particles were
reflected back into the metal from the bottom of the ladle, but that the particles escaped
on reaching the top or the sides of the metal surface. The flotation of both the mono-sized
and the multiple-sized particles was modeled, using the Rosin-Rammler distribution [28].
For all of the calculations, the density of the inclusions was assumed to be 2.7 g/cc and
the non-spherical particles were assumed to have a shape factor of 3.0, based on a
reference found in the literature [29]. The largest ladle size of 9100 kg was chosen for all
the modeling calculations as this size was mid-way between the large and the small ladles
studied in this research.
Figure 3.1. Ladle design used for modeling the flow of the liquid steel

42
3.1. DIFFERENT FLOW MODELS
The flotation of spherical inclusions of different sizes by gravity forces alone and
by natural convection is compared in Figure 3.2. It can be observed that although the
large spherical particles escape in approximately the same time for both the cases,
micron-sizes particles were not floated out by gravity, but were partially removed from
the liquid metal by natural convection.
A more intensive flow of the molten metal than natural convection helps in
improving steel cleanliness. One of the possible ways of increasing the metal flow rate is
adding Ar-stirring in the ladle. Figure 3.3 shows the particle motion of spherical
inclusions of size 50 µm in a 9100 kg capacity ladle in the presence of Ar-stirring at the
bottom. The porous-plug is at the centre of the bottom of the ladle and the rate of Ar-flow
is 3.5 cfm. It can be seen that most of the particles escaped the ladle at the end of 60
seconds in the presence of Ar-stirring.
0
20
40
60
80
100
0 1 2 3 4 5
Time (min)
Percen
t of particle remaining
0.005 mm (convection)
0.005 mm (gravity)
0.2 mm (convection)
0.2 mm (gravity)
1 mm (convection)
1 mm (gravity)
Figure 3.2. Effects of gravity and natural convection on inclusion escape from the liquid steel

43
1 sec 4 sec 20 sec 60 sec Figure 3.3. Flow of spherical particles of size 50 µm in a 9100 kg ladle with Ar-stirring at the bottom of the ladle through a porous plug
3.2. EFFECT OF LADLE SIZE
The flotation of the injected spherical particles in the molten metal, in the
presence of only natural convection, for different ladle capacities is shown in Figure 3.4.
It was interesting to observe that ladle size had a negligible effect on particle flotation in
the model. The larger ladles had longer flotation distances compared to the smaller ladle,
but more intensive convection, thus reducing the flotation time. Because of these two
factors, the hold-time of the molten steel in the ladle is the main factor limiting inclusion
flotation. The typical hold-time in minutes for the different ladles is shown with red
arrows in Figure 3.4.
3.3. EFFECT OF INCLUSION SHAPE AND SIZE
Figure 3.5 shows the dependence of particle flotation on its size, for spherical
particles, in the presence of natural convection in the molten metal. The larger particles
were observed to float out and escape faster as compared to the smaller ones. This
explains the flotation of larger Al2O3 inclusions, whereas the smaller TiO2 inclusions
remained in the steel, as observed in Section 2.3.1.
Figure 3.6 shows the effect of the inclusion shape factor and density on inclusion
flotation, in the presence of natural convection in the metal. Four different kinds of
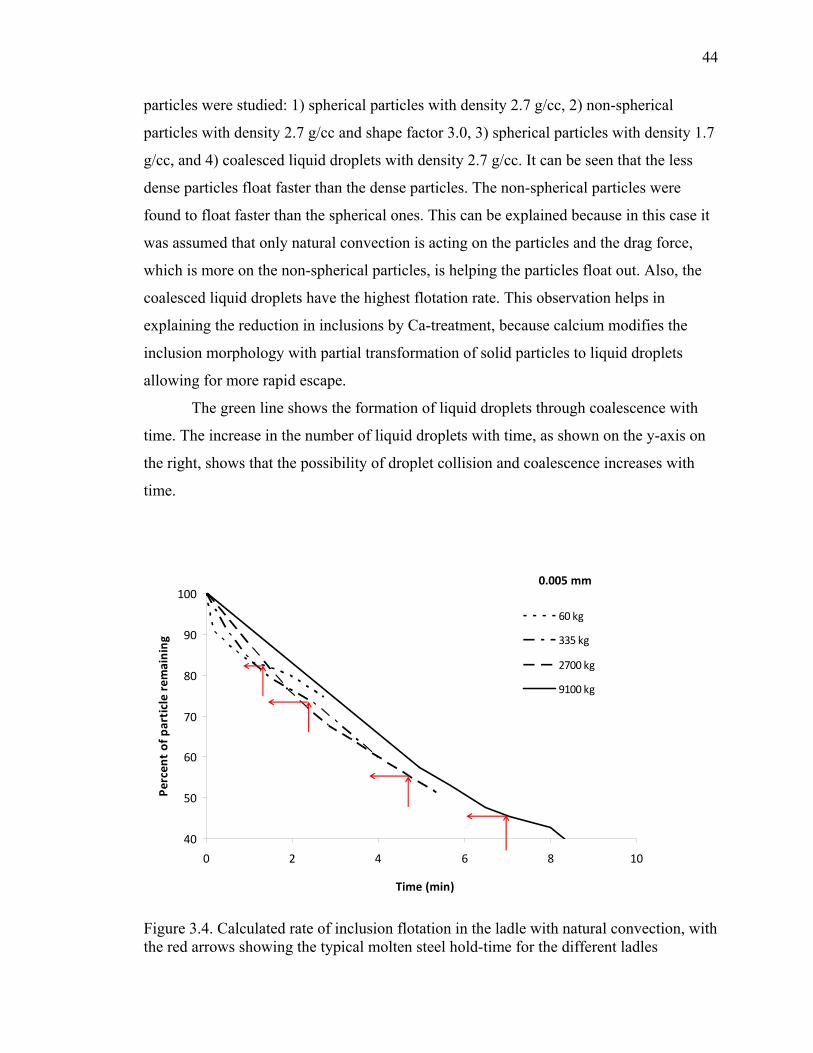
44
particles were studied: 1) spherical particles with density 2.7 g/cc, 2) non-spherical
particles with density 2.7 g/cc and shape factor 3.0, 3) spherical particles with density 1.7
g/cc, and 4) coalesced liquid droplets with density 2.7 g/cc. It can be seen that the less
dense particles float faster than the dense particles. The non-spherical particles were
found to float faster than the spherical ones. This can be explained because in this case it
was assumed that only natural convection is acting on the particles and the drag force,
which is more on the non-spherical particles, is helping the particles float out. Also, the
coalesced liquid droplets have the highest flotation rate. This observation helps in
explaining the reduction in inclusions by Ca-treatment, because calcium modifies the
inclusion morphology with partial transformation of solid particles to liquid droplets
allowing for more rapid escape.
The green line shows the formation of liquid droplets through coalescence with
time. The increase in the number of liquid droplets with time, as shown on the y-axis on
the right, shows that the possibility of droplet collision and coalescence increases with
time.
40
50
60
70
80
90
100
0 2 4 6 8 10
Time (min)
Percen
t of particle remaining
60 kg
335 kg
2700 kg
9100 kg
0.005 mm
Figure 3.4. Calculated rate of inclusion flotation in the ladle with natural convection, with the red arrows showing the typical molten steel hold-time for the different ladles
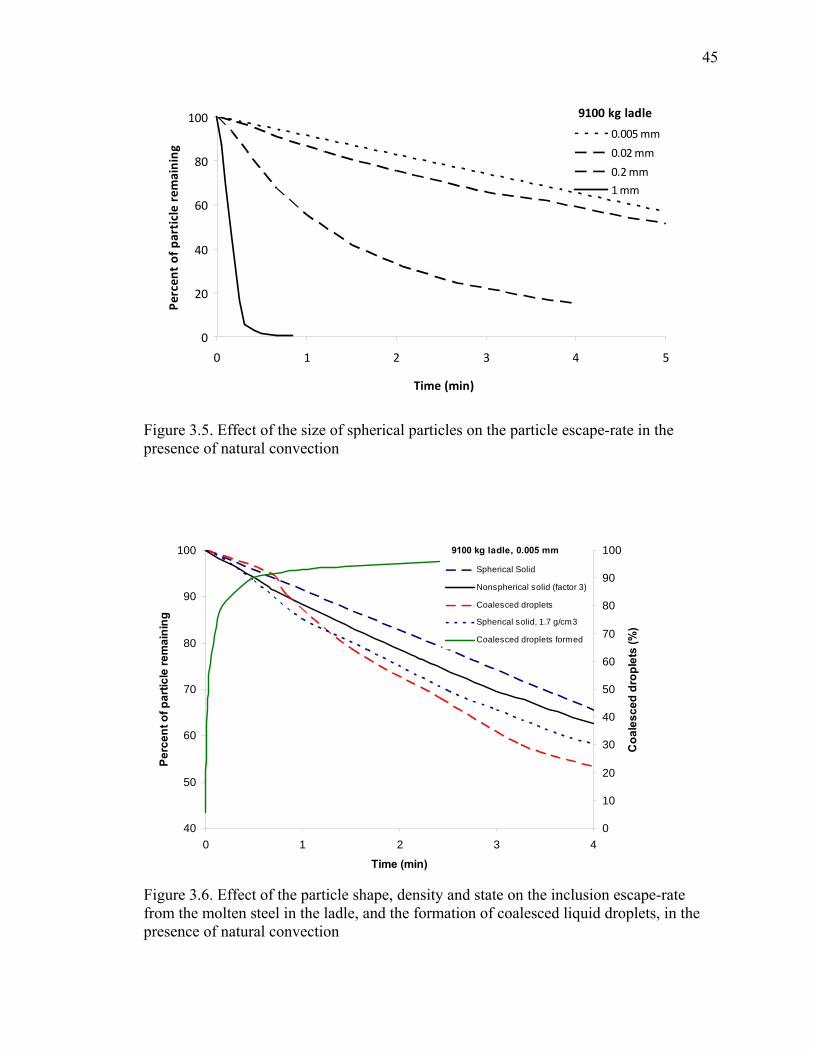
45
0
20
40
60
80
100
0 1 2 3 4 5
Time (min)
Percen
t of particle remaining
0.005 mm
0.02 mm
0.2 mm
1 mm
9100 kg ladle
Figure 3.5. Effect of the size of spherical particles on the particle escape-rate in the presence of natural convection
40
50
60
70
80
90
100
0 1 2 3 4
Time (min)
Perc
ent o
f par
ticle
rem
aini
ng
0
10
20
30
40
50
60
70
80
90
100
Coa
lesc
ed d
ropl
ets
(%)
Spherical Solid
Nonspherical solid (factor 3)
Coalesced droplets
Spherical solid, 1.7 g/cm3
Coalesced droplets formed
9100 kg ladle, 0.005 mm
Figure 3.6. Effect of the particle shape, density and state on the inclusion escape-rate from the molten steel in the ladle, and the formation of coalesced liquid droplets, in the presence of natural convection

46
4. CALCIUM TREATMENT TRIALS
In the previous trials, steel cleanliness was found to be dependent on the amount
and type of the deoxidants added. Ca deoxidation was found to be beneficial when added
as wire and in sufficient quantities. It modified MnS to CaS with globular morphology,
which is less harmful to mechanical properties of steel. Ca also transformed alumina to
calcium aluminates (CA) with lower melting point and spherical morphology allowing
them to easily float out, resulting in cleaner steel. Also, Ca-additions in the form of wire
injection gave better results than bulk additions in the ladle.
In order to study the effect of Ca-addition in detail, more trials were conducted at
Plant A. In these trials, different amounts Ca-wire and CaSi-wire were injected in the
ladle with a wire-feeder. Ar-stirring through a pipe was also performed in the ladle in
some of the heats along with Ca-addition to evaluate its effect on inclusion flotation and
removal.
4.1. EXPERIMENTAL PROCEDURE
Five heats were studied at an industrial foundry to determine the effects of Ca-
wire and Ar-stirring on inclusions in medium carbon cast steel. Steel was melted in a
medium frequency induction furnace (IF) of 2200 lbs capacity, equipped with a porous
plug at the bottom, and tapped twice into a 1000 lbs ladle.
4.1.1. Regular Practice. The regular practice at the foundry included a 10 minute
Ar-stir in the IF, at a pressure of 25 psi and flow-rate of 2 cfm, and deoxidation in the
furnace with 1 lb Al and standard FeMn and FeSi block additions. This was followed by
a treatment of 1 lb of Al, 0.66 lbs of Fe70Ti alloy and 0.88 lbs of Fe51Si35Zr alloy into
the ladle, during tap.
4.1.2. Post-tap Treatment. In the trials conducted, the post-tap treatments in the
ladle were varied for the different heats. The different treatments were planned to observe
the effect of the following parameters on the inclusions and the oxygen content:
1) CaSi wire addition, with the wt. % of Ca added varied from 0.02 % to 0.06 %
2) Pure Ca-wire addition

47
3) CaSi-wire addition at high speed
4) Ar-stirring with lance in the ladle for 1 min.
5) Combined Ar-stirring and CaSi-wire addition
The post-tap treatment for each of the two ladles in each heat is summarized in
Table 4.1.
Table 4.1. Post-tap treatment of each ladle in all of the heats Heat Ladle Post-tap Treatment
1 No post-tap treatment
A 2
CaSi wire addition in the ladle. 0.024 wt. % of Ca added at a wire
feed-rate of 12.5 ft./minute.
1 CaSi wire addition in the ladle. 0.028 wt. % of Ca added at a wire
feed-rate of 12.5 ft./minute B
2 Pure Ca wire addition in the ladle. 0.032 wt. % of Ca added at a wire
feed-rate of 12.5 ft./minute
1 CaSi wire addition in the ladle. 0.043 wt. % of Ca added at a wire
feed-rate of 12.5 ft./minute
C 2 CaSi wire addition in the ladle. 0.05 wt. % of Ca added at a wire feed-
rate of 12.5 ft./minute
1 CaSi wire addition in the ladle 0.043 wt. % of Ca added at a wire feed-
rate of 12.5 ft./minute + Ar-stirring in ladle for 1 minute D
2 High speed CaSi wire addition in the ladle. 0.06 wt. % of Ca added at
a wire feed-rate of 20 ft. /minute
E 1 No Ca-addition + Ar-stirring in ladle for 1 minute
The specifications of the pure Ca-wire and the CaSi-wire used in the trials are as
given below:
1) Ca wire (Ca = 98.5%, Al =0.5%, Mg=0.5%) [Diameter =9 mm] (Weight of Ca-
wire/ft=0.034 lbs/ft; weight of Ca/ft =0.0335 lbs/ft)

48
2) CaSi wire (Ca = 28-32%, Al =1.5%, Si=58-62%, C=1%, Fe=5%) [Diameter =9 mm]
(Weight of CaSi-wire/ft= 0.070 lbs/ft; weight of Ca/ft = 0.021 lbs/ft)
The Ar-stirring was done in the ladle of depth 24 inches for 1 minute, using a
submerged lance at the pressure of 45 psi and flow-rate of 3.5 cfm.
4.1.3. Speed of Wire-Injection. Figure 4.1 shows a picture of the wire-feeder
with the attached feeding-tubes. The five ft. long feeding tube was used for all the trials
as it provided a safe distance between the wire-feeder and the hot metal. A speed of 12.5
ft/min was used in most of the heats for wire-injection. A higher speed of 20 ft/minute
was tried for one of the heats, to obtain deeper injection of the wire in the liquid steel but
resulted in an electrical circuit failure. Therefore, only one heat used the higher speed of
wire-injection.
Figure 4.1. Picture of the wire-feeder with the feeding tubes
4.1.4. Sampling and Oxygen Measurement. Steel chemistry samples were
collected from the furnace, ladle and the mold, using submerged chemistry samplers (SaF
400-QS 3012 from Heraeus Electro-Nite). The samples were collected before and after
deoxidation and post-tap treatment. In addition, samples were cut from standard keel

49
blocks cast from the same heat. Microscopic specimens were prepared from these
samples and a 10 mm2 area was analyzed in each specimen for inclusions using the
Aspex PICA-1020 for automated inclusion analysis. The total oxygen content was
measured from all the samples collected, using Leco TC-500. The dissolved oxygen
content was measured directly from the liquid steel, through all the stages of the casting
process, using Celox oxygen probes and the Celox Lab Datacast-2000.
4.2. RESULTS AND DISCUSSION
4.2.1. Standard Practice. One regular ladle pour was followed during the trials,
with no additional post-tap treatment. Figures 4.2 compares the a) area fraction covered
by inclusions, b) total and dissolved oxygen, c) average inclusions size and d) average
inclusion aspect ratio, at the various stages of liquid processing.
00.00020.00040.00060.00080.001
0.00120.00140.00160.0018
Furnacebefore
deoxidants
Furnace afterAl addition
Ladle afterdeoxidants
Ladle end ofpour
Final CastingFrac
tion
of a
rea
cove
red
by in
clus
ions
others
TiO2CA
Al2O3
MnOMnSiO3
CaS
MnS
Sulfides SulfidesSulfidesSulfides
Oxides
OxidesOxides
Oxides
Sulfides
Oxides
a)
Figure 4.2. Comparison of a) inclusion volume, b) dissolved and total oxygen, c) average inclusion size, and d) average inclusion aspect ratio measured in samples collected at various stages of the casting process, standard practice, no post-treatment

50
020406080
100120140160180200
Furnacebefore
deoxidants
Furnace afterAl addition
Ladle afterdeoxidants
Ladle end ofpour
Final Casting
Amou
nt o
f oxy
gen
(ppm
)
Dissolved OTotal O
b)
0
0.5
1
1.5
2
2.5
3
3.5
4
Furnace beforedeoxidants
Furnace after Aladdition
Ladle afterdeoxidants
Ladle end of pour Final Casting
Size
of i
nclu
sion
s (μ
m)
MnSMnSiO3MnOAl2O3CATiO2others
c)
0
1
2
3
4
5
6
7
Furnace beforedeoxidants
Furnace afterAl addition
Ladle afterdeoxidants
Ladle end ofpour
Final Casting
Asp
ect R
atio
MnSMnSiO3MnOAl2O3CATiO2others
d)
Figure 4.2. Comparison of a) inclusion volume, b) dissolved and total oxygen, c) average inclusion size, and d) average inclusion aspect ratio measured in samples collected at various stages of the casting process, standard practice, no post-treatment (cont.)
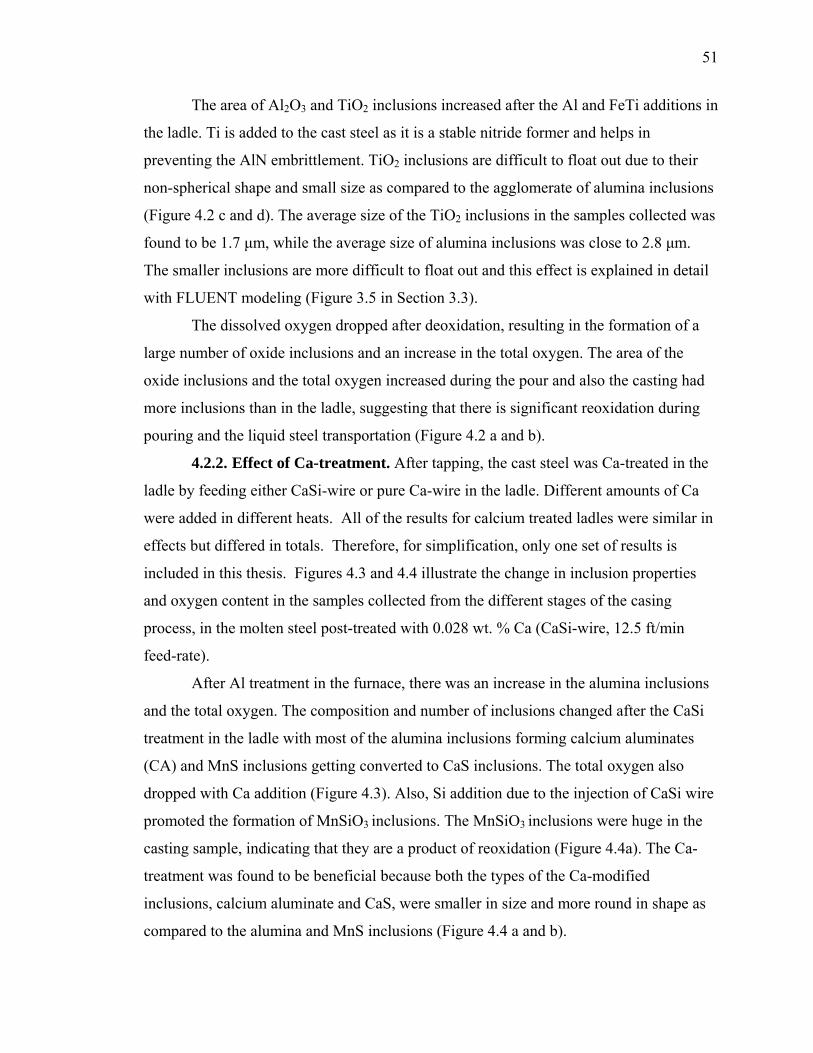
51
The area of Al2O3 and TiO2 inclusions increased after the Al and FeTi additions in
the ladle. Ti is added to the cast steel as it is a stable nitride former and helps in
preventing the AlN embrittlement. TiO2 inclusions are difficult to float out due to their
non-spherical shape and small size as compared to the agglomerate of alumina inclusions
(Figure 4.2 c and d). The average size of the TiO2 inclusions in the samples collected was
found to be 1.7 μm, while the average size of alumina inclusions was close to 2.8 μm.
The smaller inclusions are more difficult to float out and this effect is explained in detail
with FLUENT modeling (Figure 3.5 in Section 3.3).
The dissolved oxygen dropped after deoxidation, resulting in the formation of a
large number of oxide inclusions and an increase in the total oxygen. The area of the
oxide inclusions and the total oxygen increased during the pour and also the casting had
more inclusions than in the ladle, suggesting that there is significant reoxidation during
pouring and the liquid steel transportation (Figure 4.2 a and b).
4.2.2. Effect of Ca-treatment. After tapping, the cast steel was Ca-treated in the
ladle by feeding either CaSi-wire or pure Ca-wire in the ladle. Different amounts of Ca
were added in different heats. All of the results for calcium treated ladles were similar in
effects but differed in totals. Therefore, for simplification, only one set of results is
included in this thesis. Figures 4.3 and 4.4 illustrate the change in inclusion properties
and oxygen content in the samples collected from the different stages of the casing
process, in the molten steel post-treated with 0.028 wt. % Ca (CaSi-wire, 12.5 ft/min
feed-rate).
After Al treatment in the furnace, there was an increase in the alumina inclusions
and the total oxygen. The composition and number of inclusions changed after the CaSi
treatment in the ladle with most of the alumina inclusions forming calcium aluminates
(CA) and MnS inclusions getting converted to CaS inclusions. The total oxygen also
dropped with Ca addition (Figure 4.3). Also, Si addition due to the injection of CaSi wire
promoted the formation of MnSiO3 inclusions. The MnSiO3 inclusions were huge in the
casting sample, indicating that they are a product of reoxidation (Figure 4.4a). The Ca-
treatment was found to be beneficial because both the types of the Ca-modified
inclusions, calcium aluminate and CaS, were smaller in size and more round in shape as
compared to the alumina and MnS inclusions (Figure 4.4 a and b).

52
0
0.00020.0004
0.0006
0.00080.001
0.0012
0.00140.0016
0.0018
Ladle afterdeoxidants
Ladle beforeCaSi
Ladle afterCaSi
Ladle end ofpour
Final CastingFrac
tion
of a
rea
cove
red
by in
clus
ions
othersTiO2CAAl2O3MnOMnSiO3CaSMnS
SulfidesSulfidesSulfidesSulfides
OxidesOxides
OxidesOxides
Sulfides
Oxides
a)
020406080
100120140160180200
Ladle afterdeoxidants
Ladle beforeCaSi
Ladle afterCaSi
Ladle end ofpour
Final Casting
Amou
nt o
f oxy
gen
(ppm
)
Dissolved OTotal O
b) Figure 4.3. Comparison of a) inclusion area and b) oxygen content measured in samples collected at various stages of the casting, post-treated with CaSi-wire, 0.028 wt. % Ca, 12.5 ft/min feed-rate
In the other ladle tests, the weight % of Ca-added was varied from 0.02% to
0.06%. The Ca-addition was made with either CaSi-wire or pure Ca-wire. No Ar-stirring
was done in these heats. Figures 4.5 and 4.6 show the effect of varying the Ca-addition
on the inclusions and the total oxygen content of the steel, as measured from the cast
samples obtained from the various heats.

53
00.5
11.5
22.5
33.5
4
Ladle afterdeoxidants
Ladle beforeCaSi
Ladle afterCaSi
Ladle end ofpour
Final Casting
Size
of i
nclu
sion
s (μ
m)
MnSCaSMnSiO3MnOAl2O3CATiO2others
a)
0
1
2
3
4
5
6
7
Ladle afterdeoxidants
Ladle beforeCaSi
Ladle afterCaSi
Ladle end ofpour
Final Casting
Asp
ect R
atio
MnSCaSMnSiO3MnOAl2O3CATiO2others
b) Figure 4.4. Comparison of inclusion a) size and b) aspect ratio measured in samples collected at various stages of the casting, post-treated with CaSi-wire, 0.028 wt. % Ca, 12.5 ft/min feed-rate
0
0.0002
0.0004
0.0006
0.0008
0.001
0.0012
0.0014
0.0016
0.0018
0 0.01 0.02 0.03 0.04 0.05 0.06 0.07
Wt% of Ca added
Frac
tion
of a
rea
cove
red
by in
clus
ions
Figure 4.5. Change in the amount of inclusions with varying wt. % of Ca-addition.
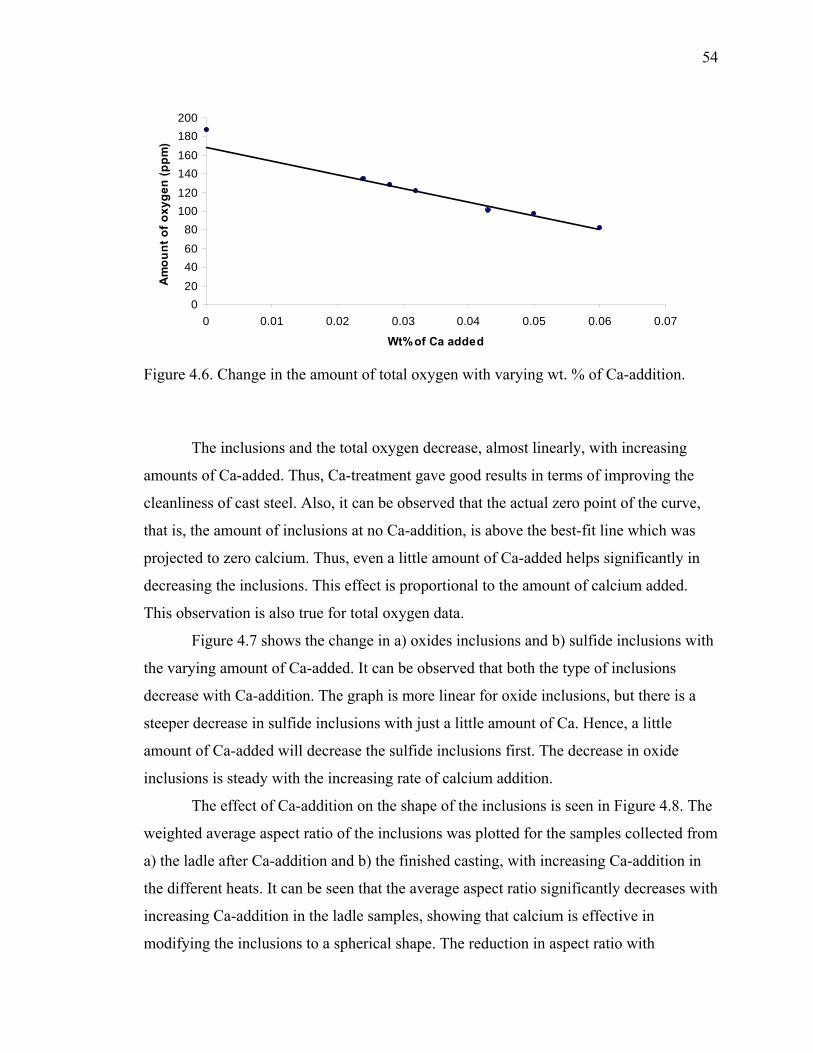
54
020406080
100120140160180200
0 0.01 0.02 0.03 0.04 0.05 0.06 0.07
Wt% of Ca added
Am
ount
of o
xyge
n (p
pm)
Figure 4.6. Change in the amount of total oxygen with varying wt. % of Ca-addition.
The inclusions and the total oxygen decrease, almost linearly, with increasing
amounts of Ca-added. Thus, Ca-treatment gave good results in terms of improving the
cleanliness of cast steel. Also, it can be observed that the actual zero point of the curve,
that is, the amount of inclusions at no Ca-addition, is above the best-fit line which was
projected to zero calcium. Thus, even a little amount of Ca-added helps significantly in
decreasing the inclusions. This effect is proportional to the amount of calcium added.
This observation is also true for total oxygen data.
Figure 4.7 shows the change in a) oxides inclusions and b) sulfide inclusions with
the varying amount of Ca-added. It can be observed that both the type of inclusions
decrease with Ca-addition. The graph is more linear for oxide inclusions, but there is a
steeper decrease in sulfide inclusions with just a little amount of Ca. Hence, a little
amount of Ca-added will decrease the sulfide inclusions first. The decrease in oxide
inclusions is steady with the increasing rate of calcium addition.
The effect of Ca-addition on the shape of the inclusions is seen in Figure 4.8. The
weighted average aspect ratio of the inclusions was plotted for the samples collected from
a) the ladle after Ca-addition and b) the finished casting, with increasing Ca-addition in
the different heats. It can be seen that the average aspect ratio significantly decreases with
increasing Ca-addition in the ladle samples, showing that calcium is effective in
modifying the inclusions to a spherical shape. The reduction in aspect ratio with

55
increasing Ca is still evident in the casting samples; however, reoxidation damaged the
modification effect increasing the overall aspect ratio.
0
0.0002
0.0004
0.0006
0.0008
0.001
0.0012
0.0014
0 0.01 0.02 0.03 0.04 0.05 0.06 0.07
Wt% of Ca added
Frac
tion
of a
rea
cove
red
by o
xide
in
clus
ions
a)
0
0.00005
0.0001
0.00015
0.0002
0.00025
0.0003
0.00035
0 0.01 0.02 0.03 0.04 0.05 0.06 0.07
Wt% of Ca added
Frac
tion
of a
rea
cove
red
by s
ulfid
e in
clus
ions
b) Figure 4.7. Change in the amount of a) oxide inclusions and b) sulfide inclusions with varying wt. % of Ca-addition

56
00.5
11.5
22.5
33.5
44.5
5
0 0.01 0.02 0.03 0.04 0.05 0.06 0.07
Wt% of Ca added
Ave
rage
Asp
ect R
atio
of t
he
Incl
usio
ns
a)
00.5
11.5
22.5
33.5
44.5
5
0 0.01 0.02 0.03 0.04 0.05 0.06 0.07
Wt% of Ca added
Ave
rage
Asp
ect R
atio
of t
he
Incl
usio
ns
b) Figure 4.8. Weighted average aspect ratio of the inclusions in the sample collected from a) ladle after Ca-treatment and b) casting with varying wt. % of Ca-addition in the different heats
4.2.3. Effect of Ar-stirring. In one ladle, no Ca was added in the ladle and Ar-
stirring was performed with a submerged lance for 1 minute. Figures 4.9 compare the
change in a) inclusions area, b) oxygen content, c) average inclusion size, and d)
inclusion shape during the various stages of casting.

57
0
0.0002
0.0004
0.0006
0.0008
0.001
0.0012
0.0014
0.0016
0.0018
Furnace after Aladdition
Ladle afterdeoxidants
Ladle after Ar-stirring
Ladle end ofpour
Mold Final Casting
Frac
tion
of a
rea
cove
red
by in
clus
ions
othersTiO2
CAAl2O3
MnO
MnSiO3CaS
MnS
sulfidessulfidessulfidessulfidessulfides
oxidesoxides
oxides
oxides
oxideoxides
sulfides
a)
020406080
100120140160180200
Furnace afterAl addition
Ladle afterdeoxidants
Ladle afterAr-stirring
Ladle end ofpour
Mold Final Casting
Am
ount
of o
xyge
n (p
pm)
Dissolved O
Total O
b)
0
0.5
1
1.5
2
2.5
3
3.5
4
Furnace afterAl addition
Ladle afterdeoxidants
Ladle after Ar-stirring
Ladle end ofpour
Mold Final Casting
Size
of i
nclu
sion
s (μ
m)
MnSMnSiO3MnOAl2O3CATiO2others
c)
Figure 4.9. Comparison of a) inclusion volume, b) dissolved and total oxygen, c) average inclusion size, and d) average inclusion aspect ratio measured in samples collected at various stages of the casting process, with only Ar-stirring in the ladle

58
0
1
2
3
4
5
6
7
Furnace afterAl addition
Ladle afterdeoxidants
Ladle after Ar-stirring
Ladle end ofpour
Mold Final Casting
Asp
ect R
atio
MnSMnSiO3MnOAl2O3CATiO2others
d)
Figure 4.9. Comparison of a) inclusion volume, b) dissolved and total oxygen, c) average inclusion size, and d) average inclusion aspect ratio measured in samples collected at various stages of the casting process, with only Ar-stirring in the ladle ( cont.)
Ar-stirring helped with inclusion floatation. The volume of inclusions and the
total oxygen decreased after the stirring (Figure 4.9 a and b). This observation is
supported by FLUENT modeling discussed in Figure 3.3 in Section 3.1, which shows that
an intensive flow of the molten metal caused by Ar-stirring in the ladle helps in removing
almost all the inclusions at the end of 1 minute. But Ar-stirring did not cause any
appreciable change in the shape or size of the inclusions, showing that Ar-stirring did not
modify the inclusions, just helped them to float out (Figure 4.9 c and d).
4.2.4. Effect of Ca-addition Combined with Ar-stirring. In order to see the
combined effect of Ca-addition along with Ar-stirring, and to compare these processes, a
trial was conducted in which first CaSi-wire (0.043 wt. % Ca) was added in the ladle,
followed by Ar-stirring for 1 minute. Figures 4.10 and 4.11 illustrate the change in
inclusions and the oxygen content during the various stages of casting.
As observed in the previous cases, both Ar-stirring and Ca-addition helped in
inclusion removal. The dissolved oxygen also decreased after Ar-stirring which indicates
that the Ca-reaction with the liquid metal continued during the stirring. But a greater
decrease in inclusions and oxygen was observed in the ladle sample immediately after

59
Ca-addition, as compared to the sample taken after Ar-stirring. This shows that Ar-
stirring is not as effective as Ca-treatment for inclusion removal, but the combination of
both Ca-addition and Ar-stirring was more beneficial for inclusion removal.
0
0.0002
0.00040.0006
0.00080.001
0.0012
0.0014
0.0016
0.0018
Ladle afterdeoxidants
Ladlebefore CaSi
Ladle afterCaSi
Ladle afterAr-stirring
Mold FinalCasting
Frac
tion
of a
rea
cove
red
by in
clus
ions
othersTiO2CAAl2O3MnOMnSiO3CaSMnS
SulfidesSulfidesSulfidesSulfidesSulfides
OxidesOxidesOxides
OxidesOxides
Sulfides
Oxides
Figure 4.10. Comparison of inclusion area measured in samples collected at various stages of the casting process with CaSi-addition, 0.043 wt. % Ca and Ar-stirring in the ladle
020406080
100
120140160180200
Ladle afterdeoxidants
Ladlebefore CaSi
Ladle afterCaSi
Ladle afterAr-stirring
Mold FinalCasting
Am
ount
of o
xyge
n (p
pm)
Dissolved OTotal O
Figure 4.11. Comparison of dissolved and total oxygen at various stages of the casting process with CaSi-addition, 0.043 wt. % Ca and Ar-stirring in the ladle

60
4.2.5. Effect of Other Parameters. During these trials, two other parameters of
Ca-addition were tested, which were high-speed injection of the wire and the use of pure
Ca-wire. High speed CaSi wire addition gave better Ca-reaction with the molten steel. It
also helped in decreasing the ladle-hold time, as it added more calcium for a given time
due to the high speed. Pure-Ca addition also had the advantage of adding more calcium
and not changing the Si-chemistry. But pure-Ca wire addition produced a violent reaction
in the small ladle, thus, it was not used for any other heats.
4.2.6. Comparison of All the Treatments. The effects of the different post-tap
treatments on the cleanliness and the chemistry of the cast steel are discussed here.
4.2.6.1. Effect on inclusions. CaSi-wire additions were effective in reducing the
alumina and MnS inclusions and forming calcium aluminate and CaS inclusions (Figure
4.12 a). However, higher CaSi-wire additions led to an increase in MnSiO3 inclusions.
Better results were achieved as the amount of Ca increased. Ar-stirring in the ladle, after
CaSi-wire treatment, helped in flotation and reduction of the inclusions. But Ar-stirring
alone was not as effective as Ca-additions. CaSi-wire additions at a high speed gave the
lowest inclusions because of the larger amount of calcium added and better interaction of
the wire with the molten steel. Also, the high speed of injection helped in addition of
more Ca in less time.
By definition, “clean” steel should have widely spaced inclusions in order to
achieve high toughness. As discussed in Section 2.3.5.3, the spacing between the
inclusions for the casting samples was measured for all the heats. It can be seen that the
spacing between the inclusions is indirectly proportional to the volume of inclusions
(Figure 4.12 b). This implies that in the Ca-treated heats, not only do the inclusions
occupy less volume, but they are also more widely separated and, hence, represent
cleaner steel.
4.2.6.2. Effect on chemistry. Table 4.2 compares the chemistry of all the heats
just after the addition of the standard deoxidants during tap and chemistry of the cast
products after the various post-tap treatments. This shows the effect of the respective
post-tap treatment on the chemistry of the steel.

61
0
0.0002
0.0004
0.0006
0.0008
0.001
0.0012
0.0014
0.0016
0.0018
0.00 % Ca0.00 ft/min
No Stir
Ladle Stir 0.024% Ca12.5 ft/min
No Stir
0.028% Ca12.5 ft/min
No Stir
0.032% Ca12.5 ft/min
No Stir
0.043% Ca12.5 ft/min
No Stir
0.043% Ca12.5 ft/minLadle Stir
0.05% Ca12.5 ft/min
No Stir
0.06% Ca 20 ft/min
No Stir
Frac
tion
of a
rea
cove
red
by in
clus
ions Others
TiO2CAAl2O3MnOMnSiO3CaSMnS
a)
0
0.005
0.01
0.015
0.02
0.025
0.03
0.035
0.04
0.00 % Ca0.00 ft/min
No Stir
Ladle Stir 0.024% Ca12.5 ft/min
No Stir
0.028% Ca12.5 ft/min
No Stir
0.032% Ca12.5 ft/min
No Stir
0.043% Ca12.5 ft/min
No Stir
0.043% Ca12.5 ft/minLadle Stir
0.05% Ca12.5 ft/min
No Stir
0.06% Ca 20 ft/min
No Stir
Ave
rage
Incl
usio
n Sp
acin
g (m
m)
b) Figure 4.12. Comparison of a) inclusion volume and b) average inclusion spacing in the samples taken from the cast keel blocks from all the heats
It can be seen that use of CaSi-wire increases the silicon content of the final
product. But the final Si-content is below the acceptable limit of 0.05 %-0.06 %. If Si-
content is above this limit, it decreases the notch-toughness of the cast product [30]. The
use of pure Ca did not affect the Si-chemistry appreciably, but it caused a violent reaction
in the ladle, and hence it was avoided for the other heats. The sulfur content was found to
increase in the cast product, but this increase was minimized by higher Ca additions.
Therefore, the Ca injection was not effective in desulfurizing due to the lack of a refining
slag layer.

62
Table 4.2. Chemistry of some of the heats before and after the respective post-tap treatment Treatment C Mn P S Si Cu Ni Cr Mo Al
After
tap 0.21 0.77 0.04 0.015 0.42 0.062 0.055 0.05 0.13 0.10
CaSi-wire
(0.028 wt.
% Ca) Final 0.24 0.75 0.01 0.019 0.46 0.059 0.062 0.04 0.18 0.09
After
tap 0.21 0.77 0.04 0.015 0.42 0.062 0.055 0.05 0.13 0.10
Pure Ca-
wire
(0.032 wt.
% Ca)
Final 0.25 0.70 0.01 0.019 0.45 0.060 0.046 0.04 0.22 0.07
After
tap 0.23 0.78 0.01 0.019 0.41 0.073 0.053 0.04 0.09 0.10
CaSi-wire
(0.043 wt.
% Ca) +
Ar-stir
Final 0.28 0.80 0.02 0.020 0.49 0.082 0.050 0.05 0.10 0.10
After
tap 0.22 0.77 0.01 0.017 0.39 0.066 0.059 0.05 0.12 0.09
No-Ca +
Ar-stir
Final 0.25 0.78 0.01 0.020 0.48 0.071 0.056 0.05 0.13 0.09
4.3. CHARPY IMPACT TESTING
4.3.1. Procedure. The cast keel blocks obtained from the heats were normalized
by heating at 1650°F (900°C) for 1.5 hours and air-cooling. Charpy V-notch specimens
of dimensions 10mm×10mm×55mm were prepared form the normalized keel blocks
according to ASTM E23 standards [31]. The Charpy tests were conducted at a
temperature of -40°C. The specimens were cooled to this temperature by keeping them in
a mixture of methane and liquid nitrogen for approximately 30 minutes.
4.3.2. Results and Discussion. Figure 4.13 shows the charpy impact energy
absorbed for all the heats with the different post-tap treatments. This absorbed energy is a
measure of the toughness. High toughness was obtained for Ca-treated samples, and the

63
toughness increased with the amount of calcium. Ar-stirring also helped in increasing the
toughness. Highest toughness was obtained for the combined CaSi addition with Ar-
stirring.
02468
1012141618
0.00 % Ca0.00 ft/min
No Stir
Ladle Stir 0.024% Ca12.5 ft/min
No Stir
0.028% Ca12.5 ft/min
No Stir
0.032% Ca12.5 ft/min
No Stir
0.043% Ca12.5 ft/min
No Stir
0.043% Ca12.5 ft/minLadle Stir
0.05% Ca12.5 ft/min
No Stir
0.06% Ca 20 ft/min
No StirCha
rpy
Impa
ct E
nerg
y A
bsor
bed
(ft-lb
s)
Figure 4.13. Charpy impact energy absorbed for all the different ladle treatments
Figure 4.14 shows the correlation between the toughness and the inclusions
content, as measured for all the cast samples. As given in Equation 1 in Section 1.3, the
fracture toughness varies linearly with (Vf)-1/6, where Vf= volume fraction of inclusions,
and assuming the rest of the parameters to be constant. The charpy impact energy data
was plotted versus the (Area fraction of inclusions)-1/6 and was observed to result in a
nearly linear fit verifying this relationship. This figure directly proves that inclusions
adversely affect the toughness of cast steel. For all the treatments, a decrease in
inclusions has a corresponding increase in the toughness.
Figure 4.15 shows the change in the charpy impact energy absorbed with change
in the (area fraction) -1/6 of a) oxide and b) sulfide inclusions, as measured for all the cast
samples. A linear relationship is observed between the toughness and the oxide inclusion
fraction-1/6, showing that decreasing the volume of oxide inclusions direct increases the
toughness. The charpy impact data did not show as close of a linear relationship when
plotted agains the fraction of sulfide inclusions-1/6, but toughness definitely still increases

64
with a decrease in the sulfide inclusion volume. These results clearly suggest that both
the types of inclusions are harmful for toughness of the cast product and should be
avoided.
02468
101214161820
2.8 2.9 3 3.1 3.2 3.3 3.4
(Fraction of Area Covered by Inclusions)^(-1/6)
Char
py Im
pact
Ene
rgy
Abs
orbe
d(ft-
lbs)
(Fraction of Area Covered by Inclusions * 10^3)
2.075 0.6470.7740.9311.1271.3721.681
Figure 4.14. Correlation between the toughness and the inclusions content, as measured for all the cast samples
02468
101214161820
2.9 3 3.1 3.2 3.3 3.4
(Fraction of Area Covered by Oxide Inclusions)^(-1/6)
Cha
rpy
Impa
ct E
nerg
y Ab
sorb
ed (f
t-lbs
)
(Fraction of Area Covered by Inclusions * 10^3)
0.6470.7740.9311.1271.3721.681
a) Figure 4.15. Correlation between the toughness and the inclusions content for a) oxides and b) sulfides, as measured for all the cast samples
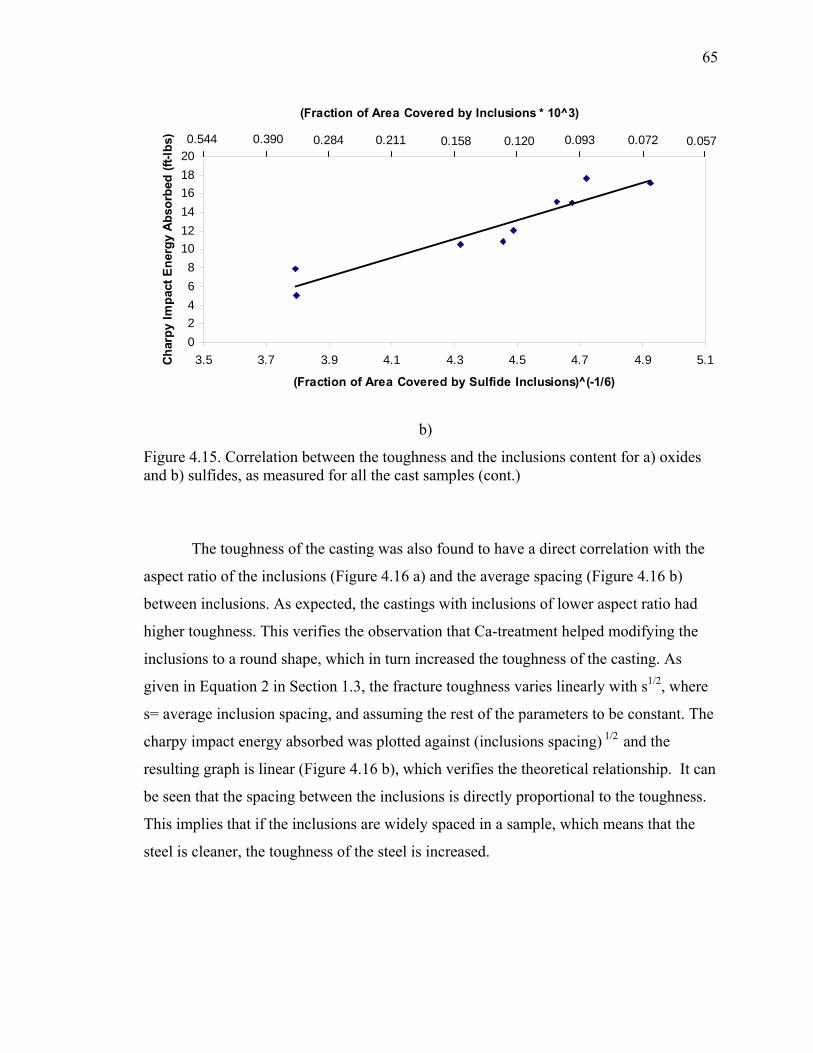
65
02468
101214161820
3.5 3.7 3.9 4.1 4.3 4.5 4.7 4.9 5.1
(Fraction of Area Covered by Sulfide Inclusions)^(-1/6)
Char
py Im
pact
Ene
rgy
Abs
orbe
d (ft
-lbs)
(Fraction of Area Covered by Inclusions * 10^3)
0.0720.0930.1200.1580.2110.2840.3900.544 0.057
b)
Figure 4.15. Correlation between the toughness and the inclusions content for a) oxides and b) sulfides, as measured for all the cast samples (cont.)
The toughness of the casting was also found to have a direct correlation with the
aspect ratio of the inclusions (Figure 4.16 a) and the average spacing (Figure 4.16 b)
between inclusions. As expected, the castings with inclusions of lower aspect ratio had
higher toughness. This verifies the observation that Ca-treatment helped modifying the
inclusions to a round shape, which in turn increased the toughness of the casting. As
given in Equation 2 in Section 1.3, the fracture toughness varies linearly with s1/2, where
s= average inclusion spacing, and assuming the rest of the parameters to be constant. The
charpy impact energy absorbed was plotted against (inclusions spacing) 1/2 and the
resulting graph is linear (Figure 4.16 b), which verifies the theoretical relationship. It can
be seen that the spacing between the inclusions is directly proportional to the toughness.
This implies that if the inclusions are widely spaced in a sample, which means that the
steel is cleaner, the toughness of the steel is increased.

66
02468
101214161820
2 2.5 3 3.5 4 4.5 5
Average Aspect Ratio of the Inclusions
Cha
rpy
Impa
ct E
nerg
y A
bsor
bed
(ft-
lbs)
a)
02468
101214161820
0.14 0.145 0.15 0.155 0.16 0.165 0.17 0.175 0.18 0.185 0.19
(Inclusion Spacing)^0.5 (mm^0.5)
Cha
rpy
Impa
ct E
nerg
y A
bsor
bed
(ft-lb
s)
b)
Figure 4.16. Change in the charpy impact energy absorbed with change in the a) average aspect ratio of inclusion and b) (average inclusion spacing) 1/2, as measured for all the cast samples
4.3.3. Fractography. The fractured surfaces of the broken bars after the Charpy
tests were observed under the Aspex SEM to determine the cause and mode of the
fracture. Fractography analysis was done on two samples with highest charpy impact
energy absorbed, which were, 17.2 and 16.2 ft-lbs. The mode of fracture for both the
samples was found to be mostly brittle.
Figure 4.17 shows an image of a brittle crack at 500 X. The EDS analysis shows
presence of alumina and manganese silicate inclusions at the crack surface, which gives a
possible explanation for the brittle crack. Figure 4.18 shows presence of TiO2-inclusions
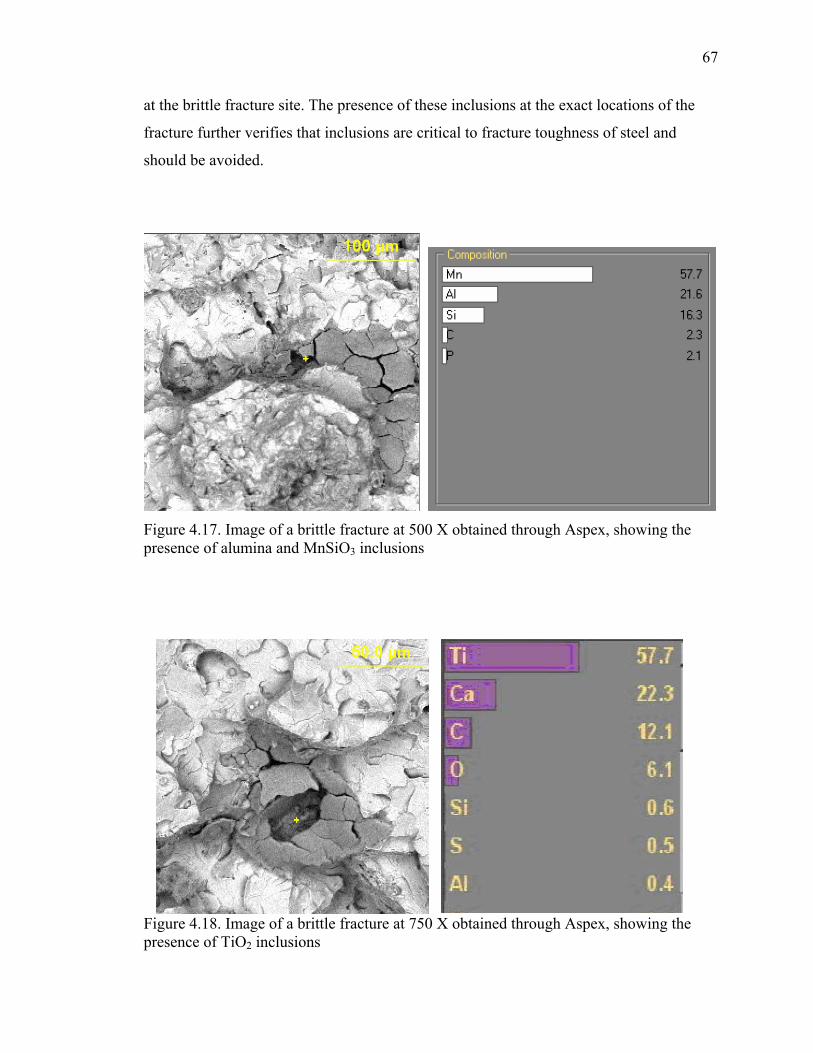
67
at the brittle fracture site. The presence of these inclusions at the exact locations of the
fracture further verifies that inclusions are critical to fracture toughness of steel and
should be avoided.
Figure 4.17. Image of a brittle fracture at 500 X obtained through Aspex, showing the presence of alumina and MnSiO3 inclusions
Figure 4.18. Image of a brittle fracture at 750 X obtained through Aspex, showing the presence of TiO2 inclusions

68
5. CONCLUSIONS
In this research a new automated inclusion analyzer, Aspex PICA-1020, is used
for identifying the number, shape, size, composition and spacing of inclusions in steel
casting. The important conclusions with respect to the use of Aspex for inclusions
analysis are as follows:
1) It is an integrated SEM and EDS system and allows for automated characterization of
all the inclusions (1 μm to 5 mm) in a microscopic specimen; including the volume
fraction, size and shape, inclusion spacing and complete inclusion identification.
2) Aspex analysis is faster than standard SEM-analysis because it only spends time
collecting detailed sizing data where inclusions are known to be present, rather than
spending time capturing and analyzing vast numbers of essentially empty pixels.
3) Aspex completely analyzed a standard microscopic specimen for inclusions in less
than an hour.
Calcium treatment was performed in the ladle in both bulk form and wire form.
Ca-addition was found to be beneficial for inclusion modification and control in the
following ways:
1) In all the heats conducted with Ca-additions in the ladle, the fraction of area covered
by inclusions and the total oxygen was found to decrease after the Ca-treatment.
2) The major reduction was found in alumina and MnS inclusions. The inclusions present
after Ca-treatment consisted primarily of calcium aluminate and CaS inclusions.
3) The shape factor of calcium aluminate and CaS inclusions was close to 1 and their
SEM images also showed their round shape, suggesting that they are not as harmful to
mechanical properties of cast steel as the non-spherical inclusions.
4) The Ca-treatment trials reported a direct decrease in inclusions and total oxygen with
increasing the amount of Ca-added.
5) Ca-treatment in bulk form did not cause as much decrease and modification in the
inclusions as Ca-added in the form of wire.
The toughness of the cast steel was measured by conducting charpy impact tests
at -40°C, after normalizing the samples. The important conclusions from the charpy tests
are:

69
1) The charpy impact energy absorbed was found to be linearly proportional to the
volume fraction of inclusions-1/6.
2) The charpy impact energy absorbed was found to increase with an increase in the
amount of Ca-added in the ladle
3) The highest toughness was obtained for the heat treated with CaSi-wire and then
stirred with Ar in the ladle.

70
6. FUTURE WORK
Fractography analysis of the broken charpy bars can be done to analyze the mode
of fracture and determine the exact cause for it. That can conclusively determine whether
the void nucleation and coalescence occurring at the inclusion sites is a major source of
affecting the toughness of steel. Also, charpy tests can be conducted at different
temperatures to determine the ductile-to-brittle transition temperature of that steel.
Instrumented Charpy tests can be done to obtain the dynamic fracture toughness, K1C,
which is a better representation of fracture toughness of the steel and is expected show a
more direct relationship with the inclusion content.
In order to see the effect of the combination of Ar-stirring and Ca-treatment in a
large ladle, samples collected from Plant C with a 20-ton ladle, will be analyzed for
inclusions and total oxygen. The samples were collected before and after the Ca-
treatment and the Ar-stirring in the ladle.
Ar-stirring in the ladle was beneficial for inclusion removal and produced tougher
steel. Ar-stirring through a porous-plug in ladle is a better way of stirring than submerged
lance-stirring. The effect of such stirring on the inclusion content and toughness of
castings will be studied at Plant A.

71
APPENDIX A
STANDARD RULES USED FOR CLASSIFYING INCLUSIONS WITH ASPEX

72
Before deoxidants:
MnS Mn>30 S >20
MnSiO3 Mn>20 Si>10 And S<20
MnO Mn>30 and S<20
After Al and Ti:
MnS Mn>30 S >20
MnSiO3 Mn>20 Si>10 And S<20
MnO Mn>30 and S<20 and Al<25
Al2O3 Al>25 and Mn<25
MnO-Al2O3 Mn>25 and Al>25 and S<20
TiO2 Ti>30
After Al, before Ca
MnS Mn>30 S >20
MnSiO3 Mn>20 Si>10 And S<20
MnO Mn>30 and S<20 and Al<25
Al2O3 Al>25 and Mn<25
MnO-Al2O3 Mn>25 and Al>25 and S<20
After Ca
MnS Mn>30 S >20 and Ca<20
CaS Ca>30 S >20 and Mn<20
MnS-CaS Mn>15 and Ca>15 and S>20
CaAl2O4 Al>20 Ca>15 Si<20 Mn<20 S<20
MnSiO3 Mn>20 and Si>10 and S<20 and Al<20 and Ca<20
CaSiO3 Ca>20 and Si>10 and S<20 and Al<20 and Mn<20

73
MnO-Al2O3 Mn>25 and Al>25 and S<20 Si<20 Ca<20
CaO-MnO Ca>25 and Mn>25 and Si<20 and Al<20 and S<20
Al2O3 Al>25
MnO Mn>30 and S<20
CaO Ca>30 and S<20

74
APPENDIX B
VISUAL BASIC CODE FOR CALCULATING INCLUSION SPACING

75
Function NEAREST_NEIGHBOR(TestRange As Range, ValRange As Range)
Dim RangeArray As Variant, TestArray As Variant
Dim i As Long, Counter As Long
Dim j As Integer, distance As Double, min_dist As Double
Dim StartValRangeRow As Long, StartTestRangeRow As Long
If ValRange.Cells.Count = 0 Then
NEAREST_NEIGHBOR = CVErr(xlErrNum)
Exit Function
End If
'''Read the values into an array
TestArray = TestRange.Value
RangeArray = ValRange.Value
'''Identify the starting row for each argument
'''to ignore comparing a row against itself.
StartValRangeRow = ValRange.Row
StartTestRangeRow = TestRange.Row
'''Loop through the data and determine the minimum distance.
For i = 1 To ValRange.Rows.Count
If StartValRangeRow + i - 1 <> StartTestRangeRow Then
distance = 0 ' reset distance in each pass
Counter = Counter + 1
For j = 1 To ValRange.Columns.Count
distance = distance + (TestArray(1, j) - RangeArray(i, j)) ^ 2
Next j
If Counter = 1 Then

76
min_dist = distance '''first pass must be the minimum so far
Else
min_dist = WorksheetFunction.Min(min_dist, distance)
End If
End If
Next i
NEAREST_NEIGHBOR = Sqr(min_dist)
End Function

77
BIBLIOGRAPHY
[1] J.W. Farrell, P.J. Bilek, D.C. Hilty, “Inclusions Originating From Reoxidation of Liquid Steel, Electric Furnace Proceedings,” Vol. 28, pp. 64-88. Pittsburgh, Pennsylvania; USA; 9-11 Dec. 1970 [2] Moore and Bodor, “Steel deoxidation practice: Special emphasis on heavy section steel castings,” AFS Transactions, 93, pp. 99-114, 1985 [3] R.A. Rege, E.S. Szekeres and W. D. Forgeng: Met. Trans. AIME, 1, No. 9, pp.2652, 1970 [4] R.W. Rastogi and A.W. Cramb: 2001 Steelmkaing Conf. Proc., ISS, Warrendale, PA, 2001, vol. 84, pp. 789-829 [5] L. Zhang, B.G. Thomas, “Literature Review: Inclusions in Steel Ingot Casting,” Metallurgical and Materials Transactions B, Vol.37B, No.5, pp.733-761, 2006 [6] T.B. Braun, J.F. Elliott, and M.C. Flemings, Met. Trans. B, 10B, pp. 171-84, 1979 [7] T.B. Cox and J.R. Low, “Investigation of the Plastic Fracture of AISI 4340 and 18 Ni-200 Grade Maraging Steels,” Met Trans A, 5A, pp.1457-1470, 1974 [8] P. Kenny and J D Campbell: Prog. Mat. Sci., 1967, 13. 135-181 [9] W.M. Garrison, “Controlling Inclusion Distributions to Achieve High Toughness in Steels,” AIST Trans, 4(5), pp.132-139, 2007 [10] G.T. Hahn, M.F. Kanninen, and A.R. Rosenfield, “Annual Review of Materials Science,” 2 , pp. 381-404, 1972 [11] R. Kiessling, Non-Metallic Inclusions in Steel, The Institute of Metals, 1989 [12] S.E. Lunner: Int. Conf. on Production and Application of Clean Steels, The Iron and Steel Institute, London, pp. 124-36, 1970 [13] H.F. Tremlett; ISI Spec. Rep. 77, 1963, London, 119-122 [14] E.T. Turkdogan, Fundamentals of steelmaking, 1996 [15] M. Herrera, F. Castro, M. Castro, M. Mendez, H. Solis, “Modification of Al2O3 inclusions in medium carbon aluminum steels by AlCaFe additions,” Ironmaking and Steelmaking, 33(151), 2006

78
[16] M.D. Eason and R.C. Richardson, “The Effect of deoxidation practice on the quality of heavy steel castings,” Technical Advances in Steel Castings; 24-25 May 1983. pp.5.1-5.7 [17] E.T. Turkdogan, Calcium Treatment Symposium, p.3. The Institute of Metals, London, 1988 [18] R.J. Fruehan, “Ladle Metallurgy Principles and Practices,” ISS Warrendale PA, 1985 [19] The Making, Shaping and Treating of Steel, Association of Iron and Steel Engineers, 1985 [20] L.E.K. Holappa: ISS Steelmaking Conf. Proc., 83, pp. 765–777, 2001 [21] L. Holappa, M. Lind, M. Liukkonem, M. Hamalainen, “Thermodynamic examination of inclusion modification and precipitation from calcium treatment to solidified steel,” Ironmaking and Steelmaking, Vol. 30, 2, pp. 111-115, 2003 [22] “Properties and Selection: Nonferrous Alloys and Special-Purpose Materials,” ASM Handbook, Volume 2, 1990 [23] “An Engineering Data Book,” Calvert, J. R., and Farrar, R. A., Palgrave, 1999 [24] N. Ritchie, “Automated Feature Analysis for Perception – user’s document,” Aspex Corporation [25] Barbara Allyn, “Deoxidation in Heavy Section Steel Castings,” Harrison Steel Castings Company, SFSA Technical and Operating Conference, 2006 [26] Ernest M. Levin, Carl. R. Robbins, Howard F. McMurdie, Phase diagrams for Ceramists, 1983 [27] Chen Chun-Li, Zhang Jin E, Li Yi-Shen “Study on an extended Boussinesq equation,” Chinese Phys. 16, 2007, 2167-2179 [28] K. N. Ramakrishnan, “Modified Rosin Rammler equation for describing particle size distribution of milled powders,” Journal of Materials Science Letters, Volume 9, Number 21 / November, 2000, 1903-1906 [29] S. Kimura, Y. Nabeshima, K. Nakajima, S. Mizoguchi, “Behavior of nonmetallic inclusions in front of the solid-liquid interface in low-carbon steels,” Metallurgical and Materials Transactions B, Volume 31, Number 5 / October, 2000 [30] K.D.Sibley, “Effect of Si on the Impact and Tensile Properties of Low-C Steels,” Metall. Trans. A, 1976 vol: 7A iss: 10, pg: 1602 -1604

79
[31] M. Meyers and K. Chawla, Mechanical Behaviors of Materials, Prentice Hall, Inc. (Pearson Education), (1999)

80
VITA
Vintee Singh was born on March 14, 1985. She received her primary and
secondary education in India. In May of 2007, she received her Bachelor’s degree in
Materials and Metallurgical Engineering from Indian Institute of Technology, Kanpur,
India. In December 2009, she received a Master’s degree in Materials Science and
Engineering from Missouri University of Science and Technology.