income distribution and housing in poland between 2005 and 2012. magdalena teska university of...
TRANSCRIPT

Income distribution and housing in Poland between2005 and 2012.
Magdalena TeskaUniversity of Alicante
24 June 2015

1. Historical background.2. Income inequality in Poland.3. Housing in Poland.4. Income distribution and housing in Poland – empirical evidence.
• Income distribution.• Income distribution within regions.• Income distribution according the tenure status.• Housing.
1. Historial background.
In 1989 the first partially free elections since the Second World War took place and Poland became the first country in Central and Eastern Europe to re-establish democracy and to head off to an economic and social transition to a market economy. A “shock therapy” programme implemented during the early 1990s enabled the country to transform its economy into the most dynamic and robust economies in the region.
The economic transition had a significant impact on the labour market reflecting in decline the real wages and the change in the income distribution. The differences between the lowest and the highest salaries grew, the values of the measures of income inequality and the income distributions were comparable to OECD countries.
As the macroeconomic policy was a success, the social policy aiming at reducing income inequality and poverty through income distribution demonstrated that the social system was costly and inefficient, and the part of the funds were not reallocated in line with its assumptions.

2. Income inequality in Poland.
Income inequality is a factor which plays an important role on the socio-economic field and its cohesion in the national economy. Its reduction was one of the most significant challenges which was facing the Polish economy since 1989 when the economic transition begun. However, this reduction could not arise at the price of the modernization and technological processes, neither separately from the globalization and international financial transfers but rather base on the redistributive policy.

Main reasons of income inequality.
• Economic recession caused by the economic transition, significant rise in unemployment.
• Globalization, liberalization of international trade and capital flows as a result of opening the borders. Joining the EU benefited from aid funds, pre-accession, structural and cohesion funds. Migration to another countries and transfer of funds into national economy.
• Transfer of assets from the public to the private sector as an effect of the privatization process in the national economy, growth of its efficiency and competitiveness, and adapting the free market rules. Also, provision of public goods and services, its substitutability and competitiveness.
• Creation of the new markets, sales and marketing channels, adopting new technologies, work organization and management, investments in knowledge, know-how and human capital.
• Structural change in the labour market by expanding the opportunities such as skilled occupations and entrepreneurship, for previously excluded groups or persons, growing premiums and other financial benefits for well-educated professionals employed in the professions requiring high and demanding qualifications.

3. Housing in Poland.
The housing sector has been a major social and political problem particularly due to quantitative and qualitative deficits. Despite of being a considerable priority for the communist government, the situation did not improve once the economic transition begun, as this sector had no more major interest in the political agenda.
Three important moments since 1990:
• Restructuring of the construction sector and investors’ structure and as a result of the fall of the great national building conglomerates.
• Change in the financing system when the government stopped the funds flows into the construction market and the credit system was not developed enough to cover the supply.
• Privatization process of communal and municipal assets and great cooperatives.

The dwellings were goods relatively cheap to maintain but difficult to access (the total expenditures for housing did not exceed 10% of the household budgets).
The gap between demand and supply was growing. After 1989 the huge part of the dwellings’ stock was sold to the sitting tenants. In consequence the rental sector was diminished.
The new dwellings construction focused on owner-occupied housing, therefore a lack of market of private apartments for rent came forth.
Privatisation of the single dwellings in housing co-operatives and then this multiple-ownership restrained effective management and necessary rehabilitation, still being reflected in the tenure status in Poland.
Another problem was the deterioration of the building stock and the backlog of maintenance work, including the old pre-war buildings or the large prefabricated housing constructions.

Another turning point in 2004 / 2005:
Fast development of market-based financing channels, the change of consciousness of consumers, and the banking sector which become an important agent on the housing market offering mortgages and housing loans available to wider public.
Since that moment housing loans and mortgages have been more available to the households with higher income. The availability of credit and mortgage to the households with lower income has been supposed to be increased with the support of social government programs like “Family on its own” started in 2006 or its continuation “Apartments for Young”.

Between 2004 and 2007 the housing market boomed and then, slowed down leading to reducing sales volumes and falling prices. The supply of new dwellings fell, thus the factors like interest rates at record low level or new government programmes to stimulate the demand were to revitalize the housing market.
Afterwards, the stabilization was reached gradually. However, the stabilisation contributed to the temporary shortfall in economic activity in the construction sector and, in turn the decrease of mortgage rates.
As a consequence sharp rise in housing prices came forth mainly in the largest Polish cities which was caused by the credit boom, the excess of liquidity source in the international financial markets and also demographic factors. Nowadays, investments in real estates has become an alternative for other banking investments due to the low interest rates.
Renting for younger people became rather a solution due to the requirements for mortgage financing, unstable situation in the labour market, even low growth perspectives. The mobility of workforce was also fostering the development of this market. But in turn, those factors have not led to the strong development of the private renting market.

The further development of the housing market is connected with the macroeconomic situation, however there can be considered certain further perspectives:
• Comprehensive approach towards further development and stability of the mortgage sector.
• Strengthening the mortgage lending regulatory framework.• Forming capital market funding channels towards the development of a modern
framework of the financial instruments that would contribute to systematic and institutional development and stability.
• Enhancing regional counter partnership (World Bank, 2014).

4. Income distribution and housing in Poland – empirical evidence.
Data source:
• European Union Statistics on Income and Living Condition (EU-SILC) provided by Eurostat.
• The annual income data converted into the Euro currency and exposed as equivalised gross income and equivalised disposable income.
Gross income is the total monetary and non-monetary income received by the household over a 12 months, before deduction of income tax, regular taxes on wealth, employees’, self-employed compulsory social insurance contributions and employers’ social insurance contributions, but after including inter-household transfers received.
Disposable income is gross income less income tax, regular taxes on wealth, employees’, self-employed and unemployed compulsory social insurance contributions, employers’ social insurance contributions and inter-household transfers paid.

The Gini coefficient:
the most adopted measure of inequality in economics literature regarding income inequality and income distribution.
Advantages:
• It covers the entire distribution and includes all data.• It has clear and intuitive interpretation: a mean difference of income relative to
a mean income.• Being the most universally adopted measure, it ensures that the empirical results are
easily comparable with results of other research and studies.

Income distribution.
Year 2005 2006 2007 2008 2009 2010 2011 2012
GEGI 0,3655 0,3478 0,3370 0,3351 0,3333 0,3345 0,3331 0,3287
GEDI 0,3463 0,3240 0,3155 0,3146 0,3127 0,3155 0,3147 0,3094
The empirical evidence indicates that since 2006 there has been a slight but systematic and consistent decrease in the value of both Gini coefficients, for gross income and for disposable income of 10,0% and 10,6% respectively. Moreover, the Gini coefficient value for disposable income was not that high comparing to gross income due to the factor of income distribution process performed in the Polish economy and its impact. Although the elements of the disposable income lead to more equal income distribution, the transfers and social benefits had more influence and importance than personal income taxes.
In Poland the percentage of transfers and social benefits as a part of disposable income was relatively high due to the very broad social system before the transition. The right to obtain the social benefits and allowances was based on social security insurance and the selectivity for the poorest socioeconomic groups was limited.

2005 2006 2007 2008 2009 2010 2011 20120.3
0.31
0.32
0.33
0.34
0.35
0.36
0.37
G EGIG EDI
Income distribution.
Poland is in the process of catching-up countries with more efficient economies, and too low value of Gini coefficient could be a sign of inadequate governmental policies aimed at avoiding social stratification and in turn in a long term would lead to loss of competitiveness in the national economy.
It is more relevant not to focus on the way to continue on decreasing the income inequality but to focus on its effective and fair distribution. The income distribution conducted in such way determines political stability and therefore impacts positively on the economic growth and development, which in turn lead to the increase of income in the society and avoids the social segmentation by restraining the income inequality.
On the other hand, the income distribution carried out rationally and effectively will reflect in rational and effective housing policy not only through the adequate subsidy scheme but also through the social and council housing, the widened mortgage financing system and competitive loan and mortgage institutions for persons with the lowest income.

Income distribution in Central Region.
Year 2005 2006 2007 2008 2009 2010 2011 2012
CR GEGI 0,3705 0,07884 0,1012 0,07787 0,09454 0,09617 0,09451 0,09341
CR GEDI 0,3512 0,09647 0,07016 0,09091 0,07067 0,07373 0,07299 0,07080
In 2005 the inequality for both, gross income and disposable income was roughly 0,01 pp above the inequality value for the whole country.
In 2006 indeed these values decreased into 0,0788 and 0,0964 and have continued this trend presenting extremely low income inequality. The values of Gini coefficient for disposable income are higher comparing to the values of gross income, thus the taxes and social benefits does not play its role in income distribution process.
Central Region includes the capital and the greatest Polish city – Warsaw, attraction of the new investments, the research and development activities, research centres, foundations, institutions and cooperations, capital flows and in general is the driving force of the Polish economy.

2005 2006 2007 2008 2009 2010 2011 20120
0.1
0.2
0.3
0.4
0.5
0.6
0.7
0.8
0.9
1
G EDIG EGI
Income distribution in Central Region.

Income distribution in South, East, North-West Regions.
Year 2005 2006 2007 2008 2009 2010 2011 2012
SR GEGI 0,3529 0,1488 0,1642 0,1454 0,1573 0,1583 0,1548 0,1596
SR GEDI 0,3329 0,1442 0,13354 0,1494 0,1339 0,1347 0,1330 0,1348
ER GEGI 0,3550 0,2168 0,2265 0,2178 0,2223 0,2290 0,2243 0,2216
ER GEDI 0,3376 0,2129 0,1986 0,2076 0,1983 0,2048 0,2017 0,1972
NWR GEGI 0,3643 0,2957 0,3069 0,2984 0,3050 0,2999 0,2951 0,2923
NWR GEDI 0,3436 0,2878 0,2864 0,2931 0,2876 0,2851 0,2808 0,2758

Income distribution in South, East, North-West Regions.
2005 2006 2007 2008 2009 2010 2011 20120.1
0.150.2
0.250.3
0.350.4
G EGIG EDI
2005 2006 2007 2008 2009 2010 2011 20120.15
0.2
0.25
0.3
0.35
0.4
G EGIG EDI
2005 2006 2007 2008 2009 2010 2011 20120.220.240.260.28
0.30.320.340.360.38
G EGIG EDI

Income distribution in South-West Region.
Year 2005 2006 2007 2008 2009 2010 2011 2012
SWR GEGI 0,3632 0,3496 0,3413 0,3123 0,3212 0,3383 0,3460 0,33250
SWR GEDI 0,3446 0,3467 0,3246 0,3124 0,3110 0,3303 0,3410 0,3198
2005 2006 2007 2008 2009 2010 2011 20120.3
0.31
0.32
0.33
0.34
0.35
0.36
0.37
G EGI G EDI
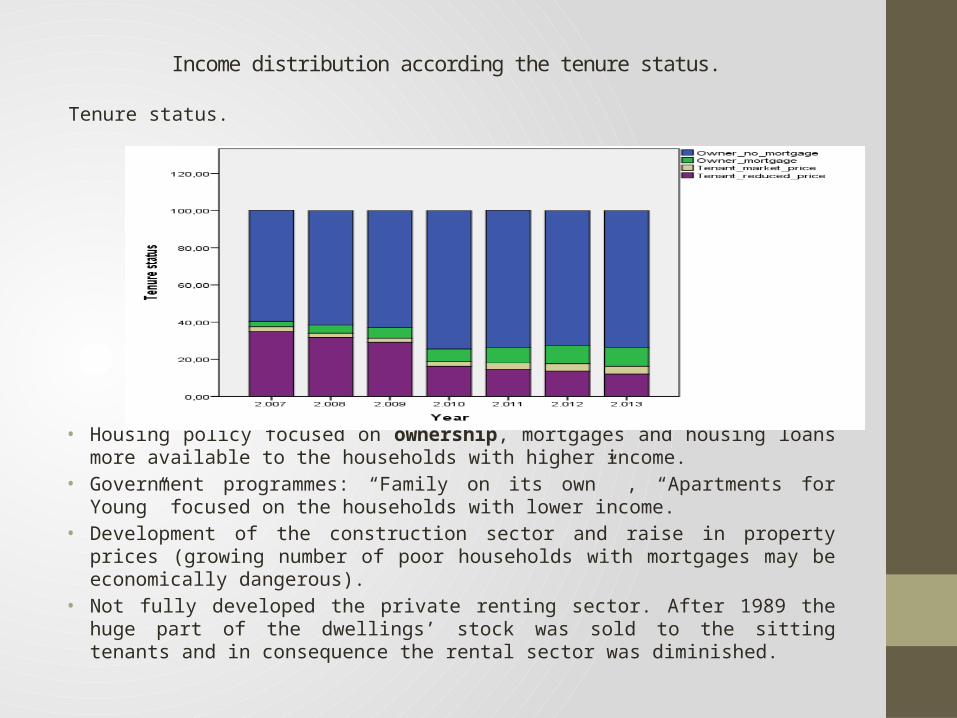
Income distribution according the tenure status.
Tenure status.
• Housing policy focused on ownership, mortgages and housing loans more available to the households with higher income.
• Government programmes: “Family on its own” , “Apartments for Young” focused on the households with lower income.
• Development of the construction sector and raise in property prices (growing number of poor households with mortgages may be economically dangerous).
• Not fully developed the private renting sector. After 1989 the huge part of the dwellings’ stock was sold to the sitting tenants and in consequence the rental sector was diminished.

Year 2007 2008 2009 2010 2011 2012
Owner no mortgage / loan 59,7 61,6 63,0 74,5 73,7 72,8
Below 60% MEII 65,3 67,4 67,1 73,0 74,0 72,4
Above 60% MEI 58,5 60,4 62,2 74,8 73,6 72,9
Owner with mortgage / loan 2,9 4,4 5,7 6,8 8,4 9,6
Below 60% MEI 1,4 2,1 2,4 1,9 2,5 3,4
Above 60% MEI 3,2 4,9 6,4 7,9 9,6 10,9
Tenant - market price 2,6 2,3 2,2 2,5 3,5 4,0
Below 60% MEI 2,9 2,8 3,6 2,9 4,1 4,3
Above 60% MEI 2,5 2,2 1,9 2,4 3,3 4,0
Tenant - reduced price 34,9 31,7 29,1 16,2 14,5 13,6
Below 60% MEI 30,4 27,7 26,9 22,2 19,4 19,9
Above 60% MEI 35,8 32,5 29,6 14,9 13,4 12,2
Source: Eurostat

• Income distribution / Owners no outstanding mortgage or housing loan.
• Income distribution / Owners with mortgage or loan.
Year 2005 2006 2007 2008 2009 2010 2011 2012
O GEGI 0,3643 0,3487 0,3422 0,3377 0,3362 0,3319 0,3263 0,3176
O GEDI 0,3469 0,3253 0,3212 0,3182 0,3166 0,3126 0,3089 0,2995
Year 2005 2006 2007 2008 2009 2010 2011 2012
OM GEGI 0,3776 0,3687 0,3844 0,3857 0,3695 0,3540 0,3044 0,3129
OM GEDI 0,3445 0,3440 0,3677 0,3626 0,3491 0,3341 0,2981 0,3068
2005 2006 2007 2008 2009 2010 2011 20120.250.270.290.310.330.350.370.39
G EGIG EDI
2005 2006 2007 2008 2009 2010 2011 20120.28
0.30.320.340.360.38
0.4
G EGIG EDI

• Income distribution / Tenants with a market price rent.
• Income distribution / Tenants with reduced price.
Year 2005 2006 2007 2008 2009 2010 2011 2012
TMP GEGI 0,3493 0,3005 0,3267 0,3565 0,3347 0,3189 0,3575 0,3671
TMP GEDI 0,3314 0,2742 0,3052 0,3368 0,3139 0,3024 0,3351 0,3448
Year 2005 2006 2007 2008 2009 2010 2011 2012
TRR GEGI 0,3557 0,3413 0,3213 0,3191 0,3231 0,3104 0,3773 0,3443
TRR GEDI 0,3348 0,3169 0,2984 0,2957 0,3000 0,2948 0,3595 0,3223
2005 2006 2007 2008 2009 2010 2011 20120.25
0.29
0.33
0.37
G EGIG EDI
2005 2006 2007 2008 2009 2010 2011 20120.290.310.330.350.370.39
G EGIG EDI

Year 2005 2006 2007 2008 2009 2010 2011 2012
House / Total 49,5 49,7 50,7 51,6 51,9 53,0 53,2 53,7
Below 60% of median equivalised income 12,6 11,9 10,5 10,7 10,6 11,1 11,1 11,0
Above 60% of median equivalised income 36,8 37,8 40,1 40,9 41,3 41,9 42,2 42,6
Detached house / Total 44,4 44,6 45,5 46,0 47,0 48,2 48,8 48,9
Below 60% of median equivalised income 11,3 10,9 9,6 9,7 9,8 10,3 10,3 10,1
Above 60% of median equivalised income 33,0 33,7 35,9 36,3 37,2 37,8 38,5 38,8
Semi-detached house / Total 5,1 5,1 5,2 5,6 4,9 4,8 4,4 4,7
Below 60% of median equivalised income 1,3 1,0 0,9 1,0 0,8 0,8 0,8 0,9
Above 60% of median equivalised income 3,8 4,1 4,3 4,6 4,1 4,0 3,7 3,8
Flat / Total 50,2 50,1 49,1 48,2 47,8 46,8 46,7 46,2
Below 60% of median equivalised income 7,8 7,1 6,7 6,1 6,4 6,4 6,6 6,0
Above 60% of median equivalised income 42,4 42,9 42,3 42,1 41,4 40,4 40,1 40,2
Flat in building less than 10 dwellings / Total 10,9 11,1 10,5 10,1 10,2 10,3 10,0 9,6
Below 60% of median equivalised income 2,7 2,7 2,2 2,0 2,2 2,4 2,1 2,1
Above 60% of median equivalised income 8,2 8,4 8,3 8,2 8,0 7,9 7,8 7,5
Flat in building with more than 10 dwellings / Total 39,3 39,0 38,5 38,1 37,6 36,5 36,7 36,6
Below 60% of median equivalised income 5,1 4,5 4,5 4,2 4,2 4,0 4,4 3,9
Above 60% of median equivalised income 34,2 34,5 34,0 34,0 33,4 32,5 32,3 32,7
Housing .
Source: Eurostat

• Overcrowding rate by tenure status as a percentage of total population.
The overcrowding rate has decreased only for owners with no outstanding mortgage or housing loan by 8,9%. Buying a dwelling has become an alternative investment from other banking investments.
People are interested in buying new dwellings / properties and renovating old ones, they also tend to acquire relatively small apartments. It is related with high real estate prices (to average income) but also with income and the tendency of tenure status.
Fall in housing deprivation is simultaneous with the changes in income inequality and then its distribution which indicates elasticity between these two factors.
Year 2007 2008 2009 2010 2011 2012
Owner with mortgage 26,0 32,1 33,1 32,7 34,5 34,1
Owner no mortgage or loan 46,0 45,1 43,4 43,4 43,0 41,9
Tenant, rent at market price 73,8 65,9 71,1 71,7 74,6 75,2
Tenant, reduced price rent 63,4 63,6 63,0 69,2 69,3 69,6
Source: Eurostat

• Share of total population living in a dwelling with damages (leaking roof, damp walls, floors or foundation, rot in window frames of floor).
• Total decline - 76%• For households below 60% MEI - 66% and above 60% MEI - 78%.
Year 2005 2006 2007 2008 2009 2010 2011 2012
Total 43,9 41,4 37,5 22,8 17,6 15,6 11,5 10,5
Below 60% MEI 58,9 61,2 56,9 37,4 31,2 29,7 20,5 20,0
Above 60% MEI 40,1 36,7 33,5 19,9 14,8 12,6 9,6 8,6
Year 2005 2006 2007 2008 2009 2010 2011 2012
Total 29,7 28,6 25,9 18,1 15,2 13,3 11,4 10,5
First q. 47,1 48,8 46,1 33,0 28,9 27,2 23,2 21,9
Second q. 38,1 35,6 32,2 22,6 19,5 16,1 13,6 13,2
Third q. 29,1 27,0 24,2 15,9 13,7 10,9 8,8 7,5
Forth q. 21,2 20,1 16,2 11,2 9,3 7,2 6,9 6,4
Fifth q. 13,2 11,8 11,0 7,6 4,5 5,5 4,6 3,6
Source: Eurostat
Source: Eurostat

• Arrears on mortgage or rent payments.
• Decrease of 26% reaching 1,7% of total population in 2012.• Greater decrease for households with income above 60% MEI (26%) than below 60%
MEI (23%).
Year 2005 2006 2007 2008 2009 2010 2011 2012
Total 2,3 1,9 1,2 0,6 0,9 1,0 1,5 1,7
Below 60% of median equvalised income 3,9 2,7 2,3 1,2 1,6 2,1 2,3 3,0
Above 60% of median equivalised income 1,9 1,7 1,0 0,5 0,8 0,8 1,3 1,4
Source: Eurostat

Conclusions.
Income distribution.
Income from work gained its importance instead of overall social transfers and other benefits but their percentage as a part of disposable income is relatively high. It was too slow, the social system was costly and inefficient, and the part of the funds were not reallocated in line with its assumptions. Now focus not only on the way how to continue on decreasing the income inequality but on its effective and fair distribution. It would determine political stability and impact positively on the economic growth and development, which in turn lead to the increase of income in the society.
On the other hand, the income distribution carried out rationally and effectively will reflect in rational and effective housing policy.

Housing.
• Tenure status: housing policy focused on ownership regime (ownership rate at 82,4% in 2012, when in 2005 it was 62,6%), but the mortgages and housing loans more available to the households with higher income.
• Not fully developed the private sector of tenancy, which at the end of 2012 was less than 10% of the stock and is still unregulated by legal agreements relations between landlord and tenant and the existing legal protection of tenants. Private renting should not fulfil social assistance, but encourage to offer more flexibility for the labour market.
• Deprivation of the dwellings: in 2005 when the first EU-SILC was performed, almost one third of the population was considered severely housing deprived. By 2012 this indicator fell by 76% narrowing the gap between Poland and EU (to 5,4 pp).
• People acquire relatively small apartments due to income and the tendency of tenure status. Thus, many people live in overcrowded properties according to the Eurostat standards, which are indeed new or well maintained.
• The tools used by the government to create and to maintain the course for the housing policy are rather pro-cyclical and has not been enough to slower the economical recession. Moreover, they also seem to be financially inefficient.
• More active tax policy and the pro-supply policy to stimulate the competition of the constructions companies and at the same time, consequently limiting excessive price volatility and speculation.

Thank you for your attention.